growth vouchers programme evaluation - cohort 1: impact … · this report was prepared by iff...
TRANSCRIPT
BIS RESEARCH PAPER NO. 259
Growth Vouchers Programme Evaluation Cohort 1: Impact at six months
FEBRUARY 2016
1
Growth Vouchers Programme: Six Month Evaluation
This report was prepared by IFF Research on behalf of the Department for Business, Innovation and Skills.
About IFF Research
IFF Research Ltd is an independent research agency specialising in research in the fields of learning and skills, employment and benefits, enterprise and health and wellbeing. Established in 1965, IFF provides research for a range of clients across the public and private sectors.
Authors: Lorna Adams, Ben Davies, Matt Barnes, Gill Stewart, Becky Duncan and Alex Pearson
Head Office: Chart House, 16 Chart Street, London N1 6DD
Website: www.iffresearch.com
Email: [email protected]
Telephone: 020 7250 3035
Acknowledgements
We would like to thank Khalid Khan, the research manager at BIS for his guidance and support and the rest of the BIS / Behavioural Insights Team Programme team.
We express our kind regards to all participating businesses who have given up their time to take part.
2

Growth Vouchers Programme: Six Month Evaluation
Contents About IFF Research .................................................................................................................... 2
Acknowledgements ..................................................................................................................... 2
Executive Summary ...................................................................................................................... 6
Operation of the RCT .................................................................................................................. 6
Evidence of Growth Vouchers Programmes’ impact .................................................................... 7
Programme implementation ........................................................................................................ 8
Evidence of Deadweight.............................................................................................................. 9
Conclusion .................................................................................................................................. 9
Eligibility criteria .................................................................................................................... 12
The evaluation design ........................................................................................................... 12
Chapter 2: Success of the Operation of the RCT ...................................................................... 15
Comparability of Cohort 1 voucher and control groups overall................................................... 16
Comparability of the Cohort 1 population and the survey population ......................................... 18
Comparability of the Cohort 1 voucher and control groups within diagnostic type ..................... 20
Chapter 3: Evidence of the impact of Growth Vouchers .......................................................... 27
Advice sought since involvement with GVP ........................................................................... 29
Attitudes towards future advice seeking ................................................................................ 33
Immediate outcomes - business capabilities and confidence .................................................... 33
Immediate outcomes – evidence of actions taken ..................................................................... 37
General business planning measures ................................................................................... 38
Theme-specific actions .......................................................................................................... 42
Sales and Marketing actions ................................................................................................. 42
Making the Most of Digital Technology actions ...................................................................... 44
3
Growth Vouchers Programme: Six Month Evaluation
Planning measures taken across all themes ......................................................................... 46
Use of business plan ............................................................................................................. 46
Evidence of ‘hard’ impacts ........................................................................................................ 47
Turnover................................................................................................................................ 48
Changes in numbers of staff, numbers of sites and sales to overseas customers ................. 51
Impact of the Growth Voucher on ambition and expectations for the future ............................... 53
Chapter 4: Evidence of the impact of the diagnostic route ...................................................... 56
Immediate outcomes - impact of diagnostic route on theme selected and voucher use ............. 58
Immediate outcomes - business capabilities and confidence .................................................... 59
Immediate outcomes – evidence of actions taken ..................................................................... 60
Evidence of “hard” impacts ........................................................................................................ 62
Impact on ambition .................................................................................................................... 64
Business views on the diagnostic .............................................................................................. 65
Impact of personal diagnostic length ......................................................................................... 67
Chapter 5: Experience of the Programme ................................................................................. 69
Satisfaction with the personal diagnostic ................................................................................... 72
Use of the Online Marketplace .................................................................................................. 76
Nature of advice purchased ...................................................................................................... 79
Reasons for not using the Growth Voucher ............................................................................... 80
Recommending the programme ................................................................................................ 82
Chapter 6: Evidence of deadweight and substitution .............................................................. 84
Chapter 7: Conclusions .............................................................................................................. 88
Annex A: Methodology ............................................................................................................... 91
Annex B: Satisfaction ratings – full breakdown ....................................................................... 96
Annex C: Minority Ethnic Group and women-led businesses ................................................. 99
4

Growth Vouchers Programme: Six Month Evaluation
Annex D: Use of subcontractors.............................................................................................. 100
Annex E: Growth Vouchers Programme Logic Model ............................................................ 101
5

Growth Vouchers Programme: Six Month Evaluation
Executive Summary The Department for Business, Innovation and Skills (BIS) launched the Growth Vouchers Programme (GVP) on 27 January 2014. The aim of the programme was to encourage small businesses to access expert advice which could help them grow, and to get robust estimates of the impact of this advice. When the programme closed for applications in March 2015, over 28,000 businesses had successfully completed their customer journey.
Three-quarters of these businesses received a voucher that offered up to £2,000 to cover half the costs of buying strategic business advice from private sector suppliers on the Online Marketplace1. The Programme operated as a Randomised Controlled Trial (RCT) to obtain robust evidence and it will answer the main policy question in this area, namely:
Do businesses that use external advice perform better than those that do not?
The programme evaluation will continue over the next four years. During this time, it will compare business performance of the voucher recipients with the non-recipients through in-depth interviews, case studies, business surveys and administrative data. In early 2015, BIS published results from in-depth interviews on the implementation of the programme (process evaluation) and early impacts of advice.2
This report presents results from the first round of business surveys and covers applicants that entered the programme between January to August 2014. The survey team contacted businesses six month after their date of diagnostics assessment so that businesses could have sufficient time to make any changes in business practices as well as see early impact on sales. Six month is a relatively short period to observe the full impact of strategic advice, past research shows it can takes between one to two years, these businesses will be surveyed twice more. Businesses that applied from September 2014 to March 2015 will be surveyed as a separate group.
Operation of the RCT
The randomisation process has successfully created comparable groups of businesses for impact evaluation. Overall, the treatment group (those offered a voucher) and the control group (those not offered a voucher) were very similar. This means any differences in business performance across the two groups should be attributable to the Growth vouchers.
Use of the voucher is lower than expected, which will make some comparisons difficult. Only a third of Cohort 1 businesses purchased advice with their vouchers. This take up rate will make it difficult to answer more detailed research questions at this stage, such as comparative impact of different advice themes3 on business outcomes. However, while fewer
1 https://marketplace.enterprisenation.com/ 2 https://www.gov.uk/government/publications/growth-vouchers-programme-evaluation-early-estimate-of-impact 3 The themes are: finance and cash flow; recruiting and developing staff; improving leadership and management skills; marketing, attracting and keeping customers; and making the most of digital technology. For more details see: https://www.gov.uk/government/publications/growth-vouchers-programme-trial-protocol
6
Growth Vouchers Programme: Six Month Evaluation
vouchers were used, the average spend among those who used their vouchers is higher than expected.4 Higher spend mitigates the effect of lower voucher usage in this Cohort.
Evidence of Growth Vouchers Programmes’ impact
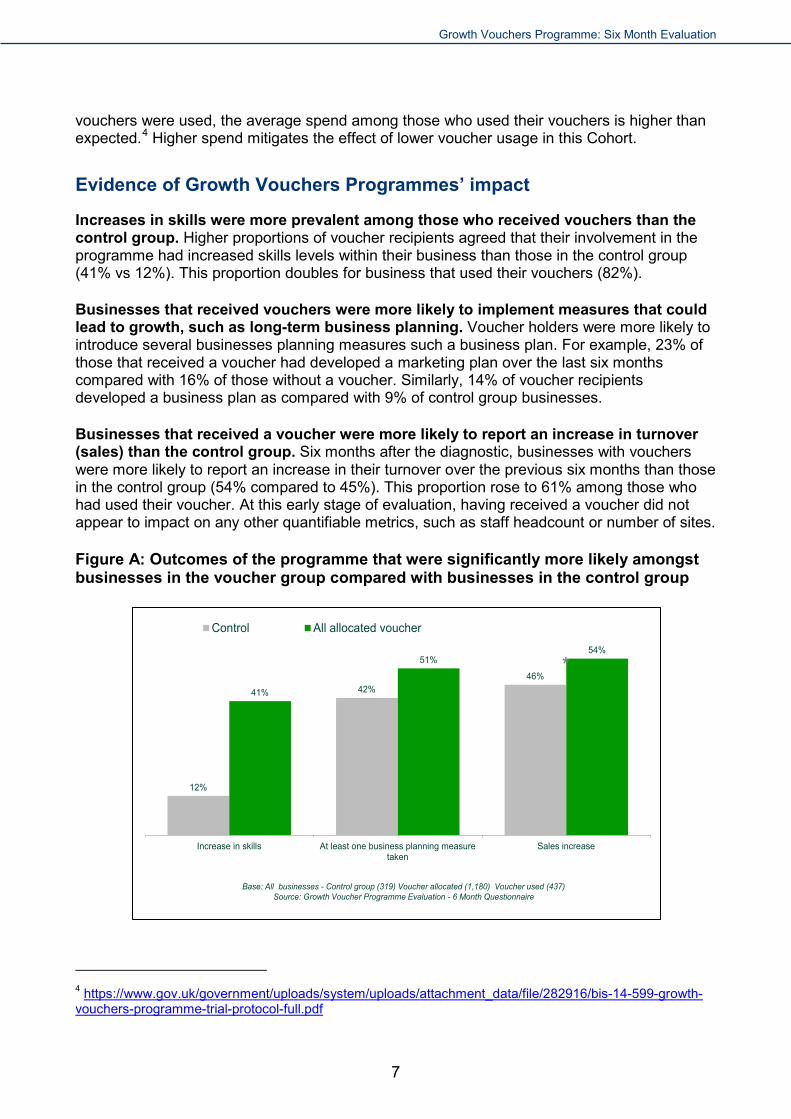
Increases in skills were more prevalent among those who received vouchers than the control group. Higher proportions of voucher recipients agreed that their involvement in the programme had increased skills levels within their business than those in the control group (41% vs 12%). This proportion doubles for business that used their vouchers (82%).
Businesses that received vouchers were more likely to implement measures that could lead to growth, such as long-term business planning. Voucher holders were more likely to introduce several businesses planning measures such a business plan. For example, 23% of those that received a voucher had developed a marketing plan over the last six months compared with 16% of those without a voucher. Similarly, 14% of voucher recipients developed a business plan as compared with 9% of control group businesses.
Businesses that received a voucher were more likely to report an increase in turnover (sales) than the control group. Six months after the diagnostic, businesses with vouchers were more likely to report an increase in their turnover over the previous six months than those in the control group (54% compared to 45%). This proportion rose to 61% among those who had used their voucher. At this early stage of evaluation, having received a voucher did not appear to impact on any other quantifiable metrics, such as staff headcount or number of sites.
Figure A: Outcomes of the programme that were significantly more likely amongst businesses in the voucher group compared with businesses in the control group
12%
42%46%
41%
51%54%
Increase in skills At least one business planning measuretaken
Sales increase
Control All allocated voucher
*
Base: All businesses - Control group (319) Voucher allocated (1,180) Voucher used (437)Source: Growth Voucher Programme Evaluation - 6 Month Questionnaire
4 https://www.gov.uk/government/uploads/system/uploads/attachment_data/file/282916/bis-14-599-growth-vouchers-programme-trial-protocol-full.pdf
7

Growth Vouchers Programme: Six Month Evaluation
The majority of programme applicants had high growth ambitions. The voucher allocation had little impact on improving businesses’ growth ambitions, largely because self-reported growth ambitions were high at the time of application.
Receiving a Growth Voucher increased the self-reported likelihood of seeking and paying for business advice in the future. Of those who received a voucher, 65% stated that they were more likely to pay for advice in future because of the programme compared with 37% in the control group. The likelihood to pay for advice is also higher among the voucher group (56%) as compared with the control group (32%).
Two in five programme participants used formal business advice from other public sector programmes or from the private sector. Since applying for the GVP, just under two in five (39%) businesses had sought business advice from other sources, of which around half paid for advice at a commercial rate. Excluding the usage of vouchers, there are no statistically significant differences in the use of advice from other sources between the voucher group and the control group.
Programme implementation
Experience of the personal diagnostics was positive, and this seemed to lead to higher satisfaction with the programme overall. Overall, seventy-four per cent of businesses were satisfied with their diagnostic assessment with advisor. On individual elements of the diagnostics, 84% were satisfied with “advisor’s knowledge of the programme”, 74% reported satisfaction with “advisor and their organisation”, 64% were satisfied with the “quality of action plan” and 67% with “handling of the follow-up inquires”.
Personal diagnostics varied between fifteen minutes and one hour. The duration of the personal diagnostic was related to satisfaction levels with the programme, satisfaction with delivery partners services and the likelihood to use business advice in the future (with all of these increasing as the length of the diagnostic session increased).
Over half of the businesses allocated a voucher (57%) visited the Online Marketplace and a quarter of control group businesses (23%) had also done so. While satisfaction with the Marketplace’s search function was high (58%), smaller proportions were satisfied with the quality of advice suppliers (50%), reviews left by other businesses (42%), and the cost of advice (41%).
Overall, more businesses were satisfied with their involvement in the programme (ie beginning-to-end customer journey from application to claiming voucher money) than were dissatisfied. Satisfaction with the overall programme was the highest among those who used their voucher, 95%. When compared across the groups, 57% of voucher holders were satisfied as compared to 18% in the control group.
Around a third of those allocated a voucher between January and August 2014 used it (32%). The three most common reasons for not using a Growth Voucher were, an inability to find a suitable supplier (40%), insufficient funds to meet the match-funding requirement (36%) and lack of time to locate suitable suppliers (32%).
Businesses allocated a voucher were more likely to use it if they were on the personal diagnostic route than the online route. Other than this, at this stage there is little evidence that the personal diagnostic route is more likely to lead to positive business outcomes than the
8

Growth Vouchers Programme: Six Month Evaluation
online diagnostic assessment. This applies to enhanced skills, intermediate actions that may lead to growth, or growth in turnover, staff numbers and exports.
Evidence of Deadweight
It is likely that some businesses would have found alternative schemes if GVP had not been available. At the time of application, 29% businesses were actively exploring the advice market and 41% considered taking advice but did not take further action. Some of the ‘actively exploring’ businesses might have found alternative schemes in the absence of the GVP. The Programme attracted 24% of businesses that had not previously considered using advice.
At this stage, vouchers did not change the propensity to use business advice from other public or private sector offers in the six months between application and the survey. The proportion that used other government programmes or fully paid for advice outside of the voucher is statistically similar in the control and treatment group.
Around one in six of those who used their voucher would have purchased the same advice anyway – suggesting some degree of deadweight in the programme. Those who used their voucher were also asked what might have happened in the absence of the programme. This self-reported measure suggests that 15% of voucher users would have purchased the same advice at a commercial rate. However, some of the businesses in this group stated that they might have bought the advice later without this Programme. This means that there is some degree of deadweight in the programme but it is lower than what is observed in similar programmes where average deadweight is over 30%.5
Conclusion
At this early stage in the evaluation, we can conclude the RCT has operated as intended. It created comparable voucher recipient and control groups. As per the original expectations of the programme, we are seeing some intermediate impacts in terms of attitudes to advice, business capability and actions that are expected to increase business sales and staff.
We are also seeing some early suggestions of business growth, particularly in terms of turnover. Significant differences between the voucher and control groups suggest evidence of the impact of business advice. The picture is less clear on the comparative benefits of the personal diagnostic route compared with the online route.
5 https://www.gov.uk/government/uploads/system/uploads/attachment_data/file/191512/Research_to_improve_the_assessment_of_additionality.pdf
9

Growth Vouchers Programme: Six Month Evaluation
Chapter 1: Introduction
Background, aims and objectives The Growth Vouchers Programme (GVP) was launched on 27 January 2014, and closed for applications on 31 March 2015. In addition to offering business support to thousands of businesses, it aims to answer the overall policy question:
Do businesses that use external advice perform better than those that do not?
The Programme in brief Over 20,000 businesses applied and completed their customer journey for a voucher in the main RCT within GVP—the remaining 8,000 businesses applied under wider eligibility criteria such as start-up businesses and business that paid for advice in the past. All these businesses could apply for a voucher for one of the five types of advice: finance and cash flow; recruiting and developing staff; improving leadership and management skills; marketing, attracting and keeping customers; and making the most of digital technology.6
Three-quarters of businesses that completed diagnostic assessment received a voucher worth £2,000 to cover half the costs of buying strategic business advice in their chosen theme from the Online Marketplace.7
The Randomised Controlled Trial This research element of the Growth Vouchers Programme involves a Randomised Controlled Trial (RCT), in which businesses were randomly allocated to different support ‘conditions’ and then monitored over the course of five years to establish which conditions create the greatest growth impact for businesses.
The use of an RCT methodology is common in the field of medical testing but less common in developing and testing industrial policy, with only one recent UK example: the Nesta Creative Credits project8.
The RCT was designed to provide evidence at several levels. As mentioned above, at an overall level it is looking to provide evidence on whether businesses that use external formal advice perform better than those who do not. However, it also aims to answer the following more specific questions:
• Do businesses that are given a Growth Voucher perform better or worse than those not given one?
6 https://www.gov.uk/apply-growth-vouchers 7 https://marketplace.enterprisenation.com/ 8 Hasan Bakhshi et.al (2013): Creative Credits: a randomised controlled industrial policy experiment. Web: http://www.nesta.org.uk/home1/assets/features/creative_credits_report
Web: http://www.nesta.org.uk/home1/assets/features/creative_credits_report
10


Growth Vouchers Programme: Six Month Evaluation
business. Businesses could agree with the suggestion and choose this theme if they wanted, or they could choose a different theme.
Once a theme was chosen, businesses were once again randomly allocated to one of two different groups - the ‘Voucher’ group where businesses received a Growth Voucher, or the ‘Control’ group, where they did not receive a voucher.
Eligibility criteria To be eligible for the programme’s main RCT, a business had to have been trading for at least one year; have fewer than 50 employees; be registered in England; have a turnover or balance sheet of at most Euro10 million; not have paid for strategic business advice in the last three years; and not have exceeded the limit for state aid of €200,000 over the previous three financial years.
At the end of August 2014, the eligibility criteria were widened such that start-up businesses become eligible for the programme. However, these businesses are not included in this report, and will be surveyed separately for impact assessment.
The evaluation design The programme evaluation uses a combination of qualitative interviews, quantitative surveys, case studies and administrative data to evaluate the short-term and long-term impact of businesses support and provision of growth vouchers. A five-year evaluation period was chosen because other evaluation studies (such as the evaluation of Business Link Online) showed additional benefits of advice lead to business growth during this period of time.9
The evaluation approach taken for the Growth Vouchers Programme addressed issues faced by earlier Programmes, for example the Creative Credits Programme, by recruiting greater numbers of participants, and following them over a longer time period.
Quantitative surveys will collect data at 6 months, 12 months, and 24 months after a business’s diagnostic, as outlined in figure 1.2. Figure 1.2: Programme of quantitative research
Interview dates
Diagnostic date
Aug 2014 –Mar 2015
Mar 2015 –Aug – 2015
Mar 2015 –Sep 2015
Sep 2015 –March 2016
Jan 2016 –Aug 2016
Sep 2016 –March 2017
Cohort 1
Jan 2014 –Aug 2014
6 Month Interviews
12 Month Interviews
24 Month Interviews
Cohort 2
Sep 2014 –Mar 2015
6 Month Interviews
12 Month Interviews
24 Month Interviews
9 McKensie, D. and Woodruff, C. (2012). What Are We Learning from Business Training and Entrepreneurship Evaluations around the Developing World? The World Bank Policy Research Working paper 6202.
12

Growth Vouchers Programme: Six Month Evaluation
Objectives for the quantitative surveys are to:
• Collect business data to develop a robust evidence base for evaluating the RCT research questions.
• Collect data on changes in business behaviour (e.g. capability) and compare it with the baseline data, captured at the application stage for both the treatment and control group.
• Collect data on business performance indicators and analyse this over the successive waves of business surveys to assess the impact of the programme.
• Measure customer satisfaction from the programme overall and from the services received from the Online Marketplace.
• Understand the extent of market failures and behavioural constraints related to the use of business advice from the participating businesses.
• Gauge deadweight, displacement and substitutions related to the Growth Vouchers Programme.
• Monitor the equality and diversity impact.
• Highlight issues, through careful data analysis, that can subsequently be explored in the qualitative evaluation.
This report covers the findings from the ‘6 month interviews’ conducted with Cohort 1. Six months after the diagnostic was a good point to review how businesses experienced the programme, and a useful point to record early actions taken as a result. However, it is quite early to expect quantifiable impacts such as change in sales and staff numbers.
The quantitative survey elements of the evaluation were complemented by a programme of qualitative research. BIS has already published, in February 2015, two reports covering the programme implementation and understanding of early impacts.10
Survey methodology IFF conducted this survey between October 2014 and March 2015 by telephone, using Computer Assisted Telephone Interviewing (CATI). These interviews covered businesses that participated in the programme between January and August 2014.
The sampling approach for the survey was an attempted census of all business who took part in the trial. There were 3,896 business records available for interviewing, and 1,499
10 https://www.gov.uk/government/publications/growth-vouchers-programme-evaluation-stakeholder-views-of-the-service and https://www.gov.uk/government/publications/growth-vouchers-programme-evaluation-early-estimate-of-impact
13

Growth Vouchers Programme: Six Month Evaluation
interviews were completed - an overall unadjusted response rate of 38%. Annex A shows completed interviews broken down by key subgroups.11
Data were weighted using a simple non-response weight. This corrects for a slight difference in response rate from different groups such as the voucher group and non-voucher group businesses in the survey sample compared to the overall population, and also different response rates within the voucher group between those who had claimed their voucher and those who did not.
11 A number of records were not viable – either as telephone numbers were not valid (129) or because businesses were screened out as ineligible (4). Removing these from the total number of records available gives an adjusted response rate of 40%.
14

Growth Vouchers Programme: Six Month Evaluation
Chapter 2: Success of the Operation of the RCT Chapter summary
• The control and the voucher groups have statistically similar business characteristics, therefore the randomisation processes created comparable groups of businesses that can provide a robust estimate of the additional benefits of advice.
• Once weighted the survey responses for both the control and voucher groups were very similar to the population of Cohort 1 participants, showing that readers can interpret these results as being representative of all businesses in Cohort 1.
• The operation of the programme has meant that businesses that received a voucher are slightly more likely than those in the control group to have had a personal diagnostic12. Readers need to keep this in mind when making comparisons at programme level. However, within diagnostic type the profiles of the control and voucher groups are similar, meaning within diagnostic route comparison can be made with confidence.
• Only a third of businesses claimed their voucher. This may cause some complications for impact assessment and may mean that business outcomes, such as change in sales, show little impact as the two third of businesses not using the voucher will bring down average for the voucher recipients group.
• A large proportion of participant businesses had obtained advice from other sources since, or alongside, buying advice with their voucher. This will introduce some uncertainty as to whether impacts and changes were purely a result of the GVP. However, the voucher and control groups were equally likely to have used advice from elsewhere, meaning the two groups can still be compared for impact assessment.
This chapter explores the evidence from Cohort 1 as to how successfully the RCT has worked. The chapter looks at the comparability of the control and voucher groups at an overall level, within diagnostic route and within advice theme. It also looks at the
12 This is due to a difference between the diagnostic routes in terms of the way they check eligibility of businesses for the programme. In the case of the online route, eligibility is checked after businesses completed online diagnostic assessment and have been given a voucher. However, for personal diagnostics the checks are completed before the diagnostic assessment. Therefore it was sometimes necessary to remove businesses from the scheme their online diagnostic and (in some cases) after the voucher had been issued.
15

Growth Vouchers Programme: Six Month Evaluation
comparability between the overall Cohort 1 population and the sub-set of participants who were interviewed for the survey.
This chapter analyses how effective the random allocation has been in establishing suitable comparison groups. It also outlines how representative the survey findings are of the groups of businesses participating in the programme.
The chapter compares:
• Cohort 1 businesses that received a voucher, those who have used a voucher and those who did not receive a voucher (the control group);
• The sub-set of businesses that were interviewed for the telephone survey against the Cohort 1 population;
• The groups who were allocated to the online and to the personal diagnostic;
• The groups that chose each advice theme.
The final section of the chapter looks at the other sources of advice that Cohort 1 businesses have accessed since they took part in the programme. This is important because if businesses receive advice from multiple sources, then it is harder to be sure that any changes in behaviour or results that are observed can be purely attributed to the Growth Vouchers Programme.
Comparability of Cohort 1 voucher and control groups overall
The RCT has been successful in creating comparable control and voucher groups.
The random allocation of vouchers was done by computer to ensure that 75% of businesses received the voucher of their choice and 25% went into the control group, against which the additional impact of advice was measured. This worked as planned.
Because some eligibility checks needed documentary proof, such as trading in England, and could only be checked in person, a small percentage of businesses turned out to be ineligible and were removed from the RCT.13 This resulted in a slight departure from 75%--25% target but given the large number of businesses in the RCT removal of these businesses have little impact on results.
Excluding the ineligible businesses, in total 3,896 businesses completed their diagnostic between January and August 2014. Of these, 2,842 were allocated a voucher (73%) and 1,054 were not (27%). The profile of each of these two groups in terms of sector, business size, turnover and age of business is shown in Table 2.1.
13 https://www.gov.uk/government/uploads/system/uploads/attachment_data/file/349232/bis-14-1501-growth-vouchers-programme-terms-and-conditions-participants.pdf
16

Growth Vouchers Programme: Six Month Evaluation
Table 2.1: Profile of Cohort 1 Control and Voucher groups
Control Voucher Allocated Base: All businesses involved in the GVP between Jan 2014 and August 2014 (Cohort 1)
1,054 2,842 % %
Sector Business services 19* 22* Other services 28 27 Primary and construction 10* 13* Fashion and textiles 6 5 Transportation 2 3 Others 34 31 Business size (number of employees) 0 7 7 1 21* 24* 2 to 4 34 35 5 to 9 17 17 10 or more 21* 17* Median 3 3 Mean 6.38 5.76 Turnover Less than £50,000 28 30 £50,000 - £99,999 17 16 £100,000 - £199,999 14 15 £200,000 - £299,999 8 9 £300,000 - £499,999 9 9 £500,000 or more 24* 21* Median £120,000 £115,000 Mean £462,412 £407,675 Years Trading 1 year 16 17 2-5 years 40 42 6-10 years 20 19 11+ years 24 22 Median 4 4 Mean 5.68 5.48
Source: GVP Management Information
17

Growth Vouchers Programme: Six Month Evaluation
As is evident from Table 2.1, the control group and voucher group were both made up of a wide range of businesses – varying by sector, size, turnover and number of years trading. There are some slight differences in the profiles of the control and voucher groups – where these are significant14 they are annotated by a * in the table. The most notable differences are that the control group has a slightly higher proportion of businesses with over £500,000 turnover. There were also some slight differences by sector.
Overall, however, the profile of the two groups is very similar, indicating that the trial has been effective in creating groups that are comparable by key observable characteristics.
Businesses were also asked at the application stage to score themselves on a number of capability measures, for example, “How capable is your business at recruiting new employees?”. Again, there are no significant differences in the results. This is a positive result for the effectiveness of the trial as it provides further evidence of the comparability of the control and treatment groups.
Comparability of the Cohort 1 population and the survey population
The survey was successful in interviewing a representative cross-section of participants. But, as we might expect, businesses that did not receive a voucher were slightly less likely to take part in surveys.
In the survey of businesses six months after participating in the programme, a total of 1,499 interviews were achieved, including 1,180 with those who had received a voucher and 319 with those who had not. The survey data was weighted to correct for a slight over-representation of businesses that had used their voucher (and a slight under-representation of those in the control group). Table 2.2 shows how the profile of all Cohort 1 businesses compares with the weighted profile of those interviewed for the survey across key business characteristics.
14A statistically significant difference between two groups is a difference that unlikely to be due to chance alone. In a social science arena, a difference is said to be significant if there is only a 5% probability it could occur by chance alone.
18

Growth Vouchers Programme: Six Month Evaluation
Table 2.2: Comparison of businesses between the population and survey data
Control group Voucher Allocated group
Cohort 1 Population
Survey respondents
Cohort 1 Population
Survey respondents
Unweighted base 1,054 319 2,842 1,180 % % % % Sector Business services 19 18 22 21 Other services 28 32 27 31 Primary and construction 10 7 13 12
Fashion and textiles 6 6 5 5 Transportation 9 3 3 3 Others 34 33 31 29 Business size (number of employees) 0 7 5 7 8 1 21 23 24 25 2 to 4 34* 40* 35 34 5 to 9 17 14 17 17 10 or more 21 18 17 17 Turnover Less than £50,000 28 28 30 31 £50,000 - £99,999 17 21 16 16 £100,000 - £199,999 14 15 15 16 £200,000 - £299,999 8 7 9 9 £300,000 - £499,999 9 9 9 8 £500,000 or more 24 21 21 20
Years Trading
1 year 16 15 17 19 2-5 years 40 39* 42 39 6-10 years 20 21* 19 19 11+ years 24 24* 22 23
Source: GVP Management Information
As evident from Table 2.2, the profiles of both the surveyed control and voucher groups are very similar to the profiles of the Cohort 1 population. The significant differences that are evident are marked with a *. As the table shows, small businesses are over-represented within the control group (those with 2 to 4 employees account for 40% of the survey responses from the control group compared with 34% of the Cohort 1 population).
19

Growth Vouchers Programme: Six Month Evaluation
However, overall we can be confident that the information collected in the survey is representative of Cohort 1 as a whole.
We also considered whether the businesses that responded to the survey were representative of the general business population in the UK in terms of whether they were women-led or minority ethnic group (MEG)-led15.
The Small Business Survey (2014)16 stated that 18% of SME employers were majority-led by women, compared to 30% of survey respondents17 (with little difference between control group and voucher group businesses). This shows that women-led businesses are proportionally ‘overrepresented’ within the programme compared to UK SMEs as a whole, which at least suggests that the scheme has been accessible to women-led businesses.
Around 7% of the UK SME population are MEG-led businesses, compared to 8% of Growth Voucher businesses 18 (again with very little difference between the control and the voucher group). MEG-led businesses are therefore represented within the Growth Voucher Programme to the same extent as within the UK population.
The similar proportions of women and MEG-led businesses in the voucher and control groups, demonstrates once again that the programme has been successful in creating comparable treatment and control groups. Data tables can be found at Annex C.
Comparability of the Cohort 1 voucher and control groups within diagnostic type
Before voucher allocation businesses completed a diagnostic assessment to determine the type of advice that they would most benefit from. They were randomly assigned to either an online diagnostic assessment or an assessment with an adviser (a personal diagnostic). Some businesses on the personal diagnostic route had their assessment face-to-face while others had it by telephone (or in a small number of cases by Skype). The approach to the personal diagnostic was agreed between the delivery partner responsible for administering the diagnostic and the business.
The phase one qualitative research showed that it was often the delivery partner that suggested the diagnostic be conducted face-to-face, by telephone or skype. Although it was common for businesses to report that they were not offered a choice by the Delivery partner, most were satisfied with the suggested channel.
15 The definition of a business that is ‘majority led’ by a certain group is one where over 50% of the directors or owners belong to that group, e.g. over half of the directors are women, or over half belong to a minority ethnic group. 16 https://www.gov.uk/government/uploads/system/uploads/attachment_data/file/414963/bis-15-151-small-business-survey-2014-sme-employers_v1.pdf 3 If we include businesses where 50% of the directors are women (i.e. where there are an equal number of male and female directors), this figure rises to 54%. 18 If we include businesses where 50% of the directors are from minority ethnic groups (i.e. where there are an equal number of MEG and non-MEG directors), this figure rises to 10%.
20


Growth Vouchers Programme: Six Month Evaluation
Although the split of diagnostic routes between the control and voucher groups is slightly different, Table 2.3 shows that the profile of businesses for the control and voucher groups within each diagnostic route are very similar. The control and treatment groups are very similar in terms of business size, sector, turnover, or number of years trading. Within the online diagnostic route, there were some very slight differences which are indicated by a * in the table. Overall, we can therefore be confident in the validity of comparisons between the voucher and control groups within each of the two diagnostic types.
Table 2.3: Demographics of full population by diagnostic type
Online Personal
Control Voucher Allocated
Voucher Control Allocated Base: All businesses involved in the GVP between Jan 2014 and August 2014 (Cohort 1)
380 730 674 2,112
% % % %
Sector Business services 19 20 20 22 Other services 29 28 28 27 Primary and construction 10 11 9 14 Fashion and textiles 6 6 7 5 Transportation 3 3 2 2 Others 33 32 35 30 Business size (number of employees) 0 8 7 7 7 1 20 23 22 24 2 to 4 34 34 34 35 5 to 9 14 18 18 17 10 or more 23 19 20 17 Turnover Less than £50,000 29 31 26 29 £50,000 - £99,999 17 15 17 17 £100,000 - £199,999 11* 17* 16 14 £200,000 - £299,999 11 8 7 9 £300,000 - £499,999 7 9 11 9 £500,000 or more 26 21 23 21
Years Trading
1 year 17 19 16 17 2-5 years 38 41 41 42 6-10 years 18 18 21 19
22

Growth Vouchers Programme: Six Month Evaluation
Online Personal
Control Voucher Allocated
Voucher Control Allocated Base: All businesses involved in the GVP between Jan 2014 and August 2014 (Cohort 1)
380 730 674 2,112
% % % %
11+ years 28* 22* 22 23
The two groups were also similar in terms of other characteristics such as the number of part time or agency staff businesses said they employed
23

Growth Vouchers Programme: Six Month Evaluation
Comparability of Cohort 1 voucher and control groups within theme
At the end of their diagnostic, businesses selected one of five themes of advice based on the assessment of their advice need. These themes included: sales and marketing, exploiting IT and e-commerce, leadership and management, raising finance or expanding workforce. The online diagnostic suggested a theme based on business’ responses to questions about their business using an algorithm. However, businesses could choose whether to accept this recommendation or to select an alternative theme. Of the 1,110 businesses following the online diagnostic route, 688 (62%) followed the recommended theme while the remainder switched to a different choice. Within the personal diagnostic, the theme was agreed between the advisor and the business. Random allocation of the voucher happened after the selection of a theme.
As Figure 2.2 below demonstrates (using information taken from the Growth Vouchers Management information), the random allocation was successful in ensuring that the split between themes for the control and voucher groups was very similar. This means that any differences between the control group and the voucher group at the overall level will not be a function of differences in the proportions choosing each theme.
Figure 2.2: Theme by profile group
46%
22%
13%
13%
6%
Sales and Marketing
Exploiting IT and E-Commerce
Leadership and Management
Raising Finance
Expanding Workforce
47%
21%
15%
13%
5%
Control Voucher Allocated
Base: Cohort 1 population - Control group (1,054) Voucher allocated (2,842)
Sales and Marketing was the most commonly selected theme (47% of those allocated a voucher and 46% in the control group). It was relatively uncommon for businesses to choose the Expanding Workforce theme (which accounted for 6% of the control group and 5% of the voucher group). This report cannot breakdown results by individual themes because some themes (such as Marketing) were selected by many more businesses than others (such as Expanding Workforce) and so sample sizes become too small to make a comparison across themes.
24

Growth Vouchers Programme: Six Month Evaluation
In the qualitative research interviews, some businesses pointed out that while several of the advice themes would have been suitable for their business there was often one that felt most necessary or helpful for them at that particular time. Businesses tended to feel that the Sales and Marketing and Digital Technology themes related to more pressing concerns within the business. For some businesses, Expanding the Workforce, for example, was not seen as an inhibitor to growth but more a secondary concern to be addressed once the business starts growing.
As shown in Table 2.4, the profile of the control and voucher group within each theme were very similar (again, the few statistically significant differences are annotated by a *).
Ultimately, policy makers will want to be able to compare the impacts of providing advice on different themes and the Trial was set up to make this possible. Table 2.4 compares the business characteristics of the control and voucher groups within theme and confirms that the groups are very similar even though the actual numbers of businesses in each theme are quite low. Hence, the indications are that robust comparisons between control and voucher businesses should be possible once all applicants have been surveyed.
Voucher take-up
As the analysis presented so far in this chapter has shown, the Trial has produced voucher and control groups that are very similar on all observable business characteristics at an overall level, within diagnostic route and within advice theme. This means that the experiment has worked very well in establishing the conditions necessary to test a causal relationship between advice and business performance.
A complication is that not all businesses that were allocated a voucher went on to use it. Businesses had three months to purchase advice and claim back the subsidy. Of the Cohort one businesses, only a third (32%) used their voucher. This means that comparing the control group with the full group that voucher allocated a voucher could under-report the additional benefits of advice. Therefore throughout this report, alongside the comparisons between the control group and the “voucher allocated” group (which the Trial was set up to establish), we will also compare the control group and the group who actually used their voucher (the “voucher used” group).
25

Growth Vouchers Programme: Six Month Evaluation
Table 2.4: Demographics of the population by profile group within theme
Sales and Marketing
Raising Finance
Leadership and Management
Expanding Workforce
Exploiting IT and E-commerce
C
ontro
l
Vou
cher
A
lloca
ted
Con
trol
Vou
cher
A
lloca
ted
Con
trol
Vou
cher
A
lloca
ted
Con
trol
Vou
cher
A
lloca
ted
Con
trol
Vou
cher
A
lloca
ted
Base: All businesses involved in the GVP between Jan 2014 and August 2014 (Cohort 1)
489 1,343 132 363 141 417 65 133 227 586
% % % % % % % % % %
Sector Business services 20 24 15 17 23 21 32 31 15 19 Other services 30 26 36 30 27 28 20 31 22 25
Primary and construction 10 12 9* 16* 11 17 3 11 11 13
Fashion and textiles 4 5 5 5 6 2 2 2 12 9
Transportation 1 2 1* 6* 3 2 8 1 2 3 Others 34 32 33 27 30 30 35 25 37 31
Business size (number of employees) 0 8 8 9 6 6 6 5 3 6 8 1 25 27 17 19 16 21 11 16 23 22 2 to 4 35 36 34 34 33 29 31 29 34 38 5 to 9 17 15 15 19 18 21 25 26 14 15 10 or more 16 14 25 21 26 23 29 26 23* 17*
Turnover Less than £50,000 30* 35* 28 26 19 23 22 20 28 28 £50,000 - £99,999 20* 16* 13 17 9 14 6 15 20* 18 £100,000 - £199,999 13 15 14 12 17 18 22 16 11 14 £200,000 - £299,999 9 9 7 9 9 8 9 14 7 10 £300,000 - £499,999 9 7 11 11 11 12 9 11 7 9 £500,000 or more 18 18 28 25 34 26 32 25 26 21
Years Trading 1 year 18 16 20 18 14 18 18 17 15 16 2-5 years 41 41 43 45 37 37 31 41 40 43 6-10 years 19 19 18 15 26 19 23 16 18 19 11+ years 22 24 18 22 23 26 28 26 28 22
26

Growth Vouchers Programme: Six Month Evaluation
Chapter 3: Evidence of the impact of Growth Vouchers
Chapter Summary
• In the immediate term, using the voucher is associated with improved capability in the areas of “people management” and “developing and implementing a business plan”, though not yet in the other capabilities surveyed. That said, a large proportion of businesses that used their voucher agreed that their involvement in the Growth Vouchers Programme had increased the skills level within their business – far higher proportions than businesses that did not use their voucher, or those in the control group.
• The use of a Growth Voucher has played a role in increasing the appetite for seeking advice, and paying for it, in the future.
• In terms of intermediate actions that may lead to growth, businesses that used the voucher were more likely than those in the control group to have put in place several business planning measures (both general measures and those more specific to the advice theme chosen). These measures could be considered steps on a journey towards growth and further development.
• In terms of observable ‘hard’ impacts, the only area where there is an observable difference as a result of receipt of advice is in terms of reported turnover growth. At this stage, use of the voucher did not appear to have an impact on any other quantifiable measures such as staff headcount or number of sites.
• The voucher appears to have had little impact on businesses’ growth ambitions for the future (largely because these were high for all businesses participating in the programme at the time of application).
27
Growth Vouchers Programme: Six Month Evaluation
This chapter explores the impact that the Growth Vouchers Programme has had on businesses by around six months after completion of the diagnostic. This is assessed through comparing outcomes for the control and voucher groups (and for a subset of the voucher group who had used their voucher).
The key aim of the Growth Vouchers Programme RCT is to provide robust evidence as to whether or not business advice results in business growth. This is based on a logic model (shown in Annex E) which sets out a number of stages of impact. In summary, these are:
• Immediate outcomes (in the first year), which include improved business confidenceand ability, as well as increased use of business advice;
• Interim outcomes (in the second and third years), which include all of the former butalso ‘harder’ business impacts such as turnover and staff numbers; and
• Ultimate outcomes (after the third year), which include all of the above but alsosustainable business growth and wider positive economic impacts.
This is based on research that shows that it can take a considerable period of time for advice to translate first into some form of action or practical change within businesses, and secondly for that action to have a genuine and measurable impact on the business. Certainly a lack of impact on hard measures at this stage does not necessarily mean absence of the programme impact, as the benefits of being involved may well take a while to ‘bed in’ to the business and create more measurable, long-standing impact.20
The evidence base for this report is the survey conducted around six months after businesses received their diagnostic. Based on evaluation of business support done in the past this is quite a short period over which to observe change on some of these hard indicators of growth (particularly when it is taken into account that businesses receiving a voucher had up to three months to use it so for some only three months had elapsed since they received their advice). It is therefore the immediate outcomes that this report primarily assesses. However, the chapter will also explore any evidence of ‘hard’ impacts of the programme, such as changes in turnover, and any changes in growth ambitions for the future. The indicators explored were
• Changes in advice seeking behaviour
• Changes in businesses perceptions of their own capabilities and their confidenceabout the future
• Evidence of general business planning
• Evidence of introducing new approaches or activities related to each advice theme
20 Mole K, Hart M, Roper S, Saal, D (2006) “Who benefits most from business assistance?”, Institute for Small Business and Entrepreneurship.
28

Growth Vouchers Programme: Six Month Evaluation
In looking for evidence of impact, the key comparisons made throughout this chapter are between:
• Control group businesses – those not allocated a voucher
• Businesses that were allocated a voucher (but may not necessarily have used it)
• Businesses that had used their voucher – a subset of those that were allocated thevoucher who have received advice and used their voucher to claim for it
Immediate outcomes - advice seeking behaviour
Advice sought since involvement with GVP The majority of businesses have sought advice beyond the programme; although it is not clear whether this is a result of GVP
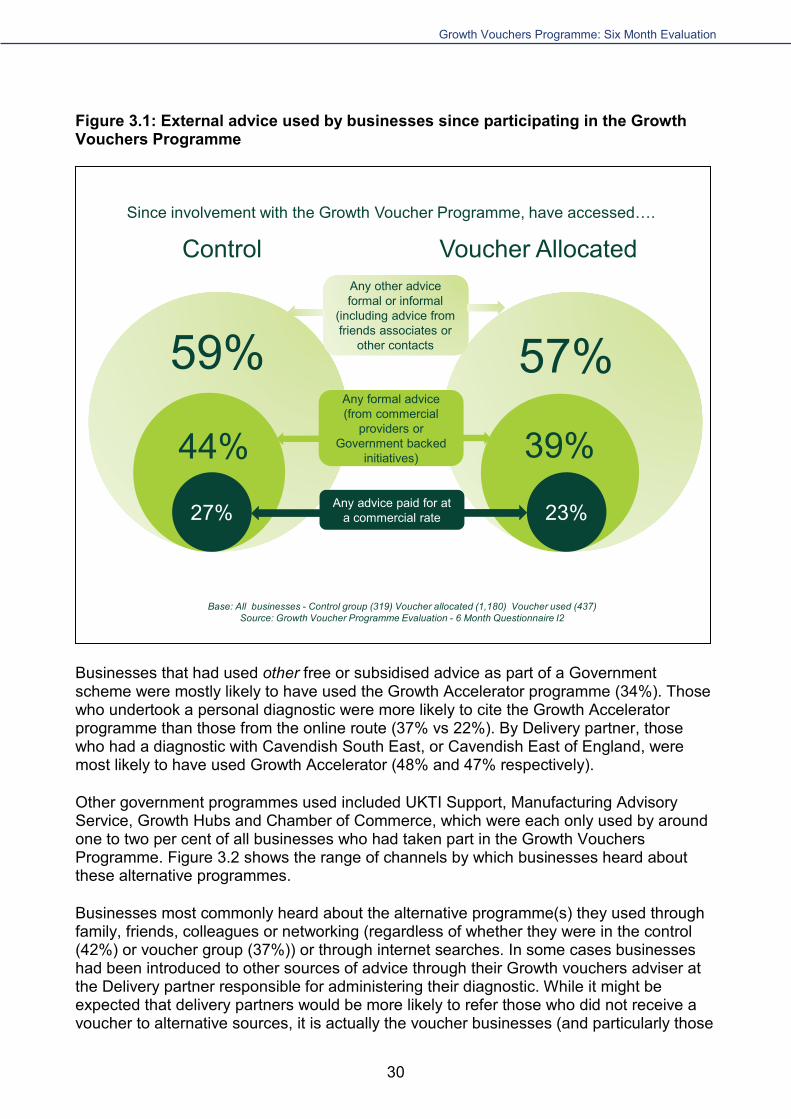
One of the motivations of the programme was that involvement in it may encourage businesses to seek further advice. To test this, we asked businesses at the six month stage about their use of other advice channels since their involvement in the programme. Since applying for the Growth Vouchers Programme, just under three in five (57%) businesses had sought business advice from other sources (59% in the control group and 57% in the group allocated a voucher).
As similar proportions of businesses had sought advice regardless of whether they were in the voucher or control groups, it does not seem that the level of involvement in the Growth Vouchers Programme (ie getting and using a voucher) makes businesses any more or less likely to have sought additional (non-Growth Voucher) advice in the first six months.
Figure 3.1 covers advice from all sources including free or subsidised advice from friends, associates or other contacts. If only more formal advice is covered (ie that delivered through commercial providers, Government schemes or other sources such as business clubs/groups, consultants, accountants and mentors) then the proportion who received advice fell to 44% in the control group and 39% in the group allocated a voucher. Fewer than half of these received advice from other sources and paid for advice at a commercial rate (27% of the control group and 23% of the voucher group). The use of multiple advice sources may make attributing impacts to the use of Growth Vouchers themselves more challenging.
29

Growth Vouchers Programme: Six Month Evaluation
who had actually used their voucher) who were more likely to have been referred to other programmes by their adviser.
Figure 3.2: Communication channels used to find out about alternative government programmes
4%
10%
3%1%
3%
9%
6%
19%
10%
30%
5%
9%
2%1%3%
5%
8%
14%12%
37%
2%
11%
2%
5%3%2%
5%
8%
18%
42%
Don't knowOtherContacted byalternativeprogramme
Local councilEmail(unspec.)
Chamber ofCommerce
Businessforum
GrowthVoucherAdvisor
Onlinesearch
Family,friends,
colleagues orthrough
networking
Voucher used
Voucher allocated
Control
Base: All businesses that used advice subsidised through another scheme - Control group (65) Voucher allocated (195) Voucher used (79)
Source: Growth Voucher Programme Evaluation - 6 Month Questionnaire I4
Other channels reported by 1% of businesses:• Previous use / already aware• Business show / event• Gov.uk website• University / college• Local adverts / newsletters• Bank• Radio / newspaper advert
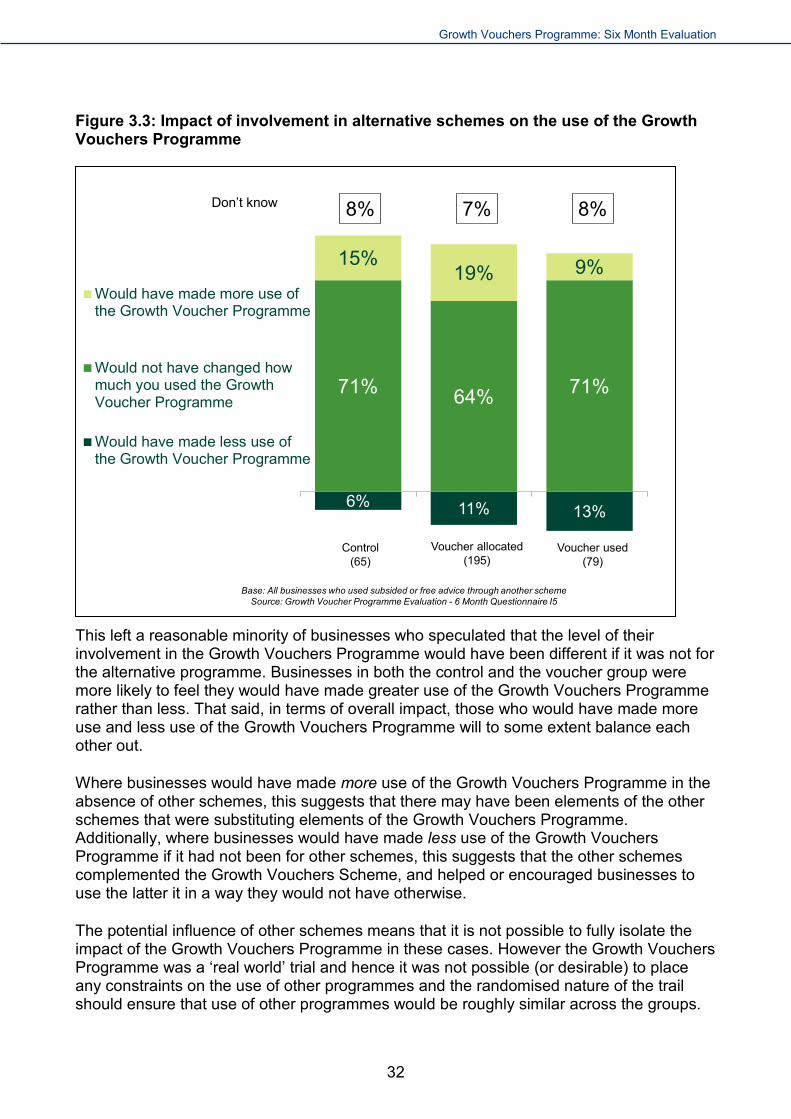
Businesses generally felt that their involvement with alternative programmes had little impact on the level of use that they made of the Growth Vouchers Programme. The majority of those who had taken up advice through an alternative programme were confident that the extent of their involvement with the Growth Vouchers Programme would not have changed if they had not been involved in the other scheme (71% control group, 64% voucher group and 71% of those who had used their voucher).
31
Growth Vouchers Programme: Six Month Evaluation
Figure 3.3: Impact of involvement in alternative schemes on the use of the Growth Vouchers Programme
6% 11% 13%
71% 64% 71%
15%19% 9%
Would have made more use ofthe Growth Voucher Programme
Would not have changed howmuch you used the GrowthVoucher Programme
Would have made less use ofthe Growth Voucher Programme
8%Don’t know 7% 8%
Base: All businesses who used subsided or free advice through another schemeSource: Growth Voucher Programme Evaluation - 6 Month Questionnaire I5
Control (65)
Voucher allocated (195)
Voucher used (79)
This left a reasonable minority of businesses who speculated that the level of their involvement in the Growth Vouchers Programme would have been different if it was not for the alternative programme. Businesses in both the control and the voucher group were more likely to feel they would have made greater use of the Growth Vouchers Programme rather than less. That said, in terms of overall impact, those who would have made more use and less use of the Growth Vouchers Programme will to some extent balance each other out.
Where businesses would have made more use of the Growth Vouchers Programme in the absence of other schemes, this suggests that there may have been elements of the other schemes that were substituting elements of the Growth Vouchers Programme. Additionally, where businesses would have made less use of the Growth Vouchers Programme if it had not been for other schemes, this suggests that the other schemes complemented the Growth Vouchers Scheme, and helped or encouraged businesses to use the latter it in a way they would not have otherwise.
The potential influence of other schemes means that it is not possible to fully isolate the impact of the Growth Vouchers Programme in these cases. However the Growth Vouchers Programme was a ‘real world’ trial and hence it was not possible (or desirable) to place any constraints on the use of other programmes and the randomised nature of the trail should ensure that use of other programmes would be roughly similar across the groups.
32

Growth Vouchers Programme: Six Month Evaluation
Attitudes towards future advice seeking Use of the voucher seems to increase businesses’ interest in seeking business advice and paying for it, in the future.
A final area explored was the impact of the programme on businesses interest in future advice seeking. Businesses allocated a voucher were considerably more likely than those in the control group to state that they would seek advice in the future (65% compared to 37%). Among those who had actually used their voucher the proportion rose to 89%. This is in contrast to the finding discussed earlier, that these businesses are no more likely to have sought (additional) advice in the last six months. This may be because, when thinking about future advice seeking, businesses that have had a positive experience of the Growth Vouchers Programme, may over-estimate their intention of future use. However when businesses were asked what they had already used in the last six months, their answers were factual.
A similar pattern was seen when businesses were asked about paying for advice in the future. More of those who had been allocated a voucher (56%) and particularly those who had used it (78%) agreed they were more likely to pay for advice in the future as a result of their experience, compared to those in the control group (32%). Again, willingness to pay for advice in the future appears to be related to a positive experience of the Growth Vouchers Programme.
Immediate outcomes - business capabilities and confidence
Those businesses who received a voucher are now more confident about their business capabilities.
One expectation at the outset of the programme was that the use of external advice would create a positive, observable impact on businesses’ confidence and perceptions of their own capabilities. However, there was a suggestion that the external challenge to their existing ideas could lead to a negative impact in the short-term, for example if the advice helps the manager realise improvements are needed.
Most businesses that had used their voucher (ie bought advice) agreed that their involvement with the Growth Vouchers Programme had improved skills within their business (82% agreement, including 40% agreeing strongly) as is shown in Figure 3.4.
This compares with only 13% of those in the control group (we can assume that those who agreed found the process of going through the diagnostic beneficial even though they did not receive a voucher). Across the whole group allocated a voucher, 40% agreed that they had seen an improvement in skills as a result of the programme.
When businesses completed the online application to the Growth Vouchers Programme they were asked to assess how capable their business was in a number of different areas:
• People management• Developing and implementing a business plan and strategy• Entering new domestic markets• Entering new foreign markets (ie exports)
33

Growth Vouchers Programme: Six Month Evaluation
• Developing and introducing new products or services • Accessing external finance e.g. loans, overdraft, equity finance • Recruiting new employees • Using information technology to grow their business
In each of these areas, they were asked to say whether they felt their business was: very strong, strong, average, poor or very poor.
In the survey conducted around six months after their diagnostic, businesses were then re-asked these questions about their capabilities. This makes it possible to look at whether the Growth Vouchers Programme has had an impact on the businesses’ views of their own capabilities. Although, these measures are self-reported and subjective these measures are still important as an immediate outcome.
Figure 3.4: Self-reported improvements attributable to the Growth Vouchers Programme
1%
3%
49%
22%
2%
15%
10%
3%
23%
25%
13%
8%
23%
42%
4%
18%
40%
Control
Voucher allocated
Voucher used
Don’t know Strongly disagree Tend to disagreeNeither agree nor disagree Tend to agree Strongly agree
Base: All businesses - Control group (319) Trial voucher allocated (1180) Trial voucher used (437)Source: Growth Voucher Programme Evaluation - 6 Month Questionnaire H1_1
As shown in Figure 3.5, at the application stage the areas in which businesses overall were most likely to rate themselves ‘strong’ (either ‘very strong’ or ‘strong’) were people management and using IT. Businesses were least likely to rate themselves strong when it came to raising external finance and entering new foreign markets (although the latter would not be relevant for all businesses).
34

Growth Vouchers Programme: Six Month Evaluation
Figure 3.5: Proportion of businesses rating themselves ‘strong’ in each area at the time of application
46% 45%
18%
53%
30%
41%
59%
12%
42%47%
19%
51%
26%
40%
55%
11%
43%46%
20%
51%
25%
43%
58%
7%
Developing /implementingbusiness plan
Introducingnew products /
services
Raisingexternalfinance
Using IT New domesticmarkets
Recruiting newemployees
Peoplemanagement
New foreignmarkets
Control All allocated voucher Used voucher
Base: All businesses - Control group (319) Trial voucher allocated (1180) Trial voucher used (437)Source: Growth Voucher Programme Evaluation – MI data
Across six of the eight capability areas, around half of businesses reported an increase in capability over the period since registering with the programme. They were slightly less likely to report improvements in People Management (around 40% improved) and Entering New Foreign Markets (around 30% improved).
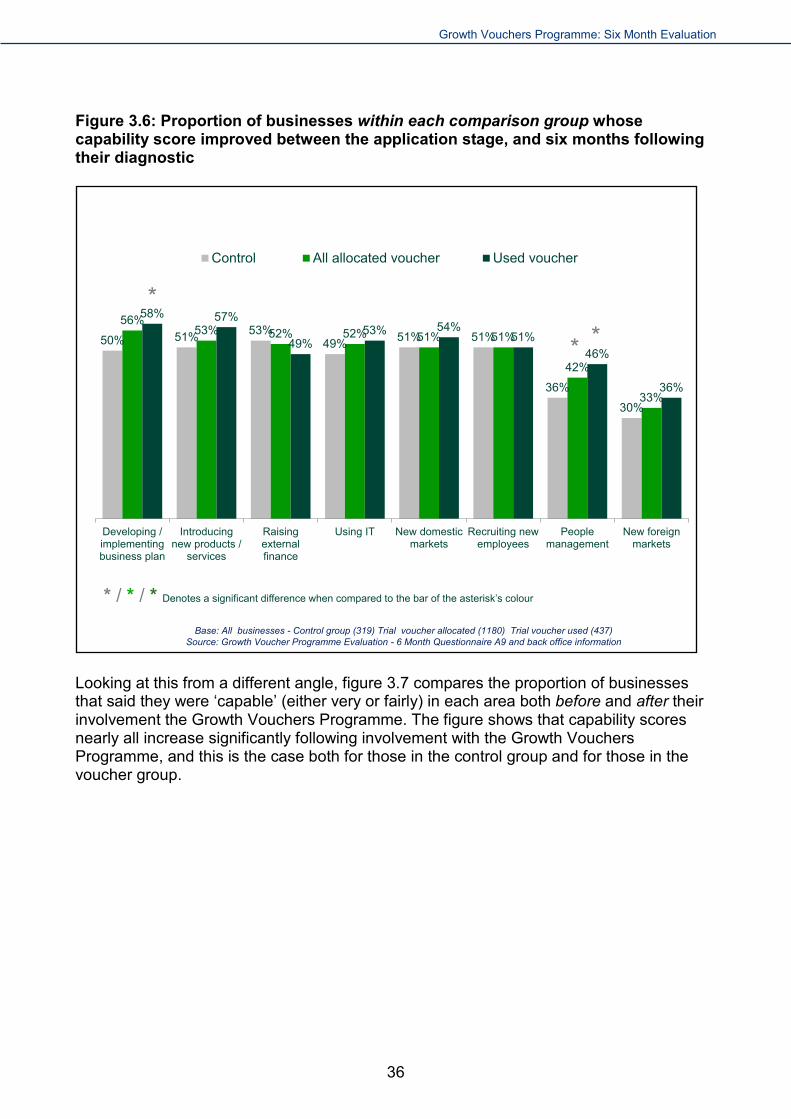
As Figure 3.6 shows, in all but two of the capability areas, half of businesses or more rate themselves better now than at the start of their involvement in the programme. However, in most areas there were no or only very small differences in the likelihood of reporting improved capability between the control and voucher groups. The exceptions are People Management and Developing and Implementing a Business Plan, where receipt of a voucher (and particularly use of a voucher) was associated with an increased likelihood to report an improved capability.
35
Growth Vouchers Programme: Six Month Evaluation
Figure 3.6: Proportion of businesses within each comparison group whose capability score improved between the application stage, and six months following their diagnostic
50% 51% 53%49% 51% 51%
36%
30%
56%53% 52% 52% 51% 51%
42%
33%
58% 57%
49%53% 54%
51%46%
36%
Developing /implementingbusiness plan
Introducingnew products /
services
Raisingexternalfinance
Using IT New domesticmarkets
Recruiting newemployees
Peoplemanagement
New foreignmarkets
Control All allocated voucher Used voucher
Base: All businesses - Control group (319) Trial voucher allocated (1180) Trial voucher used (437)Source: Growth Voucher Programme Evaluation - 6 Month Questionnaire A9 and back office information
* *
* / * / * Denotes a significant difference when compared to the bar of the asterisk’s colour
*
Looking at this from a different angle, figure 3.7 compares the proportion of businesses that said they were ‘capable’ (either very or fairly) in each area both before and after their involvement the Growth Vouchers Programme. The figure shows that capability scores nearly all increase significantly following involvement with the Growth Vouchers Programme, and this is the case both for those in the control group and for those in the voucher group.
36

Growth Vouchers Programme: Six Month Evaluation
Figure 3.7: Proportion of businesses rating themselves as ‘capable’ in each area-- before and after their involvement with the Growth Vouchers Programme
45%53%
18%
36%41%
46%
59%
12%
73% 76%
47%55%
68% 71%67%
25%
47%51%
19%26%
40% 42%
55%
11%
76%82%
49%54%
69%73% 71%
24%
Introducing newproducts and
services
Using IT External finance Entering newdomestic markets
Recruiting newemployees
Developing andimplementingbusiness planand strategy
Peoplemanagement
Entering newforeign markets
Control - before (319) Control - after (319) Voucher - before (1180) Voucher - after (1180)
Base: All businessesSource: Growth Voucher Programme Evaluation - 6 Month Questionnaire A9/Management Information
* *
**
* *
*
* *
**
* * *
*
* / * Denotes a significant difference between the ‘before’ score and the ‘after’ score
Immediate outcomes – evidence of actions taken
Businesses that received vouchers are more likely to implement measures linked with better business performance, such as developing marketing plans.
The survey also explored the impact of the Growth Vouchers Programme in terms of measures that might represent ‘steps on the journey’ to business growth.
The softer measures of impact considered in this chapter fall into two categories: a) general planning measures (such as putting in place a business plan, marketing plan, corporate website, etc); and b) actions more specifically related to the advice theme that the business chose. For example, for businesses that chose the Sales and Marketing theme, the measures explored included entering overseas markets, or developing new marketing materials, etc).
The evaluation found that businesses that received a voucher were more likely than those in the control group to have put some general, and theme specific, planning measures in
37

Growth Vouchers Programme: Six Month Evaluation
place. However, this difference was more marked when comparing those that used their voucher with those in the control group.
General business planning measures The presence of the following general planning measures was explored:
• A formal written business plan• A marketing plan• A marketing budget• A corporate website• A workforce development strategy• A recruitment budget• A training budget• A cash flow forecast• Regular financial reports e.g. VAT reports
It is useful to note the difference between these measures, and the capability measures discussed previously in the chapter. The previous capability measures (e.g. how capable the business is at people management), are subjective and self-assessed, whereas these planning measures are more tangible ‘actions’ or behaviours that can be objectively ‘in place’ or ‘not in place’.
Businesses were first asked whether they had any of these measures in place currently, and where they had, whether the measure had been put in place in the last six months since their involvement in the Growth Vouchers Programme21, or whether it had been in place before then. First, for context, Figure 3.7 shows the proportion of businesses overall that had each of the measures in place at the time of interview. This picture is similar within both the control and voucher groups, although those who have used their voucher were more likely than other businesses to have a business plan and a marketing plan in place.
It is possible that businesses with a plan already in place may have been more likely to go on to use a voucher than businesses with no plan in place. This is difficult to tease apart using the current data. However, the main interest of this section is what has been put in place since businesses’ application to the programme. This is covered in the paragraphs directly following Figure 3.8.
21 Note that businesses were not asked specifically whether they had put the measure in place as a result of their involvement with the Growth Vouchers Programme, only whether or not it had been put in place in the last six months, since their involvement with the Programme.
38

Growth Vouchers Programme: Six Month Evaluation
Figure 3.8: Proportion of businesses overall with each measure currently in place
Base: All businesses (1,499)Source: Growth Voucher Programme Evaluation - 6 Month Questionnaire G1
90%83%
75%
61%56% 53%
37%31%
16%
Corporatewebsite
Regularfinancialreports
Cash flowforecast
Businessplan
Marketingplan
Marketingbudget
Trainingbudget
Workforcedevelopment
strategy
Recruitmentbudget
This figure shows that the measures most likely to be in place currently within businesses were a corporate website (90% of businesses overall), regular financial reports (83%), cash flow forecasts (75%) and a formal written business plan (61%).
These figures provide another opportunity to compare how businesses participating in the Growth Vouchers Programme compare with UK businesses ‘in general’ to assess whether participants can be considered relatively ‘mainstream’, rather than a particularly keen or high-performing subset.
Other research commissioned by BIS suggests that similar numbers of SMEs in general in the UK have a business plan in place: “46% of all SMEs do not plan – either in terms of producing regular management reports or having a formal written business plan”22.
It is also useful to look at this data in terms of how many businesses had these measures in place before their involvement with the Growth Vouchers Programme, and how many businesses had these in place following their involvement with the programme.
22 SMEs: The Key Enablers of Business Success and the Economic Rationale for Government Intervention (2013) BIS Analysis Paper Number 2. Web: https://www.gov.uk/government/uploads/system/uploads/attachment_data/file/266304/bis-13-1320-smes-key-enablers-of-business-success.pdfWeb: https://www.gov.uk/government/uploads/system/uploads/attachment_data/file/266304/bis-13-1320-smes-key-enablers-of-business-success.pdf
39
Growth Vouchers Programme: Six Month Evaluation
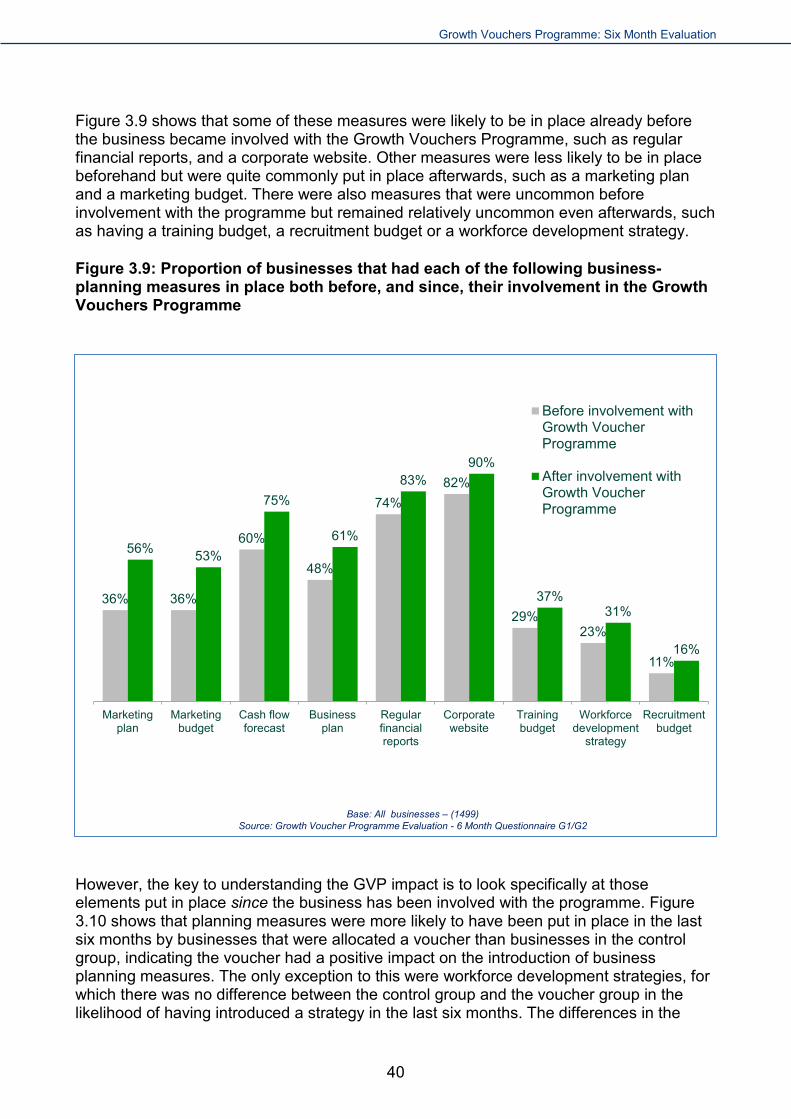
Figure 3.9 shows that some of these measures were likely to be in place already before the business became involved with the Growth Vouchers Programme, such as regular financial reports, and a corporate website. Other measures were less likely to be in place beforehand but were quite commonly put in place afterwards, such as a marketing plan and a marketing budget. There were also measures that were uncommon before involvement with the programme but remained relatively uncommon even afterwards, such as having a training budget, a recruitment budget or a workforce development strategy.
Figure 3.9: Proportion of businesses that had each of the following business-planning measures in place both before, and since, their involvement in the Growth Vouchers Programme
36% 36%
60%
48%
74%82%
29%23%
11%
56% 53%
75%
61%
83%90%
37%31%
16%
Marketingplan
Marketingbudget
Cash flowforecast
Businessplan
Regularfinancialreports
Corporatewebsite
Trainingbudget
Workforcedevelopment
strategy
Recruitmentbudget
Before involvement withGrowth VoucherProgramme
After involvement withGrowth VoucherProgramme
Base: All businesses – (1499)Source: Growth Voucher Programme Evaluation - 6 Month Questionnaire G1/G2
However, the key to understanding the GVP impact is to look specifically at those elements put in place since the business has been involved with the programme. Figure 3.10 shows that planning measures were more likely to have been put in place in the last six months by businesses that were allocated a voucher than businesses in the control group, indicating the voucher had a positive impact on the introduction of business planning measures. The only exception to this were workforce development strategies, for which there was no difference between the control group and the voucher group in the likelihood of having introduced a strategy in the last six months. The differences in the
40

Growth Vouchers Programme: Six Month Evaluation
proportions introducing planning measures were even more marked when control group businesses were compared with businesses which had actually used their voucher.
Figure 3.10: Proportion of businesses that put each of the following business-planning measures in place in the previous six months, since their involvement with the Growth Vouchers Programme
16%13% 13%
9%7% 7% 7% 8%
3%
23%
18%15% 14%
10%8% 9% 9%
5%
41%
27%
18%
24%
14%12%
14%12%
7%
Marketing plan Marketingbudget
Cash flowforecast
Business plan Regularfinancial reports
Corporatewebsite
Training budget Workforcedevelopment
strategy
Recruitmentbudget
Control All allocated voucher Used voucher
Base: All businesses - Control group (319) Trial voucher allocated (1180) Trial voucher used (437)Source: Growth Voucher Programme Evaluation - 6 Month Questionnaire G2
All allocated voucher51%
Used voucher72%
Control42%
Put any of these plans in place since involvement with GVP
* / * / * Denotes a significant difference when compared to the bar of the asterisk’s colour
*
* *
*
* *
**
* *
* * * ** **
A total of 51% of businesses in the voucher group had put in place at least one of these measures in the six months prior to interview compared to 42% of the control group. This figure rose to 72% among those who had used their voucher.
Some of the biggest differences between the control group and the group who used their voucher were evident for the proportions introducing a marketing plan or a marketing budget. This perhaps reflects the fact that the ‘sales and marketing’ theme was the one that businesses were most likely to select.
When these figures are re-based only on those who have each in place, the picture is similar in that those who used their voucher are consistently more likely to have done so since their involvement with the programme than the control group. However, there is generally no difference between the voucher and control group - the exceptions are a marketing plan and a business plan.
41

Growth Vouchers Programme: Six Month Evaluation
Theme-specific actions Businesses were asked whether they had taken certain measures that were related to the advice theme that the business chose following their diagnostic. As shown in Chapter 2, the fact that the programme allowed businesses to choose the theme that they were allocated to resulted in an uneven distribution of businesses by theme. This means that at this stage, only two themes had large enough numbers of participant businesses covered by the survey to enable reporting of theme specific actions. Hence only the actions relating to the Sales and Marketing, and Making the Most of Digital Technology themes are covered here.
Sales and Marketing actions Businesses that chose this theme were asked whether they had taken any of the following measures in the previous six months, since they had become involved in the Growth Vouchers Programme:
• Developed or amended their marketing strategy• Identified new customers• Entered or planning to enter new UK markets• Entered new overseas markets• Brought new customers to their business• Developed new marketing materials• Started or increased advertising activity• Developed or refreshed their company website• Employed marketing consultants
Of these measures, businesses overall were most likely to have brought new customers to the business, identified new customers and developed new marketing materials. Businesses were least likely to have employed marketing consultants or entered new overseas markets.
As Figure 3.11 shows, businesses that were allocated a voucher were more likely than those in the control group to have put in place most of these measures. The exceptions were ‘brought new customers to the business’ which businesses were equally likely to have done regardless of whether or not they were allocated a voucher.
42

Growth Vouchers Programme: Six Month Evaluation
Figure 3.11: Proportion of businesses that have taken each Sales and Marketing measure in the last six months
79%
71%
63% 65%
50% 48% 48%
17% 14%
82% 81%
72%67% 66%
59%
47%
34%
12%
84%89% 87%
75%
90%
71%
57%62%
9%
Brought newcustomers tothe business
Identified newcustomers
Developednew
marketingmaterials
Developed orrefreshed
your companywebsite
Developed oramended
yourmarketingstrategy
Started orincreasedadvertising
activity
Entered orplanning newUK markets
Employedmarketing
consultants
Entered newoverseasmarkets
Control All allocated voucher Used voucher
Base: All businesses in Sales and Marketing theme - Control group (149) Voucher allocated (591) Voucher used (207)Source: Growth Voucher Programme Evaluation - 6 Month Questionnaire G6
All allocated voucher97%
Used voucher100%
Control94%
Put any Sales and Marketing measure in place in last 6 months
Sales and Marketing
* / * / * Denotes a significant difference when compared to the bar of the asterisk’s colour
* **
*** **
**
* *** * **
*
The differences in the proportions of businesses taking sales and marketing actions were particularly noticeable when comparing the control group with the group of businesses who had actually used their voucher. The biggest differences were observed for the proportion of businesses that had developed/amended their marketing strategy (40 percentage points) and designed new marketing materials (24 percentage points). A big difference was also observed for employing marketing consultants but this is perhaps almost by definition (since businesses are likely to have included the sales and marketing advice bought with their voucher here).
Businesses are most likely to implement these kinds of measures together rather than in isolation: it was most common for businesses within this theme to have put in place five (16%), six (18%) or seven (18%) measures.
Lower proportions had put in place under five measures (10% had out in place four measures, 8% three measures, 6% two measures, 4% one measure and 4% had not put any measures in place), or over seven measures (11% had put in place eight measures, 4% nine measures and 1% ten measures).
43

Growth Vouchers Programme: Six Month Evaluation
Businesses that had used their voucher were more likely to have put in place seven or eight measures compared to those in the voucher allocated, or control, groups. However this was only the case for these specific numbers of measures; there were no differences between groups where businesses had put in place between one and six measures, or nine measures.
Businesses that put in place more measures reported increase in sales. For example, 47% of businesses reported increase in sales if they have adopted four or fewer measured; this percentage increased to 59% when businesses took six or more measures. This relationship indicates having implemented a number of measures could be good predictor of sales growth.
Making the Most of Digital Technology actions
Businesses that chose this theme were asked whether they had taken any of the following actions in the previous six months, since they had become involved in the Growth Vouchers Programme:
• Developed an e-commerce strategy• Explored costs of new hardware or software to enable them to benefit more from
digital technologies• Invested in new hardware or software• Taken steps to optimise the ability of customers to find their business through search
engines• Started to trade / interact with customers online for the first time• Increased the amount of trade / interaction with customers that they conducted online
Businesses in the voucher group were more likely than those in the control group to have taken nearly all these actions (with the exception of investing in new hardware or software). As for Sales and Marketing actions, the contrast between the control group and the group of businesses who had used their voucher was even more marked. In particular those who had used their voucher were much more likely to have taken steps to ensure search engine optimisation (30 percentage points more likely than the control group), to have increased the amount of trade/interaction with customers online (by 26 percentage points) or to have developed an e-commerce strategy (by 27 percentage points).
At an overall level, as shown in figure 3.12, 82% of businesses in the Making the Most of Digital Technology control group had taken one of the theme-specific actions explored while almost all (97%) of those who had used a voucher had done so.
44
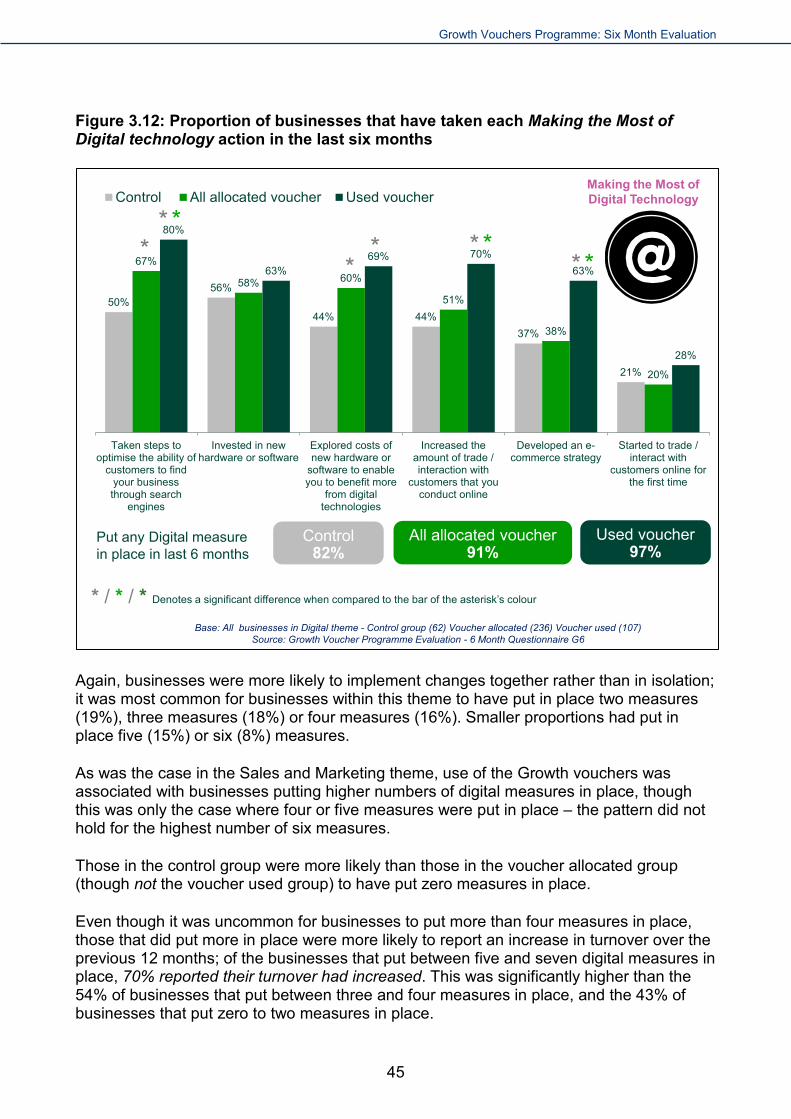
Growth Vouchers Programme: Six Month Evaluation
Figure 3.12: Proportion of businesses that have taken each Making the Most of Digital technology action in the last six months
50%56%
44% 44%37%
21%
67%
58% 60%
51%
38%
20%
80%
63%69% 70%
63%
28%
Taken steps tooptimise the ability of
customers to findyour businessthrough search
engines
Invested in newhardware or software
Explored costs ofnew hardware or
software to enableyou to benefit more
from digitaltechnologies
Increased theamount of trade /interaction with
customers that youconduct online
Developed an e-commerce strategy
Started to trade /interact with
customers online forthe first time
Control All allocated voucher Used voucherMaking the Most of Digital Technology
Base: All businesses in Digital theme - Control group (62) Voucher allocated (236) Voucher used (107)Source: Growth Voucher Programme Evaluation - 6 Month Questionnaire G6
All allocated voucher91%
Used voucher97%
Control82%
Put any Digital measure in place in last 6 months
* / * / * Denotes a significant difference when compared to the bar of the asterisk’s colour
* **
** * *
* *
Again, businesses were more likely to implement changes together rather than in isolation; it was most common for businesses within this theme to have put in place two measures (19%), three measures (18%) or four measures (16%). Smaller proportions had put in place five (15%) or six (8%) measures.
As was the case in the Sales and Marketing theme, use of the Growth vouchers was associated with businesses putting higher numbers of digital measures in place, though this was only the case where four or five measures were put in place – the pattern did not hold for the highest number of six measures.
Those in the control group were more likely than those in the voucher allocated group (though not the voucher used group) to have put zero measures in place.
Even though it was uncommon for businesses to put more than four measures in place, those that did put more in place were more likely to report an increase in turnover over the previous 12 months; of the businesses that put between five and seven digital measures in place, 70% reported their turnover had increased. This was significantly higher than the 54% of businesses that put between three and four measures in place, and the 43% of businesses that put zero to two measures in place.
45

Growth Vouchers Programme: Six Month Evaluation
Planning measures taken across all themes While there were too few businesses within each of the other themes to report on them separately, it is possible to look across all businesses and to calculate the proportion of businesses who had taken any theme-specific action. Overall, 83% of businesses in the control group had taken at least one theme-specific action in the six months following their diagnostic, compared to 87% businesses that were allocated a voucher and 94% that had used the voucher.
Use of business plan Using a Growth Voucher makes a business more likely to have a business plan, but does not alter the regularity with which they use it.
As shown earlier, around two thirds of businesses (61% overall) had a business plan in place. There is no difference at the six month stage between the voucher and control group; however, those who had used their voucher were more likely to have put this in place in the last six months (24%), compared to those in the control group (9%).
Of course, a business plan is only really likely to drive improvements if it is referred to and updated regularly (and more analysis will be needed at a later stage to establish if having a business plan will genuinely lead to business growth). Businesses were therefore asked about the extent to which they consulted their business plans, to see if there was any evidence that the Growth Vouchers Programme had an impact on the use of business plans within participant businesses. Figure 3.13 shows the frequency with which businesses referred to their plan.
Figure 3.13: How often businesses refer to their written business plan
20%5% 6%
5%
5% 8%
10%
10% 12%
23%16% 23%
32%29% 36%
Control Voucher allocated Voucher used
Every month
Every quarter
Twice a year
Once a year
Never
Base: All businesses with a business plan - Control (187), Voucher allocated (727), Voucher used (288).Source: Growth Voucher Programme Evaluation - 6 Month Questionnaire G2b
Where a formal written businesses plan was in place, most businesses referred to it frequently, with around a third (36% overall) referring to it every month and a further third (31% overall) every quarter. This was the case regardless of whether the business was in the voucher or control group (there were no significant differences between these groups or between the control group and those who had used their voucher). Around one in ten
46
Growth Vouchers Programme: Six Month Evaluation
businesses (13% overall) referred to their business plan yearly, and a very small proportion (3% overall) stated they never refer to it.
Another consideration is how often businesses update their plan because those who refer to their plan more may change it to meet new business challenges and changing business conditions. Businesses with a business plan in place tended to have updated it relatively recently. The largest proportion of businesses (35%) had updated their business plan within the last month, with lower proportions reporting they had updated their plan long ago: 28% had updated it during the last quarter, 17% within the last six months, 13% within the last twelve months, and just 7% more than a year ago. There were no significant differences in terms of how recently businesses had updated their business plan between the control group and the voucher group.
Hence, while businesses in the voucher group (and particularly those who had used their voucher) were more likely to have put a business plan in place, there was no discernible impact of receiving the voucher (or receiving advice) on the regularity with which the business plan was updated or referred.
Evidence of ‘hard’ impacts
Businesses that received a voucher were more likely to report an increase in turnover than the control group.
Because the main policy question for this programme is to test: Do businesses that use external advice perform better than those that do not? The answer to this question relies on concrete and measurable changes such as turnover or a rise in the number of staff.
Figure 3.14 first summarises the proportions of businesses reporting these hard impacts at the point around six months after their diagnostic. As the chart shows businesses that were allocated a voucher were more likely than those in the control group to report an increase in turnover (and this difference was even more marked if businesses that had used their voucher were compared to the control group). There were no significant differences between the voucher and control groups in terms of increases in staff numbers or number of sites. For export sales, businesses in the control group were actually more likely to report an increase then those in the voucher group.
47
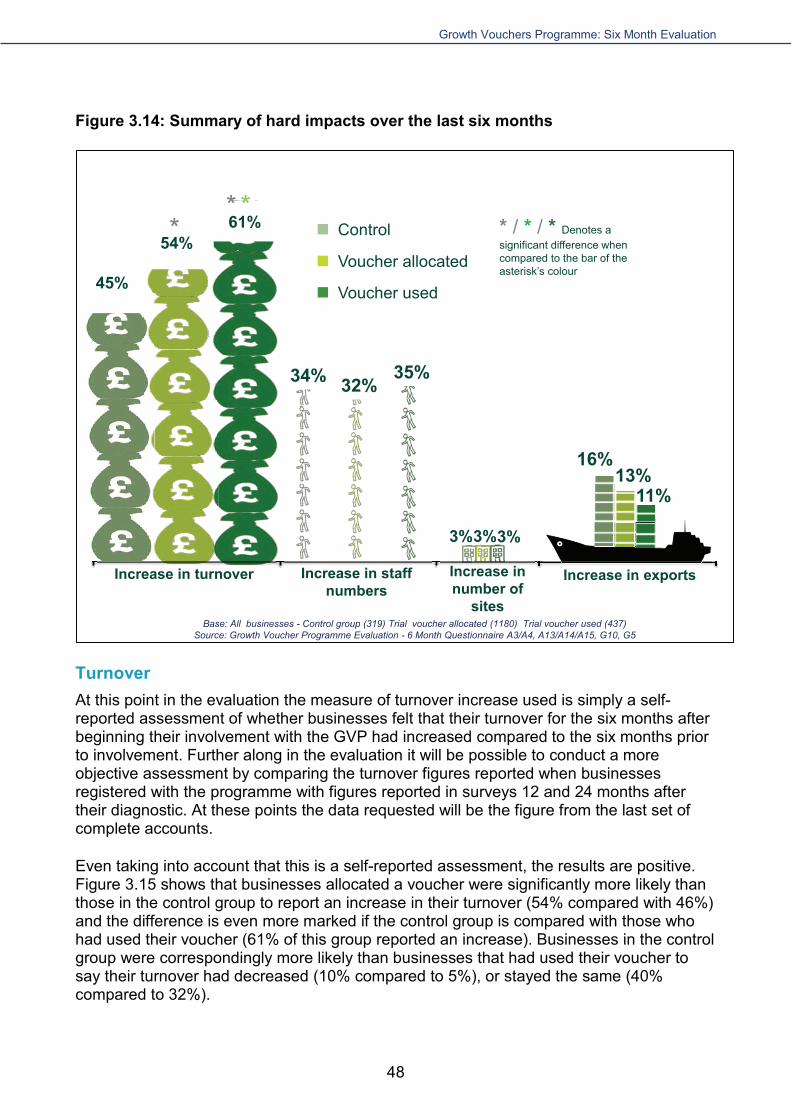

Growth Vouchers Programme: Six Month Evaluation
Figure 3.15: Percentage of businesses reporting their turnover increased, decreased and stayed the same over the previous six months
10% 7% 5%
40%36% 32%
46% 54% 61%
Control Voucher Allocated Voucher Used
Increased
Stayed the same
Decreased
Don't know
Base: All businesses - Control group (319) Trial voucher allocated (1180) Trial voucher used (437)Source: Growth Voucher Programme Evaluation - 6 Month Questionnaire G10
Figure 3.16 shows the estimates given by businesses of the percentage by which their turnover had increased. This shows that, among those reporting an increase, the levels of increase were actually higher among the control group than among those allocated a voucher. While a third of businesses in the control group stated that the increase they had observed was 30% of the turnover or more (33%), this proportion was only 24% of the turnover among those who had used their voucher.
49

Growth Vouchers Programme: Six Month Evaluation
Figure 3.16: Proportion of businesses reporting how much their turnover has increased in the last six months, compared to the same period last year
21%27% 32%
22%
23%23%
20%14%
14%9% 6%5%11% 9%9%
14% 15% 10%
Control Voucher Allocated Voucher Used
More than 50%Over 40%. Up to 50%Over 30%, up to 40%Over 20%, up to 30%Over 10%, up to 20%Up to 10%RefusedDon't know
Base: All businesses where turnover increased in last 6 months compared to same period last yearSource: Growth Voucher Programme Evaluation - 6 Month Questionnaire G11a
(148) (638) (266)
Whether turnover change is attributable to the Growth Vouchers Programme
Businesses that reported an increase in their turnover were asked to estimate how much of this increase was due to their participation in the Growth Vouchers Programme.
Around a third (33%) of businesses that reported an increase in turnover over the past six months attributed at least some of this increase to their participation in the programme. Figure 3.17 below is based on all businesses (not just those reporting an increase in turnover). The diagram shows any changes in turnover reported in the last six months, and where businesses reported an increase, the extent to which the Growth Vouchers Programme was felt by businesses to have contributed to this increase.
Of those businesses reporting an increase, nearly two thirds (62%) said that none of their increase was due to their participation in the Growth Vouchers Programme. However as mentioned before, research has shown that intervention and advice generally takes longer than six months, and sometimes years, to result in any change in turnover. This means that future follow-up surveys with these businesses, at 12 and 24 months following their diagnostic, may well show more growth vouchers influence on turnover change.
50

Growth Vouchers Programme: Six Month Evaluation
Those in the voucher allocated group were significantly more likely than those in the control group to report that the Growth Vouchers Programme had contributed to their increase in turnover. Those that had actually used their voucher were significantly more likely than both other groups to report the programme had an influence on their turnover increase.
Figure 3.17: Self-reported turnover change (if any) over the last six months, compared with the same period last year, and the proportion of businesses reporting that an increase was partly attributable to the Growth Vouchers Programme
3%3%
40%44%
10% 8%
13%
29%39%
7%
4%
Increase due to GVP: over 10% of turnover changeIncrease due to GVP: up to 10% of turnover changeIncrease NOT due to GVPNo change to turnoverDecrease in turnoverDon't know / refused
17%
26%
11%
34%
5% 7%
Base: All businesses - Control group (319) Trial voucher allocated (1180) Trial voucher used (437)Source: Growth Voucher Programme Evaluation - 6 Month Questionnaire G12
Control Voucher allocated Voucher used
Any increase due to GVP 6%
GVP 21% GVP 43%Any increase due to GVP 21%
Any increase due to GVP 43%
Changes in numbers of staff, numbers of sites and sales to overseas customers There was no evidence at this stage that being allocated a Growth Voucher was associated with an increase in any of the other ‘concrete’ measures of growth considered in the survey; businesses in the voucher group were no more likely than those in the control group to have increased their headcount, opened sites, or increased their sales to overseas customers. These measures are explored in a little more detail below.
Comparing the numbers of staff employed prior to involvement with the Growth Vouchers Programme with the numbers employed at the time of interview showed that 60% of businesses overall had seen no change in staff numbers while 32% had seen a growth in
51

Growth Vouchers Programme: Six Month Evaluation
the size of the workforce. Small proportions of businesses overall (7%) had seen a reduction in staff numbers. There were no notable differences between the various groups. Where businesses increased their staff numbers, these increases are generally small with businesses most likely to say they have increased by one or two staff members.
Generally it might be expected that the differences between the control and voucher group in terms of the likelihood to report an increase in turnover might have also manifested itself in a difference in the likelihood to have taken on more staff. There are a number of reasons that might explain why this was not the case:
• Some businesses might have had the capacity to cope with more work with theirexisting resources (at least in the short term);
• Businesses can be cautious about taking on new staff and they might want to be surethat increased revenue figures are sustained before recruiting:
• There is a lag between identifying a need for a new member of staff and finding asuitable candidate;
• And finally a number of these businesses work to a model that makes use offreelancers or associates (52% of all participant businesses used free-lance, agencyor contract workers to deliver their key product or service23) and it might therefore bemore natural to increase the use of these staff before taking on more permanentemployees. This would obviously still have a positive impact on the economy.
In terms of changes in the physical footprint of businesses, nearly all businesses within each of the three groups reported that the number of sites they had was the same at the point of interview as it was prior to joining the Growth Vouchers Programme. Within the control group, the group allocated a voucher and the group who had actually used their voucher, around three per cent of businesses had opened sites in the last six months, and around one per cent had closed sites.
Another hard measure of growth explored was sales to overseas customers (Figure 3.18). Around a third (38% overall) of businesses across all three groups stated that they had overseas customers. These businesses were asked whether their sales to overseas customers had increased or decreased over the last six months, since they applied to the Growth Vouchers Programme.
Figure 3.18: Proportion of businesses whose overseas sales have increased, decreased, or stayed the same
23 See Annex D for data tables on use of contract workers.
52
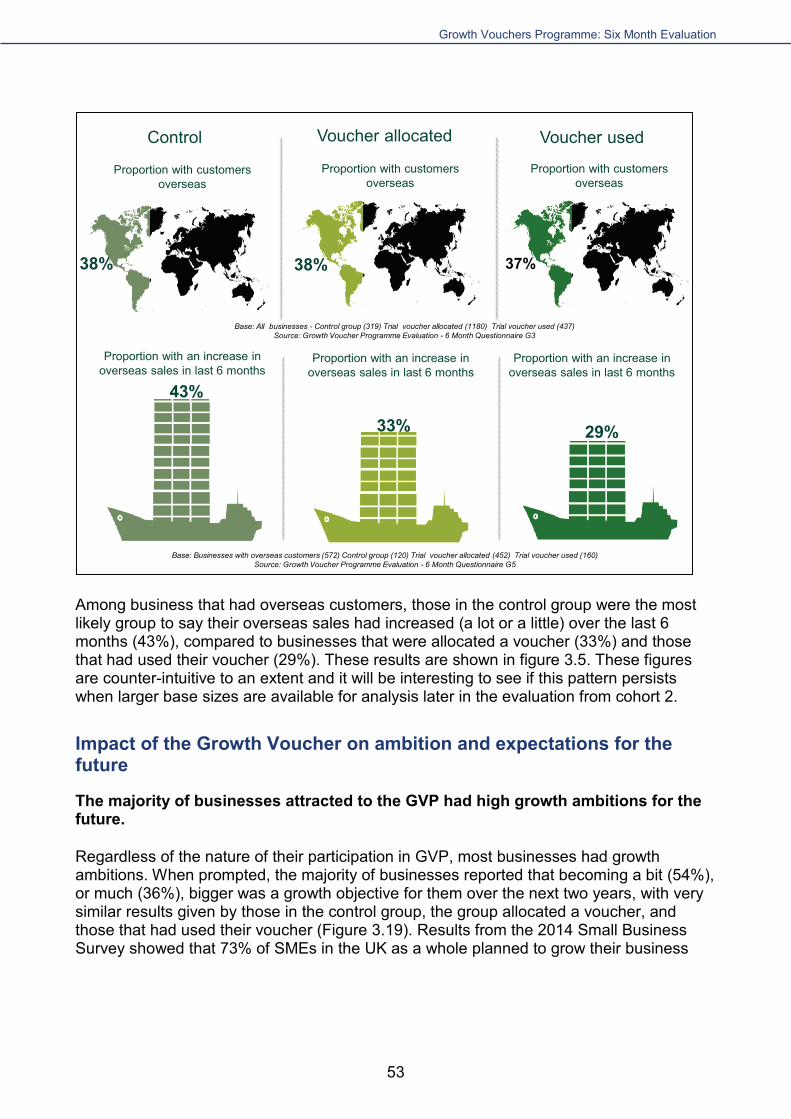


Growth Vouchers Programme: Six Month Evaluation
• Reduce costs• Raise external finance (e.g. loans, equity finance)
At an overall level, the majority of businesses reported that it was ‘likely’ (either very or fairly) that they would increase, develop or improve in many of these areas, particularly increasing turnover (95% overall), increasing sales and marketing activities (87%) and increase the skills of the workforce (86%).
As Figure 3.20 shows, the only area where businesses that used a Growth Voucher differed significantly from those in the control group was in relation to turnover but this difference was very small (93% of those in the control group thought it was likely that they would increase their turnover, compared to 96% amongst those that were allocated, or used, their voucher).
Figure 3.20: Proportion of businesses saying it is ‘likely’ that they will develop or increase in the following areas over the coming two years
93%88% 86%
81% 82%75% 77%
71%
45%
31%
96%87% 87%
83% 82% 79% 78%
64%
46%
34%
96%
86% 86%81% 84%
77% 78%
68%
50%
28%
Increasebusinessturnover
Increasesalesand
marketingservices
Increase theskillsof the
workforce
Purchasenew
equipment /technology /
software
Develop andintroduce
newproducts /services
Employmorestaff
Improve theleadershipcapability
withinyour
business
Increase orimprove
e-commerce
Reducecosts
Raiseexternalfinance
(e.g. loans,equity
finance)
Control All allocated voucher Used voucher
Base: All businesses that feel it is likely they will develop or improve in at least one area over the coming 2 years - Control group (318) Trial voucher allocated (1176) Trial voucher used (436)
Source: Growth Voucher Programme Evaluation - 6 Month Questionnaire A8
There is very little difference between control and voucher businesses in terms of what they are hoping to achieve in the coming two years. It will be interesting to see whether the likelihood of these ambitions to translate into action differs depending on involvement with the programme.
55

Growth Vouchers Programme: Six Month Evaluation
Chapter 4: Evidence of the impact of the diagnostic route
Chapter Summary
• Among businesses allocated a voucher, those who had a personal diagnostic were more likely than those who had an online diagnostic to go on to use it (25% compared to 19% on the online route). This is a benefit of the personal diagnostic and is likely to be a result of the follow-up activity undertaken by delivery partners reminding businesses to use their vouchers – this is not the case for the online route. Businesses that followed the personal diagnostic route were also more likely to be satisfied with the programme as a whole (see Chapter 5).
• There was no clear indication of the impact of the diagnostic route on the likelihood of businesses to report improvements in their capabilities. There were also no significant differences by diagnostic route when looking at general business planning actions taken since involvement with the programme.
• At this stage, there is no evidence that diagnostic route had any effect on the likelihood of businesses to report hard impacts from the programme ie on turnover, export or headcount. However, as we discuss below there was not an expectation that these kinds of impact would be evident at this stage – it will be important to monitor these at future stages.
• There was also no clear pattern in reported growth ambitions by diagnostic route although, within the control group, those who had a telephone diagnostic were less likely to report some ambitions than those who had an online or face-to-face diagnostic.
• There is some evidence to suggest that the personal diagnostic has a role in challenging businesses’ existing ideas about their advice needs to a greater extent than the online route.
• There is considerable variation in the duration of the personal diagnostic (see Chapter 5), and in many cases it was less than 15 minutes. There is a correlation between length of the personal diagnostic and a number of immediate outcomes.
56

Growth Vouchers Programme: Six Month Evaluation
This chapter explores the second key research question of the programme - do businesses assessed online perform better or worse than those assessed face-to-face?
To recap on both of these processes:
The online diagnostic is a process that the business works through by themselves; it involves answering an online questionnaire about how capable they think their business is in certain areas. At the end, based on their answers, the diagnostic suggests which type of advice (which advice ‘theme’) would best benefit the business.
The personal diagnostic is a process whereby the business talks through its needs and capabilities with an expert advisor, either face to face, over the telephone or via Skype. Following this discussion the advisor suggests which advice theme they think would be most useful for the business.
Regardless of diagnostic route, the business can choose whether to agree with the suggested advice theme, or choose a different one.
Whether businesses perform better following one route or the other is assessed through comparing findings between the diagnostic routes. This is primarily between online and personal diagnostics, but within the latter, the differences between face-to-face assessments and those conducted over the telephone. We also consider the differences between the control and voucher groups within each diagnostic route.
The logic model (shown in Annex E) sets out the expected stages of impact. In summary, these are:
• Immediate outcomes (in the first year), which include improved business confidenceand ability, as well as increased use of business advice;
• Interim outcomes (in the second and third years), which include all of the former butalso ‘harder’ business impacts such as turnover and staff numbers; and
• Ultimate outcomes (after the third year), which include all of the above but alsosustainable business growth and wider positive economic impacts.
As for the previous chapter, this chapter will consider whether there have been any ‘harder’ impacts at this stage. However, we will start by looking at some of the immediate outcomes that might represent ‘steps on the journey’ to further impact, development and growth. The indicators explored were:
• Impact on businesses’ ‘choice’ of advice theme, and (among those allocated avoucher) whether they have used it.
• Changes in businesses perceptions of their own capabilities.
• Evidence of general business planning.
• Evidence of business ambition.
57

Growth Vouchers Programme: Six Month Evaluation
• We will also explore attitudes towards the diagnostics.
As mentioned in the previous chapter, the time period that had elapsed between the diagnostic and the interview was relatively short (at only six months) and this is likely to limit the extent of any hard impacts that can be observed. Businesses will be interviewed again at points around 12 and 24 months after their diagnostic at which points there might be more evidence of hard impact.
Throughout this chapter, the key comparisons drawn are between the control groups and the voucher groups (and, within this, the groups who had used their voucher) within:
• Those allocated to the personal diagnostic route (and within this between those who received their diagnostic face-to-face and those who received it by telephone/Skype); and
• Those allocated to the online diagnostic route.
Immediate outcomes - impact of diagnostic route on theme selected and voucher use
Businesses allocated a voucher are slightly more likely to have used it if they followed the personal route than the online route.
The first area in which it is interesting to look at the impact of the diagnostic route is in terms of the advice theme that businesses selected. With the online diagnostic route, businesses answered a series of questions and then a theme was suggested to them based on an algorithm. They could then choose to accept this recommendation or select another theme. With the personal diagnostic route, the Delivery partner adviser and the business agreed an appropriate theme together, the intention being to assess whether this had a positive impact in terms of the advice sought and the outcomes achieved over a simple online allocation.
Given these different approaches, it is perhaps surprising that the distribution of businesses by theme is very similar (as shown by Figure 4.1).
The diagnostic has had no impact, at an aggregate level, on the mix of advice themes across the two routes. This may be because the businesses applying for the Growth Vouchers Programme have similar priorities and preferences (most probably because they were randomly allocated to these routes), and that their route through the programme did not change these. The scale of these differences means that it is possible to be confident that any differences observed between the online and personal diagnostic businesses are unlikely to be a function of differences in the distribution of theme on the two routes. We have previously explored, through rounds of qualitative research with businesses and delivery partners, whether businesses were challenged in their choice of advice theme – we found little evidence that this was the case.
There is a significant difference in the proportion of businesses allocated a voucher who go on to use it between the online diagnostic group and the personal diagnostic group (19% compared to 25%). This is a benefit of the personal route and is likely to be a result
58
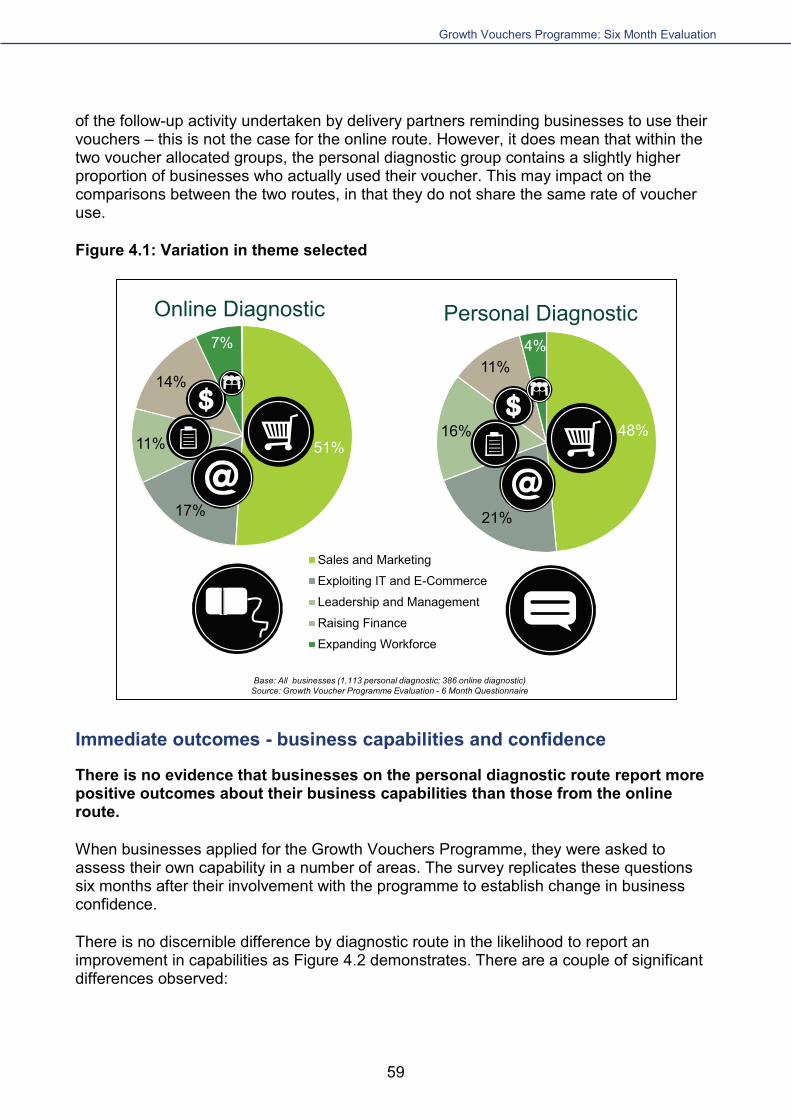

Growth Vouchers Programme: Six Month Evaluation
• For people management, businesses in the control group who had a telephone diagnostic were less likely to report an improvement in capability at the six month stage than their counterparts from the face-to-face and online routes (29% vs 37% and 41%)
• For introducing new products and services, businesses allocated a voucher through the online route were more likely than those allocated a voucher through the personal route to report an improvement in capability (58% vs 51%).
There is also no clear difference between diagnostic routes when businesses were asked whether their involvement in the Growth Vouchers Programme has improved the skills levels within their business.
Figure 4.2: Perceived capability change by diagnostic route
54%51%
49%
54%52% 53%
41%
27%
50% 50%54%
52% 52%49%
34%32%
58%55% 56%
50% 51% 51%
36% 35%
51% 52% 51% 52% 51%
57%
44%
32%
Introducing newproducts and
services
Using IT External finance Entering newdomestic markets
Recruiting newemployees
Developing andimplementingbusiness planand strategy
Peoplemanagement
Entering newforeign markets
Online - control (105)Personal - control (213)Online - voucher allocated (281)Personal - voucher allocated (895)
Base: All businessesSource: Growth Voucher Programme Evaluation - 6 Month Questionnaire A9/Management Information
Immediate outcomes – evidence of actions taken
There is no evidence that businesses receiving a personal diagnostic are more likely to implement measures that could lead to growth than those from the online route.
Figure 4.3 shows the proportions of businesses that put certain measures in place since their involvement with the Growth Vouchers Programme. The figure shows overall that
60

Growth Vouchers Programme: Six Month Evaluation
businesses that received a personal diagnostic are no more likely to have put measures in place than businesses that received an online diagnostic. Furthermore, within the personal diagnostic route, there were no differences between those who received a face-to-face diagnostic and those where the diagnostic took place over the telephone or via Skype.
Figure 4.3: Action taken since involvement with the Growth Vouchers Programme by diagnostic route and voucher group
18%
11%
15%
11%9%
7%8%
7%
2%
14%13%
11%
8%6%
8%6%
7%
3%
20%
17%
14% 14%
8% 8% 8% 8%
4%
23%
18%16%
15%
10%9% 9% 8%
5%
Marketingplan
Marketingbudget
Businessplan
Cashflowforecast
Trainingbudget
Regularfinancialreports
Workforcedevelopment
strategy
Corporatewebsite
Recruitmentbudget
Control - online (105) Control - personal (214) Voucher - online (281) Voucher - personal (899)
Base: All businessesSource: Growth Voucher Programme Evaluation - 6 Month Questionnaire A9/Management Information
The frequency with which participants referred to their business plan was consistent when comparing the online and personal diagnostic routes. However, within the personal diagnostic group, those who had used their voucher and undertaken their diagnostic face-to-face were more likely than those who had a telephone diagnostic to consult their plan very frequently ie at least once a month (50% compared with 34% of their equivalents who conducted their diagnostic over the telephone or Skype).
There were no differences by diagnostic route in the frequency with which businesses updated their business plan.
61
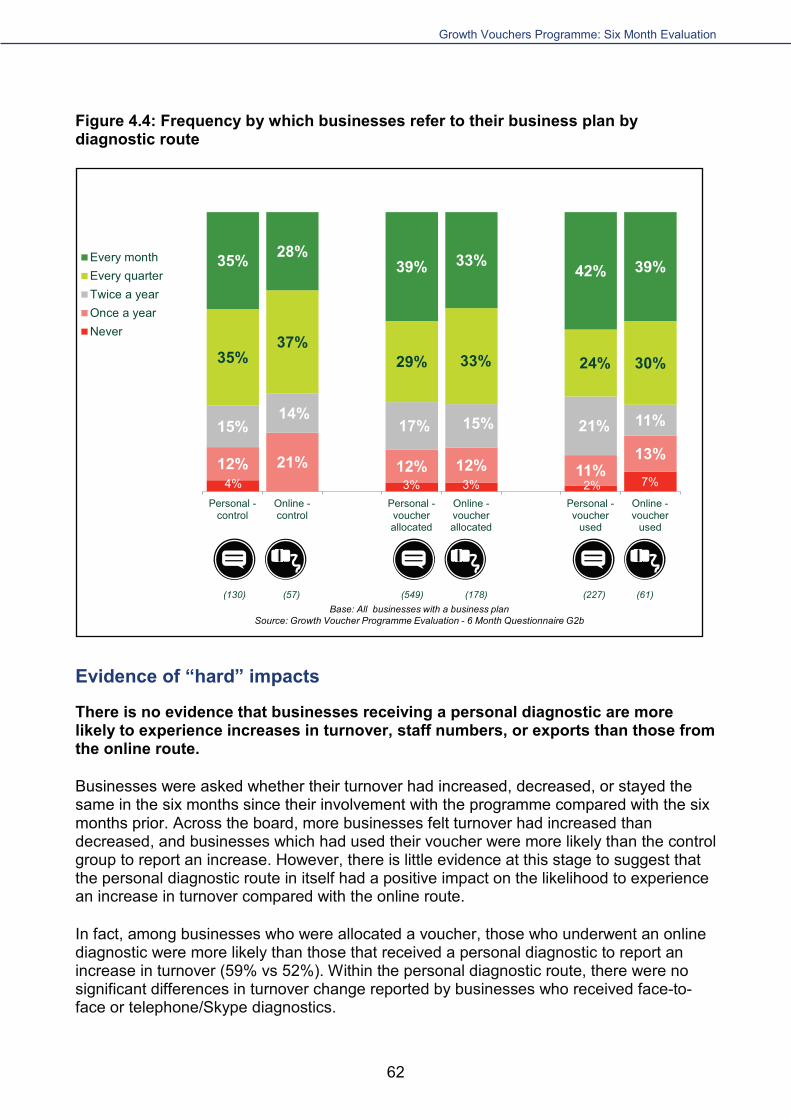

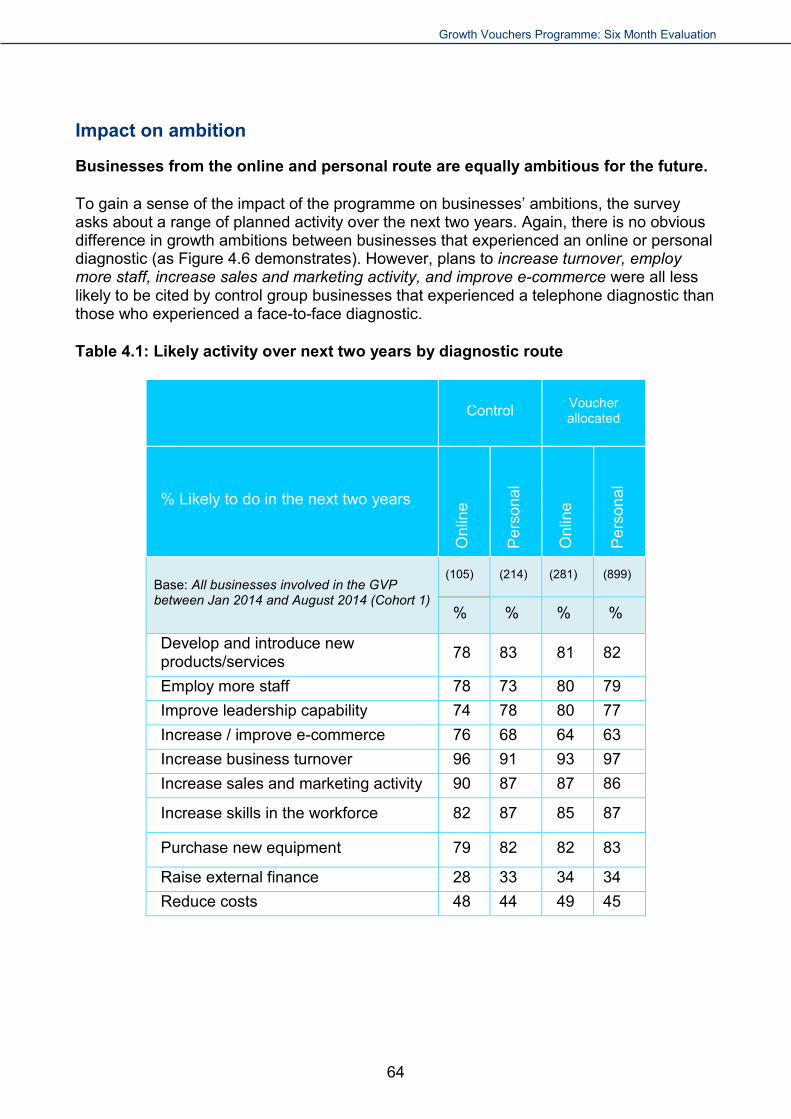
Growth Vouchers Programme: Six Month Evaluation
Impact on ambition
Businesses from the online and personal route are equally ambitious for the future.
To gain a sense of the impact of the programme on businesses’ ambitions, the survey asks about a range of planned activity over the next two years. Again, there is no obvious difference in growth ambitions between businesses that experienced an online or personal diagnostic (as Figure 4.6 demonstrates). However, plans to increase turnover, employ more staff, increase sales and marketing activity, and improve e-commerce were all less likely to be cited by control group businesses that experienced a telephone diagnostic than those who experienced a face-to-face diagnostic.
Table 4.1: Likely activity over next two years by diagnostic route
Control Voucher allocated
% Likely to do in the next two years
Onl
ine
Per
sona
l
Onl
ine
Per
sona
l
Base: All businesses involved in the GVP between Jan 2014 and August 2014 (Cohort 1)
(105) (214) (281) (899)
% % % %
Develop and introduce new products/services 78 83 81 82
Employ more staff 78 73 80 79 Improve leadership capability 74 78 80 77 Increase / improve e-commerce 76 68 64 63 Increase business turnover 96 91 93 97 Increase sales and marketing activity 90 87 87 86
Increase skills in the workforce 82 87 85 87
Purchase new equipment 79 82 82 83
Raise external finance 28 33 34 34 Reduce costs 48 44 49 45
64

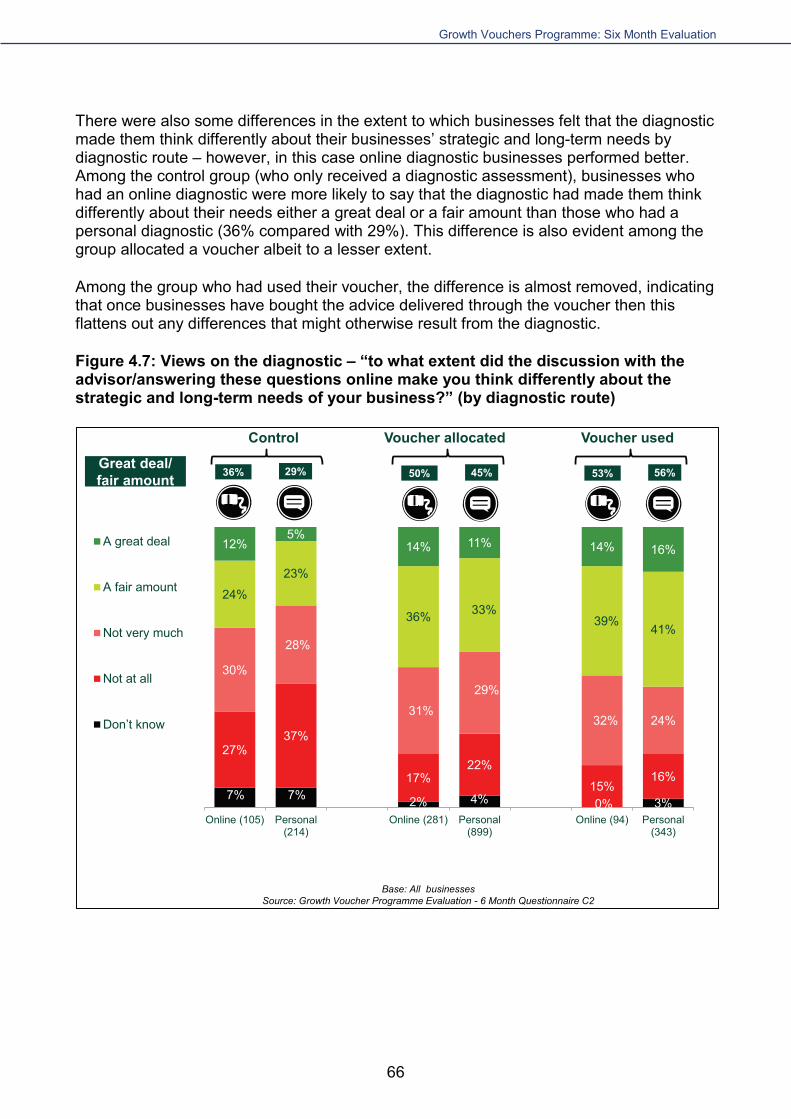
Growth Vouchers Programme: Six Month Evaluation
Impact of personal diagnostic length
Personal diagnostics varied between less than 15 minutes to over two hours.
As we found in the qualitative interviews, for businesses following the personal diagnostic route the length of the session varied considerably - between less than 15 minutes to over two hours. Fourteen per cent experienced sessions that lasted for less than fifteen minutes, and a further 27% lasting between 15 and 30 minutes. This may explain the lack of difference in impact between the personal and online routes.
There was quite a lot of variation in the reported duration of personal diagnostic sessions carried out by delivery partners. Businesses that had a personal diagnostic with either Cavendish Consortium London or Cavendish Consortium South East were most likely to have a lengthy personal diagnostics (34% and 33% of businesses respectively experienced diagnostics that lasted between forty-five minutes and one hour). In contrast, personal diagnostic sessions delivered by the West Midlands Chamber of Commerce were most likely to be the shortest, with 25% of businesses reporting a session that lasted for less than fifteen minutes.
The length of the personal diagnostics appears to have an impact on the likelihood of businesses to go on to use their vouchers. Where diagnostics were longer than 30 minutes, around 30% of businesses used their voucher, which is significantly higher than the 17% of businesses that used their voucher if their diagnostic was shorter than 15.
The length of personal diagnostics also appears to have an impact on the satisfaction with the programme, as illustrated by Figure 4.8. Similarly, several business performance measures are positively associated with the length of diagnostic assessment.
Figure 4.8 shows a positive relationship between personal diagnostic duration and:
• Overall satisfaction with the programme
• Overall satisfaction with the Delivery partner services
• Stated likelihood of businesses to seek out strategic advice in the future
• Improvement of skills within the business
There was no notable correlation between the personal diagnostic length and increases in turnover or increases in the number of employees.
67
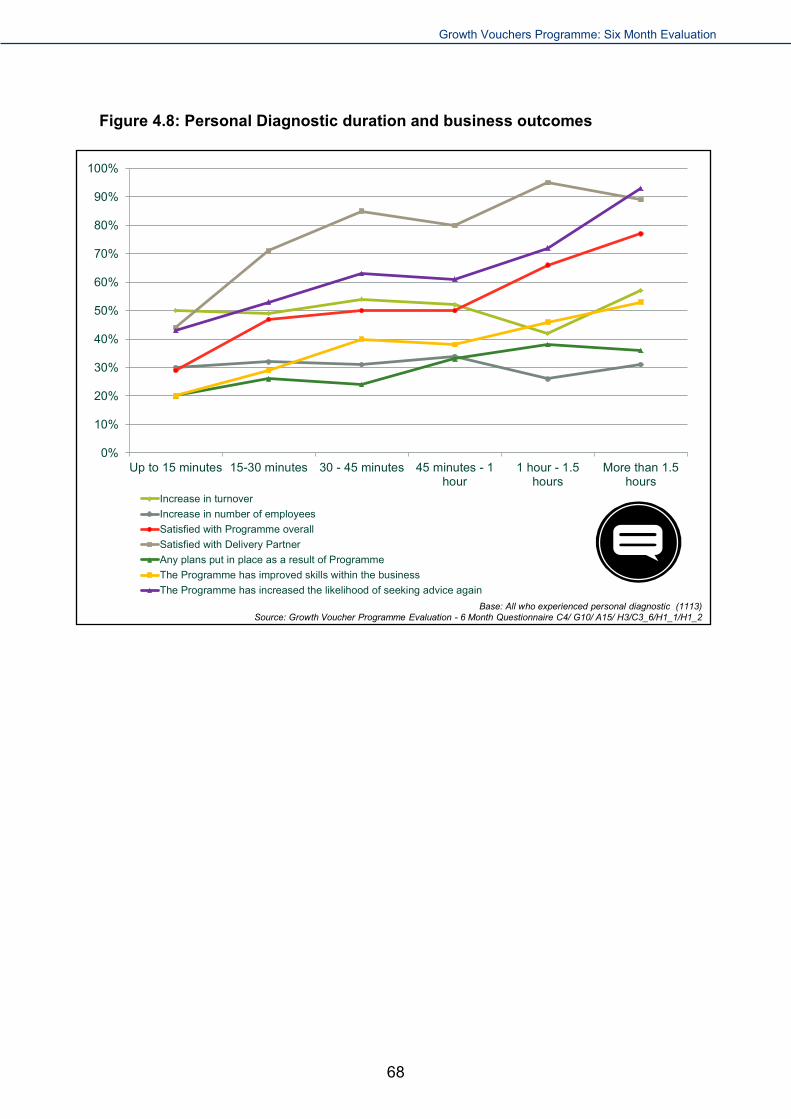
Growth Vouchers Programme: Six Month Evaluation
Figure 4.8: Personal Diagnostic duration and business outcomes
0%
10%
20%
30%
40%
50%
60%
70%
80%
90%
100%
Up to 15 minutes 15-30 minutes 30 - 45 minutes 45 minutes - 1hour
1 hour - 1.5hours
More than 1.5hours
Increase in turnoverIncrease in number of employeesSatisfied with Programme overallSatisfied with Delivery PartnerAny plans put in place as a result of ProgrammeThe Programme has improved skills within the businessThe Programme has increased the likelihood of seeking advice again
Base: All who experienced personal diagnostic (1113)Source: Growth Voucher Programme Evaluation - 6 Month Questionnaire C4/ G10/ A15/ H3/C3_6/H1_1/H1_2
68

Growth Vouchers Programme: Six Month Evaluation
Chapter 5: Experience of the Programme
Chapter Summary
• Overall, the majority of businesses involved in the Growth Vouchers Programme were satisfied with the experience (46% satisfied vs 30% dissatisfied). Overall satisfaction was significantly influenced by whether a business received a voucher or not (57% vs 18%) and the diagnostic route used (52% face-to-face compared with 40% online).
• Satisfaction with personal diagnostic sessions was high (74%). The aspect of the personal diagnostic that businesses were most satisfied with was the adviser’s knowledge of the programme (84%).
• Satisfaction with the action plan, produced after the personal diagnostic, was not very high (38% of businesses were satisfied). However, it is worth noting that many businesses did not seem to remember receiving an action plan (even though all businesses received one as part of the Growth Vouchers Programme).
• The most common duration of personal diagnostics was between fifteen and thirty minutes (27% of businesses), however – as we have also found in previous, qualitative evaluations – there is a degree of variation in personal diagnostic length with some businesses (16%) experiencing a session that lasted in excess of one hour.
• Just over half of businesses allocated a voucher (57%) had accessed the Online Marketplace. A quarter of control group businesses (23%) had also done so. There was some evidence of dissatisfaction with the quality of advice suppliers available and the cost of advice (21% and 15% dissatisfied respectively); although in both cases businesses were more likely to be satisfied than dissatisfied.
• Of the businesses that have used a Growth Voucher, the vast majority received the advice they purchased through multiple channels: face-to-face discussions (95%), written reports or plans (88%), emails (83%) or telephone conversations (78%). Almost all (98%) of these businesses found the advice session to be useful.
• The three most common reasons given for not using a Growth Voucher were an inability to find a suitable supplier (40%), insufficient funds to meet the match funding requirement of the programme (36%) and a lack of time to locate an appropriate supplier (32%).
• Two-fifths of businesses (41%) had recommended the Growth Vouchers Programme to other businesses.
69

Growth Vouchers Programme: Six Month Evaluation
This chapter explores businesses’ experience of taking part in the Growth Vouchers Programme. It explores overall satisfaction with their experience, as well as satisfaction with particular elements including the diagnostic, the Online Marketplace, and receiving advice using their voucher.
Overall satisfaction with the Programme More than two-fifths (46%) of all businesses that engaged with the Growth Voucher Programme were satisfied with their experience, with almost one-quarter (23%) very satisfied. Just under one-third (30%) of businesses were dissatisfied with their experience. The remaining one-quarter (23%) of participating businesses were neither satisfied nor dissatisfied.
The extent to which businesses were satisfied overall was influenced by several factors associated the programme’s design and implementation. In particular, satisfaction varied between businesses that were allocated a Growth Voucher and those that were not. Satisfaction rate differed by delivery partners and the diagnostics assessment route.
As illustrated in Figure 5.1, businesses within the control group were significantly more dissatisfied with the programme than those that received a Growth Voucher (53% compared with 21%). However, despite a comparatively high level of dissatisfaction among those not allocated a voucher, there were some businesses in the control group (18%) that were nonetheless satisfied with the scheme.
70


Growth Vouchers Programme: Six Month Evaluation
participating businesses (84%) content with the amount representatives knew about the programme. Furthermore, almost three-quarters of businesses that experienced a personal diagnostic were satisfied with the adviser’s comprehension of their business and their ability to identify the business’s needs to stimulate growth (72% and 71% respectively).
The two elements of the personal diagnostic which businesses were least satisfied with were the handling of follow-up enquiries by delivery partners and their respective advisors (67%) and the quality of the action plan produced for the business (64%).
Not all businesses experienced these aspects. Around a third of businesses that had a personal diagnostic had no further contact with their Delivery partner after the initial session (66% had follow-up contact).25
Figure 5.3: Satisfaction with each aspect of the personal diagnostic
9% 5% 3% 3% 2% 3%
4% 7%3% 2% 4% 2%
6% 7%5% 4% 5% 3%
18% 13%17% 19% 15%
8%
37%
30%43% 42%
37%
31%
26%37%
28% 30%38%
53%
Quality of theaction planproduced
Handling offollow up
enquiries by youradvisor or their
organisation
Identification ofbusiness needs
Adviser’s understanding of
your business
Overallsatisfaction withyour advisor andtheir organisation
Adviser’s knowledge of the Growth Vouchers
programme
Very satisfied
Fairly satisfied
Neither satisfied nordissatisfied
Fairly dissatisfied
Very dissatisfied
Don't know
Base: All who have experienced a personal diagnostic, omitting not applicable responses Source: Growth Voucher Programme Evaluation - 6 Month Questionnaire C3_1-6
84%67% 74%72%64% 71%All satisfied
(1072)(749) (1074)(686) (1069) (1074)
25 Responses of ‘not applicable’ have been omitted from the base for the purposes of comparison.
73
Growth Vouchers Programme: Six Month Evaluation
A key point to note is that where businesses in the voucher group had follow-up contact with their Delivery partner, these businesses were more likely to use their Growth Voucher to book an advice session than those who had no follow-up contact (78% compared with 66%). Previous qualitative elements of the evaluation have shown that delivery partners have undertaken considerable follow-up activity with businesses in an effort to boost the “conversion” rate of participants. However, it is difficult to establish cause and effect here – it is possible that the businesses that contact their Delivery partner after the personal diagnostic session are more inclined to use the Growth Voucher in the first place.
For each aspect of the personal diagnostic session, those allocated a Growth Voucher were more likely to be satisfied with the diagnostic process than businesses in the control group. However, both were most satisfied with the advisers knowledge of the Growth Vouchers Programme (86% of those in the voucher group compared with 78% of those in the control group) and least satisfied with the quality of the action plan produced by the Delivery partner (68% of those in the voucher group compared with 45% of those in the control group)26. A breakdown of satisfaction with each element of the personal diagnostic for businesses in the control group and businesses in the voucher group is provided in Table 5.1 of the appendices.
There were no significant differences in the degree to which businesses were satisfied with each aspect of the personal diagnostic by delivery partner. Among the partners, the West Midlands Chamber of Commerce was with the lowest level of satisfaction across all aspects of the personal diagnostics they completed. Meanwhile, the Cavendish Consortium South East was most commonly the delivery partner with the highest level of satisfaction across all elements of the personal diagnostic, with this delivery partner having the highest level of satisfaction in four of the six elements of the personal diagnostic. Table 5.2 (see appendices) provides a breakdown of satisfaction for each aspect of the personal diagnostic by Delivery partner.
Delivery partners have some autonomy in the manner in which they carry out the diagnostic and interact with businesses during and after the session. This autonomy is exhibited in the different lengths and styles of the diagnostics and the proportions that have follow-up enquiries dealt with by their respective delivery partners.
However, there were some commonalities across the diagnostics carried out by delivery partners, despite the variation in approach. All delivery partners would generally begin a diagnostic session with some information on the Growth Vouchers Programme, ie that vouchers are allocated randomly, and the vouchers are to be used for strategic advice on a particular theme. The Delivery partner would then find out about the business, what the owner felt their particular strengths and weaknesses were, and what advice would be most useful. There would also generally be some information given about the Online Marketplace and how best to use it. Sometimes this discussion was open-ended and sometimes it was more structured, like a questionnaire.
In the design of the programme, it was envisaged that an action plan would be provided by delivery partners to businesses during the personal diagnostic session in order to guide
26 Not applicable responses have been removed from the base for the purpose of comparison.
74

Growth Vouchers Programme: Six Month Evaluation
them on the next steps required to find the advice they needed. In terms of diagnostic type, sessions conducted face-to-face were more likely than those conducted over the telephone or skype to involve an action plan being delivered (46% compared with 35%). These results echo those reported in the Phase 1 qualitative report which also highlighted that face-to-face diagnostics are most likely to involve an action plan being provided to businesses.
Length of Personal Diagnostic
Personal diagnostics varied considerably in length.
Businesses reported personal diagnostics of varying length, with some businesses experiencing sessions that lasted for less than fifteen minutes and others experiencing sessions in excess of two hours (Figure 5.4). Although duration of personal diagnostic varied, the majority of businesses (58%) estimated that their personal diagnostic took less than forty-five minutes to complete. Just under one-fifth of businesses (19%) were unable to recollect the length of their personal diagnostic27.The most common duration estimated by businesses was between fifteen and thirty minutes (27%).
27 These 216 don’t know response have been omitted from the base for the purposes of comparison.
75

Growth Vouchers Programme: Six Month Evaluation
Figure 5.4: Duration of personal diagnostic session
14%
27%
16%
26%
9%7%Up to 15 minutes
15 - 30 minutes
30 - 45 minutes
45 minutes - 1 hour
1 hour - 1.5 hours
More than 1.5 hours
Base: All who experienced personal diagnostic with 216 don’t knows omitted (897)Source: Growth Voucher Programme Evaluation - 6 Month Questionnaire C4
The length of personal diagnostic was related not only to satisfaction but also a number of immediate business performance measures, including attitudes to seeking future business advice. As such, shorter diagnostics may have had a negative impact on the programme outcomes – see Chapter 4 for further discussion of this.
Use of the Online Marketplace
Satisfaction level with various aspects of the Online Marketplace varied.
The Online Marketplace28 is a website managed by Enterprise Nation in order to facilitate the identification of accredited suppliers of business advice. This platform is not only available to businesses that have been allocated a Growth Voucher, but also to businesses within the control group and businesses that have not participated in the Growth Vouchers Programme at all. The Online Marketplace provides a list of Advice
28 www.marketplace.enterprisenation.com www.marketplace.enterprisenation.com
76
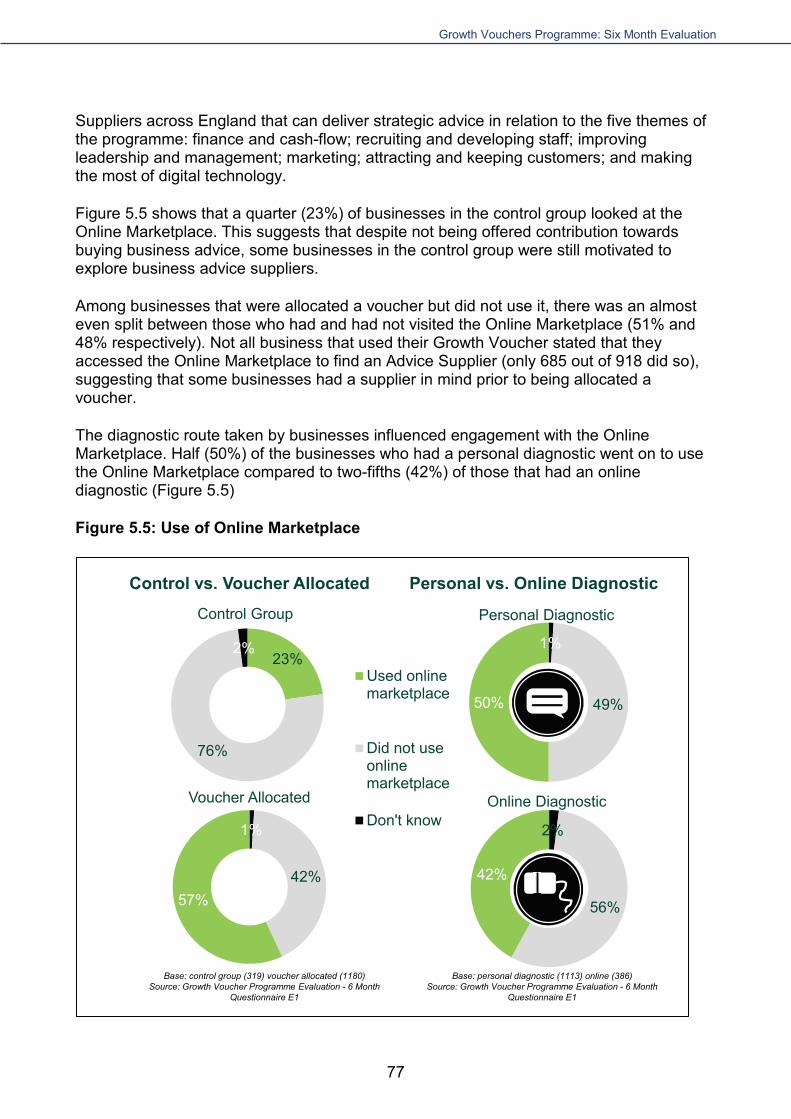

Growth Vouchers Programme: Six Month Evaluation
As illustrated in Figure 5.6, the search function was the only aspect of the Online Marketplace that the majority of businesses that engaged with the website were satisfied with (58%). For all other elements satisfaction was relatively low. Only half (50%) were satisfied with the quality of the Advice Suppliers hosted on the website and just two-fifths were satisfied with the reviews left by other users and the cost of the advice offered by Advice Suppliers (42% and 41% respectively). These findings indicate that the Online Marketplace is proficient with regard to its primary objective of enabling businesses to find Advice Suppliers, but is limited in its functionality by the content.
Some findings also suggest that the Online Marketplace was not always effective in tackling some of the market failures in the business advice sector; for example, businesses’ scepticism over the perceived quality of advice being provided, and the cost of advice being too high. For example, only half of the businesses that used the Online Marketplace were satisfied with the quality of the Advice Suppliers advertised on the website, and less than half were satisfied with the cost of the advice.
The degree of satisfaction with each element of the Online Marketplace differed between businesses in the control group and those that were allocated a Growth Voucher. In particular, businesses in the voucher group were significantly more likely than businesses in the control group to be satisfied with the search function and the cost of advice on the Online Marketplace (60% and 43% of the voucher group vs 44% and 30% of the control group). A full breakdown of the level of satisfaction with each element of the Online Marketplace is provided in Table 5.3 of the appendices.
Figure 5.6: Satisfaction with aspects of the Online Marketplace
20%5% 6% 9%
5%
5% 8% 6%
10%
10% 12% 9%
23%
16% 23%17%
32%
29% 36%38%
9% 13% 15% 20%
The cost of advice The usefulness ofreviews left by others
The quality of advicesuppliers
The search function
Very satisfied
Fairly satisfied
Neither satisfied notdissatisfied
Fairly dissatisfied
Very dissatisfied
Don't know
Base: All who have looked at the online Marketplace: total (752)Source: Growth Voucher Programme Evaluation - 6 Month Questionnaire E2_1-E2_4
41% 42%All satisfied 50% 58%
78

Growth Vouchers Programme: Six Month Evaluation
Nature of advice purchased
Satisfaction with the advice received was very high. Most advice sessions took place face-to-face.
Upon the allocation of a Growth Voucher businesses in the voucher group were free to use it to subsidise advice from any affiliated Advice Supplier of their choice on the Online Marketplace as long as the advice was related to the advice theme chosen.
Of the businesses that were allocated a Growth Voucher and went on to use it to buy advice, the vast majority (95%) received advice in a face-to-face discussion (Figure 5.7). Emails and telephone calls also formed a prominent channel through which advice was administered, with around four in five businesses that used a Growth Voucher experiencing this form of contact with their Advice Supplier (83% and 78% respectively). In addition to verbal discussions and written communication with Advice Suppliers, the majority of businesses (88%) also received a report or plan.
Figure 5.7: The implementation of advice and its usefulness
Base: Businesses who have used the voucher and booked advice session (241)Source: Growth Voucher Programme Evaluation - 6 Month Questionnaire F9
95%88% 83% 78%
21%
Face to face discussionswith the advisorThe advisor providing areport or planAdvice via email from theadvisorAdvice via telephone fromthe advisor2Anything else
18% 80%1%
Fairly useful
Very useful
Not veryuseful
Base: Voucher taken up (241)Source: Growth Voucher Programme Evaluation - 6 Month Questionnaire F7
The vast majority (98%) of businesses that used their Growth Voucher to claim for an advice session considered the advice purchased to be useful, with four in five businesses (80%) referring to the advice session as very useful and only 1% describing it as not very useful.
79

Growth Vouchers Programme: Six Month Evaluation
Reasons for not using the Growth Voucher
A lack of suitable advice suppliers on the Marketplace was a key barrier to using the voucher. Around a fifth of those who did not use the voucher say that this was because they were able to obtain advice for free from other sources.
Some of those who had not used their voucher by the time of the six month interview stated that they still intended to (which indicates some misunderstanding of the operation of the programme since all vouchers had expired by this point). Of the businesses that were allocated a Growth Voucher, 45% stated that they did not plan to use it. As shown in Figure 5.8, there are a range of reasons why businesses had decided not to use the voucher.
Figure 5.8: All reasons and primary reasons for not using the Growth Voucher
23%
20%
11%9%
8%
4%
3%3%
19%
Insufficient funds to meetthe match fundingrequirementUnable to find a suitablesupplier on the marketplace
Don't have time to find asupplier before the voucherexpiry dateMy business won't benefitfrom / doesn't need this kindof adviceNot the right time for thebusiness to receive advice
Don't have the time to getbusiness advice - it is tootime consumingFound the advice for freeelsewhere
Don't know
Another reason
Base: All businesses who do not plan to use voucher (470) Source: Growth Voucher Programme Evaluation - 6 Month Questionnaire F4
Primary reason for not using Growth Voucher
All reasons for not using Growth Voucher
38%
1%
17%
20%
22%
20%
32%
40%
36%
Base: All businesses who do not plan to use voucher (496) Source: Growth Voucher Programme Evaluation - 6 Month
Questionnaire F3
More than two-thirds (36%) of businesses that did not intend to use the Growth Voucher cited insufficient funds to meet the match funding requirement of the programme as a reason for not using the Growth Voucher, with almost one-quarter (23%) claiming this to be their primary reason. Two-fifths (40%) of businesses stated that an inability to find a suitable Advice Supplier on the Online Marketplace was one of the reasons why they did not use the Growth Voucher to purchase advice, forming the principal reason for non-use for 20% of businesses. The fact that over two-fifths (43%) of the businesses allocated a Growth Voucher have been deterred from using it provides further evidence that, for some
80

Growth Vouchers Programme: Six Month Evaluation
businesses at least, the programme has not corrected the market failures in the business advice market.
Other research on the business advice market flags similar common market failures, particularly: that businesses cannot find suitable assistance (or believe that suitable assistance doesn’t exist) and doubts about the benefits and value of assistance, including that assistance is too expensive and they do not have time to find it29.
The qualitative research conducted at the formative stage suggested that not all businesses registered the fact that the Growth Vouchers required match funding when they applied to the programme and hence decided not to use their voucher as soon as they became aware this was the case. This might well account for some of those who stated that they did not use their voucher because of a lack of funds.
Time constraints were a commonly mentioned reason for not using Growth Vouchers. Around one-third (32%) of businesses stated that they were unable to use the Growth Voucher because they did not have time to find an appropriate Advice Supplier before the expiry date, while one-fifth (20%) of businesses reported that they did not have sufficient time to buy business advice. Respectively these explanations form the primary reason for non-use of the Growth Voucher for 11% and 4% of businesses.
Some businesses that had chosen not to use the Growth Voucher had done so on the grounds of not believing the advice would benefit their business or because they felt it was not the right time for their business to start receiving strategic advice. These explanations were given as a reason for not claiming advice with a Growth Voucher by one-fifth of businesses (22% and 20% respectively) and were cited as the primary reason for not doing so for around one-tenth of businesses allocated a Growth Voucher (9% and 8% respectively).
Around one-fifth (19%) of businesses decided not to use the Growth Voucher because they were able to obtain advice for free from other sources. However, this was only the main reason for not taking up the Growth Voucher for 3% of businesses.
A further 38% of businesses were partly influenced not to use their Growth Voucher to get strategic advice because of reasons other than those mentioned in Figure 5.9. These reasons included:
• The use of personal contacts and other business advice services to receive advice (11%);
• Concerns about the costs involved in the programme (4%);
• The decision to conduct independent research to find the required information instead of seeking advice from an Advice Supplier affiliated with the programme (3%);
29 https://www.gov.uk/government/uploads/system/uploads/attachment_data/file/32250/11-1288-research-barriers-to-use-of-business-support.pdf
81
Growth Vouchers Programme: Six Month Evaluation
• The use of networking instead of seeking advice from an Advice Supplier affiliated with the programme (2%);
• The fact that the Growth Voucher allocated to the business has expired (2%);
• Disenfranchisement with the programme due to a lack of support and communication (2%);
• And the direct use of companies (ie marketing, advertising and IT companies) without using advice beforehand (1%).
Although the reasons listed above were identified by two-fifths of businesses that were allocated a Growth Voucher and decided not to use it, combined, these reasons only accounted for the primary reason for not booking an advice session with the Growth Voucher for 19% of businesses that were allocated one.
Findings also highlighted some evidence that businesses allocated a Growth Voucher did not end up using it due to misunderstanding how the scheme functions. A small proportion of businesses had not used their Growth Voucher because they did not think they were allocated one, while a further 1% of businesses had not used their Growth Voucher because they did not know how to.
Recommending the programme
Around two in five businesses recommended the programme. On average, businesses did so to four other businesses.
Two-fifths (41%) of participating businesses had recommended the Growth Vouchers Programme to at least one other business. Some of these businesses (1%) had made recommendations to 100 or more other businesses, however the average number of recommendations made per business was four.
Figure 5.9 illustrates that businesses in the voucher group were significantly more likely to suggest the scheme to other businesses than those in the control group (48% compared with 22%). Moreover, businesses within the voucher group that recommended the programme to other businesses made on average five recommendations, which the control group recommended the programme to two other businesses. Although fewer recommendations were made by businesses in the control group, the fact that any recommendations were made by businesses that were not allocated a voucher signifies that they still attached value to the programme.
Businesses that had a personal diagnostic with Winning Pitch were the most likely to recommend the programme to others, in fact those involved with Winning Pitch were the only group in which businesses making recommendations were the majority (55%). Businesses that had not made recommendations were most likely to have had a diagnostic with Cavendish Consortium East of England (64%), closely followed by those that had an online diagnostic with BE Group (63%).
82

Growth Vouchers Programme: Six Month Evaluation
Figure 5.9: The number of recommendations made to other businesses by participating businesses
77%
51%64%
57%45%
63% 61%54%
7%
7%
6%7%
13%
5% 9%
7%
6%
19%
14%16%
14%
16% 14%
16%
4%9%
9%10%
9%
4% 8%
8%
1%4%
2%4%
6%2%
3%
4%
3% 4%1% 3%
6%4%
2%2%
5% 6% 4% 4% 7% 6% 3%9%
Control VoucherAllocated
CavendishEast
WM CoC WinningPitch
BE Group CavendishLondon
CavendishSouth East
More than 10
10
6 to 9
4 to 5
2 to 3
1
No one
Base: All businessesSource: Growth Voucher Programme Evaluation - 6 Month Questionnaire H2
Mean number of recommendations 4 75 332 2 7
(319) (1,180) (233) (211)(331) (386) (171)(167)
83
Growth Vouchers Programme: Six Month Evaluation
Chapter 6: Evidence of deadweight and substitution
Chapter summary
• In terms of what would happen in the absence of the Growth Vouchers Programme, 62% of businesses say that they would have sought less or cheaper advice, with a further 22% saying they would not have sought advice. The deadweight in the programme could be considered to be the 15% of voucher users who stated that, in the absence of the GVP, they would have purchased the same advice at a commercial rate.
• 29 per cent of businesses were actively exploring the advice market and 41% were considering getting advice though had not yet looked into it. Some of these businesses are likely to represent substitution – it is likely that some would have found alternative schemes if the GVP had not been available to them.
• Although the majority of applicants were registered on the market place and offered their service the Growth Vouchers Programme did seem to attract a substantial number of businesses who had not previously thought about obtaining advice. Overall, 24% businesses had not previously considered getting advice.
This chapter looks at the evidence of substitution and deadweight in the Growth Vouchers Programme by looking at the degree to which businesses were already active in the advice market when they applied to the GVP. It explores what advice the businesses that used their voucher would have secured if the Growth Vouchers Programme had not been available to them.
Advice seeking behaviour of businesses before applying to Growth Vouchers Programme
It is likely that some businesses would have found alternative schemes if the Growth Vouchers Programme had not been available.
Businesses were asked about the extent to which they were already in the market for business advice at the point at which they got involved with the programme (Figure 6.1)
The majority of businesses (70%) said that they were considering advice at the time of their application, including 29% who were actively exploring getting advice and 41% who had considered getting advice but had not actively explored their options. It seems reasonable to assume that some of those who were already considering advice would have found alternative schemes if the GVP had not been available.
Although the majority of those who participated in the Growth Vouchers Programme were already considering advice, the programme also attracted some businesses who had not
84

Growth Vouchers Programme: Six Month Evaluation
previously thought about obtaining advice. Overall, one in four businesses (24%) had not previously considered getting advice, including 17% which were not even specifically interested in it but who applied out of curiosity.
Although the programme is not aimed at those who are currently paying for any strategic business advice (and the initial online eligibility check is set up to reject applications from businesses which are), one in twenty (5%) businesses interviewed were receiving some sort of advice at the time of their application, either from family/friends (3%) or from another programme (2%). It cannot be determined by the survey whether this was, in fact, strategic advice or not.
There was little variation in advice-seeking behaviour between those who ended up receiving the voucher and those which did not (as shown in Figure 6.1). This provides further evidence that the RCT was effective in creating two comparable groups, and that initial advice-seeking behaviour is not a factor in any differences in findings between the two groups.
However, it is clear that businesses’ advice-seeking position on entry to the programme had some bearing on the likelihood to use their voucher when they were allocated one. Those businesses who entered the programme speculatively (they were not specifically interested in advice but applied out of curiosity) were less likely to use their voucher when they were allocated one so that this group accounted for only nine per cent of those who had used their voucher (compared to 18% of those allocated one).
85
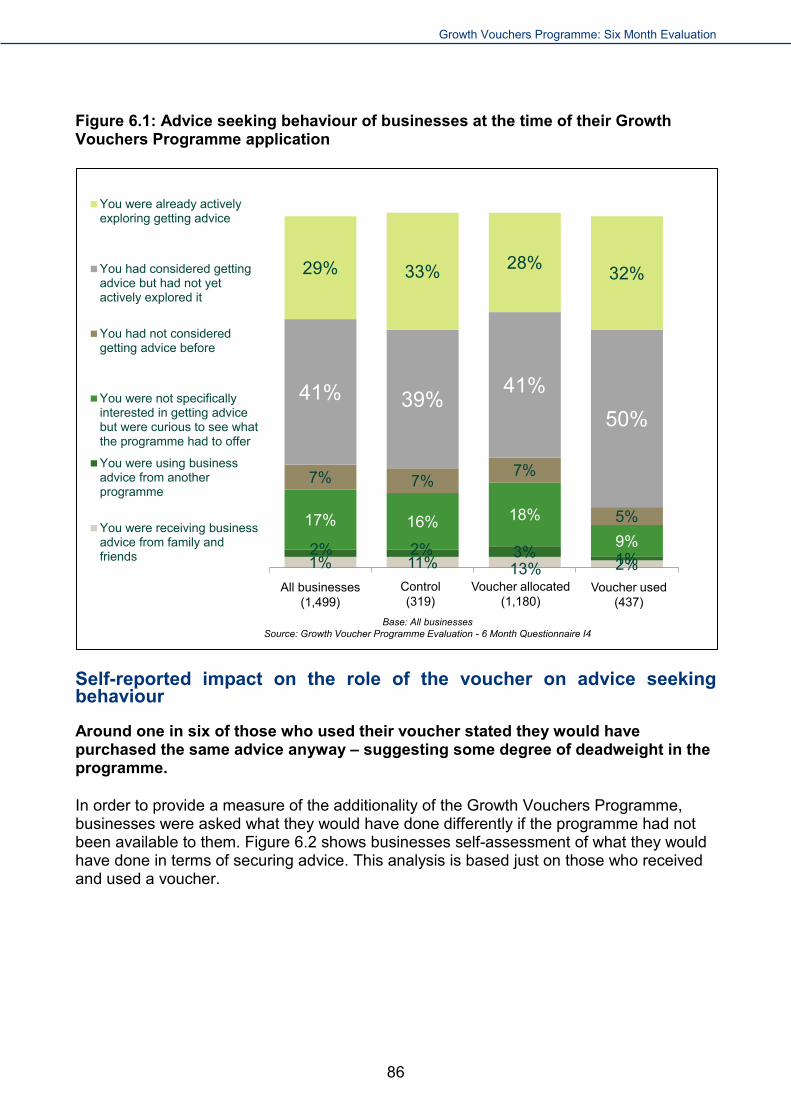
Growth Vouchers Programme: Six Month Evaluation
Figure 6.1: Advice seeking behaviour of businesses at the time of their Growth Vouchers Programme application
1% 11% 13% 2%2% 2% 3% 1%
17% 16% 18%9%
7% 7% 7%
5%
41% 39% 41%50%
29% 33% 28% 32%
You were already activelyexploring getting advice
You had considered gettingadvice but had not yetactively explored it
You had not consideredgetting advice before
You were not specificallyinterested in getting advicebut were curious to see whatthe programme had to offer
You were using businessadvice from anotherprogramme
You were receiving businessadvice from family andfriends
Base: All businesses Source: Growth Voucher Programme Evaluation - 6 Month Questionnaire I4
Control (319)
Voucher allocated (1,180)
Voucher used (437)
All businesses(1,499)
Self-reported impact on the role of the voucher on advice seeking behaviour
Around one in six of those who used their voucher stated they would have purchased the same advice anyway – suggesting some degree of deadweight in the programme.
In order to provide a measure of the additionality of the Growth Vouchers Programme, businesses were asked what they would have done differently if the programme had not been available to them. Figure 6.2 shows businesses self-assessment of what they would have done in terms of securing advice. This analysis is based just on those who received and used a voucher.
86


Growth Vouchers Programme: Six Month Evaluation
Chapter 7: Conclusions At this early stage the following conclusions can be drawn about the operation of the Growth Vouchers Programme.
In terms of the operation of the RCT:
• The Programme has worked as intended and has been effective in creating control and voucher groups that are similar in observable characteristics for comparisons to be made with confidence. This is true at the overall level, within diagnostic route and within each of the five advice themes. This provides confidence that the programme will ultimately be able to answer the research questions that it set out to.
• The only concern is that around a third of businesses in the voucher group have used their voucher to obtain advice. This means that comparisons between the control group and the group of businesses allocated a voucher are likely to under-represent the impact of using advice. Although the proportion who used their voucher is low, the average amount spent on advice is more than expected which means the programme will be able to test most of its research questions.
In terms of Impact:
• There is some evidence of impact on turnover, with businesses allocated a voucher more likely than businesses without vouchers to report that they have seen an increase in turnover compared with the six months prior to the programme. There were no discernible effects on other hard measures of impact such as opening more sites, number of employees or export sales.
• That said, there is evidence of an increased likelihood among voucher businesses (compared to control businesses) to have put in place actions that could be considered to be intermediate steps on the path to achieving business growth. These include both general business planning measures and theme-specific actions.
• There were no discernible impacts of the receipt of a voucher in terms of businesses’ perceptions of their own capabilities. Similarly, businesses in the voucher group and the control group demonstrated similar growth ambitions.
• There is some evidence of impact in increased appetite for seeking future advice. Businesses who received a voucher are more likely to consider seeking advice in the future and paying for it.
88

Growth Vouchers Programme: Six Month Evaluation
In terms of the impact of the diagnostic route:
• At this stage in the evaluation there are few obvious differences in impact by diagnostic route.
• Among those who had used their voucher, those who had experienced a personal diagnostic were slightly more likely to have put in place each of the general planning measures explored. This could translate to greater realisation of hard impacts further down the line.
• Satisfaction ratings were slightly higher among those who had experienced a personal diagnostic.
In terms of the overall experience of the programme:
• Satisfaction levels with the programme were generally reasonable (more were satisfied than dissatisfied) although understandably satisfaction was considerably higher among those who received a voucher than among the control group.
• Satisfaction with the personal diagnostic sessions was particularly high. The aspect of the personal diagnostic that businesses were most satisfied with was the adviser’s knowledge of the programme (84%).
• There is some evidence that the Online Marketplace is not functioning optimally in terms of putting businesses in touch with a supplier. To some the process of accessing the website appears to be a barrier with only around three in five voucher businesses actually attempting to use the site. Among those who have used it, only around half were satisfied with aspects such as the quality of suppliers and the cost of advice.
In terms of the businesses attracted to the programme:
• This was intended as a mainstream Programme and the evidence so far shows that participants are reasonably representative of the small business population as a whole. The characteristics of businesses are in line with the business population at large. Participants are equally as likely as small businesses generally to have business plans in place and their ratings of their own capabilities are similar. Perhaps unsurprisingly, Growth Voucher businesses show greater growth ambitions and this will need to be taken into account when considering the extent to which findings from this research exercise can be extrapolated to the business population as a whole.
In terms of deadweight:
• As with most subsidy programmes, there is evidence of a degree of deadweight. A total of 15% of participants state that they would have secured the same advice (and paid a commercial rate for it) in the absence of the Growth Vouchers Programme although some of these would have waited longer before accessing advice.
89

Growth Vouchers Programme: Six Month Evaluation
• The majority of participants were already in the market for advice at the time when they registered for the programme. Some of these inevitably would have enrolled with other advice initiatives if they had not happened across the GVP.
90

Growth Vouchers Programme: Six Month Evaluation
Annex A: Methodology The core evaluation method for the Growth Vouchers Programme is a Randomised Controlled Trial (RCT), in which businesses are allocated randomly to different ‘conditions’ (such as having a business advice assessment online or in person, or receiving a voucher that can be redeemed for external advice, or not receiving one). The evaluation then involves conducting telephone interviews with businesses within each ‘condition’ over a period of around five years in order to explore what impact the Growth Vouchers Programme has had, and whether the impact has been different for businesses allocated to the different conditions.
Sampling and response For the purposes of reporting the quantitative interviewing, businesses have been divided into two Cohorts – 1 and 2 – depending on when they applied for the programme. The cut-off between the two cohorts was set at the end of August 2014, as this was when a number of changes to the programme were introduced. Data covered in this report is therefore based on businesses that underwent their diagnostic between January and August 2014, with interviewing taking place between October 2014 and March 2015.
The sampling approach for the survey was an attempted census. There were 3,896 business records available for interviewing – this was fewer than initially anticipated for the first Cohort as take up of the programme was initially slow, but Cohort 2 will have more records than anticipated as the programme made up its target in the later stages. It was clearly important to achieve a strong response rate to ensure that the findings are robust and that analysis can be conducted between various subgroups. A number of steps were taken to maximise participation, including:
• Each business was called at different times and on different days to maximise the chances that the desired respondent is at the establishment. Each was called at least ten times. The survey was carried out by experienced interviewers, trained to follow up leads and source alternative contact details, such as mobiles where office numbers prove unproductive. Evening and weekend appointments were also offered – these often suit smaller businesses or those who are more mobile. All appointments were scheduled through a Computer Assisted Telephone Interviewing (CATI) system which ensured at least one interviewer was able to pick it up at the arranged time.
• Interviewers were trained and briefed to deliver the best possible introduction to the survey. Although interviewers were given a script to conduct the interview, they were offered some degree of creative licence to adapt the introduction to best suit their ability to engage respondents (with the provision that any adapted introduction should convey the key points required). IFF’s quality control team worked closely with the project team to feedback any problems with engaging respondents. They also listened in closely to interviewers and pick up any instances where a particular interviewer is notably more successful in encouraging respondents to take part. Interviewers
91

Growth Vouchers Programme: Six Month Evaluation
were encouraged to share their techniques so as to ensure these were spread widely across the fieldwork team and overall response rate was increased.
• Sample was allocated to interviewers randomly, meaning they have no choice in who they are able to call. This avoids interviewers cherry picking sample and ensures each record has the opportunity to be called the maximum number of times.
• Where ‘unobtainable’ numbers are encountered (for example dead lines or fax numbers), rather than simply striking off the record as ‘unusable’, IFF sought alternative telephone numbers via automated searches in the first instance, before then turning to manual internet searches where required.
The survey achieved 1,499 completed interviews and the overall population was 3,896, which gives a response rate of 38%. However a number of records were not viable either because the telephone numbers were not valid (129) or because businesses were screened out as ineligible (4). Removing these from the total population gives an ‘available population’ of 3,755, and therefore an ‘adjusted response rate’ of 40%.
A breakdown by key subgroup is shown in Table A.1.
Table A.1: Response rate by key subgroups
Variable
Overall population
N
Available population
N
Survey population
N
Unadjusted response
rate
%
Adjusted response
rate
%
Diagnostic type Phone / Skype 1,298 1,257 501 39 40 Face-to-face 1,488 1,431 612 41 43 Online 1,110 1,067 386 35 36 GV status Claimed 918 897 437 48 49 Control Group 1,054 1,006 319 30 32 Expired 1,923 1,852 743 39 40 Theme Sales & Marketing 1,832 1,771 740 40 42 Raising Finance 495 477 177 36 37 Leadership and Management 558 537 217 39 40 Expanding Workforce 198 185 67 34 36 Exploiting IT and E-Commerce 813 785 298 37 38 TOTAL 3,896 3,755 1,499 38% 40%
92
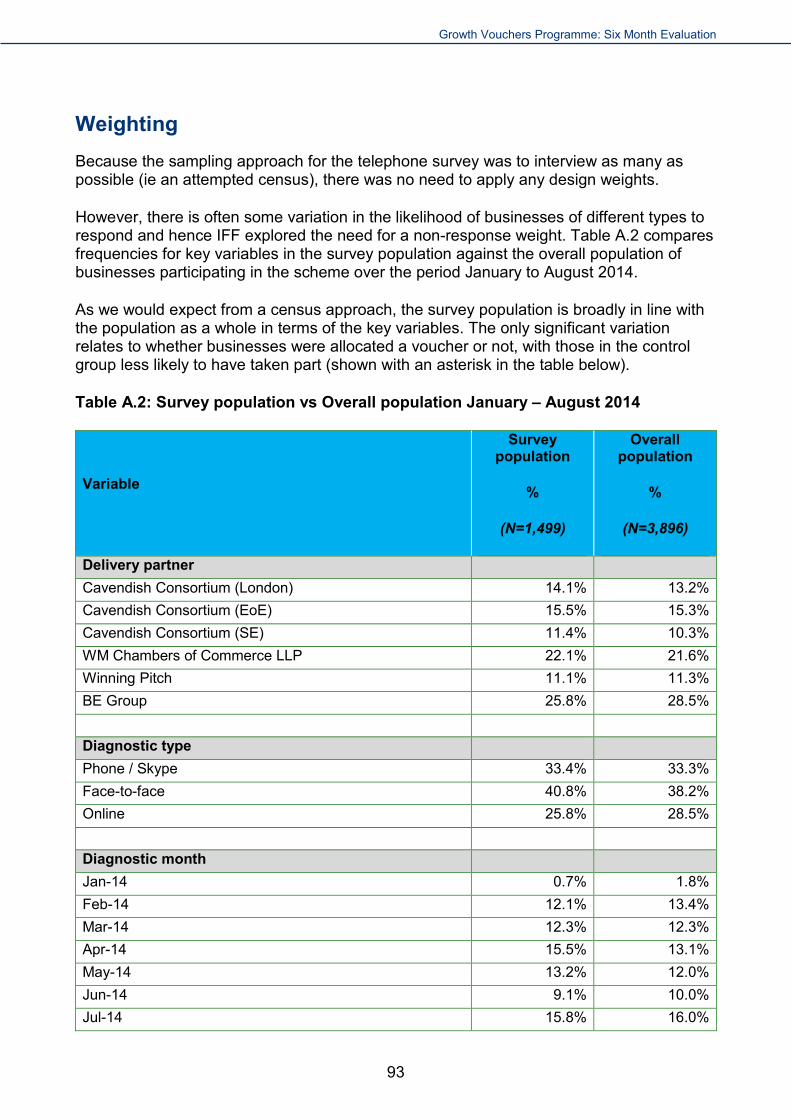
Growth Vouchers Programme: Six Month Evaluation
Weighting Because the sampling approach for the telephone survey was to interview as many as possible (ie an attempted census), there was no need to apply any design weights.
However, there is often some variation in the likelihood of businesses of different types to respond and hence IFF explored the need for a non-response weight. Table A.2 compares frequencies for key variables in the survey population against the overall population of businesses participating in the scheme over the period January to August 2014.
As we would expect from a census approach, the survey population is broadly in line with the population as a whole in terms of the key variables. The only significant variation relates to whether businesses were allocated a voucher or not, with those in the control group less likely to have taken part (shown with an asterisk in the table below).
Table A.2: Survey population vs Overall population January – August 2014
Survey population
Overall population
Variable % %
(N=1,499) (N=3,896)
Delivery partner Cavendish Consortium (London) 14.1% 13.2% Cavendish Consortium (EoE) 15.5% 15.3% Cavendish Consortium (SE) 11.4% 10.3% WM Chambers of Commerce LLP 22.1% 21.6% Winning Pitch 11.1% 11.3% BE Group 25.8% 28.5% Diagnostic type Phone / Skype 33.4% 33.3% Face-to-face 40.8% 38.2% Online 25.8% 28.5% Diagnostic month Jan-14 0.7% 1.8% Feb-14 12.1% 13.4% Mar-14 12.3% 12.3% Apr-14 15.5% 13.1% May-14 13.2% 12.0% Jun-14 9.1% 10.0% Jul-14 15.8% 16.0%
93
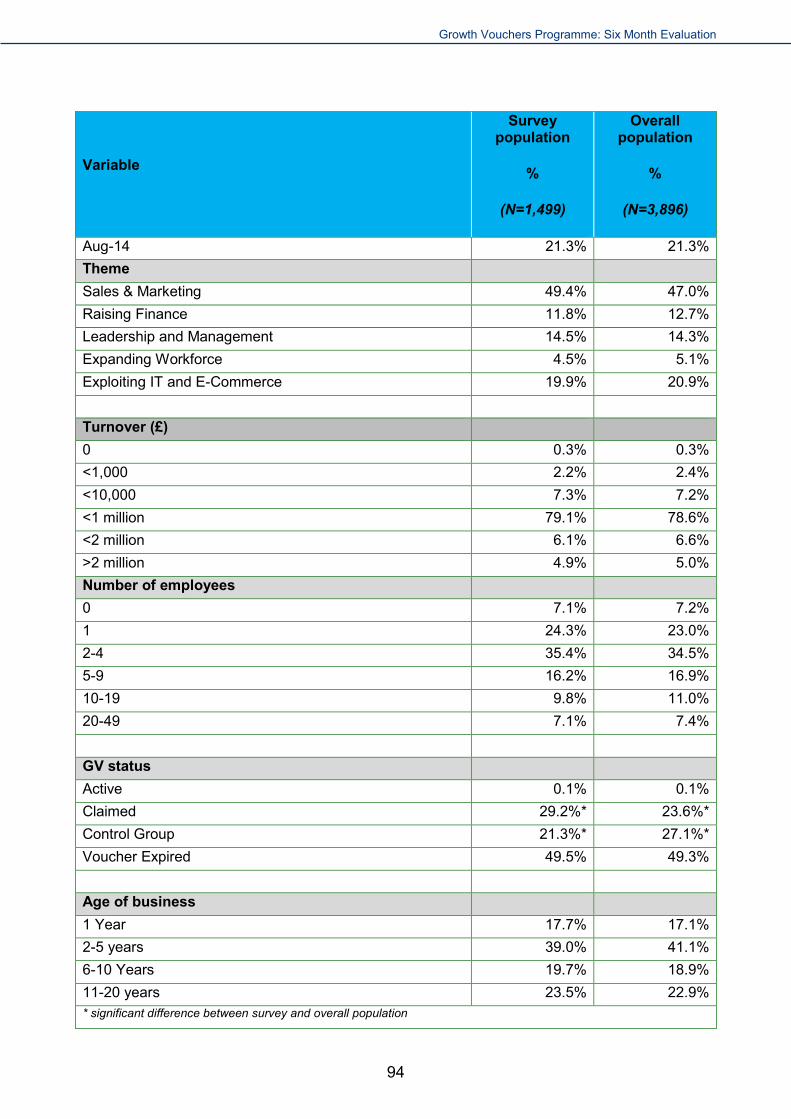
Growth Vouchers Programme: Six Month Evaluation
Survey population
Overall population
Variable % %
(N=1,499) (N=3,896)
Aug-14 21.3% 21.3% Theme Sales & Marketing 49.4% 47.0% Raising Finance 11.8% 12.7% Leadership and Management 14.5% 14.3% Expanding Workforce 4.5% 5.1% Exploiting IT and E-Commerce 19.9% 20.9% Turnover (£) 0 0.3% 0.3% <1,000 2.2% 2.4% <10,000 7.3% 7.2% <1 million 79.1% 78.6% <2 million 6.1% 6.6% >2 million 4.9% 5.0% Number of employees 0 7.1% 7.2% 1 24.3% 23.0% 2-4 35.4% 34.5% 5-9 16.2% 16.9% 10-19 9.8% 11.0% 20-49 7.1% 7.4% GV status Active 0.1% 0.1% Claimed 29.2%* 23.6%* Control Group 21.3%* 27.1%* Voucher Expired 49.5% 49.3% Age of business 1 Year 17.7% 17.1% 2-5 years 39.0% 41.1% 6-10 Years 19.7% 18.9% 11-20 years 23.5% 22.9% * significant difference between survey and overall population
94

Growth Vouchers Programme: Six Month Evaluation
On this basis, we have applied a simple non-response weight to correct for the imbalance in Growth Voucher status. This corrects for the difference in the treatment compared with control proportions between the survey sample and the overall population, but also corrects for the imbalance within the treatment group between those who have claimed their voucher and those whose voucher has expired.
95

Growth Vouchers Programme: Six Month Evaluation
Annex B: Satisfaction ratings – full breakdown
Table 5.1: Satisfaction with aspects of the personal diagnostic by control group and voucher group
Aspects of the personal
diagnostic
Degree of satisfaction
Growth Voucher
Allocation Don’t know
Very dissatisfied
Fairly dissatisfied
Neither satisfied
nor dissatisfied
Fairly satisfied
Very satisfied
Adviser’s understanding
of your business
Control Group (203)
5% 2% 8% 26% 38% 20%
Voucher Allocated
(869) 2% 3% 3% 16% 43% 33%
Identification of business
needs
Control Group (202)
4% 3% 11% 24% 42% 16%
Voucher Allocated
(867) 3% 3% 4% 15% 44% 32%
Quality of the action plan produced, if
any
Control Group (104)
13% 9% 7% 27% 30% 15%
Voucher Allocated
(582) 8% 3% 6% 15% 39% 29%
Adviser’s knowledge of the Growth Vouchers
Programme
Control Group (204)
5% 3% 4% 9% 36% 42%
Voucher Allocated
(870) 3% 2% 2% 7% 30% 56%
Handling of follow-up
enquiries by your advisor
or their organisation
Control Group (115)
8% 9% 14% 20% 31% 18%
Voucher Allocated
(634) 5% 6% 6% 12% 30% 42%
Overall satisfaction with your
advisor and their
organisation
Control Group (204)
3% 6% 8% 25% 34% 24%
Voucher Allocated
(870) 1% 3% 4% 12% 38% 42%
96

Growth Vouchers Programme: Six Month Evaluation
Table 5.2: Satisfaction with aspects of the personal diagnostic by Delivery partner
Aspects of the session with the advisor
Degree of satisfaction
Delivery partner
Don’t know
Very dissatisfied
Fairly dissatisfied
Neither satisfied
nor dissatisfied
Fairly satisfied
Very satisfied
Adviser’s understanding
of your business
CE (226) 2% 6% 7% 15% 33% 38% CL (201) 3% 3% 4% 18% 37% 35%
CSE (170) 0% 3% 1% 16% 42% 37% WP (163) 1% 3% 3% 13% 41% 39%
WM CoC (312) 3% 4% 6% 13% 34% 39%
Identification of business
needs
CE (226) 5% 9% 10% 15% 26% 36% CL (202) 5% 10% 10% 14% 33% 28%
CSE (169) 5% 2% 5% 14% 36% 37% WP (161) 7% 6% 5% 8% 29% 45%
WM CoC (311) 6% 7% 7% 14% 28% 39%
Quality of the action plan produced, if
any
CE (149) 3% 3% 4% 7% 38% 45% CL (134) 4% 5% 2% 6% 31% 52%
CSE (117) 3% 2% 2% 6% 27% 60% WP (108) 2% 1% 1% 6% 34% 56%
WM CoC (178) 4% 1% 3% 12% 28% 53%
Adviser’s knowledge of the Growth Vouchers
Programme
CE (229) 6% 4% 9% 15% 33% 33% CL (201) 7% 6% 8% 20% 37% 22%
CSE (170) 11% 4% 4% 13% 46% 23% WP (161) 10% 4% 7% 18% 36% 26%
WM CoC (313) 11% 3% 2% 21% 36% 27%
Handling of follow-up
enquiries by your advisor
or their organisation
CE (158) 3% 3% 8% 15% 43% 28% CL (138) 2% 2% 5% 20% 39% 32%
CSE (109) 3% 3% 4% 17% 45% 28% WP (113) 3% 3% 5% 12% 46% 32%
WM CoC (231) 4% 3% 5% 21% 43% 24%
Overall satisfaction with your
advisor and their
organisation
CE (227) 3% 4% 7% 20% 38% 28% CL (203) 3% 1% 2% 20% 40% 35%
CSE (170) 2% 3% 3% 13% 48% 30% WP (162) 3% 1% 3% 17% 45% 30%
WM CoC (312) 3% 3% 5% 20% 40% 29%
97
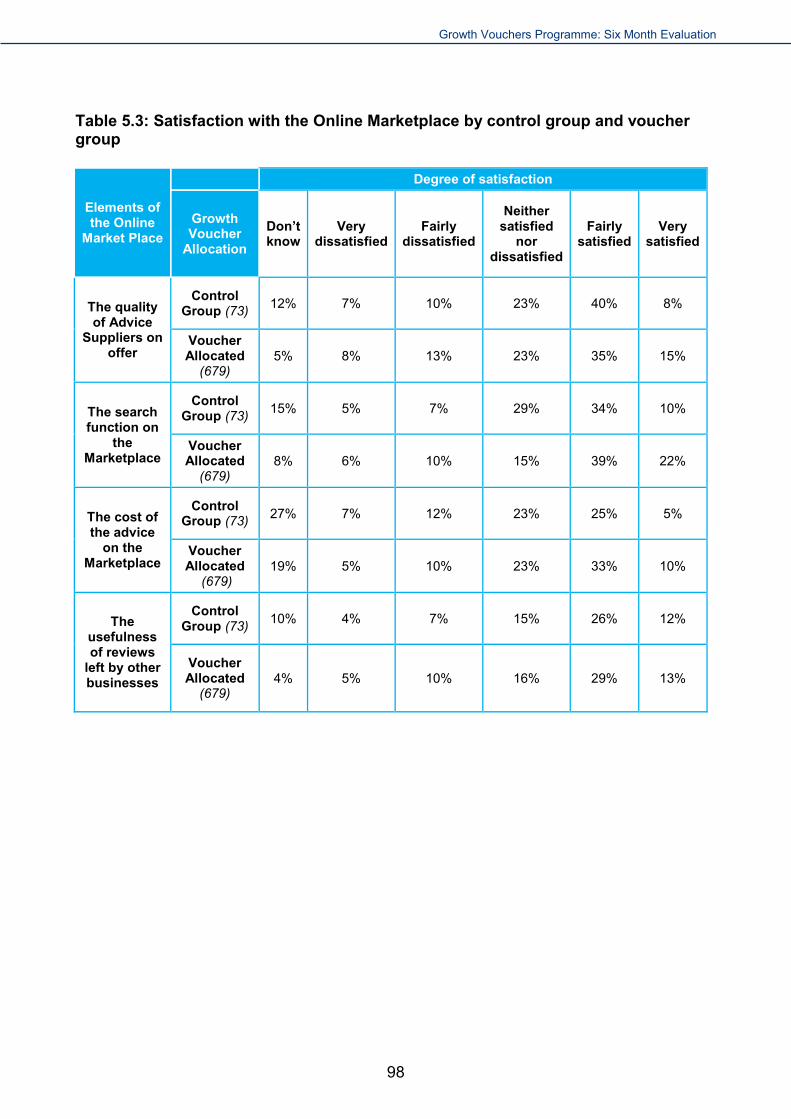
Growth Vouchers Programme: Six Month Evaluation
Table 5.3: Satisfaction with the Online Marketplace by control group and voucher group
Elements of the Online
Market Place
Degree of satisfaction
Growth Voucher
Allocation Don’t know
Very dissatisfied
Fairly dissatisfied
Neither satisfied
nor dissatisfied
Fairly satisfied
Very satisfied
The quality of Advice
Suppliers on offer
Control Group (73) 12% 7% 10% 23% 40% 8%
Voucher Allocated
(679) 5% 8% 13% 23% 35% 15%
The search function on
the Marketplace
Control Group (73) 15% 5% 7% 29% 34% 10%
Voucher Allocated
(679) 8% 6% 10% 15% 39% 22%
The cost of the advice
on the Marketplace
Control Group (73) 27% 7% 12% 23% 25% 5%
Voucher Allocated
(679) 19% 5% 10% 23% 33% 10%
The usefulness of reviews
left by other businesses
Control Group (73) 10% 4% 7% 15% 26% 12%
Voucher Allocated
(679) 4% 5% 10% 16% 29% 13%
98

Growth Vouchers Programme: Six Month Evaluation
Annex C: Minority Ethnic Group and women-led businesses
Diagnostic route
Growth Voucher
Allocation
% with any non-white proprietors, owners or
directors % with any female proprietors,
owners or directors
Personal
Control Group (214) 14% 60%
Voucher Allocated
(899) 13% 61%
Online
Control Group (105) 14% 57%
Voucher Allocated
(281) 21%* 59%
99
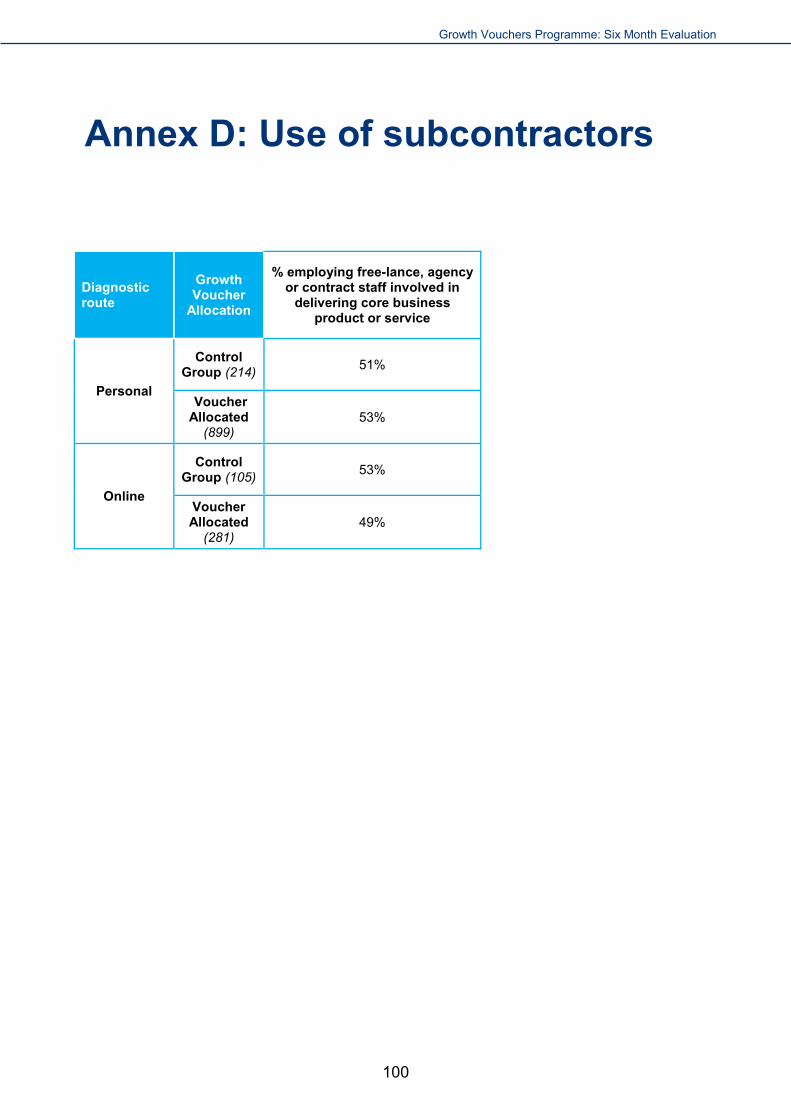
Growth Vouchers Programme: Six Month Evaluation
Annex D: Use of subcontractors
Diagnostic route
Growth Voucher
Allocation
% employing free-lance, agency or contract staff involved in
delivering core business product or service
Personal
Control Group (214) 51%
Voucher Allocated
(899) 53%
Online
Control Group (105) 53%
Voucher Allocated
(281) 49%
100

Growth Vouchers Programme: Six Month Evaluation
Annex E: Growth Vouchers Programme Logic Model
101

© Crown copyright 2016
You may re-use this information (not including logos) free of charge in any format or medium, under the terms of the Open Government Licence. Visit www.nationalarchives.gov.uk/doc/open-government-licence, write to the Information Policy Team, The National Archives, Kew, London TW9 4DU, or email: [email protected].
This publication available from www.gov.uk/bis
Any enquiries regarding this publication should be sent to: Department for Business, Innovation and Skills 1 Victoria Street London SW1H 0ET Tel: 020 7215 5000 If you require this publication in an alternative format, email [email protected], or call 020 7215 5000. BIS/16/30