gtqg3.-iq-q - nasa · gtqg3.-iq-q_ structure-property ... • assistant coach for u 14 boys soccer...
TRANSCRIPT

206_11
gtqG3.-i q-q_
STRUCTURE-PROPERTY RELATIONSHIPS OF BISMALEIMIDES
A Dissertation
Presented to
The Graduate Faculty of The University of Akron
In Partial Fulfillment
Of the Requirements for the Degree
Doctor of Philosophy in Polymer Science
Anita D. Tenteris-Noebe
December, 1997
https://ntrs.nasa.gov/search.jsp?R=19980003929 2018-08-21T15:25:10+00:00Z

2510 I/2 Medina Road
Medina, OH 44256(330) 725-0363
E-Mail: [email protected]
BACKGROUND SUMMARY
Anita Tenteris-Noebe
The University of AkronPolymer Science Dept.Akron, OH 44325-3909(330) 972-6674
Diverse training and experience in polymers, biomaterials, and metals. Highlyanalytical with mature technical and communication skills. Self-sufficient,industrious, reliable, adaptable, works well with others. Seeking a research orproduct development position in a polymer-related company.
EDUCATION
Present
1986
1983
Ph.D. (Polymer Science), December, 1997, The University of Akron, PolymerScience Dept., Akron, OH 44352. Dissertation topic: Structure-PropertyRelationships in Bismaleimides. Advisor: Prof. Frank N. Kelley. Recipient of B. F.Goodrich Fellowship - i year. Mentored Upward Bound student and 2 summerinterns.
MS (Biomedical Engineering), Case Western Reserve University, Cleveland, OH44106. Thesis: Tissue Response Around a Stimulated Electrode. Thesis Advisor:Prof. P.H. Peckham.
BS (Biomedical Engineering, Materials Discipline - with Honors), Case WesternReserve University, Cleveland, OH 44106. Ohio Board of Reagents Scholarship - 4years. Case Western Reserve University Matching Scholarship - 4 years.
PROFESSIONAL EXPERIENCE
6/91 - 9/91
8/88 - 3/91
6/88 - 9/89
1/86 - 1/87
Polymer Scientist for Acro Med Corp, Cleveland, OH 44115. Synthesized andcompounded rubber used in the fabrication of a prototype artificial spinal disk.Responsibilities included writing and revising protocol procedures, physical testingand characterization of the synthesized rubber. Temporary summer position. Dr.Carl McMillin - Supervisor.
General Manager for Reynolds Corner Recreation Bowling Center, Toledo+ OH43615. Weekend responsibilities in the family business included: customer sen, ice,inventory, general maintenance, snack bar concessions, bartending, and waitressing.Sandra Tenteris - Supervisor.
Student Assistant for Applied Research, Akron, OH 44352. Performed GC/FTIRanalyses on unknown samples.
Research Assistant at University of Michigan Transportation Research Institute, AnnArbor, MI 48109. Principal Investigator: Investigation of Intravenous andIntramuscular Needle Penetrations. Performed needle testing, prepared reports withstatistical data analysis, and monthly financial statements. Developed protocol for
Anita Tcntcris-Noebe
Page 2
the evaluation of bone biopsy needles, including statistical analysis and SEM ofbiopsy core samples. Dr. L. W. Schneider - Supervisor.
6/84 - 10/85 Graduate student in the Department of Biomedical Engineering at Case WesternReserve University. Performed animal surgeries, set up and operated histologylaboratory, and prepared tissue samples for histological evaluation. Taught anintroductory materials laboratory to undergraduates.
PROFESSIONAL AFFLIATIONS AND COMMUNITY-BASED ACTIVITIES
• Member: Society of Plastics Engineering, Society for the Advancement of MaterialsProcessing and Engineering, American Chemical Society - Rubber Division.
• Active member of Student Chapter of SAMPE. Previously held offices - President,1989-1992; Vice-President, 1987-1989. Principle student organizer of a one dayseminar - "Advancing Composites into the 90's" held February, 1990.
• Assistant coach for U 14 boys soccer (Highland Hornets) in Medina, OH.
• Actively participates in several organized leagues of women's and co-ed softball andwomen's soccer.
• Participated in the Volunteer Reading Program at Medina County Library, in Medina,OH.
PUBLICATIONS AND PRESENTATIONS
A. Tenteris-Noebe and L.W. Schneider: "Comparative Evaluation of Disposable Bone MarrowBiopsy Needles", Technical Report for The University of Michigan Transportation ResearchInstitute, UMTRi-87-14, February, 1987.
A. Tenteris-Noebe: Chemtracts Macromolecular Chemistry Condensation of the article: "Rheological
Studies on Solutions of Poly-p-phenylene Terephthalamide in H2SO4" by Y. Xu and R. Qian,Intern. Polymer Proc., 4, 1990, 250.
A. Tenteris-Noebe: Chemtracts Macromolecular Chemistry Condensation of the article "Knit LineFractures in Injection Molded Liquid Crystalline Polymers" by K. Engberg, A. Knutsson, P. E.Werner, and U. W. Gedde, Polymer Eng. Sci., 30(24), 1990, 1620.
A. Tenteris-Noebe: Chemtracts Macromolecular Chemistry Condensation of the article "Rheologyand Morphology of Polymer Bends Containing Liquid-Crystalline Component in Melt and SolidState" by V. G. Kulichikhin, O. V. Vasil'eva, I. A. Litvinov, E. M. Antipov, I. L. Parsanyan, and N.A. Plate, J. Appl. Polymer Sci,, 42, 1991, 363.
A. Tenteris-Noebe: Chemtracts Macromolecular Chemistry Condensation of the article "FatigueBehavior of Oriented Ultra-High Molecular Weight Polyethylene Prepared by Gel Drawing" by N.Kaiya, A, Takahara, and T. Kajiyama, PolymerJ., 2__2,1990, 859.
A. Tenteris-Noebe: Review of the book Introduction to Plastics and Composites MechanicalProperties and Engineering Applications, by Edward Miller, for Materials and ManufacturingProcesses, 11, 1996, pp. 891-892.
A. Tenteris-Noebe and Dr. Frank N. Kelley, "Structure-Property Relationships in Bismaleimides",presented at The College of Polymer Science and Polymer Engineering, Sponsor's Day Symposium,October 24, 1996.

ACKNOWLEDGMENTS
There are many people that I have to acknowledge and
thank for all of their help and support during this
research effort. I sincerely acknowledge and am indebted
to Dr. Frank Kelley for his help, support, and guidance
throughout this project. He accepted my need for
independence and was extremely patient with me throughout
this investigation.
The second person who richly deserves my sincere
gratitude is Dr. Gary Roberts for his help at NASA Lewis
Research Center and his guidance on polyimides. The
financial assistance for this research was supplied to us
in a grant from NASA Lewis Research Center.
Several companies furnished the necessary material for
this research: Shell Chemical Co, of Texas supplied BMI
and Ciba Geigy Polymers, New York supplied DABA.
At NASA Lewis Research Center, a plethora of personal
contributed to this research effort. My sincere thanks
extend to: H. Eakin, D. Schiemann, L. McCorkle,
vi

P. Dickerson, J. Kamvouris, V. Klans, T. Leonhardt, M.
Miller, A. Garg, and M. Meador.
Dr. Kelley and I would like to gratefully acknowledge
Wright Patterson Air Force Base and specifically, Dr. Allan
Crasto, K. Lindsay, and W. Price for their help while I was
at WPAFB. The use of their laboratories greatly aided in
the completion of this work.
I want to thank Dr. Galiatsatos for his contributions
to this work. In the dielectric work, Xiaofeng Xu greatly
aided in the experimentation while Jeff Sherman helped with
the modelling.
I would like to thank the supporting cast of RoseMary
Kolton, Paul Easterling, Linda Seib, Brian Gudhe, Jeremy
Jones, Justin Spradley and Jeff Deisz Sr for their help and
assistance.
I would like to thank the Tenteris and Noebe families
for all their support, encouragement, and love. I would
also like to thank Helen Witkowski for her wisdom and
guidance.
Last but not in the least, I would like to acknowledge
and thank Ron. His help, guidance, patience and knowledge
in putting this dissertation together were invaluable. I
could not have finished this research without him.
vii

DEDICATION
This is dedicated to the four men in my life. The first
man has cared for me all my life, faults and all. When I
was in the darkest, deepest, black hole, the second man
lifted me on his shoulders and carried me around until I
could almost see daylight. The third man gave me his hand,
pulled me up out of the hole, and pointed me in the
direction of the mountain. The fourth person put his arm
around my shoulders and led me to the top of this mountain.
These four men were and always will be my mentors, my
heroes, and most of all, my friends. Thank you.
viii

ABSTRACT
The purpose of this research was to control and
systematically vary the network topology of bismaleimides
through cure temperature and chemistry (addition of various
coreactants) and subsequently attempt to determine
structure-mechanical property relationships.
Characterization of the bismaleimide structures by
dielectric, rheological, and thermal analyses, and density
measurements was subsequently correlated with mechanical
properties such as modulus, yield strength, fracture
energy, and stress relaxation.
The model material used in this investigation was
4,4'-bismaleimidodiphenyl methane (BMI). BMI was coreacted
with either 4,4'-methylene dianiline (MDA), o,o'-diallyl
bisphenol A (DABA) from Ciba Geigy, or diamino diphenyl
sulfone (DDS). Three cure paths were employed: a low-
temperature cure of 140 °C where chain extension should
predominate, a high-temperature cure of 220 °C where both
chain extension and crosslinking should occur
iii

simultaneously, and a low-temperature (140 °C) cure followed
immediately by a high-temperature (220 °C) cure where the
chain extension reaction or amine addition precedes BMI
homopolymerization or crosslinking. Samples of cured and
postcured PMR-15 were also tested to determine the effects
of postcuring on the mechanical properties.
The low-temperature cure condition of BMI/MDA
exhibited the highest modulus values for a given mole
fraction of BMI with the modulus decreasing with decreasing
concentration of BMI. The higher elastic modulus is the
result of steric hindrance by unreacted BMI molecules in
the glassy state. The moduli values for the high- and
low/high-temperature cure conditions of BMI/MDA decreased
as the amount of diamine increased. All the moduli values
mimic the yield strength and density trends.
For the high-temperature cure condition, the room-
temperature modulus remained constant with decreasing mole
fraction of BMI for the BMI/DABA and BMI/DDS systems.
Postcuring PMR-15 increases the modulus over that of the
cured material even though density values of cured and
postcured PMR were essentially the same.
Preliminary results of a continuous and intermittent
stress relaxation experiment for BMI:MDA in a 2:1 molar
iv

ratio indicate that crosslinking is occurring when the
sample is in the undeformed state.
Computer simulation of properties such as density,
glass transition temperature, and modulus for the low-
temperature cure conditions of BMI/MDA and BMI/DABA were
completed. The computer modeling was used to help further
understand and confirm the structure characterization
results. The simulations correctly predicted the trends of
these properties versus mole fraction BMI and were extended
to other BMI/diamine systems.

TABLE OF CONTENTS
LIST OF TABLES
LIST OF FIGURES
CHAPTER
I. INTRODUCTION
Page
xvi
xvii
II. HISTORICAL
2.1.
2.2.
2.3.
REVIEW
Introduction
Epoxies
Polyimides
2.3.1.
2.3.2.
2.3.2.1.
2.3.2.2.
2.3.2.3.
Condensation Polyimides
Addition Polyimides
Acetylene-Terminated Oligomers
PMR Polyimides
Bismaleimides
2.3.2.3.1.
2.3.2.3.1.1.
2.3.2.3.1.2.
2.3.2.3.1.3.
Chemistry of BMI/Diamine
temperature effects
transition temperature
reactant ratios
2.3.2.3.2. Chemistry of BMI/Alkenylphenols
2.3.2.3.2.1. temperature effects
9
9
9
14
15
15
16
16
18
21
23
25
27
27
31
ix

CHAPTER Page
2.4.
2.3.2.3.3. Mechanical Properties of
Bismaleimides
Advanced Polymer Characterization
Techniques
2.4.1. Continuous and Intermittent Stress
Relaxation
2.4.2. Frequency-Dependent Impedance Sensing
Techniques
2.4.2.1. Electric Dipole Moments and
Polarization
2.4.2.2. Experimental Theory
2.4.2.3. Dielectric Measurement Techniques
2.4.2.3.1. Parallel Plate Electrodes
2.4.2.3.2. Comb Electrodes
2.4.2.3.3. Microdielectrometry
2.4.2.4. Dielectric Analysis of Polymeric
Networks During Cure
2.4.3. Polymer Modeling
2.4.3.1. QSPR
2.4.3.1.1. Dow
2.4.3.1.2. van Krevelan
2.4.3.2. Synthia
32
35
35
38
39
4O
44
45
46
46
47
48
48
49
49
5O
III . EXPERIMENTAL DETAILS
3.1. Introduction
3.1.1. Experimental Materials
3.1.1.1.
3.1.1.2.
3.1.1.3.
Bismaleimides
Crosslinking Agents
Chemistry - BMI/MDA and BMI/DDS
X
54
54
54
54
56
56

CHAPTER
3.2.2. Differential Calorimetry
3.3. Network Preparation
3.1.1.3.1. Reactant Ratios - BMI/MDA
3.1.1.3.2. Reactant Ratios - BMI/DDS
3.1.1.4. Chemistry - BMI/DABA
3.1.1.4.1. Reactant Ratios - BMI/DABA
3.1.1.5. PMR-15
Raw Material Characterization
Dynamic Thermogravimetric Analysis/Fourier Transform InfraredSpectrophotometer
Spectroscopy
3.3.1. Powder Technology - BMI/MDA and BMI/DDS
3.3.1.1. Powder Characterization.
3.3.1.1.1.
3.3.1.1.2.
3.3.1.1.3.
Gel Point Determination
TGA/FTIR
Differential ScanningCalorimetry
BMI/MDA and BMI/DDS
DifferentialCalorimetry
3.3.2. Processing of
3.3.2.1. General
3.3.2.1.1.
3.3.2.2. Molds
3.3.2.3. Thermal Historiesand BMI/DDS
3.3.2.3.1.
3.3.2.3.2.
3.3.3. Synthesis
Scanning
BMI/MDA
Curing Procedure - BMI/MDA,BMI/DDS
Postcuring Procedure - BMI/MDA
- BMI/DABA
×J
Page
58
58
6O
60
63
63
63
64
64
64
66
66
67
67
68
68
7O
71
73
76
77
77

CHAPTER
3.3.3.1. Molds - BMI/DABA
3.3.3.2. Thermal Histories - BMI/DABA
3.3.3.2.1. Curing Procedures - BMI/DABA
3.3.3.2.2. Postcuring Procedures- BMI/DABA
3.3.4. Thermal History - PMR-15
3.4. Testpiece Preparation
3.4.1. General
3.4 2 Rheological Testpieces
3.4 3 Double-Torsion Samples
3.4 4 Sonic Modulus Samples
3.4 5 Plane Strain Compression Testpieces
3.4 6 Density Testpieces
3.4 7 Equilibrium Rubbery Modulus Testpieces
3.5. Network Characterization
3.5.1. Dynamic Shear Measurements
3.5.2. Density by the Method of HydrostaticWeighing
3.5.3. Molecular Weight between Crosslinks, Mc
3.5.4. Materialography
3.5.4.1.
3.5.4.2.
3.5.4.3.
Optical Microscopy
Solvent Etch
Nomarski Differential InterferenceContrast
02 Plasma Etch
Scanning Electron Microscopy (SEM)
xii
Page
79
79
81
81
84
84
84
86
87
87
88
88
89
89
89
92
93
94
94
95
95
96
96

CHAPTER
3.5.5. Gel Permeation Chromatography (GPC)
3.6. Mechanical Properties
3.6.1. Plane Strain Compression
3.7. Double-Torsion Fracture Energy Measurements
3.7.1. Experimental
3.7.2. Calculations
3.7.3. Plastic Zone Size Calculations
3.8. Rubbery Modulus Measurements
3.8.1. Above Tg - Near-Equilibrium Stress-Strain Testing
3.8.1.1. Experimental
3.8.1.2. Calculations
3.8.2. Intermittent Stress Relaxation
3.8.2.1. Experimental
3.8.2.2. Calculations
3.8.3. Below Tg - Sonic Modulus
3.8.3.1. Experimental
3.8.3.2. Calculations
3.9. Dielectric Measurements
3.10.
3.9.3.
Polymer
Instrumentation
Dielectric Measurementsand BMI/DDS
Dielectric Measurements
Modeling
- BMI/MDA
- BMI/DABA
IV. RESULTSAND DISCUSSION
4.1. Introduction
XIII
Page
97
97
97
I00
I00
104
107
109
109
109
110
iii
III
112
112
112
113
115
115
115
117
118
120
120

CHAPTER
4.2.
4.2.1.
4.2.2.
Network Preparation and Characterization
BMI/MDA and BMI/DDS Processing
Materialographic Examination ofCured Plates
4.3. Dielectric Measurements of Thermosets
4.3.1. Low/High Step Cure Condition: BMI/MDA
4.3.1.1. Low-Temperature Cure
4.3.1.2. High-Temperature Cure
4.3.2. Low/High Step Cure Condition: BMI/DABA
4.3.2.1. Low-Temperature Cure
4.3.2.2. High-Temperature Cure
4.3.3. Low/High Step Cure Condition: BMI/DDS
4.3.3.1. Low-Cure Condition
4.3.3.2. High-Temperature Cure
4.4. Network Characterization
4.4.1. Differential Scanning Calorimetry ofBMI/MDA and BMI/DDS
4.4.2. Gel Point Determination
4.4.3. Gel Permeation Chromatography
4.4.4. TGA/FTIR
4.4.5. Dynamic Mechanical Spectroscopy
4.4.5.1. Rheological Properties of BMI/MDA
4.4.5.2. Rheological Properties of BMI/DABA
4.4.5.3. Rheological Properties of BMI/DDS
4.4.5.4. Rheological Properties of PMR
4.4.6. Density by the Method of HydrostaticWeighing
xiv
Page
121
121
126
138
151
151
160
163
163
165
167
167
168
169
169
181
184
185
195
200
212
222
225
225

CHAPTER
4.5.
4.6.
Plane Strain Compression
Double-Torsion Fracture Energy Measurements
4.6.1. Double-Torsion Fracture Energy
4.6.2. Plastic Zone Size
4.7. Modulus Measurements
4.7.1. Below Tg - Sonic Modulus
4.7.2. Above Tg - Near Equilibrium Stress-Strain Testing .
4.7.3. Intermittent Stress Relaxation
4.8. Computer Modelling of Thermoset Networks
V°
REFERENCES
SUMMARY AND RECOMMENDATIONS
5.1. Summary of Results
5.2. Suggestions for Future Work
Page
238
249
249
258
266
266
275
283
289
306
306
313
315
XV

Table
3.1
4.2
4.3
4.4
4.5
4.6
4.7
4.8
4.9
LIST OF TABLES
Cure and Postcure Schedules for the BMI/MDA
and BMI/DDS Systems.
Cure and Postcure Schedules for BMI/DABA.
Dielectric Properties of BMI/MDA in Various
Mole Ratios.
Dielectric Properties of BMI/MDA in a 2:1
Mole Ratio (High-Temperature Cure) and BMI.
Dielectric Properties of BMI/DABA and BMI/DDS
in Various Mole Ratios.
Critical Temperatures Determined by DSC for
BMI:MDA and BMI:DDS Systems.
TGA Properties of the Various BMI-Based
Copolymers.
Evolved Gas and IR Assignments for Various
BMI:MDA, BMI:DDS, and BMI:DABA Samples.
Density Values for PMR.
Moduli Comparisons for BMI:DABA 1:0.87.
Sonic Modulus Values for PMR.
Page
74
82
152
153
154
175
189
196
237
267
275
xvi

LIST OF FIGURES
Figure
I.i Schematic representation of the cure schedules
and expected network structures under
investigation.
1.2 Outline of the methodology used in this research.
2.1 The chemical structures of a.) NE, b.) BTDE, and
c.) MDA.
2.2 The general structure of BMI.
2.3 Chemical reactions that occur during the
polymerization of a bismaleimide with an amine:
a.) amine addition and b.) bismaleimide
homopolymerization.
2.4 The chemical structure of DABA.
2.5 Schematic illustration of the pentafunctional
prepolymer of BMI/DABA.
2.6 Compact tension fracture energies data from
Donnellan and Roylance's investigation versus the
molecular weight between crosslinks, derived from
rheological data, resulting in a _-power
dependence.
3.1 Chemical structure of N,N' bismaleimido 4,4'
diphenyl methane (BMI).
3.2 Chemical structures of the crosslinking agents
used in this study: a.) 4,4'-diaminodiphenyl
methane (MDA), b.) 4,4'-diaminodiphenyl sulfone
(DDS), c.) o,o'-diallyl bisphenol A (DABA).
3.3 Steps in the BMI/MDA reaction, a.) Chain
extension due to amine addition, b.) BMI
homopolymerization.
3.4 Potential reactions in the BMI/DABA system, a.)
_ene' reaction, b.) Diels-Alder reaction, c.) BMI
homopolymerization, d.) Idealized pentafunctional
prepolymer.
xvii
Page
17
20
22
29
3O
34
55
57
59
61

Figure
3.5 Schematic diagram of the 6" x 6" tempered steelmold, used to consolidate BMI/MDA and BMI/DDSpowders. The labels denote the following: a =mold lid, b = _U-shaped' bottom mold with
detachable sides, c = platform plates for
containing the powders.
3.6 Typical thermal history and pressure profile for
BMI/MDA in a 2:1 mole ratio, cured for 16 hr at
low temperature and then postcured for 6 hr at
high temperature.
3.7 Reaction kettle setup used in preparing BMI/DABA
networks. (Figure obtained from S. Mudrich. 3)
Labels denote the following: a) thermometer, b)
glass stirring rod, c) vacuum hose, d) reaction
kettle lid, e) i000 ml reaction kettle, f)
heating mantle, g) Teflon stirring blade.
3.8 Schematic diagram of the Teflon coated aluminum
mold used to cure BMI/DABA sheets. (Figure
obtained from S. Mudrich.3).
3.9 Typical processing history for BMI:DABA in a I:Imole ratio.
3.10 Patterns for cutting the various test-piece
configurations from the 6" x 6" (top) and 8" x 8"
(bottom) cured plates. Labels denote the
following: 'DT' : double-torsion sample, 'rheom'
= rheological test sample, _extra' = extra
material, not used for mechanical testing.
3.11 Schematic illustration of the relationship
between storage modulus (G') and temperature for
a typical BMI network. The glass transition
temperature, Tg was determined by an intercept
method, indicated by the dashed lines.
3.12 Schematic representation of the plane strain
compression yield test fixture.
3.13 Schematic representation of the double-torsion
sample and loading configuration.
3.14 Schematic diagram of the Instron, Model TM
universal test machine with double-torsion setup.
(Figure from S. Mudrich. 3) Labels denote the
following: a) double-torsion sample, b)
compression load cell, and c) Instron crosshead.
xviii
Page
72
75
78
80
83
85
91
99
I01
103

Figure
3.15 Typical load-displacement curves for a.) stable,continuous crack propagation and b. unstable,stick-slip crack propagation.
3.16 Schematic diagram for setup of the impulseexcitation technique, or sonic modulusexperiment. 67
3.17 Schematic diagram of the microdielectricmeasurement system.
3.18 The chemical structure of a.) p-phenylene diamine(PPD), b.) p-xylenediamine (PXD), and c.) 4,4'-diaminobiphenyl (DBP).
4.1 Photomicrograph of BMI/MDA produced by thesolvent-powder processing method.
4.2 Powder size distributions for the material moldedfor this investigation.
4.3 Bright-field optical photomicrograph of BMI:MDAin a 2:1 mole ratio, cured at 140 °C for 16 hours.
4.4 Bright-field optical photomicrograph of the as-ground powders. .
4.5 Bright-field optical photomicrograph of BMI:MDAin a 2:1 mole ratio, cured at 140 °C for 16 hoursafter solvent etch/acid etch.
4.6 Bright-field optical photomicrograph of BMI:MDAin a 2:1 mole ratio, cured at 140 °C for 16 hoursafter plasma etching.
4.7 Dark-field optical photomicrograph of BMI:MDA ina 2:1 mole ratio, cured at 140 °C for 16 hours.
4.8 Scanning electron micrograph of BMI:MDA in a 2:1
mole ratio, cured at 140 °C for 16 hours after
fracturing at cryogenic temperatures.
4.9 Optical photomicrograph of BMI:MDA in a 2:1 mole
ratio, cured at 140 °C for 16 hours after
fracturing at cryogenic temperatures.
4.10 Optical photomicrograph of BMI:MDA in a 2:1 mole
ratio, cured at 220 °C for 6 hours after
fracturing at cryogenic temperatures.
Page
106
114
116
119
122
125
128
129
130
132
133
135
136
137
xix

Figure
4.11 Permittivity and loss factor as a function of
time and temperature for BMI:MDA in a 2:1 mole
ratio during a 165 °C cure and a 220 °C postcure
processing cycle.
4.12 Permittivity and loss factor versus time and
temperature for 2:1 BMI:MDA heated to 220 °C.
4.13 (_" * _) plots versus time and temperature for the
165 °C/220 °C cure of BMI:MDA in a 2:1 mole ratio.
4.14 Arrhenius plot of log conductivity versus
i/temperature for BMI:MDA in a 2:1 mole ratio for
the low-temperature cure condition.
4.15 Cole-Cole plot for 2:1 BMI:MDA cured at 165 °C and
postcured at 220 °C.
4.16 Data from Fig. 4.12, replotted as (_" * _) plots
versus time and temperature for the high-
temperature cure of BMI:MDA in a 2:1 mole ratio.
4.17 Cole-Cole plot of BMI:DABA in a 2:1 mole ratio
cured at 155 °C.
4.18 DSC scans of unreacted powder and samples cured
for 6 and I0 hrs at 220 °C of BMI:MDA in a 2:1
mole ratio.
4.19 Normalized DSC scans of unreacted powder, and
samples cured at low-, high-, and low/high-
temperature conditions of BMI:MDA in a 2:1 mole
ratio.
4.20 Normalized DSC scans for unreacted powder, and
samples cured at low-, high-, and low/high-
temperature conditions of BMI:MDA in a 4:1 mole
ratio.
4.21 Normalized DSC scans for unreacted powder, and
samples cured at low-, high-, and low/high-
temperature conditions of BMI:MDA in a I:i mole
ratio.
4.22 Normalized plots of DSC curves for BMI:DDS in a
2:1 mole ratio.
4.23 Normalized plots of DSC curves for BMI:DDS in a
I:i mole ratio.
XX
Page
141
145
148
156
158
161
166
170
173
177
178
179
180

Figure
4.24 Mole ratio of BMI:MDA versus gel time in secondsper gram for cure temperatures of 140 and 220 °C.
4.25 Number and weight average molecular weightsversus mole fraction BMI for the low curecondition of BMI:MDA in a 2:1, 4:1, and I:I moleratio determined by GPC analysis.
4.26 Weight percent remaining and the first derivativeof weight loss versus temperature for BMI:MDA ina 4:1 mole ratio.
4.27 Weight percent remaining versus temperature forBMI:MDA in a 4:1 mole ratio after variousprocessing conditions.
4.28 Weight percent remaining versus temperature forBMI/MDA unreacted powders in various mole ratios.
4 29 Typical FTIR spectrum with IR band identificationdetermined at 220 °C for unreacted powder ofBMI:MDA in a 4:1 mole ratio.
4 30 Rheological plot of G', G", and tan 6 for theBMI:MDA sample in a 2:1 mole ratio, cured for 6hours at 220 °C. Frequency of test was 1 Hz.
4 31 Plots of G' for BMI:MDA in a 2:1 mole ratio forthe various cure cycles. Frequency of test was 1Hz.
4 32 Rheological plots of G' for BMI:MDA in a I:I moleratio for the various cure cycles. Frequency oftest was 1 Hz.
4 33 Plots of G' for BMI:MDA in a 4:1 mole ratio forthe various cure cycles. Frequency of test was 1Hz.
4 34 Dynamic mechanical plots of G' for the variousBMI/MDA mole ratios cured at high temperature.Frequency of test was 1 Hz.
4 35 The effect of mole fraction BMI on the glasstransition temperature of BMI/MDA copolymers forthe three different cure conditions.
Page
183
186
188
192
193
194
199
201
202
203
207
209
xxi

Figure
4.36 G' curves for BMI:DABA in a i:i mole ratio for
the low-, high-, and low/high-temperature cure
conditions. Frequency of test was 1 Hz.
4.37 Storage modulus curves for BMI:DABA in a 1:0.87
mole ratio for the low-, high-, and the low/high-
temperature cure conditions. Frequency of testwas 1 Hz.
4.38 Storage modulus curves for BMI:DABA in a 2:1 mole
ratio for the low-, high-, and the low/high-
temperature cure conditions. Frequency of testwas i Hz.
4.39 G' versus temperature for the low- and low/high-
temperature cure conditions of BMI:DABA in a
1:1.12 mole ratio. Frequency of test was 1 Hz.
4.40 The effect of mole fraction BMI on the glass
transition temperature of BMI/DABA copolymers.
4.41 Storage modulus curves for BMI/DDS in a 2:1 and
i:I mole ratio. Frequency of test was 1 Hz.
4.42 The effect of mole fraction BMI on the glass
transition temperature of BMI/DDS copolymers.
4.43 G' versus temperature for cured and postcured
PMR. Frequency of test was 1 Hz.
4.44 Density versus mole fraction BMI for BMI/MDA
copolymers.
4.45 Density versus mole fraction BMI for BMI/MDA, and
BMI/DABA in the low-temperature cure condition.
4.46 Density versus mole fraction BMI for BMI/MDA,
BMI/DDS, and BMI/DABA in the high-temperaturecure condition.
4.47 Density versus mole fraction BMI for BMI/MDA, and
BMI/DABA in the low/high-temperature cure
condition.
4.48 Room-temperature densities of BMI/DABA samples
cured at low-, low/high-, and high-temperature
curing conditions.
Page
214
217
219
221
223
224
226
227
228
231
232
233
235
xxii

Figure
4.49 Yield stress versus mole fraction BMI for the
BMI/MDA system for different cure conditions.
4.50 Yield stress versus mole fraction BMI for the
BMI/DABA system.
4.51 Yield stress versus mole fraction BMI for the
high cure conditions of BMI/MDA, BMI/DDS, and
BMI/DABA. Data of the cured and postcured PMRare also included.
4.52 Fracture energy, determined by the double-torsion
test, versus mole fraction BMI for the BMI/MDA
system cured at low-, high-, and low/high-
temperature cure conditions.
4.53 Fracture energies versus mole fraction BMI for
the BMI/DABA system in the low-, high-, and
low/high-temperature cure conditions.
4.54 Fracture energies for the high-temperature cure
conditions of the BMI-based copolymers as a
function of mole fraction BMI. Fracture energyvalues of PMR are included.
4.55 Calculated plastic zone size (2rp) versus mole
fraction BMI for the low-, high-, and low/high-
temperature cure conditions for BMI/MDA.
4.56 Calculated plastic zone size versus mole fraction
BMI for the low- and high-temperature cure
condition for the BMI/DABA system.
4.57 Comparison of the calculated plastic zone size
for the high-temperature cure conditions of the
BMI/MDA, BMI/DABA, and BMI/DDS.
4.58 Sonic modulus versus mole fraction BMI for the
various BMI/MDA cure conditions.
4.59 Sonic modulus versus mole fraction BMI for the
BMI/DABA system.
4.60 Comparison of the sonic modulus versus mole
fraction BMI for the various high-temperature
cure systems.
Page
241
243
246
250
253
256
260
263
264
269
270
272
XXll|

Figure
4.61 Representative true stress versus time graph at
various strain levels for the high-temperature
cure condition of BMI/MDA in a 2:1 mole ratio,
tested in nitrogen.
4.62 A representative true stress versus strain curve
for the high-temperature cure condition of
BMI/MDA in a 2:1 mole ratio.
4.63 Relationship between fracture energy and
molecular weight between crosslinks, determined
from the near-equilibrium stress-strain curves,
for the BMI/MDA system.
4.64 Rheological analysis of 2:1 BMI:MDA before and
after an isothermal hold at 288 °C. Frequency of
test was 1 Hz.
4.65 Three possible relationships between continuousand intermittent stress relaxation behavior for a
polymer network. 3s
4.66 Normalized stress versus strain for BMI:MDA in a
2:1 mole ratio cured for 6 hrs at 220 °C. The
lines indicate the continuous stress relaxation
curve for two samples cured at high temperature
and the symbols represent the intermittent
normalized stress values for a given time.
4.67 Comparison of the measured and modeled glass
transition temperature as a function of mole
fraction BMI for the BMI/MDA system.
4.68 Comparison of the measured and modeled glass
transition temperature versus mole fraction BMI
for the BMI/DABA low-temperature cure condition.
4.69 Glass transition temperature versus mole fraction
BMI for the experimental data previously shown
for BMI/MDA, and modeled data for three other
diamines: DBP, PPD, and PXD.
4.70 Experimentally determined and modeled density
values as a function of BMI mole fraction for the
BMI/MDA system.
4.71 Experimentally determined and modeled density
values as a function of BMI mole fraction for the
BMI/DABA system.
xxiv
Page
278
280
282
284
286
288
292
294
295
297
298
Figure
4.72 Density versus mole fraction BMI for the modeledbehavior of three BMI/diamine systems and theexperimental values for BMI/MDA.
4.73 Modulus versus mole fraction BMI for the BMI/MDAsystem and the modeled low-temperature cureresults.
Page
299
301
4.74 Modulus versus mole fraction BMI for the BMI/DABAsystem and the calculated modulus vales from thecomputer simulation for the low-temperature curecondition.
4.75 Calculated modulus results versus mole fractionBMI for various BMI/diamine systems compared to
the experimental values for BMI/MDA.
302
303
XXV

CHAPTER I
INTRODUCTION
One of the oldest and most useful types of polymers in
modern technology is the crosslinked polymer network or
thermoset. Thermosets are polymeric materials, which, when
heated, form permanent network structures via the formation
of intermolecular crosslinks between chains. Due to their
network structure, thermosets exhibit good dimensional
stability, resist viscous flow at elevated temperatures, and
are considered water and solvent resistant. Therefore,
thermosets fill many common engineering needs for structural
applications, usually at elevated temperatures.
Epoxies have been the most widely used and extensively
studied class of thermosets. They are easy to handle and
process. However, there are several problems associated
with epoxies. For one, their upper use temperature is
approximately 180 °C, which limits applications to non-
thermally critical structural parts. Another detrimental
feature is their low resistance to brittle fracture.

2Many researchers have tried to determine the mechanisms
responsible for this low fracture resistance in an effort to
correct this deficiency. But because of the intractable
nature of epoxies, direct structural characterization is
extremely difficult. Therefore, the structure-property
relationships of epoxies and glassy thermosets in general
are not so well understood. The increasing use of
crosslinked polymers for critical and demanding engineering
applications requires better fundamental knowledge of the
molecular network and the relationships between processing
and mechanical properties.
LeMayI and Swetlin 2 investigated the effects of
crosslink density on fracture and the fracture processes of
highly crosslinked epoxy networks. Mudrich 3 studied the
crack tip plastic zone in epoxies with plane strain
constraints, while Ajbani 4 incorporated alumina and rubber
particles in fiber reinforced epoxy composites and
determined the crack speed during fracture. One interesting
discovery in the epoxy work was made by LeMayI, who found a
1/2 power dependence when he plotted the arrest values of
fracture energy versus Me, the number average molecular
weight between crosslinks. He concluded that the fracture
energy of epoxies is related to the plastic zone size,
which is determined by crosslink density.

3There has been an increased effort in the development
of high temperature, high performance resin systems. Uses
include advanced composite matrices for commercial and
military aircraft structures. Seemingly every day a new and
improved polyimide is discovered to meet the challenges of
advanced composites. One relatively new class of addition
polymers is the bismaleimides, (BMI). BMI's were developed
for applications requiring higher temperatures than the
thermal capabilities of epoxy matrix systems. Bismaleimides
display excellent processability and excellent thermal and
mechanical properties. Sometimes BMI's have been added to
epoxies to improve Tg and thermal stability. BMI's by
themselves are inherently brittle; they are usually reacted
with a chain extender in order to increase the molecular
weight between crosslinks. However, BMI's have been
bypassed as a potential candidate for advanced composites
due to their brittle behavior, weight loss at elevated
temperatures, and observed microcracking.
At the start this research, a model thermosetting
system was sought, for which the structure-property
relationships could potentially be investigated in the same
manner as epoxies have been historically examined. Two
papers by Donnellan and Roylance 5'6 were recently published
on the properties of BMI and methylene dianiline (MDA). The
fracture data was replotted against the estimated molecular

4
weight between crosslinks and a _ power dependence was
found. This was a promising sign in the search for a model
resin system to study.
The BMI/MDA system is cure path dependent. By varying
the reactant ratios or by changing the cure path, the
structure of the network formed will be affected, which in
turn, will influence the thermal and mechanical properties
of the resin. A schematic of the cure schedules and
expected structures is shown in Figure I.i. If the BMI/MDA
is cured at low temperatures, chain extension would be the
predominate reaction and result in linear chains of BMI/MDA
with few or no crosslinks. When BMI/MDA is _ured at high
temperatures only, there would be simultaneous chain
extension and crosslinking occurring. The resultant network
would have short chains with network defects. Finally, if
the BMI/MDA system were cured at low temperature to promote
chain extension and then cured at high temperature to
crosslink the linear chains of BMI/MDA, a cross-linked
network would form with long chains and minimal chain
defects. Even though BMI has been investigated before, the
quantitative dependence of the physical properties on the
network topology is undetermined, mainly due to the lack of
adequate characterization techniques for densely crosslinked
materials.

High Only
Low
/High
Low Only
Time
Simultaneous extension
& Cross-linking
Extension then
Cross-linking
Extension
Figure I.i. Schematic representation of the cure schedules
and expected network structures under investigation.

6
The purpose of this research was to determine the
structure-property relationships of BMI by changing the cure
histories, the reactants, and the reactant ratios and
examining these effects on thermal and mechanical
properties. Two diamines and a chain extender were used in
conjunction with BMI in varying mole ratios. The specific
objectives of this research were: to monitor the curing
reactions of the bismaleimide and the crosslinking agent, to
apply the same type of experimental techniques used
previously in epoxy research to bismaleimides, and to test
the predictive capacities of the Synthia module of Biosym
Technologies. 7
The methodology used is shown in Figure 1.2. Curing
reactions were monitored with dielectric analysis,
differential scanning calorimetry, and TGA/FTIR. The
effects of each curing condition on Tg, density, and the
mechanical properties were determined. Samples of cured and
postcured PMR, supplied by NASA Lewis Research Center were
also tested in the same manner. PMR is the acronym for
[olymerization of monomer _eactants and is considered one of
the leading commercial polyimides in the aerospace
industry. 8
Relevant epoxy research and previous work on BMI's are
reviewed in Chapter 2. The experimental procedures and
conditions under which each technique was employed are

Systems
BMI:MDA (4:1, 2:1, 1:1)
BMI:DABA (2:1, 1:1, 1:0.87, 1:1.12)
BMI:DDS (2:1, 1:1)
BMI
Cure Histories
1. Low Temperature Cure
2. High Temperature Cure
3. Low / High Temp. Cure
Characterization- Dielectric Analysis
- Rheological Analysis
- Thermal Analysis:
*DSC
*FTIR/TGA
Mechanical & Physical Properties
- Elastic Modulus
- Yield Stress
- Fracture Energy
- Density
- Molecular Weight Between Crosslinks
[Modelingl "1_- I Fractography I
Figure 1.2. Outline
research.
of the methodology used in this

8
discussed in Chapter 3. The results and discussion are
described in Chapter 4. Finally, in Chapter 5, a summary of
this work plus recommendations for future work is presented.

CHAPTERII
HISTORICAL REVIEW
2.1. Introduction
Thermosetting polymers are being used in adhesive as
well as structural applications. Therefore, a complete
understanding of the mechanical behavior and especially
fracture properties of thermosetting polymers is very
important. There are several major variables that affect
the fracture properties of thermosets: type of resin and
curing agent used, amount of curing agent, and the cure
schedule (times and temperatures). All affect the crosslink
density of the material and ultimately its mechanical
behavior. The purpose of this dissertation is to add to the
understanding of structure-property relationships in
thermosets by studying a model polyimide system.
2.2. Epoxies
Of all the thermoset systems, epoxies have been much
more widely studied, especially in terms of structure-
property relationships. However, it is difficult to

10
correlate the fracture property results from a variety of
studies that used different epoxy resins, cured under
dissimilar conditions. Vakil and Martin 9 studied the yield
strength and the fracture energies of a series of
crosslinked epoxy resins. They found that the most densely
crosslinked network had the highest yield strength and that
the yield stress decreased as the molecular weight between
crosslinks increased. Also, the initiation and arrest
values of the fracture energy both increased as the
molecular weight between crosslinks increased.
Epoxies can be polymerized with many different
crosslinking agents. The type of crosslinking agent and the
amount used can influence the physical properties of
epoxies. Phillips et al. I° found that the amine type
influenced the fracture behavior of DGEBA (diglycidyl ether
of Bisphenol A) epoxies. They investigated stoichiometric
amounts of DGEBAcured with two different series of
aliphatic amines. The first was a difunctional primary
diamine and the second diamine studied was a polyfunctional
diamine. They found that the fracture initiation energy of
the DGEBA/primary diamine series increased as the molecular
weight of the curing agent increased. The fracture
initiation values for the mixed amine series was independent
of molecular weight. They determined that the crosslink
density of the mixed amine series did not change because the

l!
molecular distance between the amines remained constant even
though the amine molecular weight increased.
The effect of crosslink density on the properties of
epoxies has been studied primarily by varying the
epoxy/curing agent ratio. The ratio of crosslinking agent
to epoxy resin is usually reported as A/E where _A' is the
number of moles of amine hydrogen atoms in the curing agent
and _E' is the number of moles of epoxide endgroups in the
epoxy. Many researchers have investigated the effect of
reactant ratio on the physical properties and fracture
behavior of epoxy systems. Meyers et al. 11 varied the A/E
ratio for DGEBAand DDS and determined that for A/E = I, Tg
and crosslink density was highest. The epoxy-rich system
exhibited the highest room-temperature flexural modulus and
flexural stress. Gupta et al. 12 varied the A/E ratio for
DGEBAand meta-phenylene diamine and found similar results
for the modulus and the tensile stress.
On the other hand, Kim et al. 13 studied a series of
Epon epoxies coreacted with MDA and found that the ultimate
tensile properties were "relatively" insensitive to
stoichiometry over a wide range of A/E ratios. The tensile
stress did show a slight minima at A/E : I. Many of the
investigators used A/E ratio as an effective way to vary
crosslink density. However, the results, all pooled
together, prove that using A/E ratio for epoxies is not

12
always an appropriate way to change the crosslink density
and to determine the structure-property relationships of
epoxies.
The final way to vary the structure of the network is
by controlling the curing times and/or temperatures. By
altering the curing temperature, the reaction kinetics of
the developing network are affected. Chang et al. 14 tried
to vary the crosslink density over a wide range to determine
the effect of crosslinking on the physical properties. They
used a fixed stoichiometric amount of DGEBAand DDS. In
effect, they regulated the extent of cure by controlling the
curing conditions. As the postcuring time increased, the
extent of cure, density, and modulus increased. However, it
is difficult to use cure schedules to control structure.
While the structure may change appreciably with different
temperatures and cure times, the network structure can not
be realistically qualified or quantified. Consequently,
while a great deal of work has been done to characterize the
fracture of epoxies, most studies listed above, have been
performed by varying the curing agents, curing conditions,
or reactant ratios without fully understanding the resultant
changes in structure.
Swetlin _ and LeMayI examined the effects of crosslink
density in DGEBAepoxy resins, crosslinked with MDA or DDS,
on various physical properties. They systematically varied

13
Mc by curing with stoichiometric and nonstoichiometric
amounts of epoxy and crosslinking agents. This was
significant because they created a series of homologous
epoxy networks, whose networks varied by endlinking
chemistry rather than nonstoichiometric reactions. 15
Network Mc'S were determined by measuring the near-
equilibrium rubbery modulus in tension at temperatures above
the Tg.
They determined that stoichiometric amounts of epoxy
and crosslinking agent had the tightest network and that Mc
was nearly equal to Mn for Epon 828/MDA. 1'2 For
nonstoichiometric concentrations of epoxy and curing agent,
Mc increased as the epoxy/curing agent ratio moved farther
from i:i or stoichiometry.
The effective molecular weight between crosslinks, Mc,
can be calculated from equilibrium rubbery modulus
measurements when they are performed well above Tg. The
experimental concept and calculation of Mc are based on the
theory of rubbery elasticity where:
p R T
Mc- G_ (2.1)
is the front factor, assumed to be unity, which is the
ratio of the mean square end to end distance of a matrix
chain between crosslinks to an equivalent random coiled
chain, p is the sample's density, R is the gas constant, T

is the test temperature in Kelvin, and Ge is the rubbery
shear modulus. The theory predicts that Mc or the level of
crosslinking is inversely proportional to Ge. When the
tests are performed in tension and the sample is considered
in a rubbery state, Ge is estimated as Ee/3 because
deformation at constant volume is assumed.
However, some researchers have assumed that Ge is
equivalent to the equilibrium elastic shear modulus, when
the value is determined from dynamic shear measurements.
They assumed that Equation 2.1 is valid even though the
tests were performed dynamically. It is not absolutely
valid to assume this approach, especially for polyimides,
which are notorious for G' minimas not plateau values. _'I_
Another interesting discovery by LeMayI was a 1/2 -
power dependence in the arrest fracture energies and Mc.
This implied that the ultimate fracture properties of the
epoxy system he was studying were proportional to the
plastic zone size. This indicated that the chains in front
of a crack tip undergo yielding and dissipate energy during
extension.
14
2.3. Polyimides
Another class of thermosets with significant
technological applications is the high-temperature
polyimides. Polyimides are derived from monomers containing

15
the maleimide functionality. 17 The synthesis route of the
monomer to fully cured polyimide dictates the type of
polyimide: condensation or addition.
2.3.1. Condensation Polyimides
Condensation polymerization involves the reaction of a
soluble polyamic acid precursor and a final cyclization step
for the end product. Maintaining high purity for the
solvent and reactants is required to obtain high molecular
weight polymers. The ratio of the reactants is also a
critical variable in condensation polymerization. Volatiles
generated during the cyclization reaction can cause the
formation of voids during processing. Condensation
polyimides are known for their high-temperature stability,
but are, at times, difficult to process into useable shapes.
2.3.2. Addition Polyimides
The second type of polyimide is addition polyimides
that are formed by the polymerization of low molecular
weight polyimide resins. Contrary to condensation
polymerization of polyimides, addition polymerization does
not evolve byproducts. (Though, during composite
processing, solvent is usually used to reduce the viscosity
of the resin during prepregging.) Stenzenberger 18 outlines
three types or classes of addition polyimides: acetylene-
terminated oligomers, PMR-polyimides, and Bismaleimides.

16
2.3.2.1. Acetylene-Terminated Oligomers
Hughes Aircraft Company developed the acetylene-
terminated polyimides in the 1970's. 8 These resins are
produced by a two-step reaction process. In the first
stage, the acetylene-terminating group is the reaction site.
Since it is sterically unhindered, these reactive groups
will react very quickly by free radical polymerization. In
a very short period of time, a linear structure is formed.
When high temperature is reached, the reaction forms a
crosslinked network. Small processing windows are the
result of fast reaction rates, which usually produce a
matrix filled with voids.
2.3.2.2. PMR Polyimides
PMR (_olymerization of monomeric _eactants) polyimides
are considered one of the leading commercial polyimides in
the aerospace industry. PMRwas developed in the 1970's at
NASA Lewis Research Center. 8 PMRconsists of three
components: 5-norbornene-2, 3-dicarboxylic acid monomethyl
ester (NE), dimethyl ester of 3,3', 4,4'-benzophenone-
tetracarboxylic acid (BTDE), and 4,4'-methylene dianiline
(MDA). The chemical structures of NE, BTDE, and MDA are
shown in Figure 2.1. The polymerization of PMR is
considered a two-step process. Short chains of imide
oligomers with norbornene endcaps are formed in the first
step when NE, BTDE, and MDA are combined in molar ratios of

17
O
IIC_OMe
C _OH
I0
a.) Monomethyl ester of 5-norbornene-2, 3-dicarboxylic acid(NE)
O
II oMeO_C O ]]
HO _C
II II0 0
b.) Dimethyl ester of 3,3', 4,4'-benzophenone-tetracarboxylic acid(BTDE)
Figure 2.1.
and c. ) MDA.
H2N'-__CH 2--___NH 2
c.) 4,4'-M ethylenedianiline
(MDA)
The chemical structures of a.) NE, b.) BTDE,

18
2/2.087/3.087. (The formulated molecular weight, FMWT, is
calculated to be 1500. Hence, the designation of PMR is
PMR-15.) In the second reaction step the norbornene endcaps
are reacted to form a crosslinked network.
For composite processing, the three monomers are
usually dissolved in a low-boiling point alkyl alcohol. 8
This solution is impregnated within the reinforcing fibers
and allowed to polymerize in-situ. Since a low-boiling
point solvent is used with the low molecular weight
monomers, little to no evolution of volatile materials
occurs during the final cure step. PMR-15 is easily
processed, has good mechanical properties, even at elevated
temperatures, and is known for its excellent thermo-
oxidative stability.
For neat resin plates of PMR-15, commercially available
imidized PMR-15 powder is used. In this investigation, four
neat PMR-15 plates were received from NASA Lewis Research
Center. These were molded from imidized PMR-15 powder at
the appropriate cure schedules. Two of the four plates were
given a postcuring treatment.
2.3.2.3. Bismaleimides
Bismaleimides, BMI, are the third type of addition
polyimides. 18 BMI's are like epoxies in that they can be
processed at fairly low temperatures with little pressure.
BMI's can be processed by a variety of techniques such as

19
autoclave or resin transfer molding (RTM) for composite
applications.
Bismaleimide monomer is prepared from the reaction of
maleic anhydride and a diamine. 18 The general structure of
BMI is shown in Figure 2.2 where R' can be an aromatic or an
aliphatic molecule, depending upon the diamine used to
synthesize BMI. 4,4' Bismaleimidodiphenyl methane from the
diamine MDA is the most common and is commercially
available.
The aromatic nature of the BMI imparts thermal
stability to the resultant polymer while the imide moiety
adds rigidity. However, a major drawback of cured neat BMI
is its inherent brittleness due to a high crosslink density
and therefore, it is not used in structural applications by
itself. Bismaleimides are, therefore, reacted with aromatic
diamines to increase the molecular weight between
crosslinks, but at the expense of thermal stability. The
type of diamine used as a chain extender can vary depending
upon the properties required in a specific application.
The reactivity of the double bond in the maleimide
group is a consequence of the electron withdrawing nature of
the two adjacent carbonyl groups, which create an electron
deficient double bond. 19 Therefore, bismaleimides are very
susceptible to homopolymerization and co-polymerization.

2O
O
IIHC _C_
O
II/C-----CH
N--R'---N
/HC--C
II0
\C--CH
II0
wheFe(__CH2"--_ -
Figure 2.2. The general structure of BMI.

21
Generally, most BMI resins do not fully cure until they
reach temperatures of 205 to 260 °C.
2.3.2.3.1. Chemistry of BMI/Diamine
There are two chemical reactions that occur during the
polymerization of a bismaleimide with an amine: amine
addition and bismaleimide homopolymerization. 19 The amine
addition to the maleimide double bond, or the chain
extension reaction, occurs by a second order mechanism and
results in extension of the network chains. 2° Figure 2.3a
illustrates the chain extension reaction between BMI and a
diamine.
The second reaction, which occurs in the bismaleimide
polymerization, is the homopolymerization reaction of the
maleimide double bonds. It is a thermally initiated,
multistep radical mechanism that leads to crosslinking. 2°
Again, the maleimide double bonds of the bismaleimide are
weakened by the electron withdrawing nature of the adjacent
carbonyl groups and they readily react in the molten state
by free radical polymerization. 21 The homopolymerization
reaction of BMI is shown in Figure 2.3b.
The chain propagation of BMI is slower than the
initiation or termination steps and is therefore, considered
the rate-controlling step. 2° Since the amine addition is a
one-step reaction and occurs more rapidly than the chain
propagation of the bismaleimide homopolymerization, at low

22
O
II,/C--CH2
O
a.) Chain extension due to Amine addition
0
II I
.__ /C--CH--CH2 N I
C--CH O
0 HC--C_ _._HCl C/N CH2--
III ob.) Crosslinking due to homopolymerization
Figure 2.3 Chemical reactions that occur during the
polymerization of a bismaleimide with an amine: a.) amine
addition and b.) bismaleimide homopolymerization.

23
temperatures, the chain extension reaction is favored over
the homopolymerization reaction. However, the propagation
reaction becomes competitive with the amine addition
reaction at high temperatures.
The rates of amine addition and homopolymerization
reactions determine the network topology during the early
stages of cure. The amine addition is an order of magnitude
faster than the BMI homopolymerization reaction and occurs
until most of the amine is consumed, which reduces the
crosslink density of the final network. 2°'22
2.3.2.3.1.1. temperature effects
The two reactions have different effects on the
topology of the network formed. The nucleophillic addition
of the amine to the maleimide double bond occurs readily at
low temperatures. Tungare and Martin 2° found that the amine
addition occurs at 125 °C and that above 150 °C, the
crosslinking reaction competes with the chain extension
reaction. Donnellan and Roylance, 5 determined from FTIR
analysis that only the chain extension reaction occurs
readily up to 145 °C. In the temperature range of
approximately 130-180 °C, chain extension is favored over
the homopolymerization or crosslinking reaction. This does
not mean that some initial crosslinking does not occur,
however.

24
During a high-temperature cure, at greater than 180 °C,
both reactions occur simultaneously, but with different rate
constants. This leads to the formation of a fully connected
network at the gel point. The reactions continue to occur
but become diffusion controlled rather than chemically
controlled. 23
Cure to completion in bismaleimides is often not
possible because conversion of liquefied monomer to a highly
crosslinked glassy matrix is limited by the restricted
translational movement of unsaturated imide groups. 24 The
cure reaction ceases at a certain degree even though there
are many active functional groups still present. The bulk
viscosity increases with the increase in chain branching,
and finally crosslinking, which restricts the mobility of
the functional groups.
With two different reactions, one may use different
temperature regions for cure. In the low-temperature
regime, the amine addition reaction will predominate. In
the high-temperature region, both the amine and
homopolymerization reactions can occur, possibly resulting
in a tight, inflexible network. Finally, with a two-step
cure, the amine addition reaction can occur at low
temperatures followed by the homopolymerization reaction at
high temperatures.

25
2.3.2.3.1.2. transition temperature
The temperature of cure plays a very important role in
forming the network. As the cure proceeds at a given
temperature, a network develops and its Tg increases.
However, when the Tg of the network reaches the cure
temperature, the rate of further cure or crosslinking is
drastically reduced because of the slowing of reactant
diffusion. If the specimen is then heated to above its
original cure temperature, additional curing may occur.
Therefore, the cure temperature should be higher than the
maximum use temperature if a stable network is desired
25during testing.
The glass transition temperature is a property that can
be used to estimate network development and is dependent on
the curing chemistry of the resin. When a resin system
cures by only one reaction, the Tg is a function of the
extent of reaction or cure and is independent of curing
conditions. The curing of BMI resins involve two reactions,
amine addition and BMI homopolymerization. Therefore, the
glass transition temperature is dependent on two types of
reaction, which in turn, are dependent on resin composition
and curing conditions.
For a particular cure temperature, Tg initially rises
as a function of cure time, but eventually reaches a
limiting value. The magnitude of this value depends on the

26
cure temperature: the higher the cure temperature, the
higher the final Tg.
With additional heat, such as that applied during
postcuring, the Tg of a material prepared by a low-
temperature cure can attain and surpass that of a
corresponding intermediate-temperature cured material. When
postcured, the unreacted BMI molecules undergo
homopolymerization and network rearrangement. Therefore, a
large, rapid increase in Tg is observable.
Tungare 22 showed by experimentation and computer
modeling that a significant increase in Tg is observed from
the cured state to the postcured state. The large
difference in T_ occurs due to the curing conditions or
cure-path dependence of the network. During a short-time,
low-temperature cure, most of the amine is depleted with
BMI. However, some BMI remains unreacted in the resin. The
unreacted BMI in the polymer reacts with the previously
extended chains during the postcuring reaction and the Tg
increases dramatically. During a long-time, low-temperature
cure more BMI is consumed. Therefore, there is less
opportunity for crosslinking during postcure and the Tg does
not increase as much as in the previous case.
Several researchers have used thermal and mechanical
properties to characterize the state of cure of BMI to
determine the cure path dependence of the properties. Leung

27
et al. 26 found that the Tg, tensile stress, and fracture
energy increased as the cure temperature increased from 130
°C to 180 °C, even though the extents of reaction, as
determined by DSC, were the same. Therefore, they concluded
that different network structures formed at different curing
temperatures.
2.3.2.3.1.3. reactant ratios
Resin composition governs the rate of amine addition
and BMI homopolymerization reactions. Stoichiometric
reaction of BMI and a diamine leads to the formation of
linear chains with few crosslinks. 27 With BMI in excess,
the coreaction of BMI with a diamine results in a
crosslinkable resin.
Leung et al. 28 determined the effects of resin
composition on Tg. As the concentration of BMI increases
from I:I to a 2:1 mole ratio, the Tg increases. Tung29
measured the fracture energy of various BMI/MDA copolymers
at two different cure temperatures. The fracture energy
decreased as the concentration of BMI increased. Fracture
energy increased with the two-step cure temperature over
just high-temperature cure alone.
2.3.2.3.2. Chemistry of BMI/Alkenylphenols
Because BMI is inherently brittle when reacted with
itself, diamines have been used to increase the molecular
weight between crosslinks. In recent years, chain extenders

28
other than diamines have also been developed and reacted
with BMI in order to lengthen the chains between crosslinks.
A new system was introduced by Ciba-Geigy in the 1980's,
which consists of a two-component bismaleimide resin: 4,4'-
bismaleimidodiphenyl methane (BMI) and o,o'-
diallylbisphenol A (DABA). The structure of DABA is shown
in Figure 2.4. This figure shows the common bisphenol A
with two allyl functions attached to it. This system is
attractive because DABA is a liquid at room temperature and
will facilitate the melting of BMI when heated to the
appropriate temperatures.
Morgan et al. 3° report that the reaction scheme for
BMI/DABA consists of an addition reaction occurring between
the allyl groups that are attached to an aromatic ring and
the double bond of the maleimide. These will undergo an
'ene' type linear chain reaction. The resulting
"substituted styrene" undergoes a Diels-Alder reaction with
another maleimide group. The reaction of a diene with a
dienophile, resulting in a ring-containing compound is the
Diels-Alder reaction. Once the two components have reacted,
the BMI/DABA 'ene' adduct prepolymer is considered
pentafunctional: three double bonds, capable of chain
extension and crosslinking and two hydroxyl groups, capable
of etherification by hydroxyl dehydration. A schematic of
this pentafunctional prepolymer is shown in Figure 2.5.

29
CH2=CH.ell2\ CH 2_ CH_ ell2
HO i OH
CH 3
o,o'-Diallyt bi_ol A
(DABA)
Figure 2.4. The chemical structure of DABA.

3O
/ CH2
0% C_ N/_
/ \CH
/ \c/C_oH2% * CH2
H% HC/ H2
H2C CH//*
CH3
* "ENE" double bond polymerization
** BMI double bond polymerization
Figure 2.5.
prepolymer
Schematic
of BMI/DABA.
illustration of the pentafunctional

31
2.3.2.3.2.1. temperature effects
There are three temperature ranges associated with the
cure reactions in the BMI/DABA system, as determined by FTIR
spectroscopy and DSC:3° i.) 100-200 °C, 2.) 200-300 °C, and
3.) 300-350 °C. In the 100-200 °C range, the _ene' reaction
occurs between the allyl groups and the double bond of the
male imide. There are three active double bond sites capable
of polymerization, as well as two hydroxyl groups, making
the prepolymer a pentafunctional chain.
In the 200-300 °C range several reactions occur in the
following sequence: I.) _ene' reaction at a significant
rate, 2.) BMI homopolymerization, which occurs at
approximately 210 °C, 3.) _ene' homopolymerization and the
Diels-Alder reaction, at approximately 255 °C, and 4.) Above
240 °C, dehydration of the hydroxyl groups that form ether
crosslinks.
In the 300-350 °C range, further cure occurs as the
test temperature approaches the glass transition temperature
of the material. Therefore, by manipulating the curing
temperatures, the network topologies may be controlled for
the BMI/Alkenylphenol system.
Recently there has been some debate over the reaction
of BMI with DABA. The reaction mechanism is not necessarily
in question, but the temperature ranges over which these

32
reactions occur are in doubt. Mijovic and Andjelic 31
determined with FTIR spectroscopy that the principle
reaction in the temperature range of 140 to 200 °C was the
copolymerization between the maleimide and the allyl double
bonds, a chain extension _ene' reaction. They determined
that the _ene' reaction was the only one that involved
double bonds below 200 °C until all of the double bonds were
consumed. At about 180 °C, the etherification reaction
involving two -OH groups occurs, which controls the
crosslink density of the system. Finally, at temperatures
above 200 °C, the homopolymerization reaction of BMI occurs.
Yet regardless of the number of specific chemical reactions
occurring, BMI/DABA is basically considered a two-step
reaction: chain extension by an 'ene' reaction and BMI
homopolymerization.
2.3.2.3.3. Mechanical Properties of Bismaleimides
Because of the need to fulfill aerospace needs, many of
the polyimides synthesized have been mechanically tested at
room temperature and at the upper use temperature. Strain
rates and test temperatures have not been extensively varied
to determine the viscoelastic properties. As with epoxies,
investigators have studied BMI with different chain
extenders by varying the resin composition, cure schedule,

33
and cure history to determine the room temperature
mechanical properties.
Tung et al.29found that the fracture energies for
samples that were cured by a two-step process were higher
than the fracture energies for samples cured only at high
temperatures. They attributed the difference in fracture
energies for a given mole ratio to network topology
differences.
Donnellan and Roylance 6 also investigated the effects
of changing the resin composition and cure schedule on BMI
and MDA. They found that by increasing the amount of BMI in
the composition the density, yield stress, and modulus
increase while the free volume and fracture toughness
decrease. The ability to yield is the controlling factor in
fracture toughness. Yielding induces crack tip blunting
which increases the energy needed for a crack to grow.
Compact tension fracture toughness data from Donnellan
and Roylance 6 was replotted in this investigation as
fracture energy versus the molecular weight between
crosslinks, derived from theological data, and a _ -power
dependence was obtained, Figure 2.6. This is the same
result observed by LeMayI for epoxies even though LeMay
plotted the log of the arrest values of fracture energies
versus the log of the molecular weight between crosslinks,
calculated from measurements of rubbery modulus. This

34
E
v
0
-3.6
-38
40
42
44
' ' ' ' I ' ' ' ' I '
BMI:MDA
1/2
©
Data from Donnellan and Roylance
Poly. Eng. Sci., 3_22,415, (1992)
I I I I
Data replotted according to LeMay (1985)I , i , , I a , , ,
2.0 2.5 3.0 3.5
log Mc
Figure 2.6. Compact tension fracture energies data from
Donnellan and Roylance's investigation versus the molecular
weight between crosslinks, derived from rheological data,
resulting in a _ -power dependence.

35
implies that the ductile yielding occurring at the crack tip
controls the ultimate fracture properties of the BMI/MDA
system.
The mechanical properties of DABA from various
investigators have been hard to correlate with each other.
The curing conditions all vary from study to study. Some
investigators have even reported mechanical properties as a
function of DABA without specifying cure conditions. 32 Ciba
Geigy has recommended specific molar ratios and curing
conditions when using their products. Generally, the room
temperature mechanical properties for each formulation are
similar. System II, (1:0.87 BMI:DABA) usually exhibits the
highest fracture toughness and strength over the other
formulations investigated. 33 Overall, according to
Stenzenberger 32 the fracture energy increases with
increasing amounts of DABA up to approximately 40% DABA
while the modulus in flexure remains constant with
increasing amounts of DABA.
2.4. Advanced Polymer Characterization Techniques
2.4.1. Continuous and Intermittent Stress Relaxation
When a polymer is tested above its Tg at several strain
levels, in the rubbery state, the stress will decrease with
time to asymptotic values. The plateau stress can be
plotted against the strain values to obtain a near-

36
equilibrium stress-strain curve. The slope of this stress-
strain plot is inversely proportional to Me.
Stress relaxation experiments are also used to evaluate
separately the effects of chain scission and crosslinking of
polymers as they are related to changes in stress. 34 Stress
will diminish with time during stress relaxation. In a
continuous stress relaxation experiment, a constant
deformation is applied to the specimen while the retractive
force and changes in the retractive force with time are
recorded. The force usually decreases with time.
Initially, the decline is large due to conformational
changes and alignment of polymer chains. 35
Crosslinking reactions make no contribution to the
retractive force measured by continuous stress relaxation. 3s
For example, when a sample is "aged" at constant elongation,
chain scission will result because a number of the chains
will not be able to support the applied stress. If
crosslinks do form in the stretched state, they will not
contribute to support the stress.
Continuous and intermittent stress relaxation
experiments are performed as complementary tests. In an
intermittent stress relaxation experiment, the specimen is
maintained in a relaxed, undeformed condition at the
appropriate test temperature. 35 At widely spaced time
intervals, a predetermined fixed deformation is applied to

the specimen and the instantaneous stress is measured.
specimen is unloaded until the next "time" at the
37
The
appropriate test temperature. If the material is "aged" in
the unstretched state and then stretched, the stress will
reflect both chain scission and crosslinking. The peak
value of stress at the different time intervals are recorded
and plotted against the continuous stress relaxation
experiment at the same fixed deformation.
In general, during an intermittent stress relaxation
experiment, the sum of bond scission and crosslinking
reactions is determined. When these reactions are equal,
the peak values of stress are constant as a function of time
and reversible network degradation is observed. If the peak
values of stress diminish with time the bond scission
reactions are predominant. Only irreversible network
degradation occurs - no rearrangement reactions and no
crosslinking reactions of any consequence are occurring. In
this case, the continuous and intermittent stress relaxation
curves have the same stress values with time. The peak
values of stress increase with time when crosslinking
reactions are predominant. 35 Crosslinking reactions are
detected by intermittent stress relaxation with an increase
in retractive forces because the network density increases
while the continuous stress relaxation experiment is
unaffected.

38
2.4.2. Frequency-Dependent Impedance Sensing Techniques
FDIMS techniques are useful characterization methods,
which monitor the cure process of both thermoplastics and
thermosets. 3_ Dielectric analysis is one of the few methods
available for studying the molecular properties of both
solid and liquid states by using frequency dependence in the
Hz to MHz range to separate the ionic and dipolar
mobility. 37 This method of characterization is able to
continuously monitor the curing process from a monomeric
liquid to a crosslinked, insoluble high-temperature solid
in-situ and relate the electric measurements to chemical
changes in the polymeric structure. 38
In structure-property relationship investigations, the
mechanical and rheological properties of a material can be
associated with macroscopic scale processes. Spectroscopic
analysis such as FTIR focuses on the molecular or
microscopic level. Dielectric analysis measures both the
macroscopic and microscopic levels of polymeric behavior.
Microscopically, dipoles orient during an alternating field.
Macroscopically, the viscosity of the system and the
tightness of the network as chains form affect the dipole
orientation. 39 Dielectric analysis, however, has its weak
points. There are insufficient models available to aid in
the interpretation of data and a lack of correlation between

39
the data and other material characterization methods such as
mechanical measurements. 4°
2.4.2.1. Electric Dipole Moments and Polarization
Dipole moments are called permanent electric dipole
moments. 41 Dipole moments form in nonconducting molecules
as a result of asymmetry of charges in the bonding electrons
when atoms of different electon-negativities join, unequal
sizes of the two orbitals being joined, or as the result of
the hybrid character of the orbitals.
In an electric field, the nonconducting molecules'
electrons will shift in the positive direction of the field.
No continuous flow of electrons will occur since the
electrons are centered about the nuclei. If the electric
field is alternating, the electron cloud will "sway" back
and forth, pivoting about its nucleus to keep up with the
changing field. The nucleus will move in the negative
direction, opposite to the direction of the electron cloud.
As a result of movements of the positive nucleus and
the negative electrons, a polar atom is produced. 42 A
molecule with positive and negative charged ends is called a
dipole. In a very strong field, electrons can become
displaced from the atom to produce ions.
Nonpolar molecules have symmetry of the distribution of
charges and no permanent moment exists. Nonpolar molecules
can acquire a dipole moment in the presence of an
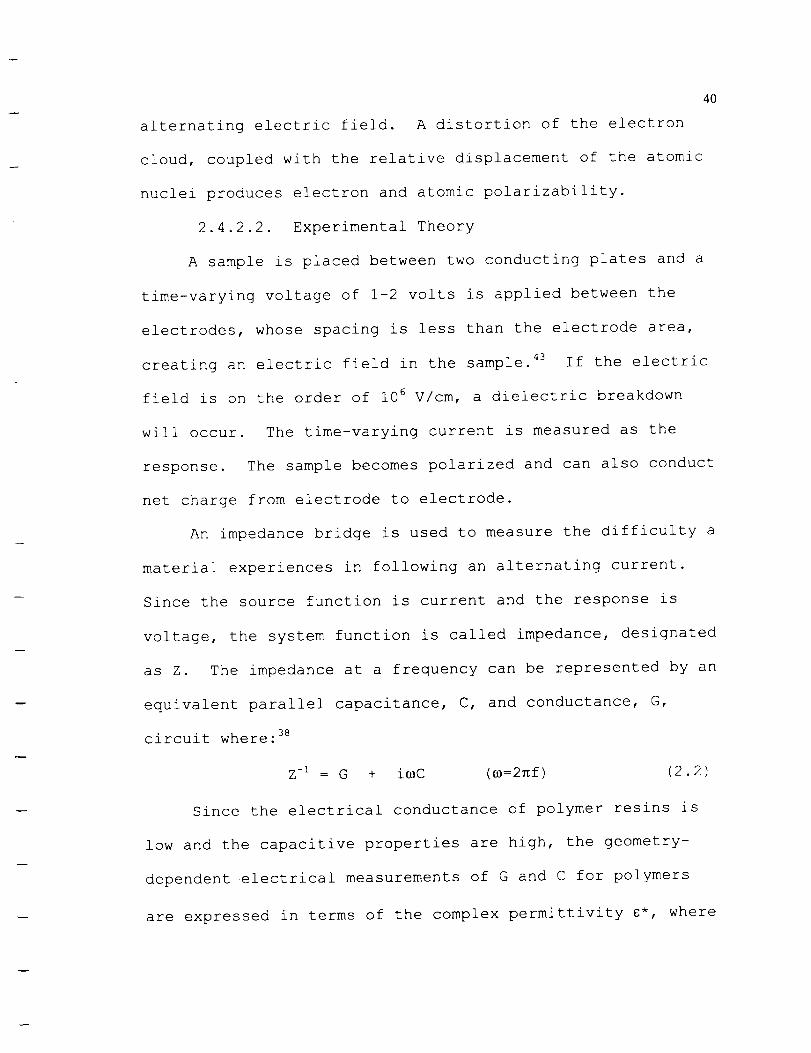
4O
alternating electric field. A distortion of the electron
cloud, coupled with the relative displacement of the atomic
nuclei produces electron and atomic polarizability.
2.4.2.2. Experimental Theory
A sample is placed between two conducting plates and a
time-varying voltage of 1-2 volts is applied between the
electrodes, whose spacing is less than the electrode area,
creating an electric field in the sample. 43 If the electric
field is on the order of l0 GV/cm, a dielectric breakdown
will occur. The time-varying current is measured as the
response. The sample becomes polarized and can also conduct
net charge from electrode to electrode.
An impedance bridge is used to measure the difficulty a
material experiences in following an alternating current.
Since the source function is current and the response is
voltage, the system function is called impedance, designated
as Z. The impedance at a frequency can be represented by an
equivalent parallel capacitance, C, and conductance, G,
circuit where: 38
Z-I = G + i_C (_=2_f) (2.2)
Since the electrical conductance of polymer resins is
low and the capacitive properties are high, the geometry-
dependent electrical measurements of G and C for polymers
are expressed in terms of the complex permittivity _*, where

_* = c' - i_". The complex permittivity is defined as the
vector sum of the in-phase and out-of phase permittivity,
analogous to G' and G" in dynamic mechanical testing. When
a time-varying electric field is applied to a material, the
dielectric constant, _, can then be regarded as a complex
number. _' is the dielectric permittivity or the storage
component and _" is the dielectric loss factor or the loss
component. Furthermore, _' and _" can be expressed as:
41
c' (_)= C(o)material (2.3a)Co
c" (_): G (_)material (2.3b)
C. 2_f
where Co is the air-filled capacitance and f is the measured
frequency.
Two types of molecular processes contribute to the
impedance of a resin: 38 ionic and dipolar. The impedance of
a resin is determined as a function of frequency in terms of
the molecular processes. Both the real and the imaginary
parts of _* have a dipolar and an ionic component.
+ s' (_)± (2.4a)
+ s"(_)i (2.4b)
The dipolar component contributes to the impedance
signal at high frequencies and in viscous mediums. The

42
dipolar component is due to rotational diffusion of dipolar
moments and bound charges. The dipoles of a curing resin
that are contained in a viscous medium, are hindered by
being attached to a growing network and therefore, can't
keep up with the alternating electric field. The time
measured for rotational mobility of the dipoles is the
dipole relaxation time, _d. Early in the cure, _d is short.
When dipolar molecules can align with the electric field
perfectly to the maximum extent possible, usually at low
frequencies, the permittivity is considered the relaxed
permittivity and is denoted as gr. As the cure proceeds,
chains become longer , the resin vitrifies, and Zd is long.
The high frequency permittivity value is considered the
unrelaxed permittivity and is denoted as gu. Because the
growing chains cannot keep up with the alternating electric
3_field, there is a hindrance mechanism or an energy loss.
The ionic component dominates at low frequencies, low
viscosities, and/or high temperatures. 38 The ionic
component is governed by ion charge diffusion, the hindered
translation of mobile ions, and the interaction of these
ions with other charged species. The conductivity, _, is an
experimentally determined parameter that measures
translational mobility of ions.

The frequency dependent dipolar components and the
contribution due to conductivity for a single relaxation
time may be expressed as:
, £r --£u£a + £ui
(1 + i W r.)
o- --£_-- +
0-) £'o 1 + (&O Ta )2
43
(2.5a)
(2.5b)
where gr and gu are the limiting low and high frequency
values of g*, o is the ionic conductivity in (ohm cm) -l,
is the angular frequency, and Td is the single relaxation
time. This is an ideal representation of the dipolar
contributions to permittivity and loss factor. In most
systems, a distribution of relaxation times is observed due
to the presence of more than one polar species, the
asymmetric shape of the polar groups, and intra- and
intermolecular forces. 3s
By plotting _' versus g", the frequency dependence of
g' and g" is determined. This is called a Cole-Cole plot. 39
When conductivity or ion mobility does not contribute to the
loss factor and a single relaxation time is observed, a
perfect semi-circle will result with gu and gr as the
endpoints and the maximum value of _" is less than gu-gr/2.
As the conductivity contribution to the loss factor
increases the semi-circle of the Cole-Cole plot becomes less

44
circular. The Cole-Cole plot also reveals details about the
distribution of relaxation times. If the semi-circle plot
is skewed at the high permittivity end of the plot, a
distribution of times may be responsible. Finally, if the
semi-circle passes through the origin, no blocking layer
occurs on the electrode. 43
2.4.2.3. Dielectric Measurement Techniques
Permittivity, _', is a measure of the degree of
alignment of dipoles and is a function of the strength,
amount and mobility of dipoles in a resin. 44 Permittivity
values usually begin at a high level during cure because
initially, the liquid resin contains a high concentration of
highly mobile dipoles. As the material hardens, the
permittivity values decrease because the dipole motion is
restricted by network formation.
The dielectric loss factor, analogous to the loss
modulus, G", can be considered the change in dissipated
energy when an alternating electric field is applied between
capacitor plates that hold the material during the cure
cycle. The loss factor, _", is a measure of the energy
required to align dipoles and move ions. The loss factor is
the sum of both dipole motion and ionic conduction: 45
_" = _/_o + dipole terms (2.6)

where _" is the loss factor, _o is the permittivity of free
space (8.854 picoFarads/m), _ is 2_f, where f is the
frequency of measurement, and _ is the bulk ionic
conductivity. At low frequencies, the dipole terms become
negligible.
of ionic impurities in the material, is frequency
independent, and is very sensitive to network changes. At
the beginning of cure, the ion mobility is high and
therefore, ionic conductivity is high. Before gelation,
is inversely proportional to the viscosity. As the cure
proceeds, the ionic conductivity decreases because the
mobility of ions decreases due to a highly crosslinked
network. Ionic conductivity can be used to follow the
"tightening of the crosslinked matrix until the very end of
the reaction. ''4°
2.4.2.3.1. Parallel Plate Electrodes
The simplest way to measure the dielectric properties
of a resin is with a parallel plate electrode
configuration. 43 A sample is placed between two closely
spaced conducting plates. The advantage of this type of
electrode is the simple analysis of the phase angle and
amplitude. The disadvantage of this type of electrode is
the need to control the plate spacing and electrode area in
order to measure _' and _". During cure, materials will
45
The ionic conductivity, a, arises from movement

46
undergo shrinkage. It is then hard to maintain calibration
of the space between the plates. Therefore, this type of
electrode is not useful in monitoring thermosets in-situ.
2.4.2.3.2. Comb Electrodes
By using an interdigitated or comb design for an
electrode circumvents the problem associated with the
parallel plate electrodes. 43 Electrodes are fabricated on
an insulating substrate such as ceramic to prevent the
variable geometry changes due to curing or applied pressure.
The major advantage with this type of electrode is its
reproducibility or calibration, miniaturized integrated
circuit, and ease of use in composite manufacture.
Calibration is insensitive to applied pressure or
temperature changes. The disadvantage of this electrode is
that it is less sensitive than the parallel plate design.
2.4.2.3.3. Microdielectrometry
Microdielectrometry was developed by Senturia and
became commercially available in 1983. 43 Geometry-
independent electrodes allows for the measurement of
impedance instead of admittance. Since impedance is
measured, measurements can be made at low frequencies.
The electrode used in microdielectrometry is an
improvement over the comb electrode. The electrode combines
a pair of field-effect transistors on the same plane of the
silicon integrated microcircuit electrode. The sample is

47
placed over the electrode surface. The electric properties
measured generate an excitation signal at a given frequency.
The change in gain and phase is the response and that is
converted into _' and _" by a calibration contour plot.
Amplification of the signal is required because the
electrode geometry is less efficient than the parallel plate
configuration. A thermal diode is also located on the
electrode to measure changes in temperature during the
experimentation. Sensitivities of measurement are
comparable to the parallel plate electrodes without worrying
about the spacing between electrode plates. This was the
technique utilized in the present investigation.
2.4.2.4. Dielectric Analysis of Polymeric Networks
During Cure
Dielectric analysis is a means of characterizing cure
processes by non-destructive methods. Many researchers have
used dielectric analysis to determine processing windows,
curing parameters, and to gain insight into ionic mobility
with temperature. 38'43 The common thread of cure monitoring
for any thermosetting resin is that when chemical reaction
starts, the loss factor increases gradually until a maximum
is reached. Onset of crosslinking is indicated by a rapid
decrease in loss factor due to a decrease in ionic mobility.
Finally, when the slope of the loss factor is zero, cure is
complete. 4°

48
2.4.3. Polymer Modelinq
2.4.3.1. QSPR
The purpose of modeling or computer simulation is to
provide estimates of polymer properties by empirical
methods. 46 Biosym Technologies, Inc. produces computer
simulation software with Insight II user interface. The
software contains two modules to estimate properties of
polymers: QSPR and Synthia. QSPR is the acronym for
Quantitative Structure Property Relationships, which is a
method based on group additivity. Selected molecular groups
contribute to the polymer property of interest, independent
of the environment. A physical/chemical property of a
polymer system is assumed to be the scalar sum of the
property for each group of the entire polymer. The more
groups recognized within the polymer, the more accurate the
estimated properties. Therefore, QSPR requires a 'group
property' database. The estimation of properties is based
on additive molar functions. Some of the properties that
can be estimated are molar mass, cohesive energy, and Tg.
Again, the estimation of properties depends on how many
groups of the polymer system are recognized by the computer
software program. QSPR, however, does not provide an
insight into atomistic calculations nor can the program
4Gaccount for special interactions.

49
Wi<hin the QSPR module, are two complementary
techniques: Dow and van Krevelan. Using empirical and
semi-empirical relationships to predict the properties of
amorphous polymers, the Dow technique depends on the
contribution of six groups. 46 The van Krevelan methodology
is based on the calculations of various molar properties of
the average repeat unit.
2.4.3.1.1. Dow
The Dow methodology tries to limit the database of
group contributions by relating the amorphous polymer
properties of the repeat units to molecular properties such
as cohesive energy, molecular size, and chain mobility. For
example, the mechanical properties of a polymer can be
determined from the interaction energy between the repeat
units of the polymer. All properties calculated by the Dow
methodology are based on cohesive energy, which is the net
attractive force of interaction and the van der Waal volume
that is proportional to interaction distances of the atoms.
2.4.3.1.2. van Krevelan
The van Krevelan approach is based on molar properties
of the average repeat units, which are then used to
calculate the macroscopic properties. The molar properties,
such as cohesive energy, mass, or number of backbone atoms,
are summed over the entire polymer, group by group, and then
that sum is divided by the total number of repeat units.

50
The van Krevelan approach can calculate more properties for
amorphous and semi-crystalline polymers, but requires a much
larger database of group contributions. Properties that can
be estimated are: thermophysical, mechanical, ultimate
mechanical, transport, electrical, optical, magnetic, and
thermal stability. The van Krevelan methodology however,
cannot be used for new types of polymers that are not in the
'group property' database nor can it improvise and predict
new properties.
The two methodologies described above are fast and easy
to use, especially if all the groups within the polymer are
contained in the database of _group contributions'. If the
polymer contains a group that is not recognized by the
database, then the properties of that polymer can not be
determined. For example, neither approach recognizes the
-NH group nor the maleimide group attached to a benzene
ring, both of which are present in the bismaleimide system.
A program named Synthia was developed, based on connectivity
indices to predict and estimate thermodynamic, mechanical
and transport properties of bulk amorphous polymers.
2.4.3.2. Synthia
Synthia, developed by Dr. Jozef Bicernano of Dow
Chemical Company, utilizes topological information about the
polymer instead of group contributions to predict properties
of the polymer. 4G Properties of polymers containing any of

51
the nine following elements can be estimated: C, H, O, Si,
S, FI, Cl, and Br.
Connectivity indices based on graph theory are used to
estimate properties of amorphous polymers. The repeat unit
is represented as a hydrogen-suppressed graph. Zeroth (0th)
and the first (Ist) order connectivity indices are the basic
structural descriptors of the model. The 0th order atom
indices can be described in terms of two atomic indices (6
and BY). _ describes the number of non-hydrogen atoms
bonded to the specific atom while 8v describes the numerical
characterization of the electronic configuration of the
atom. 5v is given by the following equation:
l;:)6 u = - NH (2.7)Z r -1
where Zv is the number of valence electrons, NH is the
number of hydrogen atoms attached, and Z is the atomic
number of the atom.
Once the atomic indices have been determined for an
atom then the Ist order bond indices have to be defined in
fl,j: 6,6j ( 2.8 )
and
v _,' V
fl,s: 6, @j (2.9)
terms of the atomic indices:

52
After the atomic and bond indices are defined for the
repeat unit, the connectivity indices for the polymer chain
may be characterized and then later correlated to the
polymer properties. The zeroth-order (atomic) indices are
given as the summation of 8 and 5v:
Oz =E_ (2.10)
The first order
polymer molecule is described in terms of:
I
lz =EX/_
(bond) connectivity indices for the
(2.11
lz :_-_ 1
(2.12
(2.13
These connectivity indices are augmented by other
descriptors such as the number of different types of groups
or the number of different atoms and repeat unit lengths.
The connectivity indices are then correlated to extensive
and intensive properties. 46 Extensive properties of a
polymer are properties that depend upon the size of the
system and the amount of material present. These properties
include the molar mass and cohesive energy. Intensive
properties are properties that are independent of the amount

53
of polymer present. The two general forms of properties
are:
Property) : ZOX + (extensive structural parameters, and(Extensive
atomic correction terms)
and
(Intensive Property) = Zb + (intensive structural parameters, and
atomic correction terms) + constant
The structural parameters are combinations of connectivity
indices and geometrical parameters that are used in the
correlations of certain properties. The atomic group terms
are dependent upon the number of certain atoms that are
present.
Synthia may be used for isotropic, unoriented amorphous
atactic polymers and alternating, random copolymers as long
as the repeat unit is correctly represented. This approach
allows the input of known measurements such as Tg or density
to produce more accurate results or predictions of the
polymer and no dependence of molecular weight on properties.
There are certain types of polymers that are beyond the
scope of Synthia. These are polymers that contain additives
or impurities, are crosslinked, or display some type of
tacticity, orientation or ordering.

CHAPTERIII
EXPERIMENTALDETAILS
3.1. Introduction
3.1.1. Experimental Materials
3.1.1.1. Bismaleimides
The bismaleimide used in this study was Compimide Resin
MDAB or N,N'-bismaleimido-4,4'-diphenylmethane (BMI) and was
commercially obtained from Shell Chemical Co. The molecular
weight of BMI is 358.36 g/mole with a melting point of
approximately 155 °C. The BMI consisted of a fine, yellow
powder at room temperature with a purity of greater than 90
%wt and contained no free methylene dianiline. The chemical
structure is shown in Figure 3.1. The aromatic content of
the BMI adds to the high-temperature stability while the
imide moiety imparts rigidity to the resin.
Bismaleimides, when cured alone, are very brittle due
to the high crosslink density. To increase the flexibility,
BMI is reacted in excess with an aromatic diamine to reduce
the crosslink density and to ensure a final product
susceptible to crosslinking.
54

55
O
O
O
Figure 3.i. chemical structure o_ _,N'
diphenyl methane (BMI_-
bismaleimid° 4,1

56
3.1.1.2. Crosslinking Agents
Three different crosslinking agents were used in this
study: 4,4' - methylene dianiline (MDA), 4,4'-
diaminodiphenyl sulfone (DDS), and o,o'- diallyl bisphenol A
(DABA). The structures of the three crosslinking agents are
shown in Figure 3.2.
MDA is an aromatic primary diamine with a molecular
weight of 198.29 g/mole and a melting point of 89 °C. The
MDA was purchased from Lancaster Synthesis of Windham, New
Hampshire and existed as yellow flakes.
The DDS is a tetrafunctional aromatic amine crosslinker
with a molecular weight of 248.30 g/mole and has a melting
point range of 175-178 °C. DDS, a white powder at room
temperature, was purchased from Aldrich Chemical Company and
has a purity of 98-99%, and required no further
purification.
The third crosslinking agent was o,o'-diallyl bisphenol
A (DABA), commercially available under the trademark
Matrimid 5292 from Ciba-Geigy. The DABA is an amber, high
viscosity liquid at 25 °C.
3.1.1.3. Chemistry - BMI/MDA and BMI/DDS
The chemical reactions between BMI and MDA are
temperature dependent and have different effects on the
topology of the network formed. The amine addition to the
maleimide double bonds is a chain extension reaction and

57
H2N CH2 H2Na.) 4,4'-Diaminodiphenyl methane
(MDA)
H2N SO2 H2Nb.) 4,4'-Diaminodiphenyl sulfone
(DDS)
c.) o,o'-Diallyl bisphenol A
(DABA)
Figure 3.2. Chemical structures of the crosslinking agents
used in this study: a.) 4,4'-diaminodiphenyl methane (MDA),
b.) 4,4'-diaminodiphenyl sulfone (DDS), c.) o,o'-diallyl
bisphenol A (DABA).

58occurs by a second order reaction mechanism. "Thermal" or
BMI homopolymerization, occurs with the opening of the
double bond above 180 °C. The two reactions are shown in
simplified form in Figure 3.3. These two reactions would
also occur for the BMI/DDS system.
By processing these systems in three different
temperature ranges, three distinct types of network
structures are assumed to form: i.) low-temperature cure
so that only chain extension occurs, ii.) high-temperature
cure so that both chain extension and crosslinking occur
simultaneously, and iii.) low-temperature cure and then a
high-temperature postcure so that chain extension occurs to
completion, followed by crosslinking.
3.1.1.3.1. Reactant Ratios - BMI/MDA
Homogeneous formulations of three different
stoichiometric mole ratios of BMI to MDA were prepared and
investigated, i:i, 2:1, and 4:1. BMI alone was also
prepared and cured as a control material.
3.1.1.3.2. Reactant Ratios - BMI/DDS
Homogeneous formulations of two different
stoichiometric mole ratios of BMI to MDA, 2:1 and i:i, were
prepared and investigated.

59
O O
1
a.) Chain Extension Reaction
o 0
--N/_"_ \ J\N--
o o IIII II o
II I(0 0
o 0
II II
mN N--
_J _dII \ / IIo 0
b.) BMI Homopolymerization
Figure 3.3. Steps in the BMI/MDA reaction.
extension due to amine addition, b.) BMI
homopolymerization.
a.) Chain

6O3.1.1.4. Chemistry - BMI/DABA
The reaction scheme for BMI/DABA is complex. 4_ An
addition reaction occurs between the allyl groups that are
attached to an aromatic ring with the double bond of the
maleimide and will undergo an 'ene' type linear chain
reaction. This is shown in Figure 3.4. The resulting
"substituted styrene" then undergoes a Diels-Alder reaction
with another maleimide group. The reaction of a diene with
a dienophile, resulting in a ring-containing compound is
called a Diels-Alder reaction. Bismaleimides are highly
active bis(dienophiles). Once the two components have
reacted, the BMI/DABA 'ene' adduct prepolymer is considered
pentafunctional: 48 three double bonds capable of chain
extension and crosslinking, and two hydroxyl groups, capable
of etherification by hydroxyl dehydration. With an increase
in temperature, the double bonds can react with other
prepolymers or with BMI through a BMI homopolymerization
reaction.
3.1.1.4.1. Reactant Ratios - BMI/DABA
Homogeneous formulations of four different
stoichiometric mole ratios of BMI to DABA were prepared and
investigated: 2:1, I:I, 1:1.12, and 1:0.87. The latter
three formulations are the supplier recommended molar ratios
for BMI/DABA. 49

61
O O
II II
ff IIO O
_#-_R_ = 0_'-- Ci_iHs OH
a.) _Ene' Reaction
0
II
iL/=L oH <_'N _--<-Fc_-,__ o
o "-{- oII II
II II0 0
m.l_..
OH
c_ o o
_° °O_ C\NiC_---O
b.) Diels-Alder Reaction
Figure 3.4. Potential reactions in the BMI/DABA system.
a.) _ene' reaction, b.) Diels-Alder reaction, c.) BMI
homopolymerization, d.) Idealized pentafunctional
prepolymer.

62
O OII II
o ,J
N--
O o
c.) BMI Homopolymerization
o oII H
mc_----"HC--mc c..__cw__cm__r_%__'_ ___/_ /c-_cm _ I/N cm N •# \\ I- /--\ <-c _ ,,--_, _c--
HO'---_'_1_ 'P C'---_', ,}----OH 0II 0IICH3
*Double bondscapableof furtherreaction.
d.) Idealized Pentafunctional Prepolymer
Figure 3.4 cont. Potential reactions in the BMI/DABA
system, a.) _ene' reaction, b.) Diels-Alder reaction.
BMI homopolymerization, d.) Idealized pentafunctional
prepolymer.
c.)

3.1.1.5. PMR-15
Three 6 inch x 6 inch plates of PMR-15, produced at
NASA Lewis Research Center, were also investigated in order
to compare the results to the bismaleimide data. PMR
polyimides are addition curing thermoset polymers, based on
the monomers 5-norbornene-2, 3-dicarboxylic acid monomethyl
ester (NE), dimethyl ester of 3,3', 4,4'-
benzophenonetetracarboxylic acid (BTDE) and 4,4' methylene
dianiline (MDA). 5° The NE, BTDE, and MDA are combined in a
2.0/2.087/3.087 molar ratio to obtain norbornene endcapped
imide oligomers with a formulated number average molecular
weight of 1500. _I The norbornene endcaps react with further
heat to form a crosslinked network.
63
3.2 Raw Material Characterization
3.2.1. Dynamic Thermogravimetric Analysis/Fourier
Transform Infrared Spectrophotometer
A Fourier transform infrared spectrophotometer (FTIR)
interfaced with thermogravimetric analysis (TGA)
instrumentation allows the simultaneous quantification and
identification of evolved decomposition products. 52
TGA/FTIR was performed at NASA Lewis Research Center on BMI,
MDA, DDS, and DABA. This simultaneous analysis was
performed by coupling an Omnitherm TGA I000 with a BioRad
FTS-45 3200 Data Station. Samples were heated at a rate of

64i0 °C/min between room temperature and 700 °C in a flowing
nitrogen atmosphere.
3.2.2. Differential Calorimetry Spectroscopy
Differential scanning calorimetry (DSC) was performed
at NASA Lewis Research Center on BMI, MDA, DDS, and DABA to
determine the melting behavior of the resin and the
crosslinking agents. All measurements were made on a DuPont
Model 910 DSC instrument. Indium metal, whose melting point
is 156.6 °C, was used to calibrate the temperature control.
Samples weighing approximately 40 mg were placed in open
aluminum DSC pans and were heated at a rate of I0 °C/min in
a nitrogen atmosphere.
3.3. Network Preparation
3.3.1. Powder Technoloqy - BMI/MDA and BMI/DDS
The procedure for preparing the polymers was based on
an English patent by Bargain, 53 but with several processing
modifications. In this patent, a homogeneous mixture of
virgin powders was prepared and was spread on a plane
surface. The mixture was placed in a 200 °C oven for 7
minutes and then removed and allowed to cool. The product
was ground to a fine powder with a mean particle diameter of
80 zm. The powder was then placed in a mold and pressed at
200 °C with a pressure of 50 kg/cm 2 for 1 hour. The mold
was released at elevated temperatures to reduce the chances

65
of material shrinkage and possible breakage of the molded
material. The authors then suggest that the material should
be heated to 220 °C for 24 hours and then 240 °C for an
additional 24 hours. However, at these temperatures the
material experiences cure conditions that would promote the
BMI homopolymerization reaction.
In this investigation, virgin powders of BMI and MDA in
the appropriate mole ratio were initially mixed and placed
in a preheated glass beaker in a vacuum oven set at 95 °C,
just above the melting temperature of MDA. The MDAmelted
and "wetted" the BMI, producing a discontinuous phase (BMI)
within a continuous matrix (MDA). At the appropriate
consistency, the material was removed from the beaker and
placed on a preheated Teflon coated plate and placed in a
120 °C oven for approximately 7-10 minutes or until the BMI
melted. The plate with material was then removed from the
oven and allowed to cool to room temperature. Once cooled,
the gelled material was removed from the plate and broken
into small pieces. A mortar and pestle were used to crush
the pieces into fine powder, whose particle size was less
than 250 _m in diameter.
The criterion for powder sieving in this research was
that all the fine powder must pass through a 250 _m mesh
sieve into the three remaining levels: 212 zm sieve, 160 _m
sieve, bottom pan. The sieves were stacked in descending

66order of mesh size. The ground powder was placed in the
first sieve along with a number of Grade 25 stainless steel
ball bearings to aid in the powder flow. A lid was placed
on the top sieve and the entire stack of sieve layers was
sealed with electrical tape at the joints and placed in a
sieve shaker for approximately 20 minutes. After that time
powder remaining in the top sieve was removed and reground.
The process is repeated until all the powder has been forced
through the sieve with a mesh opening of 250 zm. The weight
of powder at each sieve level was determined before and
after screening to determine how much material is "caught"
by the procedure.
The process of manipulating the virgin powders in an
intermediate step is called "B-Staging" in industrial
circles. The B-staged powders were placed in appropriately
marked vials and stored in desiccators until needed for
molding or dielectric cure monitoring analyses.
3.3.1.1. Powder Characterization
3.3.1.1.1. Gel Point Determination
During the melting of a polymer, the viscosity
decreases. An increase in the viscosity with further time
indicates that the resin has begun to solidify. This is
considered the gel point. In fabricating the compression-
molded material, it is necessary to determine the time
required for material to reach its gel point. One method

67
for determining the gel point is based on the measurement of
the steady state viscosity of the liquid phase, ASTM D2471.
This method determines the time between initial mixing of
the reactants of a resin and the time when solidification
begins. _4
Approximately 4.2 grams of each powder were placed in a
5-dram vial for gel point determination. Three vials of
each powder were used to determine the average time and
standard deviation of the gel point. Each vial was
partially submerged in either a 140 °C or 220 °C oil bath,
depending upon the curing condition and the time required
for gelation was measured. Every 15 seconds the centers of
the vials were probed with an applicator stick. When the
material no longer adhered to the end of a clean stick, the
gel time was recorded.
3.3.1.1.2. TGA/FTIR
As with the original components, the B-staged powders
were characterized by TGA/FTIR at NASA Lewis Research
Center. The BMI/MDA and BMI/DDS powders were heated at a
rate of i0 °C/min between room temperature and 700 °C in a
flowing nitrogen atmosphere.
3.3.1.1.3. Differential Scanning Calorimetry
Differential scanning calorimetry (DSC) was performed
at NASA Lewis Research Center on appropriate mole ratios of
BMI/MDA and BMI/DDS powders prior to curing to determine the

68melting behavior of the B-staged powders. Samples weighing
approximately 40 mg were placed in open aluminum DSC pans
and were heated at a rate of i0 °C/min in a nitrogen
atmosphere.
3.3.2. Processing of BMI/MDA and BMI/DDS
3.3.2.1. General
An important processing variable that needs to be kept
constant in any investigation is the cure schedule. 2 The
cure schedule is considered the period of heating, which
affects the polymerization rate of the material. Cure
schedules are typically chosen such that further thermal
treatment will not cause changes in the network structures
or properties. The glass transition temperature, number
average molecular weight between crosslinks, and sol
fraction are a few characterization properties that can be
used to determine state of cure of thermosetting resins.
When a resin system cures by only one reaction, the Tg
is a function of the extent of reaction or cure and is
independent of cure schedules. The curing of BMI resins
involves at least two reactions, amine addition and BMI
homopolymerization. The glass transition temperature is
dependent on two extents of reaction, which are dependent on
resin composition and cure schedules. For example, Leung et
al. 26 found that the Tg and fracture energy of BMI/MDA in a
2.5:1 mole ratio increased as the cure temperature increased

69
from 130 °C to 180 °C, even though the DSC extents of
reaction were the same. They concluded that different
network structures formed during the different cure
schedules.
The rates of the amine addition and homopolymerization
reactions determine the network topology during the early
stages of cure. The amine addition is an order of magnitude
faster than the BMI homopolymerization reaction and
continues until most of the amine is consumed. 2_ For a
particular cure temperature, Tg rises initially as a
function of cure time but eventually reaches a limiting
value. The magnitude of this value depends on the cure
temperature: the higher the cure temperature, the higher the
final Tg.
During postcuring, the Tg of the low-temperature cured
material can attain and surpass that of material cured at
intermediate temperature. 22 At low temperature, the curing
reaction is mainly chain extension with few crosslinks.
When postcured, the unreacted BMI undergoes
homopolymerization and network rearrangement. Therefore, a
large, rapid increase in Tg occurs.
During a short time, low-temperature cure, most of the
amine is depleted with the BMI. However, some BMI remains
unreacted in the resin. The unreacted BMI in the polymer
crosslinks the previously extended chains during the

7Opostcuring reaction and the Tg increases dramatically over
the Tg of the "cured only" reaction. During a long time,
low-temperature cure more BMI is consumed. Therefore, there
is less crosslinking that can occur during the postcure and
the Tg does not increase as much as in the previous case.
Therefore, the cure schedule strongly affects the BMI
network and ultimately the Tg.
3.3.2.1.1. Differential Scanning Calorimetry
In order to get the appropriate time of cure at a given
temperature, B-staged powder samples of BMI/MDA and BMI/DDS
in the appropriate mole ratios were cured for varying
increments of time. These samples were used to determine
the percent conversion at 140 °C and 220 °C versus cure time
by DSC, which was performed at NASA Lewis Research Center.
Samples weighing approximately 20 mg were placed in open
aluminum DSC pans and were heated at a rate of i0 °C/min in
a nitrogen atmosphere.
The approximate states of cure for BMI/MDA and BMI/DDS
as a function of time and temperature were determined by
measuring the residual heat of polymerization of the
samples. This was accomplished by determining the percent
conversion versus time and temperature. The % conversion,
R, is given by:

71
R : AH1-AHxI00% (3.1
AH 7
where AH 7 is the total heat of reaction and AH is the
residual heat of polymerization.
This method is considered a rough estimate for the
extent of reaction because DSC analysis for bismaleimides is
not very reproducible, sometimes not discernible, and many
times not practical. $5 For some polyimides, DSC shows only
weak exotherms that are sometimes mistaken for noise.
3.3.2.2. Molds
The powders were consolidated in a 6" x 6" tool steel
mold at NASA Lewis Research Center. Figure 3.5 is a
schematic diagram of the mold. The mold consists of a U-
shaped bottom with two removable sides. The bottom of the
mold has four equidistant I/2-inch diameter holes that are
used to punch out the cured material. Two flat metal plates
are the support platforms for the curing material. The top
of the mold has lipped edges so that the top will rest on
the sides of the mold. A small hole, 1/16-inch diameter, 1
inch deep has been drilled into the side of the mold to
accommodate a thermocouple sensor to monitor the mold
temperature.

72
a
I I
I I
I
, I
Figure 3.5. Schematic diagram of the 6" x 6" tempered steel
mold, used to consolidate BMI/MDA and BMI/DDS powders. The
labels denote the following: a = mold lid, b = _U-shaped'
bottom mold with detachable sides, c = platform plates for
containing the powders.

73
3.3.2.3. Thermal Histories - BMI/MDA and BMI/DDS
Each BMI/MDA formulation was prepared using three
different cure cycles: 16 hr at a low temperature of 140 °C,
6 hr at a high temperature of 220 °C, or 16 hr at a low
temperature of 140 °C followed immediately by 6 hr at a high
temperature of 220 °C. Each BMI/DDS formulation was
prepared using only the high-temperature cure cycle of 6 hr
at 220 °C.
The thermal histories for the BMI/MDA and BMI/DDS are
listed in Table 3.1. The temperatures in the table refer to
the mold temperature and consequently, the material
temperature. The times listed are the periods of time that
the materials experience at that particular temperature.
A typical thermal history with pressure versus time is
shown in Figure 3.6. Cooling was not controlled because the
cured material was removed quickly from the mold to prevent
the cured material from cracking. Any constraint on the
cured material as it is cooling will cause stress cracks
throughout the material. Finally, any heat treatment below
the curing temperature such as heating the material at 105
°C in a vacuum oven for the elimination of residual water
was not deemed part of the thermal history.

74
Table 3.1. Cure and Postcure Schedules for the BMI/MDA andBMI/DDS Systems.
Time at the Indicated TemperaturesBMI:MDA
mole ratios 140 °C I 220 °C 140 °C/220 °CI
4:1 16 hr 6 hr 16 hr/6 hr
2:1 16 hr 6 hr 16 hr/6 hr
I:I 16 hr 6 hr 16 hr/6 hr
i:0 -- 6 hr --
BMI:DDS I
I:I -- 6 hr --
2:1 -- 6 hr --

?5
4O0
°_
o. 320
"-I(/}
Q)
n 240
e-
0
L,.
E
I--
160
80
.J]
m
J
' ' I ' ' I ' ' I
BMI:MDA 2:1
Low/High-Temperature Cure
-II
0
i r | _ i
| i
Temperature
Pressure
0 , I , I , , I , , I i ,
300 600 900 1200 1500
Time (min)
Figure 3.6. Typical thermal history and pressure profile
for BMI/MDA in a 2:1 mole ratio, cured for 16 hr at low
temperature and then postcured for 6 hr at high temperature.

763.3.2.3.1. Curing Procedure - BMI/MDA, BMI/DDS
The individual pieces of the mold were coated liberally
with MonoCoat E63FF 7A Chem Trend MultiRelease agent. When
dried, the sides of the mold were bolted to the bottom U-
shaped piece. Approximately 80 g of ground powder was
placed between the two platform plates. After the top lid
was placed onto the mold, the entire mold was inserted into
a preheated Wabash 12 ton press with a ram diameter of 4"
A thermocouple placed into the side of the mold was used to
monitor the mold temperature. Five minutes after the gel
point of the material was reached, slight pressure (i00
psig) from the platens was added and released several times
to squeeze out any trapped air in the material. The
pressure was then increased to 600 psi or 1800 psig for the
remainder of the cure schedule.
When the cure time was complete, the pressure was
released and the two sides were quickly removed. Flash that
flowed over the two platform plates was scored with a razor
blade prior to removing the mold from the press. The entire
mold was removed from the press and turned upside down. The
upside down mold was returned to the press and positioned
onto two 2" x I" x 8" aluminum bars, six inches apart.
Four 1.5" dia. stainless steel rods were placed into the
holes on the bottom of the mold. A flat 1/4" thick aluminum
plate was placed over the rods and the top platen of the

77
press was slowly lowered to push the plate and subsequently
the rods into the bottom of the mold, thereby forcing the
cured material, sandwiched between the platform plates out
of the mold. The two platform plates were removed, leaving
the cured material of BMI/MDA, BMI/DDS, or BMI. The cured
plate of material was stored in a desiccator until needed.
3.3.2.3.2. Postcuring Procedure - BMI/MDA
One of the thermal histories for BMI/MDA was 16 hr at
low temperature followed immediately by 6 hr at high
temperature. The material was not removed from the press
during the postcure. Pressure was slightly decreased (1500
psig) in case of material expansion during heating. The
cured material was removed at the end of the cure schedule
and then cut into testpieces.
3.3.3. Synthesis - BMI/DABA
According to the supplier's recommended procedure, 49
the appropriate amount of DABA was placed in a i000 ml
reaction kettle, equipped with a heating mantle,
thermometer, stirring rod, and a vacuum line, as shown in
Figure 3.7. 3 When the DABA was the consistency of water,
the appropriate quantity of BMI was added. Under constant
stirring with a Teflon paddle in a N2 atmosphere, the two
components were heated to 125 °C until a clear homogeneous
solution was obtained. The mixture was degassed for 20
minutes without stirring before it was poured into a

i
I
ii
u
d
e
J
Figure 3.7. Reaction kettle setup used in preparingBMI/DABA networks. (Figure obtained from S. Mudr ich3)
Labels denote the following: a) thermometer, b) glass
stirring rod, c) vacuum hose, d) reaction kettle lid, e)
i000 ml reaction kettle, f) heating mantle, g) Teflon
stirring blade.
78

79
preheated upright mold, shown in Figure 3.8. The material
was placed in a 155 °C vacuum oven. After two hours, the
oven temperature was raised to 177 °C for 16 hours. The
material remaining in the reaction kettle was scraped out
and placed in marked vials and stored in a desiccator for
use in dielectric analysis.
3.3.3.1. Molds - BMI/DABA
An upright Teflon coated aluminum 8" x 8" mold, shown
in Figure 3.8, 3 was used for the BMI/DABA material. The
aluminum molds were machined from cast aluminum sheet stock,
polished, and then coated with a Teflon film by Falholt,
Inc. Akron, OH. One half of the mold consists of the
material cavity, (8" x 8" x .157"), surrounded by a venting
channel that allows trapped air to escape from the bottom of
the mold up through the sides of the mold. The other half
of the mold is a rectangular aluminum plate. The mold was
held together by four 6" C clamps.
3.3.3.2. Thermal Histories - BMI/DABA
Each BMI/DABA formulation was prepared using three
different cure cycles, recommended by Ciba Geigy: 16 hr at a
low temperature of 177 °C, 16 hr at a high temperature of
250 °C, or 16 hr at a low temperature of 177 °C followed by
16 hr at a high temperature of 250 °C.

80
!
//
//
!
/
!
/!
!
/
!I
/!
!
/I ,i
I
/!
!
//
/
/
!
/!/
/
Figure 3.8. Schematic diagram of the Teflon coated aluminum
mold used to cure BMI/DABA sheets. (Figure obtained from S.
Mudrich. 3)

81
The thermal histories for BMI/DABA are detailed in
Table 3.2. The temperatures listed refer to the mold
temperatures, and consequently the material or cure
temperatures. The times represent the times the materials
are held at the cure temperature.
A typical thermal history versus time for BMI/DABA is
shown in Figure 3.9. The cooling rate is not monitored
since the material is removed from the mold as soon as the
cure schedule is complete.
3.3.3.2.1. Curing Procedures - BMI/DABA
After pouring the clear, homogeneous material into the
preheated upright mold, the mold was placed in a vacuum oven
for 2 hours at 155 °C until the gel point was reached. The
temperature of the oven was then increased to 177 °C for the
remaining 16 hours. After the cure time was reached, the
mold was removed from the oven. The C-clamps were quickly
removed and the mold was disassembled. The material was
removed from the mold while still hot so that the material
would not crack during cooling. Once removed, the material
was allowed to cool to room temperature and then stored in a
desiccator.
3.3.3.2.2. Postcuring Procedures - BMI/DABA
One of the cure schedules for BMI/DABA was 16 hr at 177
°C followed by 16 hr at 250 °C. After the 177 °C cure, the
cured plate was cut into testpieces and then heated to

82
Table 3.2.Cure and Postcure Schedules for BMI/DABA.
Time at the Cure TemperaturesBMI:DABAmole ratios
177 °C " 250 °C " 177 °C/250 °C"
2:1 16 hr 16 hr *
I:I 16 hr 16 hr *
1:0.87 16 hr 16 hr *
1:1.2 16 hr 16 hr 16 hr/16 hr
'Each sample experienced 2 hr at 155 °C prior to curing,according to manufacturer's recommendations. 49
* Only the theological dynamic shear and density sampleswere given the step cure.

83
200 , , , , , , , , . , , , , , . , , . ,
0 1600
E
_ 120
8O
BMI'DABA 1:1
0 200 400 600 800 1000
Time (min)
Figure 3.9. Typical processing history for BMI:DABA in a
I:I mole ratio.

84105 °C in a vacuum oven for 24 hr to remove any residual
moisture. The testpieces were weighed and measured before
being inserted into a preheated 250 °C vacuum oven
backfilled with a N2 atmosphere for 18 hr. Postcuring the
testpieces in a N2 atmosphere minimized oxidative
degradation. The postcured testpieces were weighed and
measured and then stored in a desiccator until use.
3.3.4. Thermal History - PMR-15
Samples from one of the three cured PMR sheets obtained
from NASA Lewis Research Center, were postcured after being
cut by the diamond saw. The testpieces were heated to 105
°C for 24 hr in a vacuum oven to remove water. The
testpieces were weighed and measured before inserting them
into a preheated 316 °C oven for 16 hr. The samples were
again weighed, measured, and stored in a desiccator until
use.
3.4. Testpiece Preparation
3.4.1. General
All mold flash and extraneous material were removed
from the cured plates with a file. Various test samples
were cut from the plates using a diamond impregnated cutting
wheel on a water-cooled Micro-Matic Precision table,
manufactured by Micromech MFG, Corp. Figure 3.10
illustrates the cutting patterns for the 6" x 6" and the

DT
DT
DT
I rheom I rheom
DT
DT
DT
extra
8S
DT
DT
DT
DT
DT
DT
DT
DT
D T D T extra
rheom |rheom I rheom i
Figure 3.10. Patterns for cutting the various test-piece
configurations from the 6" x 6" (top) and 8" x 8" (bottom)
cured plates. Labels denote the following: _DT' = double-
torsion sample, _rheom' = rheological test sample, _extra' =
extra material, not used for mechanical testing.

868" x 8" material plates. Two or more plates were made for
each cure condition and material combination.
After the plates were cut by a diamond saw into
testpieces, the samples were measured and weighed, heated to
105 °C for 24 hours to remove any residual water from
cutting, and then measured and weighed again. The cut
testpieces were labeled and stored in desiccators until
needed.
Throughout the investigation, rigorous effort was made
to track all weight measurements from after cure to after
post cure and before testing. Polyimides, 55 in general, can
absorb as much as 2% moisture. Therefore, drying at 105 °C
is necessary for the elimination of moisture. Elimination
of moisture has been successfully achieved by placing the
material in an oven at 105 °C for 16-24 hours. Weight gains
may be due to absorbed moisture and swelling. All materials
were stored in a desiccator from the start to end of this
investigation.
3.4.2. Rheological Testpieces
Several rheological testpieces (2" x 1/4") were cut
from each cured plate on a water lubricated diamond saw.
Samples were then heated to 105 °C in a vacuum oven to
remove any residual moisture. The samples were weighed,
measured and stored in a desiccator until use.

87
3.4.3. Double-Torsion Samples
Rectangular samples (2.95" x 1.77") were cut from the
cured plates with a water lubricated diamond saw. Six
double torsion specimens were cut from each plate of
BMI/MDA, BMI/DDS, BMI, and PMR. Ten double torsion
specimens were cut from each BMI/DABA plate. After the
sides of the testpieces were squared on a Bridgeport mill to
uniform dimensions, a V-notch was centrally milled the
entire length of the testpiece with a carbon-coated circular
slotting cutter, ground to a 30 ° included angle. The depth
of the V-notch was roughly one half the thickness of the
sample. The V-groove on each sample was scored with a
dental pick to ensure that a crack would propagate along the
V-groove. Before a crack could be initiated along the V-
groove with a razor blade, a notch, 1/4" in length, was
sawed perpendicular along the V-groove with a jeweler saw.
Just prior to testing, a razor blade was forced into the
notch with a rubber mallet to induce a sharp precrack. A
new razor blade was used for each sample. A mark with a
metallic marker was placed 2 mm from the edge of the sample
along the V-groove over the precrack to aid in the tup
placement during testing.
3.4.4. Sonic Modulus Samples
Once the double-torsion tests were performed, one half
of the testpiece was used for sonic modulus measurements.

88
Eight to twelve specimens of each BMI/MDA and BMI/DDS ratio,
BMI, and PMR-15 were used during the sonic modulus
measurements. Twelve to fifteen samples for each ratio of
BMI/DABA were utilized during the sonic modulus
measurements. The fractured V-groove surfaces were ground
off using a circular, water lubricated grinding wheel with
400 grit silicon carbide paper. Only the fractured surface
was in contact with the water.
3.4.5. Plane Strain Compression Testpieces
The plane-strain compression yield samples (1.77" x
0.87") were cut from the sonic modulus testpieces using a
water lubricated diamond saw. After cutting, the samples
were heated to 105 °C for 24 hr to remove any residual
water. The samples were measured, weighed, and stored in a
desiccator until tested. Eight to twelve samples were
tested for each cure condition and composition.
3.4.6. Density Testpieces
Density samples (0.87" x 0.99") were cut from the sonic
modulus testpieces. The samples were heated to 105 °C in a
vacuum oven to remove any residual water. The samples were
weighed, measured, and stored in a desiccator until use.
Three samples were cut from one sonic modulus testpiece;
twenty-four to thirty-six samples were tested for each cure
condition and composition and only the average and standard

89
deviation values are reported in the Results and Discussion
section.
3.4.7. Equilibrium Rubbery Modulus Testpieces
The second half of each double-torsion sample was cut
lengthwise with a diamond saw into two equal pieces for the
equilibrium rubbery modulus tests and the intermittent
stress relaxation experiments. Dumbbell samples were not
possible due to the inherently brittle nature of the BMI-
based material. The samples were heated to 105 °C to remove
residual moisture, measured, weighed, and stored in a
desiccator until use. Three samples each of the high- and
low/high-temperature cure conditions for each ratio of
BMI/MDA were tested. The low-temperature cure condition of
BMI/MDA and the high-temperature cure condition of BMI/DDS
and BMI were too brittle to be tested in this manner.
3.5. Network Characterization
3.5.1. Dynamic Shear Measurements
A Rheometrics mechanical spectrometer at Wright
Patterson Air Force Base was used to determine the
rheological properties of the BMI/MDA, BMI/DDS, BMI/DABA,
BMI and PMR samples. The dynamic shear moduli were measured
by deforming the test specimens in torsion at a frequency of
1Hz with a maximum strain of 0.2%. The heating rate was 5
°C/min from room temperature to 450 °C.

98The glass transition temperatures were determined by a
line intercept method. Lines are drawn through the glassy
region and the transition region. The point at which these
lines intersect is considered the glass transition
temperature, Figure 3.11. Even though figures and tables in
this dissertation contain the symbol "Tg", it is recognized
that the glass transition temperature is an apparent
measure, not done at near-equilibrium but in a dynamic
mechanical test. From these theological curves, the
temperature range of the rubbery plateau regions or the
minimum value of G' was determined for future equilibrium
rubbery moduli measurements.
Some dynamic mechanical spectroscopy was also performed
at NASA Lewis Research Center under the conditions listed
above. Researchers at NASA Lewis Research Center have found
theological analysis to be a useful and reproducible
technique, capable of discerning moisture in the material,
which can be identified by a lower Tg and a drop in G' at
about i00 °C. Finally, rheological analysis can determine
the general state of cure. sS Undercured material exhibits a
broad secondary transition after the rubbery plateau. A
slight increase in G' after the minimum is also indicative
of undercuring in the material. Since tan 8 is the ratio of
G' to G", any transition in G' or G", such as undercuring,

91
O
i
i
Temperature
Figure 3.11. Schematic illustration of the relationship
between storage modulus (G') and temperature for a typical
BMI network. The glass transition temperature, Tg was
determined by an intercept method, indicated by the dashed
lines.

92
will be reflected in tan 6. Therefore, the midpoint between
the glassy region and the rubbery plateau should not be used
as an indication of the glass transition temperature.
Dynamic shear measurements were also performed in order
to determine if network changes occurred during an
isothermal hold above the network's glass transition
temperature. Initially, the temperature was ramped to a set
temperature and held for one hour while G' was measured.
The sample was returned to room temperature and was then
retested. This time the experiment proceeded as normal to
verify if the isothermal hold resulted in an increase in the
network's glass transition temperature.
3.5.2. Density by the Method of Hydrostatic Weighing
Density measurements provide a measure of molecular
packing within a network. Therefore, hydrostatic weighing
was used to determine the densities of the samples produced,
according to ASTM 792-86. 56 Samples, approximately _ inch
long were cut from the ends of the sonic modulus specimens.
The samples were weighed in air and then submerged in
distilled water and weighed on a coiled wire platform of
known weight in water. From these weights and the density
of water, the densities of the BMI-based materials could be
determined from the following equation:

p
0.9975 × a
a+w-b
93
(3.2)
where a is the weight of the sample in air, b is the weight
of the sample in water, and w is the weight of the coiled
wire platform in water.
3.5.3. Molecular Weight between Crosslinks, Mc
Near equilibrium stress-strain measurements were
performed on BMI/MDA samples at least 20 °C above the
network Tg. A rubbery tensile modulus, Ee, was calculated
from these measurements and then related to the number
average molecular weight of effective network chains between
crosslinks, Me, through the kinetic theory of rubber
57
elasticity. Ee is given as:
Ee = 3 _p R< M c ( 3.3 )
where • is the front factor assumed to be unity in this
investigation, p is the density at the test temperature, R
is the universal gas constant, and T is the absolute
temperature.
These experiments are performed 20 to 60 °C above the
Tg of the network. Due to the presence of unreacted BMI in
the cured material, an increase in G' after the minimum with
further heating has been reported. This implies that as the
near-equilibrium stress-strain experiment proceeds to a

94temperature greater than Tg the unreacted BMI could
conceivably react to form new crosslinks. A continuously
changing network would then further confound the
determination of Mc. However, the values obtained in a
period of minutes are relative rankings of Me.
3.5.4. Materialography
Several methods were utilized to ascertain whether
intimate mixing of the powders occurred without use of a
solvent during processing and if the consolidation of the
powders resulted in a uniform network structure. Standard
materialographic methods were used to prepare the specimens
for viewing. Samples were cut to fit in 1-inch diameter
rubber molds. Epoxy was poured into the mold and cured to
provide support for the sample. The embedded sample was
ground on a water-lubricated grinding wheel with sandpapers
ranging from 120 to 600 grit. Water flows over the
sandpaper to cool the sample and to remove the debris away
from the grinding surface. The sample was then polished
using graded alumina suspensions down to 0.5 pm on a
rotating cloth covered wheel followed by ultrasonic cleaning
to remove the polishing media.
3.5.4.1. Optical Microscopy
Optical microscopy provides details of the structure
such as length, shape, and arrangement of visible
features. _8 A Leica Reichert MeF3 inverted metallograph,

95
equipped with a Polaroid camera was used to view the resin
samples. The resolution is on the order of 0.5 _m with a
magnification of approximately 1500x.
A second optical microscope used was the Olympus SZH,
equipped with a Sony Color Video Camera (Model 38-386) and a
Sony Color Video Printer Mavigraph. This camera offers low
power microscopy with instantaneous documentation of
results.
3.5.4.2. Solvent Etch
The process of etching is used to assess differences in
the microstructure that may not be readily observable
directly. After the grinding and polishing procedures, an
etching solution of sodium boric acid was used to etch the
newly exposed surface to reveal if any powder particles
existed after curing.
3.5.4.3. Nomarski Differential Interference Contrast
Nomarski differential interference contrast (DIC)
microscopy is used to view the surface topography. Flow
patterns, greatly enhanced from polishing, are obvious with
DIC. The DIC uses oblique lighting that shadows the sample.
A cross-polarizer is employed to align two beams of light;
one beam of light is focused onto the plane of the specimen
and the other beam of light is reflected off of a reference
mirror. The beams of light are rejoined back into the lens
to give contrast by interference. 58 The Reichert-Jung MeF3

96microscope was used for differential interference contrast
observations.
3.5.4.4. 02 Plasma Etch
An oxygen plasma etch is the bombardment of charged
particles onto a polished surface to etch away the top layer
of surface atoms. Etching was done in two stages, for 7
minutes under vacuum and for 9 minutes under 1 mbar of 02.
Great care is needed with 02 plasma etching because textures
can be introduced on the surface, which appear as artifacts
and not microstructure.
3.5.4.5. Scanning Electron Microscopy (SEM)
Examination of a fractured surface allows one to
investigate localized plastic deformation and any departures
from ideal brittle fracture. Samples of BMI/MDA were
submerged in liquid N2 for two minutes. When the samples
were pulled out of the liquid N2, they were immediately
fractured to induce a brittle failure. The fractured
surfaces would also reveal the presence of unreacted powder
within the cured material, if any.
The cryogenically fractured surfaces were coated in
carbon for 20 minutes, mounted on an appropriate specimen
holder, and viewed in a JEOL 6100 scanning electron
microscope at NASA Lewis Research Center. A Polaroid camera
was used to take photomicrographs.

97
3.5.5. Gel Permeation Chromatography (GPC)
Gel Permeation Chromatography (GPC) was performed at
NASA Lewis Research Center on low-temperature cured samples
of BMI/MDA. For GPC analysis, a Waters 6000 pump, equipped
with a Valco injector and three phenogel columns, from
Phenomex Co., were employed. The three columns had pore
sizes of I000, 500, and i00 Angstroms. Low-temperature
cured samples of BMI/MDA were dissolved in NMP and filtered
with a syringe, equipped with a disposable filter cartridge
Leur tip.
A sample size of I00 _L was in ected into the columns,
heated to 90 °C with NMP flowing at a rate of 0.5 cc/min. A
Waters Refractive Index Detector was used to monitor the
difference in refractive index between the pure solvent and
the dilute polymer solution. The Waters Maxima GPC software
was employed to calculate the molecular weight distribution
from the amount of solute versus retention volume curves.
3.6. Mechanical Properties
3.6.1. Plane Strain Compression
The compressive yield stress behavior in plane strain
was obtained for the cured and postcured materials. Ford
and Williams $9 were the first to test plastics in plane
strain compression. In compression yield testing, a flat

98
sample with parallel faces is placed between two level,
highly polished rectangular steel dies. A schematic diagram
of the test specimen and dies is shown in Figure 3.12. The
die fixture was loaded on an Instron, Model 1125 screw
driven load frame. The upper die was attached to the
crosshead and the lower die rested on the platform of a
compression load cell. The Instron is loaded in compression
at a crosshead speed of 0.5 mm/min until yield or fracture.
To eliminate friction between the sample and the steel dies,
Dow Corning's MolyKote G-N lubricating paste was used.
The compressive yield stress is given as:
where P is the load at yield, Wo is the undeformed width of
sample, and b is the width of the steel die in contact with
the sample. The following guidelines were observed when
performing the plane strain compression yield test: 1.) b
< h, 2.) 8h < Wo < 16h and 3.) L > 3b. The test is
considered "plane strain" because deformation is restricted
in the 2,3 plane of loading. Since the area of specimen in
contact with the die remains constant during deformation the
strain values obtained in these experiments correspond to
the true strain values. The mean value and standard
deviation reported in the Results and Discussion section

99
W
h
b
3
Figure 3.12. Schematic representation of the plane strain
compression yield test fixture.

represent eight to twelve BMI/MDA, BMI/DDS, BMI, and PMR-15
samples for each condition.
I00
3.7. Double-Torsion Fracture Enerqy Measurements
3.7.1. Experimental
The double torsion test was initially proposed by
Outwater 6° but was developed more fully by Kies and Clark. 61
The double torsion test is a simple method for analyzing the
slow crack growth of brittle materials. 62 An important
feature of this test method is the crack length independence
of the stress intensity factor. 62 The specimen is a simple
rectangular plate that is supported on two parallel rollers.
A "V" groove is machined along the lower face of the plate
to ensure that the crack propagates along the specimen's
long axis. A precrack is carefully introduced into one end
of the sample, with a length as long as _ of the specimen's
width. A load via a tup is applied to the end with the
precrack. The crack then propagates along the length of the
specimen.
A schematic diagram of the double-torsion testpiece is
shown in Figure 3.13. The specimen itself can be considered
as two elastic torsion bars. 63 The displacement of these
bars under a load is related to torsional deflections.
Neither bending nor shearing contribute to the specimen

I01
,,, ,, , , ,
tA
I
W
P
Loading I
Tup ]
.]. Precrack
_u_o_._ _
W m Wm
Figure 3.13. Schematic representation of the double-torsion
sample and loading configuration.

102
deflection. All deflections can be attributed to elastic,
torsional motions of the two arms. There is no need to
measure sample deflections, crack lengths, or compliance
relationships with this test method.
Under a compressive load, crack extension will occur in
the direction that yields plane strain conditions. In
general, a crack will move in an orthogonal direction to the
crack front. The test method can be performed in three
different modes: fixed displacement, which is the most
effective mode to obtain continuous crack growth, constant
displacement, and constant load.
The glassy fracture energies of cured and postcured
networks were performed using double-torsion samples. All
testing was done on an Instron, Model TM universal test
machine in compression with a crosshead rate of 0.05 cm/min
(0.02 in/min) at room temperature. The test setup is shown
in Figure 3.14. 3 An aluminum platform (1/4" x 3" x 5") with
six 1/8" wide by 1/8" deep alignment grooves was used to
support two 1/4" diameter aluminum rods. The double-torsion
testpiece, V-notch down, was placed on the two rods, held
1.5" apart. The precrack was positioned halfway between the
two rods and aligned directly over the crosshead ram. On
the mark, 2 mm away from the edge of the sample, two ball
bearings (1/4" dia.) partially embedded into an aluminum
disk (1/4" x i" x i") were situated on either side of the

c
103
Figure 3.14. Schematic diagram of the Instron, Model TM
universal test machine with double-torsion setup. (Figure
from S. Mudrich. 3) Labels denote the following: a) double-
torsion sample, b) compression load cell, and c) Instron
crosshead.
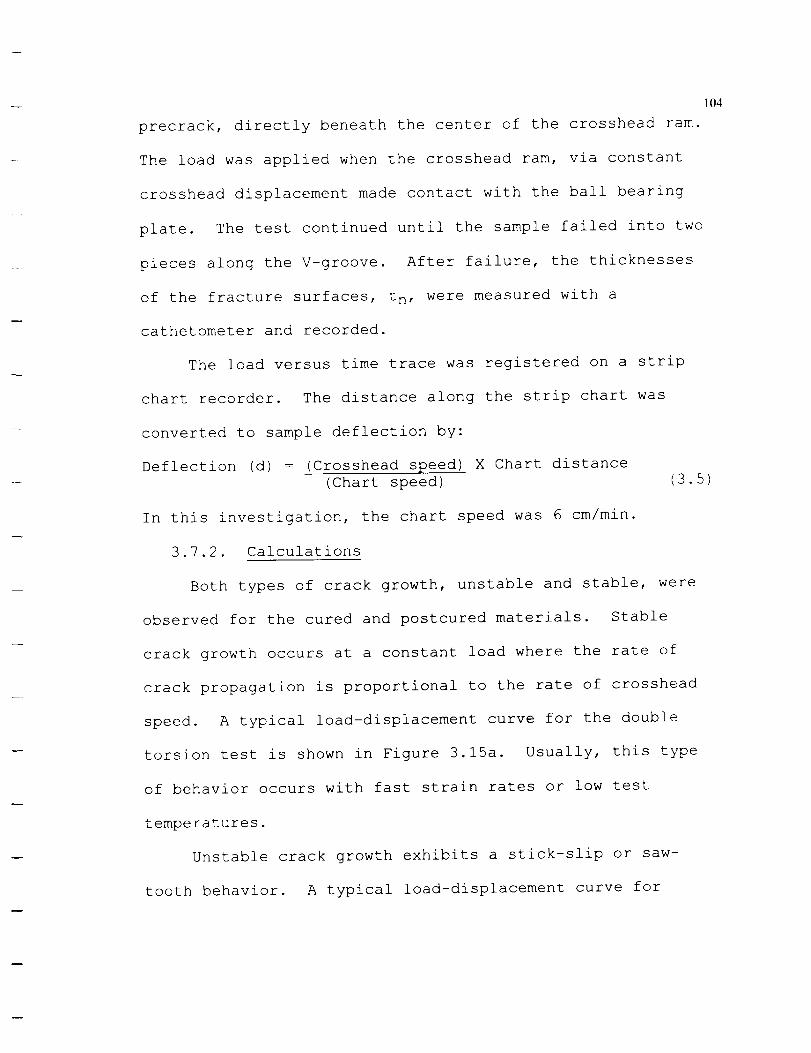
precrack, directly beneath the center of the crosshead ram.
The load was applied when the crosshead ram, via constant
crosshead displacement made contact with the ball bearing
plate. The test continued until the sample failed into two
pieces along the V-groove. After failure, the thicknesses
of the fracture surfaces, tn, were measured with a
cathetometer and recorded.
The load versus time trace was registered on a strip
chart recorder. The distance along the strip chart was
converted to sample deflection by:
Deflection (d) = (Crosshead speed) X Chart distance
(Chart speed) (3.5)
In this investigation, the chart speed was 6 cm/min.
3.7.2. Calculations
Both types of crack growth, unstable and stable, were
observed for the cured and postcured materials. Stable
crack growth occurs at a constant load where the rate of
crack propagation is proportional to the rate of crosshead
speed. A typical load-displacement curve for the double
torsion test is shown in Figure 3.15a. Usually, this type
of behavior occurs with fast strain rates or low test
temperatures.
Unstable crack growth exhibits a stick-slip or saw-
tooth behavior. A typical load-displacement curve for
104

105
unstable crack growth is shown in Figure 3.15b. This type
of crack growth occurs at low strain rates or high test
temperatures. Besides varying the strain rates or test
temperatures, other factors that influence the type of crack
growth are curing agents and cure schedules. 64
For unstable crack growth, the first crack initiation
load was not used. The subsequent critical loads, Pc, or
the maximum values from the strip chart recorder were used
to obtain the critical crack initiation loads, pi. The
minimum values from the strip chart recorder were considered
the critical crack arrest loads, pa. All load values were
determined from the strip chart with an HP Digitizing
Tablet.
The fracture energies of the cured and postcured BMI
networks were determined from the following relationship:
G/c
38 c,,,(3.6)
where Gzc is the plane strain fracture energy, Pc is the
critical load, Wm is the moment arm from the support rod to
the ball bearing, E is Young's modulus, v is Poisson's
ratio, assumed to be 0.35, W is the width of the sample, t
is the sample thickness, tn is the fracture path thickness,
CZD is the displacement correction factor for the torsional
bars undergoing loading, and CFT is the finite thickness
correction factor. The correction factors, CLD and CrT, are

_d
Init, iatio_
106
(a) Oi_lacement
Load
Initiation
Arrest
(b) Dit4)lacement
Figure 3.15. Typical load-displacement curves for a.)
stable, continuous crack propagation and b.) unstable,
stick-slip crack propagation.

107
described precisely in Geisler's dissertation 15 and will not
be discussed here. The plane strain condition was used
since tn met the plane strain requirement for all BMI
networks:
tn _2.5(GI(E//'_ ) 2_ 3.7)
where _y is the yield stress determined at the same
crosshead rate and temperature as Gzc. In order to minlmize
the number of samples tested in plane strain conditions, the
general guidelines for fracture specimen dimensions of
metallic materials were also employed: L _ 2.5 (K1c/_y) 2
and L _ 50rp, where rp is the plastic zone size radius. The
modulus values, E, were determined sonically by an impulse
excitation technique. The mean value and the standard
deviation represent eight to twelve samples of BMI/MDA,
BMI/DDS, BMI, and PMR-15 and ten to fifteen samples of
BMI/DABA at each mole ratio.
3.7.3. Plastic Zone Size Calculations
There is a simple relationship that exists between
fracture energy, G, and the stress intensity factor, K,
using linear elastic fracture mechanics (LEFM}. Under plane
strain conditions, the fracture energy of a crack in a
homogeneous material for Mode I deformation can be described
as:

where v is the material's Poisson ratio.
108
(3.8)
LEFM also predicts
that infinite stresses occur at the crack tip but in real
materials this is not the case. A yield zone does form at
the crack tip and the Irwin model can estimate the size of
this plastic zone. 65 Irwin assumed that the plastic zone
had a circular cross section. Employing plane strain
conditions where yielding is suppressed by the triaxial
stress state, the plastic zone size is given as:
IllI K_._./___ (3.9)
rr : (6m]<cr_,)
where rp is the radius of the estimated plastic zone and [YYt
is the yield stress in tension. Wronski 66 found that for
epoxies, the yield stress in compression was approximately
0.75 that of the yield stress in tension. This relationship
has been used in this investigation. Equation 3.9 then
becomes :
rp = (3. :tO)0. 75 o'yc
where (YYc is the yield stress, measured in plane strain
compression.

I09
3.8. Rubbery Modulus Measurements
3.8.1. Above T_ - Near-Equilibrium Stress-Strain Testinq
3.8.1.1. Experimental
The molecular weight between crosslinks, Me, of the
networks was determined based on the kinetic theory of
rubber elasticity 5v from rubbery tensile moduli
measurements. The rubbery tensile moduli were determined
from stress-strain tests performed on an Instron Model 4505
universal testing machine equipped with an environmental
chamber, capable of reaching 400 °C.
Due to the inherent brittleness of the networks,
samples were not dumbbell-shaped. Benchmarks were placed in
the middle of the rectangular samples with white correction
fluid. The sample dimensions and weight of each sample were
recorded prior to testing.
The chamber temperature was set to approximately 20 °C
above the glass transition temperature of the sample to be
tested. Each testpiece was loaded into the upper clamp and
allowed to equilibrate to the test temperature. A
thermocouple loosely encircled the sample in the benchmark
area to provide accurate control of the test temperature.
Once the test temperature was reached, the sample was
mounted into the lower clamp and allowed to equilibrate to
the test temperature.

I10
The load cell was balanced and the crosshead was
incremented at a very slow rate (0.05 cm/min) until the
total crosshead travel was 0.38 mm, which does not translate
to sample displacement. Instead the elongation was
determined by measuring the distance between the benchmarks
on the testpiece with a cathetometer after the retractive
force was permitted to diminish to an apparent equilibrium
value. The load was recorded manually. After reaching a
nearly constant value of load, the crosshead displacement
was increased by 0.38 mm and the procedure was repeated.
The BMI based networks were not able to approach
strains of >10% due to their brittleness. In addition, the
low-temperature cure condition and the BMI samples were too
brittle to test at 20 °C above their Tg. Moreover, the low-
temperature cured samples would further cure with the
addition of heat.
3.8.1.2. Calculations
The initial unstrained benchmark length, io, may be
calculated by plotting the length versus equilibrium load
and extrapolating back to zero load. The nominal strain, g,
was calculated as:
= \ I ] (3.11)
where l is the length between the benchmarks during loading.

The engineering stress, (_e, was calculated as:
(_e : f / Ao
III
(3.12)
where Ao is the initial cross-sectional area of the sample
and f is the retractive force applied to the specimen. The
engineering stress versus time for the various strain levels
was plotted for each sample to illustrate stress relaxation.
True stress, ot, calculated from the equilibrium load
value was further manipulated to give ot/3pRT. The linear
plots of ot/3pRT versus strain gave slopes equal to the
rubbery tensile moduli for the samples. Three samples from
the high- and low/high-temperature cure condition of BMI/MDA
were tested and averaged.
3.8.2. Intermittent Stress Relaxation
3.8.2.1. Experimental
An Instron Model 4505, screw driven load frame,
equipped with an environmental chamber was used for the
intermittent stress relaxation experiments. The sample
consisted of a rectangular shaped specimen with benchmarks.
Only the low/high-temperature and high-temperature cured
BMI:MDA materials in a 2:1 mole ratio were tested.
In an intermittent stress relaxation experiment, the
specimen was maintained in an undeformed condition in the
upper grip at the test temperature. At widely spaced time
intervals, the sample was tightened into the bottom grip. A
112fixed deformation was applied to the specimen and the
initial retractive force was measured. Before the specimen
was unloaded, the benchmarks were measured with a
cathetometer. The sample was removed from the lower grip
until the next time interval when the process was repeated.
The length of the sample was checked after returning to zero
strain and zero stress to make sure no elongation of the
sample is observed between test measurements.
3.8.2.2. Calculations
After the nominal strain was determined by Equation
3.11, the engineering stress was calculated using the
initial retractive force and employing Equation 3.12. The
engineering stress versus time was plotted against the
stress relaxation plots described earlier.
3.8.3. Below T_ - Sonic Modulus
3.8.3.1. Experimental
A non-destructive test that measures the resonant
frequency of a sample and can be used to calculate the
modulus, which is a function of the measured frequency,
dimensions, and weight of the sample, is an attractive
O
alternative to mechanical tests which rely on difficult
cathetometer measurements on a deformed sample. The impulse
excitation technique utilizes a sensitive microphone and
electronics to analyze sound waves emitted from the
vibrating sample. 6_

113
To determine the appropriateness of this technique, a
sample of BMI/DABA in a 1:0.87 mole ratio was used in the
correlation of the modulus determined by three-point bending
with strain measured by cathetometer, the sonic test
technique, and four-point bending with strain measured by a
series of strain gages. These values were also compared to
previously determined values reported by the manufacturer of
Matrimid 5292 (BMI:DABA).
The recommended setup for the operation of the impulse
excitation technique is shown in Figure 3.16. A sample was
placed on two pieces of Styrofoam so that the ends of the
sample hung over the Styrofoam support rods by approximately
0.224L, where L is the length of the sample. A small mallet
with a ball bearing head was used to strike the surface of
the sample, causing the specimen to vibrate. A microphone
detected the vibrating wave and a GrindoSonic Instrument,
manufactured by Lemmens-Elektroniks, Belgium measured the
frequency of the resonant wave.
3.8.3.2. Calculations
The frequency values were tabulated and inserted into a
computer program specifically designed by the makers of the
GrindoSonic, which calculated Young's modulus through the
following equation:
E = 0.94642 p L 4 _ T� t2 (3.13)

114
Microphone
Bead
Figure 3.16. Schematic diagram for setup of the impulse
excitation technique, or sonic modulus experiment. 67

where p is the density of the sample, L is the sample
length, f is the frequency of the wave measured, T is the
shape factor dependent on Poisson's ratio, and t is the
specimen thickness. The mean value and standard deviation
of eight to twelve samples of each cure condition and
composition of BMI/MDA, BMI/DDS, BMI, and PMR and ten to
fifteen samples of each cure condition of BMI/DABA are
plotted verses mole fraction BMI.
115
3.9. Dielectric Measurements
3.9.1. Instrumentation
Cure measurements were conducted on a Eumetric System
III Microdielectrometer, manufactured by Micromet
Instruments. The small microsensor (0.2" x 0.I" x 0.01")
employed by the instrument contained a microthermal diode
which could monitor the temperature as well as measure the
phase and amplitude of the output current at each frequency
tested. A schematic diagram of the experimental setup is
shown in Figure 3.17. 7
3.9.2. Dielectric Measurements - BMI/MDA and BMI/DDS
Dielectric cure monitoring was used to characterize the
powders previously discussed. After a sensor was placed on
a Teflon coated aluminum mold specifically designed to hold

116
Sensor
Oven Interface Microdielectrometer
I Electronics
Se__ t(0-30 Feet)
Softwar_
Packages
System Controller
Figure 3.17. Schematic diagram of the microdielectric
measurement system.

117
the sensor in place, a small amount of powder (approximately
2 grams) was placed over the sensor pad. The entire fixture
was inserted into a preheated oven for 4 to 8 hours to
monitor the chain extension reaction. During the
experiment, the temperature of the material slowly increased
while the BMI/MDA or BMI/DDS powder melted and intimately
covered the sensor pad. The frequency was cycled from 0.I
Hz to i00,000 Hz while the gain, phase, and temperature were
monitored as a function of time.
3.9.3. Dielectric Measurements - BMI/DABA
Dielectric analysis was used to characterize the gelled
material of BMI/DABA, which was produced in a reaction
kettle and stored in a desiccator. After a dielectric
sensor was placed on a Teflon coated aluminum mold
specifically designed to hold the sensor in place,
approximately 2 grams, of the BMI/DABA was positioned over
the sensor pad. The entire fixture was placed in a
preheated oven for 8.5 hours to monitor the dielectric
response. During the experiment, the material temperature
slowly increased to the set temperature. The frequency was
cycled from 0.i to I00,000 Hz while the gain, phase, and
temperature were monitored as a function of time.

1183.10. Polymer Modeling
Biosym software, with Insight II user interface and the
Synthia module, by Biosym Technologies, Inc. was employed to
model chain stiffness and entanglement properties. 68 A
Silicon Graphics workstation equipped with the software was
used. Room-temperature properties such as density and
Young's modulus were calculated as well as the glass
transition temperature for the low-temperature cure
conditions of the BMI/MDA and BMI/DABA. Only the low-
temperature cure condition for each system was modelled
since the Synthia module cannot take into account network
crosslinks.
The mole ratios of the BMI/MDA system that were
modelled were 4:1, 2:1, i:I, and 1:2. The mole ratios of
the BMI/DABA system were varied from 4:1, 2:1, I:I, 1:0.87,
and 1:1.2.
In modeling with the Synthia module, the mole ratios
should be expressed in decimal notation, less than I. For
example, a 4:1 mole ratio would be represented as 0.8:0.2.
In addition to the systems listed above, three other
diamines were modelled in a 2:1 and I:I mole ratio with BMI.
These are p-phenylene diamine (PPD), p-xylenediamine (PXD),
and 4,4'-diaminobiphenyl (DBP). The structures of the three
diamine monomers are shown in Figure 3.18.

119
NH2
a.) p-phenylene diamine (PPD)
H2N_H2C_CH2_ NH2
b.) p-xylenediamine (PXD)
NH2
c.) 4,4'-diaminobiphenyl (DBP)
Figure 3.18. The chemical structure
diamine (PPD), b.) p-xylenediamine
diaminobiphenyl (DBP).
of a.) p-phenylene
(PXD), and c.) 4,4'

CHAPTERIV
RESULTSAND DISCUSSION
4.1. Introduction
In processing the BMI/MDA and BMI/DDS copolymers, a
powder melt technique was utilized to prepare the
constituents prior to molding. Dielectric analysis was
used to determine the cure conditions for the BMI-MDA
system. The powders and molded materials were
characterized by various methods to determine cure times,
molecular weights, thermal stability, rheological
properties, and mechanical properties as a function of mole
fraction BMI. Modelling of the mechanical properties of
these systems was performed to verify the validity of
current molecular simulation techniques and to try to gain
additional insight into the behavior of these materials.
The hypothesis or premise of this research was to
determine whether curing along different thermal paths
produce networks with differing topologies and hence,
differing physical and mechanical properties.
120

121
4.2'. Network Preparation and Characterization
4.2.1. BMI/MDA and BMI/DDS Processing
Much effort was expended in determining an appropriate
method for preparation of cured BMI/MDA and BMI/DDS
materials. The most common practice for producing BMI-
based copolymers found in the literature, 19'2°'27 was based on
solvent-powder processing methods. With this technique the
two starting materials are dissolved and combined in an
appropriate solvent, the solvent is extracted, and the
resultant powder material is molded. The disadvantages 69 of
this procedure are incorporation of solvent into the
polymer structure leading to the formation of voids by
volatilization of the solvent, a plasticization effect due
to excess solvent, and reduced thermal stability due to
occluded solvent.
The first attempts at producing material for this
study were modeled after these solvent-powder processing
methods 19'2°'2v using Methylene Chloride (MeCI) to intimately
mix the BMI and MDA powder together. After the BMI and MDA
were dissolved in MeCl, the solvent was evaporated off in a
vacuum oven. The remaining material was ground to a fine
powder and compression molded. The result of the
compression-molded powder is shown in Figure 4.1.

122
Figure 4.1. Photomicrograph of BMI/MDA produced by the
solvent-powder processing method.

123
Impressions of tiny bubbles on the order of 2-5 _m are
clearly visible in Figure 4.1, which are indicative of
solvent retention after drying and its volatilization
during curing. Over 70 different attempts were made using
the solvent-powder processing route, varying the solvent
and other processing parameters. All these attempts using
solvent-powder processes were equally unsuccessful with
evidence for solvent retention observed in all cases.
Therefore, an alternative technique found in the
patent literature s3 and recommended by Donnellan 7° was
instituted. This alternative technique was based on a
melt-processing method. During this process the two
constituents are mixed together and heated until the lower
melting point constituent melts and wets the second,
resulting in a heterogeneous mixture. This mixture is then
cooled and ground into a fine powder and subsequently
reacted during molding.
For example, in preparing BMI:MDA copolymers both
individual constituents initially consist of fine powder.
These are mixed together in a beaker at the appropriate
mole ratio and heated to 80 °C in vacuum at which point the
MDAmelts and wets (but does not react with) the BMI
powder. Once the two constituents are thoroughly mixed

124
together the mixture is allowed to cool. After the mixture
cools and solidifies it has the consistency of peanut
brittle. Grinding is used to reduce the particle size of
this gelled substance and for further mixing and blending
of the two constituent materials. After grinding, the
resulting powder is screened - a mechanical method of
separating the powder in terms of particle size. The
screen surfaces act as a "go/no-go" criterion. The smaller
particles are allowed to pass through the surface opening
while retaining the larger particles. The net effect is a
physical separation of the powder based on particle size,
resulting in a particle size distribution. 71 Screening was
also used to make sure that all the powder used for molding
was no larger than 250 _m. All the gelled material was
ground repeatedly until it passed through at least this
first sieve.
Particle size distributions were recorded for all the
systems (as shown in Figure 4.2). For all the systems,
approximately 42-46 weight percent of the total amount of
the melt-processed powder consisted of particle sizes of
107 to 211 _m. All the powder used for molding was less
than 250 _m in diameter.

125
100
9O
8O
70
60
o 50
c-
o 40E<
30
20
10
0
"O c-
O _I_..Q
m 121
O
l
//// \/ \/ \/ \/ \/ \
, / \/ \
[-----I 213p - 249p particle size
[Z_ 107p - 211p particle size
105p and less particle size
c_ 4-:
_d _d
// // // \ // \ //\ /T
/ \ // \ // \ // \ // \ //, \ /
_d
I/////////////
I
\\\\\\\
64
6Oa121cd
7"////
// -
//",4/."4.
Figure 4.2. Powder size distributions for the material
molded for this investigation.

126
The ground powder is then placed in a mold and
compacted under light pressure. It was found that a wide
particle size distribution was actually beneficial for
molding compared to using a narrow size range. In the case
of a wide powder size range, particles of a smaller size
fit into the interstices between the larger particles.
This ensures a higher packing density than with a single
large particle size alone. It was found that using a too
narrow range of powder size resulted in not all the powder
melting and properly mixing during heating. After the
initial compaction process, the material is heated or cured
under various conditions during molding to control the
final structure of the co-polymer.
4.2.2. Materialographic Examination of Cured Plates
To ensure that intimate mixing of the powders occurred
during curing, various materialographic techniques 5_ were
used to characterize cured plates. While analysis of
various materials was conducted, the bulk of the
materialography was performed on samples of BMI:MDA in a
2:1 mole ratio, cured at 140 °C for 16 hours and the
descriptions provided below are for this material unless
the cure condition is otherwise stated. Materialography
was also performed on the as-screened powder.

127
After blending of the constituents, the question that
still remained was whether any individual powder particles
were present in the molded material. Bright field optical
microscopy, where the 'direct unscattered beam is allowed
to reach the image plane '58 is used to distinguish macro- to
microstructural features within the material, ranging from
1 cm to 0.2zm. At a magnification of 100x, individual
powder particles were not apparent as demonstrated in
Figure 4.3. The dark random spots are contaminants within
the powder from the grinding process. In contrast, Figure
4.4 is a bright field micrograph of the as-ground powders
embedded in an epoxy matrix. This figure indicates how
powders or the presence of powders would tend to appear
under bright field techniques. Such features were never
observed in the consolidated co-polymer plates.
With the solvent etch/acid etch method, the
microstructure is revealed by preferentially etching
amorphous regions. Since BMI is a crystalline powder, this
technique would etch the matrix material around unreacted
BMI revealing its presence. If the entire sample is
amorphous, it will etch the bulk material more or less
evenly. Figure 4.5 is an optical micrograph of a sample
that was solvent/acid etched. The micrograph does not

128
Figure 4.3. Bright-field optical photomicrograph of
BMI:MDA in a 2:1 mole ratio, cured at 140 °C for 16 hours.

129
Figure 4.4. Bright-field
as-ground powders.
optical photomicrograph of the

130
Figure 4.5. Bright-field optical photomicrograph of
BMI:MDA in a 2:1 mole ratio, cured at 140 °C for 16 hours
after solvent etch/acid etch.

131
reveal any pronounced microstructural features or the
presence of BMI-rich powder particles.
Samples were also plasma-etched for 7 minutes and then
again for 9 minutes. Plasma etching is the bombardment of
a surface with ions, in this case, oxygen ions. One of the
problems associated with plasma etching is that textures
can be introduced which are artifacts. Figure 4.6 is a
bright-field micrograph of a plasma-etched surface. In
spite of the rough surface appearance, individual powder
particles are not apparent after preferentially etching the
surface by plasma techniques.
Figure 4.7 is the differential interference contrast
(DIC) micrograph of a polished surface of BMI:MDA in a 2:1
mole ratio. DIC microscopy illuminates the surface
topography and produces a pseudo- 3-D image of the
surface. 5s One disadvantage associated with DIC is that
flow patterns are usually observed. These are artifacts
from either processing or polishing the sample. In Figure
4.7, only the polishing patterns are observed; evidence of
powder particles was not observed.
The final characterization technique used to determine
if powder particles were left in the consolidated material
was viewing of the cryogenic fracture surfaces by scanning
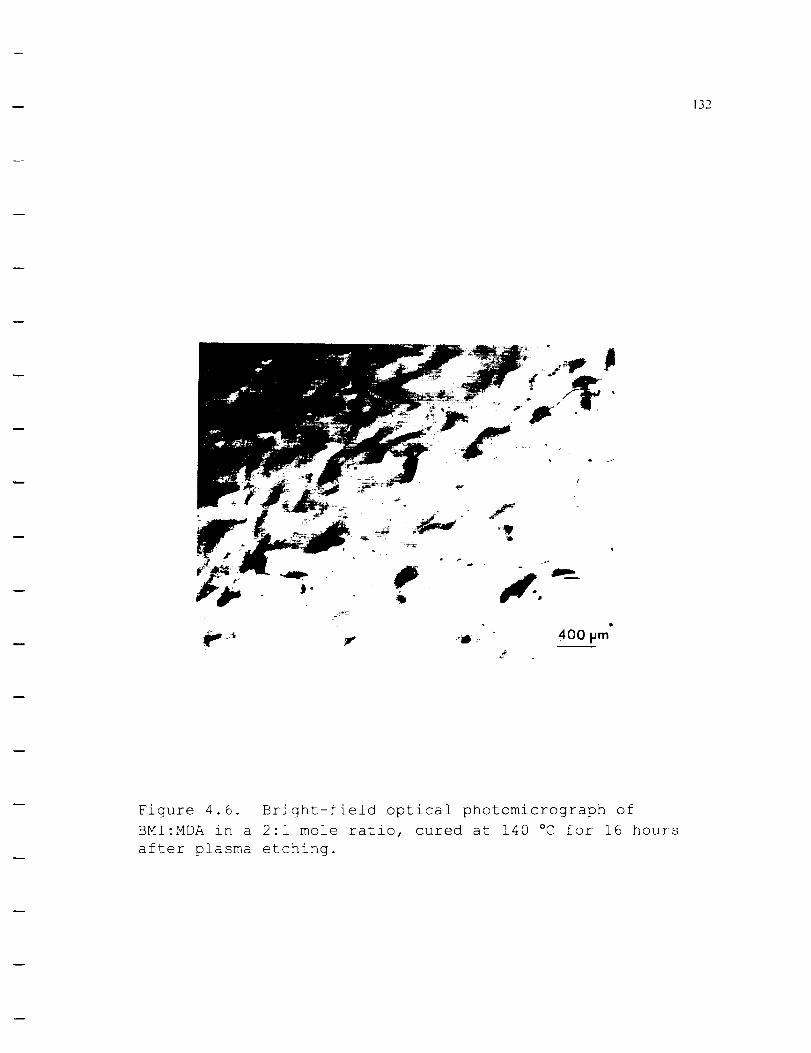
132
£
Figure 4.6. Bright-field optical photomicrograph of
BMI:MDA in a 2:1 mole ratio, cured at 140 °C for 16 hours
after plasma etching.

133
Figure 4.7. Dark-field optical photomicrograph of BMI:MDA
in a 2:1 mole ratio, cured at 140 °C for 16 hours.

]34
electron microscopy (SEM). After immersing the samples in
liquid nitrogen for i0 minutes, brittle fracture was
induced to determine the existence of any dispersed phase.
Figure 4.8 is a SEM micrograph of the BMI:MDA in a 2:1 mole
ratio, cured for 16 hours at 140 °C. There is evidence of
cleavage brittle fracture but no sign of fracture along
powder particles. Incidentally, there is also no
indication of solvent bubbles as shown in Figure 4.1.
Consequently, a number of materialographic techniques
were used to characterize the as-processed plates of
BMI:MDA and all the techniques revealed that the material
was uniform and homogeneous, without significant porosity
or unreacted powder particles, thus justifying use of the
melt-processing method for production of polymer plates.
The first indication that there were at least two
distinct network topologies produced by the various cure
cycles was during the cryogenic fracturing of BMI:MDA in a
2:1 mole ratio, cured at 140 °C for 16 hours versus cured at
220 °C for 6 hours. The sample cured at low-temperature
shattered into many pieces during the immersion into liquid
nitrogen (Figure 4.9). The sample cured at high
temperature did not shatter and was difficult to break on
impact, as evident in Figure 4.10.

135
Figure 4.8. Scanning electron micrograph of BMI:MDA in a
2:1 mole ratio, cured at 140 °C for 16 hours after
fracturing at cryogenic temperatures.

136
Figure 4.9. Optical photomicrograph of BMI:MDA in a 2:1
mole ratio, cured at 140 °C for 16 hours after fracturing at
cryogenic temperatures.

137
Figure 4.10. Optical photomicrograph of BMI:MDA in a 2:1
mole ratio, cured at 220 °C for 6 hours after fracturing at
cryogenic temperatures.

138
4.3. Dielectric Measurements of Thermosets
Processing variables such as viscosity and the times
for the beginning and end of the reaction must be
determined and controlled during the curing of a resin.
In-situ cure monitoring using frequency-dependent
electromagnetic impedance measurements is useful in
evaluating these processing variables by correlating the
chemical reactions and rheology of the system to the
electrical properties of the polymer. 72 By monitoring the
temperature, time, and the frequency dependence of the
impedance, chemical and rheological changes and
consequently key processing variables may be determined.
The dielectric properties measured are characteristic of
the number and magnitude of the dipole moments of the
molecular segments, ionic transport, and molecular chain
diffusion. The amount of dipoles in the material is
dependent upon the chemical nature of the reactants.
The dielectric properties of an uncured thermosetting
resin change as a result of three effects: 73 I.) A decrease
in the concentration and mobility of protons which are
produced by dissociation of amine groups, 2.) A decrease in
the dipole moment per unit chain segment as the length of
the chain and the crosslink density increase, and 3.) A

139
rapid increase in the dielectric relaxation time as the
diffusion of the chain or network segments carrying the
dipoles become progressively slower with the growth of the
chains and networks (steric hindrance). All of these
effects lead to a slowdown of dipole movement and ion
mobility. As chain propagation or crosslinking increases
the molecular weight of the network, the viscosity
increases and the permittivity value decreases.
Permittivity, _', is a measure of the degree of
alignment of dipoles and is a function of the strength,
amount, and mobility of the dipoles in a resin. 44
Permittivity values usually begin at a high level during
cure because initially, the liquid resin contains a high
concentration of highly mobile dipoles. As the material
hardens, the permittivity values decrease because the
dipole motion is restricted by network formation. In the
case of the BMI:MDA system, the starting material is
powder; hence, there is a transition from powder (solid) to
liquid to solid and the permittivity does not begin at a
high level due to the immobile dipoles of the powder state.
Thus for this system, permittivity would be expected to
start low, increase dramatically, and then drop off again.

140
The loss factor, c", is a measure of the energy
required to align dipoles and move ions. The loss factor
is the sum of both the dipole motion and ionic conduction: 44
_" = _ / _o_ + dipole terms (4.1)
where _" is the loss factor, _o is the permittivity of free
space (8.854 x 10⁻¹⁴), _, the angular frequency, is 2 _f,
where f is the applied frequency, and _ is the bulk ionic
conductivity. At low frequencies, the dipole terms become
negligible. The ionic conductivity is a molecular
parameter that arises from movement of ionic impurities in
the material, is frequency dependent and is very sensitive
to network changes. At the beginning of the cure, the ion
mobility is high, and therefore, ionic conductivity is
high. Before gelation, _ is inversely proportional to the
viscosity. As the cure proceeds, the ionic conductivity
decreases because the mobility of the ions decreases due to
the formation of a highly crosslinked network.
The use of different frequencies within an experiment
demonstrates the extent of restriction of orientational
mobility of polar groups within the resin as the
74temperature increases.
Figure 4.11 illustrates the dielectric properties of
permittivitity and loss factor as a function of time and

i
136 °C
1 Hz
2
I I I I
Temp
250
200
150"rE 1 10 Hz 220 °C
#- loo
0 50
165°CCure _< 220°C Postcure
-1 L I I I I 00 100 200 300 400 500 600
4l ' ' ' ' ' /
3_ 136°0 Temp----> 1 250
2 220 °C 200
1 150
o ... _. _._o,,_ _ loo __) -1 I-_ "_ li "" ......... 100"Z /
"_._: " 50
165 °C Cure 220 °C Postcure
_3 I_ I = I = I L =0
0 100 200 300 400 500 600
Time (minutes)
141
Figure 4.11. Permittivitity and loss factor as a function
of time and temperature for BMI:MDA in a 2:1 mole ratio
during a 165 °C cure and a 220 °C postcure processing cycle.

142
temperature for BMI:MDA in a 2:1 mole ratio during a 165 °C
cure and a 220 °C postcure processing cycle. Low
frequencies exhibit greater sensitivity to an absolute
change in magnitude of permittivity. At low frequencies
during the low-temperature cure, a large single peak
occurs. A single peak at all frequencies indicates a
frequency independent phenomenon. Here, a single peak
indicates that dipole rotation and bulk conduction are
occurring.
Initially, permittivity increases due to the low
molecular weight chains. The chains can adjust to an
alternating field. At a given time, as frequency
increases, the permittivity falls because of the inability
of the chains to track the alternating electric field.
With increasing temperature the molecular weight of the
resin increases, driving the viscosity up and the
permittivity down. The permittivity reaches an asymptotic
value or steady state value after reaching 165 °C during the
curing procedure, typical of gelation. There is no
dielectric event such as a peak, which accompanies
gelation. 7_
When the temperature is increased to approximately 220
°C, the low frequency permittivity values follow the slope

143
and change in temperature even though the material has
gelled with infinite viscosity. 76 Local viscosity, which is
related to the diffusion of individual molecules that are
able to move despite formation of a network, pushes the
glass transition of the network toward the postcure
temperature. The curing of a thermoset becomes diffusion
controlled at high viscosity or longer times.
The permittivity reaches an asymptotic value after the
cure temperature reaches 220 °C. This is indicative of
vitrification, the point where dipolar reorientation
ceases. Again, no dielectric event characterizes the
77vitrification process.
The loss factor in Figure 4.11b initially rises with
increasing temperature. The loss factor measures the
energy dissipated while dipoles try to track the
alternating field. The peak in the loss factor reflects
the maximum mobility of trace ions in the resin and
corresponds to increased fluidity of the resin. A single
maximum in the loss factor indicates that ionic effects
dominate the region of high fluidity. Here diffusion
controlled translation of ions is occurring. 78 As the
network builds, the segmental mobility diminishes.
Chemical reaction onset is marked by a sudden drop in d_"/dt

144
which reflects the reduced mobility of ions with molecular
weight buildup. 72 As the chemical reactions continue, the
loss factor decreases due to deficient ionic conduction.
When the loss reaches an asymptotic value, the cure
reaction is considered complete. No further changes in
mobility can be detected. The cure completion time is
approximately 75 minutes.
As the temperature is raised for the postcuring
reaction, the loss factor follows the temperature profile
for all frequencies tested. Due to the larger thermal
energy imparted to the system, greater mobility of the ions
and dipoles with the electric field is observed for at
least 50 minutes. After that time, the loss factor is
invariant with temperature and time, indicating
vitrification.
The permittivity and loss factor verses time and
temperature are shown in Figure 4.12 for the BMI:MDA in a
2:1 mole ratio. The material was heated to 220 °C to
simulate high-temperature cure. During the high-
temperature cure, the permittivity and loss factor
initially increase and then fall with time. After the
temperature reaches 220 °C, the permittivity and loss factor
both experience another minor rise in value.

145
_o
EL.-
0)
o..
O
-J
3,5250
Temperature
_ _- 225
3.0 _ - _-- - 200
//// ;. / -112_
1.5 " _ _-_1" '. 1 Hz • . • . ,1.0 _ 75
0.5 __ .. 7 m._ "'----] 50
0.0 _ - 25
0
-0.5
o t4 Tern peratu re 22 5
3- h --_ _ _ 200
HI[ .. "._____-_=......... ----_ooo.....t_ooo ..,,,r-_ .... _..:..'_... .... -T.-_7:.,.-'_..:-':
-1 _ ......i OooH, | 7s
-2 _;_//: _ 50
-4 200 2500 50 100 150
Time (rain.)
3"O
E
O
-H(D
3"O
E
Ov
Figure 4.12. Permittivity and loss factor versus
temperature for 2:1 BMI:MDA heated to 220 °C.
time and

146
At the higher frequencies, the permittivity does not
change greatly with time. For the lower frequencies, the
permittivity initially increases as the cure temperature
approaches 156 °C. Then the permittivity falls. The broad
width of the first peak, compared to the peak widths in
Figure 4.11, could be the result of both chain extension
and crosslinking reactions occurring almost simultaneously.
After the amine is depleted, the BMI crosslinking reaction
occurs as the temperature approaches 220 °C, as indicated by
another rise in the permittivity.
The loss factor maxima occur at a temperature lower
than the final cure temperature. The chemical reaction
onset is marked by a sudden drop in d_"/dt at 36 minutes and
167 °C. Again, this reflects the decreasing mobility of
ions with molecular weight buildup.
As the temperature further increases to 220 °C,
segmental mobility of the "gelled" material increases as
evident by a slight increase in the loss factor. This is
due to ionic conduction, which is predominantly diffusion
controlled. The further increase in temperature
facilitates the chemical reactions between the remaining
76unreacted molecules.

147
According to Kranbuehl, 72 another way to view data from
Figure 4.11 in order to differentiate the dipolar and ionic
contributions to the loss term is with a plot of log (_" *
_), versus time, where _ : 2_f and f is the measurement
frequency. Plots of the product of angular frequency (_)
and the imaginary component of the complex permittivity
_"(_), (_" * _), allow the visual determination of frequency
dependent molecular mobility. When the (_" * _) curves
differ at each frequency, the dominant molecular process is
due to rotational diffusion of dipoles. When the (_" * _)
curves overlap, the dominate molecular process is
translational diffusion of charged species. The ionic
component usually dominates the loss factor at low
frequencies, at low viscosities, and/or high temperature.
The ionic properties are determined by charge
diffusion, the hindered translational mobility of the ions
within the material, and the interaction with other charged
species in the network. 38 The dipolar component dominates
the loss factor at high frequencies and high viscosities.
Figure 4.13 shows the (_" * _) plots versus time and
temperature for the 165 °C/220 °C cure of BMI:MDA in a 2:1
mole ratio. Initially, at low frequencies (less than 1,000

148
7
6
5
$,, 4
=_v
03o 3_1
2
/
250160 C Cure
100,000 Hz
_1 _ 220 C Postcure
0,000 Hz
0.1 Hz
0 ,uz. I I - 0
0 100 200 300 400 500 600
200
-4
- 150 3
C"=1
- 100 oC)
- 50
Time (minutes)
Figure 4.13. (¢" * _) plots versus time and temperature for
the 165 °C/220 °C cure of BMI:MDA in a 2:1 mole ratio.

149
Hz), the loss factor plots overlap, indicating an ionic
translational contribution. The rise in the (_" * _) curves
represents a decrease in viscosity due to the pending
exotherm. The time at which the low frequency (_" * _)
curves reach a peak is when ionic mobility and resin
fluidity are maximum. The time at which a peak occurs also
typifies the time occurrence of the mean dipolar relaxation
time, _ : I/(2_f).
The mean dipolar relaxation time is the
"characteristic time" needed for the majority of dipoles to
respond completely to the alternating electric field and to
overcome the viscous drag of the surrounding molecules. 74
The mean relaxation time is a first order response and is
used to characterize the magnitude of the rate of a
material's time-dependent elastic response. Strictly
speaking, the mean relaxation time is the time required for
the material to reach (I - (i/e)) or 63.2% of the ultimate
retarded elastic response to a step change.
In most systems, a distribution of relaxation times
will be observed. A distribution of relaxation times is
due to a combination of molecular phenomena such as the
presence of more than one polar species, the asymmetrical
shape of the polar groups, and the strength of the intra-

150
and intermolecular forces. 38 Dipolar relaxation times
usually become shorter at successively higher frequencies.
This results because the viscosity decreases while the
temperature increases. However, as the cure proceeds,
larger and more complex molecules are produced. The large
chains interfere with the movements of the dipoles and
cause an increase in the relaxation times.
At the first sign of the (_" * _) peak, the exotherm
reaction begins. As the temperature increases, the (_" * _)
curves do not overlap, indicative of rotational diffusion
of dipoles. At high frequencies (greater than I0,000 Hz),
the curves do not overlap at all, indicating that at high
frequencies more energy is required to align and move the
dipoles than what is available. When the temperature is
increased to 220 °C, thermal energy supplied to the system
results in the ionic translation of the ions at frequencies
less than 1,000 Hz.
It is not possible to compare qualitatively the
permittivity and loss factors of each cure condition due to
inconsistent temperature ramping of the oven. Therefore,
(_" * _) curves were constructed for each cure condition.
The combination of the ionic and dipolar mobility is useful
in cure monitoring for the determination of the point of

151
maximum fluidity, onset of reaction, and the approach of
the reaction completion. Cure variables such as time until
the exotherm, time until dipolar relaxation, end reaction
time, and the glass transition temperature were determined
from each (_" * _) plot in order to compare the system to
system cure conditions. Tables 4.1 - 4.3 consist of times
and temperatures of exotherms, relaxation peaks, and the
occurrence of the end of the reactions for BMI:MDA,
BMI:DDS, and BMI:DABA. The time and temperature of the end
of the crossover point of the
listed for each cure history.
(g" * _) curves were also
For the high-temperature
conditions, the times reflect when the temperature was
raised for the "high-temperature cure" condition.
4.3.1. Low/High Step Cure Condition: BMI/MDA
4.3.1.1. Low-Temperature Cure
For the low-temperature conditions of 2:1, 4:1, and
I:i mole ratios of BMI:MDA, the times and temperatures of
the exotherms or maximum fluidity and ionic mobility all
occur at approximately the same time and temperature, 21
minutes and 140 °C, as shown in Table 4.1. This temperature
was then used as the low-temperature cure condition for the
rest of this investigation. No process window was observed

152
o.,-t
r_
,--t0
o_
o
r_
.-a m
0
03®
-,.-t
(1)Q_0
U-_1
U
,-I
-,-tED
_o u
0 E_
u]0 (D
(..) -_-t "
o I.D _ D_} [-0 0 13)l.n Oo kD P_ LO O0 {'_
0if)
0CO _ cq
H oq H o,,1 _ oq
O -,H o E_o
O H
[-7-] (1] II _
_= "--_.,_ :>_
oq 0o _ P-.- _ 0o ',<r'u_ cq ',D H u_ _ ',.D
k.OOh p.-
',D Or H Oh
LP _ v
O"',
N _o ::z: _ o_
-,H (1).._ o E._
o
r_ m,-H II
a::;
× _._
Z Z Z Z Z
O O O O u")u_ Oq kD O.I u_
Oq _ C'-,1 H
Oh CO "<I" E_C'q O-,I C_ O O_
O4 ,r-I 04
u_
<D <D <D _-_ --
k._ co _ LID O
Cq _ O,,I r'-I
,< (1) 0 -H 0 -H 0n ,__{ ,--1 _ _ _
ffl U') ......
,--t0 if-)kD
@
Z Z X]O
_9
4mO
o _ _-_cJ _o _L
$
0o <D
o4 r-_
o eJ
o4 uu O
O
O_o_9O
_ rO
0
Z

o-,]
®,--t..Qn3E_
H
75
n5
O
C)
@
4-}n_
O{m
OE-_
I
-,-I
v
O-,-.I4mn5
(P
O
oo
o,]
r_
c_-,-I
<C]Z
H
q-4O
D]@
4-}
(DD..,O
Q
4-}O(D
,--I(D
.,..q
O_>O03
O
C)
E1 {..)0 o
E-_
OaO0,:-¢
r-tCo
OqL_
00r"q
N D. _ O LDX _ _ rO I I O I r-.I12_ _J o I I I
o [__ _ ('q o.1o
0 _-_
@ _ o oII _ I I o I
D. _ 0 0 0"] 00 0.1
• _- <D ,__t 09 uu o
O _ _ _-I _._
(D
H
O
4_CO×
0
0 0 00
0 0 0,-_ ___ _-_
N
v
oi--I
× _ o <D I I I• o I I I
0c_
, , ,
0×
D. _ 0 0 _ _ Oq
_4 0 o
_ <o <D LO0 "_ _ _ _ o_ o_
N
_D0
v
E
H
rno
<o
<D
_o
c_
@
D..,
(P
i1}
Er8
O O OO
O OO
×
(D
-,-I
<rm
H
_n
.,-i_r_
H
m
153

154
0
0
0
-H
>
H
H
0
©
-_I
©
4-J
U®
@
r_
o E_O3
O3
o _'_
O
H
OI
I,--t
O oqr--t I kD
r--t
O-1
O
00
r--4
IC',I Ir-t
LO O O (2O O Lr)ID", L) CO u-> r--.- "<, 0o ',_
o,.--t C'-.J i--I C',,I _ ('q
O "H O E'_4-) O
r.-L] (b II _ E:r',': -,-q
_._
Lrb 0 Oq 0 _-_ r"_
O0 u-) LC) d3 CO _<P
r-_ C',J r-q 04 r-_ C'q
(N1 O OOh O O,-.-I _
LOoh
LO
"<r'"<t'
Z Z Z Z Z Z
0 0 0 0O0 L_ CO Lr)
o,.! _-I c,,I
c'q I__--I E_- '._C'q _ o4
o o• 6-" ,-_ Cq
0 "_ _ ou r_ ._ <g
4_ 0n5 0
,-t
_ (1) v _ C',I ,----t O,1 ,---t O4
X:.._
O ® _ _ u-)
-H LO r"] LO _ O,,I
0 -H 0 "_
O0
I II I
Lr]LO
O
O,r--I
Z
Lr]
LO,--'1
0
C'q
_g
_0
0 "_ 0
nn
.°
O
C'q
O4
C'q
O.1
O
O,1
Z
O
O,1
O.1
if')
O4
O,1
O
O4
-,-t

155
for any of the cure conditions; the peaks all had one
maximum at the same time and temperature.
The relaxation times for the 3 mole ratios were again,
similar, 16 minutes at 133 °C, at f : I00 Hz. The peaks
coincide at the same time and temperature in the loss
factor, indicating that dipolar rotational diffusion
processes control all the mole ratios for the low-
temperature condition.
An Arrhenius plot of log conductivity versus
I/temperature should yield a straight line if there is a
single relaxation time. 79 The slope of this line is the
"apparent" activation energy. In the frequency range of
0.I to i00 Hz, a single line with a slope of 12.76 can be
drawn through the data from room temperature to 155 °C,
Figure 4.14. Therefore, the single line in this case
represents a single relaxation time. At the higher
frequencies, greater than I000 Hz, a distribution of
relaxation times exists.
With increased molecular size and more molecular
interactions, a wider distribution of relaxation times
results. The more rigid the network environment, the wider
the distribution of relaxation times due to the segmental
chains inability to follow the alternating fields. B° The

156
-6216
I
Temperature (°C)
162 108I I
54I
-8-
:__ -10 -O
"O
OOu_ -12 -0
_.1
-14 -
100,000 Hz
B:M 2:1
10,000 Hz
! ' 1000 Hz
i'i 12.76 \'_\\\ ,oo.z
LJ 0.1Hz
I I-162.0 2.5 3.0 3.5
1000/Temperature (K)
Figure 4.14. Arrhenius plot of log conductivity versus
1/temperature for BMI:MDA in a 2:1 mole ratio for the low-
temperature cure condition.

157
establishment of a distribution of relaxation times,
however, has not been correlated to the molecular structure
of the sample.
The most direct evidence for a distribution of
relaxation times is the departure of the Cole-Cole plot
from a semi-circle. 43 The Cole-Cole plot forms a
symmetrical arc whose intercepts are _u, the unrelaxed
permittivity and _r, the relaxed permittivity. The arc's
maximum observes the following relationship:
_max < (_r -- _u)/2. (4.2)
Figure 4.15 is a representative Cole-Cole plot for a 2:1
BMI:MDA cured at 165 °C and postcured at 220 °C. When the
Cole-Cole plot is skewed at the low permittivity end of the
plot, conductivity contributions dominate. When the Cole-
Cole plot is skewed at the high permittivity end of the
plot, a distribution of relaxation times is responsible.
The arc in Figure 4.15 does not continue to be circular at
the high permittivity end of the plot, indicative of a
distribution of relaxation times and an increase in ionic
conductivity. The beginning of the arc passes through the
origin, which means that there is no blocking layer ion
build up at the electrodes at very low frequencies.

158
1000
80O
o 600
Ii
o_
o 400._1
200
0
2:1Cured 165 °C/220 °C
Oo0
0
0
0 50O 1000 1500
Permittivity
2000
Figure 4.15. Cole-Cole plot for 2:1 BMI:MDA cured at 165 °C
and postcured at 220 °C.

159
The crossover or overlaps in (_" * _) for differing
frequencies, indications of when and at what time ionic
translation diffusion dominates physical processes, are
tabulated in Table 4.1. The overlaps occur up to 41
minutes for I:i, up to 50 minutes for 2:1, and up to 80
minutes for the 4:1 mole ratios of BMI:MDA.
At cure temperatures below 180 °C, the amine addition
reaction occurs at least two orders of magnitude faster
than the homopolymerization reaction. 22 The stoichiometric
amounts of BMI and MDA theoretically result in long, linear
chains of relatively high molecular weight. The 2:1 and
the 4:1 mole ratios of BMI:MDA are amine deficient and
during the low-temperature cure, excess BMI remains
unreacted. The higher the BMI concentration, the more
diffusion-controlled reactions occur.
For the 1:2 mole ratio of BMI:MDA, the time to
exotherm, or maximum fluidity and ionic mobility was
slightly longer (36 minutes) at a higher temperature of 152
°C than the other low cure conditions, Table 4.1. The 1:2
mole ratio of BMI:MDA contains excess of MDA; during curing
the chain ends become endcapped with MDA. The BMI is
therefore consumed early and very little BMI remains for
crosslinking. The end of the reaction for the 1:2 mole

160
ratio case was 151 minutes at a temperature of 164 °C while
the crossover or overlap in (_" * _) extended for 25 minutes
up to 135 °C. For the first 25 minutes, the curing reaction
of 1:2 mole ratio of BMI:MDA is controlled by ionic
translational diffusion. Then the short, MDA endcapped
chains no longer translate but rotate about the center axes
of the chains.
Glass transition occurs when the conductivity
approaches zero. In this investigation, the Tg was always
the final cure temperature. The glass transition
temperatures, determined from the dielectric analyses do
not take into account physical entanglements.
4.3.1.2. High-Temperature Cure
Figure 4.16 is Figure 4.12, replotted as (_" * _) plots
versus time and temperature for the high-temperature cure
of BMI:MDA in a 2:1 mole ratio. The double peak for the
0.I Hz is probably due to charge polarization effects of
the electrode for the low frequency and indicates a highly
fluid system. BI There are two major peaks observed in the
high-temperature cure of BMI:MDA. The first major peak for
a given frequency is due to the initiation and propagation
of the BMI:MDA oligomers. For low frequencies (less than
i000 Hz), the (_" * _) plots for differing frequencies

161
£
%V
0
6
5
4
3
2
0
-1
-2
I I I I
Temperature
100,000 Hz
0
10,000 Hz
BMI:MDA 2:1
I I
50 100
I I
150 200 250
Time (min)
250
225
200
175
150
125
100
75
5O
25
0
-4(1)3
"'1
(I)
O
Ov
Figure 4.16. Data from Fig. 4.12, replotted as (_" * _)
plots versus time and temperature for the high-temperature
cure of BMI:MDA in a 2:1 mole ratio.

162
exhibit a coincidental peak. The curve beyond the peak
falls gradually due to the increasing viscosity with
increasing molecular weight. The first peak exhibits a
broader width due to the occurrence of both amine addition
and BMI homopolymerization reactions.
The first peak's time and temperature, or the
relaxation time and temperature are 31 minutes and 156 °C,
(as shown in Table 4.2). This is slightly longer than
exhibited for the low-temperature cure condition in Table
4.1. However, the broader width of the peak indicates a
wide distribution of chain lengths.
The relaxation times differ for each frequency when
the temperature approaches 220 °C, Table 4.2. Different
peak times imply a frequency dependent process. The
characteristic times increase from 91 minutes to 146
minutes as the frequency decreases from I000 Hz to 1 Hz.
Hence, the dipole relaxation occurs sooner at higher
frequencies. Also, the relaxation times decrease as the
temperature increases due to an increase in dipolar
mobility. This is due to a buildup of resin viscosity.
The end of the reaction occurs after 220 minutes at f : i00
Hz. Up to 81 minutes of the cure, the reaction is
controlled by translational diffusion of the charged

163
species. After that time, the translational movement of
unsaturated imide groups is restricted.
For the high-temperature cure of BMI alone, only the
homopolymerization reaction occurs. The time of the
exotherm is 156 minutes for all frequencies. This implies
that the polymerization is a frequency independent process.
The relaxation time at f = i00 Hz was 150 minutes. The
times of the exotherm and relaxation for BMI are longer
than the times of the exotherm and relaxation at f = I00 Hz
for all mole ratios of the BMI/MDA system. Pure BMI forms
a network of short chains. With the addition of MDA, at
high temperature, BMI can react with MDA or with another
BMI. Since the BMI/MDA rate of reaction is faster than BMI
homopolymerization rate of reaction, the addition of MDA at
high temperatures produces a frequency dependent process
with shorter exotherms, relaxation times, and end of
reaction times than BMI alone.
4.3.2. Low/High Step Cure Condition: BMI/DABA
4.3.2.1. Low-Temperature Cure
For the low-temperature conditions of i:I, 2:1, and
1:0.87 mole ratios of BMI:DABA, the times and temperatures
of the exotherms or maximum fluidity and ionic mobility all
occur at approximately the same time and temperature, 50

164
minutes and 170 °C, Table 4.3. This is within the
supplier's 49 recommended cure history of 177 °C for 18
hours. No process window was observed for any of the cure
conditions; the peaks all had one maximum at the same time
and temperature. In the temperature range of 140-250 °C,
the copolymerization reaction of BMI and DABA occurs
through the double bonds, otherwise known as the 'ene'
reaction.
The relaxation times at f = i00 Hz for the 3 mole
ratios were again, similar, roughly 41 minutes at 170 °C,
Table 4.3. This means that the peaks coincide at the same
time and temperature for the (_" * _) plots, indicating that
dipolar rotational diffusion processes control all the mole
ratios for the low-temperature condition.
The crossover or overlaps in (_" * _) for differing
frequencies, indicate when ionic translation diffusion
dominates physical processes. The overlap times, listed in
Table 4.3, occur up to ii0 minutes for I:I, up to 162
minutes for 2:1 and up to 120 minutes for the 1:0.87 mole
ratio case. After these times, the translational movements
of the unsaturated imide groups are restricted.
The end of reaction times at f : I00 Hz for the three
mole ratios occurred at roughly 180 °C for the I:I and

165
1:0.87 mole ratios and at 153 °C for the 2:1 mole ratio of
BMI:DABA, Table 4.3. The times for the I:i, 2:1, and
1:0.87 mole ratios of BMI:DABA were 192, I00, and 146
minutes, respectively.
Glass transition occurs when the first derivative of
conductivity (d_/dt) approaches zero. However, in the
dielectric analyses, the Tg was always the final cure
temperature.
The Cole-Cole plot of BMI:DABA in a 2:1 mole ratio
cured at 155 °C is shown in Figure 4.17. Since the plot is
semi-circular and follows Equation 4.2, a single relaxation
time may be assumed. 43 Because the arc passes through the
origin, no blocking layer buildup occurs on the electrode.
4.3.2.2. High-Temperature Cure
For low frequencies (less than i000 Hz), the (_" * _)
plots for differing frequencies exhibit a coincidental
peak, Table 4.3. The first major peak for a given
frequency, is due to the formation of the BMI:DABA
oligimers occurring during the 'ene' type chain extension
reaction. The peak falls gradually due to the increasing
viscosity with increasing molecular weight.
The peak times and temperatures, or the relaxation
times and temperatures at I00 Hz are 31 minutes and 247 °C

166
1000
8OO
'- 600O
Om
LI_
U)U)O-- 400
2OO
0
Gw
O
#
o@
-/9
@
I I I
BMI:DABA 2:1 Cured to 155 °C
cD_o QDO0 04) C_0 0 0 0 0
qb
0
%0
0
0
I I =_-=
0 500 1000 1500
Permittivity
2OOO
Figure 4.17. Cole-Cole plot of BMI:DABA in a 2:1 mole
ratio cured at 155 °C.

167
for the I:i case, 11.5 minutes and 217 °C for the 2:1 case,
and 21 minutes and 247 °C for the 1:0.87 case, Table 4.3.
These are shorter than exhibited for the low-temperature
cure conditions. After the diallyl component is exhausted
in the _ene' reaction, the maleimide homopolymerization
reaction occurs at temperatures above 200 °C.3_
The end of the reaction at I00 Hz occurs after I00
minutes for the i:i case, 36 minutes for the 2:1 mole
ratio, and 41 minutes for the 1:0.87 mole ratio condition.
Only the 2:1 mole ratio case exhibited a crossover behavior
for II minutes. The reaction for the 2:1 mole ratio is
controlled by translational diffusion of the charged
species at the high temperatures.
4.3.3. Low/High Step Cure Condition: BMI/DDS
4.3.3.1. Low-Cure Condition
Table 4.3 also includes the results of BMI:DDS in a
i:i mole ratio cured at 165 °C to simulate the low-
temperature cure condition. The relaxation time and
temperature at I00 Hz were 42 minutes at 160 °C. The
exotherm occurred at 46 minutes at a temperature of 161 °C.
These time parameters are slightly double those observed
for BMI:MDA in a I:i mole ratio listed in Table 4.1. The
-SO2 group in DDS delays the reactivity of the diamine due

168to its high electron attracting power. This fact decreases
the basicity of the diamine by transferring electrons from
NH2 to the SO2 group. The chemical reactivity of MDA would
be faster than DDS at the cure temperature of 165 °C because
the -CH2 group is an electron donor and therefore, MDA would
be more reactive than DDS.
4.3.3.2. High-Temperature Cure
Table 4.3 illustrates the processing parameters of
BMI:DDS for the high-temperature cure condition. The
relaxation time and temperature at I00 Hz are 12 minutes at
195 °C while the exothermic reaction time and temperature
are 17 minutes at 202 °C. These are much faster than those
observed for BMI:MDA cured at high temperatures, Table 4.1.
In cure monitoring by dielectric analyses, it is hard
to use empirical approaches to correlate the chemical
changes of molecular structures to the physical processes
such as dipoles and ions responding to the alternating
electric field. These approaches oversimpifly chemical
kinetics and do not take into account chemical reactions
such as branching or autocatalytic mechanisms. In our
case, dielectric analysis was used to determine the
processing variables of bismaleimides.

1694.4. Network Characterization
4.4.1. Differential Scanning Calorimetry of BMI/MDA and
BMI/DDS
Differential Scanning Calorimetry (DSC) is a valuable
instrument, which can be used to determine the range of
temperatures in the curing reaction and can be used to
follow cure advancement. In using DSC, the heat evolution
during polymerization is assumed to be proportional to the
extent of reaction. 82 DSC can also determine the curing
kinetics of polymerization of a polymer system. BMI
appears to be an exception because the melting point of BMI
is close to the temperature at which thermal polymerization
begins, approximately 155 °C.83 The melting points of BMI,
MDA, and DDS are 155, 89, and 176 °C, respectively.
Figure 4.18 shows a DSC scan for unreacted BMI:MDA
powder in a 2:1 mole ratio. Prepolymer blends of powders
show two adjacent melting endotherms and a broad
polymerization exotherm. The respective endotherms of the
two components are slightly shifted to lower temperatures
and are broader than the actual melting endotherms of the
individual components. With the addition of MDA to BMI,
the melting point of the mixture is lower with increasing
molar ratios of MDA. The powder melts before curing

170
E
O
0.16
0.08
0.00
-0.08
-0.16
.... I''''1 .... I .... I''''
B:M 2:1 Powder
B:M 2:1 6hr @ 220 ° C
B:M 2:1 10hr@220 °C
._ ! BMI-MDA Reaction/
_ HomopolymerizationReaction$
Intramolecular attack
.... I i i , , = .... I .... I ....
0 100 200 300 400 500
Temperature (°C)
Figure 4.18. DSC scans of unreacted powder and samples
cured for 6 and I0 hrs at 220 °C of BMI:MDA in a 2:1 mole
ratio.

171
begins. The first exotherm in the DSC plots is due to the
BMI/MDA reaction and the BMI homopolymerization reaction.
A second exotherm is obvious after the main
polymerization peak, in Figure 4.18. Barton et al. 83 found,
through FTIR studies, that during the second exotherm the
concentration of maleimide bonds decreased and alicyclic CH2
groups increased. Barton determined that a possible
reaction was the intramolecular attack of the maleimide
groups off of the phenylene ring and forms a bridged ring
structure shown below: 83
O
N'__CH2"_ m CH2_
O
The blended powder was cured for 6 hours and I0 hours
at 220 °C and then analyzed with DSC to determine the
minimum time needed to completely cure the BMI:MDA system.
This was resolved by determining when the polymerization
exotherm peak of the DSC scan was minimized. For the high-
temperature cure, the minimum time required for curing was
6 hours.

172
No changes in the exothermic peak were observed from 14
to 18 hours with DSC at 140 °C. Therefore, 16 hours was
used as the cure time for the low-temperature cure.
Figure 4.19 illustrates the normalized DSC scans for
unreacted powder, and after low-, high-, and low/high-
temperature cure conditions for BMI:MDA in a 2:1 mole
ratio. For the powder, the melting endotherms are broad
and lower than normally observed for each of the components
individually. Chain rotation energy is lower in the
blended material than for the pure components. 84 The
endotherms are followed by a broad exotherm. Here, both
chain extension and BMI homopolymerization reactions will
occur simultaneously. For the low-temperature cure, there
is only one endotherm followed by a large, broad exotherm.
Curing starts immediately after the endothermic peak of
BMI. The large exothermic peak is due to the
homopolymerization reaction of the BMI-endcapped chains.
In Figure 4.19, an endotherm also appears at
approximately 165 °C for the low-temperature cure. This is
due to the presence of unreacted BMI that remains in the
low-temperature cured material since the curing temperature
was only 140 °C. Presumably, only chain extension has
occurred up to 140 °C. After 140 °C, unreacted BMI will

173
0")
E0(1.)
0
0.10
0.08
0.06
0.04
0.02
0.00
-006
I
BMI:MDA 2:1
Powder
I I I
High Cure
\\
\
Low/High Cure
-008 t I i I0 100 200 300 400 500
Temperature (°C)
Figure 4.19. Normalized DSC scans of unreacted powder, and
samples cured at low-, high-, and low/high-temperature
conditions of BMI:MDA in a 2:1 mole ratio.

174
melt at its normal melting temperature (156-159 °C At
higher temperatures BMI-endcapped chains will begin to
homopolymerize, which contribute to the polymerization
exotherm.
The high and low/high cure conditions exhibit small
endothermic peaks before displaying a polymerization peak
or exotherm in the temperature range of 200-300 °C. In the
developing network, the loss of mobility of the reacting
molecules results in an incomplete reaction. When more
thermal energy is added to the system, such as in DSC
analysis, the molecular mobility of the reacting molecules
increases and further reacts. Thus, the temperature of the
polymerization or exothermic peak increases over that of
the powder.
The following temperatures were determined from DSC
curves and are listed in Table 4.4: Tm, the endothermic
temperatures associated with melting, Te×o, the temperature
corresponding to the exothermic peak, TI, the temperature of
onset of the cure reaction, and T2, the temperature at the
completion of the reaction. As the amount of amine
increased, a decrease in Texo was observed. The
polymerization of BMI can be initiated at lower

Table 4.4Critical Temperatures Determined by DSC for BMI:MDA and
BMI:DDS Systems.
175
Sample Tendo Tendo TI Texo T2
(°c) (°c) (°c) (°c) (°c)
BMI:MDA
2:1 Powder 60 125 140 219 295
4:1
Low 165 -- 188
Hi 265 -- 280
Low/Hi 248 -- 260
Powder
Low
Hi
Low/Hi
59 141
141
169
186
315
270
309 *
330 *
310
226
257
275
I:I Powder 51 113 145 209 270
Low -- 172 270 328 *
Hi -- 226 273 329 *
Low/Hi -- 219 274 319 *
BMI:DDS
12551
5O
I:I Powder
Hi
2:1 Powder
Hi
202
353
206
280
77
75
62
*Reached machine limits.
261
367
256
423
137
362
3OO

176
temperatures by incorporating a strong nucleophillic
diamine.
Figure 4.20 is a composite graph of normalized DSC
scans of BMI:MDA in a 4:1 mole ratio. The DSC scan of the
low-temperature cured material exhibits a slight exothermic
polymerization peak and no others. The low/high- and high-
temperature cure conditions exhibit no endotherms for the
melting of BMI or MDA and no exotherms below 300 °C. After
300 °C there is evidence of an exothermic peak, which is
probably due to the intramolecular attack of maleimide
groups attached to the phenylene groups.
For the i:I mole ratio of BMI:MDA, more MDA is
present, which reveals itself as a sharp endothermic peak
at approximately 50 °C, (Figure 4.21). Only the DSC scan of
the powder exhibits the presence of the second exotherm at
temperatures exceeding 300 °C before degradation begins.
For the low-temperature cure condition, an endotherm
appears at approximately 175 °C, which is due to the
presence of unreacted BMI in the material. The endothermic
peaks for the high and the low/high cure conditions are due
to the unreacted BMI melting before polymerization begins.
Figures 4.22 and 4.23 are normalized plots of DSC
curves for BMI:DDS in a I:I and 2:1 mole ratios. Both the

177
0.20
0.15
0.10
a) 0.05E
0.00
m
:_ -0.05
-0.10
-0.15
I I I I
BMI:MDA 4:1
owder
Low / /f_'---
•
f .... _ Low/High Cure
.___. .." High Cure
-0.20 i i t t
0 100 200 300 400 500
Temperature (°C)
Figure 4.20. Normalized DSC scans for unreacted powder,
and samples cured at low-, high-, and low/high-temperature
conditions of BMI:MDA in a 4:1 mole ratio.

178
0.08
0.06
0.04
a_ 0.02E
0.00
-0.02
-0.04
-0.06
I I I
BMI:MDA 11
\
I-0.08 i I I0 100 200 300 400 500
Temperature (°C)
Figure 4.21. Normalized DSC scans for unreacted powder,
and samples cured at low, high, and low/high-temperature
conditions of BMI:MDA in a I:i mole ratio.

179
0.20
0.15
0.10
0.05E(J
(n 0.00
t_O
-0.05
-0.10
-0.15
I
BMI:DDS 2:1
I I I
Powder
:\I \
//
// High Cure
./
-0.20 i i i i0 100 200 300 400 500
Temperature (°C)
Figure 4.22. Normalized plots of DSC curves for BMI:DDS in
a 2:1 mole ratio.

180
0.20
0.15
0.10
o) 0.05EOa)(_ 0.00i
0
-0.05
-0.10
-0.15
I
BMI:DDS 11B
I I I
Powder
f7
High Cure
\
-0.20 t t t t0 100 200 300 400 500
Temperature (°C)
Figure 4.23. Normalized plots of DSC curves for BMI:DDS in
a I:I mole ratio.

181
figures exhibit three endotherms for the powders. Table
4.4 lists the results of the DSC curves for the BMI:DDS
system. The exothermic peaks for the 2:1 and the I:i mole
ratios are due to the Michael's addition reaction between
BMI and DDS. Strong electron withdrawing groups such as
DDS, present in the backbone of a polymer will increase the
cure temperature of the polymerization reaction and will
reduce the reactivity of the maleimide double bond. 85
4.4.2. Gel Point Determination
Up to this point in the research, the temperature and
time of curing for the various systems and conditions have
been determined. The curing process of a thermoset
undergoes several macroscopic changes when the material is
converted to a glassy state by increasing the crosslink
density. Gelation is the formation of a network with
branched molecules of very high molecular weight. At
gelation, the viscosity of the system increases. Since the
DSC does not mark the onset of gelation or vitrification,
gel point determination, or gel time, was used to estimate
gelation. The gel point was determined according to ASTM
D2471. _4
The gel time is an important processing parameter
because it is the point when the resin will no longer flow.

182
Ideally, all processing must be completed before the gel
point is reached. However, gelation does not mean the cure
reaction ends. On a microscopic level, gelation
corresponds to the formation of an infinite molecular
weight network.
Gelation starts at a fixed chemical conversion while
vitrification occurs as a result of reduced degrees of
freedom. Gelation is solely dependent on chemical
reactivities of the functional groups of the resin.
Figure 4.24 is the mole ratio of BMI:MDA versus gel
time in seconds per gram for two curing temperatures, 140
and 220 °C. At 140 °C, as the BMI concentration increases,
the gel time increased, because there is less chain
extension occurring. The time required to form a network,
or the gel point, would be long.
As the BMI concentration increased, the time to gel
decreased at 220 °C for BMI:MDA and BMI:DDS. From Table
4.4, the exotherms for the 2:1 and I:I mole ratios of
BMI:DDS are 256 and 261 °C, respectively. At a temperature
of 220 °C, the 2:1 mole ratio of BMI:DDS would exhibit a
shorter gel time than for the i:I mole ratio. The BMI/DDS
systems exhibited the longer gel times because the
reactivity of DDS is much less than MDA.

183
4.5
4.0
3.5
0"-" 3.0
K..
o 2.5E
<a 2.0
• °
1.5m
1.0
0.5
I
BMI:MDA
220 °C
Z_ BMI:DDS
[] _220 °C
I I
BMI:MDA
BMI 220 °C.- I I I I0.0 ,,
0 160 320 480 640
Gel Time (seconds/gram)
8OO
Figure 4.24. Mole ratio of BMI:MDA versus gel time in
seconds per grams for cure temperatures of 140 and 220 °C.

184
At 220 °C, BMI with or without MDA had gel times in the
range of 80 seconds/gram. The shortest gel time was
observed for the 2:1 mole ratio of BMI:MDA. Presumably, a
2:1 mole ratio of BMI:MDA results in simultaneous
homopolymerization and chain extension reactions in an
optimum ratio. Consequently, the concentrations of BMI and
MDA would be exhausted early at high temperatures.
4.4.3. Gel Permeation Chromatography
Gel Permeation Chromatography (GPC) is a useful tool
for determining the approximate molecular weight
distributions in polymers. Based on size exclusion, a
dilute polymer solution is passed through columns of packed
particles with a porous substrate. The solvent is passed
through the heated columns at a constant rate. As the
dissolved polymer molecules flow past the porous substrate,
they become entrapped in the internal pore structure
depending on the molecule's size. Larger molecules will
only enter a small fraction of internal pores or will be
excluded all together. The larger the molecule the less
time spent within the columns. A concentration-sensitive
detector monitors the difference in refractive index
between the pure solvent and the dilute polymer solution as
the polymer solution leaves the columns. The set of

185
columns of different pore sizes is calibrated so that the
amount of solute versus retention volume can be converted
into a molecular weight distribution. Then based on a
standard calibration scale, the number and weight average
molecular weights may be determined.
The low cure condition samples of BMI:MDA in a 2:1,
4:1, and I:I mole ratio were dissolved in NMP and filtered
for GPC analysis. Figure 4.25 is the number and weight
average molecular weights verses mole fraction BMI. As the
amount of diamine increases, the number and weight average
molecular weights increase. With a higher concentration of
diamine, during the chain extension reaction, long chains
of alternating BMI and MDA are possible. These GPC results
have been confirmed by Leung et al. 28 This data also
implies that the predominant reaction during the low cure
condition is chain extension between the amine and double
bond of BMI since the polymer samples dissolved completely.
4.4.4. TGA/FTIR
TGA/FTIR is a technique used in chemical
characterization of polymers. During TGA weight loss and
its first derivative are monitored versus temperature. The
evolved gases are also captured for FTIR spectroscopy
analysis. The absorbance of infrared light through the gas

186
20000
18000
16000_,OE
14000
12000
"Oc 10000
0 8000E
v 6000
c
4000
20OO
I I I I I
BMI:MDA in NMP Mw
Mn
v
I I I I I
0.90 0.75 0.60 0,45 0.30
Mole Fraction BMI
Figure 4.25. Number and weight average molecular weights
versus mole fraction BMI for the low cure condition of
BMI:MDA in a 2:1, 4:1, and I:i mole ratio determined by GPC
analysis.

187
is measured as a function of the wavelength. The
absorbance spectrum will demonstrate a "characteristic
signature" of the sample. 22 The different peaks in the
spectrum are the result of functional groups present in the
evolved gas. The areas under these peaks are related to
the concentration of the functional groups present. In
this study, several "slices of gas" were passed through the
FTIR for analysis.
TGA/FTIR was performed on the powder samples of
BMI:MDA and BMI:DDS in various mole ratios and for BMI:DABA
in 2:1 and i:I mole ratios in nitrogen. Initial weight
losses of 2-11% were observed in the temperature range of
325-475 °C. These initial weight losses were followed by a
major weight loss at Tma×. The weight remaining and the
first derivative of weight loss versus temperature for
BMI:MDA in a 4:1 mole ratio is shown in Figure 4.26.
Although BMI:MDA's weight loss typically displayed only one
weight change rate with respect to temperature, the initial
portion of decomposition is quite rapid. According to
Ninan et al. 86 the extent of crosslinking is less than the
extent of bond rupture when decomposition is rapid. The
TGA results for all the samples are listed in Table 4.5.
The IDT, or the initial decomposition temperature for the

188
v
¢-.
t'-
t_
E
r_
t,--
110
100
9O
8O
7O
6O
50
I
BMI:MDA 4:1
IB
m
i
1.0
- 0.8
O(1)
- 0.6 -"<
tb
0.4
ZT
0.2 _-
0.0
40 i t J i i i t m0.20 100 200 300 400 500 600 700 800
Temperature (°C)
Figure 4.26. Weight percent remaining and the first
derivative of weight loss versus temperature for BMI:MDA in
a 4:1 mole ratio.

LO
@
n_
O9
@
0
0C5
n5m
IH
0-_1
n_>
4_
k_
0
-,-I4_
0_q
©E_
o_O
C_
o\O
4J
ou
q-4
E_
o\O
Uo
×
o\o
4-J
ov
m
@
,---t
C_
o
00 OO
u")
CO0qk.0
O'hkO
Oqu'b
r-'-O_
l"'-
@
O
H
o
!,---I O
r"-
Lr_LD
OU_k.0
Oh
1""-
O400
U")O'h
kO
0
n
H
L)o
L_ 0Lr_ 0
',..0
0p.-
kOp._
Lr)
Oh
O0
_P
0
Uo
LO 0LQ O
k.0
Ohk.0
k.0
d-')r"-
k..O
UD
CO
k.0Oh
LPo
u'b Ok.OI
r--I
u")E"-
OCO
u3
O,,IO%
c,"b
-,-I
O
L_o
O
u'_ O
0Ou'b
Oh
k..0
00
k.0
E--O_
Oh
(30
'O
O
n
H C_
L_o
0_ O
0
O0
Cq
O0
O0
O0
Cq
0
0
_Po
0
0
C_
C_
O0
@
0
r_
oo oo
H
C;o
CO 00kP
0"_
Lf3
L_
L_
u_O_
Ou")r'q
O
LPo
O_ O,,_ O
kP_
k.O
f..._k.0
E"-
C_
O'h
00uDcO
-,H
0
189

o\O
o\O
u u _O O O O
CD r-_ CD CO C> {3O C_
O
0 0er} 0
p-..
{..)o
¢x1 0
eq 0
_D Oh kip _ ¢XI 0
190
uov
E-_
O'_ O Oxl Oh _ OD
k.O ',_ k.O k.D kD "¢:I"
4-1
OO
ca
o_O
ov
n_
E-4
o_O
Oh O _ 0,4 OE"_ I"_ _ F"_ k.D P"-
O"1 Oh CO 0"} Oh l_
O,1 O k..O kid
E"_ _ E_ _ _O_ O'h Oh O'h a_ 0%
o
E_ c,oc'lH
@,.-H
cO
OO _ Oq OhO O-1 O O
x_o o _._
09n
X
_ 00 _0 o0
_ H TM _
r---
191
powder 4:1 sample was 464 °C while the Tma x, or the
temperature of maximum rate of weight loss is 482 °C. Tf,
or the final decomposition temperature was 650 °C for the
4:1 powder sample. The char yield at 700 °C was 51%. For
the other cure conditions in a 4:1 mole ratio, the TGA
results are virtually identical, Figure 4.27. The other
mole ratios of BMI/MDA at various cure conditions display
similar results. In Figure 4.28, as the amount of diamine
increases for the remaining powder samples, the thermal
stability decreases, determined by IDT and Tma x. With the
addition of the -NH- linkage, the thermal stability is
lower than for BMI alone. The longer chains result in a
87decrease in thermal stability.
Small amounts of the evolved gas from the TGA analysis
were passed through a Nicolet FTIR for characterization. A
typical FTIR trace with IR band identification of the
evolved gas for unreacted powder of BMI:MDA in a 4:1 mole
ratio determined at 220 °C is presented in Figure 4.29.
Evolved gases, due to the degradation process, exhibit peak
amounts at Tma x. The evolved gas is composed of CO 2 (2359
cm-l), CO 2110 cm-l), and H20 (3750 cm -I) and also contain
the following IR assignments of =CH stretching of maleimide

192
110
100
v
_ 90cc
E 80
w.
cIDo 70
¢-_ 60
°_
50
4O
!
BMI:MDA 4:1
I !
PowderLow Cure '"-
...... High Cure
Low/High Cure
I I I
0 200 400 600 800
Temperature (°C)
Figure 4.27. Weight percent remaining versus temperature
for BMI:MDA in a 4:1 mole ratio after various processing
conditions.

193
120
"-" 100
t_
80
&60
I
Powders
. _ _ ._,._,.,_._,..,,,,_ ..__. _.
BMI:MDA 2:1
BMI:MDA 1:1
BMI:MDA 4:1
BMI
. o
"... \
\:: \
40 I I i0 200 400 600 800
Temperature (°C)
Figure 4.28. Weight percent remaining versus temperature
for BMI/MDA unreacted powders in various mole ratios.

194
O.15-A
b
S
or O.iO-
b
a
n
c 0.05-e
O°
1 I I I I !4000 3500 3000 2500 2000 i500 t000
Navenumber6
Figure 4.29. Typical FTIR spectrum with IR band
identification determined at 220 °C for unreacted powder of
BMI:MDA in a 4:1 mole ratio.

195
(3098 cm-l), aromatic C-C and NH bending (1623 cm-l),
aromatic C-C (1514 cm -I) and C-N stretching (1276 cm-l).
Table 4.6 lists the evolved gas and IR assignments for the
various BMI:MDA and BMI:DDS powders and BMI:DABA samples.
In Figure 4.29, the peak at 1514 cm -z occurs due to
aromatic C-C stretching vibration. C-N-C stretching of the
maleimide groups causes the peak at 1150 cm -I while the 1173
cm -1 peak is the result of C-N-C stretching of the
succinimide groups. These two peaks are closely coupled
and sometimes hard to distinguish in FTIR spectroscopy.
The presence of a peak in the range of 3100-3000 cm -1
represents the double bonds in BMI. This suggests that the
Michael's addition reaction between the diamine and BMI has
not occurred in these uncured powders. 88 The C-N-C groups,
produced by the Michael's addition reaction are easier to
split during degradation than if BMI appeared alone. BMI
does not exhibit the C-N-C stretching of the maleimide
groups during degradation. Therefore, the thermal
stability of BMI is greater than for BMI:MDA or BMI:DDS
copolymers.
4.4.5. Dynamic Mechanical Spectroscopy
A dynamic mechanical spectrometer was used to
determine the theological behavior during linearly rising

196
o3@
o.
cuu_
¢,n
mmH
"D
rU
oeH
ol
_.orU
>
O
-IJ
o3
rvlm
x3
r_
rUL9
"O®
O
i
Ov
4_
rU
4-J
(1)
b_
_dt---q
r'n
rm°°
H v-q
c'n
o°H o,1
U3¢m
°° _H
U_¢hcm H
m Oq
I--q
_EH°° i_
H Oq
n
H r--q
c_
H
O
ou_
o'3
o
oub
r,¢.)
ou"b
r'q
©
o3
O
o
ouhkor',h
"_ ._
(1)
_+oc_
CA
L.) L) ruII tl
-oo -o,.oCD O (_ OOr--t C_ C,,IC_ Oq
"oo o'Oo o% t..o
r-_ C_ (3"_ °°C"3 C'-,I 0,1
I 00
00 0
C_
I 00
000m
C_
I 00
00 0
C¢')O'3
I 00
000r---tC_C'q
I 00
000C_m
I 00 00 0
O'3C_
_ ,X2r.D _ 0
+_® c_
uD
Oq
O%u-_oOCxl
u")oOOq
u'bohOq
O CAc-!
"_ _ "_ 0
rU rU
@ O0 O + ..._ _ _
,_ rg 0
Z CA
c_
c_
coc_
c_kid
Oh 0 rrbuO r-_ ('q03 ,-H t.O
('q Oq r-_
__ ou"9 ,.-I o,.1r'o ,.-.-i kDO,,1 C-,I ,.--I
OhuO
Oq
rv_Cqk.o
Oh O oqu") _ O,1oo 1_ k..OO,,I Oq ,.--I
O OO
o'h
-or-_ 0 I'_uO O0
r-H r-_
rHuOr-_
r'_
UO
r-d
u_H
u-"l
',<r,
u_

OO
<o
_D
c7(DE
O7
O9
r,,
(7 +,°.
H
O3
C_,°
H C'J
O3
O3('7
o° °°
.cO
4J®
zL)
k.o
o,;
,.,p
cq
k.D
C-,1
09, r7
p....O .+ .+
cqv H (_
p....
nJ
o° ooo,I
:--i _-I
r7
o° o,
k.O
O,1
p...Oa
c'0
-,.-t
-,--t
I 0t'- ft.?r_- _r---t ,.._t
0
,---t _
0
r-t r--t
©
®
U? CO
0
0
I0 0
0 O7
@
n5
II
0
u_
<3o
O (DO7
-,-I
0 _ c_ 0 _ _
:_ _ Z0 C) 0
II
ou-)
p_
o_o
t--
ohot_
ou')t_
c)u-)
t_
ouDp_
oLID
C)uUp_
197

198
temperature conditions. Figure 4.30 is the rheological
plot of G', G", and tan 8 for the BMI:MDA sample in a 2:1
mole ratio, cured for 6 hours at 220 °C. Normally, the tan
5 peak is used to estimate the glass transition temperature,
Tg, however, these peaks were often rather broad.
Therefore, in this research, the intercept method was used,
where Tg is the intersection between lines drawn through the
glassy region and the transition region. Even though
figures and tables in this dissertation contain the
designation '_Tg", it is recognized that the glass transition
temperature is an apparent measure, not done at near-
equilibrium but in a dynamic mechanical test. Broad tan 6
peaks may be due to a spread in the crosslink density 89 or
due to the presence of unreacted BMI molecules that act
like a second phase within the BMI:MDA matrix.
For polyimides, a true plateau is never achieved
during dynamic theological measurements because of further
crosslinking as the temperature is increased. However,
when an increase in G' occurs after a minimum in the curve
at temperatures above Tg, the value at the minimum has often
been used to indicate the relative levels of crosslinking.
In this dissertation, the apparent minimum before the

]99
1011
-----101°EO
¢-
_, 0 9
-.o 108t-
L_
107
I I I I 1.0
High Temperature CureG' BMI:MDA 2:1
G"
A
2_
Tan 6
0.8
0.6
0.4
106 0.00 100 200 300 400 500
Temperature (°C)
-4
Oo
Figure 4.30. Rheological plot of G', G", and tan 5 for the
BMI:MDA sample in a 2:1 mole ratio, cured for 6 hours at
220 °C. Frequency of test was 1 Hz.

2O0
increase in G' will be termed the "rubbery minima" although
many authors refer to this value as the rubbery plateau.
4.4.5.1. Rheological Properties of BMI/MDA
Figures 4.31-4.33 are the plots of G', the storage
modulus or in-phase modulus, for the various cure cycles
(high, low, and low/high) for the three different mole
ratios of BMI:MDA. The three different of networks are
formed for the 2:1 mole ratio conditions, shown in Figure
4.31. This is evident by three different glass transition
temperatures and three different rubbery minima. As the
cure proceeds from low to low/high to high the Tg,
determined by the intercept method, increases. The rubbery
minima increase as the cure proceeds from low to low/high
to high, indicating that the molecular weight between
crosslinks decreases as the cure proceeds from low to
low/high to high cure conditions. With increasing
crosslinking, the value of the rubbery minima increases.
The numerical value of a level rubbery minima can be
used as an estimate of Mc, the number average molecular
weight between crosslinks, based on the theory of rubber
elasticity. 57 However, for many reasons, the theory of
rubber elasticity is not valid for highly crosslinked

201
10_
10_o
E 10 9O
O"
E
"O
10 8
10 7
10 6
I
BMI:MDA 2:1
I ' I I
-__ _h• '"'""'""="
• L.H,g \
LOW,#w
0 100 200 300 400 500
Temperature (°C)
Figure 4.31. Plots of G' for BMI:MDA in a 2:1 mole ratio
for the various cure cycles. Frequency of test was 1 Hz.

2O2
1011
101o
E 100{.)O"
c
13
10 8
10 7
10 6
I
BMI:MDA 1:1
0
O
Low Cure o
O
°_ oO
High Cure
o,
Oeo, Low/High
O
oo • ",J,_"0 _>
• , i i I i i i
100
o O°° 0o(900 o 0<>o° 4P
0 0
0 0
0 0
I * 'O i I i I ! ' '
200 300 400
Temperature (°C)
Figure 4.32. Rheological plots of G' for BMI:MDA in a i:I
mole ratio for the various cure cycles. Frequency of test
was 1 Hz.

203
1011
10 lo
E 10 9o_r(/)t--
"(3
10 8
10 7
10 6
I I I I
High}ure[]LDk
[]
BMI'MDA 4"1
[]
o o
0
i i i I . , . l . , , I , i i I
100 200 300 400 500
Temperature (°C)
Figure 4.33. Plots of G' for BMI:MDA in a 4:1 mole ratio
for the various cure cycles. Frequency of test was 1 Hz.

204
systems, but has been shown to be useful for an
approximation or relative ranking of Me within a system. 9°
Generally the trend between Tg and Ge should be similar.
This is expected because as Tg and Ge increase, the
crosslink density should increase and Me should decrease.
The storage moduli increase with temperature,
especially for the low-temperature cure, which is
indicative of BMI homopolymerization or further reaction
during the time frame of the dynamic mechanical testing.
As stated earlier, during the dielectric characterization,
the curing of a thermoset becomes diffusion controlled at
high viscosity or longer cure times since unreacted BMI
molecules become trapped within the forming matrix.
Regnier et al. 91 reported that at the end of cure, the
amount of unreacted maleimide double bonds is approximately
10%. Cure to complete reaction is not possible because the
conversion of the liquefied monomers to a highly
crosslinked thermoset becomes more restricted as the
reaction proceeds. Consequently, the translational
movements of the unsaturated imide groups are hindered at
high viscosity. During theological testing, the BMI:MDA
chains have the thermal energy to diffuse and with heat,
crosslink further. This investigation must account for a

205
changing network structure as testing procedures involve
higher temperatures.
Figure 4.32 is the G' curves for BMI:MDA in a I:i mole
ratio for the various cure cycles. As the cure proceeds
from low to low/high to high, the Tg increases. However,
the values of the rubbery minimas are roughly the same,
indicating that the molecular weight between crosslinks
does not change for the cure condition in the I:i mole
ratio condition. According to Tungare, 22 in the case of i:i
BMI:MDA, curing occurs predominately by the amine addition
reaction. Most of the BMI is consumed during the low-
temperature cure. Therefore, there is less chance for
crosslinking during the high cure or second step condition.
The low/high and high cure conditions exhibit the same Tg
and rubbery minima, possibly indicating that the samples
have the similar network topologies.
Figure 4.33 shows the G' curves for BMI:MDA in a 4:1
mole ratio for the various cure conditions. As the cure
proceeds from low to low/high to high, the apparent Tg
increases. The rubbery minima increase as the cure goes
from low to low/high to high. The low cure has the highest
number average molecular weight between crosslinks while
the high cure condition would exhibit the lowest Mc for the

206
4:1 mole ratio conditions. Once the amine content is
completed, there is excess BMI available for further
crosslinking, or homopolymerization. Consequently, after
the rubbery minimum, G' increases with further temperature.
The unreacted BMI begins to crosslink with the addition of
heat, forming new crosslinks. The high cure has a higher
rubbery minimum than the low/high cure even though the
apparent glass transition temperatures are the same. The
high cure of the 4:1 mole ratio BMI:MDA has a qualitatively
lower Mc than the low/high cure condition, possibly
indicating two different networks with the same TG.
When comparing the dynamic storage moduli (G') as a
function of temperature and BMI content, the rubbery minima
increase in the order of G' (i:I), G' (2:1), and G' (4:1).
Figure 4.34 indicates that an increase in BMI content
increases the relative crosslink density for the high cure
condition. The stoichiometric i:I mixture of BMI:MDA had
the lowest value of rubbery minima for all the mole ratios.
For epoxies, when the rubbery minimum is plotted as a
function of amine/epoxy ratio with cure schedule as a
parameter, the highest modulus would be observed in the
stoichiometric mixtures suggesting that the highest
crosslink densities are present in those systems. 11

207
1011 . ' ' ' I ' ' ' I ' ' ' I ' ' ' I ' ' '
1010
Eo 109ET(/)
C>,
13
10 8
10 7
10 e
__ B:M
"_ _ 4:1B:M : _
1:1 ; 2:-i _ ;
• \ ;
'%.Cure Condition: •
6hrat220 °C
, J a I , , , I , , , I , _ _ I , , ,
0 100 200 300 400 500
Temperature (°C)
Figure 4.34. Dynamic mechanical plots of G' for the
various BMI/MDA mole ratios cured at high temperature.
Frequency of test was 1 Hz.

2O8Because there is more BMI content in the 4:1 case, the rise
in G' after the rubbery minimum is greater than for the I:i
or 2:1 conditions due to an extensive homopolymerization
reaction.
Many of the physical properties examined have been
plotted against mole fraction BMI. In this designation,
0.8 depicts the 4:1 mole ratio of BMI/diamine, 0.667
represents 2:1 mole ratio of BMI/diamine, and 0.5 denotes
the I:I mole ratio case of BMI/diamine. Figure 4.35
illustrates the effect of mole fraction of BMI on the glass
transition temperature of BMI:MDA copolymers for the three
different cure conditions. The figure indicates that the
higher the isothermal-cure temperature, the higher the
glass-transition temperature. During the low-temperature
cure, curing occurs by the chain extension reaction,
resulting in a network consisting of long chains with a low
Tg. In the i:i case, lack of sufficient maleimide groups
for crosslinking may contribute to a lower Tg for both high
and low/high cure conditions.
In any case, the addition of amine increases the Tg for
both the low/high and the high cure conditions over BMI
alone. The Tg for BMI alone is lower than the cure
temperature because the network vitrifies as the glass

209
280
.-. 26000
I,=,.
_ 220I.-
g 200°m
_rjc BMII,,--
_- 180t_
o 160
1401.0
| I
! I
/g_ High CureJJ \
_- ...... -_\\
Low/High .\\Cure \\\
\\
[] Low Cure
[]
I
BMI/MDA
, I , I ,
0.8 0.6 0.4 0.2
Mole Fraction BMI
Figure 4.35. The effect of mole fraction BMI on the glass
transition temperature of BMI/MDA copolymers for the three
different cure conditions.

210
transition temperature approaches the isothermal cure
temperature. During rheological analysis, the addition of
heat causes an increase in G' At higher temperatures,
degradation reactions overshadow any increase in G'.
According to Tungare 22 the glass transition data for
2:1, I:I and 1:2 BMI:MDA mole ratios under different cure
conditions are dependent on the network topology, which in
turn, is dependent upon the cure condition. He determined
that for the I:I condition cured at low-temperatures, the Tg
is higher than for 2:1 and 1:2, as a result of network
topology. Leung et al. 28 found that in comparing the high
cure to the low/high cure condition, the Tg'S for the 2:1,
i:i and 1.5:1 cases were essentially the same. Only in the
2.5:1 case, were the Tg'S slightly different. They also
found that the Tg'S were shifted to higher values as the
amount of BMI increased.
For the 4:1 and the I:I cases shown in Figure 4.35,
the cure conditions did not influence the Tg. Both the high
and the low/high conditions produced the same Tg. For the
4:1 case, in both the high and the low/high cure
conditions, there is an excess of BMI. BMI
homopolymerization will occur at the expense of the chain

211
addition reaction. Essentially the same network is
produced with the 4:1 network, hence the same Tg.
In the i:I case, stoichiometry results in a more
extensive amine addition reaction than in the 2:1 or 4:1
cases. The i:i low-temperature cure condition has a higher
Tg than the 2:1 case. This increase in glass transition
temperature can be attributed to an increase in molecular
weight (linear chain length) of the I:I condition where the
I:I case results in more amine addition than in the 2:1
case. For the !:i case, the amine addition reaction is
more extensive than in the 2:1 case. This could possibly
lead to some chain ends capped with MDA instead of BMI,
which would inhibit the homopolymerization reaction.
Therefore, for the high and low/high cure conditions,
essentially the same network was produced.
The Tg for I:I BMI:MDA increases with reaction time
until it reaches or slightly exceeds the isothermal cure
temperature because the resin vitrifies as the Tg approaches
the isothermal cure temperature. The high and the
low/high-temperature cure conditions both produce Tg's near
the high cure temperature.
The three different cure conditions for the 2:1
BMI:MDA produced three different types of network

212
topologies, as evident from the different Tg's and
rheological curves. The amine addition reaction was
predominant during the low-temperature cure reaction.
Since there were 2 BMI molecules to every 1 MDA molecule,
the chances of endcapping the chains with BMI are
favorable. Then, with further cure at high temperature,
homopolymerization will occur, resulting in a network with
fewer network defects and longer chains. During the high-
temperature cure condition, both the amine addition
reaction and the BMI homopolymerization reaction may occur
simultaneously, resulting in a network with short chains
and network defects.
The rheological results indicate that the resin
composition, the curing conditions, and the topology of the
resulting network have significant effects on the thermal
properties of BMI's. In general, a high BMI content leads
to a high Tg. The amine addition reaction occurs more
readily than BMI homopolymerization and therefore, in the
early stages of cure, amine addition occurs until most of
the amine is consumed.
4.4.5.2. Rheological Properties of BMI/DABA
Figures 4.36-4.39 are storage modulus curves for
BMI:DABA in I:I, 1:0.87, 2:1 and 1:1.2 mole ratios.

213
Figure 4.36 is the G' curves for BMI:DABA in a I:I mole
ratio for the low-, high-, and low/high-temperature cure
conditions. The Tg and the rubbery minimum/inflection
increase as the cure proceeds from low to low/high to the
high cure condition. G' for the low cure condition
increases after reaching a minimum. Because of the
unreacted BMI within the gelled matrix, additional thermal
energy in the form of higher temperatures will result in
new crosslinks, causing an increase in G'.
Mijovic and Andjelic 31 determined through FTIR
spectroscopy that the principle reaction in the temperature
range of 140 to 200 °C was the copolymerization between the
maleimide and allyl double bonds or a chain extension 'ene'
reaction. This is the only reaction that involves double
bonds below 200 °C. The minimum value of G' for the low
cure condition occurs at approximately 250 °C. With heat,
the unreacted BMI joins to form long chains and additional
crosslinks, thereby increasing G'
For the low/high cure condition, a slight increase in
G' is apparent after a minimum is reached. As stated
before, below 200 °C, the copolymerization of BMI and DABA
occurs in alternating fashion. In addition, at
approximately 180 °C, the etherification reaction involving

214
"1011 ' ' I ' 1 ' I ' I. n i i i | | i | w i
BMI:DABA 1:1
1010
E 09o 1c)"(/)
(.-
"t3
10 a
10 7
10 6
Cure Conditions:
o Low Cure: 18hr @177 °C
Low/High Cure: 18hr @ 177 °C/18hr @ 250 °C
• High Cure: 18hr @ 250 °C
I i I l ' ' ' l , , , I i i i I ' ' '
0 100 200 300 400
Temperature (°C)
5OO
Figure 4.36. G' curves for BMI:DABA in a i:i mole ratio
for the low-, high-, and low/high-temperature cure
conditions. Frequency of test was 1 Hz.

215
two OH groups occurs, the extent of which determines the
crosslink density of the material. Mijovic 31 found that
below 200 °C the maleimide and allyl double bonds are almost
completely consumed. Above 200 °C, the homopolymerization
of BMI occurs. Just above 300 °C, there is a slight
increase in G' after the plateau region. This is
apparently due to unreacted BMI molecules diffusing through
the matrix and forming new crosslinks.
The high cure condition does not display a rubbery
minimum or plateau; degradation competes with the
rheological process and G' steadily decreases. Mijovic 31
attributed this to addition dehydration and initiation of
degradation. The TGA results in Table 4.5 indicate that
the maximum weight loss in a nitrogen atmosphere occurs at
469 °C for the BMI:DABA in a I:I mole ratio. Dynamic
mechanical testing was performed in air. This could
account for the difference in degradation temperatures
between the TGA and rheological data. Degradation may be
detected as a drop in storage modulus at temperatures above
360 °C, which corresponds to onset of visible degradation.
During the high-temperature cure, above 200 °C, both the
'ene' reaction and the maleimide homopolymerization will
occur simultaneously. However, in the initial stages of

216
polymerization where there is a high concentration of BMI
and when the allyl groups are exhausted, the fast
homopolymerization reaction of the maleimide groups is
predominant.
Figure 4.37 illustrates the G' curves for the low-,
low/high-, and two high-temperature cure conditions for the
1:0.87 mole ratio of BMI:DABA. There are two high-
temperature conditions, labeled short time (4 hours) and
long time (18 hours). The low-temperature cure condition
exhibits the lowest Tg and the lowest value of the rubbery
minimum. The low-temperature cure condition also displays
an increase in G' after the minimum G', at approximately
240 °C. At temperatures above 240 °C, the
homopolymerization reaction of the maleimide bonds occurs,
creating new crosslinks. The etherification reactions may
also occur at higher temperatures.
The low/high-temperature cure condition and the high-
temperature cure condition (long time) both exhibit the
same glass transition temperature of 300 °C. At
approximately 340 °C, both cure conditions exhibit a rapid
decrease in G', due to the initiation of degradation. Tmax
from the TGA data was 457 °C in N2. The low/high-
temperature cure condition experiences a slightly lower

217
EO
t-->,
"o
1011 . •
1010
109
108
107
106
BMI:DABA 1:0.87
Low/HighVv ,i,
V
, High" High (Long time)V
(Short time)VV
Low %
A
v Low Cure: 18hr @ 177 °C
• Low/High Cure: 18hr @ 177 °C/18hr @ 250 °C !
• High Cure: 4hr @ 250 °C
_A High Cure: 18hr @ 250 o_ ..... .
0 100 200 300 400 500
Temperature (°C)
Figure 4.37. Storage modulus curves for BMI:DABA in a
1:0.87 mole ratio for the low-, high-, and the low/high-
temperature cure conditions. Frequency of test was 1 Hz.

218rubbery minimum value than the high-temperature cure - long
time condition. However, the degradation process
overshadows the significance of this result.
The glass transition temperature and the value of the
rubbery plateau region for the high-temperature cure -
short time condition falls between the low- and the
low/high-temperature cured material. By increasing the
cure time for a given cure condition, the glass transition
increases from 270 °C to 300 °C. The longer cure time for
the high-temperature cured BMI:DABA in a 1:0.87 mole ratio
produced a matrix with a high crosslink density relative to
the high-temperature - short time cure condition.
Figure 4.38 contains the G' curves for the 2:1 mole
ratio of BMI:DABA in the various cure conditions. The
glass transition temperatures and the rubbery minima
increase as the cure proceeds from the low- to high- to
low/high-temperature cure conditions. The materials, for
each cure condition in the 2:1 mole ratio, are more highly
crosslinked compared to the other mole ratios of the
corresponding cure conditions as evident by the higher
rubbery plateau values. (The value of the rubbery plateau
is a relative indicator of crosslink density.) For the
low-temperature cure condition, excess BMI remains

219
1011
1010
Eo
o"
0 9c: 1
"1ov
10 8
10 z
' ' ' I ' ' ' I ' ' ' I ' ' ' I ' ' '
BMI:DABA 2:1
Low/High Cure
• Hi(
Low cu re_ll_
E
a
BD
Ib
Cure Conditions: !
• Low Cure: 18hr @ 177 °C
a Low/High Cure:18hr @ 177°C, 18hr @ 250°C
o High Cure: 18hr @ 250 °C
I I I I I I I I , . , I , , , I , , ,
0 100 200 300 400 500
Temperature (°C)
Figure 4.38. Storage modulus curves for BMI:DABA in a 2:1
mole ratio for the low-, high-, and the low/high-
temperature cure conditions. Frequency of test was 1 Hz.

220
unreacted in the material even after the DABA is exhausted
during the copolymerization. Therefore, when the test
temperature exceeds 250 °C, the unreacted BMI molecules
begin to translate and diffuse to produce further
crosslinking. Consequently, G' increases with temperature
after reaching a minimum.
The high cure condition has a Tg of 280 °C. G'
decreases until the minimum at 295 °C. Then G' increases
due to the BMI homopolymerization reaction. The low/high-
temperature cure condition does not exhibit a rubbery
plateau or minimum before degradation begins. The Tg was
300 °C. No increase in G' was observed with temperature
after the rubbery plateau.
Figure 4.39 contains the G' curves for the low- and
low/high-temperature cure conditions of BMI:DABA in a
1:1.12 mole ratio. As the cure proceeds from low to
low/high-temperatures the Tg increases from 160 °C to 278
°C. In the low-temperature cure condition, with DABA in
excess, G' still increases with temperature after the
minimum at 260 °C.
For the low/high-temperature cure condition, a long
rubbery plateau is observed before G' decreases with

221
10 9
E(3
(/)E 108>,
10 7
' ' ' I ' ' ' I ' ' ' I ' ' ' I ' ' '
BMI:DABA 1:1,12
Low/High
, , , I , , , I , , I l I I I I I I I
0 100 200 300 400 500
Temperature (°C)
Figure 4.39. G' versus temperature for the low- and
low/high-temperature cure conditions of BMI:DABA in a
1:1.12 mole ratio. Frequency of test was 1 Hz.

222temperature. The additional curing step increased the Tg,
the value of the rubbery plateau, and exhausted the
unreacted BMI. No increase in G' was observed with further
increase in temperature.
Figure 4.40 shows the effect of mole fraction BMI on
the glass transition temperature of BMI/DABA copolymers.
For all the cure conditions, as the crosslinking agent
increased, the glass transition temperature decreased.
Chattha and Dickie 92 have also observed this trend of
decreasing Tg with increasing amounts of DABA for a BMI/DABA
copolymer with a different thermal history than that
performed in this investigation. During the high-
temperature cure, BMI homopolymerization initially occurs
at a faster rate than the copolymerization of BMI and DABA.
The homopolymerization reaction then slows and the
copolymerization and etherification reaction rates increase
until one of the components is exhausted. 31
4.4.5.3. Rheological Properties of BMI/DDS
Figure 4.41 contains the storage modulus curves for
BMI/DDS in a 2:1 and i:i mole ratio. Both samples barely
exhibit a rubbery minima region before degradation. TGA
results indicate that the Tmaxfor the 2:1 mole ratio sample
was 429 °C. Because of the very small decrease in G' from

223
4OO
o 3500
"- 300
E
1-
250
c
(.9
150
I I I
BMI/DABA
BMI
Low/High Cure
High _ _
* I i I , I *
1.0 0.8 0.6 0.4 0.2
Mole Fraction BMI
Figure 4.40. The effect of mole fraction BMI on the glass
transition temperature of BMI/DABA copolymers.

224
101o
10 7
10 6
DS 2:1
BMI:DDS 1:1 _ _o
0
%0
Cure history:
6hr @ 220 °C
0 100 200 300 400 500
Temperature (°C)
Figure 4.41. Storage modulus curves for BMI/DDS in a 2:1
and I:1 mole ratio. Frequency of test was 1 Hz.

225
the glassy region to the rubbery plateau region, the
samples exhibited a very high crosslink density and were
very brittle.
Figure 4.42 illustrates the effect of mole fraction
BMI on the glass transition temperature of the BMI/DDS
copolymers. As the amount of DDS increased, the glass
transition temperature decreased.
increases the Tg over BMI alone.
The addition of DDS
The DDS system also
displayed a higher Tg than the MDA systems. This is because
of the high polarity of the -SO2 group compared to the -CH2
group of MDA.
4.4.5.4. Rheological Properties of PMR
Figure 4.43 is the G' versus temperature behavior for
cured and postcured PMR. Tg increases from 330 °C to 405 °C
with the addition of postcuring. The cured PMR displayed a
large transition region before reaching the limits of the
test equipment. The postcured PMR exhibited a slight
increase in G' with temperature after the minimum at 400 °C.
4.4.6. Density by the Method of Hydrostatic Weighing
Density was measured for all the samples by a simple
hydrostatic weighing technique, ASTM D792. _6 Density
provides a measure of molecular packing within a network
structure. Figure 4.44 exhibits density versus mole

226
00v
k,,,,,,,
300
270
-I
_- 240E(1)
I-cO
.m
'_ 210c
I,D
t--
180
! !
BMI/DDS
High Temperature Cure
z_
BMIZ_
150 ' ' ' ' ' ' '1.0 0.8 0.6 0.4 0.2
Mole Fraction BMI
Figure 4.42. The effect of mole fraction BMI on the glass
transition temperature of BMI/DDS copolymers.

g__7
1011
101o
E(,.)ETor)E 109
108
I ' I ' I ' I ' I '
-- PMR - postcured
10 7 , I , I , I J I i I ,
0 100 200 300 400 500 600
Temperature (°C)
Figure 4.43. G' versus temperature for cured and postcured
PMR. Frequency of test was 1 Hz.

228
¢O
E
1.34
1.32
o
v
1.30
(/)1:O
a
1.28
1.26
BMI
1.0
BMI/MDA
I
[] Low Temp Cure
O High Temp Cure
A Low/High Temp Cure
I , I
0.8 0.6
Mole Fraction BMI
0.4
Figure 4.44.
copolymers.
Density versus mole fraction BMI for BMI/MDA

229fraction BMI for BMI/MDA copolymers and pure BMI. BMI has
the highest density - 1.34 g/cm 3. Density of the copolymers
then decreases as the amount of diamine increases.
Resin density has been correlated with free volume: as
the density increases there is a reduction in free volume
due to crosslinking. In other words, when fractional free
volume is at a high level, intermolecular distances are
great and density values are lower. The i:I mole ratio
cure conditions of BMI/MDA exhibit the lowest density
values. This is due to the extensive Michael's addition
reaction that occurs during the curing of all i:I mole
ratio cure conditions, implying that the i:i mole ratio
materials have the highest free volume compared to the
other mole ratios.
Room-temperature density values for BMI/MDA
copoiymers, irrespective of cure condition, decreased as
the concentration of BMI decreased. This implies that the
free volume of the samples increased as the amount of
diamine increased. There is also an indirect correlation
between the free volume and Mc; the longer the molecular
chains, the more free volume within the network. The i:I
mole ratio cases had the lowest density values and
therefore, have the highest Mc and free volume. GPC results

230
confirm that for the low-temperature cure condition, the
I:I mole ratio case of BMI:MDA had the lowest Mw and Mn.
Donnellan and Roylance 6 also confirmed this correlation
through dilatometry experiments. They found that the
fractional free volume was highest for their I:I BMI:MDA
materials.
Gupta and Brahatheeswaran 93 investigated crosslinked
epoxy networks and found that the samples having the
highest crosslink densities had the lowest bulk room-
temperature densities. And after postcuring, the densities
of all the epoxy samples decreased. This type of behavior
was not observed in the present investigation on
polyimides. Chemical composition rather than cure history
was more important in affecting the density of BMI/MDA.
Donnellan and Roylance 6 found similar correlations between
chemistry and density to those observed in this
investigation.
Figures 4.45-4.47 are plots of density versus mole
fraction BMI for the low-, high-, and low/high-temperature
cure conditions, respectively, of BMI/MDA, BMI/DDS, and
BMI/DABA. In the BMI/MDA and BMI/DABA systems, the room-
temperature density decreased as the concentration of BMI
decreased for all cure conditions. Furthermore, samples of

231
E
v
I/)e-
1.36
1.32
1.28
1.24
I !
Low Temperature Cure
MDA
DABA
1.20 ' ' ' ' ' ' '1.0 0.8 0.6 0.4 0.2
Mole Fraction BMI
Figure 4.45. Density versus mole fraction BMI for BMI/MDA,
and BMI/DABA in the low-temperature cure condition.

232
EO
v
°_
ca0E
a
1.36
1.32
1.28
1.24
I I
High Temperature Cure
BMI
DDS
MDA
1.0 0.8 0.6 0.4 0.2
Mole Fraction BMI
Figure 4.46.
BMI/DDS, and
condition.
Density
BMI/DABA
versus mole fraction BMI for
in the high-temperature cure
BMI/MDA,

233
E¢o
v
¢/Je-
1.40
1.36
1.32
1.28
1.24
1.201.0
BMI
! I
Low/High Temperature Cure
MDA
DABA
I I I i I i
0.8 0.6 0.4
Mole Fraction BMI
0.2
Figure 4.47.
and BMI/DABA
Density versus mole fraction BMI for BMI/MDA,
in the low/high-temperature cure condition.

234
BMI/DABA had lower densities than the BMI/MDA samples of
similar mole ratios. This suggests that the BMI/DABA
systems have a higher fractional free volume than the
BMI/MDA systems. It is plausible that the bulky structure
of DABA prohibits the efficient packing of the BMI/DABA
chains, thereby resulting in excess free volume and a lower
density for than for BMI/MDA of similar mole ratio.
The room-temperature densities of BMI/DDS samples
scarcely increased with increasing amounts of diamine,
Figure 4.46. The addition of DDS to BMI increases the
room-temperature density over BMI, BMI/MDA, or BMI/DABA.
Since the atomic weight of sulfur is higher than carbon,
DDS has a higher packing density than MDA or DABA.
Consequently, the density of DDS is 1.38 g/cm 3 while the
density of MDA is 1.16 g/cm 3. This could account for why
the BMI/DDS system has a higher density than the BMI/MDA
system.
The room-temperature densities of BMI/DABA samples
cured at low-, low/high-, and high-temperature are shown in
Figure 4.48. As the amount of DABA increases, the room-
temperature density decreases. The low- and high-
temperature cure conditions for all mole ratios tested have
the same room-temperature densities. With additional heat

235
(v)
1.36 , ,_(j, , ,
1.34 '_
1.32
E 1.30o
1.28
(g)r-
1.26121
BMI BMI/DABA
1.24
1.22
L°w/Hig_ Low Cure
ft"12o-,-_,,.. , , , , , , .... I | f # !
,.o o.z 0.6 o.s,/J
0.4
Mole Fraction BMI
Figure 4.48. Room-temperature densities of BMI/DABA
samples cured at low-, low/high-, and high-temperature
curing conditions.

236
treatment, in the form of a step cure from low to high
temperature, the density decreases. This suggests two
things: i.) The increased cure temperature leads to higher
free volume in the sample and 2.) The same chemical
reaction occurs for both the low- and high-temperature cure
conditions, namely the chain extension _ene' reaction.
Mijovic 31 recently noted that the DABA and BMI copolymerize
in an alternating fashion until the components are
exhausted. Even though the temperature of the high cure
condition is above the 200 °C "cut-off temperature," the
alternating copolymerization reaction has a much higher
reaction rate than the BMI homopolymerization reaction.
Therefore, both chemical composition and cure history are
important in determining the room-temperature density for
the BMI/DABA system.
Table 4.7 lists the density values of cured and
postcured PMR. Statistically, the density values are the
same for the two samples. Postcuring did not affect the
room-temperature density or free volume.

237
Table 4.7
Density Values for PMR.
Sample Density (g/cm 3) Stand. Dev.
Cured PMR 1.328 0.002
Postcured PMR 1.326 0.003

238
4.5. Plane Strain Compression
Yield stress is considered a small strain property,
which is influenced by the molecular architecture and free
volume or intermolecular packing in a polymer network.
Close packing networks result in higher yield stresses.
Yield stresses of the various networks in this
investigation were measured by plane strain compression.
This particular test is useful in determining the yield
properties of polymers because the area under the applied
load remains constant and instabilities due to reduction in
sample area do not occur. Since there is no geometrical
reason for unstable deformation, the yield stress measured
in compression is considered the intrinsic yield stress of
the material.
However, yield testing of the brittle networks formed
in this investigation was not always straightforward. The
samples tested in biaxial compression displayed several
general types of behavior:
I.) The anticipated behavior was that samples would
yield prior to fracture. Approximately one half the
samples behaved in this manner. Yielding took the form of
a change in the slope of the load-displacement curve which
corresponded to permanent set in the sample gage region.

239
In the majority of the samples, yielding was more subtle,
consisting only of a slight change in slope of the load-
displacement curve for the sample. For many of these
samples fracture also occurred shortly after yielding.
Yielding was verified by permanent set in the sample and
the consistency of the yield values between similar
samples.
2.) Some of the samples were brittle and fracture
actually proceeded yielding. Still, a relative yield value
was determined. For this type of behavior, fracture
usually occurred by fine, almost continuous microcracking,
which could be heard as faint clicks during testing. Each
individual fracture event was considered very low energy
and no load drop was observed. In fact, the plots for
these samples showed absolutely no deviation in slope for
the load-deflection curve during loading due to individual
fracture events. The yield value of the sample was
observed when a gentle change in slope was observed in the
load-displacement plot. Yielding was then confirmed by a
permanent change in thickness of the sample gage. While
these values do not represent ideal "yield" values they
were very consistent between and within sample plates.
Therefore, the values can still be used to determine the

240
yield strength (and relative chain mobility) of these
samples compared to each other and those that displayed
normal yield behavior.
3.) Some samples were so brittle that catastrophic
failure occurred during elastic loading. These samples
actually "exploded" at a given load, resulting in nothing
more than a fine pile of powder where the gage sections
once existed. In this case, the fracture value for the
sample was recorded in place of the yield stress. The
fracture values themselves were characteristic of the type
of material tested and ranged from 80 to over 250 MPa.
Figure 4.49 is a plot of yield stress versus mole
fraction BMI for the BMI/MDA system for the different cure
conditions. For the low-temperature cure condition, the
various materials fractured and did not yield. These
values are reported as "Fracture Stress". As the amount of
diamine increased the fracture stress increased.
Consequently, no conclusion concerning the effect of
diamine on the yield behavior of BMI/MDA copolymers for the
low cure condition could be determined.
The yield stress was sensitive to mole fraction BMI
for the low/high and high cure condition. As the amount of
diamine increased the yield stress decreased. The yield

241
210
175
v BMI
= 140
_- 105
70
' I
\Low/High Cure
\
High Cure
I
BMI:MDA
, I
1.0 0.8
\\
t Low Cure(Fracture Stress)
0.6
Mole Fraction BMI
I
0.4 0.2
Figure 4.49. Yield stress versus mole fraction
BMI/MDA system for different cure conditions.
BMI for the

242
stress decreases as the restriction to molecular
deformation decreases or free volume increases. These
results are consistent with the epoxy work of Martin 9 and
Young. 94 Martin 9 found that the yield stress decreased as
the molecular weight between crosslinks increased while
Young 94 determined that the yield stress decreased as the
amount of hardener (diamine) increased. As stated earlier,
BMI/MDA samples in a I:i mole ratio, regardless of the cure
condition, exhibited the lowest density and therefore, the
highest free volume. Hence, the yield stress is lowest for
the I:I mole ratio cure conditions and Mc is the highest for
the I:I mole ratio of high and low/high cure conditions.
Figure 4.50 displays the yield stress behavior versus
mole fraction BMI for the BMI/DABA system. The low-
temperature cure condition exhibited higher yield values
than the high-temperature cure condition. For both the low
and high cure conditions, the yield stress was essentially
independent of the amount of DABA. These trends are
different from that observed for the BMI/MDA system and
opposite the density measurements, which reflect a decrease
in intermolecular packing with increasing diamine.
Typically, the amine-rich epoxies exhibit more
mobility due to the large intermolecular separation of the

243
200
180
m
160 BMI
(/)(/)
140"0
>.
120
1001.0
I
BMI/DABA
I I
Low Cure
Low Temperature Cure(Fracture Stress)
High Cure
, I I I I I '
0.8 0.6 0.4 0.2
Mole Fraction BMI
Figure 4.50. Yield stress versus mole fraction BMI for the
BMI/DABA system.

244
chain ends. A low density and low yield stresses are
typical for such systems. The resistance to initial
deformation arises from intermolecular forces. Once the
resistance is overcome, a sample will yield. How the
chains pack or how much free volume exists within the
sample, plays an important role in yielding of glassy
polymers.
As the curing agent increases, the structure would
become more linear and the molecular weight between
crosslinks would increase. The activation energy required
for yielding would decrease. Therefore, a linear polymer,
where the chains are held together by secondary forces
would have lower yield values than one that was crosslinked
with primary forces contributing to the mechanical
stability. This behavior was not observed in Figure 4.50.
While density is an average property of the total sample,
yield stress is more sensitive to intermolecular distances
within the sample and involves the cooperative movement of
I0 to 20 chain segments. Any processing parameter, which
reduces the free volume of the sample enhances the yield
stress.
Another plausible explanation for the nearly constant
yield stress may be due to an antiplasticization effect,
245described by Venditti et al. 9_ Anitplasticization is the
presence of high concentrations of unreacted low molecular
weight material and dangling, unreacted chain ends, which
act like defects in the network of a glassy material. The
unreacted material and dangling chain ends fill the free
volume, reduce the glass transition temperature over that
of the glassy material without unreacted material, and
increase the yield stress and modulus. The rheological
data for the low-temperature cure conditions of DABA
exhibit large increases in G' after the minima were
achieved because of uncured species that may have reacted
during characterization at temperatures near or above the
previous cure temperature. This indicates that unreacted
BMI and possibly DABA are present during the time frame of
the yield experiments. The unreacted components could
sterically hinder chain mobility, reduce free volume, and
cause what appears to be a questionable result for yield
strength.
Figure 4.51 is a plot of yield stresses versus mole
fraction BMI for the high cure conditions of BMI/MDA,
BMI/DDS, and BMI/DABA. The figure also includes data for
the cured and postcured PMR. The yield stresses of the
BMI/MDA and the BMI/DDS systems decrease as the

246
280
260
240
220I_.
v
2OO(/)
(D
"-' 180
"oG)__. 16o
140
120
100
I
DDS I\
\
BMI (_ MDA
I I I I
High Temperature Cure
\\\\ Post Cured
PMR {
DABA_ Cured PMRo
I I I I I
.0 0.8 0.6 0.4 0.2 0.0
Mole Fraction BMI
Figure 4.51. Yield stresses versus mole fraction BMI for
the high cure conditions of BMI/MDA, BMI/DDS, and BMI/DABA.
Data of the cured and postcured PMR are also included.

247concentration of BMI decreases. These values also indicate
that as the yield stresses decrease, the molecular weight
between crosslinks increase. However, the yield stresses
of the BMI/DDS system do not follow the trend in density
measurements. As the amount of diamine increases, the room
temperature densities slightly increase (Figure 4.46),
which is due to the enhanced intermolecular packing of DDS.
However, the addition of DDS to BMI definitely improves the
yield stress or the resistance to deformation over neat
BMI. The BMI/DABA yield values are essentially independent
of BMI concentration. This, too, is opposite to the trends
in density shown in Figure 4.46.
The results indicate that for the copolymer systems
studied, using observed trends in density as a first
approximation to trends expected in other properties,
particularly small strain properties such as yield
behavior, is not very appropriate. Yield stress is
considered to be controlled by short-range cooperative
motions of 10-20 molecular chains and backbone rotations.
Since the yield stress of BMI/DABA is independent of BMI
concentration, it can be inferred that Mc, a long-range
structural parameter, does not influence the short-range
motion of chains. 9° However, for BMI/MDA, the yield

248stresses do show a strong dependence on the concentration
of BMI, and hence, Mc. BMI/MDA chains may be so short that
they do affect short range motion and therefore yield
strength.
Another instance where yield behavior does not track
with density was in the case of the PMR. With the
additional heat treatment (post cure) of the PMR, the yield
stress increased from 119 MPa to 170 MPa. This was
initially surprising since no apparent difference was
observed in the density measurements of the two samples.
However, postcuring a sample induces a higher crosslink
density. The more highly crosslinked a system is, the
higher the yield stress since the deformation resistance
stresses the whole network, not a few chains or
intermolecular forces. A network with a higher crosslink
density has a higher glass transition temperature. And the
glass transition temperature of postcured PMR increased
significantly with the post-cure treatment. This suggests
that the crosslink density of the system increased and
therefore, the yield stress increased as PMRwas postcured.

249
4.6. Double-Torsion Fracture Energy Measurements
4.6.1. Double-Torsion Fracture Enerqy
The constant compliance test or double-torsion test is
used to determine the plane strain fracture energy of a
material. The fracture energy is the energy required to
create a unit area of new crack surface. It is also a
measure of the ability of the chains at the crack tip to
dissipate energy. Figure 4.52 is a plot of fracture energy
versus mole fraction BMI for the BMI/MDA system. The low
values of the fracture energies for the low cure conditions
indicate a very weak structure consisting of short segments
and low crosslink density. The addition of chain extender
did not improve the fracture energy over BMI alone. The
low cure condition failed in a stable, brittle manner and
the fracture energy was insensitive to the amount of
diamine present. Low fracture energies reflect poor crack
resistance in a glassy material.
Both the step cure and the high-temperature cure
conditions follow the same dependence, the fracture
energies increased as the amount of diamine increased,
regardless of the cure histories. In fact the values were
statistically indistinguishable. When observed, both the
arrest and initiation values of unstable crack growth were

250
C,,I
0.6
0.5
0.4
(J
(.9
0.2
0.1
I I
BMI:MDA arrest initiation
13 Low Cure
O High Cure _ --O--
A Low/High --,It-
initiation _
arrest
/High Cure
initiati° V" .
..'_
/High Curearrest
Low/High
High Cure
Stable
Growth
UnstableBMI Crack
Growth
0.90
Low Cure
Stable Growth
__O.O [] , . rt . . 0 ,0.75 0.60 0.45
Mole Fraction BMI
Figure 4.52. Fracture energy, determined by the double-
torsion test, versus mole fraction BMI for the BMI/MDA
system cured at low-, high-, and low/high-temperature cure
conditions.

251plotted. They, too, fell within the experimental scatter.
For the BMI/MDA system, as the amount of diamine increased,
G1c increased due to a more molecularly mobile network. The
more diamine present in the system results in higher
"flexibility" of the network segments and therefore, higher
fracture energies.
These results parallel those of Leung 28 and Enoki et
al. 96 The fracture energy increases as the amount of
diamine increases. However, Leung 2s reported that the step-
cure condition exhibited higher fracture energies than the
high-temperature cure condition for all mole ratios due to
the lower crosslink densities of the step-cured material.
In this study, the high-temperature cure conditions for all
mole ratios in Figure 4.52 exhibited higher average
fracture energies than the low/high-temperature cure
conditions, though in reality the values are statistically
indistinguishable. The addition of heat treatment (high or
low/high) over the low-temperature cure condition greatly
improves the fracture energies or the ability of the chains
to dissipate energy at the crack tip.
Stick-slip behavior is the result of yield stress-
controlled crack tip blunting and is more prevalent for
higher yield strength materials. The yield stress was

252observed to decrease as the concentration of BMI decreased.
Here, stick-slip behavior occurs for both of the 4:1 mole
ratio cases, and for the high-temperature cure condition of
the 2:1 mole ratio BMI:MDA. Stick-slip behavior does not
occur for the I:i mole ratio conditions, which had the
lowest yield stresses for each cure condition.
Figure 4.53 illustrates the fracture energies versus
mole fraction BMI for the BMI/DABA system. For the high-
temperature cure condition, only stable crack growth was
observed and the fracture energy increased with increasing
amounts of DABA. Despite differences in cure histories,
Enoki 96 found the same trends, with I:I mole ratio material
having the highest fracture energies.
For the low-temperature cure condition, unstable or
stick-slip crack growth was observed for all mole ratios of
BMI/DABA. The fracture energy of BMI was greatly enhanced
with the addition of DABA. The I:I mole ratio conditions
exhibited the highest fracture energy initiation values and
the largest difference between the initiation and arrest
values. As stated previously, yield stress-controlled
crack tip blunting produces a stick-slip behavior. The
yield stress for the low-temperature cure condition was
observed to be independent of the amount of DABA, while the

253
0.5
0.4
0.3E
v
om.-
o 0.2
0.1
BMI/DABA
Low Cureinitiation energy
Hitgbh C,url _
/
///
Low Cure
arrest energy
UnstableBMI Crack
Growth
SL°w/Hig h
I Curek \ Stable Growth
0.0 I _ , , , , ,0.60 0.45
Mole Fraction BMI
Figure 4.53. Fracture energies versus mole fraction BMI
for the BMI/DABA system in the low-, high-, and low/high-
temperature cure conditions.

254
difference in the initiation and arrest values of the
fracture energy increased.
Stenzenberger et al. 31 analyzed the fracture energies
of BMI as a function of DABA concentration. They found
that with up to 40% DABA incorporated in the copolymer, the
fracture energy improved. This is roughly 0.535 mole
fraction BMI or 1:0.87 mole ratio of BMI/DABA. After 40%
DABA, the fracture energy determined by Stenzenberger et
al. 31 decreased. However, the cure histories of the samples
tested were not revealed. In this research, the peak in
fracture energy was observed at the i:i mole ratio case, or
0.5 mole fraction BMI, which is close to that observed by
Stenzenberger et al. 31 The i:I mole ratio material also
demonstrated the highest initiation fracture energy for the
low-temperature cure condition and highest (stable growth)
fracture energy for the high-temperature cure condition.
Finally, the step-cure of the 1:1.12 mole ratio BMI:DABA
greatly enhanced the fracture energy over that of the low-
temperature cure. The low-temperature cure condition
displayed a low fracture energy stick-slip unstable crack
growth behavior. The inclusion of a two-step cure cycle
almost doubles the fracture energy.

255
Figure 4.54 compares the fracture energies for the
high-temperature cure conditions of the BMI:diamine
copolymers as a function of mole fraction BMI as well as
the PMR material. Neat BMIexhibits the lowest fracture
energy with unstable crack growth. The addition of diamine
does enhance the fracture energies or the resistance to
crack propagation. The fracture energy of thermosets
improves as the molecular weight between crosslinks
increases. This, however, is usually achieved at the
expense of temperature capacity. Fracture energy also
depends on the chemical structure and the molecular build
of the network and packing density. Sulfone amines have
been used to increase or improve toughness. Here, the DDS
barely improves the fracture energy over the neat BMI
resin. By increasing the molecular weight between
crosslinks with the addition of DDS, the fracture energy
improved slightly. But failure still occurred in an
unstable manner. Finally, no difference in fracture energy
can be detected with different mole ratios of BMI/DDS.
By changing the sulfone group of DDS to a methylene
group (MDA), the fracture energies greatly improve over
that of the BMI/DDS system or neat BMI. Fracture energy is
dependent upon chain mobility and flexibility. Since

256
1.0 ' I ' I ' I ' I '
High Temperature Cure
I ' ]
Postcured PMR
Stable Crack Growth
MDA
Cured PMRStable Crack Growth
Growt___,.,t
initiation_
rrest Growth I
,%-0.9 0.8 0.7 0.6 0.5 0.4 0.0
Unstable initiatio_=._Crack DDS _-._ • •Growth rrest
Mole Fraction BMI
Figure 4.54. Fracture energies for the high-temperature
cure conditions of the BMI-based copolymers as a function
of mole fraction BMI. Fracture energy values of PMR are
included.

257BMI/MDA experienced greater fracture toughness than
BMI/DDS, and MDA has a lower molecular weight than DDS, it
is safe to assume that MDA is more flexible than DDS. The
crack propagation behavior was stick-slip for the 4:1 and
2:1 mole ratios of BMI:MDA. For the i:I mole ratio cases,
whose yield stresses were the lowest, stable crack growth
was observed.
The addition of DABA chain extender increased the
fracture energy over that of neat BMI and the DDS system.
All cases of BMI/DABA failed in a stable manner. As the
amount of DABA increased the fracture energy increased.
The fracture energy for the BMI/DABA system was not greater
than the fracture energies of BMI/MDA. This result is
surprising since the molecular weight of DABA is greater
than MDA. This suggests that the MDA is more flexible than
DABA when incorporated within BMI.
Figure 4.54 also contains the results of fracture
energy for the cured and postcured PMRmaterials. Both the
cured and postcured materials experienced stable crack
growth. The postcured PMRhad a higher fracture energy
than the cured material. As the crosslink density
increased with postcuring, the fracture energy increased.

258
Both cured and postcured materials of PMRexhibited higher
fracture energies than the other systems tested.
4.6.2. Plastic Zone Size
The radii of the plastic zone in plane strain were
determined on the materials previously evaluated using the
Irwin Plastic Zone model, the compressive yield strengths,
and fracture energies previously determined. Calculations
based on models are made because it is extremely difficult
97to actually witness the plastic zone.
Small plastic zones, whether calculated from a model
or observed by experimental techniques, imply that the
material is resistant to yielding and more importantly,
less resistant to fracture. During loading, after crack
arrest, a plastic zone forms at the crack tip. Crack
propagation occurs by slow growth through the plastic zone
followed by a rapid propagation into the bulk material.
Large areas of continuous, densely crosslinked networks can
impede plastic deformation. Conversely, the loosest
networks have the lowest yield stress and the highest
plastic zone sizes. Generally, the larger the plastic zone
the more energy required to drive the crack into the bulk
material. Therefore, the fracture energy is directly

259
related to the plastic zone size. The fracture energy is a
minimum for the smallest plastic zone sizes.
Stick-slip crack propagation can be explained in terms
of crack blunting at the crack tip. Low yield stresses
correspond to ductile crack growth while high yield
stresses result in an unstable crack growth behavior.
Larger crack tip radii form in materials with low yield
stresses and therefore, have higher fracture energies.
This occurs because, generally as the yield stress
decreases, the energy that can be dissipated around the
crack tip increases. Therefore, more plastic deformation
will occur around the tip of the crack and the crack will
become blunted. This leads to an increase in fracture
energy of the material.
Figure 4.55 is a plot of the calculated plastic zone
size (2rp) versus mole fraction BMI for the BMI/MDA systems.
Neat BMI is considered more brittle on a macroscopic scale
than most thermosetting polymers. 9v Hence, BMI would be
expected to have a very small plastic zone, which is the
case here.
For the low cure condition, there is little to no
plastic zone calculated. The addition of diamine and
increased chain lengths of BMI/MDA by chain extension did

260
2O
--- 15E::L
I,--
10
25
BMI/MDA
5
BMI
01.0
I I ' I
[ _Nigh Cure
h Cure
Low Cure
0.8 O.6 0.4
Mole Fraction BMI
Figure 4.55. Calculated plastic zone size (2rp) versus mole
fraction BMI for the low-, high-, and low/high-temperature
cure conditions for BMI/MDA.

261
not influence the calculated plastic zone sizes. The
fracture energies for the chain extended BMI/MDA was very
low, hence the plastic zone sizes would also be minimal.
The calculated plastic zone sizes for the high-
temperature cure condition were larger than the calculated
plastic zone sizes for the low/high-temperature condition
for the i:I and 2:1 mole ratios. In the 4:1 mole ratio
case the same network topology was produced as evident from
the theological data and hence, exhibits the same plastic
zone size. This would imply that the high cure condition
does yield a topology with network defects and short
chains. The low/high-temperature cure condition
hypothetically should yield a topology with little network
defects and longer continuous chains.
Finally, the neat BMI and the 4:1 mole ratio cases
experience smaller plastic zone sizes. For both the high-
and low/high-temperature cure conditions the 4:1 mole ratio
cases had the same calculated plastic zone size. This,
along with the rheological data, suggests that the 4:1 mole
ratio network topologies are similar. The BMI and the 4:1
mole ratio cases all experience the highest yield values.
The higher the yield stress, the more crosslinked the

262material and therefore, the smaller the calculated plastic
zones sizes.
Figure 4.56 shows the calculated plastic zone size
versus mole fraction BMI for the DABA system. According to
Williams, 98 the plastic zone is inversely proportional to
the yield stress. However, in this system, yield stress
was essentially independent of BMI mole fraction. The
results for plastic zone size are therefore, influenced
more by the fracture energies. Remember, an
antiplasticization mechanism is suspected to influence the
yield stress, modulus, and therefore the glass transition
temperature of the BMI/DABA system. Here, the calculated
plastic zone size was shown to increase as the mole
fraction of BMI increased for the high-temperature cure
condition. The high-temperature cure condition experienced
stable crack growth behavior. The low-temperature cure
condition has the lower calculated plastic zone size per
mole fraction BMI over the high-temperature cure condition.
Figure 4.57 is a comparison of the calculated plastic
zone size for the high-temperature cure conditions of
BMI/DABA, BMI/DDS, BMI/MDA as a function of BMI and PMR.
The neat BMI and the BMI/DDS system have roughly the same
calculated plastic zone size. Both materials experienced

263
E::zk
v
¢-_
25
2O
15
10
' I
BMI/DABA
' I ' I '
High Cure
Low Cure
BMI
0 I I I I I I I
1.0 0.8 0.6 0.4 0.2
Mole Fraction BMI
Figure 4.56. Calculated plastic zone size versus mole
fraction BMI for the low- and high-temperature cure
conditions for the BMI/DABA system.

264
4O
35
30
25
E=L
v 20¢,_
0,1
15
10
5
I
Cured PMR
High Temperature Cure
MDA
BMI
PostCured PMR
DDSL L
0.8 0.6 0.4
DABA
0 ] h
1.0 0.2 0.0
Mole Fraction BMI
Figure 4.57. Comparison of the calculated plastic zone
size for the high-temperature cure conditions of BMI/MDA,
BMI/DABA, and BMI/DDS.

265the highest yield values and the lowest fracture energies.
The DABA system had a higher calculated plastic zone size
than the neat BMI or the BMI/DDS. The calculated plastic
zone size for the BMI/DABA is essentially independent of
DABA concentration. This is the same trend observed for
the yield stresses of the DABA system.
As the concentration of MDA increases, the networks
become more flexible. For the BMI/MDA system, the fracture
energies increase and the yield stresses decrease as the
concentration of MDA increases. Therefore, the plastic
zone sizes increase as the amount of diamine increases.
The primary factor governing the fracture energy is the
ability of the resin to yield. Yielding, in turn, allows
crack blunting which increases the energy for crack growth.
The cured PMRmaterial had a higher calculated plastic
zone size than the postcured PMR. When postcuring, the
material's crosslink density increases. The postcured PMR
experienced higher yield values, higher fracture energies,
and therefore, lower calculated plastic zone sizes.

266
4.7. Modulus Measurements
4.7.1. Below T_- Sonic Modulus
In past investigations, 4'15 the flexural modulus in
three point bend was used as a measure of the elastic
modulus. In this case, a cathetometer is used to measure
deflection as a function of load, which can be quite
challenging at small strains. Consequently, this method
usually underestimates the value of the elastic modulus in
bending (Table 4.8).
In this investigation, an alternative method was used
to determine elastic modulus - the Impulse Excitation
Technique (IET). 99 The IET is used to obtain the dynamic
modulus by measuring the resonant frequency of flexural
vibrations of a sample after a mechanical impulse or tap
has excited it. While the sample is supported at the nodes
of resonance with a microphone located beneath it, the
sample is tapped once to induce a vibration and the natural
resonant frequency is determined. With the samples'
geometry and material properties in hand, the Young's
modulus or the sonic modulus may be determined. This
method is quick, easy, and very reproducible for samples
that are isotropic.

267
To determine if the sonic technique was a viable
alternative for determining elastic properties, comparisons
were made between the elastic modulus determined in three-
point bending using a cathetometer to measure deflection,
four-point bending with strain carefully determined with
strain gages, and the sonic technique. Table 4.8 shows the
results of these comparisons. The sonic moduli and the
four-point bend values fell within 3% of each other and
within 10% of the literature values. 31 This is much better
than the underestimated three-point bend values, which fell
37% below the four-point bend values, where strain was
determined by a pair strain gages, or 33% below the
literature values.
Table 4.8Moduli Comparisons for BMI:DABA 1:0.87.
Test Technique Modulus (GPA) Comments
3-Point Bend 1.74 J.Jones @UA
3-Point Bend 2.73 A. Tenteris @ UA
Sonic Modulus 4.50 GrindosonicMethod
4-Point Bend 4.36 NASA, Strain Gage
Literature 31 4.05 Flexural Method

268
Modulus is a property primarily controlled by short-
range structure. At room temperature, free volume or
intermolecular packing normally governs the low strain
properties of thermosets such as modulus and yield. Close
packing of molecules results in high modulus and high yield
values.
The sonic modulus versus mole fraction BMI for the
various BMI/MDA cure conditions is shown in Figure 4.58.
For the low-temperature cure condition, the modulus
decreases with decreasing concentration of BMI. For the
low-temperature cure condition, mostly chain extension
occurs. The higher elastic modulus is most likely the
result of steric hindrance by unreacted BMI molecules in
the glassy state, which gives the sample higher stiffness
or rigidity. 12
The moduli values for the high- and low/high-
temperature cure conditions decreased as the amount of
diamine increased. The BMI/MDA chains may be so highly
crosslinked that short range motion of molecular chains are
affected. All the moduli values mimic the yield strength
and density trends.
The sonic moduli of the DABA system versus mole
fraction BMI are shown in Figure 4.59. The low-temperature

269
5.4
.-.5.1t_0_(9v
-OO
O
O9
4.2
I I I
BMI BMI/MDA
High Cure
Low/High CureI i
1.0 0.8 0.6 0.4 0.2
Low Cure
I , I ,
Mole Fraction BMI
Figure 4.58. Sonic modulus versus mole fraction BMI for
the various BMI/MDA cure conditions.

270
5.50
BMI5.25
t_
a. 5.00
-5 4.75"OO
O
_o 4.5009
4.25
4.001.0
I I
LowCureHigh Cure } _
0
I
BMI/DABA
z_ Low/HighCure
I I I I I I I
0.8 0.6 0.4 0.2
Mole Fraction BMI
Figure 4.59. Sonic modulus versus mole fraction BMI for
the BMI/DABA system.

271
cure condition exhibited the highest modulus. This may be
due to the steric hindrance of unreacted molecules that add
to the rigidity of the material. As the amount of DABA
increases, the modulus is virtually unaffected. This was
the case for both the low- and high-temperature cure
conditions. Neither one varied substantially with
increasing amounts of DABA. Similarly, Stenzenberger 31 had
reported that the flexural modulus did not vary with
concentration of DABA. However, the cure histories were
not mentioned in his paper. But the values were in the
same range as the values reported in Figure 4.59.
As stated previously, the yield stress and glassy
modulus are properties that are influenced by the
cooperative short-range motion of a few chains. The
modulus values for BMI/DABA are independent of the amount
of diamine. Assuming that the more reacted BMI in the
network, the higher the crosslink density, Mc does not seem
to affect the short-range motion of the BMI/DABA chains.
Figure 4.60 is a comparison of the sonic modulus
versus mole fraction BMI for the various high-temperature
cure systems. The BMI/DDS system exhibited the highest
modulus values over the other systems investigated. This
tendency followed the density measurements and is probably

272
6.0 I I I
5.6
a_
v 5.2
0
oo_
c-O
BMI
4.8
4.4
4.01.0
High Temperature Cure
....... <_ DDS
DABA
MDA
, I , I i I ,
0.8 0.6 0.4 0.2
Mole Fraction BMI
Figure 4.60. Comparison of the sonic modulus versus mole
fraction BMI for the various high-temperature cure systems.

27]
due to the close packing ability of the DDS molecule. For
at least the BMI/MDA system, the modulus values decrease
with increasing additions of MDA. This trend mirrors the
yield strength behavior for the BMI/MDA system.
The modulus values of the high-temperature cure
condition for BMI/DABA are basically unchanged with DABA
concentration. But the values of modulus are higher than
the modulus values of BMI/MDA. This is opposite to the
density results for which BMI/MDA had the higher density
compared to the BMI/DABA system. The modulus values of
DABA might be inflated due to unreacted species within the
material. In rheological data, the increase in G' after
the minimum is greater for the BMI/DABA materials than for
the BMI/MDA system.
The yield values and the modulus values as a function
of BMI mole fraction for the BMI/DABA system do not follow
the same trends. Deformations at which modulus and yield
stresses are measured are different. The results in this
investigation might not show the same behavior or trend
between the two physical properties. Other factors that
need to be considered in explaining modulus should be chain
structure and chemical composition. Earlier, it was noted
that DDS was less flexible than MDA or DABA. The

274
inflexibility of the diamine is advantageous for yield
strengths and modulus values but is unfavorable for
fracture energy. A diamine with a flexible structure, like
MDA, contributes to higher fracture energies.
Postcuring PMR actually increases the modulus over
that of the cured material, Table 4.9. This follows epoxy
work cited by Gupta, 12 where an increase in crosslink
density decreases the free volume. As a result, the
modulus increases. As PMR is postcured, the crosslink
density increases, which tightens the network and produces
a high modulus material. Even though modulus trends tend
to imitate trends in density, postcuring PMR had no effect
on the density values. The density values of the cured and
postcured PMR were essentially the same. The different
tendencies between the density values and the modulus
values may result because density is a total sample -
average property while the modulus values focus on
resistance to initial deformation by the intermolecular
forces.

Table 4.9Sonic Modulus Values for PMR.
275
Sample Sonic Modulus Standard Dev.
(GPa)
Cured PMR 4.46 0.04
Postcured PMR 4.51 0.02
4.7.2. Above T_ - Near Equilibrium Stress-Strain Testinq
The temperature at which the transition region
intersects the rubbery plateau region, determined from
Rheometrics Spectrometer graphs, was used in the
determination of Mc. In an Instron, equipped with an
environmental chamber set at a temperature 20 to 60 °C above
Tg, a sample was loaded to a given deflection while the load
relaxed to an equilibrium value. The deflection was
increased and the procedure was repeated. The equilibrium
load values were plotted against deflection to obtain a
near equilibrium stress-strain curve. The slope of the
stress-strain curve is proportional to the inverse of Mc.
Measurement of the equilibrium modulus of a network
polymer in the rubbery state is a common method for
determining the crosslink density, making use of the
statistical theory of rubberlike elasticity. 57 In

276
principle, this method should not be used for densely
crosslinked polymers, particularly those polymers with a
polar backbone. However, since there seems to be no
alternative method to characterize the extent of
crosslinking in these materials, several authors, 9° have
used the equilibrium rubbery modulus to obtain an apparent
Mc, the number average molecular weight between crosslinks
in epoxy networks. Surprisingly, the values obtained for a
fully reacted, stoichiometric, end-linked epoxies have
differed very little from the prepolymer molecular weights.
The method used to obtain equilibrium values of modulus
employed temperatures at least 40 °C above the crosslinked
resin Tg. Stepwise strains were imposed using an Instron
tester with a controlled temperature chamber, in which the
force required to maintain a constant strain is allowed to
relax until an equilibrium value is obtained. The strain
level is then increased several times and at each strain
level the force is again relaxed to near-equilibrium. The
force-deformation values at equilibrium are plotted as a
stress-strain curve and the tangent modulus is used to
calculate Mc for each network.
This approach is based on rubber elasticity theory
even though major assumptions are made in this

277
investigation. Rubber elasticity theory relates the
equilibrium shear modulus, Ge to Mc by the following
equation:
Mc : • p R T/Ge (4.3)
where • is the front factor, p is the density of the
sample, R is the gas constant, and T is the test
temperature. Constant volume is presumed so that Ge=Ee/3.
Other assumptions made in this experiment are that • is
accepted to be unity, Gaussian statistics apply to the
network chain configurations, and the internal energy
changes on extension are negligible.
A relative ranking or an estimate of the tightness of
the network based on this technique is obtained. This
procedure is a means to correlate the crosslink density to
physical properties even though the network changes with
temperature during the time frame of the experiment, based
on rheological data.
Figure 4.61 is a representative true stress versus
time graph at various strain levels for the high-
temperature cure condition of BMI/MDA in a 2:1 mole ratio,
tested in nitrogen. The true stress is normalized by a
factor of 3pRT to account for the test temperature; where p
is the sample's density, R is the gas constant, and T is

278
oE
V
I--.-n,-Q.
0.40
0.32
0.24
0.16
0.08
0.00
• I ' ! ' I " I ' I ' I '
BMI:MDA 2:1
High-Temperature Cure Condition
Test Temperature 288 °C
mosphere
= 9
....._ ,. v_ c = 0.014
.,-!. [] _ = 0.00051,_ 9 9 _ _,--°.°,°°2, , , ,
0 10 20 30 40 50 60
Time (minutes)
7O
Figure 4.61. Representative true stress versus time graph
at various strain levels for the high-temperature cure
condition of BMI/MDA in a 2:1 mole ratio, tested in
nitrogen.

27g
the temperature of the test. The equilibrium stress values
were used to create a near-equilibrium stress-strain curve,
shown in Figure 4.62.
Figure 4.62 is a representative true stress versus
strain curve for the high-temperature cure condition for
BMI/MDA in a 2:1 mole ratio. The true stress is normalized
by a factor of 3pRT. The test temperature was 288 °C and
the test was performed in a N_ atmosphere. In extension,
stress versus strain is a linear relationship up to a
strain of 0.002. Also plotted are the stress-strain
measurements in retraction. The retraction data indicate
that the near-equilibrium stress-strain behavior was not
reversible. This is probably due to further reaction
occurring over the time scale of the experiment. In epoxy
work, I the behavior was reversible up to strains of 10%.
The reversibility suggested that the measurements were
performed under near-equilibrium conditions and that the
networks were stable at high test temperatures.
Even though further reaction at higher test
temperatures is suspected in the BMI/MDA system, this
approach was used within this investigation to determine a
relative ranking of network structures. Comparison to
other studies would not necessarily be valid. The near-

280
0.05
0.04
o')
- 0.03oE
I---nr"Q.
0.02b
0.01
I
BMI:MDA 2:1
Test Temperature - 288 °C
/
//
//
//O
//
//
| • . ,
//
0 //
//
/
//
/
Instron
Stress Relax.
O extension
• return
0.00 ' ' ' ' ' ' ' '
0.000 0.001 0.002 0.003
Strain
Figure 4.62. A representative true stress versus strain
curve for the high-temperature cure condition of BMI/MDA in
a 2:1 mole ratio.

281
equilibrium stress-strain experiments were performed on the
high- and low/high-temperature cure conditions of BMI/MDA
system only. The BMI, BMI/DDS, and the low-temperature
cure condition of BMI/MDA were too brittle to attempt these
experiments. The near-equilibrium stress-strain curves
were used to determine Me.
The arrest values of the fracture energies for the
BMI/MDA system were plotted against the molecular weight
between crosslinks, determined from the near-equilibrium
stress-strain curves, Figure 4.63. A _ -power dependence
This is the same result observed by LeMay Iwas observed.
for epoxies. Me is a long-range structural variable, which
usually should not influence the short-range molecular
properties such as yield strength and modulus. 9° But for
BMI/MDA, Mc did influence these properties. M¢ determines
the plastic zone size, which in turn, influences the
fracture energy. 91 This _ -power dependence, shown in
Figure 4.63, implies that the ultimate fracture properties
of BMI are proportional to the plastic zone size, which is
determined by crosslink density. This is a promising
result because it implies that the typical characterization
techniques performed on epoxies, as established by LeMay, I

282
E
,,e,v
.,4,..a
{/)O5....5,.....
¢..)T-
O
O)O
-0.3 .... I .... i .... I ....
-0.4
-0.5
-0.6
-0.7
-0.81.50
BMI/MDA O <O
O_ r = .950
O
, _ i I .... I , , _ * I , , , ,
1.75 2.00 2.25 2.50
log M c
Figure 4.63. Relationship between fracture energy and
molecular weight between crosslinks, determined from the
near-equilibrium stress-strain curves, for the BMI/MDA
system.

283
can be applied specifically to BMI's and possibly other
polyimides.
4.7.3. Intermittent Stress Relaxation
Since the near-equilibrium stress/strain behavior was
not reversible, the network is changing during the time
frame of the experiment. Consequently, a sample was tested
with a Rheometrics Spectrometer to obtain G' The glass
transition temperature was 245 °C, Figure 4.64. When the
test temperature reached 288 °C, the sample experienced an
isothermal hold for 1 hour to simulate the load-deflection
testing at 288 °C. The storage modulus, G' increased during
the 1 hour hold. The sample was then cooled to room
temperature and retested from room temperature to 400 °C.
The glass transition temperature increased from 245 °C to
300 °C. Therefore, it appears that some further reaction is
occurring during the load-deflection experiment that was
performed at 288 °C.
In crosslinked rubbers, the network can be tested by
intermittent and continuous stress relaxation to determine
the extent of degradation or continued crosslinking. In
the intermittent stress relaxation experiment, the sample
is first undeformed. At a given time interval, the sample

284
1011
101o
._. 109CL
b108
107
106
I !
BMI:MDA 2:1
High Temperature Cure
I " • •
Retest After 288 °C Hold
Tg = 300 °C J
Isothermal
Hold at 288 °C
• • I . . , = l , , , , I , . , . I .
100 200 300 400
Temperature (°C)
Figure 4.64. Rheological analysis of 2:1 BMI:MDA before
and after an isothermal hold at 288 °C. Frequency of test
was I Hz.

285
is extended to a predetermined deflection. The peak load
value is recorded and the sample is then unloaded during a
set time interval. The sample is reloaded to the
designated deflection and the peak load value is recorded.
This experiment is done at the same test temperature as the
continuous stress relaxation procedure. The sample is
unloaded from the bottom grip while remaining at the test
temperature in order to determine if further reaction will
occur within the network.
Figure 4.65 shows three composite graphs of continuous
and intermittent stress relaxation showing the possible
behaviors that can be observed. 3_ The exponentially
decaying curve in all three figures is the continuous
stress relaxation behavior at one strain level. The
intermittent values are indicated as vertical lines. If
the peak stress values of the intermittent stress
relaxation experiment fall on the continuous stress
relaxation curve (part a), the system is undergoing
irreversible network degradation. If the peak stress
values of the intermittent stress relaxation experiment are
greater than the continuous stress relaxation values and
constant as in part b, the network is only experiencing

f/fo
a
lm
to
!
!
time
286
b
\
r
time
f/fo
In
toC
i i
ti
time
Figure 4.65. Three possible
continuous and intermittent
a polymer network. 3S
relationships between
stress relaxation behavior for

287
rearrangement reactions. If the peak stress values of the
intermittent stress relaxation experiment are increasing
and greater than the continuous stress relaxation curve, as
in part c, then the network is experiencing additional
crosslinking reactions which overshadow any degradation
reaction that may be occurring simultaneously.
Figure 4.66 is a plot of normalized stress versus
strain for the BMI:MDA in a 2:1 mole ratio cured for 6 hrs
at 220 °C. The lines indicate the continuous stress
relaxation curve for two samples, cured during the high-
temperature cure condition. The symbols represent the
intermittent normalized stress values for a given time. At
strains of e : 0.0173 and 0.0181, the intermittent stress
relaxation experiments do reveal an overall increase in
stress over time, indicative of additional crosslinking.
However, there is considerable scatter in the data over the
time frame of the experiment. The material is subjected to
very small strains, measured by a cathetometer and bench
marks on the sample. Some error is expected with clamping
and reclamping of the sample during experimentation at
elevated temperatures. But an increasing trend in stress
with time is clearly evident.

288
i,1,,,_°
v
¢ao
O9
13
N
EI.,,,.
OZ
2.0
1.5
1.0
0.5
0.0
. . . ' I ' • | ' I ' ' ' ' l ' ' ' ' i ' ' ' ' I ' ' ' '
Test Temperature - 288 °C
Intermittent Stress Relaxation
[]ip
[] O
_= Continuous Stress Relaxation0.0181
_. e = 0.0173
0
BMI:MDA 2:1
I ' ' " I . . • . I • i i i I i i i • I . • . . I , , , •
10 20 30 40 50 60
Time (minutes)
Figure 4.66. Normalized stress versus strain for BMI:MDA
in a 2:1 mole ratio cured for 6 hrs at 220 °C. The lines
indicate the continuous stress relaxation curve for two
samples cured at high temperature and the symbols represent
the intermittent normalized stress values for a given time.

28O
This is the first attempt to characterize a thermoset
network in this manner. Some refinement of the
experimental procedure is certainly necessary. This
result, coupled with the theological data of the isothermal
hold and the irreversible true stress-strain behavior,
indicates that the material does, in fact, undergo further
reactions at temperatures above its Tg, and holds promise
that the kinetics of the additional crosslinking reactions
might be established.
4.8. Computer Modellinq of Thermoset Networks
A computer simulation package developed by Biosym 68 was
used to compare the experimentally obtained physical
properties of the low-temperature cure condition of
BMI/MDA, BMI/DABA, and BMI to the calculated physical
properties of the same systems. Computer modelling allows
the scientist to experiment with a number of possible
polymers with different structures without having to
synthesize all possible scenarios. The economic benefits
of such an approach in terms of time and money are obvious.
However, with the current technology, computer modelling is
best suited for predicting trends rather than generating

absolute (accurate) numbers for physical, mechanical, and
thermal properties.
The specific model used in this investigation was
Synthia, based on connectivity indices as opposed to group
contributions and a database. 46 The connectivity indices
method of modelling defines atomic indices that describe
the bonding and the electronic environment of each non-
hydrogen atom. Therefore, it can be used to estimate
properties for any amorphous atactic homopolymer or random
copolymer based on nine elements: C, H, O, N, Si, S, Br,
Cl, and F. Chain stiffness, thermophysical properties,
mechanical properties, electrical and optical properties,
and transport properties are the different types of
behaviors that can be modeled with Synthia.
No dependence on molecular weight is used in the
calculations. All simulations are based on a typically
high molecular weight polymer. The low-temperature cure
conditions employed in this investigation were compared
because the model, in its present state, cannot handle
crosslinks between chains or cyclic structures. The main
assumption for the low-temperature cure condition of the
BMI/MDA and the BMI/DABA systems is that no crosslinks
occur during the chain extension reaction.
290
The model also

291
cannot take into account unreacted species. Therefore,
only the low-temperature cure condition of the MDA and the
DABA systems were modeled. The calculated properties of
the DDS system were not included here since only the high-
temperature cure condition was implemented for that
particular system. The results would be meaningless if
included here.
Another objective of the modelling was to substitute
three other diamines for MDA and compare the calculated
physical properties to the BMI/MDA system. The diamines
were; 4,4' diaminobiphenyl (DBP), p-phenylene diamine
(PPD), and p-xylylene diamine (PXD).
In this investigation, the reliability of the computer
model and simulation was examined. It was also hoped that
comparison of the modeled results with experiment would
lead to further insight into the structure of the systems
studied. Finally, the ability to use computer modeling to
predict the behavior to unknown and unfamiliar systems was
tested.
Figure 4.67 illustrates the glass transition
temperature as a function of mole fraction BMI for the
BMI/MDA system. Also included is the result of the low-
temperature cure model of glass transition temperature

292
00v
300
250G)Q_
EI--t-O
r 200I,..
I-(/)
(.9
I
BMI/MDA
High Cure
Low/High
Cure _
___ _._
BMI
[] Low Cure
I , I-I I i
Modeled
Low Cure
150 ' ' ' ' '1.0 0.8 0.6 0.4 0.2 0.0
Mole Fraction BMI
Figure 4.67. Comparison of the measured and modeled glass
transition temperature as a function of mole fraction BMI
for the BMI/MDA system.

293
versus mole fraction BMI. The computer simulation
overestimated the actual Tg of the low-temperature condition
but the model does follow the general trend in experimental
data. As the amount of diamine decreases, the glass
transition temperature increases.
Figure 4.68 displays the Tg versus mole fraction BMI
for the BMI/DABA low-temperature cure condition. The model
for the low-temperature cure condition underestimates the
glass transition temperature but the trend is the same.
The Tg increases as the amount of BMI increases. One
possible reason for underestimating the Tg is that the model
does not take into account crosslinking or etherification.
Some crosslinking or etherification of the DABA could be
occurring even at curing temperatures of 177 °C.
Figure 4.69 is the glass transition temperature versus
mole fraction BMI for the three different diamines, MDA,
and the experimental data previously shown. As stated
before, the simulation underestimated the MDA properties.
DBP exhibited the highest calculated Tg while PXD had the
lowest Tg of the systems analyzed. It would expected that
the addition of phenyl rings in the backbone chain
increases the stiffness and therefore, the Tg of the DBP
system.

294
250
0£_.. 225
l,,,-
:1
5,.,.
Q- 200E(1)
i-tO
•_- 175(/)t-
I.,.
p.-(/)e0(_ 150
(.9
I
BMI/DABAI I I
\
BMI
[_Low Cure
\°ModeledLow Cure
125 , I , I , I , i ,
1.0 0.8 0.6 0.4 0.2 0.0
Mole Fraction BMI
Figure 4.68. Comparison of the measured and modeled glass
transition temperature versus mole fraction BMI for the
BMI/DABA low-temperature cure condition.

_ 295
' I ' I ' I ' I '
240 ]- BMI (model)
% 220 -
200 \_. ""----.... "
BM, \ MDA---__ PDE .(exp) \
180
t-O
o_
160¢/)t-
I,.,.
t-140
¢/)
(.9120
DD
m
[] \
\\[]
Low Cure MDA
© BMI model
t BMI experimental
• PPD model
• PXD model• DBP model'i I i I ,
PXD\
\\
\\
\
100 I , I ,1.0 0.8 0.6 0.4 0.2 0.0
Mole Fraction BMI
Figure 4.69. Glass transition temperature versus mole
fraction BMI for the experimental data previously shown for
BMI/MDA, and modeled data for three other diamines: DBP,
PPD, and PXD.

296
Figure 4.70 shows the experimental values of density
of BMI/MDA and the calculated density values versus mole
fraction BMI. The modeled behavior determines the affect
of diamine on density perfectly. Chemical composition
rather than cure history controls the experimental or
calculated density measurements for the BMI/MDA system.
Figure 4.71 is the BMI/DABA counterpart of Figure
4.70. The computer simulation underestimates the density
values of the low-temperature cured material investigated
in this study. This result implies that the low-cure
condition for BMI/DABA resulted in some crosslinking of the
material. The effect on density of having no crosslinks
and only long, linear chains is that the calculated density
measurements are lower than the experimental values.
Figure 4.72 shows the density values versus mole
fraction BMI for the three diamines and the experimental
values of MDA. PPD had the highest calculated density
values. Obviously, the -NH2 groups and the phenyl ring can
pack efficiently to produce higher density values. Adding
another phenyl group decreases the calculated density for a
given BMI mole fraction from the density values of PPD.
Finally, adding -CH2 groups lowers the calculated density

_ 297
EO
v
¢.
D
1.34 q
1.32
1.30
1.28
1.26
BMI
\
! !
BMI/MDA
[] LowTemp Cure
O HighTemp Cure
z_ Low/High Temp Cure
o I _ I o
1.0 0.8 0.6 0.2
Low Cure
N_odeled
0.4
Mole Fraction BMI
Figure 4.70. Experimentally determined and modeled density
values as a function of BMI mole fraction for the BMI/MDA
system.

298
1.35
1.32
"-" 1.29(_
Eo
El)
1.26
,_
c
cl 1.23
1.20
BMI
\\
! !
\
! !
BMI/DABA
[] Low Cure
© High Cure
/k Low/High
Modeled XLow Cure \
1.17 , i , i , i , i ,1.0 0.8 0.6 0.4 0.2 0.0
Mole Fraction BMI
Figure 4.71. Experimentally determined and modeled density
values as a function of BMI mole fraction for the BMI/DABA
system.

299
1.40 ' I ' I I ' I ' I
[] Low Cure MDA exp.
• BMI experimental© BMI model
1.36 • PPD model
] BMI (exp) • PXD model
t_ * DBP model
E 1.32 x -
(model) _,_._ _
c 1.28
D
P
1.24 MDA\\ _ "(exp) \ \ PXD _-
1.20 , t , t , t , I , t1.0 0.8 0.6 0.4 0.2 0.0
Mole Fraction BMI
Figure 4.72. Density versus mole fraction BMI for the
modeled behavior of three BMI/diamine systems and the
experimental values for BMI/MDA.

300
values as observed in PXD and MDA. The methylene groups do
not allow close packing of the molecular chains.
Figure 4.73 is a plot of modulus versus mole fraction
BMI for the BMI/MDA system and the modeled low-temperature
cure condition. The experimental modulus values are much
higher than the calculated values. This could be due to
unreacted species within the material which sterically
hinder molecular mobility. The computer simulation does
not account for unreacted species and crosslinks. However,
the model does predict that the modulus will increase with
increasing amounts of BMI.
Figure 4.74 is a plot of the experimental data for
modulus versus mole fraction BMI for the BMI/DABA system
and the calculated modulus values from the computer
simulation for the low-temperature cure condition. The
low-temperature cure condition of BMI/DABA experiences much
higher modulus values than the modeled modulus values.
This, too, is probably due to unreacted species and
crosslinks present within the material. The model can not
account for these types of imperfections, which can have
significant effects on certain properties such as modulus.
Finally, Figure 4.75 summarizes the calculated modulus
results versus mole fraction BMI for various BMI/diamine

301
5.5
BMI
5.0
---- 4.5D_(.9
_0 4.0-s
O
3.5
3.0
2.51.0
I I I I
BMI/MDA
w Cure
High Cure
Low/High Cure
. Modeled
Low Cure
, I _ I , I , I ,
0.8 0.6 0.4 0.2 0.0
Mole Fraction BMI
Figure 4.73. Modulus versus mole fraction BMI for the
BMI/MDA system and the modeled low-temperature cure
results.

302
5.5
5.0
£1..(.9 4.5
V)
-o 4.0O
3.5
BMI
I I I I
BMI/DABA
_ ___.[3_ Low CureHigh Cure O
Low/HighCure
ModeledLow Cure
30. , i , i , i , i ,
1.0 0.8 0.6 0.4 0.2 0.0
Mole Fraction BMI
Figure 4.74. Modulus versus mole fraction BMI for the
BMI/DABA system and the calculated modulus values from the
computer simulation for the low-temperature cure condition.

303
6000 ' I ' I ' I ' I '
BMI (exp)
5000[]
n 4000
-3 r.._!1iUU_l)-o 3000
PXD ----- -..:• BMI experimental
2000 © BMI model
• PPD model
• PXD model
• DBP model1000 , I , i , i , i ,
1.0 0.8 0.6 0.4 0.2 0.0
Mole Fraction BMI
Figure 4.75. Calculated modulus results versus mole
fraction BMI for various BMI/diamine systems compared to
the experimental values for BMI/MDA.

304
systems. The modulus reflects short-range structure. At
room temperature, free volume or intermolecular packing
normally governs the low strain properties of thermosets
such as modulus and yield. Close packing of molecules
results in high modulus values. PPD was calculated to have
the highest modulus per given mole fraction. This result
coupled with the density data indicates that PPD has the
closest packing of molecules compared to the other diamines
modeled. DBP, with two phenyl rings also followed the same
trend as the calculated density values.
As demonstrated above, computer simulation can be a
useful tool when used in conjunction with experimental
results. Modeling serves as a benchmark or a starting
point in designing experimental matrices for research or
for verifying trends in the data. The modeled results when
compared to the experimental data pointed towards the
following conclusions: I) For the BMI/MDA system the
modeled values tended to underestimate the experimental
values, except in the case of density. This implies that
the low-temperature cured material examined in this study
may contain some crosslinks and unreacted material. The
fact that density was insensitive to cure condition and was
accurately modeled for BMI/MDA implies that, in the case of

305
density, chemistry is a more important factor than
structure. 2) Likewise, the modeled results tended to
seriously underestimate the experimentally determined
properties for the low-temperature cured BMI/DABA for the
same reason: the presence of crosslinks and unreacted
material. 3) Finally, BMI/PPD was calculated to have
higher density and modulus values and a relatively high
glass transition temperature for the low-temperature cure
condition relative to the other systems experimentally or
analytically investigated in this study. Consequently,
this may be an interesting system to add to future studies
of various BMI/diamine systems.

CHAPTERV
SUMMARYAND RECCOMMENDATIONS
5.1. Summary of Results
I. The powder-melt method of processing was a
successful alternative to solvent processing and proved to
be an acceptable method for producing BMI/diamine
copolymers. The process involves the melting of the lower
melting point constituent, mixing in the second powder
component, allowing the mix to cool, and then grinding the
mixture into a fine powder, which is finally used in the
molding process. Intimate mixing was shown to occur for BMI
and MDA.
2. FTIR analysis indicates the presence of a peak in
the range of 3100-3000 cm -I which represents the double bond
of BMI, and infers that the Michael's addition reaction has
not occurred between the two components in the as-ground
powders. Therefore, the powders prepared for the molding
process have not reacted and the double bond is available
for crosslinking during curing.
306

387
3. Dielectric analysis of cure monitoring is a
complementary tool in network characterization. This
characterization process is not useful by itself but is used
in conjunction with other theological techniques. In this
investigation, dielectric analysis was used to determine the
processing variables of bismaleimides. Temperature ranges
for curing BMI/MDA were resolved. At low temperatures, a
plot of log conductivity versus I/T yielded a single
relaxation time for low frequencies. At higher frequencies,
there is a distribution of relaxation times. From the Cole-
Cole plot, a single relaxation time occurs for BMI/DABA,
cured at low temperatures. The exothermic parameters of
BMI/DDS were double that of the BMI/MDA system. This is due
to the increased chemical reactivity of MDA.
4. Curing times were determined from DSC analysis and
used in conjunction with dielectric analysis results. With
the addition of MDA to BMI, the melting points of the
mixtures lowered with increasing molar ratios of MDA. The
presence of DDS with BMI increased the curing temperature
over that of BMI/MDA.
5. GPC results indicate that the predominant reaction
during low temperature cure is chain extension between the
amine and the double bond of BMI. The polymer samples
dissolved in NMP.
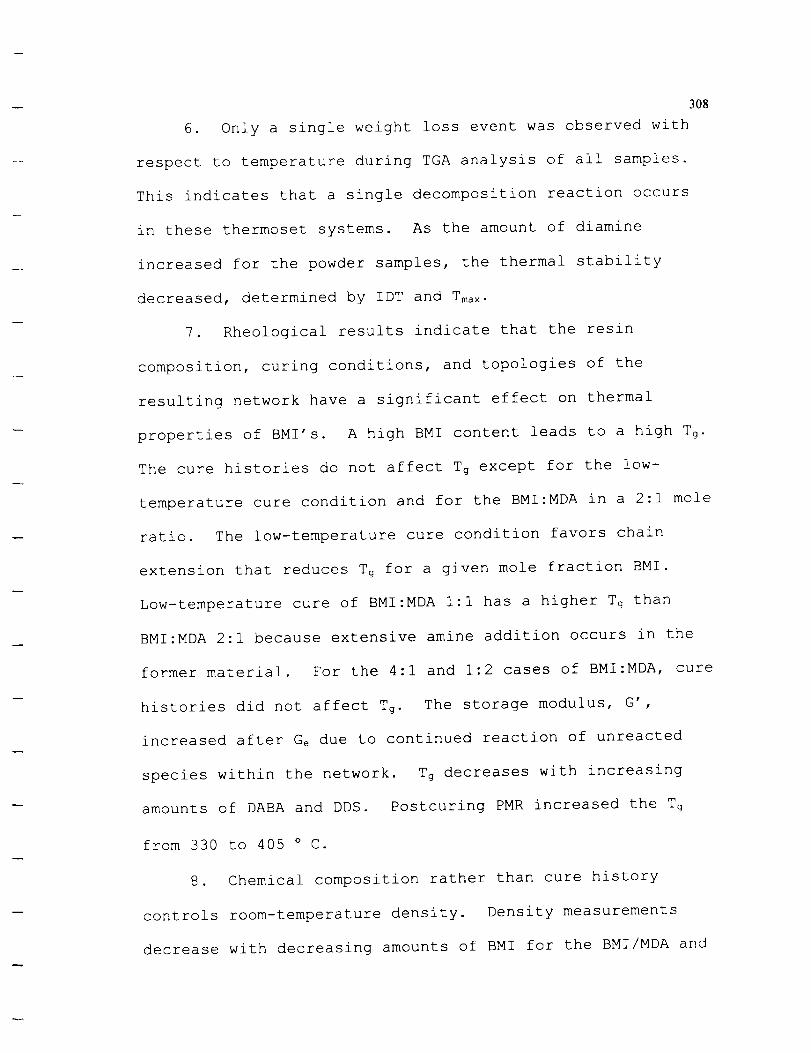
9086. Only a single weight loss event was observed with
respect to temperature during TGA analysis of all samples.
This indicates that a single decomposition reaction occurs
in these thermoset systems. As the amount of diamine
increased for the powder samples, the thermal stability
decreased, determined by IDT and Tma×.
7. Rheological results indicate that the resin
composition, curing conditions, and topologies of the
resulting network have a significant effect on thermal
properties of BMI's. A high BMI content leads to a high Tg.
The cure histories do not affect Tg except for the low-
temperature cure condition and for the BMI:MDA in a 2:1 mole
ratio. The low-temperature cure condition favors chain
extension that reduces Tg for a given mole fraction BMI.
Low-temperature cure of BMI:MDA I:I has a higher Tg than
BMI:MDA 2:1 because extensive amine addition occurs in the
former material. For the 4:1 and 1:2 cases of BMI:MDA, cure
histories did not affect Tq. The storage modulus, G',
increased after Ge due to continued reaction of unreacted
species within the network. Tg decreases with increasing
amounts of DABA and DDS. Postcuring PMR increased the Tg
from 330 to 405 o C.
8. Chemical composition rather than cure history
controls room-temperature density. Density measurements
decrease with decreasing amounts of BMI for the BMI/MDA and

30q
BMI/DABA systems. Low-temperature and high-temperature cure
conditions for all mole ratios of DABA have the same room-
temperature density values. The step-cure condition of the
BMI/DABA system produced lower density values for a given
mole ratio. Additions of DDS to BMI increased the room-
temperature density over that of BMI, BMI/MDA, or BMI/DABA
because DDS apparently has a higher packing density than MDA
or DABA. The density values of cured and postcured PMR's
were statistically the same.
9. Sonic techniques are a viable alternative to three-
point bend measurements for determining modulus. For the
low-temperature cure condition of BMI/MDA, the modulus
decreases with decreasing concentration of BMI. The low-
temperature cure condition for a given mole fraction BMI had
the highest modulus compared to the low/high- or high-
temperature cure condition. This may be due to the steric
hindrance of unreacted BMI molecules in the glassy state.
I0. The sonic modulus values of BMI/DABA for both the
low- and high-temperature cure conditions did not vary
substantially with mole fraction BMI. The low temperature
cure condition of BMI/DABA displayed the highest modulus
values over that of the high-temperature cure condition.
The BMI/DDS system exhibited the highest modulus values over
the other systems investigated. The postcured PMR samples

318
had a higher modulus (4.51 GPa) compared to cured PMR (4.46
GPa).
II. The low-temperature cured samples all fractured in
compression tests instead of yielding for BMI/MDA. As the
amount of diamine increased, the fracture stress increased.
The addition of MDA to BMI did not enhance the yield
strength for the low-temperature cure condition. The yield
stress for the high-temperature and the low/high-temperature
cure conditions were sensitive to the concentration of BMI.
As the amount of diamine increased, the yield stress
decreased.
12. The yield stresses for the low- and high-
temperature cure conditions of the BMI/DABA system were
insensitive to mole fraction BMI, possibly due to an
antiplasticization effect, where unreacted species act like
defects and increase the yield stress. The yield stress for
BMI/DDS decreased as the concentration of BMI decreased.
Postcuring PMR increased the yield strength from 119 to 170
MPa due to an increase in crosslink density.
13. The low-temperature cured samples, which favors
chain extension in the BMI/MDA system, fractured in a
stable, brittle manner and had the lowest fracture energies.
Fracture energy was insensitive to the amount of diamine
present for the low-temperature cure condition.
Crosslinking, which occurs in both the high- and low/high-

311temperature cure histories of BMI/MDA increases the fracture
energy for a given BMI mole fraction. Fracture energies
increased as the amount of diamine increased. Stick-slip
behavior did not occur for the low-temperature cure
condition of BMI/MDA, for the low/high-temperature cure
condition of BMI/MDA in a 2:1 mole ratio, or any cure
condition of BMI/MDA in a I:I mole ratio.
14. For the BMI/DABA system, stable crack growth was
observed and fracture energies increased with increasing
amounts of DABA. For the low-temperature cure condition,
stick-slip behavior was observed for all ratios of BMI/DABA.
The i:I mole ratio conditions exhibited the highest fracture
initiation values. The step-cure of BMI:DABA 1:1.12 greatly
enhanced the fracture energy over that of the low-
temperature cure condition.
15. Neat BMI exhibits the lowest fracture energy with
unstable crack growth. The addition of DDS to BMI barely
improves the fracture energy. Failure occurred in an
unstable manner. Both the cured and postcured PMR materials
experienced stable crack growth. The postcured PMR material
had a higher fracture energy than the cured material. As
the crosslink density increased with postcuring, the
fracture energy increased.
16. For the low-temperature cure condition of BMI/MDA,
the plastic zone size could not be calculated. Calculated

312
plastic zone sizes for the high-temperature cure conditions
were greater than the plastic zones calculated for the
low/high-temperature cure conditions. For the BMI/DABA
system, the calculated plastic zone sizes increased as the
concentration of BMI increased for the high-temperature cure
condition. The low-temperature cure condition had lower
calculated plastic zone sizes than the high-temperature cure
condition of BMI/DABA. Neat BMI and BMI/DDS had roughly the
same calculated plastic zone size. Cured PMRhad higher
calculated plastic zone sizes than the postcured PMR. The
higher the crosslink density, the smaller the calculated
plastic zone size.
17. Results indicate that a log-log plot of the
fracture energy arrest values versus the molecular weight
between crosslinks exhibit a _ -power dependence, indicating
that the fracture energy dependence for bismaleimides is
similar to that found for epoxies.
18. Preliminary results of intermittent stress
relaxation tests on BMI:MDA in a 2:1 mole ratio indicate
that crosslinking is occurring in the relaxed state.
19. Computer simulation is a useful tool to be
employed in conjunction with experimental results. Modeling
of the low temperature cure conditions of BMI/MDA and
BMI/DABA predicted the correct trends of physical properties
versus mole fraction BMI. However, there was some

313
discrepancy in the absolute values of the modeled versus
experimentally determined properties. This was probably due
to some crosslinking and/or the presence of unreacted
species in the low-temperature cured material studied in
this investigation. For the low temperature cure condition,
BMI/PPD (para-phenylene diamine) was calculated to have
higher density and modulus values and a relatively higher Tg
compared to BMI/MDA.
20. The experimental procedures used to study epoxies
can be applied to systems such as bismaleimides.
5.2. Suggestions for Future Work
i. Further work should be done on the intermittent
stress relaxation of thermosets. In particular, it should
be demonstrated that intermittent stress relaxation can be
applied effectively to understand the continued reactions
occurring at high temperatures in thermosets like epoxies or
polyimides.
2. Testing the physical properties of bismaleimides at
elevated temperatures or after long-term exposure to
elevated temperature should be further investigated. It is
known that bismaleimides as high-temperature materials
undergo changes to their network structures with increasing
temperature.

314
3. Physical aging of polymers, in general, has been
studied extensively. Investigating the physical aging of
bismaleimides should be considered, especially if the
presence of unreacted species can affect the free volume of
the system.

REFERENCES
I. LeMay, J. D.:Akron, (1985).
2. Swetlin, B. J.:Akron, (1984).
3. Mudrich, S. F.:Akron, (1991).
4. Ajbani, M.:Akron, (1995).
Ph.D. Dissertation, The University of
Ph.D. Dissertation, The University of
Ph.D. Dissertation, The University of
Ph.D. Dissertation, The University of
Poly. Eng. Sci.,5. Donnellan, T. M.; and Roylance, D.:
32, 409, (1992).
6. Donnellan, T. M.; and Roylance, D.: Poly. Eng. Sci.,
32, 415, (1992).
7. Day, D.: "Dielectric Properties of Polymeric Materials,"
Eumetric System III Microdielectrometer Manual, Micromet
Instruments , Inc., Cambridge, (1991).
8. Pater, R. H.: SAMPE J., 30, 29, (1994).
9. Vakil, U. M.; and Martin, G. C.: J. Mater. Sci., 28,
4442, (1993).
i0. Phillips, D. C.; Scott, J. M.; and Jones, M.: J.
Mater. Sci., 13, 311, (1978).
ii. Meyers, F.; Sanz, G.; Eceiza, A.; Mondragon, I.; and
Mijovic, J.: Polymer, 3_66, 1407, (1995).
12. Gupta, V. B.; Drzal, L. T.; Lee, C. Y.-C.; and Rich,
M.J.: Poly. Eng. Sci., 2_55, 812, (1995).
315

316
13. Kim, S. L.; Skibo, M. D.; Manson, J. A.; Hertzberg, R.
W.; and Janiszewski, J.: Poly. Eng. Sci., 18, 1093,
(1978).
14. Chang, T. D.; Cart, S. H.; and Brittain, J. O.:
Eng. Sci., 22, 1213, (1982).
Poly.
15. Geisler, B.:
Akron, (1993).
Ph.D. Dissertation, The University of
16.
Polym Comp., 12, 126, (1991).
Pater, R. H.; Whitley, K.; Morgan, C.; and Chang, A.:
17. Varma, I. K.; Sangita; and Ralli, D. K.:
12, 294, (1987).
18. Stenzenberger, H. D.:
(1994).
Polym. News,
Adv. Polym. Sci., 117, 165,
19. Varma, I. K.; Gupta, S. P.; and Varma, D. S.:
Angew. Makromol. Chem., 153, 15, (1987).
Die
20. Tungare, A. V.; and Martin, G. C.:
Sci., 46, 1125, (1992).
J. Appl. Polym.
21. Stenzenberger, H. D.: J. Appl. Poly. Sci. App. Poly.
Symp., 22, 77, (1977).
22. Tungare, A. V.:
University, (1990).
Ph.D. Dissertation, Syracuse
23. Tungare, A. V.; and Martin, G. C.:
33, 614, (1993).
Polym. Eng. Sci.,
24.
D.:
Barton, J. M.; Hamerton, I.; Rose, J. B.; and Warner,
Polymer, 32, 2482, (1991).
25. Manson, J. A.; Kim, S. L.; and Sperling, L. H.: AFML-
TR-76-124, Air Force Materials Laboratory, Wright Patterson
AFB, Ohio, (1976).
26. Leung, C. L.; Liao, T. T.; and Dynes, P. J.:
National SAMPE Symposium, 818, (1983).
28th
27.
D.:
Barton, J. M.; Hamerton, I.; Rose, J. B.; and Warner,
High Perform. Polym., 6, 21, (1994).
28. Leung, C. L.; Liao, T. T.; and Tung, C. M.:Div. Poly. Mater. Sci. Eng., 52, 134, (1985).
317Proc. ACS
29. Tung, C. M.; Leung, C. L.; and Liao, T. T.:Div. Mater. Sci. Eng., 52, 139, (1985).
Proc ACS
30. Morgan, R. J.; Jurek, R.; Larive, D. E.; English, E.J.; Tung, C.; and Donnellan, T.: 22nd Intern. SAMPETechn.Conf., 145, (1990).
31. Mijovic, J.; and Andjelic, S.:(1996).
Macromol., 29, 239,
32. Stenzenberger, H. D.; Konig, P.; Herzog, M.; andRomer, W.: Proceed. 19th Intern. SAMPETech. Conf., vol.19, 372, (1987).
33 Chaudhari, M.; Galvin, T.; and King, J.:21, 17, (1985).
SAMPEJ.,
34 Tobolsky, A. V.; Takahashi, Y.; and Naganuma, S.:Polym. J., 3, 60, (1972).
35 Bjork, F.; Dickman, O.; Stenberg, B.:Techn., 62, 387, (1989).
Rubb. Chem.
36 Sheppard, N. F.; Day, D. R.; Lee, H. L.; and Senturia,S. D.: Sens. Actuat., 2, 263, (1982).
37 Kranbuehl, D. E.:(1991).
J. Non-Cryst. Solids, 131, 930,
38 Kranbuehl, D. E.: in Developments in Reinforced
Plastics - 5, G. Pritchard, Ed., Elsevier Applied Science
Publishers: New York, p. 181, (1986).
39. Senturia, S. D.; Sheppard, N. F.; Lee, H. L.; and Day,
D.R.: Adhes., 15, 69, (1982).
40. Jang, B. Z.; and Shih, W. K.:
5, 301, (1990).
Mater. Manuf. Process.,
41. Greenfield, E. W.: "Introduction to Dielectric Theory
and Measurements", Washington State University, (1970).

318
42. Elias, H. G.: in Macromolecules Structure Properties,
Volume i, Plenum Press: New York, p. 480 (1984).
43. Senturia, S. D.; and Sheppard, N. F.: Adv. Polym.
Sci., 80, 3, (1986).
44. Day, D. R.: Polym. Eng. Sci., 26, 362, (1986).
45. Gotro, J.; and Yandrasits, M.: Polym. Eng. Sci., 29,
278, (1989).
46. Polymer Users Guide Version 6, Biosym Technologies,
San Diego, CA, (1993).
47. Stenzenberger, H.: in Structural Adhesives
Developments in Resins and Primers, A. J. Kinloch, Ed.,
Elsevier Applied Science Publishers, New York, p. 77,
(1987).
48. Morgan, R. J.; Jurek, R. J.; Yen, A.; and Donnellan,
T.: Polymer, 34, 835, (1993).
49. Snyder, C.: Personal Communication, Ciba-Geigy,
Hawthorne, NY, (1993).
50. Serafini, T. T.; Delvigs, P.; and Alston, W. B.:
Proceed. 27 TM Nat. SAMPE Symp., vol. 27, 320, (1982)
51. Roberts, G.; and Lauver, R. W.: J. Appl. Poly. Sci.,
33, 2893, (1987).
52. Mittleman, M. L.; Johnson, D.; and Wilkie, C. A:
Trends in Poly. Sci., 2, 391, (1994).
53. Bargain, A. C.; and Grojean, P.: British Patent No.
1,190,718, 6 May, 1970.
54. ASTM D2471-88. Standard Test Method for Gel Time and
Peak Exothermic Temperature of Reacting Thermosetting
Resins, (1988).
55. Roberts, G.: Personal Communication, NASA Lewis
Research Center, Cleveland, OH, April, (1993).
56. ASTM 792-86. Standard Test Methods for Density and
Specific Gravity of Plastics by Displacement, (1991).

319
57. Treoloar, L. R. G. : The Physics of Rubber Elasticity,
3rd. Ed., Oxford Univ. Press, Oxford, (1975) .
58. Sawyer, L. C; and Grubb, D. T.:
Chapman and Hall, New York, (1987).
59. Williams, J. G.; and Ford, H.:
405, (1964).
60. Outwater, J. O.; and Gerry, D. J.:
(1969).
Polymer Microscopy,
J. Mech. Eng. Sci., 6,
J. Adhes., I, 290,
63. Evans, A. G.; Russell, L. R.; and Richerson, D., W.:
Metall. Trans. A., 6A, 707, (1975).
64. Kinloch, A. J.; and Williams, J. G.:
15, 987, (1980).
68.
Modeling and Property Prediction 1995", (1994).
69. Knight, G. J.: in Developments in Reinforced Plastics
- 1 - Resin Matrix Aspects, Edited by G. Pritchard, Applied
Science Publishers Ltd.: London, p. 145, (1980).
70. Donnellan, T.: Personal Communication, (1993).
71. Kuhn, W. E.; Friedman, I. L.; Summers, W.; and
Szegvari, A.: in Metals Handbook, Ninth Ed., Vol. 7,
American Society For Metals: Metals Park, p. 56 (1984).
72. Kranbuehl, D. E.: in International Encyclopedia of
Composites, Volume. I, Edited by S. Lee, VCH: New York, p.
534, (1990).
J. Mater. Sci.,
65. Knott, J. F.: Mater. Sci. Eng., 7, i, (1971).
66. Wronski, A. S.: J. Mater. Sci., 12, 28, (1977).
67. Grindosonic Manual, Lemmens-Elecktroniks, Belgium.
Biosym Technologies, Biosym/MSI Workshop, "Polymer
62. Yamini, S.; and Young, R. J.:
1075,.(1977).
Polymer, 18,
61. Kies, J. A.; and Clark, B. J., in Fracture 1969, P. L.
Pratt, Ed., London: Chapman and Hall Ltd., 483, (1969).

73. Wang, M.; Johari, G. P.; and Szabo, J. P.:33, 4747, (1992).
Polymer,320
74. Sheppard, N. F.; Coln, M. C. W.; and Senturia, S. D.:
Proc. 29 TM National SAMPE Symposium and Exhibition, 1243,
(1984).
75. Olyphant, M.:
Conf., 12 (1965).
Proc 6 th IEEE Electrical Insulation
76. Mangion, M. B. M.; and Johari, G. P.:
Part B: Poly. Phys., 28, 1621, (1990).
J. Poly. Sci.:
77. Delides, G. C.; Hayward, D.; Pethrick, R. A.; and
Vatalis, A. S.: J. AppI. Poly. Sci., 47, 2037, (1993).
78. Uemura, S. J.:
1177, (1974).
J. Poly. Sci. Poly. Phys. Edn., 12,
79. Starkweather, H. W.; and Avakian, P.:
Part B: Poly. Phys., 30, 637, (1992).
J. Poly. Sci.:
80. Finzel, M. C.; Hawley, M. C.; and Jow, J.:
Sci., 31, 1240, (1991).
Poly. Eng.
81. Kranbuehl, D. E.: "Dielectric Monitoring of
Polymerization and Cure", in press, (1995).
82. Kenny, J. M.; Trivisano, A.; and Nicolais, L.: in
Advances in Chemistry Series, vol. 227, Edited by Clara D.
Craver and Theodore Provder, American Chemical Society,
Washington, DC, p. 539, (1990).
83. Barton, J. M.; Hamerton, I.; Rose, J. B.; and Warner,
D.: in Polyimides and other Hiqh-Temperature Polymers,
edited by M. J .M. Abadie and B. Sillion, Elsevier Science
Publishers, Amsterdam, p. 283, (1991).
84. Watson, E. S.; O'Neill, M. J.; Justin, J.; and
Brenner, N.: Anal. Chem., 36, 1233, (1964).
85. Varma, I. K.; Sangita; and Varma, D. S.:
Sci.: Poly. Chem. Edn., 22, 1419, (1984).
J. Poly.
86. Ninan, K. N.; Krishnan, K.; and Mathew, J.:
Poly. Sci., 32, 6033, (1986).
J. Appl.

87. Nanjan, M. J.; and Sivaraj, K.:A: Poly. Chem., 27, 375, (1984).
J. Poly. Sci.: Part321
88. Patel, H. S.; and Shah, V. J.:
Mater., 26, 79, (1994).
Int. J. Polymeric.
89. Arridge, R. G. C.; and Speake, J. H.:
443, (1972).
Polymer, 13,
90. LeMay, J. D.; and Kelley, F. N.:
78, 115, (1986).
Adv. Polym. Sci.,
91. Regnier, N.; and Mortaigne, B.: Polym. Adv. Techn.,
5, 513, (1994).
92. Chattha, M. S.; and Dickie, R. A.: J. Appl. Poly.
Sci., 40, 411, (1990).
93. Gupta, V. P.; and Brahatheeswaran, C.:
1875, (1991).
Polymer, 32,
94. Yamini, S.; and Young, R. J.:
1814, (1980).
J. Mater. Sci., 15,
95.
Y.:
Venditti, R. A.; Gillham, J. K.; Jean, Y. C.; and Lou,
J. Appl. Polym. Sci., 56, 1207, (1995).
96. Enoki, T.; Takeda, T.; and Ishii, K.:
Thermosetting Plast., 14, 131, (1993).
S.
97. Pritchard, G.; and Swan, M.:
(1995).
Poly. Int., 36, I,
98. Williams, J. G.: Fracture Mechanics of Polymers,
Ellis Horwood Publishing LTD., Chichester, England, (1984).
99. Heritage, K.; Frisby, C.; and Wolfenden, A.:
Sci. Instrum., 59, 773, (1988).
Rev.