guava easycyte systems expanding the potential of …geneious.mx/catalogos/newguavabrochure.pdf ·...
TRANSCRIPT

Guava EasyCyte™ Systems Expanding the potential of flow cytometry
Guava easyCyte™ Systems• Flexible• Intuitive• Affordable
Waste
Laser
Sample
Sam
ple
Flow
▸
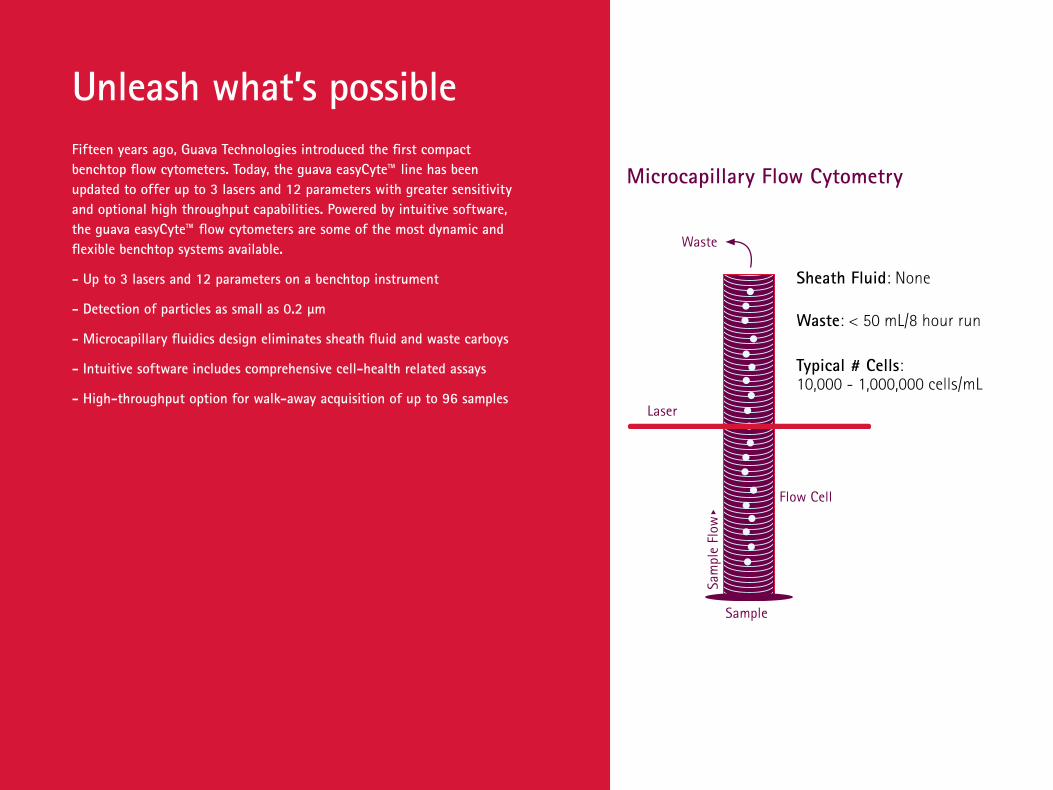
Microcapillary Flow Cytometry
Sheath Fluid: None
Waste: < 50 mL/8 hour run
Typical # Cells:10,000 - 1,000,000 cells/mL
Flow Cell
Unleash what’s possibleFifteen years ago, Guava Technologies introduced the first compact benchtop flow cytometers. Today, the guava easyCyte™ line has been updated to offer up to 3 lasers and 12 parameters with greater sensitivity and optional high throughput capabilities. Powered by intuitive software, the guava easyCyte™ flow cytometers are some of the most dynamic and flexible benchtop systems available.
- Up to 3 lasers and 12 parameters on a benchtop instrument
- Detection of particles as small as 0.2 μm
- Microcapillary fluidics design eliminates sheath fluid and waste carboys
- Intuitive software includes comprehensive cell-health related assays
- High-throughput option for walk-away acquisition of up to 96 samples

Inside the guava easyCyte™ 12 systems
How it Works
The guava easyCyte™ systems use patented, microcapillary, laser-based technology capable of detecting mammalian and microbial cells and beads. A sample of fluorescently labeled cells is aspirated into a uniquely proportioned microcapillary flow cell. Forward and side scatter characteristics are detected by photodiode, and fluorophores excited by the violet, blue, or red laser emit signals that are spectrally filtered to resolve up to 10 fluorophores simultaneously.
405
nm
NIR
785/
70
RED
695/
50
RED
-R66
1/15
YLW
583/
26
GRN
525/
30
488
nm
633
nm
SSC
FSC
BLU448/50
405 nm - Violet Laser
488 nm - Blue Laser
633 nm - Red Laser
Blu - V GRN - V YEL - V RED - V
GRN - B YEL - B RED - B NIR - B
RED - R NIR - R
(448/50)BV421™
Cascade Blue
(525/30)BV520™
Cascade Green
(583/26)BV605™
(695/50)BV650™
(525/30)FITC
AF® 488
(583/26)PE
(695/50)PE-Cy5.5
(785/70)PE-Cy7
(661/15)APCCy5
(785/70)APC-Cy7
APC-AF® 750

Sensitive and specificSpherotech 8-color beads analyzed on the guava easyCyte™ 12 system demonstrate the instrument’s proficiency for resolving adjacent fluorophores in multiple detection channels.
10⁰
140Cascade Blue MESF: 40
Blue - V Fluores (BLU-V-ALog)
100
70
40
1010¹ 10² 10³ 10⁴ 10⁵
Coun
t
10⁰
140FITC MESF: 75
Green-B Fluor... (GRN-B-ALog)
100
70
40
1010¹ 10² 10³ 10⁴ 10⁵
Coun
t
10⁰
140PE-Cy7 MESF: 120
Near IR-B Fluo...a (NIR-B-ALog)
100
70
40
1010¹ 10² 10³ 10⁴ 10⁵
Coun
t
10⁰
140PE-Cy5 MESF: 120
Red - B Fluores (Red-B-ALog)
100
70
40
1010¹ 10² 10³ 10⁴ 10⁵
Coun
t
10⁰
140APC MESF: 50
RED-R Fluores... (RED-R-ALog)
100
70
40
1010¹ 10² 10³ 10⁴ 10⁵
Coun
t
10⁰
140FITC MESF: 25
Yellow-B Fluor...a (YEL-B-ALog)
100
Coun
t
70
40
1010¹ 10² 10³ 10⁴ 10⁵
Blue Fluorescence - 405nm laser
Red Fluorescence - 488nm laser NIR Fluorescence - 488nm laser
Yellow Fluorescence - 488nmGreen Fluorescence - 488nm
Red Fluorescence - 633nm laser

Immunological Phenotyping
CD4+
CD8+
Plot P04, gated on PO1.CD45+.CD3-.R9
100
1
01
102
1
03
104
CD19
BV
510
(GRN
-V-H
Log)
CD19+
CD16&CD56+
101 102 103 CD16 + CD56 PE (YEL-B-HLog)
Plot P06, gated on P01.Cd45+.Cd3+.Cd
101 102 103 104
Cd45Ra aPC (Red-R-Hlog)
Cd62
l FI
tC (g
Rn-B
-Hlo
g)10
0
101
1
02
103
1
04
R6
Plot P05, gated on P01.CD45+.CD3+.CD
101 102 103 104
CD45RA APC (RED-R-HLog)
CD62
L FI
TC (G
RN-B
-HLo
g)10
0
101
1
02
103
1
04
R6
Plot P01, ungated
101 102 103
0 1
0000
30
000
50
000
70
000
90
000
CD45 PerCP-Cy5.5 (RED-HLog)
CD45+
Side
Sca
tter
(SSC
-HLi
n)
CD45+
Plot P03, gated on PO1.CD45-.CD3+
101 102 103 104
CD8 APC-Cy7 (NIR-R-HLog)
101
1
02
103
1
04CD
4 PE
-Cy7
(NIR
-B-H
Log)
CD4+
CD8+
CD3+CD3-
Plot P02, gated on P01.CD45+
101 102 103
0 1
0000
30
000
50
000
70
000
90
000
CD3 BV 421 (BLU-V-HLog)Si
de S
catt
er (S
SC-H
Lin)
CD3- CD3+
10 μL adult human blood was stained for 20 minutes at room temperature with a cocktail containing anti-CD45 PerCP-Cy5.5, anti-CD3 Brilliant™ Violet 421, anti-CD4 PE-Cy7, anti-CD8 APC-Cy7, anti-CD16+CD56 PE, anti-CD19 Brilliant™ Violet 510, anti-CD45 RA APC, and anti-CD62L FITC. After incubation, cells were lysed and fixed with 180 μL Guava® lysing solution for 15 minutes at room temperature. Samples were then acquired on the guava easyCyte™ 12HT system. Lymphocytes identified as CD45+ were
selected and subsequently gated into a SSC vs. CD3 plot. T cells (CD3+ and CD45+) were gated into a CD4 vs CD8 plot. CD4+ and CD8 + T cells were subtyped by evaluating each population using CD45RA and CD62L to differentiate naive from memory cells. To distinguish natural killer (NK) and B cells, CD3-negative cells were gated into a plot comparing CD19 (B cells) and CD16+56 (NK cells).

SoftwareThe guavaSoft™ operating system software provides access to modules for acquisition and analysis, as well as instrument setup and maintenance. The guavaSoft™ system includes templates for use with a wide range of EMD Millipore flow cytometry kits to simplify your experiments and data collection. Additionally, the guavaSoft™ package includes InCyte™ software, an intuitive open software package for custom analysis. Results can be exported to spreadsheets or as industry-standard FCS 2.0 or 3.0 files for further analysis. GuavaSoft™ software includes 21 CFR Part 11-enabling features.
InCyte™ Software: Intuitive
EMD Millipore’s InCyte™ software has an intuitive, easy-to-use interface that enables you to focus on data at the sample or experimental level. The software simplifies setup and analysis of plots with drag-and-drop features, while automated compensation makes it easy to perform complex, multi-color assays. The instant update feature responds in real time to change analysis conditions for viewing. The multiparameter heat mapping function allows analysis of entire plates of data in the time previously required to analyze a single sample. These features provide a simple and rapid means to attain a macroscopic view of experiment “hits” and easily compare different experiments in real time. InCyte™ software is especially useful for interpreting the results of high-throughput cell-based assays.
Annexin V CF400 (GRN - HLog7A
AD (R
ED -
HLo
g)
Plot PO3, gated on P01.R1
Mito
Sens
e Re
d (R
ED2
- H
Log)
Annexin V CF488 (GRN - HLog
Plot PO2, gated on P01.R1Plot PO1, ungated
Forward Scatter (FSC - HLog)
Side
Sca
tter
(SSC
- H
Lin)
1 2 3 4 5 6 7 8 9 10 11 12
Count: 2746
100 101 102 103 104020
0040
0060
0080
00
A
B
C
D
E
F
G
H
MitoSense Red (+)Annexin V (-)68.46%
MitoSense Red (+)Annexin V (+)
4.44%
MitoSense Red (-)Annexin V (-)6.19%
MitoSense Red (-)Annexin V (+)
20.90%100 101 102 103 104
100
10
1
102
10
3
104
100
10
1
102
10
3
104
100 101 102 103 104
Create and apply analysis methods across multiple datasets.
Analyze both tubes and plates.
Drag-and-drop gating.
View up to 24 plots at once.
Refine gates in real time.
Default or custom statistics.
Multiple plot and gating options.
Minimal gain adjustment needed when performing routine assays.
Perform compensation during acquisition or analysis or use the automated compensation features.
MitoSense Red
MitoStress
Annexin V-CF488
Caspase 3/7
7-AAD
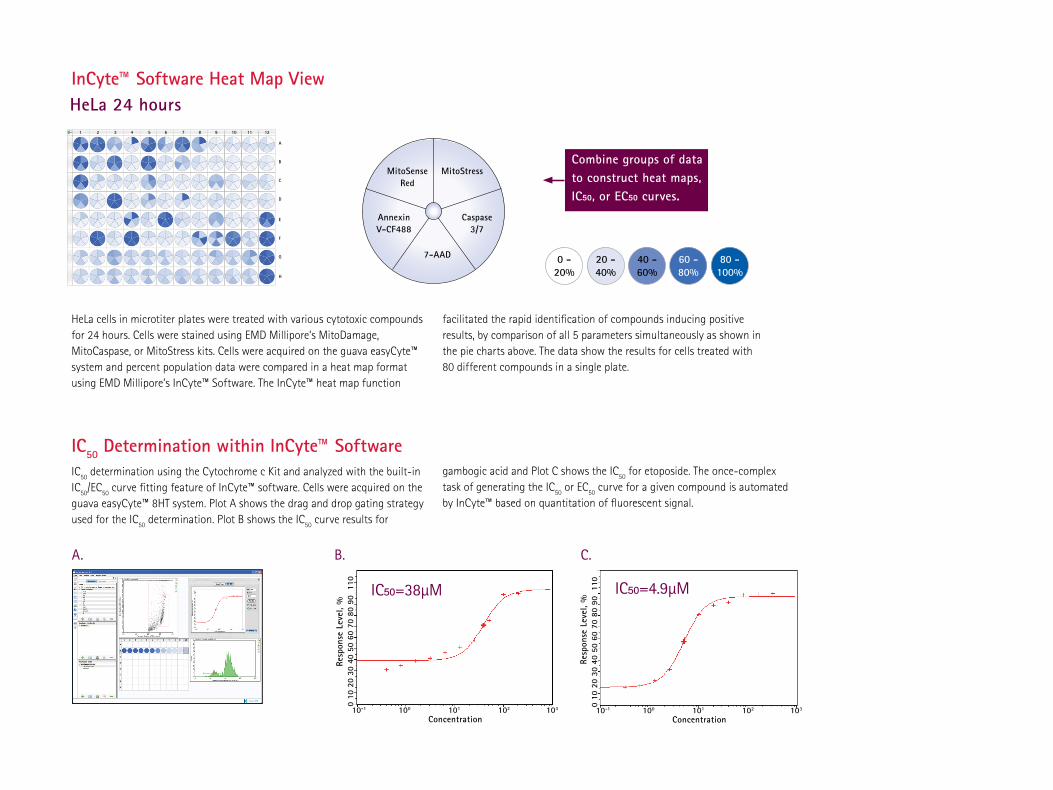
Combine groups of data to construct heat maps, IC50, or EC50 curves.
0 -20%
20 -40%
40 -60%
60 -80%
80 -100%
Resp
onse
Lev
el, %
0 10
20
30 4
0 50
60
70 8
0 90
110
10-1 100 101 102 103
Concentration
IC50=4.9µM
HeLa 24 hours1 2 3 4 5 6 7 8 9 10 11 12
A
B
C
D
E
F
G
H
InCyte™ Software Heat Map View
HeLa cells in microtiter plates were treated with various cytotoxic compounds for 24 hours. Cells were stained using EMD Millipore’s MitoDamage, MitoCaspase, or MitoStress kits. Cells were acquired on the guava easyCyte™ system and percent population data were compared in a heat map format using EMD Millipore’s InCyte™ Software. The InCyte™ heat map function
facilitated the rapid identification of compounds inducing positive results, by comparison of all 5 parameters simultaneously as shown in the pie charts above. The data show the results for cells treated with 80 different compounds in a single plate.
IC50 Determination within InCyte™ SoftwareIC50 determination using the Cytochrome c Kit and analyzed with the built-in IC50/EC50 curve fitting feature of InCyte™ software. Cells were acquired on the guava easyCyte™ 8HT system. Plot A shows the drag and drop gating strategy used for the IC50 determination. Plot B shows the IC50 curve results for
gambogic acid and Plot C shows the IC50 for etoposide. The once-complex task of generating the IC50 or EC50 curve for a given compound is automated by InCyte™ based on quantitation of fluorescent signal.
A.
Resp
onse
Lev
el, %
0 10
20
30 4
0 50
60
70 8
0 90
110
10-1 100 101 102 103
Concentration
IC50=38µM
B. C.

Side
-Sca
tter
(SSC
-HLo
g)
Forward Scatter (FSC-HLog)
1.3µm
0.8µm
0.4µm
0.2µm
100
100 101 102 103 104 105
101
102
103
104
105
Small Particle DetectionThe guava easyCyte™ 8 and 12 systems have been shown to detect particles as small as 0.2 μm, a significant improvement over typical flow cytometers. This increased resolution and sensitivity means better separation, making gating and identification of dim populations easier. These capabilities may prove particularly useful for researchers analyzing particulates, beads, bacteria or algae.
Acquisition of a mixture of beads of known size demonstrates the ability of guava easyCyte™ 12 instruments to detect and discriminate particles as small as 0.2 μm.
Lipid measurement of chlorophyll A-positive algae. Identification of algal cells containing chlorophyll A; chlorophyll A fluoresces in the red channel (A). Gate applied to select for chlorophyll A-positive cells (B). Histograms showing a wide range of lipid content (as evidenced by BODIPY green fluorescence intensity) for a variety of algal strains (C), with one clone showing as much as 500 times the lipid content as others.
Turning algae into biofuelseasyCyte™ systems are currently participating in algal biomass laboratories worldwide, where flow cytometry facilitates selection of high lipid content strains and efficient monitoring of cultures. Because microcapillary systems require smaller sample volumes, generate significantly less waste, have lower operating costs, enable high sample throughput, and have a small instrument footprint, they are a natural choice for demanding laboratory settings.
100 101 102 103 104
0
38
75
113
150
BODIPY (GRN-HLog)
Plot 4: Gated by Chlorophyll A
Coun
t
100 101 102 103 104
100
101
102
102
104
Chlorophyll A (RED-HLog)
Plot 4: No Gated
Side
Sca
tter
(SSC
-HLo
g)
100 101 102 103 104
0
5
10
20
30
BODIPY Fluorescence
Coun
t
High LipidContent Clone
M1 M2
100 101 102 103 104
0
38
75
113
150
BODIPY (GRN-HLog)
Plot 4: Gated by Chlorophyll A
Coun
t
100 101 102 103 104
100
101
102
102
104
Chlorophyll A (RED-HLog)
Plot 4: No Gated
Side
Sca
tter
(SSC
-HLo
g)
100 101 102 103 104
0
5
10
20
30
BODIPY Fluorescence
Coun
t
High LipidContent Clone
M1 M2
100 101 102 103 104
0
38
75
113
150
BODIPY (GRN-HLog)
Plot 4: Gated by Chlorophyll A
Coun
t
100 101 102 103 104
100
101
102
102
104
Chlorophyll A (RED-HLog)
Plot 4: No Gated
Side
Sca
tter
(SSC
-HLo
g)
100 101 102 103 104
0
5
10
20
30
BODIPY Fluorescence
Coun
t
High LipidContent Clone
M1 M2
A. Not Gated B. Gated by Chlorophyll A
C. Histograms showing varying lipid content of different algae clones
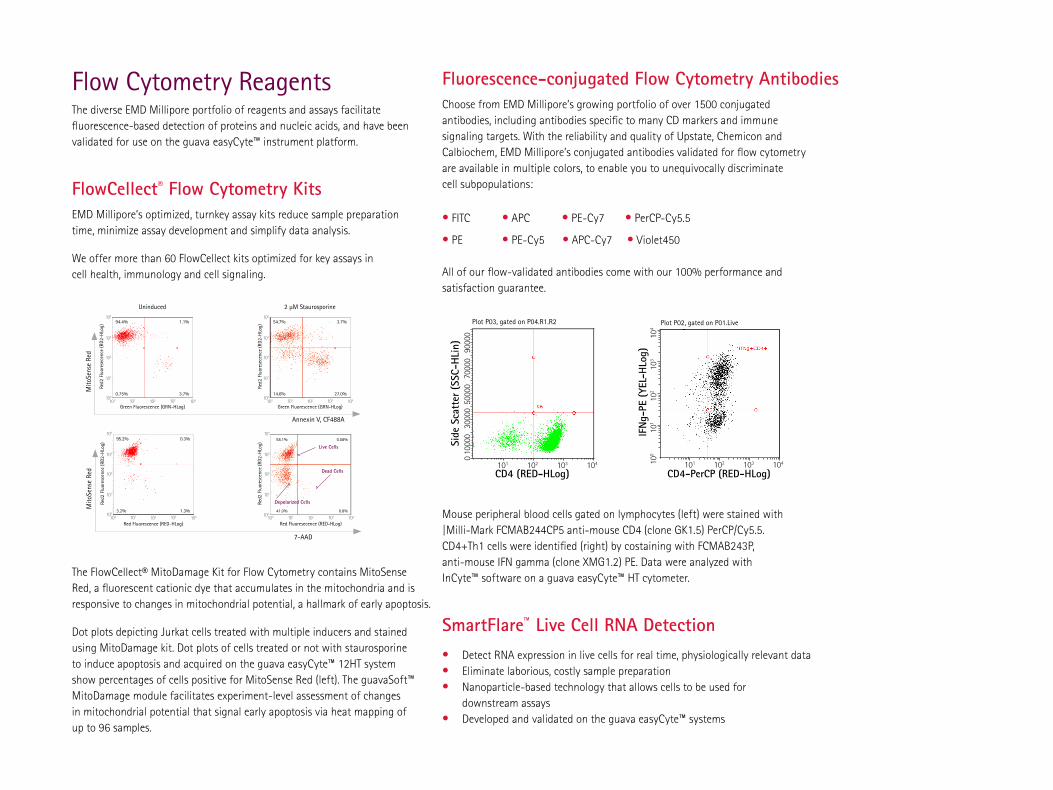
Fluorescence-conjugated Flow Cytometry AntibodiesChoose from EMD Millipore’s growing portfolio of over 1500 conjugated antibodies, including antibodies specific to many CD markers and immune signaling targets. With the reliability and quality of Upstate, Chemicon and Calbiochem, EMD Millipore’s conjugated antibodies validated for flow cytometry are available in multiple colors, to enable you to unequivocally discriminate cell subpopulations:
• FITC • APC • PE-Cy7 • PerCP-Cy5.5
• PE • PE-Cy5 • APC-Cy7 • Violet450
All of our flow-validated antibodies come with our 100% performance and satisfaction guarantee.
Mouse peripheral blood cells gated on lymphocytes (left) were stained with |Milli-Mark FCMAB244CP5 anti-mouse CD4 (clone GK1.5) PerCP/Cy5.5. CD4+Th1 cells were identified (right) by costaining with FCMAB243P, anti-mouse IFN gamma (clone XMG1.2) PE. Data were analyzed with InCyte™ software on a guava easyCyte™ HT cytometer.
SmartFlare™ Live Cell RNA Detection• Detect RNA expression in live cells for real time, physiologically relevant data• Eliminate laborious, costly sample preparation• Nanoparticle-based technology that allows cells to be used for
downstream assays• Developed and validated on the guava easyCyte™ systems
Flow Cytometry ReagentsThe diverse EMD Millipore portfolio of reagents and assays facilitate fluorescence-based detection of proteins and nucleic acids, and have been validated for use on the guava easyCyte™ instrument platform.
FlowCellect® Flow Cytometry Kits EMD Millipore’s optimized, turnkey assay kits reduce sample preparation time, minimize assay development and simplify data analysis.
We offer more than 60 FlowCellect kits optimized for key assays in cell health, immunology and cell signaling.
Uninduced
Mito
Sens
e Re
d
Annexin V, CF488A
Red2
Flu
ores
ecen
ce (R
D2-H
Log)
Green Fluorescence (GRN-HLog)
94.4%
0.75% 3.7%
1.1%
100 101 102 103 104100
101
102
103
104
Red2
Flu
ores
ecen
ce (R
D2-H
Log)
Green Fluorescence (GRN-HLog)
54.7%
14.6% 27.0%
100 101 102 103 104100
101
102
103
104
3.7%
2 µM Staurosporine
Mito
Sens
e Re
d
100 101 102 103 104100
101
102
103
104
Red2
Flu
ores
cenc
e (R
D2-H
Log)
Red Fluorescence (RED-HLog)
95.2%
3.2% 1.3%
0.3%
100 101 102 103 104100
101
102
103
104
Depolarized Cells
Dead Cells
Live Cells58.1% 0.08%
41.0% 0.8%
Red2
Flu
ores
cenc
e (R
D2-H
Log)
Red Fluoresecence (RED-HLog)
7-AAD
The FlowCellect® MitoDamage Kit for Flow Cytometry contains MitoSense Red, a fluorescent cationic dye that accumulates in the mitochondria and is responsive to changes in mitochondrial potential, a hallmark of early apoptosis.
Dot plots depicting Jurkat cells treated with multiple inducers and stained using MitoDamage kit. Dot plots of cells treated or not with staurosporine to induce apoptosis and acquired on the guava easyCyte™ 12HT system show percentages of cells positive for MitoSense Red (left). The guavaSoft™ MitoDamage module facilitates experiment-level assessment of changes in mitochondrial potential that signal early apoptosis via heat mapping of up to 96 samples.
Plot P02, gated on P01.Live
101 102 103 104
CD4-PerCP (RED-HLog)
IFN
g-PE
(YEL
-HLo
g)10
0
1
01
1
02
1
03
1
04
Plot P03, gated on P04.R1.R2
101 102 103 104 0
1000
0 3
0000
500
00
7000
0 9
0000
CD4 (RED-HLog)
Side
Sca
tter
(SSC
-HLi
n)

guava easyCyte™ Single Sample System
System easyCyte™ 5 easyCyte™ 6-2L easyCyte™ 8 easyCyte™ 12Catalogue No. 0500-5005 0500-5007 0500-5008 0500-5012Violet (405 nm) Laser
Blue (488 nm) Laser
Red (633 nm) Laser
FSC
SSC
Blue-V (448/50 nm)
Green-V (525/30 nm)
Yellow-V (583/26 nm)
Red-V (695/50 nm)
Green-B (525/30 nm)
Yellow-B (583/26 nm)
Red-B (695/50 nm)
NIR-B (785/70 nm)
Red-R (661/15 nm)
NIR-R (785/70 nm)
Microcapillary Fluidics
Direct, Absolute Cell Counts
Automation-plate and tubes
Mixing
Dell® Laptop
InCyte™ Software
Digital Signal Processing
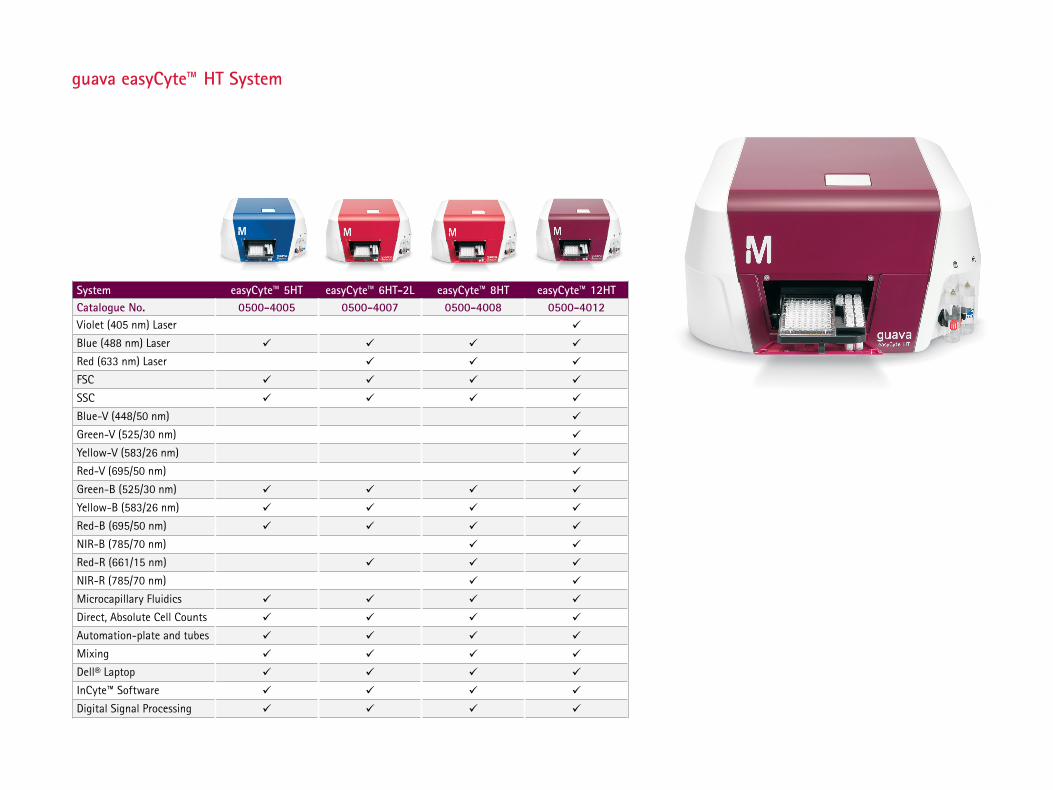
System easyCyte™ 5HT easyCyte™ 6HT-2L easyCyte™ 8HT easyCyte™ 12HTCatalogue No. 0500-4005 0500-4007 0500-4008 0500-4012Violet (405 nm) Laser
Blue (488 nm) Laser
Red (633 nm) Laser
FSC
SSC
Blue-V (448/50 nm)
Green-V (525/30 nm)
Yellow-V (583/26 nm)
Red-V (695/50 nm)
Green-B (525/30 nm)
Yellow-B (583/26 nm)
Red-B (695/50 nm)
NIR-B (785/70 nm)
Red-R (661/15 nm)
NIR-R (785/70 nm)
Microcapillary Fluidics
Direct, Absolute Cell Counts
Automation-plate and tubes
Mixing
Dell® Laptop
InCyte™ Software
Digital Signal Processing
guava easyCyte™ HT System
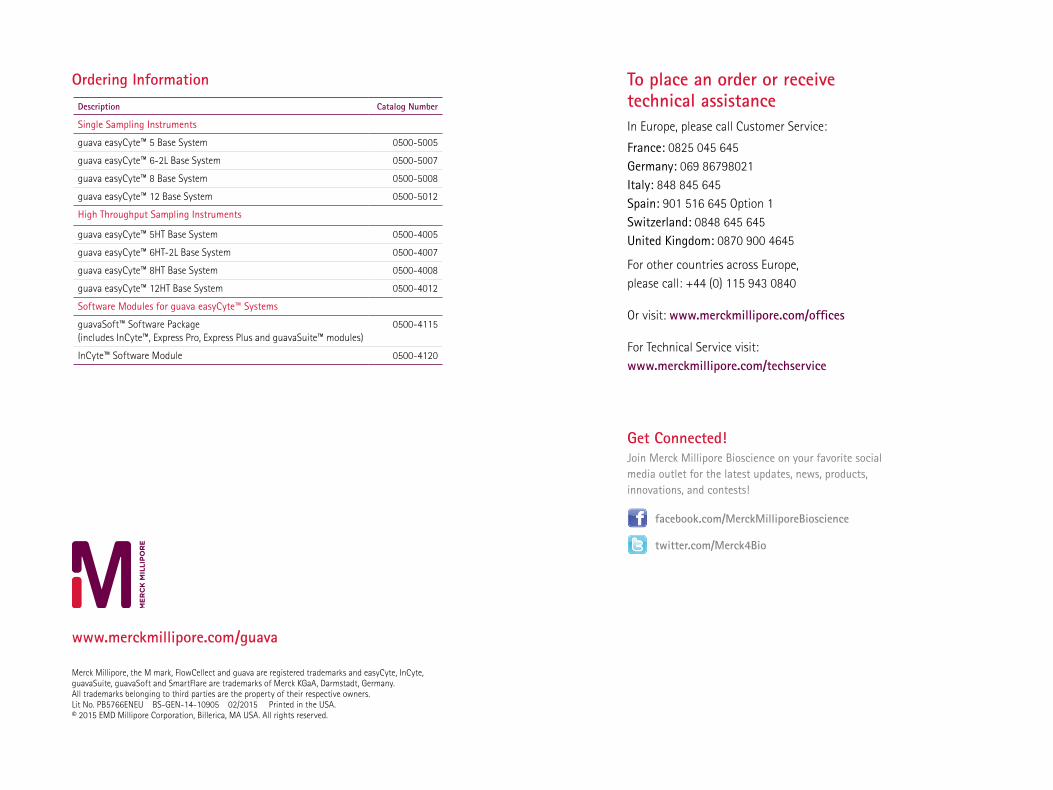
Ordering InformationDescription Catalog Number
Single Sampling Instruments
guava easyCyte™ 5 Base System 0500-5005
guava easyCyte™ 6-2L Base System 0500-5007
guava easyCyte™ 8 Base System 0500-5008
guava easyCyte™ 12 Base System 0500-5012
High Throughput Sampling Instruments
guava easyCyte™ 5HT Base System 0500-4005
guava easyCyte™ 6HT-2L Base System 0500-4007
guava easyCyte™ 8HT Base System 0500-4008
guava easyCyte™ 12HT Base System 0500-4012
Software Modules for guava easyCyte™ Systems
guavaSoft™ Software Package (includes InCyte™, Express Pro, Express Plus and guavaSuite™ modules)
0500-4115
InCyte™ Software Module 0500-4120
Merck Millipore, the M mark, FlowCellect and guava are registered trademarks and easyCyte, InCyte, guavaSuite, guavaSoft and SmartFlare are trademarks of Merck KGaA, Darmstadt, Germany. All trademarks belonging to third parties are the property of their respective owners. Lit No. PB5766ENEU BS-GEN-14-10905 02/2015 Printed in the USA. © 2015 EMD Millipore Corporation, Billerica, MA USA. All rights reserved.
www.merckmillipore.com/guava
To place an order or receivetechnical assistanceIn Europe, please call Customer Service:
France: 0825 045 645Germany: 069 86798021Italy: 848 845 645Spain: 901 516 645 Option 1Switzerland: 0848 645 645United Kingdom: 0870 900 4645
For other countries across Europe, please call: +44 (0) 115 943 0840
Or visit: www.merckmillipore.com/offices
For Technical Service visit:www.merckmillipore.com/techservice
Get Connected! Join Merck Millipore Bioscience on your favorite social media outlet for the latest updates, news, products, innovations, and contests!
facebook.com/MerckMilliporeBioscience
twitter.com/Merck4Bio