guide - final report · practice guide practice guide final report final report prepared for ec dg...
TRANSCRIPT

GUIDE GUIDE GUIDE GUIDE ---- Urban Urban Urban Urban Interchanges Interchanges Interchanges Interchanges ---- A Good A Good A Good A Good Practice GuidePractice GuidePractice GuidePractice Guide Final ReportFinal ReportFinal ReportFinal Report Prepared for EC DG VIIEC DG VIIEC DG VIIEC DG VII April 2000

Document ControlDocument ControlDocument ControlDocument Control
Project Title: GUIDE GUIDE GUIDE GUIDE ---- Urban Interchanges Urban Interchanges Urban Interchanges Urban Interchanges ---- A Good A Good A Good A Good Practice GuidePractice GuidePractice GuidePractice Guide
MVA Project Number: C8437
Document Type: Final Report
WP Reference: al/gt/lt
Directory & File Name: S:\tp\projects\8437\report\final\wp5v4.doc
Document ApprovalDocument ApprovalDocument ApprovalDocument Approval
Primary Author: George Terzis Other Author(s): Andrew Last Reviewer(s): Andrew Last
IssueIssueIssueIssue DateDateDateDate DistributionDistributionDistributionDistribution CommentsCommentsCommentsComments
1 17/06/99 GT/AL Draft 2 09/07/99 GT/AL Review 3 20/07/99 Partners Draft 4 27/08/99 EC Deliverable 5 26/04/00 EC Revised Final Report

Final Report For PublicationFinal Report For PublicationFinal Report For PublicationFinal Report For Publication
Urban InterchangeUrban InterchangeUrban InterchangeUrban Interchanges s s s ---- A Good Practice Guide A Good Practice Guide A Good Practice Guide A Good Practice Guide
Status: Public (P)Status: Public (P)Status: Public (P)Status: Public (P)
GUIDEGUIDEGUIDEGUIDE Contract No: URContract No: URContract No: URContract No: UR----97979797----SC.2087SC.2087SC.2087SC.2087
Project Project Project Project CoCoCoCo----ordinator:ordinator:ordinator:ordinator:
MVA Limited MVA House, Victoria Way Woking, Surrey GU21 1DD United Kingdom
Partners:Partners:Partners:Partners: Aristotle University of Thessaloniki (AUTH) Attiko Metro AE (AM) Centre d’Etudes sue les Réseaux, les Transports, l’Urbanisme et les Constructions Publiques (CERTU) Ecole Nationale des Ponts et Chaussées (ENPC) Ecole Polytechnique Fédérale de Lausanne (EPFL) Greater Manchester Passenger Transport Executive (GMPTE) London Transport (LT) Nederlandse Spoorwegen (NS) Régie Autonome des Transports Parisiens (RATP) Uppsala Universitet (UU) West Midlands Passenger Transport Executive (Centro)
Date:Date:Date:Date: April 2000
PROJECT FUNDED BY THE EUROPEAN COMMISSION UNDER THE TRANSPORT RTD PROGRAMME OF THE 4th FRAMEWORK PROGRAMME

ContentsContentsContentsContents
GUIDE - Urban Interchange - A Good Practice Guide
ChapterChapterChapterChapter PagePagePagePage PreamblePreamblePreamblePreamble Executive SummaryExecutive SummaryExecutive SummaryExecutive Summary List of Contact PersonsList of Contact PersonsList of Contact PersonsList of Contact Persons Part 1Part 1Part 1Part 1 Strategic OverviewStrategic OverviewStrategic OverviewStrategic Overview
1111 Why is Interchange Important?Why is Interchange Important?Why is Interchange Important?Why is Interchange Important? 2222
1.1 Introduction 2 1.2 What is Interchange and How Much Takes Place? 3 1.3 Is Interchange a ‘Good Thing’? 4
2222 Factors Affecting the Interchange ExperienceFactors Affecting the Interchange ExperienceFactors Affecting the Interchange ExperienceFactors Affecting the Interchange Experience 7777
3333 ImprovinImprovinImprovinImproving Interchangesg Interchangesg Interchangesg Interchanges 12121212
3.1 Strategies for Improving Urban Interchange Locations 12 3.2 Reducing Network-Wide Barriers to Interchange 14 3.3 Benefits from Improving Interchange 17
Part 2Part 2Part 2Part 2 Guide to Current PracticeGuide to Current PracticeGuide to Current PracticeGuide to Current Practice
4444 The LiteratureThe LiteratureThe LiteratureThe Literature 21212121
4.1 Objectives of the Literature Review 21 4.2 Conceptual Framework 22 4.3 The Gaps in Literature 23 4.4 Other Findings 24
5555 Surveys of Current PracticeSurveys of Current PracticeSurveys of Current PracticeSurveys of Current Practice 31313131
5.1 Objectives and Methodology 31 5.2 Response 36 5.3 Findings 38
6666 The Case StudiesThe Case StudiesThe Case StudiesThe Case Studies 53535353
6.1 Objectives of the Case Studies 53 6.2 Selection and Approach 53 6.3 Overview of Case Studies (Good and Bad Practice) 56
Part 3Part 3Part 3Part 3 RecommendationsRecommendationsRecommendationsRecommendations
7777 Improving Interchange at a NetworkImproving Interchange at a NetworkImproving Interchange at a NetworkImproving Interchange at a Network----wide Levelwide Levelwide Levelwide Level 83838383
7.1 Introduction 83 7.2 Setting the Network Context 83 7.3 Network-wide Information Strategy 84 7.4 Fares and Ticketing 87

ContentsContentsContentsContents
GUIDE - Urban Interchanges - A Good Practice Guide
7.5 Passenger Attitudes and Behaviour 87 7.6 Evaluation of Investment 90 7.7 Funding 91 7.8 Organisation and Management 92
8888 Improving Interchange at Individual Interchange LocationsImproving Interchange at Individual Interchange LocationsImproving Interchange at Individual Interchange LocationsImproving Interchange at Individual Interchange Locations 97979797
8.1 Introduction 97 8.2 Principles of Design and Layout 97 8.3 Local Accessibility - Linkages with Surrounding Area 99 8.4 Accessibility for the Mobility Impaired 102 8.5 Facilities 104 8.6 Image 107 8.7 Information 108 8.8 Signage 111 8.9 Personal Security 112 8.10 Operational Safety 114 8.11 Standards and Ergonomics 115
ReferencesReferencesReferencesReferences 102102102102

PreamblePreamblePreamblePreamble
i
How to Use this ReportHow to Use this ReportHow to Use this ReportHow to Use this Report This report sets out the main findings and conclusions from the GUIDE project. It is the final deliverable (D5). GUIDE is an international collaboration of European public transport operators, planners and researchers which has explored the subject of urban public transport interchange.
The work is intended to be helpful to a number of different audiences, and the report has been structured to facilitate access to the results at different levels to reflect different interests.
Part 1Part 1Part 1Part 1 provides an overview of the subject, highlighting key features from the research of which policy makers and senior public transport executives should be made aware.
Part 2Part 2Part 2Part 2 provides a more detailed and factual account of the work of the GUIDE Group, describing the study process that was carried out and summarising the main outputs from the different stages of the work programme. It will be of most interest to professionals and researchers seeking detailed information about the current ‘state of the art and practice’, and sources of further information.
Part 3Part 3Part 3Part 3 sets out the recommendations about how public transport passengers interchange experience can be improved; some of these recommendations are concerned with the principles underlying the detailed design of interchange facilities, but others are more general, and span the role of interchange within the public transport network, and the planning, organisation and staffing of facilities.
StatusStatusStatusStatus
Although the GUIDE Group contains participants from six different countries, and includes major public transport operators from some of Europe’s largest Cities, the Project cannot claim that its conclusions are representative of the views of anything other than the Partners within the Group. The interests and perspectives of the Project have been coloured by the concerns and objectives of Partner organisations, while the evidence that has been gathered reflects the information most easily accessed by the Partners, as well as the level of resources available.
This will inevitably lead to omissions, and some partiality. We hope that many of our conclusions will be shared by fellow professionals from other organisations, but even if not, we trust that our work will at least stimulate some positive reactions in terms of alternative propositions or further research. The GUIDE ProjectThe GUIDE ProjectThe GUIDE ProjectThe GUIDE Project In December 1997 the European Commission, Directorate General 7 commissioned the Group for Urban Interchanges Development and Evaluation (GUIDE) Consortium to undertake research with the aim of
PreamblePreamblePreamblePreamble
ii
encouraging good practice in the development and evaluation of urban interchanges across Europe. The terms of reference of the project are described in Annex I (Technical Annex: Parts 1 and 2) and Annex II (General Conditions) of the Contract titled The GUIDE Project, Contract No UR-97-SC.2087 signed by the Commission on 16 December 1997. The official start date of the project was 1 January 1998. The GUIDE Consortium comprises public transport operators and transport planning authorities, providing services in major European Cities, together with educational establishments and transport consultants as follows: MVA, based in Woking, England (co-ordinator) UK Attiko Metro AE (AM), Athens, Greece GR Aristotle University of Thessaloniki (AUTH), Greece GR Centre d’Etudes sur les Réseaux, les Transports, l’Urbanisme et les Constructions Publiques (CERTU), Lyon, France FR Ecole Nationale des Ponts et Chaussées (ENPC), Paris, France FR Ecole Polytechnique Fédérale de Lausanne (EPFL), (with financial support from OFES) Switzerland CH Greater Manchester Passenger Transport Executive (GMPTE), UK London Transport (LT), England UK Nederlandse Spoorwegen (NS), The Netherlands NL Régie Autonome des Transports Parisiens (RATP), Paris, France FR Uppsala Universitet (UU), Sweden SE West Midlands Passenger Transport Executive (Centro), England UK
The objectives and work methodology of the project are described in detail in Part 2 of the Technical Annex to the contract. In brief the objectives are to: • = identify and summarise existing European research on
interface issues; • = provide a framework for collaborative research amongst major
European public transport operators on issues concerned with improving passenger interface;
• = determine good practice in the functional specification and
design aspects of passenger interface, through case study review;

PreamblePreamblePreamblePreamble
iii
• = disseminate the outputs through review meetings, preparation of a ‘good practice’ guide, conferences, seminars and publications.
GUIDE is organised into six Work Packages (WP) reflecting the objectives of the project and containing a large number of tasks. The work packages are: • = inception (WP1); • = review of the state of the art (WP2); • = surveys of current practice and passengers’ perceptions (WP3); • = case studies (WP4); • = synthesis and development of conclusions (WP5); • = project management, coordination and reporting (WP6). In correspondence with the work packages, the project deliverables (D)
include: • = project management and quality assurance plan (D1); • = literature review of previous European work devoted to
passenger interface issues (D2); • = report on the survey of current practice across public transport
operators in Europe as well as a report on the surveys of passengers’ perceptions (D3);
• = report on case studies (D4); • = a ‘guide to good practice’ (D5). Dissemination and ExpDissemination and ExpDissemination and ExpDissemination and Exploitationloitationloitationloitation When the GUIDE project was first conceived, the subject of Public Transport Interchange was little recognised and under-researched. It has now become a key topic in many medium to large cities because of its significance for the quality of public transport. GUIDE, as well as other EC Funded work (e.g. MMIC, PIRATE) has contributed to this realisation and the papers and presentations prepared by GUIDE partners, together with the Web Site WWW.interchanges.co.uk have facilitated a wide dissemination of the research findings. The GUIDE project has provided the opportunity for its partners, planners and operators from some of Europe’s leading public transport organisations to observe practice in other countries, to debate good points and weak points with informed and interested colleagues, and to develop their own thinking about how to apply the lessons learned to their own situations. Thus, there is a direct exploitation of the results within the GUIDE partners’ organisation. The deliverables from the GUIDE project, also provide a record of some of these lessons. It is

PreamblePreamblePreamblePreamble
iv
hoped that fellow professionals will also find our research of value, and will enhance their efforts to improve the quality of their public transport systems. AcknowledgementsAcknowledgementsAcknowledgementsAcknowledgements GUIDE has been part-funded by Directorate-General VII of the European Commission, under the Fourth Framework research programme. We acknowledge with thanks the support of the officials of DG VII who have provided encouragement and direction throughout the project. We are also grateful to colleagues working in the same area, particularly the MIMIC and PIRATE projects also funded through the Fourth Framework, for their collaboration and participation in joint meetings and the International Seminar organised by GUIDE and hosted by RATP in Paris (April 1999).
The European Commission has stimulated the project through articulating the need for research and providing half of the funds. The balance of costs has been borne by the Partner organisations themselves, which have both contributed money, but more importantly made available key staff to carry out the work. The Swiss participation (EPFL) was partly funded by the Federal Office for Education and Science (OFES). We are most grateful to the Partners organisations for their support, and trust that substantial benefits will be generated as a consequence.
Finally, a large number of colleagues outside the formal GUIDE partnership arrangements have given time to provide data, share knowledge of research and generally help improve the coverage of material drawn upon by GUIDE. We are most grateful to these individuals and organisations.

Executive SummaryExecutive SummaryExecutive SummaryExecutive Summary
v
Why is Interchange ImportantWhy is Interchange ImportantWhy is Interchange ImportantWhy is Interchange Important
There is now almost universal acceptance within Europe that better public transport is a key component of a number of areas of policy designed to improve the quality of life. Most obviously, it is an essential part of transport strategies designed to reduce car-dependency, so as to deliver benefits of improved transport system efficiency and reduced environmental damage. But improving public transport can also strengthen a number of other areas of public policy such as social inclusion and sustainability.
Interchange between services is an inescapable feature of public transport. The essence of a public transport system is the concentration of passenger flows onto specific lines of movement; it is almost inevitable that the network of individual lines - be they bus routes or rail services - will not serve all combinations of passenger origin and destination.
The ideal which public transport operators and planners would like to work towards is ‘the seamless journey’, in which a passenger making a journey which involves a transfer between services would be hardly aware of the fact.
In practice, it is difficult to see how some of the negative aspects of interchange between services can be avoided, such as some additional waiting and walking time. However, quite apart from walking and waiting time, the typical large-city public transport system creates many additional barriers to interchange such as lack of information, unpleasant conditions, and a poor sense of security, lack of integration, etc.
Public transport interchanges tend to have the dual function of providing access to public transport and transfer between public transport vehicles. In addition, the word interchange has two meanings:
• = it can describe the action of interchanging, as passengers transfer
between vehicles as part of a journey;
• = but it can also mean a location where interchange takes place.
While it is easy to identify physical locations where interchange may take place, it is more difficult to find out how many passengers are making use of these opportunities. We collected information on public transport in 20 European cities but were able to establish the volume of interchange movements in only 12 of them. It is apparent that in general very little is known about the volume of interchange taking place in many cities.
However, it is clear that the propensity to interchange varies considerably. Statistics from some cities (for example Munich and London) imply that almost half of all passenger journeys involve at least one change of mode or service. In contrast, in other cities, (for example Manchester and Newcastle) the proportion of interchanging passengers

Executive SummaryExecutive SummaryExecutive SummaryExecutive Summary
vi
is significantly lower, with less than ten percent of passenger journeys involving an interchange.
The data we gathered does suggest that the cities with the higher propensities to interchange tended to have a significant rail-based (including underground, metro or tram systems) element in their public transport systems. It also seemed that there was some association of higher levels of transfer with higher public transport modal shares. Reducing barriers to interchange will enable individual passengers to gain more benefit from the public transport system, and will increase the attractiveness of the public transport ‘offer’ relative to the car.
Improving interchange at a networkImproving interchange at a networkImproving interchange at a networkImproving interchange at a network----wwwwide levelide levelide levelide level
Our work has identified an overall process for improving the quality of interchange by defining the strategic public transport networkstrategic public transport networkstrategic public transport networkstrategic public transport network. Such a definition is the starting point for this process, because it allows the function of individual interchanges to be established, in terms of:
• = the services to be connected; • = the volume of passenger flows; and • = the balance of use of the interchange between local access and
egress, and transfer between services.
An overall information strategyinformation strategyinformation strategyinformation strategy for the network is needed, including all public transport modes. It should ideally embrace all media, setting out the role for:
• = high level advertising; • = system maps at both a network and (potentially) more local level; • = static timetable information; • = other static information such as fares and ticket products; • = real-time information systems delivering information to
individual stations, bus stops and tram stops; • = centrally provided information facilities such as call centres and
telephone inquiry bureaux, or the internet; • = information provision by local staff at individual locations around
the network.
The way in which interchange opportunities are presented through the information strategy provides an extremely important mechanism for both moulding passenger expectations and also (to some degree) steering passengers towards a higher quality public transport experience. The key is through a system of standardsstandardsstandardsstandards that can be used to:
• = measure the acceptability of current interchange quality at
individual locations; • = establish expectations of quality in the minds of passengers; and • = articulate aspirations for the future in terms of progressive
improvement in the level of standard achieved.

Executive SummaryExecutive SummaryExecutive SummaryExecutive Summary
vii
Fares and ticketingFares and ticketingFares and ticketingFares and ticketing policies are key factors affecting the propensity to transfer at the network level. Fares and ticketing products should not impose additional disincentives for passengers to change between services but often do. Our tests of network wide interchange strategy showed that reductions in other barriers to interchange had very little effect, and created minimal benefit, unless the fare system was also designed to be “seamless”. Modern technology such as smart cards gives operators more choice for reducing such barriers to interchange.
The most consistent lesson from the research of the GUIDE group is that improvement of interchange requires a holistic view of the experience provided to interchanging passengers. An important corollary is that an organisation and managementorganisation and managementorganisation and managementorganisation and management structure needs to be in place that is capable of examining interchange aspects of the public transport ‘offer’ that is unconstrained by organisational boundaries.
Both Paris and London offer examples of network-wide organisational structures operating at these two levels (Network Level Committees in Paris and the London Interchange Network).
These arrangements encourage a multidisciplinary approach which brings together both the planner’s strategic view of the place of interchange activity within the network as a whole, as well as the implementation skills and practical experience of operators.
One of the most significant initiatives that can thus be taken at a network wide level is the promotion of liaison and coordination arrangements at the location specific level. It is evident that local managers are often able to identify opportunities to improve the interchange experience for passengers, but may feel inhibited from doing so because it may require crossing organisational boundaries. General encouragement and the establishment of ‘model’ local organisations (such as the Paris Site Committees) will go a long way to reduce such inhibitions.
Improving interchange at individual interchange locationsImproving interchange at individual interchange locationsImproving interchange at individual interchange locationsImproving interchange at individual interchange locations
The objective of the design and layoutdesign and layoutdesign and layoutdesign and layout of an interchange is to match form to function as effectively as possible. In looking at any particular interchange location, this implies that the starting point should be an understanding of the function that is to be served. Clearly, an interchange should facilitate movement of passengers between public transport services, and generally also help passengers access those services from the surrounding area. But the nature of the passenger use of the interchange should have an influence on how it is designed, because much of the design process will be concerned with compromises between conflicting objectives.
Interchanges play a key role in providing accessibility to the public accessibility to the public accessibility to the public accessibility to the public transport networktransport networktransport networktransport network. In the vast majority of interchange locations, more passengers are likely to use the facilities for access to public transport services rather than for transfer between services. Improving the accessibility offered by an interchange requires:

Executive SummaryExecutive SummaryExecutive SummaryExecutive Summary
viii
• = an integrated approach to setting the interchange in its urban
context; • = a comprehensive approach to designing access to the interchange
by all relevant modes, including walk, cycle, taxi and car; • = a recognition that the existence of the interchange should be
acknowledged at some distance from it, particularly in terms of signing.
The key access mode for most interchanges will be the walk mode, and since all passengers will be pedestrians at some points in their journeys, getting detail right for pedestrians is essential. However, other access modes may also be important, depending upon context, including cycles, taxis, cars (as in “Kiss and Ride”) and cars (as in “Park and Ride”).
There is increasing recognition that city and local centres within urban areas need management as an entity, embracing a number of functions including planning, street furniture maintenance, and publicity for the centre. The promotion of the public transport system, and of specific interchange facilities, should be seen as part of this overall process, so that signage, and possibly real-time information systems, become a natural part of the facilities provided by shopping centres or other commercial developments.
Improving the accessibility of the public transport network for those with mobility impairments mobility impairments mobility impairments mobility impairments has become an increasingly high priority for many Cities over the last few years. Partly, this reflects the realisation that the features of the system that can assist the more severely disadvantaged will also assist very large numbers of other passengers such as parents with young children in pushchairs or prams; or passengers with luggage. The availability of a range of facilitiesfacilitiesfacilitiesfacilities can reduce the disutility of interchange to the passenger by creating a positive benefit from time spent at the location. At the same time opening up interchanges to non-travellers may improve security issues (by encouraging more people to be in the vicinity), but may also lead to problems if the interchange attracts undesirable elements.
Our Case Studies provided illustrations of a number of facets of the commercial exploitationcommercial exploitationcommercial exploitationcommercial exploitation of interchange space. For example, a significant element of the funding of new bus or metro stations can be leveraged through the associated commercial retail development (see Hammersmith London, UK). On the other hand, the volume of retail activity in the interchange space can be so great that passengers cannot easily identify key features such as platform entrances (for example, Utrecht Central Station Netherlands, or Gare du Nord Paris).
The logical extension to retail development associated with interchange is the ‘Village Services’ concept being developed at La Défense (Paris, France).

Executive SummaryExecutive SummaryExecutive SummaryExecutive Summary
ix
Interchanges are the principal shop window for the public transport system, and as such the image image image image that they convey will be a major influence on public perceptions of public transport. While (arguably) regular passengers, and especially commuters, may not be very sensitive to such things, two aspects will be particularly important to potential or irregular travellers:
• = the extent to which the image projected is one that the passenger
feels comfortable being associated with (“...am I the sort of person who goes there...);
• = the extent to which the passenger will feel welcomed or threatened
by the entrance to the public transport system, especially in terms of reassurance about where to go or where to seek assistance.
The image of the public transport system projected through the appearance of individual interchanges has an important role in encouraging potential users to commit themselves to using the public transport system. However, if a willingness to consider using public transport has been established, the next stage in turning a potential passenger into an actual passenger is to provide more informationinformationinformationinformation about the product on offer.
The way in which the public transport network as a whole is presented (for example, through a network map) can be used to establish the role of individual interchange locations. The strategy for the provision of information at an individual interchange should flow from this role, and oriented towards two distinct groups of passengers:
• = potential passengers planning their journeys, for whom an
interchange is the natural point of inquiry at which to find out about services and fares, etc;
• = assisting passengers get to, from and between the public transport
services within the interchange area.
Clearly, with larger interchanges with bigger numbers of services, the amount of information that could be displayed increases substantially, to the point where there is the danger of information overload. A consistent convention for the labelling and design of all forms of static information needs to be established at a network-wide level to help users recognise the type of information being offered at a particular point within the interchange.
Non-travel related commercial activity at an interchange can be a distinct disbenefit in this context, because retail outlets can create so much information “noise” (through frontage designs, shop names and product displays) that travel-related information gets lost amongst the clutter.
For many passengers, the preferred source of information and guidance will always be well informed and accessible staff, such as the staffed information desks at the Bureau Information Publique (BIP) in Paris.

Executive SummaryExecutive SummaryExecutive SummaryExecutive Summary
x
Another example of good practice are the Customer Care Assistants (CCA) employed by London Underground whose duties extend to an ambassadorial role. Both CCA and BIP as mentioned above can also provide real time information.
The signssignssignssigns that help passengers find their way around an interchange are a special form of information and particularly important to the effective operation of an interchange.
The fundamental components of signing schemes should be set at the network-wide level, with standardised pictograms, colour schemes, font designs, and sizes. The scope of the signing scheme should clearly include all public transport modes (including taxis) but should also make provision for cycle facilities, car parking, and full range of facilities likely to be encountered, including toilets, information points, telephones, shops, etc.
Standards of good practice have been developed by a number of organisations and operators within Europe, but there is no European standardisation. We strongly recommend the development of a European standard, with a moderate number of pictograms that individual operators can incorporate into individual signage schemes.
Personal securitysecuritysecuritysecurity (in the sense of fear of theft and assault) is commonly considered as a major issue at all interchanges, whether large (e.g. Gare du Nord, Utrecht) or small (e.g. Bury, Cradley Heath). It extends to concern about the welfare of employees, and also operators commercial interest in minimising fraud. For passengers, the main issue appears to be the feeling of insecurity rather than statistical evidence of crime. In fact, crime statistics at interchanges are rarely available and the available evidence does not suggest that transport interchanges are any different to other comparable public spaces.
Larger numbers of staff are often seen as important contributors to an improved sense of security, and can also of course provide passenger information, aid space management, and maintain safety. In most European countries an enhanced police presence was considered important, although some GUIDE Partners preferred a larger (uniformed) staff presence who could combine basic security duties with customer care.
Technical solutions such as automatic ticket barriers (which restrict access and also combat fraud), CCTV and help points have benefits and appear to be cost-effective, although, in some countries (e.g. Sweden) there are legal constraints on the use of CCTV. Security measures are sometimes not sufficiently publicised, and therefore do not fully address the underlying fears of passengers - for example, it is not widely known that London Transport’s Help Points are all covered by CCTV.
Design features have a major contribution to combating insecurity, by improving lines of visibility, lighting and creating a pleasant ambience (e.g. see new interchanges in The Netherlands); equally important is a

Executive SummaryExecutive SummaryExecutive SummaryExecutive Summary
xi
consistent maintenance regime which demonstrates an alertness of management and an aspiration to high standards.
FinallyFinallyFinallyFinally
When the GUIDE project was first conceived, the subject of public transport interchange was little recognised and under-researched. It has now become a key topic in many medium to large cities because of its significance for the quality of public transport.
The GUIDE project has provided the opportunity for planners and operators from some of Europe’s leading public transport organisations to observe practice in other countries, to debate good points and weak points with informed and interested colleagues, and to develop their own thinking about how to apply the lessons learned to their own situations. It is hoped that fellow professionals will also find our research of value, and will enhance their efforts to improve the quality of their public transport systems.

List of Contact PersonsList of Contact PersonsList of Contact PersonsList of Contact Persons
xii
MVA LimitedMVA LimitedMVA LimitedMVA Limited (Coordinator) Woking, Surrey, United Kingdom (George Terzis) Tel: (+44) (0) 1483 728051 Fax: (+44) (0) 1483 755207 e-mail: [email protected] Aristotle University of Thessaloniki (AUTH)Aristotle University of Thessaloniki (AUTH)Aristotle University of Thessaloniki (AUTH)Aristotle University of Thessaloniki (AUTH) Thessaloniki, Greece (Christos Taxiltaris) Tel: (+30) (0) 31 996126 Fax: (+30) (0) 31 996154 e-mail: [email protected] Attiko Metro AE (AM)Attiko Metro AE (AM)Attiko Metro AE (AM)Attiko Metro AE (AM) Athens, Greece (George Nellas) Tel: (+30) (0) 1 6792040 Fax: (+30) (0) 1 6726126 e-mail: [email protected] Centre d’Etudes sur les Réseaux, les Transports, l’Urbanisme et les Centre d’Etudes sur les Réseaux, les Transports, l’Urbanisme et les Centre d’Etudes sur les Réseaux, les Transports, l’Urbanisme et les Centre d’Etudes sur les Réseaux, les Transports, l’Urbanisme et les Constructions Publiques (CERTU)Constructions Publiques (CERTU)Constructions Publiques (CERTU)Constructions Publiques (CERTU) Lyon, France (Maurice Abeille) Tel: (+33) (0) 4 72 74 5820 Fax: (+33) (0) 4 72 74 5920 e-mail: [email protected] Ecole Nationale de Ponts et Chaussées (ENPC)Ecole Nationale de Ponts et Chaussées (ENPC)Ecole Nationale de Ponts et Chaussées (ENPC)Ecole Nationale de Ponts et Chaussées (ENPC) Marne la Vallee, France (Nikolas Stathopoulos, Fabienne Margail) Tel: (+33) (0) 1 64 15 3599 Fax: (+33) (0) 1 64 15 3000 e-mail: [email protected]. e-mail: [email protected] Ecole Polytechnique Fédérale de Lausanne (EPFL) Ecole Polytechnique Fédérale de Lausanne (EPFL) Ecole Polytechnique Fédérale de Lausanne (EPFL) Ecole Polytechnique Fédérale de Lausanne (EPFL) Lausanne, Switzerland (Christophe Jemelin) Tel: (+41) (0) 21 693 3296 Fax: (+41) (0) 21 693 3840 e-mail: [email protected] Greater Manchester Passenger Transport ExecutivGreater Manchester Passenger Transport ExecutivGreater Manchester Passenger Transport ExecutivGreater Manchester Passenger Transport Executive (GMPTE)e (GMPTE)e (GMPTE)e (GMPTE) Manchester, United Kingdom (Nick Vaughan) Tel: (+44) (0) 161 242 6224 Fax: (+44) (0) 161 242 6205 e-mail: [email protected] London Transport (LT)London Transport (LT)London Transport (LT)London Transport (LT) London, United Kingdom (Jon Willis) Tel: (+44) (0) 171 918 3331 Fax: (+44) (0) 918 3395 e-mail: [email protected] Nederlandse Spoorwegen (NS)Nederlandse Spoorwegen (NS)Nederlandse Spoorwegen (NS)Nederlandse Spoorwegen (NS) Utrecht, The Netherlands (Mark van Hagen) Tel: (+31) (0) 30 2357781 Fax: (+31) (0) 30 2355073 e-mail: [email protected]

List of Contact PersonsList of Contact PersonsList of Contact PersonsList of Contact Persons
xiii
Régie Autonome des Transports Parisiens (RATP)Régie Autonome des Transports Parisiens (RATP)Régie Autonome des Transports Parisiens (RATP)Régie Autonome des Transports Parisiens (RATP) Paris, France (Monique Smolar) Tel: (+33) (0) 1 44 68 2433 Fax: (+33) (0) 1 44 68 2320 e-mail: [email protected] Uppsala UniversitetUppsala UniversitetUppsala UniversitetUppsala Universitet (UU)(UU)(UU)(UU) Uppsala, Sweden (Eric Clark) Tel: (+46) (0) 46 222 9496 Fax: (+46) (0) 46 222 8401 e-mail: [email protected] West Midlands Passenger Transport ExecuWest Midlands Passenger Transport ExecuWest Midlands Passenger Transport ExecuWest Midlands Passenger Transport Executive (Centro)tive (Centro)tive (Centro)tive (Centro) Birmingham, United Kingdom Tel: (+44) (0) 121 214 7154 Fax: (+44) (0) 121 214 7010 e-mail [email protected]

GUIDE - Urban Interchanges - A Good Practice Guide Page 1
Part 1Part 1Part 1Part 1 Strategic OverviewStrategic OverviewStrategic OverviewStrategic Overview This part of the final report of the GUIDE project provides a strategic overview of the subject of passenger transport interchanges. It highlights key features from the GUIDE research of which policy makers and senior public transport executives should become aware. Part 1 discusses what is interchange, why it is important and its key features. Next it introduces the most important factors affecting the interchange experience, ranging from physical arrangements to institutional structures. Finally, it suggests strategies for improving interchange and points out the benefits of doing so. Most of the material presented in this Part was written after completion of WP2, WP3 and WP4 and as part of WP5: Synthesis, but it was really developed during the course of all four work packages. It greatly benefited from all previous work packages as well as the International Seminar (Paris, April 1999) organised by GUIDE and other discussions between Partners.

GUIDE - Urban Interchanges - A Good Practice Guide Page 2
1111 Why is Interchange Important?Why is Interchange Important?Why is Interchange Important?Why is Interchange Important?
1.11.11.11.1 IntroductionIntroductionIntroductionIntroduction
1.1.1 There is now almost universal acceptance within Europe that better public transport is a key component of a number of areas of policy designed to improve the quality of life.
1.1.2 Most obviously, it is an essential part of transport strategies designed to reduce car-dependency, so as to deliver benefits of improved transport system efficiency and reduced environmental damage. But improving public transport can also strengthen a number of other areas of public policy such as social inclusion and sustainability.
1.1.3 Interchange between services is an inescapable feature of public transport. The essence of a public transport system is the concentration of passenger flows onto specific lines of movement; it is almost inevitable that the network of individual lines - be they bus routes or rail services - will not serve all combinations of passenger origin and destination.
1.1.4 If in general the quality of the interchange experience across the public transport system is poor, very few passengers will choose to make public transport journeys if they involve a transfer between services, and if they have a choice of alternative modes. Consequently, improving the quality of the experience of interchange will widen the range of journeys that can be made by public transport, and reduce the incentive to use alternatives - particularly the private car.
1.1.5 The ideal which public transport operators and planners would like to work towards is ‘the seamless journey’, in which a passenger making a journey which involves a transfer between services would be hardly aware of the fact.
1.1.6 In practice, it is difficult to see how some of the negative aspects of interchange between services can be avoided, such as some additional waiting and walking time. However, quite apart from walking and waiting time, the typical large-city public transport system creates many more barriers to interchange than just additional travel time. These can include:
• = lack of information about the services that are available; • = poor signing to show how to get between services; • = unpleasant conditions for walking and waiting; • = lack of security, or a sense of ‘not being safe’.
1.1.7 Often, simple lack of consideration of the needs of the interchanging passenger creates needless physical obstacles and organisational boundaries often prevent integrated management of all aspects of the passenger’s interchange experience.

1111 WhyWhyWhyWhy isisisis InterchangeInterchangeInterchangeInterchange Important?Important?Important?Important?
GUIDE - Urban Interchanges - A Good Practice Guide Page 3
1.1.8 The reality is thus that most public transport systems offer a far from seamless journey, and that the need to interchange is a major deterrent to public transport use. As a result, public transport networks deliver far less ‘connectivity’ - good quality connections between different parts of the urban area - than they should, and the public transport system does not make the contribution it could to attracting potential passengers, such as car users, off the road.
1.21.21.21.2 What is Interchange and How Much Takes Place?What is Interchange and How Much Takes Place?What is Interchange and How Much Takes Place?What is Interchange and How Much Takes Place?
1.2.1 At the start of this project we extensively considered the dual functioning of interchanges: access to public transport and interchange between public transport vehicles. This led us to introducing the term passenger ‘interface’ to emphasise both functions. Later it emerged that another dualism is equally important in understanding and analysing interchange.
1.2.2 Discussion of interchange is often confused by the fact that it is one word with two meanings:
• = it can describe the actionactionactionaction of interchanging, as undertaken by passengers as part of a journey (sometimes termed ‘transfer’);
• = but it can also mean a locationlocationlocationlocation where interchange takes
place.
1.2.3 A typical public transport network - even a relatively small one - offers a very large number of locations where it is possible to transfer between services. Each bus stop represents an opportunity to get on or get off a bus, and any location where more than one bus stop are close together provides an opportunity to change buses. However, at the vast majority of such locations, not many passengers use the opportunity to interchange.
1.2.4 Rather, discussion of interchange tends to focus on locations where different public transport modes meet, such as bus services at railway stations, and where volumes of interchanging passengers are greatest. Often, interchange is only acknowledged at railway stations and purpose-built bus stations, and interchange activity at ‘informal’ interchange locations is neglected.
1.2.5 Figure 1.1 illustrates the public transport network in part of the West Midlands conurbation in Great Britain. The largest circles show the locations where the largest numbers of bus-to-bus, bus-to-rail, and rail-to-bus transfers take place. But there are literally thousands of potential interchange locations. Figure 1.1 has been created by Centro using their VIPS Software and includes all public transport routes and number of transfers in Birmingham in the am peak period for 1996.

1111 WhyWhyWhyWhy isisisis InterchangeInterchangeInterchangeInterchange Important?Important?Important?Important?
GUIDE - Urban Interchanges - A Good Practice Guide Page 4
Figure 1.1: VIPS/3 Network and Interchanges with Number of TransfersFigure 1.1: VIPS/3 Network and Interchanges with Number of TransfersFigure 1.1: VIPS/3 Network and Interchanges with Number of TransfersFigure 1.1: VIPS/3 Network and Interchanges with Number of Transfers Birmingham 1996 Am Peak Network run with fares.Birmingham 1996 Am Peak Network run with fares.Birmingham 1996 Am Peak Network run with fares.Birmingham 1996 Am Peak Network run with fares.
1.2.6 While it is easy to identify physical locations where interchange
may take place, it is more difficult to find out how many passengers are making use of these opportunities. Our survey of 20 European cities was able to establish the volume of interchange movements for only 12 of them, and it is apparent that in general very little is known about the volume of interchange taking place in many cities.
1.2.7 However, it is clear that the propensity to interchange varies considerably. Statistics from some cities (for example Munich and London) imply that almost half of all passenger journeys involve at least one change of mode or service. In contrast, in other cities, (for example Manchester and Newcastle) the proportion of interchanging passengers is significantly lower, with less than ten percent of passenger journeys involving an interchange.
1.2.8 The data we gathered does suggest that the cities with the higher propensities to interchange tended to have a significant rail-based (including underground, metro or tram systems) element in their public transport systems. It also seemed that there was some association of higher levels of transfer with higher public transport modal shares. If interchange inevitably adds to journey time, how are these two things compatible?
1.31.31.31.3 Is Interchange a ‘Good Thing’?Is Interchange a ‘Good Thing’?Is Interchange a ‘Good Thing’?Is Interchange a ‘Good Thing’?
1.3.1 Changing between public transport services will almost inevitably add some waiting and walking time to a passenger’s

1111 WhyWhyWhyWhy isisisis InterchangeInterchangeInterchangeInterchange Important?Important?Important?Important?
GUIDE - Urban Interchanges - A Good Practice Guide Page 5
journey, compared with staying on the bus or train. In many cities, in most situations, interchange is also likely to have a number of other disbenefits. So is it a ‘good thing’? Should it be encouraged?
1.3.2 In an ideal world, with an ideal public transport system, the answer is probably not. Ideally, the public transport network would offer fast, direct links from everywhere to everywhere, just as (in theory) the car does. But in practice, public transport works by concentrating passengers onto selected corridors, and inevitably this leaves some journeys without a direct connection. So interchange is a necessary evil when it comes to providing comprehensive linkages within an urban area.
1.3.3 However, there is a range of public transport modes, each of which offers a different combination of characteristics such as speed, capacity, ride quality, ability to penetrate dense urban areas, and cost. It can be highly advantageous to passengers to substitute a fast mode (such as rail) for part of their journey, instead of a slow mode (such as bus). Indeed, only by doing so can public transport consistently offer an acceptable alternative to the private car (see Figure 1.2).
Figure Figure Figure Figure 1111 When is Interchange a Good Thing?When is Interchange a Good Thing?When is Interchange a Good Thing?When is Interchange a Good Thing?
1.3.4 Fast, and hence high capacity modes such as train and metro
can also be advantageous to cities, because they take up less land or can go underground. Consequently, larger cities tend to develop around multi-mode public transport networks, with services provided by a combination of road and rail based modes, including hybrids such as guided bus, streetcars and LRT (Light Rapid Transit).
1.3.5 Cities and their public transport networks grow over many decades. For any mature city, the options for radical change to the overall network structure are limited, at least in the short term. Consequently, the geographical relationship between public transport services (especially between rail lines and
Bus - 45 minutes
Bus - 30
Rail- 15
1
2
3
No interchange - total journey time 45
Assume interchange time
One interchange - total journey time 50
One interchange - total journey time 35

1111 WhyWhyWhyWhy isisisis InterchangeInterchangeInterchangeInterchange Important?Important?Important?Important?
GUIDE - Urban Interchanges - A Good Practice Guide Page 6
principal road corridors) will be relatively fixed. However, the extent of barriers to interchange will significantly affect the efficiency with which the given public transport network serves the public.
1.3.6 The contrast between two paradigms of ‘the seamless journey’ and ‘barriers to interchange’ is set out in Table 1.1 below.
Table Table Table Table 1111....1111 Contrasts between different types of Interchange Contrasts between different types of Interchange Contrasts between different types of Interchange Contrasts between different types of Interchange QualityQualityQualityQuality
The Seamless JourneyThe Seamless JourneyThe Seamless JourneyThe Seamless Journey Barriers to InterchangeBarriers to InterchangeBarriers to InterchangeBarriers to Interchange Comprehensive connectedness - the public transport network offers an ‘anywhere-to-anywhere’ service
The need to interchange is a significant disadvantage for any public transport journey for which there is no direct connection
Full advantage can be taken of journey time savings that are offered by a change to a faster mode
Passengers will stay on slow, direct services and will not interchange onto faster modes
Planners/operators can have maximum flexibility to match demand and supply, and maximise the overall efficiency of the network through appropriate mixing of modes and services
Sub-optimal network solutions are adopted to avoid imposing additional interchange on passengers
1.3.7 The consequence is that reducing barriers to interchange will
enable individual passengers to gain more benefit from the public transport system, and will increase the attractiveness of the public transport ‘offer’ relative to the car.

GUIDE - Urban Interchanges - A Good Practice Guide Page 7
2222 Factors Affecting the Interchange Factors Affecting the Interchange Factors Affecting the Interchange Factors Affecting the Interchange ExperienceExperienceExperienceExperience
2.1.1 The theoretical benefits of improved interchange will seem somewhat abstract to the average passenger confronted with the reality of changing services in many of today’s public transport systems.
2.1.2 The closest experience to a seamless transition from one public transport service to another that many systems offer is the cross-platform interchange:
• = the passenger arrives at station X on, for example Metro line 1, and steps onto the platform;
• = he/she waits on the platform, or perhaps steps across to
the other side to wait; • = the required train arrives, say for Metro Line 2, and the
passenger boards, to continue the journey.
2.1.3 For regular passengers, such as commuters, little more may be required in terms of interchange facilities. But even the simplest cross-platform interchange can represent an unpleasant experience for irregular travellers, unfamiliar with the station, or when services are infrequent or irregular. Critical weaknesses will often be:
• = lack of information; • = poor or non-existent facilities; • = unattractive surroundings; • = concern with personal safety (security).
2.1.4 All these will contribute to a desire not to repeat the
experience. Yet the cross-platform interchange provides the best potential for good interchange, because it stems from a convenient physical relationship between two lines. If ‘connecting services’ are not physically adjacent, the scope for giving passengers a poor experience is very great.
2.1.5 The overall quality of the interchange experience will be dictated by a number of characteristics, some of which are specific to individual locations; others will apply to a number of locations within a network, while some are determined and applied throughout the network.
2.1.6 The physical arrangementsphysical arrangementsphysical arrangementsphysical arrangements will be location-specific, and can be subdivided into:
• = ‘structuralstructuralstructuralstructural’ elements such as the spatial relationships between lines, platforms and roads, the location of open space, and the massing of buildings in, on and around the interchange; in a mature city with an established public transport network these are only likely to be

2222 FactorsFactorsFactorsFactors AffectingAffectingAffectingAffecting thethethethe InterchangeInterchangeInterchangeInterchange ExperienceExperienceExperienceExperience
GUIDE - Urban Interchanges - A Good Practice Guide Page 8
changeable through a large scale strategic project or comprehensive urban remodelling.
• = More ‘cosmetic’cosmetic’cosmetic’cosmetic’ elements such as the detailed layout of
walkways and individual areas, passenger facilities, kerbs and street furniture, architectural treatment (e.g. lighting, cladding), and signage. Clearly, the attractiveness of these cosmetic elements will be constrained by the overall physical layout of the site.
2.1.7 In addition, operational arrangementsoperational arrangementsoperational arrangementsoperational arrangements for individual
interchanges may be as important to the passenger experience as physical arrangements. These include aspects such as:
• = organisation and management of staff (for example, the extent to which the staff of one operator are briefed to answer questions about the services of other operators);
• = staffing levels (for security and information/guidance, as
well as ‘operational’ purposes); • = comprehensiveness of ticket retailing activity (are tickets
for all modes available from all ticket outlets?); • = service scheduling (e.g. timing of connecting services)
and operational control (e.g. co-ordination between services to hold connections and mitigate the effect of service disruption).
2.1.8 However, the organisational context for the way in which
individual interchanges are operated will generally be established at a network widenetwork widenetwork widenetwork wide levellevellevellevel, where the relationship between the different organisations (and parts of organisations) are determined.
2.1.9 By definition, interchange takes place at the boundary between parts of the public transport network. Public transport operations are generally organised on a line-by-line basis: management and staff are focused on moving passengers along the line from where they board to where they alight. What passengers do before they board, and after they alight, is often regarded as nothing to do with the operator.
2.1.10 Moreover, the interface between the public transport system and the surrounding urban area is also of crucial importance, particularly if this is where interchange with buses takes place. Usually this will be controlled by a local authority, and not even a public transport operator. A listing of the possible organisations involved at a major transport interchange is shown in Table 2.1.

2222 FactorsFactorsFactorsFactors AffectingAffectingAffectingAffecting thethethethe InterchangeInterchangeInterchangeInterchange ExperienceExperienceExperienceExperience
GUIDE - Urban Interchanges - A Good Practice Guide Page 9
2.1.11 Consequently, one of our key conclusions is that all the players who influence the passenger’s interchange experience need to be brought together within an institutional structureinstitutional structureinstitutional structureinstitutional structure that can secure a co-ordinated, consistent and integrated approach that is ‘blind’ to organisational boundaries. The structure needs to provide a mechanism for:
• = reducing network-level barriers to interchange, such as through integrated fare systems, and consistent (and comprehensive) signing schemes;
• = establishing consistent standards of interchange facility,
which can then be implemented by programmes of action at individual interchange locations;
• = marketing the public transport network to exploit the
available interchange facilities and so ensure that the public make full use of the connectivity provided by the public transport network.
Table Table Table Table 2222....1111 A Major Interchange A Major Interchange A Major Interchange A Major Interchange ---- Possible Players Possible Players Possible Players Possible Players
OrganisationOrganisationOrganisationOrganisation Principal ObjectivePrincipal ObjectivePrincipal ObjectivePrincipal Objective Impact on Interchange Impact on Interchange Impact on Interchange Impact on Interchange PassengersPassengersPassengersPassengers
Rail operators Longer distance passenger haulage
Entry and/or exit from the Interchange
Bus operators Local collection and distribution of passengers
Entry and/or exit from the Interchange. Bus stops may not be within the ‘formal’ interchange area
Interchange property owner
Maintenance of property in good condition, possibly security
Creates and manages the interchange environment. Even if owned by one of the operators may be a distinct entity
Local authority Planning, development and maintenance of area surrounding the interchange
Creates the urban context for the interchange. Controls quality of pedestrian links in and out of the interchange, especially with regard to links with adjacent bus stops
Police Providing security and maintaining order
May be different organisations within the interchange and outside, with different foci
2.1.12 A fully integrated approach could lead to new ways of
managing larger interchange facilities so as to reflect a ‘passenger’s eye of the world’. For example, airports are

2222 FactorsFactorsFactorsFactors AffectingAffectingAffectingAffecting thethethethe InterchangeInterchangeInterchangeInterchange ExperienceExperienceExperienceExperience
GUIDE - Urban Interchanges - A Good Practice Guide Page 10
commonly managed purely as interchanges, rather than as a location where a number of individual air services happen to terminate.
2.1.13 The ‘airport model’ would suggest that larger interchange locations are managed as a single entity, specifically tasked to maximise the seamlessness of passenger transfers between transport services (as well as access and egress with the surrounding urban area). The role of the operators would be focused on moving passengers in and out. This concept is further developed in Table 2.2.
Table Table Table Table 2222....2222 Urban Interchange and the ‘Airport Model’Urban Interchange and the ‘Airport Model’Urban Interchange and the ‘Airport Model’Urban Interchange and the ‘Airport Model’
AttributeAttributeAttributeAttribute Conventional Urban Conventional Urban Conventional Urban Conventional Urban Interchange Interchange Interchange Interchange OrganisationOrganisationOrganisationOrganisation
The ‘Airport Model’The ‘Airport Model’The ‘Airport Model’The ‘Airport Model’
Ownership of space Transport operators own most of the interchange space, as extensions to what is required for transport operations. Interchange space left on the margins
Interchange space is maximised and is ‘owned’ by the interchange manager, transport space is minimal required by the operators for safe operation
Responsibilities Responsibility for interchange ambiguous, and secondary to transport operations
Interchange manager responsible for looking after passengers in the interchange space; operators only for supervising loading/unloading, despatching etc
2.1.14 A number of the GUIDE Partners are developing institutional
arrangements that reflect some of the principles set out above:
• = within London Transport, a special task force called LINK (London Interchange Network) has been established to lead the co-ordination of efforts to improve inter-modal interchange, involving both rail and bus operations, and interacting with local authorities, the National Rail Network infrastructure provider and Train Operating Companies;
• = in Paris, RATP and SNCF have established Site
Committees at some of the larger interchange locations

2222 FactorsFactorsFactorsFactors AffectingAffectingAffectingAffecting thethethethe InterchangeInterchangeInterchangeInterchange ExperienceExperienceExperienceExperience
GUIDE - Urban Interchanges - A Good Practice Guide Page 11
(e.g. Gare du Nord, La Défence) to co-ordinate and integrate the development of facilities and improve day-to-day liaison between the different operating entities;
• = in Manchester, the Quality Partnership arrangements that
are being developed between Greater Manchester Passenger Transport Executive, the local authorities, and the bus operators will be specifically tasked to improve interchange.
2.1.15 It is clear that improvement of the passenger’s interchange
experience requires action at an organisational and network level, as well as at individual interchange locations. The next question is how can practical programmes of improvement be identified?

GUIDE - Urban Interchanges - A Good Practice Guide Page 12
3333 Improving InterchangesImproving InterchangesImproving InterchangesImproving Interchanges
3.13.13.13.1 StrategiesStrategiesStrategiesStrategies for Improving Urban Interchange Locations for Improving Urban Interchange Locations for Improving Urban Interchange Locations for Improving Urban Interchange Locations
3.1.1 Of the different aspects of interchange, location-specific barriers to interchange are the most researched, since they are most tangible and also the most obvious. However, one of the major problems in applying the results from this research is the multiplicity of possible interchange locations that exist in any medium to large public transport network. A process is needed to determine priorities, and to help identify what will be most effective.
3.1.2 The key requirement would seem to be the identification of a strategic public transport networkstrategic public transport networkstrategic public transport networkstrategic public transport network, or a hierarchy of services, that enable some interchange locations to be identified as more important than others. Determining the shape of such a strategic network is one of the main reasons why an institutional structure able to look at the public transport system as a whole is required. Apart from an ability to take an objective view of the future role of, for example, different modes, the structure must also facilitate the implementation of change in many different areas and of different types.
3.1.3 In a multi-mode network, the higher capacity, rail-based modes can often form the starting point for defining the strategic network. But it will rarely be the case that this is sufficient in itself. In particular, key nodes which can act as feeder/distributor points for the high capacity modes will need to be identified, and roles of other elements of what will often be the bus network will need to be established.
3.1.4 Some bus routes may represent strategic links in their own right (for example, to provide orbital connections to complement a radically-oriented rail network); others may be explicit feeder services, with the interchange locations key traffic objectives; others may predominately have a local role in which the connections with the strategic network are peripheral.
3.1.5 Given the identification of a strategic network, the function of function of function of function of individual interchange locationsindividual interchange locationsindividual interchange locationsindividual interchange locations can be established. Then, for any one location, the importance of individual interchange movements can be prioritised. Just as a network provides thousand of interchange opportunities, an individual interchange location will often provide the potential for hundred of combinations of services to be linked up. Again, effective improvement for the greatest number of passengers requires a prioritisation - which of these movements are most important? In general, one would expect that interchange between strategic links would be most important, followed by feeder/distributor links to the strategic network, and finally other local linkages.

3333 ImprovingImprovingImprovingImproving InterchangesInterchangesInterchangesInterchanges
GUIDE - Urban Interchanges - A Good Practice Guide Page 13
3.1.6 A structure for codifying individual interchanges allows a standardsstandardsstandardsstandards----based approachbased approachbased approachbased approach to be used for auditing the quality of existing arrangements and identifying gaps in facilities. A number of operators in different countries have established their own interchange standards, but not surprisingly these tend to be concerned with those things that are under the control of the individual operators (e.g. see London Underground 1998 Station Planning Standards and Guidelines). Because they stop at the organisational boundary, almost by definition they only apply to part of the picture.
3.1.7 Typical elements of standards include:
• = accessibility; • = security and ambience; • = travel-related facilities; • = non-travel related facilities (such as shops); • = comfort.
3.1.8 Table 3.1 gives an example from the United Kingdom which illustrates the content and structure of some of the standards documents that are available.
Table Table Table Table 3333....1111 Established Standards DocumentsEstablished Standards DocumentsEstablished Standards DocumentsEstablished Standards Documents
RailtrackRailtrackRailtrackRailtrack1111 (UK) (UK) (UK) (UK) Interchange Categories National hub stations;
regional hub stations; important feeder stations; medium staffed stations; small staffed stations; small unstaffed stations
Main Headings Information provision Security Waiting rooms/shelters Platforms Integrated transport Customer facilities Footbridges and subways Disabled access
3.1.9 If applied systematically, the standards provide consistency
across the network and should ‘set reasonable expectations’ for infrequent users about what to expect if they are making an unusual journey. They can be incorporated into an overall diagnosis and audit processdiagnosis and audit processdiagnosis and audit processdiagnosis and audit process to:
• = identify the most important locations;
1 Developing Modern facilities at Stations - Consultation Report, Railtrack, November 1998. See references at the end of this document, (it can also be found in the GUIDE Literature Listing under the number [355])

3333 ImprovingImprovingImprovingImproving InterchangesInterchangesInterchangesInterchanges
GUIDE - Urban Interchanges - A Good Practice Guide Page 14
• = establish gaps between reality and standards; • = evaluate alternative spending plans; • = monitor effectiveness of actions; • = update standards to reflect changing expectations.
3.1.10 The definition of a strategic network, the establishment of standards, the application of diagnosis procedures, and implementation of the measures that are identified will secure the systematic improvement of individual interchange locations.
3.23.23.23.2 Reducing NetworkReducing NetworkReducing NetworkReducing Network----Wide Barriers to InterchangeWide Barriers to InterchangeWide Barriers to InterchangeWide Barriers to Interchange
3.2.1 The reduction of location-specific barriers to interchange will not in themselves generate overall benefits unless network-wide barriers to interchange are also removed. These are predominantly concerned with fare systems and passenger information.
3.2.2 The fare systemfare systemfare systemfare system influences how individual passengers making a specific journey choose from the large number of alternative paths provided by the public transport network. Even if physical barriers to interchange have been eliminated, the fare system itself may present an additional barrier to interchange, if changing vehicles means that the passenger has to pay more than if he/she is making a direct journey.
3.2.3 Most fare systems relate the fare that passengers have to pay to the distance travelled. Especially with ‘pay-as-you-go’ systems, such as cash fares on buses, the fare is not entirely proportional to distance - there is a minimum fare that must be paid, even if the passenger is only travelling a few metres. Consequently, the two cash fares for a journey involving a change of buses may be substantially more expensive than one of an equivalent distance, but direct. This is illustrated in Figure 3.1, which shows how the fare scale is made up from a boarding penalty plus a distance-related element. The interchange passenger may have to pay for two boarding two boarding two boarding two boarding penaltiespenaltiespenaltiespenalties rather than the one of the direct journey passenger. The solution is an Integrated Ticketing SystemIntegrated Ticketing SystemIntegrated Ticketing SystemIntegrated Ticketing System.
Figure 3.1Figure 3.1Figure 3.1Figure 3.1 Fare Scale and InterchangesFare Scale and InterchangesFare Scale and InterchangesFare Scale and Interchanges
Fare
Distance
Boarding
Fare for direct journey
Additional fare for interchange
Direct journey fare scale

3333 ImprovingImprovingImprovingImproving InterchangesInterchangesInterchangesInterchanges
GUIDE - Urban Interchanges - A Good Practice Guide Page 15

3333 ImprovingImprovingImprovingImproving InterchangesInterchangesInterchangesInterchanges
GUIDE - Urban Interchanges - A Good Practice Guide Page 16
3.2.4 The proportion of passengers paying fares which penalise interchange varies from city to city. Most cities have fare systems which include travelcards or passes which do not penalise interchange, but the proportions using them vary. For other passengers, the existence of fare penalties to interchange will inhibit the use of paths through the network that involve one or more interchange, and could result in significantly slower and poorer quality public transport journeys as a consequence.
3.2.5 The quality, and the general approach to passenger passenger passenger passenger informationinformationinformationinformation is other network-level inhibitor of interchange. High quality information during the course of the journey (for example, through good signing and availability of real-time information) is obviously a key factor in smoothing the way for interchanging passengers at specific locations. But the way in which the network as a whole is presented to the public will also significantly affect the effectiveness of the network.
3.2.6 At the extreme, if passengers are not told about interchange opportunities, they will not plan their journeys to make use of them. More subtly, the way in which the public transport network is promoted to the public, and the role set out for interchange within the network, will have a profound influence on how passengers use the system.
3.2.7 For example, the intersection of two metro lines on a network map is usually interpreted by the public as an interchange possibility. But depending upon how it is presented, it could be projected as a location where interchange activity is encouraged, with good facilities, or a location where interchange is not recommended (perhaps because distances between lines are too great, or simply because facilities are poor or non-existent). The promotion of the networkpromotion of the networkpromotion of the networkpromotion of the network can thus highlight or alternatively downplay, the scope for interchange at particular locations, and hence guide passengers as to where physical barriers to interchange are least.
3.2.8 The way in which the network is promoted - through network maps, or through advice offered by staff or through telephone inquiry centres - provides a valuable application for interchange standards, because they provide a means of establishing and managing passenger expectations. By steering passengers towards interchange locations where a good standard has been achieved, public confidence will be enhanced, and passengers will be encouraged to widen the range of journeys that they make using the public transport system.

3333 ImprovingImprovingImprovingImproving InterchangesInterchangesInterchangesInterchanges
GUIDE - Urban Interchanges - A Good Practice Guide Page 17
3.33.33.33.3 Benefits from Improving InterchangeBenefits from Improving InterchangeBenefits from Improving InterchangeBenefits from Improving Interchange
3.3.1 There is no doubt that improvement to the quality of public transport interchange will benefit passengers. However, it is quite difficult to quantify and evaluate the benefits.
3.3.2 A significant volume of research has been carried out on the evaluation of individual improvements to specific aspects of individual locations. Some of the research has sought to establish the willingness of passengers to pay for particular features (unfortunately the results are commercial in confidence).
3.3.3 The results of this research can be incorporated into formal cost-benefit analysis of proposals for change. However, many aspects of interchange that seem to be important to passengers are difficult to quantify, and individually may be quite marginal in effect. On the other hand, improvements to interchange quality will often benefit all passengers, not just those that are interchanging.
3.3.4 Most of the footfall through most interchanges comes from passengers accessing the public transport network rather than interchanging between public transport services. Interchanges at all levels (from international rail terminals down to individual bus stops) provide a ‘shop window’ for the public transport network, and a high quality image projected by high quality facilities will be reflected in public perceptions of public transport system.
3.3.5 However, the implications of widespread improvement in the quality of interchange can be explored using computer-based models of the public transport network. These simulate how individual passengers choose to use the public transport network, and calculate the time and cost of alternative paths through the network before choosing the best.
3.3.6 Such models explicitly include the additional journey time of interchange, such as additional walking and waiting time (and fare, if appropriate). But in addition, they also tend to include a factor, known as the Interchange Penalty, which attempts to reproduce all the unquantified negative aspects of interchange, such as additional uncertainty, poor waiting conditions, poor sense of security, etc. Typical values of the Interchange Penalty are in the range 5 to 10 minutes of in-vehicle time (in other words, passengers would prefer to spend an extra 5 to 10 minutes time travelling on the bus or train rather than interchange). Such values of interchange penalty have been used in modelling major urban PT systems in the UK, France, Greece, etc and differ slightly between countries depending on interchange quality.

3333 ImprovingImprovingImprovingImproving InterchangesInterchangesInterchangesInterchanges
GUIDE - Urban Interchanges - A Good Practice Guide Page 18
3.3.7 Setting the value of the Interchange Penalty to zero provides a way of simulating the effect of creating seamless interchange everywhere on the network - it implies that a passenger would be indifferent between a travel path that was direct and one that involved an interchange, if both had identical journey times. This is probably not a realistic ambition, but provides a way of assessing the maximum possible benefit that could be generated from improvement to interchange.
3.3.8 Tests carried out by Centro have shown that in the West Midlands (UK), barriers to interchange (fare, walk, wait, interchange penalties) impose substantial costs on the travelling public. If the barriers were removed, then significant benefits would be generated, thus justifying investment to remove these barriers.
3.3.9 Changes in overall journey time come about because passengers switch from longer, direct (i.e. no-interchange) journeys to shorter journeys that make use of one or more interchanges. The Centro model of West Midlands suggests that almost half the direct trips made when there are both fares penalties and other interchange barriers would be made via an interchange if these barriers were removed.
3.3.10 The output from the model, highlighted in the Network Strategy Case Study (See Guide 1998, D4: Report on Case Studies) demonstrates that rerouting of passengers does occur (when fare and other penalties/barriers are removed), with transfers previously taking place in the City Centre moving out to make use of orbital connections. This reduces congestion on core radial routes and enables passengers to reduce journey time and distance. It also encourages better use of the high capacity radial rail routes, by allowing buses to act in a more effective feeder capacity.
3.3.11 The impact on overall journey times revealed by the Centro tests are summarised in Table 3.2 below.
Table Table Table Table 3333....2222 Effect of Removing Barriers to InterchangeEffect of Removing Barriers to InterchangeEffect of Removing Barriers to InterchangeEffect of Removing Barriers to Interchange
AM Peak AM Peak AM Peak AM Peak ---- change in change in change in change in
average Journey average Journey average Journey average Journey TimeTimeTimeTime
Off Peak Off Peak Off Peak Off Peak ---- change in change in change in change in
average Journey average Journey average Journey average Journey TimeTimeTimeTime
Equivalent Equivalent Equivalent Equivalent Annual ValueAnnual ValueAnnual ValueAnnual Value2222
If Fares barriers remain
-0.5% -0.6% 1.2 million hours
If Fares barriers are removed
-1.6% -2.0% 3.8 million hours
2 Assuming approximate annualisation ratios in order to transform from AM peak and off-peak hours to whole year

3333 ImprovingImprovingImprovingImproving InterchangesInterchangesInterchangesInterchanges
GUIDE - Urban Interchanges - A Good Practice Guide Page 19
3.3.12 The effectiveness of removing physical barriers is much less if fares barriers continue to dissuade passengers from making use of otherwise advantageous routes involving interchange. In percentage terms, the reductions in journey times brought about by eliminating physical barriers are small, but these are spread over a very large number of travellers, many of whom would not directly benefit. Nevertheless, in aggregate, substantial journey time savings are made, that would be valued at millions of £s even for the subset of the West Midlands conurbation represented in the model.
3.3.13 These calculations need to be treated with caution, since they depend upon a large number of assumptions and hypotheses. But they support the proposition that reductions in barriers to interchange would increase the overall attractiveness of the public transport network quality, and would significantly improve the quality of public transport journeys that have to or could be made by transferring between services.
3.3.14 In summary the key benefits from the systematic improvements of interchange are:
• = reductions in disutility from reducing unpleasantness of individual interchange experiences (existing users) (Sections 3.1 and 3.3);
• = reduced journey times from rerouting where previously
interchanges discouraged use (Sections 3.2 and 3.3); • = fulfilling a necessary condition to make possible an
increase in public transport mode share, especially where it is traditionally least competitive such as for orbital movements (Section 3.3);
• = reduced pressure on crowded radial sections (Section 3.3,
3.3.9,10 and 11); • = increased flexibility for operators and planners to offer a
mix of public transport modes to suit local circumstances (Section 3.3).
3.3.15 The remainder of this report is intended to help practitioners
achieve these benefits.

GUIDE - Urban Interchanges - A Good Practice Guide Page 20
Part 2Part 2Part 2Part 2 Guide to Current PracticeGuide to Current PracticeGuide to Current PracticeGuide to Current Practice Part 2 describes the study process that was carried out for the GUIDE project and summarises the main outputs from three different packages (WPs) of the work programme. These are:
• = Literature Review (WP2); • = Surveys of Current Practice (WP3); and • = Case Studies (WP4).
The common objectives of all three work packages were to review the current state of the art and practice in the development and evaluation of urban passenger interchanges and identify examples of good and bad practice. Therefore, Part 2 provides a guide to existing practice. Only a summary of the main findings from the three work packages is presented in this Part. However, insights from findings are enhanced and additional arguments are presented with emphasis on good and bad practice. Where appropriate references are made to the original material as well as to the deliverables of D2, D3 and D4 which include more complete coverage of the subjects. Part 2 will be of most interest to professionals and researchers seeking detailed information about the current ‘state of the art and practice’ and sources of further information. The following Chapter introduces the Literature Review which was the first substantive task of the GUIDE project. It followed Work Package 1: Inception Phase, during which the management planning of the project was carried out. Work Package 2: Literature Review culminated in the first major Deliverable (D2) of the project. D2 assembled over 500 references on the subject of interchanges and provided a brief but detailed review of about 80 references as well as an overview of the literature as a whole which assessed the main gaps in research. A number appearing in square brackets next to a reference in this document provides the key for locating the particular reference in the GUIDE Literature Listing included in D2. However, this final report is self-standing and all the references actually being used have also been assembled at the end of the document. The findings of the Literature Review influenced the research carried out under the Surveys of Current Practice and the selection of Case Studies. The findings and conclusions of these two work packages are also summarised in Part 2 with main emphasis on identifying examples of existing good and bad practice.

GUIDE - Urban Interchanges - A Good Practice Guide Page 21
4444 The LiteratureThe LiteratureThe LiteratureThe Literature
4.14.14.14.1 Objectives of the Literature ReviewObjectives of the Literature ReviewObjectives of the Literature ReviewObjectives of the Literature Review
4.1.1 The main objective of the Literature Review was to establish an annotated bibliography of research and other documentation on interchange research, development and evaluation in European countries. In addition, the work developed a conceptual structure for considering urban interchange issues, and the beginning of a common vocabulary.
4.1.2 Interchange facilities, and the interchange activity by travellers, are not topics that are well-conceptualised, and there is no tradition of treating them as distinct topics for research. Consequently it was not the intention to carry out classical bibliography research, and we make no claims for completeness or comprehensive coverage. Rather, our approach has been to exploit the established knowledge of the various practitioners within the Group (which consists of major public transport operators, planning authorities, research institutions and consultants) to identify a cross-section of available material of relevance to the interests of the Group. This has included a wide variety of material that has not been formally published, although the majority of references are in the public domain and hence in principle they are available to third parties.
4.1.3 The main tasks of the literature review were:
• = development of a conceptual structure to help classification of references;
• = identification of references by Partners, with broad
assessment of the key characteristics of each reference; over 500 such references have been identified;
• = detailed review of selected references that were felt to be
of greatest relevance to the main areas of interest of the Partners; there are about 80 of these detailed reviews;
• = analysis and overview of the literature as a whole,
primarily to assess the main gaps in research, and to help identify topics for further investigation in subsequent phases of the GUIDE project;
• = as a distinct sub-task, review studies of interchange
carried out by European, national or professional organisations.
• = assembling all reference material (including publishers’
details) using Microsoft Excel software to provide an easily accessible reference source (GUIDE Literature Listing);

4444 TheTheTheThe LiteratureLiteratureLiteratureLiterature
GUIDE - Urban Interchanges - A Good Practice Guide Page 22
4.1.4 The following paragraphs describe briefly the main findings of the literature review concentrating on the aspects that summarise issues of the state of the art and practice. A more detailed account of the work carried out can be found in the work-package deliverable (Guide D2: Literature Review). The same document also contains a full list and detailed information on all references and publications assembled in the course of the work including the ones referred to in this report which are summarised in the References Section.
4.24.24.24.2 Conceptual FrameworkConceptual FrameworkConceptual FrameworkConceptual Framework
4.2.1 One of the main obstacles to improvement in the state of the art in urban interchange is lack of a coherent, well-structured framework within which different aspects of interchange can be related to each other. It was essential to create such a framework to provide a structure for the bibliography, before references were collected, to ensure that they were categorised and analysed consistently.
4.2.2 The framework reflects the different perceptions arising from the diversity of the Partners’ interests, as well as contrasting national and regional perspectives.
4.2.3 Institutional arrangements for public transport vary from totally privatised and deregulated to totally state owned and publicly controlled. The range of possible topics that could be addressed by GUIDE is equally diverse. At one extreme are topics concerned with specific issues of individual interchange design, such as architectural treatment of interiors; at the other extreme are general topics such as the role of interchange in the public transport network.
4.2.4 Given the variety of background the project has had to be steered on the principle of reflecting the particular interests of individual Partners.
4.2.5 The conceptual structure was built around four main topics, within each of which a number of second level (or sub) topics were identified. The four main topics were as follows:
• = locationlocationlocationlocation----specificspecificspecificspecific, concerned with specific aspects of individual interchanges, with sub-topics such as accessibility, design, facilities, safety, security, etc;
• = organisationorganisationorganisationorganisation relating to organisation and operation of
individual interchanges (but which are also likely to be common features across a number of interchanges within a particular public transport system); examples of sub-topics include management structures, ownership and staffing;

4444 TheTheTheThe LiteratureLiteratureLiteratureLiterature
GUIDE - Urban Interchanges - A Good Practice Guide Page 23
• = strategystrategystrategystrategy concerned with the function of interchange within a public transport network, with sub-topics including fares and ticketing, passenger propensity to interchange, impacts on modal split and the contribution of interchange to network efficiency;
• = evaluationevaluationevaluationevaluation concerned with passenger attitudes to
interchange facilities, techniques for optimising interchange design, and appraisal methodology.
4.34.34.34.3 The Gaps in LiteratureThe Gaps in LiteratureThe Gaps in LiteratureThe Gaps in Literature
4.3.1 In general, the vast majority of references were found to be related to location-specific topics. This is not surprising since individual interchanges are the most tangible aspect of the interchange concept. At the same time location-specific topics cover the most common aspects of the design and construction of interchanges which are necessary even in occasions when little attention is paid to planning and evaluation.
4.3.2 In contrast, it was highlighted that the other three main topics (organisation, strategy and evaluation) were not well represented in the literature.
4.3.3 In particular, the following sub-topics were identified as requiring further analysis and recommended for future research projects:
• = effects of ticketing on interchange; • = changing staff culture and emerging jobs at interchanges
; • = effects of information (real time and conventional) on
interchange; • = evidence of impacts of interchange on mode split; • = access to transport interfaces for people with special
needs (e.g. reading and linguistic problems).
4.3.4 It also emerged that the following areas are not well researched with obvious gaps in existing literature (available in the public domain) and that they will be worthwhile subjects for future research:
• = passengers’ attitudes and behaviour and how they change;
• = strategic assessment of interchanges and criteria for optimisation;
• = operations and staffing; efficiency for staff and/or passengers;
• = relationships between organisations at interchanges; • = private and public partnerships in developing
interchanges;

4444 TheTheTheThe LiteratureLiteratureLiteratureLiterature
GUIDE - Urban Interchanges - A Good Practice Guide Page 24
• = interchange in transport modelling: interchange penalties and other aspects of the generalised cost function used in modelling.
4.3.5 It was decided to address some of the above issues by means
of WP3 and WP4. For example, Work Package 3 (Surveys of Current Practice) addressed some of the gaps by investigating the specific issues of organisation and modelling interchange penalties. In addition, Work Package 4 (Case Studies) was enhanced to include particular case studies on topics such as network strategy, attitudes and behaviour, etc (see later Chapters).
4.44.44.44.4 Other FindingsOther FindingsOther FindingsOther Findings
4.4.1 The literature review identified a small number of projects sponsored by the EC and by DG7, DG13 and DG16 in particular. Amongst the more relevant ones to this project was the Public Transport Interchanges Network, 1992 ([415b] GUIDE Literature Listing number) also sponsored by UITP. The objectives of this programme were to collect (by means of a questionnaire survey of public transport operators) and disseminate information about interchanges to authorities, operators and research establishments throughout Europe. It was organised into three major areas relating to public transport interchanges:
• = location; • = functional design; and • = operation and management.
4.4.2 This study was probably the first to emphasise the importance of passenger interchanges at a European level and as part of an international transport network. It extended the definition of interchanges to include multi-functional transport, information, shopping and working centres in or close to the urban/industrial areas and constituting important instruments in local, regional and national policies.
4.4.3 The final report recognised that there is nothing like ‘the best solution’ but every situation has to be studied in its own special context. Nevertheless, Public Transport Interchanges provided up-to-date (at that time, 1992) information to a network of organisations and an impulse for further European research. Note that GUIDE (within WP3) carried out a more extended survey of interchanges across Europe, but with essentially similar objectives of creating an inventory of facilities for analysing good and bad practice.
4.4.4 Despite the fact that over 500 references were assembled, the literature review identified that the evidence on issues of development and evaluation of passenger interchanges and in particular on the GUIDE topics and sub-topics is rather

4444 TheTheTheThe LiteratureLiteratureLiteratureLiterature
GUIDE - Urban Interchanges - A Good Practice Guide Page 25
sporadic. A possible exception relates to some sub-topics within the location main topic which are discussed in the following paragraphs.
Standards 4.4.5 For example, design, architectural, ergonomics and health and
safety guidelines and standards have been given somewhat comprehensive coverage. This usually has been prepared for and in some cases delivered by major public transport operators (e.g. London Transport (LT) ‘Station Planning Standards Guidelines’ (1998) [236] and ‘Bus Infrastructure’ (1997) [217]), government (e.g. Handbook from the German Bundesministerium für Verkehr (1997) [247d]) and statutory organisations (e.g. see Health and Safety Executive of HM Railway Inspectorate (UK) on ‘Railway and Safety Principles and Guidance’ (1996) [247g]).
4.4.6 Other sub-topics with some coverage in the literature include information and signage (see LT’s ‘Customers’ Information Strategy’ (1993), ‘Design Guidance on Bus Station Signage’ (1997) [216], ‘Passenger Access Terminal’ (1998) [235], and ‘Interchange Signing Standards’ (1998) [237], Handbook from the German Bundesministerium für Gesundheit (1996) [247e] and NS Stations ‘Wegwijs op het station’ (1997) [223]). However, it also appears that there are gaps in our knowledge on the topic of information especially with respect to its effects (conventional or high technology) on interchanging and how much users and non-users value it. In addition, the literature identified the difficulties in developing a coordinated information strategy when more than one operator and mode are involved.
4.4.7 The above publications contain comprehensive material and advice dealing with some aspects of the location main topic. Note however that, despite the inclusion of the word ‘standards’ in their titles, their conclusions and recommendations should not be considered as cookbook rules (or mandatory standards) for the development and construction of interchanges. They rather are ‘guidelines’ and their application strongly depends on local aspects and circumstances. Their transferability across countries, even cities and individual interchanges is sometimes problematic. However, they do provide ample advice in addition to discussing basic principles and giving examples of established good practice.
Accessibility 4.4.8 Accessibility is a very important sub-topic (recognised by the
EC see Cost 335) within the location main topic and includes a number of distinct aspects. It is used to describe the physical

4444 TheTheTheThe LiteratureLiteratureLiteratureLiterature
GUIDE - Urban Interchanges - A Good Practice Guide Page 26
attributes of an interchange (such as walking distances, staircases, other special characteristics but also information, etc) which affect access to public transport. Under this definition accessibility for people with special needs is also considered.
4.4.9 At the same time other references use the term accessibility as a measure of the performance of the public transport system (thus an interchange is a major handicap for public transport). In addition, if we move from the transport planner’s to the urban planner’s point of view then a network based accessibility is extended to a land-use and an activity based concept.
4.4.10 Four different aspects of accessibility were discussed in the literature:
• = accessibility for people with special needs; • = accessibility between modes; • = accessibility between the terminal and its environs; and • = evaluation of accessibility improvements.
4.4.11 The first item, accessibility for people with special needs appears very important in the literature. Some people may find interchanging particularly difficult or impossible because:
• = they have a physical disability which makes it difficult for them to negotiate the passenger terminal, this may be permanent, or temporary for example, they are carrying heavy luggage; or
• = they have a sensory impairment or learning difficulty
which makes it difficult for them to use visual or audio information.
4.4.12 The literature indicates that the estimation of the proportion of passengers experiencing a mobility problem within a city is problematic. D2 gives some evidence derived from a number of UK studies which appears to vary from location to location (for example in London figures between 15% and 40% were quoted). Unfortunately, estimates from other British and European studies were not available for comparison.
4.4.13 Two different approaches to designing interchange facilities for people with special needs were identified:
• = detailed standards which are published separately from the operators planning guidelines, for example in the UK, ‘Meeting the Needs of Disabled Passengers’ Office of the Rail Regulator (1994) [129], and the DPTAC ‘Code of Good Practice’ (1994) [245] which contains legibility standards for visually impaired passengers;
4444 TheTheTheThe LiteratureLiteratureLiteratureLiterature
GUIDE - Urban Interchanges - A Good Practice Guide Page 27
• = the Dutch Railway approach (see ‘NS Norm Accessibility’ (1997) [226]) which requires that stations are accessible to passengers with impaired mobility as an integral element of their design, and the needs of passengers with impaired mobility are not treated separately from other passengers.
4.4.14 With regards to accessibility between modes, station audits are
a popular technique. This technique requires the interchange to be broken down to its constituent parts (‘deconstructed’) and to measure the performance of these parts against ‘minimum’, ‘desired’ and ‘ideal’ standards. It is stressed that these standards do not simply relate to the physical dimensions of the interchange, for example, a study in London (‘Bus Rail Interchange’ Maunsell (1997) [222]) defined:
• = separation standardsseparation standardsseparation standardsseparation standards which relate to the ease of access between the station platform and bus stop;
• = information staninformation staninformation staninformation standardsdardsdardsdards which require that information is
available at each decision point; and • = infrastructure standardsinfrastructure standardsinfrastructure standardsinfrastructure standards which include features such as
personal security and lighting.
4.4.15 On the third aspect of accessibility, the literature indicates that relatively little attention has been paid to the relationship between the interchange terminal and its environs.
4.4.16 It is believed that improving the accessibility of interchanges will result in increased benefits and usage of the public transport system. The literature identified economic benefits such as increased revenue for operators, passenger time savings and broader social benefits such as less reliance on home based services for people with disabilities and improved comfort for passengers. It appears from the literature that little attention has been paid to the quantification of social benefits, although attempts have been made to derive monetary and temporal values (see ‘The Effects of Lift Access on the London Underground’ (1995) [424]).
4.4.17 In general, the following methodologies have been used to examine this topic (also used for more general evaluation of interchanges):
• = passenger surveys - revealed, attitudinal and stated preference;
• = passenger terminal audits and environ audits; • = pedestrian modelling.
4.4.18 It is very difficult to prove that special measures that improve interchange accessibility increase public transport use (and

4444 TheTheTheThe LiteratureLiteratureLiteratureLiterature
GUIDE - Urban Interchanges - A Good Practice Guide Page 28
revenue) because it is difficult to isolate their impacts (on trip generation or mode split) from other factors. However, there is evidence about preferences. For example (see ‘Low Floor Bus Study’, GMPTE 1997 [402b]), research shows clear preference by users to opt for low floor buses when both alternatives are offered and a particularly strong desire by those carrying luggage, with children, etc, to opt for low floor buses.
Security 4.4.19 Security and safety at interchanges are also major topics for
both passengers and operators. There is some confusion of terminology between the two issues (especially in translations from one language to another). By safety, we mean the freedom from unacceptable risks of personal harm, i.e. avoidance of accidents and incidents. We also mean protection for the passenger from the physical dangers of proximity to public transport operation, through measures such as separation of the public from machinery, management of pedestrian flows to avoid overcrowding or conflicting movements, and well established emergency and evacuation procedures. As mentioned earlier safety is a very important issue for all operators and authorities and well developed standards and guidelines exist within European countries (e.g. see Health and Safety Executive publications in the UK, mentioned above).
4.4.20 On the other hand, security tends to be used in the sense of protection from external threats from crime and harassment through video surveillance (CCTV), security staffing (or police) or simple (but not always less expensive) clear lines of visibility.
4.4.21 There are tools and standards of design that can improve the sense of security. Guidelines have been developed by a number of operators or consultants covering most of the material aspects. Attitudes surveys show that security is (together with information) a priority for the passengers (see Guide D2 for references). It is probably necessary to distinguish between real insecurity and the feeling of insecurity. From a statistical point of view, public transport is no less secure than any other public urban space. However, the typical characteristics of interchanges (e.g. waiting, underground stations, crowding, the socio-economic mix of users) tend to increase a feeling of insecurity.
4.4.22 Overall, insecurity (whether real or felt) is a real problem at interchanges and is paid a lot of attention in all modern guidance for building and developing interchanges and in consultations with the public (e.g. see RAILTRACK’s ‘Developing Modern Facilities at Stations’ (1998) [355]).

4444 TheTheTheThe LiteratureLiteratureLiteratureLiterature
GUIDE - Urban Interchanges - A Good Practice Guide Page 29
Organisation 4.4.23 Much less can be said about the references related to the other
three main topics (organisation, strategy and evaluation). In particular, organisation is a major issue with regard to urban interchange. However there is very little in the literature about "how to organise and manage" interchanges. On the other hand some of the sub-topics (e.g. management) appear in the bibliography, in particular with regard to the difficulty of securing coordination between players.
4.4.24 We found very little in our bibliography about local management of stations (how staff are organised, procedures, duties, etc.) except with regard to emergency situations management. However the presence of staff and their competence are highlighted as essential in all interchange audits, especially the contribution that staff can make to information, security issues and customer care.
4.4.25 Studies of the ownership of interchanges and the relationships between organisations (operators, authorities and other players) very rarely appear in the bibliography. However, coordination of the different players is a major issue, both at large and small interchanges. Even at small interchanges, it is common to have several operators and authorities involved. This can be a problem because of fragmentation of responsibility which can be perceived as a potential barrier to achieving improvements.
Strategy 4.4.26 A number of references were identified on the main topic of
strategy. However, it is very difficult to draw any concrete lessons because they were scattered across sub-topics and countries. In addition, very little is published on theoretical issues on interchange. Some discussion can be found in two very recent (both published after completion of GUIDE’s WP2) British publications (CIT Report on Passenger Interchanges 1998 [354]) and ‘Transport Interchange Best Practice’ report to DETR by Colin Buchanan and Partners 1998 [352]).
4.4.27 It is rather surprising that there is little clear evidence even about issues such as fares and ticketing and their effects on interchange. Although their significant effects are widely acknowledged, there is little quantitative evidence about their impacts on interchanging.
Evaluation 4.4.28 On evaluation issues a number of references have been
identified dealing with techniques and methodologies. Among them was another major EC programme reported in 1995 under the title: “APAS: Cost Benefit and Multi-Criteria Analysis
4444 ThThThTheeee LiteratureLiteratureLiteratureLiterature
GUIDE - Urban Interchanges - A Good Practice Guide Page 30
for New Infrastructure in the Field of Nodal Centres for Passengers”. This study focused on passenger nodes relevant to European level transport networks, i.e. at inter-continental, trans-European and regional level, though some elements lower down the ‘interchange hierarchy’ were also considered. Urban interchange of the sort that is the focus of GUIDE was explicitly notnotnotnot considered.
4.4.29 However, the above study provides a good starting point (for GUIDE and other interested parties) on issues of interchange investment assessment and in particular on such techniques as cost benefit analysis and multi-criteria assessment. Note that the subject of evaluation was included in the GUIDE topic case studies (See Guide D4 – Report on Case Studies).
4.4.30 Within the evaluation main topic, a growing corpus of literature is devoted to techniques for measuring interchange users (and non-users) attitudes and behaviour (market research and computer modelling). They also greatly gain from the research and application of similar techniques in the field of transport in general. However, there are differences and gaps in the research and application of these techniques between European countries. In addition, although a number of references document methodology, very little is in the public domain about results and how they have influenced (or guided) policy and action.
4.4.31 In addition, and relating to the main topic of evaluation, very little is published on the issues of funding in general and the modern trends of public private partnerships. These and other gaps were mentioned above and led to the development of special (topic) case studies within GUIDE.

GUIDE - Urban Interchanges - A Good Practice Guide Page 31
5555 Surveys of Current PracticeSurveys of Current PracticeSurveys of Current PracticeSurveys of Current Practice
5.15.15.15.1 Objectives and MethodologyObjectives and MethodologyObjectives and MethodologyObjectives and Methodology
5.1.1 The overall objective of the Survey of Current Practice was to identify the current state of practice across Europe in the development and evaluation of passenger interchanges. The aim was to collate information on network, operational, physical and institutional characteristics of passenger interchanges by directly approaching public transport operators and authorities in different cities across Europe.
5.1.2 We did not attempt to carry out a comprehensive census of interchange locations or the volume of interchange travel, but rather to concentrate on a representative number of locations and build upon existing knowledge and readily available data. At first, a list of representative cities was established together with possible contacts in those cities. Our approach was to concentrate on a small number of locations for which we could extract good quality data in reasonable time.
5.1.3 The results of the Surveys of Current Practice were reported in deliverable Guide D3, Volume 1. This was accompanied by an extensive Appendix documenting the whole survey and including the bulk of the information gathered. Note that D3 also reported on the Surveys of Passengers’ Perceptions (Volume 2) which were carried out within WP3. This subject is addressed in this report within the Case Studies.
Survey SampleSurvey SampleSurvey SampleSurvey Sample 5.1.4 The survey was administered through a network of individual
officers, managers and planners, identified by Group members as either being able to supply the required information directly, or as being in a position of authority to ensure that the information is collated (subject to its availability). We targeted contact persons who were able to provide an overall national and city-wide perspective, while also knowing how to ‘mine’ potentially detailed, unpublished data about specific interchanges.
5.1.5 Given the probable ineffectiveness of a “straight” postal questionnaire, the mail-outs were preceded by personal telephone calls explaining the background to the work, and outlining its benefits.
5.1.6 Based on our resources we set a target of 20 cities across Europe. The locations for surveys concentrated on the countries directly represented within the Group, although we took the opportunity to expand the coverage to additional countries (e.g. Spain, Germany, etc.).
Questionnaire ContentQuestionnaire ContentQuestionnaire ContentQuestionnaire Content 5.1.7 The survey used three different questionnaires:

5555 SurveysSurveysSurveysSurveys ofofofof CurrentCurrentCurrentCurrent PracticePracticePracticePractice
GUIDE - Urban Interchanges - A Good Practice Guide Page 32
• = a country questionnaire [A]; • = a city questionnaire [B]; and • = ‘interface facility’ questionnaires [C].
5.1.8 The country questionnaire captured general contextual information about public transport in each of the countries we researched, to provide a setting for the information about individual cities and avoid the need to duplicate material for different cities in the same country.
5.1.9 The city questionnaire aimed to generate network level data about interchange and to provide the context for the location-specific questions (note that more general data from a recent UITP survey3 were also examined).
5.1.10 The ‘interface facility’ questionnaires assembled detailed information about individual interchanges. We sought information on at least four passenger interchanges for each city. The initial steps in the questionnaire development were also guided by the ‘Public Transport Interchanges’ (1992) also mentioned in the literature review.
5.1.11 The contents of the questionnaires are summarised in Table 5.1 (more details and the complete questionnaires themselves are shown in the Appendix of D3).
Table Table Table Table 5555....1111 Questionnaire ContentsQuestionnaire ContentsQuestionnaire ContentsQuestionnaire Contents
Country QuestionnaireCountry QuestionnaireCountry QuestionnaireCountry Questionnaire City QuestionnaireCity QuestionnaireCity QuestionnaireCity Questionnaire Individual Interface Individual Interface Individual Interface Individual Interface QuestionnaireQuestionnaireQuestionnaireQuestionnaire
Total population Population Map, sketch diagram, brief history
Country car ownership Area Management and ownership Urban population City car ownership Modes of transport Public transport organisation
Transport statistics (all modes)
Area and physical separation
National transport statistics (all modes)
Public transport operators
Quantification of transport supply: number of lines by mode
Service and operation data by mode
Transport supply: departures by mode
Passenger volumes by mode
Transport demand
Public transport organisation
Operational facilities
Volume of interchange
Passenger facilities at interchange
Modelling interchange
Interchange for
3 Urban Public Transport Statistics 1997, Union Internationale des Transports Publics

5555 SurveysSurveysSurveysSurveys ofofofof CurrentCurrentCurrentCurrent PracticePracticePracticePractice
GUIDE - Urban Interchanges - A Good Practice Guide Page 33
Country QuestionnaireCountry QuestionnaireCountry QuestionnaireCountry Questionnaire City QuestionnaireCity QuestionnaireCity QuestionnaireCity Questionnaire Individual Interface Individual Interface Individual Interface Individual Interface QuestionnaireQuestionnaireQuestionnaireQuestionnaire
people with special needs
Survey OperationSurvey OperationSurvey OperationSurvey Operation
5.1.12 Three distinct roles for individual members of the Group were identified:
• = the Work Package Leader; • = a Lead Partner in each country represented within the
Group; • = other Partners: participation as appropriate.
5.1.13 The role of the Work Package Leader was:
• = definition of methodology; • = preparation of survey material; • = co-ordination of activity and overall progress chasing; • = collation of contact details; • = analysis and reporting of results.
5.1.14 The role of the Lead Partner in each country was:
• = identification and mailing of questionnaires to target individuals;
• = follow-up telephone calls; • = review and clarification of results; • = supply of information at country level.
5.1.15 Other Partners, as appropriate participated in:
• = completion of questionnaire for own organisation; • = carry out personal interview or postal survey for target
city(s); • = supply of contact information or any supplementary data; • = assist lead Partner as required, especially with review and
quality control of results.
5.1.16 As implied above in some cases it was necessary to carry out a personal interview with the appropriate representative within the target organisation in order to achieve results. Note that in most cases GUIDE Partners were familiar with their target contacts. All the above secured a healthy response rate in reasonable time (see next section), bearing in mind that completion of the three questionnaires was not the easiest of tasks.
TerminologyTerminologyTerminologyTerminology 5.1.17 A special attempt was made to generate and apply consistent
terminology and definitions for the different aspects of network features, statistics and transport concepts. This was

5555 SurveysSurveysSurveysSurveys ofofofof CurrentCurrentCurrentCurrent PracticePracticePracticePractice
GUIDE - Urban Interchanges - A Good Practice Guide Page 34
particularly difficult given the number of different languages involved (English, French, Dutch, Greek, German, Spanish, etc.).
5.1.18 However, every respondent was provided with a two-page terminology and definition document which was referred to at different parts of the questionnaire. This document is self-explanatory and is included here.

5555 SurveysSurveysSurveysSurveys ofofofof CurrentCurrentCurrentCurrent PracticePracticePracticePractice
GUIDE - Urban Interchanges - A Good Practice Guide Page 35
GUIDE Terminology DefinitionsGUIDE Terminology DefinitionsGUIDE Terminology DefinitionsGUIDE Terminology Definitions GUIDE TermGUIDE TermGUIDE TermGUIDE Terminology Definitions (continued)inology Definitions (continued)inology Definitions (continued)inology Definitions (continued)
LineTerminus Terminus Intermediate stops
Generic Specific StopStopStopStop Bus stop Tram stop
Station h
Generic Specific LineLineLineLine Route Service
Line characteristics include modemodemodemode and
Network featuresNetwork featuresNetwork featuresNetwork features
l1 l2 l3 l4
l5
Network Network Network Network Line 1, Mode A
Line 2, Mode B
Line 3,Mode
Individual route lengthIndividual route lengthIndividual route lengthIndividual route length: Line 1 Line 2 Line 3 Aggregate l1+l2 l2+l3+l4 l3+l5 (l1+l2) + (l2+l3+l4)+ (l3+l5)) Individual mode length:Individual mode length:Individual mode length:Individual mode length: Mode A Mode B Aggregate l1+l2+l3+l4 l3+l5 (l1+l2+l3+l4) + (l3+l5)Network length:Network length:Network length:Network length:
Line 1 Line 2
A
B C
Journey 1 A to B Direct: 1 Journey Journey Journey Journey, 1 StageStageStageStageJourney 2 A to C via transfer at B:
1 JourneyJourneyJourneyJourney, 2 Stages Stages Stages Stages
Passenger StatisticsPassenger StatisticsPassenger StatisticsPassenger Statistics

5555 SurveysSurveysSurveysSurveys ofofofof CurrentCurrentCurrentCurrent PracticePracticePracticePractice
GUIDE - Urban Interchanges - A Good Practice Guide Page 36
GenericGenericGenericGeneric Common Common Common Common
SynonymsSynonymsSynonymsSynonyms Fuller descriptionFuller descriptionFuller descriptionFuller description
OriginOriginOriginOrigin----destination destination destination destination movementmovementmovementmovement
Passenger journey
Acceptable Complete passenger journey from one non-travel activity to another (i.e. home to work)
Trip; Linked trip
Discouraged
StageStageStageStage Leg; Boarding
Acceptable A direct movement on one public transport service only without change of vehicle. Note: a passenger journey will be equivalent to a stage if and only if it is direct and does not involve a change of vehicle.
Journey; Trip
Discouraged
TransferTransferTransferTransfer Interchange Acceptable Movement from one public transport vehicle to another (same or different operator, or mode) in the course of one passenger journey
Access ModeAccess ModeAccess ModeAccess Mode Mode of arrival at the public transport node from the journey’s origin, e.g. walk, cycle, park/ride, kiss/ride
Egress ModeEgress ModeEgress ModeEgress Mode As access mode but for the part of the journey from the public transport node to the journey destination.
StopStopStopStop Node; Bus/tram stop; Station; Interchange
Acceptable Note: it is necessary to distinguish between “interchange” as a component of infrastructure and “interchange” as act of transfer by a passenger
LineLineLineLine Route; Service
Acceptable
Note: the genericgenericgenericgeneric terminology should be used wherever there is the potential for an ambiguous interpretation of statistics, but ‘acceptable’ common synonyms can be used in most contexts. We are seeking to discourage the use of ‘non-acceptable’ synonyms where these are likely to cause confusion or ambiguity.
5.25.25.25.2 ResponseResponseResponseResponse
5.2.1 The questionnaires together with a short-list of potential recruits were finalised in mid May 1998. They were then sent out by a combination of methods (e-mail, post, etc). This was followed up by telephone calls and personal interviews (if

5555 SurveysSurveysSurveysSurveys ofofofof CurrentCurrentCurrentCurrent PracticePracticePracticePractice
GUIDE - Urban Interchanges - A Good Practice Guide Page 37
necessary) during June and July. The bulk of questionnaires were returned by the end of July, but the last response was received in September 1998.
5.2.2 In order to achieve our target of approximately 20 cities, questionnaires were sent out to 29 cities in 13 European countries. A total of 22 questionnaires (cities) have been completed and returned. This gives a response rate of 76% which is considerably high for this kind of survey and reflects the recruitment effort. The 22 cities represented nine countries: Denmark, France, Germany, Greece, Spain, Sweden, Switzerland, The Netherlands and United Kingdom (accurately speaking Great Britain, data were not collected from Northern Ireland). Table 5.2 summarises the response results.
Table Table Table Table 5555....2222 Response to the QuestionResponse to the QuestionResponse to the QuestionResponse to the Questionnairesnairesnairesnaires
City/County Questionnaire returned: Country City/Area Interchange GB London
Merseyside Tyne and Wear Edinburgh Birmingham South Yorkshire West Yorkshire Gtr Manchester
√ √ √ √ √ √ √ √ √
√ √ √ √ √ √ √ √
Sweden Uppsala √ √ √ Spain Madrid
Barcelona √
√ √ √
Denmark Copenhagen √ √ Italy Milan
Torino
Ireland Dublin Austria Vienna Greece Athens
Thessaloniki √ √
√ √ √
Switzerland Lausanne Geneva
√ √ √
√ √
Netherlands Utrecht Amsterdam
√ √ √
√ √
Germany Munich Berlin
√ √ √
France Paris Lyon Toulouse Strasbourg
√ √ √ √
√ √ √

5555 SurveysSurveysSurveysSurveys ofofofof CurrentCurrentCurrentCurrent PracticePracticePracticePractice
GUIDE - Urban Interchanges - A Good Practice Guide Page 38
City/County Questionnaire returned: Belgium Brussels
5.2.3 Some respondents sought help from their colleagues in order
to answer particular questions. However, we emphasised to them that the intention was to exploit existing knowledge and readily available data, and we were not asking them to carry out any primary data collection. Lack of information in particular areas would in itself tell us something about the state of knowledge about interchange.
5.2.4 Of those returned, some were incomplete or provided data on a different basis from that requested and supplied by others. This applied to all questionnaires but was most acute in the questionnaire [C] dealing with individual interchanges and despite the terminology definitions described earlier. As a result in some cases it was difficult to compare data across countries because of inconsistencies.
5.2.5 In general, data tended to be missing in those instances where services were operated by the private sector without public sector subsidy, either because the operators did not gather the data, or decided not to make it available because of commercial sensitivity (e.g. Edinburgh).
5.2.6 This is important because lack of data may make the planning of interchanges, and interchanging services more difficult. Conversely (and rather unlikely), lack of data may imply that improved interchanges and connecting services are planned as a ‘public good’ and therefore are not subject to stringent economic and financial appraisal.
5.35.35.35.3 FindingsFindingsFindingsFindings
5.3.1 The remainder of the analysis in this section will look, briefly, at some of the returned information in qualitative terms. This will start at the country level and then continue with the city and individual interchange level. Only highlights are presented in this report, however, more detailed analysis and results can be found in deliverable D3, Volume 1: Surveys of Current Practice.
Country LevelCountry LevelCountry LevelCountry Level 5.3.2 The statistics show that among the countries in our sample,
Germany has the highest car ownership, followed closely by France and Switzerland. Greece has the lowest at 199 per 1000 population.
5.3.3 It was found that at the country level the public transport mode share would roughly reflect country car ownership levels and levels of urbanisation (with the exception of Switzerland). It was interesting to find out that Britain has a lower public

5555 SurveysSurveysSurveysSurveys ofofofof CurrentCurrentCurrentCurrent PracticePracticePracticePractice
GUIDE - Urban Interchanges - A Good Practice Guide Page 39
transport mode share than Germany or Switzerland, despite the fact that it has higher levels of urbanisation and lower levels of car ownership. This implies that if British people have access to a car, they have a greater tendency to use it than their German or Swiss counterparts.
5.3.4 The institutional arrangements for ownership and operation of public transport vary across Europe, but essentially there are three models:
• = public ownership and operation; • = public ownership or control and private operation
(particularly bus systems); • = private ownership and operation.
5.3.5 Private sector involvement is most prevalent in the UK. With the exception of London, all bus services are privately owned and operated, with no public control over fares or routing. On the heavy rail network, the infrastructure is privately owned and all services are operated by franchised private companies, with minimum standards set by and associated subsidies paid by government. Within London, bus operations are privately owned but within a franchised and heavily regulated environment facilitated by the public sector (London Transport Buses). The London Underground network is publicly owned and operated (nota bene: according to current government plans this will soon change, see D3 for more details). Other metro and light rail systems throughout the UK employ public ownership with, usually, private operation.
5.3.6 In mainland Europe, the most common model is of public ownership of infrastructure with private operation. In some countries, special exceptions are made for large and capital cities (as in London, described above). In the Paris region, Ile de France, a single authority (Paris Transport Syndicate) oversees all the public transport provision in the area, co-ordinating the activities of the operating companies (RATP, SNCF and 80 private operators). Similarly in Germany and the Netherlands, the large cities have publicly owned and operated systems.
5.3.7 In Greece, the rail network is publicly owned and operated. Conversely, most bus systems are owned and operated by the private sector, with no public sector control or management. However, as elsewhere a different structure exists in the capital city, Athens, where the system is publicly owned and operated.
City LevelCity LevelCity LevelCity Level

5555 SurveysSurveysSurveysSurveys ofofofof CurrentCurrentCurrentCurrent PracticePracticePracticePractice
GUIDE - Urban Interchanges - A Good Practice Guide Page 40
5.3.8 There are a few caveats about data availability, quality and geographical or unit definitions between different countries (see Tables 5.3 to 5.8) but in general it was found that:
• = most cities were able to generate good information on overall travel demand; where information was lacking, it tended to be for non-motorised modes (e.g. bicycle or walk) or car use;
• = the data sought on public transport supply included
number and length of lines, vehicle kilometres and peak vehicles; not surprisingly few respondents were able to complete everything, but most were able to provide indicators of balance between modes;
• = there is great variation in the availability of demand data; • = interchange data is available for about twelve of the
cities, although we suspect that some of this data is based more on informed judgement than firm evidence.
5.3.9 In the following paragraphs we summarise our conclusions
from the data analysis – more detailed information is presented in Tables 5.3 to 5.8.
5.3.10 Car ownershipCar ownershipCar ownershipCar ownership at the city level is comparable to that at the national level. In the majority of cities, the rate is slightly higher than the national level, with some cities (Athens, Thessaloniki and Toulouse) being significantly higher (by around 25-30%).
5.3.11 Although it may be intuitive to expect lower car ownership levels in the city given the greater provision of public transport, cities can create higher levels of wealth than the national average, which is reflected in greater car ownership levels. (For example, the Ile de France region has 18% of the population, but produces 27% of the national wealth.) However, average earnings in Newcastle are lower than the national average, which is reflected in the lower than average car ownership rate.
5.3.12 An exception to the above is London where car ownership is lower than the national average despite higher per capita per capita per capita per capita incomeincomeincomeincome, which appears to be the effect of greater public transport provision.
5.3.13 It was possible to carry out analysis of travel demand by mode of travel for a number of cities. For example, it was found that both Copenhagen and Paris appear to share long average car journey lengthsjourney lengthsjourney lengthsjourney lengths. Although generally average public transport journey length is shorter than the car equivalent, for both

5555 SurveysSurveysSurveysSurveys ofofofof CurrentCurrentCurrentCurrent PracticePracticePracticePractice
GUIDE - Urban Interchanges - A Good Practice Guide Page 41
London and Barcelona, public transport journeys are longer than car journeys.
5.3.14 In London, the shorter journey lengths for car trips may possibly be explained by people’s propensity to use cars for short trips. One might speculate that perhaps in other European cities there is a greater propensity to walk or use the bus for such trips. This may also reflect the difficulty in making long distance car journeys in congested areas.
5.3.15 It should also be noted that the data refers to London residents and therefore longer distance commuting journeys are excluded. Unfortunately, it is not clear to us whether the Paris data include non-residents.
5.3.16 Of most interest to this project is the level of interchangelevel of interchangelevel of interchangelevel of interchange, which varies significantly. Lowest levels of interchange (indicated by highest proportions of journeys made with no transfer) are shown in Manchester, Leeds and Newcastle, as perhaps might be expected given the deregulated nature of the public transport networks in these cities. In contrast, London has one of the highest levels of interchange (only 45% of journeys made direct); only Munich is higher. Interestingly, Munich has the highest public transport mode share of all.
5.3.17 This suggests that there is some correlation between levels of levels of levels of levels of interchangeinterchangeinterchangeinterchange and mode sharemode sharemode sharemode share. Statistically, this is probably true, as shown in Figure 5.1, in which mode share is plotted against the percent of direct journeys; but it would be inappropriate at this stage to suggest that there is a causal relationship between the two.
Figure 5.1 Public Transport Modal Share plotted Figure 5.1 Public Transport Modal Share plotted Figure 5.1 Public Transport Modal Share plotted Figure 5.1 Public Transport Modal Share plotted against Level of against Level of against Level of against Level of TransferTransferTransferTransfer
Paris
LondonBarcelona
Athens
Manchester
Munich
Newcastle
Birmingham
Toulouse Uppsala
0%
5%
10%
15%
20%
25%
30%
35%
0% 20% 40% 60% 80% 100%
% of direct PT journeys
PT Mode Share
5.3.18 In terms of public transport supply, the largest of the systems
represented appears to be London, as measured by “Seat “Seat “Seat “Seat Kilometres Offered”Kilometres Offered”Kilometres Offered”Kilometres Offered” (i.e. annual vehicle kilometres multiplied

5555 SurveysSurveysSurveysSurveys ofofofof CurrentCurrentCurrentCurrent PracticePracticePracticePractice
GUIDE - Urban Interchanges - A Good Practice Guide Page 42
by the average capacity per vehicle of each mode), although the Paris /Ile de France figures could well be greater if the data was available. London certainly has the largest bus fleet. Geneva and Lausanne have the smallest system, in terms of seat kilometres. Toulouse stands out as having a significantly larger system capacity than the other smaller cities for which we have data (i.e. with populations of less than one million). Bus lines provide the larger share of service in most cities.
5.3.19 In terms of total public transpublic transpublic transpublic transport journeysport journeysport journeysport journeys, London is significantly larger than the other cities represented, although in terms of passenger kilometres Paris/Isle de France is very close. Geneva and Toulouse are at the other end of the scale. The implied average journey lengths vary from 12.9 (Paris - but no doubt reflecting the regional area definition), to 5.4 (Greater Manchester and Toulouse) and 4.5 (Munich and Madrid).
5.3.20 Volumes of interchange have already been discussed to some extent. The range of direct journey proportions is from 94% (Newcastle - despite the maintenance of an integrated ticket system that would be expected to encourage transfer) and 92.5% (Manchester), down to as low as 30% for Munich. This is despite the very short average journey length for this city.
5.3.21 The ratio of boardings to journeys is an alternative indicator of “propensity to interchange“propensity to interchange“propensity to interchange“propensity to interchange” and it would produce a similar ranking to the “proportion of direct journey”“proportion of direct journey”“proportion of direct journey”“proportion of direct journey” indicator, although in the middle range, e.g. 60% to 70% of direct journeys, the boarding/journey ratio is heavily dependent upon the proportion of multiple transfers (e.g. two or more) that have been estimated.
5.3.22 There is little discernible pattern relating transfer proportions to average stage length. However, there is more evidence that high proportions of direct journeys are associated with more bus-dominated networks. This is illustrated in Figure 5.2, in which the percentage of direct journeys is plotted against the bus share of total boardings.
5.3.23 The relationship between level of transfer and the bus share of total passenger kilometres is very similar, but slightly less evident.
5.3.24 Finally, where the data permit it is possible to estimate the average level of loading on each of the public transport modes. This also demonstrates considerable variation, with average bus loads of 6.2 in Manchester contrasting to over 23 in Athens. Average metro loadings are, as would be expected, significantly higher.
Figure 5.2Figure 5.2Figure 5.2Figure 5.2 Level of Transfer and Bus Share of PT BoardingsLevel of Transfer and Bus Share of PT BoardingsLevel of Transfer and Bus Share of PT BoardingsLevel of Transfer and Bus Share of PT Boardings

5555 SurveysSurveysSurveysSurveys ofofofof CurrentCurrentCurrentCurrent PracticePracticePracticePractice
GUIDE - Urban Interchanges - A Good Practice Guide Page 43
Paris
London
Barcelona
Athens
Manchester
Munich
Newcastle
Toulouse
Madrid
Uppsala
0.0%
10.0%
20.0%
30.0%
40.0%
50.0%
60.0%
70.0%
80.0%
90.0%
100.0%
0.0% 20.0% 40.0% 60.0% 80.0% 100.0%
% Bus Boardings
% Direct Journeys
5.3.25 The availability of period ticketsperiod ticketsperiod ticketsperiod tickets encourages a higher level of
public transport usage and consequently of interchange. This is further encouraged with the period tickets being valid for all modes (see for example Colin Buchanan and Partners, 1998). All of the cities in our sample provide multi-mode period tickets with the exception of Athens and Thessaloniki. In Athens (where there are only 3 rail based routes in addition to the bus network), multi-operator period tickets are available. In Thessaloniki, only single stage tickets are available, which would have an adverse affect on the level of interchange.
5.3.26 As discussed in the previous Chapter our literature review found little on modelling and interchange penalties. Our survey shows that network and interchange modelling is carried out by 60% of the surveyed cities. Whilst all the models employ factors for walking and waiting time, several also apply an interchange or boarding penalty, to account for the perceived additional dis-benefit arising from the need to interchange over and above that obtained from the weighting of walk and wait time. This ranges from 80 seconds in Toulouse to up to 10 minutes in Manchester. It is highly probable that, in practice, such perceived penalties are dependent on the interchange environment and highlight the importance of achieving quality interchanges.
5.3.27 Timetable integrationTimetable integrationTimetable integrationTimetable integration is only carried out in Copenhagen, where co-ordinated timetables are produced and all-mode timetables issued. The latter are also produced in Munich and Amsterdam. In British cities, London Transport or the passenger transport authority produces area based maps showing the public transport network and, in some instances, headway data for the bus network. About half of the cities

5555 SurveysSurveysSurveysSurveys ofofofof CurrentCurrentCurrentCurrent PracticePracticePracticePractice
GUIDE - Urban Interchanges - A Good Practice Guide Page 44
explicitly promote interchanges. London Transport is currently piloting different types of multi-modal timetable.
5.3.28 Provision for mobility impaired Provision for mobility impaired Provision for mobility impaired Provision for mobility impaired passengers is quite varied, but increasing as facilities and vehicles are renewed and modernised. Low floor buses and elevators in stations are the most prevalent facilities being provided. Other infrastructure based improvements include tactile surfaces and dropped kerb lines at stations and bus stands.
5.3.29 Some cities have policy plans, such as London, where the aim is to make stations step free and Barcelona, where by 2006 all stations should be adapted for the mobility impaired. Interestingly, few cities provided data for the percentage of trips made by mobility impaired persons , implying that providing such facilities is done primarily on a policy led basis rather than any evaluation process.
Interchange LevelInterchange LevelInterchange LevelInterchange Level 5.3.30 Data was obtained for 82 interchanges, ranging from Garforth
in Leeds catering to 5 bus routes, to Gare du Nord in Paris, which extends over 4 levels and serves 6 regional rail lines, 3 metro lines and 10 bus routes. The sections of the questionnaire dealing with modes of transport, quantification of supply and facilities were generally completed. However, the section dealing with demand data was often not completed, making meaningful comparisons of interchange functionality problematical. This and other caveats (mentioned in the previous sections) should be born in mind whilst reading the following summary of findings.
5.3.31 Table 5.3 summarises the level of trip interchange and sets out the number of interchanges serving a range of passengers. As mentioned above the highest interchange rates are reported in Munich and Lyon at 60%. Next is London with 50% and then several cities follow at around the 30% mark. The lowest, at 6-7%, is Tyne & Wear (Newcastle) and Greater Manchester. In terms of the number of interchanges, Paris has the highest number serving 50k+ a day, followed by London (11 interchanges). For the next two ranges (25-50 and 10-25), Copenhagen reports the greatest number (a total of 48).
Table Table Table Table 5555....3333 Level of Interchanging by CityLevel of Interchanging by CityLevel of Interchanging by CityLevel of Interchanging by City

5555 SurveysSurveysSurveysSurveys ofofofof CurrentCurrentCurrentCurrent PracticePracticePracticePractice
GUIDE - Urban Interchanges - A Good Practice Guide Page 45
CityCityCityCity % of trips % of trips % of trips % of trips making making making making one one one one interchanginterchanginterchanginterchange e e e
Interchanges serving (000’s/day) Interchanges serving (000’s/day) Interchanges serving (000’s/day) Interchanges serving (000’s/day) TotalTotalTotalTotal
50+ 25-50 10-25 5-10 Greater Manchester
7 n/a n/a n/a n/a n/a
Tyne & Wear
6 0 0 1 4 5
Birmingham
33 1 1 10 11 23
West Yorkshire
15 0 2 7 many >9
London 50 11 11 15 16 53 Uppsala 15 0 0 0 1 1 Barcelona 21 3 3 2 3 11 Madrid 26 n/a n/a n/a n/a n/a Copenhagen
n/a 4 16 32 n/a 52
Athens 30 3 3 9 10+ >28 Lausanne n/a 2 n/a n/a n/a n/a Geneva 30 3 n/a n/a n/a n/a Utrecht 25 0 1 n/a n/a n/a Munich 60 n/a n/a n/a n/a n/a Paris 39 17 7 n/a n/a >24 Lyon 60 n/a n/a n/a n/a n/a Toulouse 33 n/a n/a n/a n/a n/a
5.3.32 In D3 we presented the results of our analysis of interchange
facilities, ranging from lifts, stairs and seats to CCTV, telephones and luggage facilities. The analysis revealed a number of trends, only the most important are summarised below.
5.3.33 The overall provision of facilities at each individual interchange exhibits a strong correlation to the network provision. We devised a measure of network provision factor (or available capacity) from the number of lines by public transport mode serving each particular interchange. We weighted the various modes (by 10, 2 and 1 for regional rail and metro, tramway and light rail and bus respectively) to account for capacity differences. (Interchanges with incomplete data on lines and modes were excluded.) It was found that, the greater the available capacity, as measured by the above factor, serving the interchange, the greater the number of facilities. The correlation is shown in Figure 5.3.
5.3.34 The age of an interchange was also considered as a possible factor in the provision of facilities, with the anticipation that the older and perhaps unplanned facilities would tend to have fewer facilities. (Some of the interchanges reported upon have

5555 SurveysSurveysSurveysSurveys ofofofof CurrentCurrentCurrentCurrent PracticePracticePracticePractice
GUIDE - Urban Interchanges - A Good Practice Guide Page 46
existed for several decades in one form or another and have grown and developed to accommodate the needs of new services and lines and also passenger expectations. For example, Gare du Nord in Paris, France, has existed since 1875 and developed to accommodate the needs of new Metro, TGV and Eurostar services.)

5555 SurveysSurveysSurveysSurveys ofofofof CurrentCurrentCurrentCurrent PracticePracticePracticePractice
GUIDE - Urban Interchanges - A Good Practice Guide Page 47
Figure 5.3Figure 5.3Figure 5.3Figure 5.3 Network Provision anNetwork Provision anNetwork Provision anNetwork Provision and Number of Facilitiesd Number of Facilitiesd Number of Facilitiesd Number of Facilities
0
50
100
150
200
0 5 10 15 20 25 30 35
Number of facilities
Net
wor
k pr
ovisi
on

5555 SurveysSurveysSurveysSurveys ofofofof CurrentCurrentCurrentCurrent PracticePracticePracticePractice
GUIDE - Urban Interchanges - A Good Practice Guide Page 48
Table Table Table Table 5555....4444 Data AvailabilityData AvailabilityData AvailabilityData Availability
Paris London
Madrid
Barcelona
Athens
Manchester
Leeds Copenhagen
Liverpool
Sheffield
Munich
Lyon Newcastle
Amsterdam
Birmingham
Thessaloniki
Toulouse
Edinburgh
Geneva
Lausanne
Utrecht
Uppsala
General City characteristics
Good Good Some Good Good Good Good Good Good Good Good Good Good Good Good Good Good Good Good Good Good Good
Overall transport demand
Some Good Poor Good Good Good Poor Good Good Poor Good Poor Good Poor Good Poor Good Poor Poor Poor Poor Some
Public transport supply
Good Good Good Good Good Some Poor Some Poor Some Some Some Some Some Poor Good Good Poor Good Good Poor Good
Public transport demand
Good Good Some Good Good Some Poor Some Poor Poor Good Poor Good Good Poor Poor Some Poor Good Good Poor Poor
Interchange Good Good Some Good Good Good Good Poor Poor Poor Good Poor Good Poor Good Poor Good Poor Good Poor Good Some
Table Table Table Table 5555....5555 General City CharacteristicsGeneral City CharacteristicsGeneral City CharacteristicsGeneral City Characteristics
CityCityCityCity ParisParisParisParis LondoLondoLondoLondonnnn
MadridMadridMadridMadrid BarceloBarceloBarceloBarcelonananana
AthensAthensAthensAthens ManchManchManchManch----esteresteresterester
LeedsLeedsLeedsLeeds CopenCopenCopenCopen----hagenhagenhagenhagen
SheffielSheffielSheffielSheffieldddd
MunichMunichMunichMunich LyonLyonLyonLyon NewcaNewcaNewcaNewcastlestlestlestle
AmsterAmsterAmsterAmsterdamdamdamdam
BirminBirminBirminBirminghamghamghamgham
ThessaThessaThessaThessalonikalonikalonikalonika
ToulouToulouToulouToulousesesese
GenevaGenevaGenevaGeneva LausanLausanLausanLausannenenene
UtrechtUtrechtUtrechtUtrecht UppsalUppsalUppsalUppsalaaaa
Population (millions)
11.027 7.070 5000 4.200 4.100 2.575 2.100 1.766 1.300 1.236 1.135 1.127 1.103 1.021 0.750 0.661 0.401 0.244 0.234 0.185
Area (sq kms)
3,000 1,579 8026 3,236 465 654 2,000 2,868 600 310 487 540 635 265 500 500 282 298 64 50
Population density
368 448 62 130 882 394 105 62 217 399 233 209 174 385 150 132 142 82 366 370
Employment (millions)
4.934 3.700 n/a 1.525 1.500 1.000 n/a 0.915 n/a 0.820 0.557 0.407 n/a 0.443 0.180 0.314 0.226 0.140 0.169 0.080
Car ownership (cars/person)
0.454 0.334 n/a 0.531 0.248 0.395 0.318 0.285 n/a 0.521 0.451 0.272 0.333 0.4121 0.250 0.550 0.505 0.488 0.358 n/a
Employment rate 2
44.7% 52.3% n/a 36.3% 36.6% 38.8% n/a 51.8% n/a 66.3% 49.1% 36.1% n/a 43.4% 24.0% 47.5% 56.3% 57.5% 72.2% 43.2

5555 SurveysSurveysSurveysSurveys ofofofof CurrentCurrentCurrentCurrent PracticePracticePracticePractice
GUIDE - Urban Interchanges - A Good Practice Guide Page 49
1. West Midlands County 2. The employment rate is calculated simply by dividing employment by population - this is not accurate because it does not take into account the effect of people commuting into the
cities from outlying areas - however, this is all it could be done with the available data.

5555 SurveysSurveysSurveysSurveys ofofofof CurrentCurrentCurrentCurrent PracticePracticePracticePractice
GUIDE - Urban Interchanges - A Good Practice Guide Page 50
Table Table Table Table 5555....6666 Overall Travel DemandOverall Travel DemandOverall Travel DemandOverall Travel Demand
CityCityCityCity ParisParisParisParis LondonLondonLondonLondon MadridMadridMadridMadrid BarcelonaBarcelonaBarcelonaBarcelona AthensAthensAthensAthens ManchestManchestManchestManchesterererer
LeedsLeedsLeedsLeeds CopenCopenCopenCopen----hagenhagenhagenhagen
MunichMunichMunichMunich NewcastlNewcastlNewcastlNewcastleeee
ThessaThessaThessaThessa---- lonikalonikalonikalonika
BirmingBirmingBirmingBirming----hamhamhamham
ToulouseToulouseToulouseToulouse GenevaGenevaGenevaGeneva UtrechtUtrechtUtrechtUtrecht UppsalaUppsalaUppsalaUppsala
Passenger JourneysPassenger JourneysPassenger JourneysPassenger Journeys (millions)::::
All public transport
1,650 2,340 1300 652 460 310 230 340 420 201 133 114 54 26 12
Private car/van 3,575 3,240 665 1,250 1,279 484 390 534 642 319 40 Taxi 275 120 14 248 22 10 1 2 Motor cycle/moped
85 110 10 10 20.7 6 1
Bicycle 90 11 n/a 31 321 95 19 14 40 Walk 2750 2400 640 n/a 482 180 340 348 258.7 110 5 All Journeys 8,250 8,190 n/a 2,067 2,068 2,134 n/a 1,325 1,265 1,102 1,035 504 26 100 PT Mode Share 20.0% 28.6% n/a 31.5% 22.2% 14.5% n/a 25.7% 33.2% 18.2% 11.0% 10.7% n/a 12.0% Average car Journey Length
26.6 6.6 6.5 12.0 6.7 16.0 0.0 11.9 11.1 5.3 n/a
Average PT journey length
12.9 9.6 6.5 7.3 7.2 5.4 n/a 8.5 4.5 7.8 8.5 5.4 n/a 4.1 n/a
% Journeys with % Journeys with % Journeys with % Journeys with no transferno transferno transferno transfer
61%61%61%61% 45%45%45%45% 71%71%71%71% 77777%7%7%7% 67%67%67%67% 93%93%93%93% 85%85%85%85% 30%30%30%30% 94%94%94%94% 63%63%63%63% 63%63%63%63% 65%65%65%65% 72%72%72%72% 83%83%83%83%
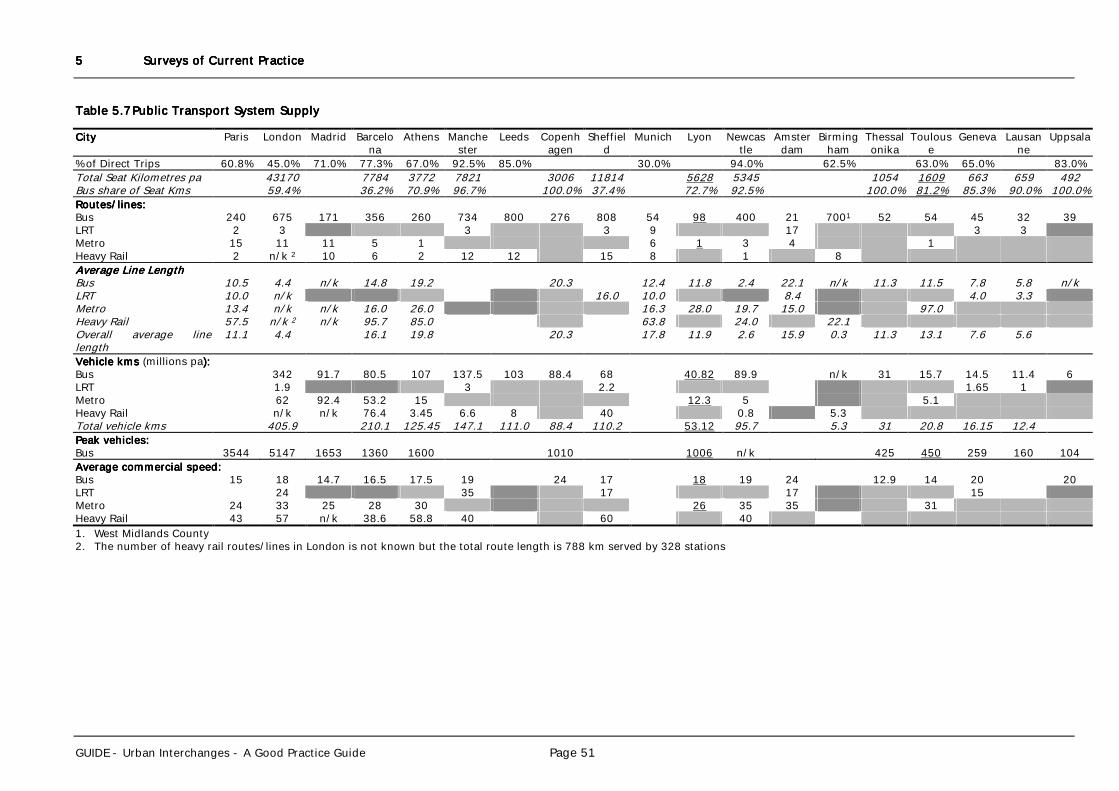
5555 SurveysSurveysSurveysSurveys ofofofof CurrentCurrentCurrentCurrent PracticePracticePracticePractice
GUIDE - Urban Interchanges - A Good Practice Guide Page 51
Table Table Table Table 5555....7777 Public Transport System SupplyPublic Transport System SupplyPublic Transport System SupplyPublic Transport System Supply
CityCityCityCity Paris London Madrid Barcelona
Athens Manchester
Leeds Copenhagen
Sheffield
Munich Lyon Newcastle
Amsterdam
Birmingham
Thessalonika
Toulouse
Geneva Lausanne
Uppsala
% of Direct Trips 60.8% 45.0% 71.0% 77.3% 67.0% 92.5% 85.0% 30.0% 94.0% 62.5% 63.0% 65.0% 83.0% Total Seat Kilometres pa 43170 7784 3772 7821 3006 11814 5628 5345 1054 1609 663 659 492 Bus share of Seat Kms 59.4% 36.2% 70.9% 96.7% 100.0% 37.4% 72.7% 92.5% 100.0% 81.2% 85.3% 90.0% 100.0% Routes/lines:Routes/lines:Routes/lines:Routes/lines: Bus 240 675 171 356 260 734 800 276 808 54 98 400 21 7001 52 54 45 32 39 LRT 2 3 3 3 9 17 3 3 Metro 15 11 11 5 1 6 1 3 4 1 Heavy Rail 2 n/k 2 10 6 2 12 12 15 8 1 8 Average Line LengthAverage Line LengthAverage Line LengthAverage Line Length Bus 10.5 4.4 n/k 14.8 19.2 20.3 12.4 11.8 2.4 22.1 n/k 11.3 11.5 7.8 5.8 n/k LRT 10.0 n/k 16.0 10.0 8.4 4.0 3.3 Metro 13.4 n/k n/k 16.0 26.0 16.3 28.0 19.7 15.0 97.0 Heavy Rail 57.5 n/k 2 n/k 95.7 85.0 63.8 24.0 22.1 Overall average line length
11.1 4.4 16.1 19.8 20.3 17.8 11.9 2.6 15.9 0.3 11.3 13.1 7.6 5.6
Vehicle kms Vehicle kms Vehicle kms Vehicle kms (millions pa):):):): Bus 342 91.7 80.5 107 137.5 103 88.4 68 40.82 89.9 n/k 31 15.7 14.5 11.4 6 LRT 1.9 3 2.2 1.65 1 Metro 62 92.4 53.2 15 12.3 5 5.1 Heavy Rail n/k n/k 76.4 3.45 6.6 8 40 0.8 5.3 Total vehicle kms 405.9 210.1 125.45 147.1 111.0 88.4 110.2 53.12 95.7 5.3 31 20.8 16.15 12.4 Peak vehicles:Peak vehicles:Peak vehicles:Peak vehicles: Bus 3544 5147 1653 1360 1600 1010 1006 n/k 425 450 259 160 104 Average commercial speed:Average commercial speed:Average commercial speed:Average commercial speed: Bus 15 18 14.7 16.5 17.5 19 24 17 18 19 24 12.9 14 20 20 LRT 24 35 17 17 15 Metro 24 33 25 28 30 26 35 35 31 Heavy Rail 43 57 n/k 38.6 58.8 40 60 40 1. West Midlands County 2. The number of heavy rail routes/lines in London is not known but the total route length is 788 km served by 328 stations

5555 SurveysSurveysSurveysSurveys ofofofof CurrentCurrentCurrentCurrent PracticePracticePracticePractice
GUIDE - Urban Interchanges - A Good Practice Guide Page 52
Table Table Table Table 5555....8888 Public Transport DemandPublic Transport DemandPublic Transport DemandPublic Transport Demand
City Paris London Madrid Barcelona
Athens Manchester
Copenhagen
Munich Lyon Newcastle
Amsterdam
Thessalonika
Birmingham
Toulouse
Geneva Lausanne
Uppsala
PT Passenger JourneysPT Passenger JourneysPT Passenger JourneysPT Passenger Journeys (millions)::::
1,650 2,340 1300 652 460 310 340 420 133 201 133 114 54 12
PT Passenger km PT Passenger km PT Passenger km PT Passenger km (millions):(millions):(millions):(millions):
21,230 22,530 5850 4,745 3,300 1,669 2,886 1,910 n/k 1,559 963 289 248
Average PT journey length
12.9 9.6 4.5 7.3 7.2 5.4 8.5 4.5 n/k 7.8 n/k 8.5 5.4 n/k n/k n/k
Interchange percentage:Interchange percentage:Interchange percentage:Interchange percentage: % Journeys with no transfer
60.8% 45.0% 71 77.3% 67.0% 92.5% 30.0% n/k 94.0% 62.5% 63.0% 65.0% 83
% journeys with 1 transfer
39.2% 50.0% 26 20.6% 30.0% 7.0% 60.0% n/k 6.0% 32.5% 33.0% 30.0% 15
% journeys with 2 or more transfers
0.0% 5.0% 3 2.1% 3.0% 0.5% 10.0% n/k 0.0% 5.0% 4.0% 5.0% 2
Boardings/Journey 1.392 1.501 1.33 1.248 1.304 1.080 1.755 1.550 1.044 1.425 1.343 1.400 n/k AvAvAvAverage Stage Length:erage Stage Length:erage Stage Length:erage Stage Length: 4.8 6.9 5.8 4.3 5.5 5.2 3.9 3.7 1 5.6 3.6 n/k 4.0 n/k n/k n/k Bus share: % boardings 36.4% 36.4% 46.1 43.5% 86.7% 90.9% 100.0% 21.7% 51.1% 82.2% 21.3% n/k 59.4% n/k 78.6% 100.0% Bus share: % pass. kms 19.5% 17.9% 29.1 39.9% 75.8% 80.1% 100.0% 9.4% n/k 75.4% 25.5% n/k 65.1% 80.2% n/k 100.0% Average Load Average Load Average Load Average Load (Pkms/Vkms)(Pkms/Vkms)(Pkms/Vkms)(Pkms/Vkms)
Bus 12.7 18.5 14.6 23.4 6.2 11.3 9.8 12.0 13.7 LRT n/k n/k n/k n/k Metro 104.5 23.8 23.6 53.3 49.8 19.8 Heavy Rail n/k 2 n/k 6.8 n/a 21.4 48.8 1. There is an inconsistency between city wide passenger kilometre figures for Munich and those for individual modes (which sum to a much larger figure). We have assumed here that heavy rail should be excluded from the calculations, but this will require further investigation. 2 Total annual passenger kilometres for heavy rail in London is 14,600 (representing 485 million O-D movements annually), but an estimate for vehicle kilometres is not available.

GUIDE - Urban Interchanges - A Good Practice Guide Page 53
6666 The CasThe CasThe CasThe Case Studiese Studiese Studiese Studies
6.16.16.16.1 Objectives of the Case StudiesObjectives of the Case StudiesObjectives of the Case StudiesObjectives of the Case Studies
6.1.1 The objective of this work was to review the current state of practice in the development and evaluation of passenger interchanges. In particular, it sought to identify good and bad practice by means of case studies.
6.1.2 A total of 20 case studies were developed. For selection purposes they were structured in two major groups:
• = site-specific case studies, addressing particular interchanges and their facilities in various cities across Europe;
• = topic case studies, addressing particular issues of interest
in the development and evaluation of passenger interchanges.
6.1.3 Previous Guide work had a significant input to the selection
and development of the case studies. In addition, heed was paid to select a range of different interchanges (major multi-modal hubs as well as single bus stops) and to cover a variety of issues ranging from park and ride to cycle facilities.
6.1.4 The final act was the organisation of a seminar where all the GUIDE case studies were presented and discussed by an international peer group (presentations by the other two projects, sponsored by EC DG7, PIRATE and MIMIC were also included).
6.1.5 This Chapter briefly summarises findings from the case studies. More detailed results can be found in deliverable D4: Report on Case Studies.
6.26.26.26.2 Selection and ApproachSelection and ApproachSelection and ApproachSelection and Approach
6.2.1 Utilising case studies as the means of identifying good and bad practice and comparing between different European cities was a major part of the GUIDE project. Initially, it was envisaged that a number of specific interchange sites in European cities would need to be studied.
6.2.2 Early in the course of the project it was established that some issues, such as network strategy, interchange management, evaluation, etc, required special attention. This was further reinforced by the gaps found during the literature review and the analysis of the survey of current practice. It was, therefore, decided to devote resources to address some of the above issues (or topics).
6.2.3 Thus the final list of case studies includes a mix of site-specific and topic case studies. Note that Surveys of Current Practice provided a data base of over 80 interchanges across

6666 TheTheTheThe CaseCaseCaseCase StudiesStudiesStudiesStudies
GUIDE - Urban Interchanges - A Good Practice Guide Page 54
Europe with basic information about transport demand, supply and general facilities at each site. This facilitated the selection of the site-specific case studies. In addition, the structured list of topics (location, organisation, strategy and evaluation) and sub-topics developed during the literature review eased the above tasks and guided the methodology.
6.2.4 The following criteria influenced the final list of case studies:
• = spread across European cities; • = availability of local manager within the GUIDE group; • = size of interchange and transport modes served; • = location in the urban area and on the public transport
network; • = issues of interest to GUIDE Partners; • = what contribution the case study would make to GUIDE’s
topics and sub-topics.
6.2.5 The final set contains 14 site-specific case studies, in the following eight cities (spread in five different European countries): London (2), Utrecht, Amsterdam, Manchester (2), Paris (2), Athens (2), Birmingham (2) and Stockholm (2). Table 6.1 gives the full list of the site-specific case studies together with the special issues of interest relating to each particular site. The same Table also shows (first column) the (GUIDE) Partner organisation managing each case study.
Table Table Table Table 6666....1111 SiteSiteSiteSite----Specific Case StudiesSpecific Case StudiesSpecific Case StudiesSpecific Case Studies
ManagerManagerManagerManager SiteSiteSiteSite IssuesIssuesIssuesIssues RapporteurRapporteurRapporteurRapporteurLT
Hammersmith retail, shops, offices, high quality Metro+Bus interchange, interface with surrounding area
NS
LT Canning Town design standards, planning a new line, strategy multi-modal interchange, multi-modal operation
NS
NS Utrecht multi-modal, design, safety, security, accessibility, bicycle
MVA
NS Duivendrecht+ Bijlmer
design, safety, security, network strategy
MVA
GMPTE Bury passenger security, network strategy
RATP
GMPTE Piccadilly Gardens
facilities, interface with city centre
RATP
RATP La Défense funding, evaluation, facilities, partnership
GMPTE
RATP Gare du Nord information, multi-operation, personal security
GMPTE
AM Pireas metro+rail+bus+trolley+P&R+ Centro

6666 TheTheTheThe CaseCaseCaseCase StudiesStudiesStudiesStudies
GUIDE - Urban Interchanges - A Good Practice Guide Page 55
ManagerManagerManagerManager SiteSiteSiteSite IssuesIssuesIssuesIssues RapporteurRapporteurRapporteurRapporteurmajor Greek port
AM Ethniki Amyna (to be built ) metro+bus+P&R, offices
Centro
Centro Five Ways retail, offices, surrounding area, security
AM
Centro Cradley Heath design, facilities, multi-modal, multi-operation, accessibility
AM
UU City Terminal design, facilities, evaluation, multi-modal, multi-operation
LT
UU Gullmarsplan bus+metro, facilities, security, multi-operator
LT
6.2.6 For each case study a technical visit was organised by the case
study manager, in advance of which some basic data, in addition to the information collected in previous Guide work, were prepared. The visit usually started with official presentations by the local management of the interchange, local public transport operators and local authorities. The presentations were concluded by discussion between the local representatives and GUIDE’s Partners. After the presentations the Partners visited a number of areas within the site accompanied by local representatives. The technical visit was usually concluded by a discussion between the Partners.
6.2.7 The methodology developed required the ‘rapporteur’ (see Table 6.1) to sum up the results of the technical visit and submit a report to the case study manager (as an aid most Partners submitted their own observations, comments on a ‘site visit record sheet’, see D4). This (rapporteur’s) report was a small but significant input to the final report compiled by the case study manager.
6.2.8 In addition to the site-specific case studies, six topic case studies were developed. The selection of topics was influenced by the results of the literature review and the surveys of current practice and passengers’ perception as well as by the Partners’ interests.
6.2.9 Table 6.2 lists the topic case studies. A leader was assigned to each case study as well as supporting Partners. The leader’s responsibilities were to:
• = assemble and collate necessary information; • = discuss issues of interest with his supporting team; and • = produce a paper on the case study.
Table Table Table Table 6666....2222 Topic Case StudiesTopic Case StudiesTopic Case StudiesTopic Case Studies
LeaderLeaderLeaderLeader TopicTopicTopicTopic IssuesIssuesIssuesIssues SupportSupportSupportSupport NS Funding fund raising , PPPs, retail facilities MVA,GMPTE,
LT,AM

6666 TheTheTheThe CaseCaseCaseCase StudiesStudiesStudiesStudies
GUIDE - Urban Interchanges - A Good Practice Guide Page 56
LeaderLeaderLeaderLeader TopicTopicTopicTopic IssuesIssuesIssuesIssues SupportSupportSupportSupport LT Evaluation economic, financial, other, network,
pedestrian modelling RATP, Centro, GMPTE
Centro
Network Strategy types of networks, ticketing, information, marketing, interchange strategy
MVA, LT
ENPC EPFL
Attitudes, Behaviour
passenger perceptions, priorities, methods for measuring,
MVA, LT
RATP Organisation, Operational Planning Management
ownership, relations between operators and interchange management, staff issues and attitudes
Centro, LT, MVA
GMPTE Small Uni-modal Interchanges
facilities at a small interchange (bus stop, train station)
AUTH, RATP, LT
6.36.36.36.3 Overview of Case Studies (Good and Bad Practice)Overview of Case Studies (Good and Bad Practice)Overview of Case Studies (Good and Bad Practice)Overview of Case Studies (Good and Bad Practice)
6.3.1 This section summarises examples of good and bad practice as observed and analysed by the appropriate case studies carried out by GUIDE Partners. Each case study is considered in turn. More information about the individual case studies and the different sites, briefly discussed below, can be found in deliverable D4: Report on Case Studies. For convenience the order of presentation of the case studies below is similar to D4 (structured according to groups such as major hubs, urban distributors purpose built, urban distributors not purpose built, planning new interchanges and topic case studies).
Gare duGare duGare duGare du Nord (Paris) Nord (Paris) Nord (Paris) Nord (Paris) 6.3.2 Gare du Nord is one of the six Parisian train stations. It is
situated in the middle of Paris, more precisely in the Xth district (arrondissement). It is a major regional and national hub in Paris serving a multitude of modes (e.g. rail, RER, Metro, bus, car) and operators (SNCF, RATP) with approximate half a million passengers a day (daily traffic using the interchange).
6.3.3 Gare du Nord is a good example of the application of a combined strategy (CŒUR Transport)strategy (CŒUR Transport)strategy (CŒUR Transport)strategy (CŒUR Transport) with RATP, SNCF and STP working together and linking the interchange space (location) with its surroundings. In addition, a better relationship is sought between RATP and SNCF and between operators and local authorities (see management committee). However, in individual discussions with local managers some evidence of lack of coordinationlack of coordinationlack of coordinationlack of coordination even between operators was still identified.
6.3.4 At the same time bearing in mind the size, traffic and complexity of the interchange, it was generally considered that it was efficiently and effectively catered for and from an operational point of view (passengers transferring) it appeared

6666 TheTheTheThe CaseCaseCaseCase StudiesStudiesStudiesStudies
GUIDE - Urban Interchanges - A Good Practice Guide Page 57
to work well. GUIDE Partners noted that in part this was due to familiarity by regular passengers as well as because of the management efforts by SNCF/RATP.
6.3.5 The number and range of passenger facilities such as cafes, kiosks, tourist offices etc, were thought to be good. Plenty of Plenty of Plenty of Plenty of information/direction signs were presented in French and information/direction signs were presented in French and information/direction signs were presented in French and information/direction signs were presented in French and English and included pictograms. English and included pictograms. English and included pictograms. English and included pictograms. The signs themselves were generally good but were sometimes lost amongst other visual clutter such as advertisements.
6.3.6 The good lighting levels, use of lighter coloured materials for flooring etc and general volume of pedestrian activity at the concourse level helped to give the upper levels of the interchange (SNCF) a secure feeling. Help points were not obvious. For some of the GUIDE Partners the armed police armed police armed police armed police presence presence presence presence seemed to add to the feeling of insecurity, for example people might think "what are they here for?" or "there must be trouble expected". Uniformed staff but not police would give a better impression (note here differences in attitudes between European countries). Metro/RER and bus stations (RATP) felt to be insecure areas: the metro station because of low ceilings and dark corridors etc, the bus station because of poor pedestrian links and generally untidy feel to the place. Although CCTV was in use it was not obvious, if it was so it might help to improve the feeling of a safe environment.
6.3.7 There were two areas of concern because of bad practice. It was universally felt that the bus station was of poor quality compared to the main rail station area. This related to most aspects of the interchange ranging from design (including quality of flooring, shelters, road surface etc) to information. There were some good features as well, such as the information desk with ticket machine.
6.3.8 The second main area of concern related to physical accessibility issues. If there were lifts these weren't obvious. There was also lack of dropped kerbs or rampThere was also lack of dropped kerbs or rampThere was also lack of dropped kerbs or rampThere was also lack of dropped kerbs or rampssss, which made access difficult for people with children in pushchairs as well as wheelchairs. Walk distances between Metro and main rail lines also appeared long and difficult.
Pireas (Athens)Pireas (Athens)Pireas (Athens)Pireas (Athens) 6.3.9 Pireas is, the main seaport of Athens, situated in the south-
west of the city of Athens. Today, ‘Pireas interchange’ is a major multi-mode transport node serving metro, rail, boats, buses and private cars with approximately 83,000 passengers using it each day.
6.3.10 Pireas interchange is a busy transport node, facing a number of problems that restrict its effectiveness. Completion of the
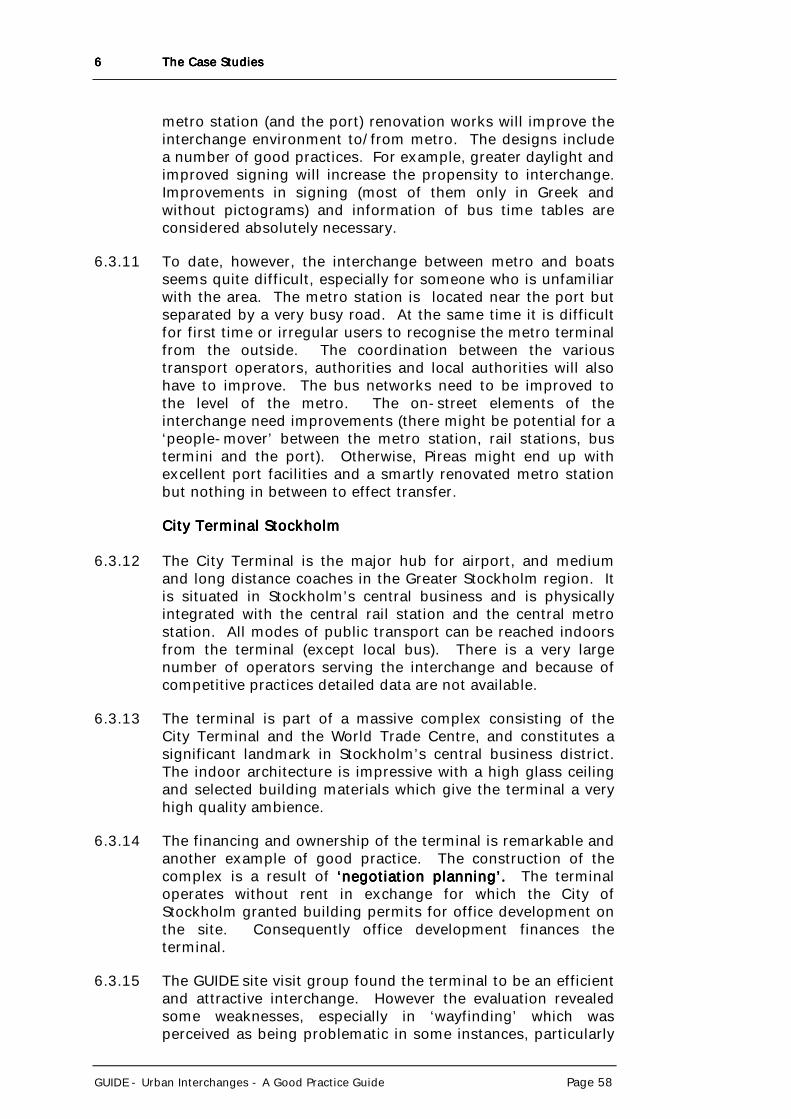
6666 TheTheTheThe CaseCaseCaseCase StudiesStudiesStudiesStudies
GUIDE - Urban Interchanges - A Good Practice Guide Page 58
metro station (and the port) renovation works will improve the interchange environment to/from metro. The designs include a number of good practices. For example, greater daylight and improved signing will increase the propensity to interchange. Improvements in signing (most of them only in Greek and without pictograms) and information of bus time tables are considered absolutely necessary.
6.3.11 To date, however, the interchange between metro and boats seems quite difficult, especially for someone who is unfamiliar with the area. The metro station is located near the port but separated by a very busy road. At the same time it is difficult for first time or irregular users to recognise the metro terminal from the outside. The coordination between the various transport operators, authorities and local authorities will also have to improve. The bus networks need to be improved to the level of the metro. The on-street elements of the interchange need improvements (there might be potential for a ‘people-mover’ between the metro station, rail stations, bus termini and the port). Otherwise, Pireas might end up with excellent port facilities and a smartly renovated metro station but nothing in between to effect transfer.
City Terminal StockholmCity Terminal StockholmCity Terminal StockholmCity Terminal Stockholm 6.3.12 The City Terminal is the major hub for airport, and medium
and long distance coaches in the Greater Stockholm region. It is situated in Stockholm’s central business and is physically integrated with the central rail station and the central metro station. All modes of public transport can be reached indoors from the terminal (except local bus). There is a very large number of operators serving the interchange and because of competitive practices detailed data are not available.
6.3.13 The terminal is part of a massive complex consisting of the City Terminal and the World Trade Centre, and constitutes a significant landmark in Stockholm’s central business district. The indoor architecture is impressive with a high glass ceiling and selected building materials which give the terminal a very high quality ambience.
6.3.14 The financing and ownership of the terminal is remarkable and another example of good practice. The construction of the complex is a result of ‘negot‘negot‘negot‘negotiation planning’.iation planning’.iation planning’.iation planning’. The terminal operates without rent in exchange for which the City of Stockholm granted building permits for office development on the site. Consequently office development finances the terminal.
6.3.15 The GUIDE site visit group found the terminal to be an efficient and attractive interchange. However the evaluation revealed some weaknesses, especially in ‘wayfinding’ which was perceived as being problematic in some instances, particularly

6666 TheTheTheThe CaseCaseCaseCase StudiesStudiesStudiesStudies
GUIDE - Urban Interchanges - A Good Practice Guide Page 59
to local bus services. A general view was that it is easier to find the railway terminal from other modes than vice versa. Some Partners felt that it was also difficult to follow the signage from the railway station to the metro station. On the other hand real time information is available including at bus departure gates.
Utrecht Central Station/Mainport (The Netherlands)Utrecht Central Station/Mainport (The Netherlands)Utrecht Central Station/Mainport (The Netherlands)Utrecht Central Station/Mainport (The Netherlands) 6.3.16 In the seventies a large re-development of the area around the
Utrecht central station took place, including shopping centre ‘Hoog Catharijne’, offices, apartments, car parks, etc. Integration of activities and other economic trends also meant a large increase in traffic for the interchange serving rail, bus, car, bicycle, etc. Currently a big project is under way: the Utrecht City-Centre Project (UCP) with main objectives to provide the city with a high quality centre and improve the entire transport system by developing the interchange into a Mainport.
6.3.17 As an example of good practice, in the newly planned Utrecht City Project the interchange itself was the starting point in the development of the whole area. This leads to a very compact location (short walking distances) and efficient transfer between the different modes. In addition, the evolution on interchange building in the Netherlands over the past 25 years has led to bright, secure stations, with a lot of daylight that gives passengers a sense of place and direction
6.3.18 In construction attention is paid to the development of retail development of retail development of retail development of retail and offices in and around the station which increase revenues and offices in and around the station which increase revenues and offices in and around the station which increase revenues and offices in and around the station which increase revenues but also improve the security imagebut also improve the security imagebut also improve the security imagebut also improve the security image in and around the interchange. Note that the design integrates access and egress modes within the interchange.
6.3.19 On the other hand to date there is evidence of bad practice. For example, the large number of bicycleslarge number of bicycleslarge number of bicycleslarge number of bicycles (common in the Netherlands) also often lead to parking problems. The entry to the Utrecht Central Station is at the moment hard to find for first time users, because it is fully integrated in (one might say cramped by) the shopping area above street level (despite the relatively good signage presented in Dutch and English and including pictograms). It was reported that on-street level people feel insecure. In addition, it appears dangerous to cross the heavily used roads. Finally, bus operations are currently inefficient.
Duivendrecht Station (TDuivendrecht Station (TDuivendrecht Station (TDuivendrecht Station (The Netherlands)he Netherlands)he Netherlands)he Netherlands) 6.3.20 Duivendrecht Interchange station is situated at the junction of
the Amsterdam-Utrecht and Schiphol-Weesp railway lines. Its construction in the late 1970s improved significantly the accessibility of Schiphol airport and RAI trade market. The

6666 TheTheTheThe CaseCaseCaseCase StudiesStudiesStudiesStudies
GUIDE - Urban Interchanges - A Good Practice Guide Page 60
station also accommodates two metro lines and a link line for freight traffic. A few bus routes connect the station with the surroundings and Amsterdam.
6.3.21 The most important example of good practice at Duivendrecht relates to layout and architectural features. Transparency, Transparency, Transparency, Transparency, maximum visibility across concourse, platforms and between maximum visibility across concourse, platforms and between maximum visibility across concourse, platforms and between maximum visibility across concourse, platforms and between levels and brightnesslevels and brightnesslevels and brightnesslevels and brightness (note also special building material that add to this) are the main characteristics of the interchange. As in other interchanges in The Netherlands, a lot of attention has been paid to daylight, the sense of place and direction, security and the ease to interchange. In addition, the interchange is very compact and all modes are closely integrated (rail, bus, car and bicycle). Signage is very well placed and presented in Dutch and English including pictograms (which again differs from other countries).
6.3.22 Unfortunately interchange between trains involves change to another level. It appears that first time users of the interchange and especially to and from the airport travellers find this rather unexpected.
Hammersmith (London)Hammersmith (London)Hammersmith (London)Hammersmith (London)
6.3.23 The Hammersmith interchange is located in Hammersmith town centre, West London. It is a major road and public transport node for Underground and car journeys between West London (including Heathrow airport) and Central London, and for car and bus journeys between North West and South West London via a river crossing at Hammersmith Bridge. The high level of accessibility offered by the public transport and road networks sustains the town centre’s role as a centre of strategic importance for shopping, employment and entertainment.
6.3.24 The interchange consists of three elements:
• = a modern purpose built interchange on three levels. All three levels are linked by lifts, staircases, and/or escalators. Cross platform interchange for the Piccadilly and District Lines is provided at subsurface level. Two London Underground ticket halls and the Broadway shopping centre are situated at street level, and a bus station is located directly above the shopping centre;
• = the Hammersmith and City line station located at street
level on a separate site 50 metres away; and
• = on-street bus stops. 6.3.25 Hammersmith is one of the busiest interchanges in outer
London. The District and Piccadilly line station has the second highest number of passenger entries/exits outside the central
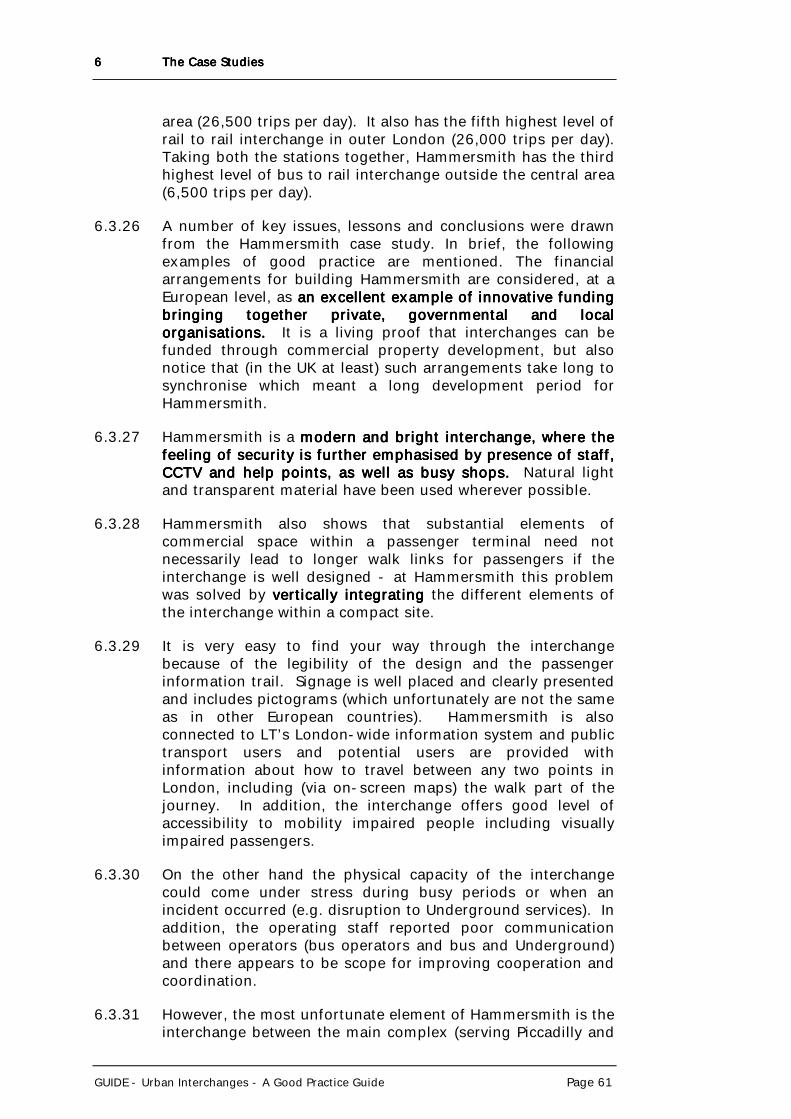
6666 TheTheTheThe CaseCaseCaseCase StudiesStudiesStudiesStudies
GUIDE - Urban Interchanges - A Good Practice Guide Page 61
area (26,500 trips per day). It also has the fifth highest level of rail to rail interchange in outer London (26,000 trips per day). Taking both the stations together, Hammersmith has the third highest level of bus to rail interchange outside the central area (6,500 trips per day).
6.3.26 A number of key issues, lessons and conclusions were drawn from the Hammersmith case study. In brief, the following examples of good practice are mentioned. The financial arrangements for building Hammersmith are considered, at a European level, as an excellent example of innovative funding an excellent example of innovative funding an excellent example of innovative funding an excellent example of innovative funding bringing together private, governmental and local bringing together private, governmental and local bringing together private, governmental and local bringing together private, governmental and local organisations.organisations.organisations.organisations. It is a living proof that interchanges can be funded through commercial property development, but also notice that (in the UK at least) such arrangements take long to synchronise which meant a long development period for Hammersmith.
6.3.27 Hammersmith is a modern and bright interchange, where the modern and bright interchange, where the modern and bright interchange, where the modern and bright interchange, where the feeling of securifeeling of securifeeling of securifeeling of security is further emphasised by presence of staff, ty is further emphasised by presence of staff, ty is further emphasised by presence of staff, ty is further emphasised by presence of staff, CCTV and help points, as well as busy shops. CCTV and help points, as well as busy shops. CCTV and help points, as well as busy shops. CCTV and help points, as well as busy shops. Natural light and transparent material have been used wherever possible.
6.3.28 Hammersmith also shows that substantial elements of commercial space within a passenger terminal need not necessarily lead to longer walk links for passengers if the interchange is well designed - at Hammersmith this problem was solved by vertically integratingvertically integratingvertically integratingvertically integrating the different elements of the interchange within a compact site.
6.3.29 It is very easy to find your way through the interchange because of the legibility of the design and the passenger information trail. Signage is well placed and clearly presented and includes pictograms (which unfortunately are not the same as in other European countries). Hammersmith is also connected to LT’s London-wide information system and public transport users and potential users are provided with information about how to travel between any two points in London, including (via on-screen maps) the walk part of the journey. In addition, the interchange offers good level of accessibility to mobility impaired people including visually impaired passengers.
6.3.30 On the other hand the physical capacity of the interchange could come under stress during busy periods or when an incident occurred (e.g. disruption to Underground services). In addition, the operating staff reported poor communication between operators (bus operators and bus and Underground) and there appears to be scope for improving cooperation and coordination.
6.3.31 However, the most unfortunate element of Hammersmith is the interchange between the main complex (serving Piccadilly and

6666 TheTheTheThe CaseCaseCaseCase StudiesStudiesStudiesStudies
GUIDE - Urban Interchanges - A Good Practice Guide Page 62
District lines of the Underground and the bus station) and the Hammersmith and City line station (Underground). The subway passage is either closed or not properly maintained for used and passengers have to negotiate with two pedestrian crossings at street level on a very busy road network.
La Défense (Paris)La Défense (Paris)La Défense (Paris)La Défense (Paris) 6.3.32 La Défense is situated at the west of Paris. The site is the first
business district in Europe and the second shopping centre in France. La Défense is a major part of Parisian economy with a remarkably high density of offices space. It attracts also a large number of tourists, because of numerous architectural monuments (among them the famous Grande Arche). Moreover La Défense is a real town where 30 000 inhabitants are living.
6.3.33 La Défense interchange includes train, metro, bus and tram services (as well as providing car parks and taxi ranks) and serves about 300,000 a day (about half of this traffic transfer at La Défense).
6.3.34 La Défense is being renovated under the programme CŒUR Transport (see also Gare du Nord) with main objectives: service development for transfer improvement, efficiency, safety, security, quality at the interchange space and implementation of a global management system.
6.3.35 The renovation project at La Défense has been successful in facing a few major challenges in developing partnerships and using existing infrastructure. The existing Partners include RATP, SNCF, STP, EPAD, Region District, etc. Management and organisational issues were commented upon favourably by the GUIDE Partners.
6.3.36 The Village servicesVillage servicesVillage servicesVillage services, is a particular good innovation at La Défense. It operates as a welcome space. Around a central information and ticket office (all public transport), it offers a wide variety of services. They include public services (post office, France Telecom, employment centre etc), a rest area (café) as well as special information about the economic activity in the area, entertainment, leisure and tourist companies etc.
6.3.37 The range of passenger facilities provided was seen as a very good feature of the interchange. Perhaps the only reservation only reservation only reservation only reservation was whether the shopping facilities would get in the way of was whether the shopping facilities would get in the way of was whether the shopping facilities would get in the way of was whether the shopping facilities would get in the way of its transport functionits transport functionits transport functionits transport function. It was suggested by the GUIDE Partners to move the shopping facilities to the side of the main concourse hall leaving the central area free for easier pedestrian movement.

6666 TheTheTheThe CaseCaseCaseCase StudiesStudiesStudiesStudies
GUIDE - Urban Interchanges - A Good Practice Guide Page 63
6.3.38 There were some concerns about the bus station split facilities which could be confusing. More importantly the underground underground underground underground nature of the bus station, combined with dark finishes make nature of the bus station, combined with dark finishes make nature of the bus station, combined with dark finishes make nature of the bus station, combined with dark finishes make the bus station areas very intimidating and threatening.the bus station areas very intimidating and threatening.the bus station areas very intimidating and threatening.the bus station areas very intimidating and threatening. Information at the bus station was poorer than the metro station.
6.3.39 Another area of concern related to accessibility features. It seemed that passengers with impaired mobility, wheelchairs or pushchairs, would find it difficult to transfer (for example, no passenger lifts are available to date between levels, but will be available by 2002). Equally more simple facilities such as dropped kerbs or ramps were missing. The long walk distances involved between modes could be a problem for all passengers.
Bury Interchange (Manchester)Bury Interchange (Manchester)Bury Interchange (Manchester)Bury Interchange (Manchester) 6.3.40 Bury Interchange is one of the best purpose built interchange
as part of Greater Manchester’s contributions to integrated passenger facilities. It currently has 10,000 bus departures a week, 1,000 tram departures and 135,000 bus and 57,000 tram passengers per week. Interchange passengers between modes are 20,000, the highest in Greater Manchester for any integrated facilities.
6.3.41 One of the good features of Bury is that it has been very well planned and integrated well to the town centre. A favourable impression was given of the enhanced CCTV facilities recently installed and the provision for continuing services after 1900 hours and Sundays.
6.3.42 On the other hand there is inadequate signing, lack of consistent information and at places lighting was sub-standard. It is not clear whether and how the UK bus deregulation affects or will affect network coordination and Bury interchange in particular.
Gullmarsplan (Stockholm)Gullmarsplan (Stockholm)Gullmarsplan (Stockholm)Gullmarsplan (Stockholm) 6.3.43 Gullmarsplan is a purpose built interchange facility situated
just outside the inner city of Stockholm. Approximately 94% of its peak hour passengers interchange between public transport modes, which is the highest percentage of interchanging passengers of all the GUIDE case studies. Over 70% of passengers interchange from local and regional bus services to the northbound metro line towards central Stockholm. The introduction of a light rail service at the end of this year will complement local bus, regional bus, a trunk line and metro services (note that car access is not catered for).
6.3.44 Despite the presence of staff in the information kiosks and in the ticket booths, the terminal could benefit from greater terminal could benefit from greater terminal could benefit from greater terminal could benefit from greater

6666 TheTheTheThe CaseCaseCaseCase StudiesStudiesStudiesStudies
GUIDE - Urban Interchanges - A Good Practice Guide Page 64
staff presence, particularly in the absence of CCTV (not used staff presence, particularly in the absence of CCTV (not used staff presence, particularly in the absence of CCTV (not used staff presence, particularly in the absence of CCTV (not used in Sweden).in Sweden).in Sweden).in Sweden). The interchange is fully accessible and appears to be well used by passengers with impaired mobility and small children and their parents/guardians.
6.3.45 Despite the fact that the interchange is a single operator interchange, the evaluation revealed some weaknesses in the interchange. Information trails were not consistent across all modes. Typefaces and colours were not consistent across all signage. There was no real time information. At the bus station information appeared to be poorer (than the metro station). It was difficult to find the departure stands and there was lack of information on fares. In addition, the ambience of the bus station was perceived to be poorer than that of the metro station: among other things, the dominant use of concrete in the bus station was viewed less favourably than the lighter materials used in the metro station.
Cradley Heath (Dudley, West Midlands)Cradley Heath (Dudley, West Midlands)Cradley Heath (Dudley, West Midlands)Cradley Heath (Dudley, West Midlands) 6.3.46 Cradley Heath is a small town in the borough of Dudley in the
West Midlands. The site is served by 29 bus routes and the Cradley Heath rail station. There is also a car park with 229 parking spaces. It is a small-scale interchange with a total of 755,000 ppa. The majority of the passengers use the train facilities (520,000 ppa).
6.3.47 Among the positive features of Cradley Heath were sheltered pedestrian facilities, efficient lighting and use of CCTV (which added to passenger security). Among the negative features were poor accessibility of the bus station, sometimes information was difficult to read and a reported feeling of insecurity at night.
Piccadilly Gardens (Manchester)Piccadilly Gardens (Manchester)Piccadilly Gardens (Manchester)Piccadilly Gardens (Manchester) 6.3.48 There are 17 bus stands in Piccadilly Gardens used by more
than 100 services. The number of bus departures exceeds 25,000 per week and the estimated number of bus passengers is 225,000 per week (more than 11 million per year). Since the opening of Greater Manchester’s Light Rapid Transit system (Metrolink) in 1992, Piccadilly Gardens has been able to provide good opportunities for interchange between light rail and bus.
6.3.49 One of the key issues at this interchange is how to improve passenger facilities without reducing the quality potential of the open space of the gardens. Suggestions to improve the situation included more extensive pedestrianisation, better use of green space and greater traffic restraint. The lack of real time information is a disadvantage at the interchange but the printed timetables are plentiful (provided at the Travel Shop) and easy to read.

6666 TheTheTheThe CaseCaseCaseCase StudiesStudiesStudiesStudies
GUIDE - Urban Interchanges - A Good Practice Guide Page 65
6.3.50 Piccadilly Gardens reflects the intrinsic issues associated with a deregulated transport industryderegulated transport industryderegulated transport industryderegulated transport industry. These include coordination procedures and the roles and responsibilities of GMPTE and operators in relation to interchange space ownership, passenger information provision, operational matters and staffing.
Five Ways (Birmingham)Five Ways (Birmingham)Five Ways (Birmingham)Five Ways (Birmingham) 6.3.51 Five Ways is a satellite office centre to Birmingham City Centre.
The site is served by 27 bus routes and the Five Ways rail station. It is a rather small scale interchange with daily passenger numbers of 13,500 (4,92 mppa). The vast majority of passengers use the bus facilities (4 mppa).
6.3.526.3.526.3.526.3.52 There is plenty of evidence of bad practice at Five Ways relating to lack of adequate information, security melack of adequate information, security melack of adequate information, security melack of adequate information, security measures, asures, asures, asures, poor bus stop environmentpoor bus stop environmentpoor bus stop environmentpoor bus stop environment and lack of facilities for the and lack of facilities for the and lack of facilities for the and lack of facilities for the disabled.disabled.disabled.disabled.
6.3.53 The provision of information is heterogeneous, and sometimes inaccurate or even misleading. Reliable information can be obtained by Centro’s “hotline” but it is not clear at the site what “hotline” is and what services it provides.
6.3.54 The site did not incorporate any special security features (e.g. CCTV). There was a variety of bus shelters, but not all bus stops had one. No other facilities were available. There was no provision for people with impaired mobility, or carrying children in pushchairs. The kerbs were not always suitable for low floor buses, whereas the lifts that existed in the rail station did not look in very good condition. The long walk distances between bus stops could be a problem for all passengers.
Canning Town (London)Canning Town (London)Canning Town (London)Canning Town (London) 6.3.55 Canning Town is located at the western end of the former
Royal Docks area, in the East End of London. Canning Town station is currently served by the Docklands Light Railway and the North London Line. The future interchange will also be served by the Jubilee line is due to open in stages and commence full operation by the end of this year. In addition a new bus station is being built to the east of the railway station. Once the new facilities are open, Canning Town will become one of London’s best connected multi modal interchanges. It is estimated that 10,500 passengers will use the Canning Town interchange in the morning peak hour on completion of all development. It is also estimated that two thirds of morning peak hour passengers will interchange within the railway station complex, with the remaining third arriving by bus, on foot or by other modes.

6666 TheTheTheThe CaseCaseCaseCase StudiesStudiesStudiesStudies
GUIDE - Urban Interchanges - A Good Practice Guide Page 66
6.3.56 Since the interchange complex is nearly complete (though not yet operational) a number of observations could be made. Passenger facilities such as signage, and ticket machines were found to be well located and easy to understand. The terminal offers good accessibility, including accessibility for mobility impaired passengers. CCTV in the railway station and bus station, ‘help points’ in the railway station, together with the visible location of the railway station control room created a sense of secure environment.
6.3.57 Commercial facilities are well located,Commercial facilities are well located,Commercial facilities are well located,Commercial facilities are well located, ie along pedestrian desire lines although not where they will impede the flow of passengers, furthermore there was perceived to be an absence be an absence be an absence be an absence of visual clutterof visual clutterof visual clutterof visual clutter created by the introduction of these facilities into the station. The design of the railway station ticket office with its large windows would encourage communication between passengers and staff. Automatic doors in the bus station that open only when a bus arrives were thought to be conducive to passenger comfort and safety.
6.3.58 On the other hand, a large concrete barrier shields the bus station from the railway tracks. While the need to provide crash protection for buses operating close to the railway and to insulate surrounding areas from noise was acknowledged, it was felt that a lighter material could have been used to a lighter material could have been used to a lighter material could have been used to a lighter material could have been used to provide bettprovide bettprovide bettprovide better sight lines between the railway platforms and er sight lines between the railway platforms and er sight lines between the railway platforms and er sight lines between the railway platforms and the bus station.the bus station.the bus station.the bus station.
6.3.59 While some of the aesthetic elements of the station were well received (e.g. the extensive use of glass and the incorporation extensive use of glass and the incorporation extensive use of glass and the incorporation extensive use of glass and the incorporation of natural daylightof natural daylightof natural daylightof natural daylight into the station ticket hall) there were concerns about the use of unadorned concrete (among the GUIDE Partners).
6.3.60 In discussion with LT two reasons were given for the above. The overall design concept for the Jubilee Line Extension stations is to keep finishes simple by leaving the civil engineering work exposed wherever possible - the architects have termed this ‘undecorating’ the stations. In addition, the rhythm of the architecture of the interchange reflects the amount of time that people will spend at each of its elements - passengers changing between high frequency rail services will care little for aesthetics, or ‘sense of place’. These factors are much more likely to come into play in those parts of the interchange where people spend time waiting, or where the interchange interfaces with its environs. At Canning Town, the architects have sought to establish a ‘sense of place’ through the inclusion of an artwork in the station ticket hall that refers to the local area’s history as an important location for ship building.
6.3.61 In addition, the provision of passenger facilities such as toilets, baby-changing facilities and commercial facilities also reflects

6666 TheTheTheThe CaseCaseCaseCase StudiesStudiesStudiesStudies
GUIDE - Urban Interchanges - A Good Practice Guide Page 67
the manner in which the different parts of the interchange will be used. These facilities have been situated at locations in the interchange where passengers are more likely to spend time rather than simply pass through.
6.3.62 The British planning system is often criticised for being slow and unwieldy. The need to ensure that objectors to a proposal can make their views heard is often cited as a major cause of delay. However, in the case of Canning Town the London Borough of Newham was able to achieve changes to the routes of the Docklands Light Railway and influence the location of the Jubilee line station, enabling the highly integrated interchange that is due to open shortly.
6.3.63 Canning Town interchange is another example of multimultimultimulti----operator/agency ownership.operator/agency ownership.operator/agency ownership.operator/agency ownership. The station will be partly owned by London Underground, London Transport Buses and Railtrack, the private company that owns the national rail network infrastructure. Railtrack lease the North London Line part of the station to the private operator Silverlink. London Underground will be the main operator of the interchange with overall responsibility for safety with London Transport Buses and London Underground personnel staffing the interchange. However, the interchange will also be served by private bus operators, the private train operating company Silverlink, and the Docklands Light Railway and they will own some of the facilities. The London Borough of Newham, and Government agencies such as the Traffic Director for London are also concerned with pedestrian and bus access to the interchange. Detailed agreements are being drawn up to ensure that were there is an interface between the services provided by different operators, this interface is properly managed. However, there is no single overarching agreement that applies to all the stakeholders in the interchange. A London-wide Code of Practice on Intermodal Interchange is in preparation, although conformity with this code will be voluntary.
Ethniki Amyna (Athens)Ethniki Amyna (Athens)Ethniki Amyna (Athens)Ethniki Amyna (Athens) 6.3.64 ‘ETHNIKI AMYNA’ Transfer Station, situated on line three of the
Athens metro system (under construction), is one of the eight transfer stations planned by ‘ATTIKO METRO SA’. The site will serve metro, buses, taxis and private cars. Some 17 urban bus services will transfer their existing terminals from Athens city centre to the station, while a total of 1,000 parking spaces will be provided to encourage park and ride and reduce central area congestion. It is anticipated that just over 6,000 passengers will board trains at Ethniki Amyna during peak hour. Of these, two-thirds will transfer from buses and 7% from park and ride. Because the surrounding area includes a significant offices development, over 3,400 people are

6666 TheTheTheThe CaseCaseCaseCase StudiesStudiesStudiesStudies
GUIDE - Urban Interchanges - A Good Practice Guide Page 68
expected to egress the metro station during the morning peak hour.
6.3.65 The station is designed to be spacious and accessible and its modern features (escalators, lifts, ramps, etc) are quite an improvement compared to the existing system and should help to change people’s attitude to public transport. It will be fitted out with CCTV, modern information systems, clear signage, information office as well as small scale retail shops. However, the effectiveness of the design features and policies on the potential for transfer will have to proven when the interchange becomes fully operational sometime in the year 2000 (the metro lines and metro station will be in operation at the end of 1999 but dates for the bus station and car parks have not been specified yet).
Case Study On Small InterchangesCase Study On Small InterchangesCase Study On Small InterchangesCase Study On Small Interchanges 6.3.66 This case study considered the most basic of public transport
interchange usually involving the first point of access to the public transport system, ie the simple bus stop. Whilst bus priority measures to improve bus speed and reliability have been used for a number of years and the quality of buses has also been developed (e.g. low floor, low emission buses), the on-street waiting area has been rather neglected.
6.3.67 The case study examined a number of bus stops in Greater Manchester, Birmingham and London, Thessaloniki in Greece, Paris in France and other European cities and identified good and bad practice and ways of improving facilities for passengers. In addition the case study developed a methodology for determining bus stop grades (four grades were proposed) and contributed to a programme of upgrading bus stop facilities in Greater Manchester (work carried out by GMPTE). Note that GMPTE will monitor the Manchester programme of improvements to evaluate the impact of investment on patronage.
6.3.68 Among the long list of desirable features drawn from passenger surveys the following prominent groups were identified: basic design for protection and lighting, passenger basic design for protection and lighting, passenger basic design for protection and lighting, passenger basic design for protection and lighting, passenger information, passeninformation, passeninformation, passeninformation, passenger convenience facilities, safety, ger convenience facilities, safety, ger convenience facilities, safety, ger convenience facilities, safety, security, measures to aid physical mobility and measures to security, measures to aid physical mobility and measures to security, measures to aid physical mobility and measures to security, measures to aid physical mobility and measures to aid vehicular access.aid vehicular access.aid vehicular access.aid vehicular access. There is variable level of provision of the above features in the cities studied. For example in Manchester (on particular corridors which were audited), 51% of the stops had seating and lighting, 91% had measures to prevent parked cars, but 25% of the bus stops had kerb face below 80mm and 78% lacked timetable information.
6.3.69 All bus stops examined in Thessaloniki lacked specific facilities for people with special needs, but otherwise, they had extensive facilities, including: bus stop flag with branding,

6666 TheTheTheThe CaseCaseCaseCase StudiesStudiesStudiesStudies
GUIDE - Urban Interchanges - A Good Practice Guide Page 69
stop name and service numbers, illuminated enclosed shelter, printed information with routes and destinations, local information and display of surrounding facilities, seating, litter bin, public telephone, etc.
6.3.70 Bus stop markings or clearway orders used and legislated in the UK were identified as good practice to aid vehicular access. Good quality shelters with integral seating and lighting Good quality shelters with integral seating and lighting Good quality shelters with integral seating and lighting Good quality shelters with integral seating and lighting and and and and with tactile paving surfacewith tactile paving surfacewith tactile paving surfacewith tactile paving surface were identified in Birmingham. In Paris, a number of tram and bus stops were identified as very good examples of well designed facilities incorporating information displays, ticket machines and help points together with integral seating and good levels of lighting. Finally, note that some cities (e.g. Hanover) have experimented with using the bus shelter as an urban art feature and in 1992 nine bus and tram stops were constructed in a variety of architectural (artistic) styles at the total cost of DM 1.5 million.
Case Study on Network StrategyCase Study on Network StrategyCase Study on Network StrategyCase Study on Network Strategy 6.3.71 This case study focused on theory and:
• = identified the theoretical implications of removing the penalty to interchange;
• = identified the theoretical implications of using multi-trip
multi-mode tickets; • = investigated initiatives adopted to reduce the barrier to
interchange raised by fares and ticketing policies; and • = identified the role played by interchange in the planning
of the network strategies of operators.
6.3.72 The work included computer simulation using the VIPS model developed and maintained by the Transport Planning Team within Centro (West Midlands Passenger Transport Executive). A number of public transport assignments were carried out on the base network using different assumptions about fares, ticketing and interchange penalties. The modelling exercise has demonstrated the benefits to be gained from removing the penalty incurred in paying separate fares for each leg of the journey and improving interchange (see discussion in Part 1 of this report).
6.3.73 Other findings and conclusions from the case study on Network strategy are briefly summarised below.
Network Integration/Co-ordination
6.3.74 The effectiveness of a given public transport network as a competitor to the private car is significantly affected by the quality of interchange. Equally, if the quality of the

6666 TheTheTheThe CaseCaseCaseCase StudiesStudiesStudiesStudies
GUIDE - Urban Interchanges - A Good Practice Guide Page 70
interchange experience can be significantly improved, then it is possible to create a more integrated network, with a greater level of interchange, while not sacrificing overall public transport quality.
6.3.75 There is very little literature on network integration benefits. What is known is that the lack of integration can create poorer quality public transport. At the same time ‘integration’ is a contested issue both in terms of how it is defined and how it can be achieved. For example, ‘The break-up of the London rail and bus network has created a loss of integration between various operators…’.(The Seamless Public Transport Journey, London Docklands Development Corporation [242]). It was claimed that this loss of integration affected the following areas; information; interchanges; network; ticketing and fares.
Fares & Ticketing
6.3.76 Policies will have a significant impact on the use made of interchanges within the public transport network, and the relationships between the different services, operators and modes which are involved. There is not much literature on this subject with the notable exception of some work to evaluate the potential for multi-modal tickets.
Modal transfer, propensity, park and ride
6.3.77 At a strategic level, the quality of interchange is essential to encourage greater public transport use, including interchange between car and public transport, i.e. Park and Ride. Some interchanges have integrated park and ride and, in some cases, like Transferium in Amsterdam area, the price for parking includes the metro ticket.
6.3.78 Specific work has been carried out on evaluating optimal location and fares for park and ride. However, even if park and ride facilities are important and their development has to be continued and amplified, other means must be applied to dissuade car users if European cities are to achieve a significant transfer between car and public transport. This is especially true when the travel time ratio is in favour of the car (Travel Time: A Relative Notion, Dutch Railways [300]) which is often the case.
Public Transport Integration
6.3.79 Evidence on timetable and service information provided by transport organisations varied between and within countries. For example:
• = timetables are co-ordinated by a committee in Copenhagen and a common timetable for all modes is issued twice a year;

6666 TheTheTheThe CaseCaseCaseCase StudiesStudiesStudiesStudies
GUIDE - Urban Interchanges - A Good Practice Guide Page 71
• = there are arrangements for integrating timetables of
different modes/operators in the Netherlands; • = there are no arrangements for integrating timetables of
different modes/operators in Greece, Barcelona and Uppsala, Sweden;
• = in the United Kingdom (UK) outside London there is
limited publication of bus services in rail timetables; • = in the UK all mode maps are published and central
telephone enquiry bureaux operate in many cities; • = information is provided to the public through a telephone
‘helpline’ in Utrecht and Birmingham; • = in Munich there are maps across the network and
electronic timetables; • = in London the underground journey planner shows
interchanges between underground and surface rail, and bus maps show bus and rail interchanges.
Identification of feeder services and interchanges:
• = interchange locations are explicitly identified and advertised in Lyon, Paris & Toulouse, France;
• = feeder services and interchange locations are explicitly
identified and advertised in Munich, Amsterdam, Thessaloniki, and Geneva;
• = in the UK some bus services are advertised on trains and
on the local network plan; • = in Merseyside, UK feeder services are explicitly identified
and advertised and interchange locations are to some degree;
• = in Lausanne and Edinburgh feeder services are explicitly
identified and advertised, but interchange locations are not;
• = in Greater Manchester feeder services are not explicitly
identified and advertised, but interchange locations are; • = no branded feeder services exist in London at present; • = in West Yorkshire feeder services are explicitly identified
and advertised, but there are very few. Interchange locations are explicitly identified and advertised;

6666 TheTheTheThe CaseCaseCaseCase StudiesStudiesStudiesStudies
GUIDE - Urban Interchanges - A Good Practice Guide Page 72
• = in Geneva the timetables are not specifically co-
ordinated, but the frequencies are high, and all the train system is on ‘cadence timetable’, which means that trains arrive and leave at the same minutes past every hour.
Network branding – evidence mainly from UK.
• = in Manchester GMPTE logos are present on all bus stops, at bus stations and rail stations;
• = in Birmingham the Centro logo is displayed at rail/bus
stations and on bus stops; • = in London a new corporate symbol has been adopted to
emphasise the integration of the network and is used on advertising and publicity material; it consists of the underground and bus roundels and the phrase ‘Making London Simple’.

6666 TheTheTheThe CaseCaseCaseCase StudiesStudiesStudiesStudies
GUIDE - Urban Interchanges - A Good Practice Guide Page 73 Page 73
Table Table Table Table 6666....3333 Summary of Availability of MultiSummary of Availability of MultiSummary of Availability of MultiSummary of Availability of Multi----stage and Multistage and Multistage and Multistage and Multi----operator Tickets.operator Tickets.operator Tickets.operator Tickets.
TicketingTicketingTicketingTicketing Single stage onlySingle stage onlySingle stage onlySingle stage only MultiMultiMultiMulti----stage same operatorstage same operatorstage same operatorstage same operator MultiMultiMultiMulti----operatoroperatoroperatoroperator MultiMultiMultiMulti----modemodemodemode Single ticket Single ticket Single ticket Single ticket Paris Lyon Copenhagen Copenhagen or carnetor carnetor carnetor carnet Athens Paris (without bus) Paris (bus) Lyon Thessaloniki Toulouse Munich Paris (but never bus) Amsterdam Athens (local-trunk bus routes) Utrecht Toulouse Utrecht Amsterdam Madrid Munich (all PT modes) Barcelona Utrecht Greater Manchester (carnet: conc only) Amsterdam Madrid Madrid Merseyside Utrecht Uppsala Uppsala South Yorkshire Madrid Geneva Geneva Tyne & Wear Merseyside (bus, rail & ferry) Lausanne Lausanne South Yorkshire (tram & bus) Birmingham/West
Midlands Birmingham/West Midlands Tyne & Wear
Edinburgh Edinburgh Greater Manchester Greater Manchester (very limited) London (LUL only) London (LUL only) Merseyside Merseyside South Yorkshire South Yorkshire Tyne & Wear Tyne & Wear West Yorkshire West Yorkshire Travel card Travel card Travel card Travel card Paris
Lyon Copenhagen Copenhagen
or period ticketor period ticketor period ticketor period ticket Thessaloniki Paris Paris Lyon Amsterdam Toulouse Munich Paris Barcelona Athens Athens Toulouse Uppsala Amsterdam Utrecht Munich (all PT modes) Birmingham/West
Midlands Utrecht Barcelona Amsterdam
Edinburgh (rail only) Barcelona Madrid Utrecht Greater Manchester Madrid Geneva Barcelona Merseyside Uppsala Lausanne Madrid South Yorkshire Lausanne Birmingham/West Midlands Geneva Tyne & Wear Birmingham/West Midlands Greater Manchester Lausanne (bus & rail) Thessaloniki Edinburgh London (DLR, bus, LUL, surface rail) Birmingham/West Midlands (bus, rail &
metro) Uppsala Greater Manchester Merseyside Greater Manchester (bus, rail & Metrolink) Geneva London (DLR, bus, LUL, surface rail) South Yorkshire London (DLR, bus, LUL, surface rail) Tyne & Wear Merseyside Tyne & Wear Merseyside (bus, rail & ferry) South Yorkshire West Yorkshire South Yorkshire (tram, rail & bus) Tyne & Wear Tyne & Wear West Yorkshire West Yorkshire (rail & bus) Store value fare Store value fare Store value fare Store value fare ccccardardardard
Toulouse Copenhagen Copenhagen
Uppsala Munich Munich (all PT modes)

6666 TheTheTheThe CaseCaseCaseCase StudiesStudiesStudiesStudies
GUIDE - Urban Interchanges - A Good Practice Guide Page 74 Page 74
Geneva Edinburgh Tyne & Wear

6666 TheTheTheThe CaseCaseCaseCase StudiesStudiesStudiesStudies
GUIDE - Urban Interchanges - A Good Practice Guide Page 75
Findings by Type of Interchange 6.3.80 The findings for major hubs were:
• = propensity to interchange was hindered by poor signage, lack of information, lack of through ticketing and long distances between modes;
• = long walk distances can be mitigated by good signage
and accessibility; • = attractiveness of stations and surroundings is another
important influence; • = following the Netherlands visit a Partner noted that good
propensity to interchange requires all the following factors:
- excellent marketing; - close linkages with transport operators; - high quality security systems; - a feeling that this is a good way forward which
appealed to public opinion
• = all major hubs demonstrated high multi-modality, albeit on several levels within the interchange;
• = in the Netherlands multi-modality has been increased to
include car in a scheme whereby people can secure cheap car hire if they have a public transport season ticket and borrow from a pool of cars located around Utrecht station.
6.3.81 The findings for Purpose Built Interchanges were:
• = in the UK bus deregulation has settled down and the desire to link and develop networks between modes should result in better co-ordination of timings;
• = propensity to interchange was generally high as terminals
functioned well as intermodal interchanges; • = connections between modes were inconsistent e.g. at La
Défense bus-train connections are less attractive than rail-rail ones, interchange between bus and rail dominated at Gullmarsplan and Cradley Heath functions mainly as a rail park and ride site.
6.3.82 The findings for Not-Purpose Built Interchanges were:
• = long walks between bus stops reduced the propensity to interchange;

6666 TheTheTheThe CaseCaseCaseCase StudiesStudiesStudiesStudies
GUIDE - Urban Interchanges - A Good Practice Guide Page 76
• = lack of information will discourage occasional users
whereas regular users become used to the interchange process;
• = the city centre site (Piccadilly Gardens) was better organised than the non-central site (Five Ways);
• = theoretical modelling suggests that removing the
interchange penalty and/or increasing usage of multi-trip multi-modal tickets shifts interchange out of centres to suburban locations where arterial and orbital routes intersect.
6.3.83 The findings for Planning of New Interchanges were:
• = close co-operation with the bus service operator to use bus as a feeder into the station rather than ‘just passing’ in an integrated system will raise the propensity to interchange;
• = likewise the development of park and ride creates
propensity to interchange for car drivers.
Case Study on Attitudes and BehaviourCase Study on Attitudes and BehaviourCase Study on Attitudes and BehaviourCase Study on Attitudes and Behaviour 6.3.84 This case study included three main tasks. The first one
involved a review of the methodology and techniques used in measuring attitudes and behaviour of interchange users. This included both qualitative and quantitative techniques and how they complement each other. The second task involved qualitative surveys at five interchanges in Toulouse and Lyon. An extensive summary of these parts of the case study was presented in deliverable 4 (D4: Report on Case Studies, section 3.8).
6.3.85 The third task within this case study included a survey of eight interchanges and their users in two French speaking (Geneva and Lausanne) and two German speaking (Basel and Bern) cities in Switzerland. The methodology used in the French surveys of the perceptions of interchange users (fully documented in Volume 2 of D3: Surveys of Passengers’ Perceptions) was further developed and applied to the circumstances of the Swiss cities.
6.3.86 In this section we briefly report the findings of the Swiss surveys. For more information the reader should directly contact the GUIDE Partners managing this case study (ENPC and EPFL). The case study used three different survey tools:
• = contextual analysis; • = on-site surveys of people transferring between modes; • = in-depth interviews.

6666 TheTheTheThe CaseCaseCaseCase StudiesStudiesStudiesStudies
GUIDE - Urban Interchanges - A Good Practice Guide Page 77
Contextual Analysis of the Swiss Interchanges
6.3.87 This consisted of a detailed description of the physical structure, architecture and equipment inside the interchanges as well as transfer statistics of passengers by different modes. The following interchanges were analysed:
• = Basel HB, of international importance; • = Dornach-Arlesheim, small suburban interchange (tram,
train, bus, P&R); • = Bern HB, very large (train, bus); • = Zollikofen, small suburban; • = Geneva-Cornavin, very complex (local, regional and
international rail); • = Moillesulaz (Geneva), near the French border (tram and
bus); • = Lausanne Flon-St Franχois (metro and bus); • = Renens (Canton of Vaud) (metro, rail and bus).
6.3.88 The sampling process for the interchange locations led deliberately to a large variety of characteristics with transfer points ranging from Bern HB (with 1400 train and 4000 bus and tram departures daily) to very small interchanges near the French-Swiss border (Moillesulaz-Geneva). All interchanges though shared a common objective: to enable efficient and comfortable transfer of people between transport modes. From that point of view small interchanges may have the advantage of being compact and easy to use.
6.3.89 The larger interchanges also suffered from underdevelopment and lack of renovation (with the exception of Bern HB). They also had, comparatively, more complex corridors with difficult to understand signage. However, in some cases these spaces were well equipped with shops, vending machines, retail, etc, which appear to have taken over the primary role of the interchange (from transfer).
On-Site Surveys of People Transferring at Swiss Interchanges 6.3.90 A total of 600 questionnaires were completed, spread among
the eight sites (slightly biased towards the larger interchanges). The questionnaires were designed to be completed on-site and apart from the respondents’ and journey characteristics, they addressed people’s expectations

6666 TheTheTheThe CaseCaseCaseCase StudiesStudiesStudiesStudies
GUIDE - Urban Interchanges - A Good Practice Guide Page 78
with respect to interchange facilities, the passageways, availability of services and overall image.
6.3.91 It was found out that there are great differences in people’s It was found out that there are great differences in people’s It was found out that there are great differences in people’s It was found out that there are great differences in people’s expectations depending on time, travel distance and trip expectations depending on time, travel distance and trip expectations depending on time, travel distance and trip expectations depending on time, travel distance and trip purpose.purpose.purpose.purpose. The majority of intra-city travellers were aware of the characteristics of the interchange place, its design, functions, etc. For people who had to wait significant time before transfer two types of behaviour were recognised: passive and active. The occurrence of one or the other type of behaviour was site related (e.g. reliable services and the presence of a coffee shop promote active behaviour), but also depended on personal characteristics.
6.3.92 Among inter-city travellers, only a small proportion were aware of the services at the interchange.aware of the services at the interchange.aware of the services at the interchange.aware of the services at the interchange. For those very fast connections were not important, undoubtedly because they allow extra time between connections in their scheduling.
6.3.93 In general, the perception of time spent at an interchange perception of time spent at an interchange perception of time spent at an interchange perception of time spent at an interchange appears to depend on both the characteristics of the place appears to depend on both the characteristics of the place appears to depend on both the characteristics of the place appears to depend on both the characteristics of the place (and the suitability and image of the available services) and (and the suitability and image of the available services) and (and the suitability and image of the available services) and (and the suitability and image of the available services) and the characteristhe characteristhe characteristhe characteristics of the users.tics of the users.tics of the users.tics of the users. In particular, it appears that type of travel relating to distance is instrumental in distinguishing important factors at an interchange. For example, for intra-city travellers reliable transport services, other services offered at the interchange and the use of time appear to be most important. For the inter-city travellers scheduling and the use of time are most important.
In-Depth Interviews of People Transferring at Swiss Interchanges 6.3.94 A small sub-sample from the 600 respondents were to
participate in a longer, in-depth interview with the objective to identify the role of transfer and interchange location in people’s activities and planning of travel. About 30 interviews (45-60 minutes long) were carried out. The interviews were analysed by means of qualitative techniques and a number of behavioural roles were identified such as: active planning, passive endurance, open-up to opportunities, etc.
6.3.95 A general finding was that the suitability and success of an suitability and success of an suitability and success of an suitability and success of an interchange equally depeinterchange equally depeinterchange equally depeinterchange equally depends on the characteristics of the nds on the characteristics of the nds on the characteristics of the nds on the characteristics of the people using it and on its own characteristics.people using it and on its own characteristics.people using it and on its own characteristics.people using it and on its own characteristics. It appears that people who often transfer between modes of transport tend to plan their travel more than others. It also appears that improving the design and services at interchanges is not sufficient to increase their use. The attractiveness of transfer seems to depend most on the way in which mobility is integrated into the planned activities of the population.
Case Study on Organisation and ManagementCase Study on Organisation and ManagementCase Study on Organisation and ManagementCase Study on Organisation and Management

6666 TheTheTheThe CaseCaseCaseCase StudiesStudiesStudiesStudies
GUIDE - Urban Interchanges - A Good Practice Guide Page 79
6.3.96 For this case study three major hubs serving three or more
modes run by various operators, were examined:
• = Gare du Nord (Paris, France); • = Utrecht Central Station (in The Netherlands); and • = Waterloo Station (London, UK).
6.3.97 In addition, discussions were carried out with local staff during
the site visits at La Défense (Paris), Hammersmith Station (and Victoria Station in London) and City Terminal (in Stockholm).
6.3.98 The investigation drew from two different sources : interchange data and in-depth interviews with station managers and key local staff. The issues under investigation included:
• = operators involved : and type (bus, train, underground, taxi etc);
• = coordination between operators (how it works if it does?); • = staff organisation (by operator : per line or per site,
schedules); • = duties of the local staff (passenger information, security,
etc); • = local manager(s) and responsibilities (transport
operation, public space management, maintenance level).
6.3.99 The responsibilities of local mangers have been examined under two points of view:
• = independence both in terms of staff management and budget;
• = relations with other transport operators departments
(commercial, maintenance, information, etc). 6.3.100 It appears from our analysis that, though there are major
differences across Europe, organisation and management of major interchanges suffer from a common problem. In D2 (literature review) this was termed the ‘frontier question’. It includes the friction and complex relations encountered at the frontiers between:
• = transport and the city; • = private and public sector; • = operations and infrastructure; • = ownership and management of the interchange
(space/location).
6.3.101 Some major operators consider the separation of management of transport operations from the management of the interchange (e.g. RATP). This was termed in D2 the ‘airport model’. However, there are a lot of variations of this model

6666 TheTheTheThe CaseCaseCaseCase StudiesStudiesStudiesStudies
GUIDE - Urban Interchanges - A Good Practice Guide Page 80
because of differences (across Europe) in infrastructure ownership, maintenance and staff practices and regulations.
Case Study on EvaluationCase Study on EvaluationCase Study on EvaluationCase Study on Evaluation 6.3.102 The GUIDE study (see D4: Report on Case Studies, section
3.10) has defined good practice in the evaluation of interchanges as ensuring that project investment reflects stakeholder priorities. Stakeholders include those groups that are directly involved in the decision making process ie politicians, operators, and planners. However, ultimately the purpose of these projects is to change passenger behaviour and attitudes, and it is therefore vital that evaluation procedures also take account of these factors.
6.3.103 Traditionally, passenger Traditionally, passenger Traditionally, passenger Traditionally, passenger responses to interchange have been responses to interchange have been responses to interchange have been responses to interchange have been represented solely as time savings, and changes in journey represented solely as time savings, and changes in journey represented solely as time savings, and changes in journey represented solely as time savings, and changes in journey quality and ambience (sometimes described as ‘soft’ factors) quality and ambience (sometimes described as ‘soft’ factors) quality and ambience (sometimes described as ‘soft’ factors) quality and ambience (sometimes described as ‘soft’ factors) have not explicitly been included.have not explicitly been included.have not explicitly been included.have not explicitly been included. This has meant that interchange improvements may be given a low level of priority relative to other objectives because the benefits of these improvements have not been fully captured. In Paris and London, stated preference techniques have been used to quantify the importance (to passengers) of all types of interchange improvement (‘soft’ and ‘hard’). For example, in London, ambience and journey quality factors have been ambience and journey quality factors have been ambience and journey quality factors have been ambience and journey quality factors have been monetised, and incorporated within project appraisal.monetised, and incorporated within project appraisal.monetised, and incorporated within project appraisal.monetised, and incorporated within project appraisal.
6.3.104 Frequently, interchange projects are by their very nature partnership projects. Often the Partners have very different objectives and this is likely to be reflected in the evaluation procedures that are used by the different Partners. This may act as a barrier to the implementation of interchange projects, although the GUIDE case studies demonstrated different approaches to unlocking this problem.
Case Study on FundingCase Study on FundingCase Study on FundingCase Study on Funding 6.3.105 The GUIDE case study concluded that funding interchanges is a
complex matter. Complex, because on one hand an interchange is a transfer activity and on the other hand it is a location which attracts private commercial activities. This special setting leads to the involvement of many different Partners with different objectives in the (re)development of an interchange which sometimes contradict each other.
6.3.106 For the transfer part of interchange, special subsidies are available. Platforms, escalators, elevators and passageways are financed by the users, the operators and the government. The station as a location, where less related transport activities take place, is of interest to development companies, retailers and the local government. However it is not always clear how to draw the border between the two activities. The concourse
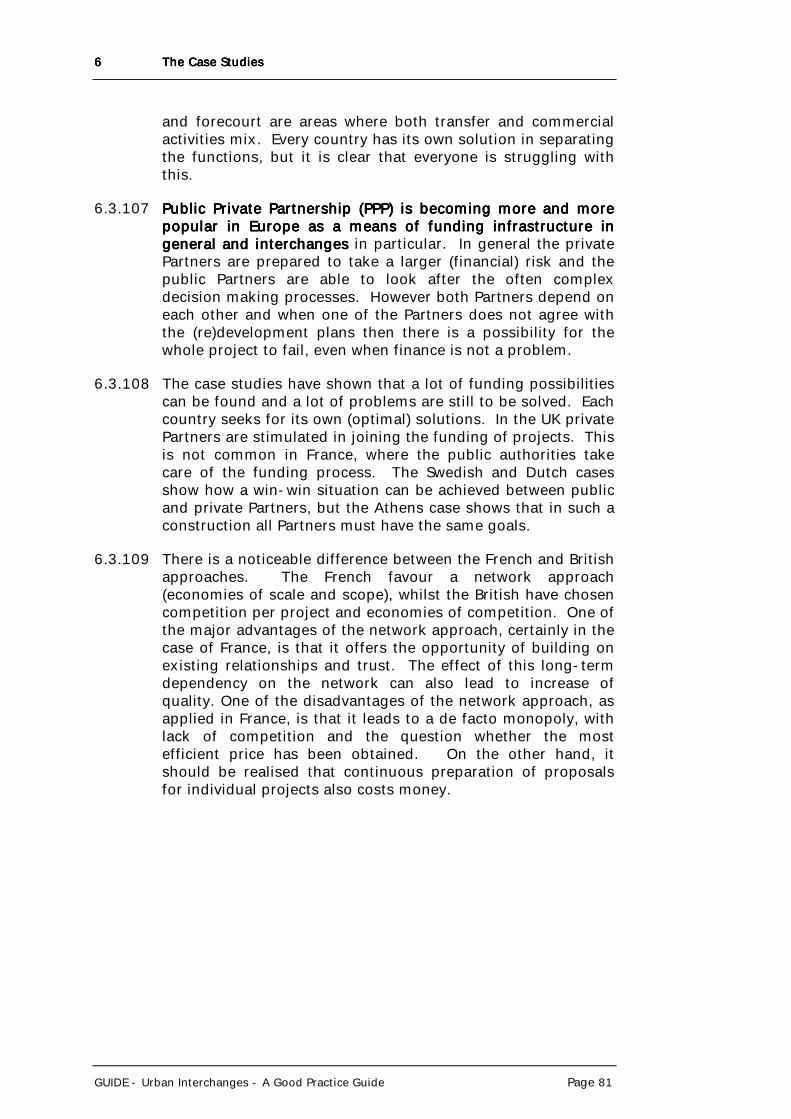
6666 TheTheTheThe CaseCaseCaseCase StudiesStudiesStudiesStudies
GUIDE - Urban Interchanges - A Good Practice Guide Page 81
and forecourt are areas where both transfer and commercial activities mix. Every country has its own solution in separating the functions, but it is clear that everyone is struggling with this.
6.3.107 Public Private Partnership (PPP) is becoming more and more Public Private Partnership (PPP) is becoming more and more Public Private Partnership (PPP) is becoming more and more Public Private Partnership (PPP) is becoming more and more popular in Europe as a means of funding infrastructure in popular in Europe as a means of funding infrastructure in popular in Europe as a means of funding infrastructure in popular in Europe as a means of funding infrastructure in general and interchangesgeneral and interchangesgeneral and interchangesgeneral and interchanges in particular. In general the private Partners are prepared to take a larger (financial) risk and the public Partners are able to look after the often complex decision making processes. However both Partners depend on each other and when one of the Partners does not agree with the (re)development plans then there is a possibility for the whole project to fail, even when finance is not a problem.
6.3.108 The case studies have shown that a lot of funding possibilities can be found and a lot of problems are still to be solved. Each country seeks for its own (optimal) solutions. In the UK private Partners are stimulated in joining the funding of projects. This is not common in France, where the public authorities take care of the funding process. The Swedish and Dutch cases show how a win-win situation can be achieved between public and private Partners, but the Athens case shows that in such a construction all Partners must have the same goals.
6.3.109 There is a noticeable difference between the French and British approaches. The French favour a network approach (economies of scale and scope), whilst the British have chosen competition per project and economies of competition. One of the major advantages of the network approach, certainly in the case of France, is that it offers the opportunity of building on existing relationships and trust. The effect of this long-term dependency on the network can also lead to increase of quality. One of the disadvantages of the network approach, as applied in France, is that it leads to a de facto monopoly, with lack of competition and the question whether the most efficient price has been obtained. On the other hand, it should be realised that continuous preparation of proposals for individual projects also costs money.

GUIDE - Urban Interchanges - A Good Practice Guide Page 82
Part 3Part 3Part 3Part 3 RecommendationsRecommendationsRecommendationsRecommendations Part 3 draws final conclusions and sets out recommendations about how passengers’ interchange experience can be improved. Some of these recommendations are concerned with the principles underlying the design of interchange facilities, but others are more general and span the role of interchange within the public transport network and the planning, organisation and staffing of facilities. Part 3 follows the above structure starting with the latter issues presented as generic recommendations (next Chapter). They correspond to the main topics of strategy, organisation and evaluation, defined earlier in this report (see Chapter 4, section 4.2). They are followed by more specific recommendations relating to interchange as a location and transfer activity and broadly structured according to the ‘location-specific’ main topic and its sub-topics (see Chapter 4 of this report). The material described in this part was developed in the course of GUIDE work on Case Studies but was crystallised during the course of WP5: Synthesis. Some of the issues and ideas were aired during the Pan-European Seminar organised by GUIDE on 22 and 23 April 1999 in Paris and gained from discussion and criticism by the participating group of experts. Note that there are certain limitations in our recommendations. Although the GUIDE Group contains participants from six different countries, and includes major public transport operators from some of Europe’s largest cities, we cannot claim that our conclusions are representative of the views of anything other than the Partners within the Group. But probably it is more important to note the limitations imposed on us by the issues of transferability of measures and policies as well as differences in approaches and traditions between different countries and within a country between different operators. Part 3 will be of interest to all audiences of this report including policy makers, senior public transport executives as well as practitioners and researchers.

GUIDE - Urban Interchanges - A Good Practice Guide Page 83
7777 Improving Interchange at a NetImproving Interchange at a NetImproving Interchange at a NetImproving Interchange at a Networkworkworkwork----wide Levelwide Levelwide Levelwide Level
7.17.17.17.1 IntroductionIntroductionIntroductionIntroduction
7.1.1 It is clear that while passengers experience interchange at the individual interchange location level, many of the conditions that influence the quality of that experience are set, or can be improved, at the network-wide level. In this Chapter, we draw together the conclusions from GUIDE that relate to network-wide issues, in particular:
• = the role of the network strategy in prioritising interchange locations;
• = information strategy and the promotion of interchanges; • = fares and ticketing; • = measurement of passenger attitudes and behavioural
analysis; • = evaluation of investment; • = funding; • = organisation and management.
7.27.27.27.2 Setting the Network ContextSetting the Network ContextSetting the Network ContextSetting the Network Context
7.2.1 The role, scale and importance of an individual interchange location is determined by its context within the public transport network rather than in isolation. Moreover, priorities for the improvement of individual interchanges need to be established at a network-wide level. Consequently it is important to have an overall view of how the network as a whole functions, or is intended to function, so that efforts to improve passenger’s interchange experience are appropriate and well directed.
7.2.2 Chapter 3 described an overall process for improving the quality of interchange by defining the strategic public transport network. Such a definition is the starting point for this process, because it allows the function of individual interchanges to be established, in terms of:
• = the services to be connected;
• = the volume of passenger flows; and
• = the balance of use of the interchange between local access and egress, and transfer between services.

7777 ImprovingImprovingImprovingImproving InterchangeInterchangeInterchangeInterchange atatatat aaaa NetworkNetworkNetworkNetwork----widewidewidewide LevelLevelLevelLevel
GUIDE - Urban Interchanges - A Good Practice Guide Page 84
7.2.3 The perspective required to establish the context of individual interchanges is that of the public transport network planner, combining an appreciation of the large number of influences that have moulded a given public transport network, including:
• = the underlying geography of the City and its historical development;
• = current and future demand patterns; • = the opportunities to create public transport corridors,
and their intersections. 7.2.4 The strategic public transport network is the cornerstone of
the overall information strategy, because it provides the most complete definition of the public transport network’s fundamental product: the connections between all the locations on the map.
7.37.37.37.3 NetworkNetworkNetworkNetwork----wide Information Strategywide Information Strategywide Information Strategywide Information Strategy
7.3.1 The overall Information Strategy for the network should include all public transport modes, and ideally embrace and set out the role for all media, including:
• = high level advertising; • = system maps at both a network and (potentially) more
local level; • = static timetable information; • = other static information such as fares and ticket products; • = real-time information systems delivering information to
individual stations, bus stops and tram stops; • = centrally provided staffed information facilities such as
call centres and telephone inquiry bureaux; • = information provision by local staff at individual locations
around the network.
7.3.2 The strategy should deliver three different levels of functionality:
• = marketing and advertising: at this level, it is concerned with raising the profile of the public transport system, and seeking to ensure that potential passengers consider public transport as a possible mode when making journey plans;

7777 ImprovingImprovingImprovingImproving InterchangeInterchangeInterchangeInterchange atatatat aaaa NetworkNetworkNetworkNetwork----widewidewidewide LevelLevelLevelLevel
GUIDE - Urban Interchanges - A Good Practice Guide Page 85
• = the static information through which a potential public transport journey can be planned (ie in terms of paths through the network) and evaluated against alternative modal options;
• = both the static and dynamic information for passengers
who have committed themselves to a public transport journey while they are en-route, including guidance as to where to go (ie signing) and real-time information (e.g. “how long to the next bus?”).
7.3.3 It would be nice to think of public transport systems in which
interchange is so good that it could be made a positive selling feature of the public transport system, and would feature in marketing and advertising material. More prosaicly, interchange is an inescapable feature of the majority of possible journeys that can be made through the public transport network. Consequently, how interchange is presented, and the processes through which passenger expectations are (a) moulded and (b) satisfied, is at the heart of the overall strategy of improving the public transport offer.
7.3.4 This is best illustrated by considering the public transport network map which underlies most public transport marketing. For most cities, the network map provides a succinct definition of the major journey opportunities provided by the network. In multi-modal networks, system maps tend to concentrate on rail based modes, and specifically identify all or principal stations.
7.3.5 Stations located where lines are shown as crossing are presumed to represent potential interchange locations. If there is not a good connection between services (for example, if a long walk is necessary) then distinct stations may be shown (a good illustration is in the Paddington area on the London Underground map). Thus the map, and literature and publicity which flows from it, provides an implicit or explicit guide to interchange quality. The presentation of the network through such information can therefore be used to promote interchange activity at some locations, and to dissuade passengers from interchanging at other locations.
7.3.6 The way in which interchange opportunities are presented provides an extremely important mechanism for both moulding passenger expectations and also (to some degree) steering passengers towards a higher quality public transport experience. The key is through a system of standards that can be used to:
• = measure the acceptability of current interchange quality at individual locations;
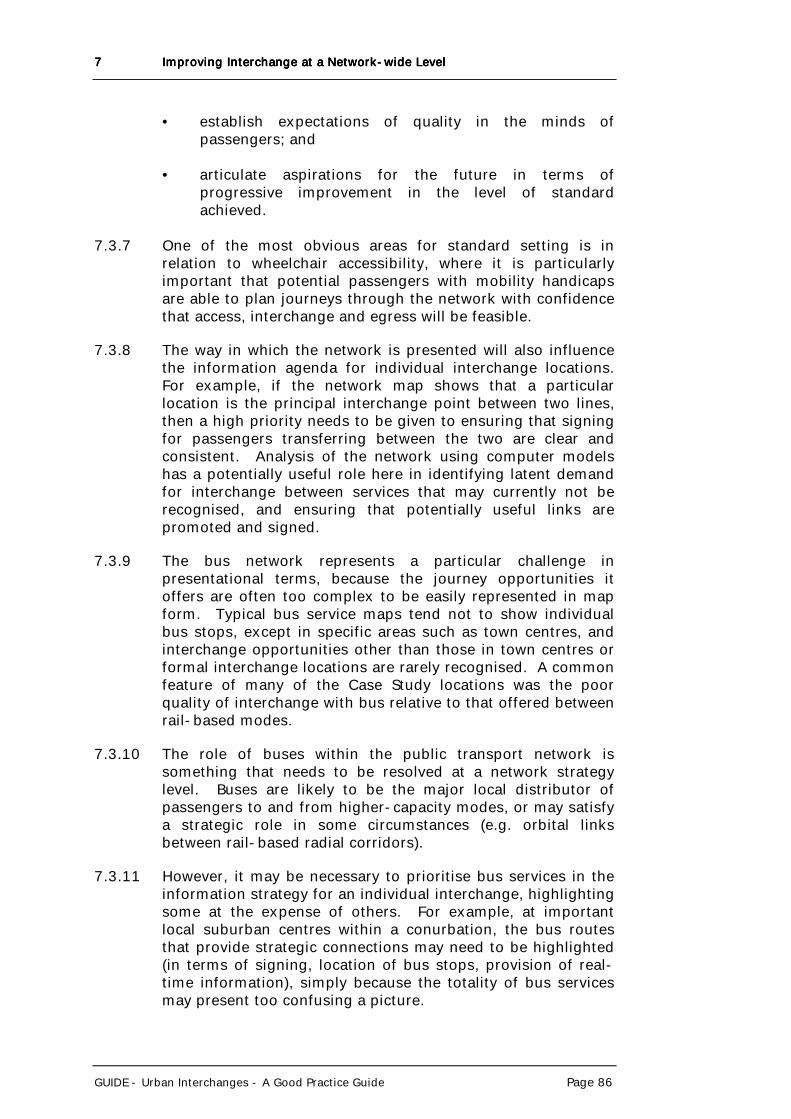
7777 ImprovingImprovingImprovingImproving InterchangeInterchangeInterchangeInterchange atatatat aaaa NetworkNetworkNetworkNetwork----widewidewidewide LevelLevelLevelLevel
GUIDE - Urban Interchanges - A Good Practice Guide Page 86
• = establish expectations of quality in the minds of passengers; and
• = articulate aspirations for the future in terms of
progressive improvement in the level of standard achieved.
7.3.7 One of the most obvious areas for standard setting is in
relation to wheelchair accessibility, where it is particularly important that potential passengers with mobility handicaps are able to plan journeys through the network with confidence that access, interchange and egress will be feasible.
7.3.8 The way in which the network is presented will also influence the information agenda for individual interchange locations. For example, if the network map shows that a particular location is the principal interchange point between two lines, then a high priority needs to be given to ensuring that signing for passengers transferring between the two are clear and consistent. Analysis of the network using computer models has a potentially useful role here in identifying latent demand for interchange between services that may currently not be recognised, and ensuring that potentially useful links are promoted and signed.
7.3.9 The bus network represents a particular challenge in presentational terms, because the journey opportunities it offers are often too complex to be easily represented in map form. Typical bus service maps tend not to show individual bus stops, except in specific areas such as town centres, and interchange opportunities other than those in town centres or formal interchange locations are rarely recognised. A common feature of many of the Case Study locations was the poor quality of interchange with bus relative to that offered between rail-based modes.
7.3.10 The role of buses within the public transport network is something that needs to be resolved at a network strategy level. Buses are likely to be the major local distributor of passengers to and from higher-capacity modes, or may satisfy a strategic role in some circumstances (e.g. orbital links between rail-based radial corridors).
7.3.11 However, it may be necessary to prioritise bus services in the information strategy for an individual interchange, highlighting some at the expense of others. For example, at important local suburban centres within a conurbation, the bus routes that provide strategic connections may need to be highlighted (in terms of signing, location of bus stops, provision of real-time information), simply because the totality of bus services may present too confusing a picture.

7777 ImprovingImprovingImprovingImproving InterchangeInterchangeInterchangeInterchange atatatat aaaa NetworkNetworkNetworkNetwork----widewidewidewide LevelLevelLevelLevel
GUIDE - Urban Interchanges - A Good Practice Guide Page 87
7.47.47.47.4 FaresFaresFaresFares and Ticketing and Ticketing and Ticketing and Ticketing
7.4.1 Fares and ticketing policies are very important for the success of public transport systems and directly affect the propensity to transfer. This has been discussed in both Part 1 and Part 2 (section 6) of this report and their impacts have been demonstrated by computer simulations (Centro, Network Strategy Case Study).
7.4.2 Fares and ticketing products should not impose additional disincentives for passengers to use interchanges. In recent times it should rather be the case that through-ticketing backed by modern technology (e.g. smart cards) gives operators more choice for reducing the barriers to interchange.
7.4.3 The physical arrangements of ticketing can promote either open or closed systems which has significant implications on interchange lay-out. Closed systems, by means of some sort of barriers, can make public transport use difficult and discourage integration with the interchange surroundings. On the other hand controlled entry through barriers enhances security and safety in practical terms as well as providing the means for information/data gathering.
7.57.57.57.5 Passenger Attitudes and BehaviourPassenger Attitudes and BehaviourPassenger Attitudes and BehaviourPassenger Attitudes and Behaviour
Taking into account the perceptions, attitudes, views and opinions of interchange users (and non-users) is very valuable: • = it provides better means for analysing the main attributes
(drivers) of choice;
• = it facilitates decision-making with regards to capital investment (and prioritising future investments).
7.5.1 There are a number of available methods for measuring
attitudes and behaviour and they can be categorised into two major groups: qualitative and quantitative. In addition, methods in either of these groups approach users or potential users of interchanges in a variety of ways. Some concentrate on the traveller with the notion of flow being predominant (space-movement management perspective); whilst others focus on the perceptions of transfering and then regarding the users (and non-users) as customers (customercentric approach).
7.5.2 Methods based on space-movement management focus basically on the dimensioning of the interfaces. They seek to determine the main principles for the development and improvement of the spaces (halls, platforms, etc.) according to the flow, speed and density of the traffic they must handle. In

7777 ImprovingImprovingImprovingImproving InterchangeInterchangeInterchangeInterchange atatatat aaaa NetworkNetworkNetworkNetwork----widewidewidewide LevelLevelLevelLevel
GUIDE - Urban Interchanges - A Good Practice Guide Page 88
practice, these methods use mainly aggregate measures of demand (e.g. traffic flow).
7.5.3 Methods centred on the customer focus on the users' expectations, and their individual perceptions and preferences about the spaces and services available. They fall into two main families, the first considering the problem in a qualitative manner, and the second regarding the quantitative aspects.
Qualitative methods to understand users' satisfaction and expectations
7.5.4 The different qualitative methods generally make use of disciplines such as psychology, ergonomics and sociology. Various tools can be used: in-depth interviews, focus groups, monitoring of traveller paths, mental maps, etc.
7.5.5 Methods analysing traveller paths are based on role games in which the user plays an active part in the survey. They are designed to link the different aspects of a transfer and to determine possible behaviour. Interviewers reconstruct graphically the path, the obstacles travellers encounter, etc, generally based on observations recorded by means of necktie-microphones. Users may also be asked directly to form a mental map of the space they went through, in order to determine reference points and the main difficulties encountered. Another variant includes using video (with or without user’s commentary).
7.5.6 Other methods involve the introduction of a third player, in addition to the interviewer and the user, and focus on particular interactions, because in a transfer site the traveller is confronted with personnel as well as machines and technology. The observations of users in real situations are very valuable, a well as observation and questioning of ‘stationary’ personnel at information desks, and ‘moving’ personnel (by means of video in particular).
Quantitative methods
7.5.7 These methods involve a variety of techniques from market research surveys on satisfaction/expectations of interchange users to stated preference surveys which place monetary values (according to travellers preferences) to interchange improvements.
Some methods, such as the London Transport mystery shopper and customer priorities surveys, combine both types of surveys (and also employ qualitative research). The interchange space is approached in an original and objective manner: observation of user paths by a surveyor, rating of the characteristics of areas, surroundings and services. On the

7777 ImprovingImprovingImprovingImproving InterchangeInterchangeInterchangeInterchange atatatat aaaa NetworkNetworkNetworkNetwork----widewidewidewide LevelLevelLevelLevel
GUIDE - Urban Interchanges - A Good Practice Guide Page 89
other hand, the expectations of users are determined by means of questionnaires. Complementarily of the different methods
7.5.8 Qualitative methods grant a special role to the user and more particularly to user experience. They are close to reality, offer a precise image of an interchange and its functioning at a given moment, and at a low cost. It is also possible to identify needs by users segments and, in the best of cases, try to deduce general recommendations (for example, extrapolation of conclusions to the mobility handicapped). Their main drawbacks are that they are not representative and their findings not always directly applicable.
7.5.9 On the other hand, quantitative approaches have the advantage of being representative. They lead to the formulation of recommendations for design and management of interchanges and can help in prioritising investments. But they may be expensive to carry out.
We strongly propose the use of a combination of qualitative and quantitative methods. For example, the qualitative approach can be the preliminary investigation leading to a more extensive programme allowing the identified research areas to be dealt with by quantitative methods. Stated Preference Techniques
7.5.10 Stated Preference techniques have been widely used in assessing transport improvements and are recommended by this study as important tools in the assessment of interchange improvements. The following paragraphs describe very briefly the advantages and disadvantages of these techniques.
7.5.11 Traditionally, demand analysis has been based on ‘Revealed Preference’ (RP) data; that is, choices and decisions that have actually been made in the marketplace. With theoretical advances in econometrics, there has been great expansion in this field. But there are practical limitations to the RP approach, largely connected to survey costs and its ability to deal with qualitative improvements and new alternatives. The sources of ‘measurement’ and ‘specification’ error in RP are potentially very large and thus making estimation difficult and expensive.
7.5.12 As a consequence, the ‘Stated Preference’ (SP) technique was developed. The main characteristic of the technique is that demand estimates are based on an analysis of responses to hypothetical choices. The alternatives are presented to respondents in terms of their component attributes; and the values of these attributes can be varied in a systematic manner

7777 ImprovingImprovingImprovingImproving InterchangeInterchangeInterchangeInterchange atatatat aaaa NetwoNetwoNetwoNetworkrkrkrk----widewidewidewide LevelLevelLevelLevel
GUIDE - Urban Interchanges - A Good Practice Guide Page 90
to explore trade-off. The design and analysis of SP are very soundly based on experimental statistics and econometrics respectively, also benefiting from the advances made in the field of RP.
7.5.13 SP has been designed to and it does successfully address the limitations of the RP approach. However its main characteristic (hypothetical choices), especially developed to deal with the RP weaknesses, brings about its own main intrinsic limitation. The SP technique may suffer from ‘response error’ ie, the respondents may not choose in the marketplace what they state they will choose under the experimental conditions created for the SP trade-offs.
7.5.14 In estimation this source of additional error causes no problems. The problem arises in forecasting and cannot be dismissed as a statistical nicety.
7.5.15 Note that this concern does not affect the relative sizes of the estimated coefficients used in the definition of the so called utility functions. Thus, if money cost and journey time are part of the utility function then their ratio: value of time is not affected by the above concerns with the absolute size of the coefficients on cost and time.
7.5.16 The real issue arises when we attempt to use utility functions derived wholly and directly by SP for forecasting. These utility functions will generally need correction, which usually takes the form of scaling, before they can be used in models to predict choice.
7.5.17 In practice the relative valuations (or ratios of the coefficients derived by SP) can be used as consistent indicators of the different effects of various attributes of the alternatives or products and their improvements. But when a forecast on patronage or revenue is required then a correction is necessary. There are a number of methods which can be used to achieve this and they all require some RP information (e.g. use a known elasticity as a control, use a small RP data set to estimate a scaling factor, etc).
7.67.67.67.6 Evaluation of InvestmentEvaluation of InvestmentEvaluation of InvestmentEvaluation of Investment
7.6.1 In the GUIDE case study focussing on the topic of Evaluation we discussed the key issues relating to evaluation and identified a number of techniques that can be useful in this domain. The main conclusion was that interchange evaluation should ensure that project investment reflects stakeholders’ priorities.
7.6.2 This is also our main recommendation. Stakeholders include those groups that are directly involved in decision making such as politicians, operators and planners. However, interchange

7777 ImprovingImprovingImprovingImproving InterchangeInterchangeInterchangeInterchange atatatat aaaa NetworkNetworkNetworkNetwork----widewidewidewide LevelLevelLevelLevel
GUIDE - Urban Interchanges - A Good Practice Guide Page 91
projects affect users (and potential users) and ultimately the objective of these projects is to change their attitudes and behaviour. Therefore, it is vital that the evaluation procedures take account of these factors and reflect them in the definition of stakeholders’ priorities.
7.6.3 Traditionally, passenger responses to interchange have been represented solely as time savings, and changes in journey quality and ambience have not explicitly been included. This has meant that interchange improvements may be given a low level of priority relative to other objectives because the benefits of these improvements have not been fully captured. In Paris and London, stated preference techniques have been used to rank how important different types of interchange improvement are to passengers, and in London ambience and journey quality factors have been monetised, and incorporated within project appraisal.
7.6.4 Frequently, interchange projects are by their very nature partnership projects. Often the partners have very different objectives and this is likely to be reflected in the evaluation procedures that are used by the different partners. This may act as a barrier to the implementation of interchange projects, although research findings from studies in London and Copenhagen demonstrate different approaches to unlocking this problem.
7.6.5 Benefits from interchange improvements can be accumulated at a network-wide level and compared consistently with benefits from other public transport investments. As discussed in this report a number of techniques are available for assessing different types of improvements at interchanges ranging from escalator improvements to better lighting and measuring their effects on a monetary scale. Moving to a network-wide level provides the basis for a standard evaluation framework establishing commercial and passenger benefits.
7.77.77.77.7 FundingFundingFundingFunding
7.7.1 It has been emphasised in this report that the word interchange has two meanings: action (or transfer) and location. This duality complicates the issues relating to the evaluation of interchanges and adds to the complexity of the public transport funding alternatives and procedures.
7.7.2 One of the main factors of this complexity is the large number and variety of agents involved in the (re)development of an interchange. These may be a public transport operator, the local authority, a local development corporation, other local lobbying groups, the central government, local private companies, developers, private finance houses, etc. By

7777 ImprovingImprovingImprovingImproving InterchangeInterchangeInterchangeInterchange atatatat aaaa NetworkNetworkNetworkNetwork----widewidewidewide LevelLevelLevelLevel
GUIDE - Urban Interchanges - A Good Practice Guide Page 92
definition these agents have different objectives which unfortunately sometimes contradict each other.
7.7.3 On the other hand, it should also be stressed that this variety of agents and objectives increases and enhances the opportunities for funding arrangements. The GUIDE case studies have revealed a number of cases of interchange development where innovative funding mechanisms and procedures have been used.
7.7.4 In particular Public Private Partnerships (PPP) are becoming more popular in Europe as a means of funding infrastructure in general and interchanges in particular. PPP can appear in different forms but the main issue in this discussion is the level of risk undertaken by each sector (public or private) in the development of a particular project.
7.7.5 The principal argument in favour of private sector involvement is that the profit motive increases cost effectiveness and market awareness. Although the cost of private capital is greater than the cost of finance raised by the public sector, it is thought that this is offset by the greater efficiency of the private sector.
7.7.6 There are plenty of arguments about when and where the above view is valid (e.g. labour intensive or fixed capital contexts) and about which is the most appropriate scheme for operating such partnerships (e.g. Build-Own-Operate-Transfer BOOT, Design-Build-Operate-Maintain DBOM). An additional important issue in some European countries is access to capital. Even though governments can raise capital more cheaply than the private sector, limitations on the funds available for public investment make it impossible to meet all reasonable demands. Then it may be essential to make use of private resources to increase the total funds available.
7.7.7 Finally, note that in practice to date there are very few examples of PPP application (in the strictest meaning, ie risk transfer to private sector) in public transport investment and even less in interchange development (one available example is the Doncaster transport interchange in South Yorkshire in the UK). However, there is a growing number of public private partnerships (relaxed definition, ie co-operation but little or no risk transferred to private sector) and a number of them have been examined in the GUIDE case studies as examples of interchange financing (e.g. Hammersmith, Stockholm City Terminal etc, see Chapter 6 and D4).
7.87.87.87.8 Organisation and ManagementOrganisation and ManagementOrganisation and ManagementOrganisation and Management
7.8.1 The most consistent lesson from the research of the GUIDE group is that improvement of interchange requires a holistic view of the experience provided to interchanging passengers.

7777 ImprovingImprovingImprovingImproving InterchangeInterchangeInterchangeInterchange atatatat aaaa NetworkNetworkNetworkNetwork----widewidewidewide LevelLevelLevelLevel
GUIDE - Urban Interchanges - A Good Practice Guide Page 93
An important corollary is that an organisational structure needs to be in place that is capable of examining interchange aspects of the public transport “offer” that is unconstrained by organisational boundaries.
7.8.2 It is inevitable that a number of different organisations contribute to passengers’ experience of interchange at a particular location; these could include:
• = the public transport operators; • = the public transport infrastructure providers (if different
to the above); • = the local authorities responsible for the urban area and
surrounding highways; • = commercial property interests; • = other property occupiers (ie shop owners).
7.8.3 This diversity will be most apparent (and most clearly delineated) where the public transport system has been privatised. However, even where the public transport system is under single public ownership, the size of the organisation in medium to large scale cities will often lead to internal divisions (e.g. between bus and rail operations) that have the same effect of creating the potential for organisational barriers to interchange.
7.8.4 Moreover, within a particular city, the mix of organisations involved at individual interchange locations will vary greatly. At one location, perhaps only one operator and one local authority will be involved; at another location, different operators, and different local authorities. Consequently, an organisation structure is needed that provides a high level unity of approach to interchange issues, and also creates a framework within which relevant organisations can work together at individual locations.
7.8.5 Both Paris and London offer examples of organisational structures operating at these two levels:
• = in Paris, RATP and other players participate in a network level committee which identifies key interchange locations and prioritises investment and other improvement activity at them; this is supplemented by “Site Committees” which are specific to individual interchange locations (see Case Studies on Gare du Nord and La Défense);
• = in London, a high-level Steering Group including London
Transport, local authorities, central Government,

7777 ImprovingImprovingImprovingImproving IntercIntercIntercInterchangehangehangehange atatatat aaaa NetworkNetworkNetworkNetwork----widewidewidewide LevelLevelLevelLevel
GUIDE - Urban Interchanges - A Good Practice Guide Page 94
Railtrack, and the main Train Operating Companies have signed up to a “Code of Practice” regarding interchange quality, and have created a task force called LINK (London Interchange Network) to pursue interchange improvement at a network-wide level. Significant initiatives include the development of a comprehensive signing system, and setting up a programme of “mystery shopper surveys” to enable customer satisfaction at different interchange locations to be measured and compared.
7.8.6 Because of the range and varying mixtures of organisations
that may need to be involved, all of which will reflect local circumstances, a partnership philosophy appears to provide a useful way forward. In Britain, the concept of Quality Partnerships (between bus operators and local authorities) is now becoming well established, and is being extended to secure improvements to interchange (see, for example, the Manchester Piccadilly Gardens Case Study). The principles underlying the operation of such partnerships is to recognise that organisations will have different end objectives (and areas of executive responsibility), but have common goals in areas such as improving the quality of the passenger’s public transport experience.
7.8.7 A key function which needs to be identified and “found a home for” within the organisational framework is overall analysis of how the current public transport network operates, and how it might operate in the future.
7.8.8 Traditionally, the long lead times associated with the implementation of public transport infrastructure projects leads to a separation of the planning function from day-to-day operations. Clearly, for major investment in new interchange facilities (especially where associated with new lines), this segregation of planners from the “current” situation is appropriate.
7.8.9 But as we have seen, many of the practical weaknesses of interchange are capable of short term improvement and do not necessarily require large scale investment. However, identification of problems and solutions requires a combination of the planners’ perspective of the interactions between different modes, with the detailed knowledge of particular locations that can be provided at the operating level.
7.8.10 Consequently, a multidisciplinary approach is required which brings together both the planner’s strategic view of the place of interchange activity within the network as a whole, as well as the implementation skills and practical experience of operators. The London LINK Team provides an example of this type of multi-disciplinary approach. Activities of such a group can include:

7777 ImprovingImprovingImprovingImproving InterchangeInterchangeInterchangeInterchange atatatat aaaa NetworkNetworkNetworkNetwork----widewidewidewide LevelLevelLevelLevel
GUIDE - Urban Interchanges - A Good Practice Guide Page 95
• = establishment of Interchange Standards; • = sponsorship of surveys of current facilities (to measure
against standards) and passenger opinions; • = use of network models to identify actual and potential
patterns of interchange; • = development of evaluation tools to help investment
decisions with regard to interchange facilities; • = reviews of infrastructure proposals to ensure that ease of
interchange is a high priority at the design stage.
7.8.11 One of the most significant initiatives that can be taken at a network wide level is the promotion of liaison and co-ordination arrangements at the location specific level. It is evident that local managers are often able to identify opportunities to improve the interchange experience for passengers, but may feel inhibited from doing so because it may require crossing organisational boundaries. General encouragement from the highest levels of Partner organisations, and the establishment of “model” local organisations (such as the Paris Site Committees) will go a long way to reduce such inhibitions.
7.8.12 Potential activities for local liaison committees include:
• = dissemination of local research results (for example the latest Mystery Shopper Survey reports);
• = discussion and consultation about future plans;
• = co-ordination of implementation and maintenance
activities;
• = arrangements for sharing operational information amongst all relevant staff;
• = arrangements for joint staff training and encouragement
of local “esprit de corps”. 7.8.13 In some senses the most important organisational contribution
to reducing barriers to interchange is simply to provide recognition that interchange is a significant aspect of the public transport system and one that merits specific attention. Raising the profile of interchange will lead to greater awareness of the need to minimise barriers, and will help avoid interchange “falling between the cracks” of the different organisations responsible for the public transport experience.

7777 ImprovingImprovingImprovingImproving InterchangeInterchangeInterchangeInterchange atatatat aaaa NetworkNetworkNetworkNetwork----widewidewidewide LevelLevelLevelLevel
GUIDE - Urban Interchanges - A Good Practice Guide Page 96

GUIDE - Urban Interchanges - A Good Practice Guide Page 97
8888 Improving Interchange at Individual Improving Interchange at Individual Improving Interchange at Individual Improving Interchange at Individual Interchange LocationsInterchange LocationsInterchange LocationsInterchange Locations
8.18.18.18.1 IntroductionIntroductionIntroductionIntroduction
8.1.1 As far as passengers are concerned, it is their experience at individual locations which will determine the impact of interchange on the quality of the journey. Improvement in the physical attributes of interchanges at specific locations will often be the most tangible way of increasing the seamlessness of the public transport system. In this Chapter, we set out our conclusions on best practice in this area.
8.1.2 Most of the discussion below is oriented towards “formal” interchanges - locations where purpose built facilities have been established such as railway and bus stations. However, many of the principles set out could also apply to any location where interchange activity (transfer) takes place, although the scope for improvement may be much less or not justified.
8.1.3 Of these principles, the most important is the philosophy of looking at the experience offered by the interchange from the perspective of the passenger using it. Although a number of organisations or parts of organisations may be involved at a particular location, the passenger is not interested in dividing lines of responsibility or territory. Consequently, to improve the passenger’s experience requires a holistic point of view, that can examine critically the design, facilities and operation of the interchange from before the passenger gets to it all the way through until the passenger has left it.
8.1.4 The discussion focuses on a number of distinct aspects of interchange, as follows:
• = overall design and layout; • = accessibility and linkages with the surrounding urban
area; • = facilities; • = image; • = information; • = signage; • = personal security; • = operational safety.
8.1.5 Clearly, there are a number of interactions between these areas, and what can be achieved in any one area may be heavily influenced by the overall design. We have sought to highlight the key interactions in the text, so that an appropriately holistic view can be obtained of how the interchange itself should function.
8.28.28.28.2 Principles of Design and LayoutPrinciples of Design and LayoutPrinciples of Design and LayoutPrinciples of Design and Layout
8.2.1 In this section, we talk about some of the fundamentals of how an interchange should be designed and arranged. Practically,

8888 ImprovingImprovingImprovingImproving InterchangeInterchangeInterchangeInterchange atatatat IndividualIndividualIndividualIndividual InterchangeInterchangeInterchangeInterchange LocationsLocationsLocationsLocations
GUIDE - Urban Interchanges - A Good Practice Guide Page 98
the scope for improvement in these fundamentals at many interchanges within a mature public transport network is limited. In a mature city, even brand new lines and stations are constrained by the established urban form, and existing lines, quite apart from resources and there may be little that can be done to improve aspects such as walking distances between lines, at least in the short term.
8.2.2 Nevertheless, a clear appreciation of what distinguishes a good interchange from a poor interchange provides an essential foundation for assessing existing or proposed interchanges. This should help ensure that the maximum use is made of opportunities for change as they arise, irrespective of whether limited to marginal cosmetics, or providing scope for wholesale reconstruction.
8.2.3 The objective of the design process is to match form to function as effectively as possible. In looking at any particular interchange location, this implies that the starting point should be an understanding of the function that is to be served.
8.2.4 Clearly, an interchange should facilitate movement of passengers between public transport services, and generally also help passengers access those services from the surrounding area. But the nature of the passenger use of the interchange should have an influence on how it is designed, because much of the design process will be concerned with compromises between conflicting objectives. The balance that is adopted needs to be informed by the anticipated mix of use, and some prioritisation between groups may need to be established. Examples of how user groups might be characterised include:
• = the balance between transferring and accessing passengers;
• = the commuter/ tourist balance, which will affect the
range of facilities required; • = the pattern and volume of throughput at different times
of day.
8.2.5 The identification of the function of the interchange needs to be carried out at a network-wide level, but should then form an input into the basic functional specification for the design at the particular location.
8.2.6 We have identified seven broad principles for good design which are set out in the table below.

8888 ImprovingImprovingImprovingImproving InterchangeInterchangeInterchangeInterchange atatatat IndividualIndividualIndividualIndividual InterchangeInterchangeInterchangeInterchange LocationsLocationsLocationsLocations
GUIDE - Urban Interchanges - A Good Practice Guide Page 99
Table Table Table Table 8888....1111 Interchange Design PrinciplesInterchange Design PrinciplesInterchange Design PrinciplesInterchange Design Principles AttributeAttributeAttributeAttribute PrinciplePrinciplePrinciplePrinciple CommentaryCommentaryCommentaryCommentary 1 Overall Overall Overall Overall
arrangementarrangementarrangementarrangement Ideally, locate services/ platforms where passengers can establish visual links from a number of different positions
Easiest to achieve in surface/ elevated situations (e.g. Duivendrecht, Holland); note visual connections enhanced through use of glass walls/roofs and other materials
2 Locate facilities in logical progression for the principal user group
ie have facilities in sequence such as information/inquiry desk, then ticket purchase, then service boarding point
3 Maximise sense of light and space, ideally using natural light
Space is generally expensive, but floor area and/or high ceilings create a higher comfort level for passengers than confined spaces
4 Walk linksWalk linksWalk linksWalk links between service loading/ unloading points, platform entrances and street entrances
Minimise walk distances
But not at expense of providing too little space for facilities such as waiting areas, and also point three above
5 Minimise changes in levels, and avoid steps if possible
Step-less interchange difficult to achieve with multi-level interchange but provision of full wheelchair-access expensive
6 Maximise directness of routes, avoiding changes in direction if possible
Circuitous routes lead to passenger disorientation and anxiety (“am I going in the right direction”). Also security issues arising from “blind” corners
7 Space Space Space Space managementmanagementmanagementmanagement
Layout of spaces should facilitate efficient supervision by staff and maximise staff visibility to passengers
e.g. locate staffed points such as ticket barriers and information desks so as to maximise the area that can be supervised visually
8.38.38.38.3 Local Accessibility Local Accessibility Local Accessibility Local Accessibility ---- Linkages with Surrounding Area Linkages with Surrounding Area Linkages with Surrounding Area Linkages with Surrounding Area
8.3.1 Accessibility is a term used in a wide variety of transport contexts:

8888 ImprovingImprovingImprovingImproving InterchangeInterchangeInterchangeInterchange atatatat IndividualIndividualIndividualIndividual InterchangeInterchangeInterchangeInterchange LocationsLocationsLocationsLocations
GUIDE - Urban Interchanges - A Good Practice Guide Page 100
• = accessibility to the public transport network provided by an interchange facility and its links with the surrounding area;
• = accessibility problems created for encumbered
passengers, or those with mobility handicaps, through barriers such as steps and severe changes in level;
• = the more general benefit of accessibility provided by the
public transport network as a whole through the connections it provides between a large number of locations in the urban area.
8.3.2 In this section, we focus on the first of these meanings.
8.3.3 Interchanges play a key role in providing accessibility to the public transport network. This is emphasised by the fact that in the vast majority of interchange locations, more passengers are likely to use the facilities for access to public transport services rather than for formal interchange between services.
8.3.4 Clearly, any railway station or bus stop provides the means through which passengers can get to or from public transport services. A location served by more than one service will offer both a greater level of service to accessing/aggressing passengers, as well as the potential for interchange.
8.3.5 In practice, the boundaries of an interchange are fuzzy: passengers walking in a metro station from a nearby bus stop are transferring just as much as passengers off-loaded within the station itself. Consequently the issue of the relationship between the interchange and the surrounding urban area affects both informal service-to service interchanges, as well as the ease with which services within the interchange can be accessed by passengers starting or ending their journeys in the vicinity.
8.3.6 Improving the accessibility offered by an interchange requires:
• = an integrated approach to setting the interchange in its urban context;
• = a comprehensive approach to designing access to the
interchange by all relevant modes, including walk, cycle, taxi and car;
• = a recognition that the existence of the interchange should
be acknowledged at some distance from it, particularly in terms of signing.
8.3.7 An approach that integrates the development of public
transport interchanges with other aspects of the urban

8888 ImprovingImprovingImprovingImproving InterchangeInterchangeInterchangeInterchange atatatat IndividualIndividualIndividualIndividual InterchangeInterchangeInterchangeInterchange LocationsLocationsLocationsLocations
GUIDE - Urban Interchanges - A Good Practice Guide Page 101
townscape is an important condition for improving accessibility. This could mean:
• = orientating redevelopment opportunities so as to maximise density of activity near interchanges, and in such as way as to minimise walking distances to and from transport services;
• = ensuring that detailed arrangements of kerbs, pedestrian
guard-rails and crossings, and other elements of street furniture facilitate straight-line pedestrian access, rather than create obstacles;
• = striking the right balance between, on the one hand,
incorporation of the interchange facilities into other built structures, and on the other hand, ensuring that the interchange nevertheless has a distinct “street presence”.
8.3.8 The key access mode for most interchanges will be the walk
mode, and since all passengers will be pedestrians at some points in their journeys, getting detail right for pedestrians is essential. However, other access modes may also be important, depending upon context, including cycles, taxis, cars (as in “Kiss and Ride”) and cars (as in “Park and Ride”). The planning process should seek to establish the importance of these different access modes, so that appropriate facilities can be provided.
8.3.9 It is also essential that sufficiently broad consideration is given to interactions with the surrounding bus network. All bus routes that pass within a reasonable walking distance of the interchange location provide the potential for transfer, if they are not explicitly included within the “formal” interchange function. Passengers will interchange between them using pedestrian routes that require special attention in terms of signing and information.
8.3.10 The potential for encouraging interchange with bus is only one aspect of the need to acknowledge that the influence of an interchange can and should spread over a wide area. There is increasing recognition that city and local centres within urban areas need management as an entity, embracing local planning, street furniture design and maintenance, street cleaning, public information, and promotion of and publicity for the centre. The promotion of the public transport system, and of specific interchange facilities, should be seen as part of this overall process, so that signage, and possibly real-time information systems, become a natural part of the facilities provided by shopping centres or other commercial developments.

8888 ImprovingImprovingImprovingImproving InterchangeInterchangeInterchangeInterchange atatatat IndividualIndividualIndividualIndividual InterchangeInterchangeInterchangeInterchange LocationsLocationsLocationsLocations
GUIDE - Urban Interchanges - A Good Practice Guide Page 102
8.3.11 Public transport operators need to look into opportunities for encouraging “joined-up-thinking” about the development and management of urban areas. The “site committee” concept, discussed elsewhere as the means of co-ordinating the activities of interested parties within an interchange facility, can usefully be extended to provide linkages with the organisations most concerned with the surrounding urban area, especially the local authority.
8.3.12 One other aspect of local accessibility that should be recognised is that transport interchanges, and potentially the transport links served, may themselves create barriers to local accessibility through severance. Railway viaducts, wide and heavily trafficked roads, and interchange buildings can often divide urban areas, obstructing natural pedestrian routes and preventing the urban area from functioning as an homogenous entity. Major investment may be required to overcome some of these problems, but clever design of the interchange facility may enable attractive pedestrian through-routes to be provided. Indeed, the objective should be to make the facilities within and in the immediate vicinity of the interchange sufficiently attractive, to allow the interchange to form an integral part of the urban area.
8.48.48.48.4 Accessibility for the Mobility ImpairedAccessibility for the Mobility ImpairedAccessibility for the Mobility ImpairedAccessibility for the Mobility Impaired
8.4.1 Improving the accessibility of the public transport network for those with mobility impairments has become an increasingly high priority for many Cities over the last few years. Partly, this reflects the realisation that mobility impairment is a continuum. While there are passengers or would-be passengers who are wheelchair-bound, blind or deaf, or in some other way have a very distinct handicap in terms of the ability to use facilities, the features of the system that can assist them will also assist very large numbers of passengers with less distinct impairments.
8.4.2 These include:
• = parents with young children in pushchairs or prams; • = passengers with luggage; • = passengers with shopping bags or carriers; • = passengers who are simply frail or lack agility,
particularly the elderly.
8.4.3 The physical barrier that creates most of an obstacle to all these groups of passengers is a significant change in level, which is an unavoidable feature of access and interchange in

8888 ImprovingImprovingImprovingImproving InterchangeInterchangeInterchangeInterchange atatatat IndividualIndividualIndividualIndividual InterchangeInterchangeInterchangeInterchange LocationsLocationsLocationsLocations
GUIDE - Urban Interchanges - A Good Practice Guide Page 103
virtually any multi-mode public transport system4, especially with regard to rail-based systems. However, there is a distinction between the needs of those who are exclusively dependent upon step-free access (ie wheelchair-bound passengers, parents with pushchairs, etc) and others:
• = step-free access requires that changes in level are accommodated either by ramps or lifts;
• = lesser degrees of mobility impairment ideally should be
accommodated by escalators, but modest steps may be acceptable.
8.4.4 While steps and lifts are not incompatible with other solutions,
they do not necessarily satisfy the requirements of the less severely mobility impaired. Indeed, the long walking distances involved with ramps may be seen as more of a barrier to the infirm than a short flight of carefully designed steps. Where ramps are ruled out because of space considerations, lifts may be the only solution for wheelchair passengers; but lifts in general seem to be unpopular with those passengers who are not obliged to use them, for a variety of reasons including security concerns and waiting times.
8.4.5 Step-free access to all access points and throughout all interchange locations is an accepted medium-to-long term aspiration for many public transport systems, but is not a realistic short term target for many mature, large urban public transport networks. Consequently, a compromise strategy for improving accessibility to wheelchair passengers needs to be adopted which entails:
• = inclusion of step-free access as a standard requirement for all new stations or interchange facilities;
• = incremental improvement of existing
stations/interchange so that there is continued progress in increasing the extent to which the public network becomes fully accessible.
8.4.6 With many systems, in the foreseeable future, at any one point
in time, not all stations and interchange locations are likely be fully accessible. The obvious corollary is that promotion and publicity about the network should make the status of any particular location clear. Potential passengers with mobility handicaps must be able to plan their journeys in the confidence that they won’t be “trapped” at a location that does
4 Changes of level can probably be most easily avoided with an exclusively surface-running public transport system; however, even with surface running, high capacity modes are likely to require dedicated rights of way, reducing pedestrian access across lines and leading towards a need for multi-level interchange.

8888 ImproviImproviImproviImprovingngngng InterchangeInterchangeInterchangeInterchange atatatat IndividualIndividualIndividualIndividual InterchangeInterchangeInterchangeInterchange LocationsLocationsLocationsLocations
GUIDE - Urban Interchanges - A Good Practice Guide Page 104
not allow egress or interchange. The classification of particular locations needs to be unequivocal - all movements (access, egress, interchange between all combinations of services) have to be feasible, so that a sufficiently simple symbolism can be used on network maps and the like.
8.4.7 Organisations representing passengers with mobility impairment have a valuable role in auditing individual interchange locations, and ideally would be involved in the process of classifying locations.
8.58.58.58.5 FacilitiesFacilitiesFacilitiesFacilities
8.5.1 The possible range of facilities that could be provided at an interchange location is very wide. Leaving aside facilities concerned with passenger information and security (discussed separately below), a list of candidate facilities is shown in Table 8.2.
Table Table Table Table 8888....2222 Potential Facilities at Interchange LocatPotential Facilities at Interchange LocatPotential Facilities at Interchange LocatPotential Facilities at Interchange Locationsionsionsions

8888 ImprovingImprovingImprovingImproving InterchangeInterchangeInterchangeInterchange atatatat IndividualIndividualIndividualIndividual InterInterInterInterchangechangechangechange LocationsLocationsLocationsLocations
GUIDE - Urban Interchanges - A Good Practice Guide Page 105
FacilityFacilityFacilityFacility CommentaryCommentaryCommentaryCommentary TravelTravelTravelTravel----relatedrelatedrelatedrelated Shelter Implicit in subway
stations Waiting areas Toilets Luggage trolleys Luggage storage Typically at rail termini Ticket sales outlets Car parking Cycle parking Taxi ranks OtherOtherOtherOther Retail outlets Automatic vending
machines
Cash points Telephones Cafe/buffet Could be considered to
be travel related Shoe-repair/key-cutting
kiosk
8.5.2 The distinction between “travel-related” and “other” facilities is
somewhat arbitrary, but is intended to distinguish between facilities that would only be used by the travellers passing through an interchange, as opposed to those that might also attract non-travellers into the interchange area purely to make use of the particular facility.
8.5.3 The availability of a range of facilities can reduce the disutility of interchange to the passenger by creating a positive benefit from time spent at the location but raises two other issues:
• = increasing the “market” for particular facilities (such as retail areas) will strengthen their commercial viability, and allow travellers to enjoy a higher level of facility (e.g. a larger range of products) at the interchange than could otherwise be sustained. Enhancing the role of the interchange within the urban area will also increase the integration of the interchange with its urban hinterland;
• = there is however an implication for the design of the
interchange with respect to the fare system’s “paid area” (ie the area of the transport system where it is compulsory to possess a valid ticket to travel). Making facilities available to the general public implies placing them outside the paid area, and may decrease their accessibility to interchanging travellers (if for example, it is necessary to exit through ticket barriers in order to make use of them).
8.5.4 Opening up interchanges to non-travellers may improve
security issues (by encouraging more people to be in the

8888 ImprovingImprovingImprovingImproving InterchangeInterchangeInterchangeInterchange atatatat IndividualIndividualIndividualIndividual InterchangeInterchangeInterchangeInterchange LocationsLocationsLocationsLocations
GUIDE - Urban Interchanges - A Good Practice Guide Page 106
vicinity), but may also lead to problems if the interchange attracts undesirable elements.
8.5.5 Our Case Studies provided illustrations of a number of facets of the commercial exploitation of interchange space:
• = at Hammersmith (London, UK), a significant element of the funding of the new bus station/London Underground station was leveraged through the associated commercial retail development, adjacent to the station and on the main pedestrian route. Elsewhere, more modest retail activity can still generate useful ancillary income to the transport operators;
• = the volume of retail activity in the interchange space can
be so great that its travel function is lost; for example, on the main concourse at Utrecht Central Station (Netherlands), it is difficult to identify the platform entrances amongst the great variety of retail facades, as is also the case at Gare du Nord (Paris, France).
8.5.6 The logical extension to retail development associated with
interchange is the ‘Village Services’ concept being developed at La Défense (Paris, France). It is based on the principle of integration and interaction between the interchange with other activities and spaces and seeks to demonstrate that the interchange experience can be rewarding in itself and not just part of the flow machine. The philosophy here is that “interchange is not just for transfer (movement) but also for rest and encounter”.
8.5.7 In general, the scale and range of facilities at any one location will reflect both the scale of passenger throughput and the nature of the passenger traffic:
• = the greater the flow of passengers, the greater the demand for facilities and the ability of that demand to support associated commercial activities;
• = passengers making longer journeys are more likely to
require facilities such as luggage storage, and are more likely to have longer wait times associated with longer-distance (and hence less frequent) services.
8.5.8 These dimensions are reflected in some of the standards
systems that have been developed to help operators classify and hence consistently equip interchanges. For example, the UK Railtrack organisation (responsible for the national railway infrastructure in Great Britain, has adopted a classification system(Railtrack, 1998 [335]) as follows:
• = national hubs; • = regional hubs;

8888 ImprovingImprovingImprovingImproving InterchangeInterchangeInterchangeInterchange atatatat IndividualIndividualIndividualIndividual InterchangeInterchangeInterchangeInterchange LocationsLocationsLocationsLocations
GUIDE - Urban Interchanges - A Good Practice Guide Page 107
• = important feeder stations; • = medium staffed stations; • = small staffed stations; and • = small un-staffed stations.
8.5.9 Our surveys of current practice of more than 80 interchange locations across Europe reported in Part 2 revealed a strong positive relationship between the level of service at the interchange (as measured by the number of lines weighted by modal capacity) and the number of facilities.
8.5.10 However, the Case Study visits also demonstrated that older interchanges tended to be less well equipped (for example, (Piraeus, Athens, Greece). This reflects both lack of space in historic public transport facilities, arising from inadequate dimensioning relative to present day levels of demand, and also rising public expectations. A neglected aspect tends to be toilet facilities, which will assume increasing importance with age of population and the closure of facilities elsewhere in urban areas.
8.5.11 The provision of high quality passenger facilities at relatively isolated interchange locations such as individual bus or tram stops is clearly more difficult than within substantial structures such as surface level or underground railway stations. Examples of well designed and attractive passenger shelters and waiting areas have been identified in our case studies (City Terminal Stockholm, Utrecht Central, Hammersmith) and the Hannover BUSTOPS project. On the other hand, we have also seen many examples of extremely basic bus stops, sometimes consisting only of a bus stop pole and flag, without any passenger information or shelter.
8.5.12 In general we suggest that levels of facilities are established at a network level through standards applied to a classification of interchanges. This classification should be based on the type of interchange according to size of site and journeys served.
8.68.68.68.6 ImageImageImageImage
8.6.1 Interchanges are the principal shop window for the public transport system, and as such the image that they convey will be a major influence on public perceptions of public transport. While (arguably) regular passengers, and especially commuters, may not be very sensitive to such things, two aspects will be particularly important to potential or irregular travellers:
• = the extent to which the image projected is one that the passenger feels comfortable being associated with (“...am I the sort of person who goes there...);

8888 ImprovingImprovingImprovingImproving InterchangeInterchangeInterchangeInterchange atatatat IndividualIndividualIndividualIndividual InterchangeInterchangeInterchangeInterchange LocationsLocationsLocationsLocations
GUIDE - Urban Interchanges - A Good Practice Guide Page 108
• = the extent to which the passenger will feel welcomed or threatened by the entrance to the public transport system, especially in terms of reassurance about where to go or where to seek assistance.
8.6.2 For purpose built interchanges, aspects that will influence
these perceptions include:
• = the overall architecture of the interchange; • = the relationship between the interchange and
surrounding buildings; • = the view within the interchange from the street, ideally
with the key facilities (e.g. ticket office, information, platform entrances) placed so as to be visible from the street;
• = visible staff presence, and other attributes that will
enhance the sense of personal security (in particular strong but sympathetic lighting);
• = a high level of maintenance; • = consistent “badging” of the interchange with other parts
of the public transport system through signage and colour schemes.
8.6.3 The image of the public transport system projected through
the appearance of individual interchanges is important to the process of encouraging potential users to commit themselves to using the public transport system. However, if a willingness to consider using public transport has been established, the next stage in turning a potential passenger into an actual passenger is to provide more information about the product on offer.
8.78.78.78.7 InformationInformationInformationInformation
8.7.1 We considered information at the network-level in the previous Chapter, where we showed that the way in which the public transport network as a whole is presented (for example, through a network map) can be used to establish the role of individual interchange locations. The strategy for the provision of information at an individual interchange should flow from this role. It should be oriented towards two groups of passengers:
• = potential passengers planning their journeys, for whom an interchange is the natural point of inquiry at which to find out about services and fares, etc;

8888 ImprovingImprovingImprovingImproving InterchangeInterchangeInterchangeInterchange atatatat IndividualIndividualIndividualIndividual InterchangeInterchangeInterchangeInterchange LocationsLocationsLocationsLocations
GUIDE - Urban Interchanges - A Good Practice Guide Page 109
• = assisting passengers get to, from and between the public transport services within the interchange area.
8.7.2 The minimum information requirement should reflect the
“gateway” or “shop window” role of an interchange, ideally even at the level of individual, isolated bus or tram stops. Table 8.3 sets out a potential hierarchy of information requirements reflecting different scales of interchange.
Table Table Table Table 8888....3333 Information FacilitiesInformation FacilitiesInformation FacilitiesInformation Facilities
StatusStatusStatusStatus MiniMiniMiniMinimum requirementmum requirementmum requirementmum requirement Individual, isolated bus/tram stop Line diagram/map of services
serving this stop; timetable
Adjacent bus/tram stops (ie within easy walking distances)
As above plus location map showing other stops in the area and local features
As above plus: Small rail/bus/metro station System map Fare system descriptors Remote help points Major City Centre hub Staffed inquiry facilities (possibly
combined with ticket sales) 8.7.3 Clearly, as the scale of the interchange increases, and the
number of services for which information needs to be provided grows, then the amount of information that could be displayed increases substantially, to the point where there is the danger of information overload. A consistent convention for the labelling and design of all forms of static information needs to be established at a network-wide level to help users recognise the type of information being offered at a particular point within the interchange.
8.7.4 This is one area in which non-travel related commercial activity at an interchange can be a distinct disbenefit, because retail outlets can create so much information “noise” (through frontage designs, shop names and product displays) that travel-related information gets lost amongst the clutter.
8.7.5 In contrast, a major benefit of real-time information displays is that the amount of information that is shown can be restricted. However, informed and accessible staff provide the preferred source of “real time” information for many passengers.

8888 ImprovingImprovingImprovingImproving InterchangeInterchangeInterchangeInterchange atatatat IndividualIndividualIndividualIndividual InterchangeInterchangeInterchangeInterchange LocationsLocationsLocationsLocations
GUIDE - Urban Interchanges - A Good Practice Guide Page 110
8.7.6 Real time information can thus be provided in four different forms:
• = as large “departure boards”, as at most main line railway stations and airports;
• = as smaller computer-driven displays, suitable for location
at individual bus stops or rail platforms (e.g. Countdown in London, GB);
• = through staffed help-points and inquiry bureaux (e.g. the
Bureau Information Publique in Paris, France; Customer Care Assistants at selected stations on the London Underground);
• = by telephone connection to remote call-centres or control
rooms. 8.7.7 Although real-time information gathering and display has
been commonplace on rail systems for many years, equivalent data capture and information display technology for buses is more recent and in many countries is yet to be in widespread use. Real time information displays offer significant benefits to passengers in terms of reassurance that the location at which they are waiting is correct for their service, and enabling decisions about their journey (e.g. to make better use of waiting time to have a coffee, or to change the planned route because of disruption) to be better informed.
8.7.8 Journey planning information can be provided within the interchange location but also outside and remote to interchanges. A number of public transport operators are experimenting to date with provision of information at home (or work) via the Internet.
8.7.9 Within the interchange locations we strongly recommend the use of staffed information desks such as the Bureau Information Publique (BIP) in Paris for the provision of journey planning information. Another example of good practice is the Customer Care Assistants (CCA) employed by London Underground whose duties extend to an ambassadorial role. Both CCA and BIP as mentioned above can also provide real time information.
8.7.10 Finally, modern technology also provides a very good vehicle for planning information by means of computer terminals inside (and outside) interchanges. Such examples are available in London (see ROUTES), Paris and Utrecht and the better ones include information about how to go from A to B, about the network, transfers, the surrounding area, maps of the origin and destination areas, etc, as well as issue a ticket for the journey.

8888 ImprovingImprovingImprovingImproving InterchangeInterchangeInterchangeInterchange atatatat IndividualIndividualIndividualIndividual InterchangeInterchangeInterchangeInterchange LocationsLocationsLocationsLocations
GUIDE - Urban Interchanges - A Good Practice Guide Page 111
8.88.88.88.8 SignageSignageSignageSignage
8.8.1 The signs that help passengers find their way around an interchange are a special form of information and particularly important to the effective operation of an interchange.
8.8.2 The fundamental components of the signing scheme at an individual interchange location should be set at the network-wide level, with standardised pictograms, colour schemes, font designs, and sizes. The scope of the signing scheme should clearly include all public transport modes (including taxis) but should also make provision for cycle facilities, car parking, and full range of facilities likely to be encountered, including toilets, information points, telephones, shops, etc.
8.8.3 The signing scheme for a particular interchange needs to be designed as a whole, taking into account all significant pedestrian movements to, from and between the public transport services and the surrounding area. Signs will often be the only way in which the nearby presence of public transport facilities will be identified, yet often significant traffic attractors such as shopping centres do not provide any indications of how to get to public transport facilities. A key aspect of the integration of an interchange with the surrounding area is therefore ensuring a sufficiently wide geographical scope for signs.
8.8.4 Within the interchange, signs should reflect the role established for the interchange by its network context (in effect, the network map), which will mould passenger expectations. If the map shows that passengers can transfer from Service A to Service B at a particular interchange location, then signs should provide a consistent trail to show passengers how to do it. The objective should be to provide maximum reassurance that passengers in mid-journey are heading in the right direction, or have arrived at the correct location from which to catch the connecting service.
8.8.5 The need for signing can be minimised by careful overall design of an interchange, for example by providing line-of-sight connections between services, but the scope for doing so is limited within mature systems. As with information more generally, a balance needs to be struck to avoid information overload, that can cause more confusion than clarity. This is a particular problem where information and signage needs to be provided in two different languages.
8.8.6 Standards of good practice have been developed at the operator level (e.g. London Transport) or government level (e.g. Germany), and a number of organisations and operators within European countries have created special symbols (or pictograms) for abbreviating signing messages. Although sharing a common basis to some degree, there is no European

8888 ImprovingImprovingImprovingImproving InterchangeInterchangeInterchangeInterchange aaaatttt IndividualIndividualIndividualIndividual InterchangeInterchangeInterchangeInterchange LocationsLocationsLocationsLocations
GUIDE - Urban Interchanges - A Good Practice Guide Page 112
standardisation. We strongly recommend the development of a European standard, with a moderate number of pictograms, that individual operators can incorporate into individual signage schemes.
8.98.98.98.9 Personal SecuriPersonal SecuriPersonal SecuriPersonal Securitytytyty
8.9.1 Security (as well as safety which is discussed in a following section) is a topic related to both the activity of interchanging (transfer) and the interchange location or space. In our terminology we use the word security to indicate freedom from crime (theft, damage, as well as assaults, criminal bodily harm, etc).
8.9.2 Our findings indicate that at all interchanges, whether large (e.g. Gare du Nord, Utrecht) or small (e.g. Bury, Cradley Heath) security is commonly considered as a major problem though the solution to it is not that common. Although we mainly discuss passenger security our conclusions and recommendations equally apply to passenger and staff (employees) security (one might say that from the operator’s point of view the topic is more acute when employees security is also at risk).
8.9.3 It is important to note that the main issue here (this was first identified in the literature review, see Chapter 4) is the feeling of insecurity amongst interchange users (or potential users) and how to combat it. In practice, statistics of crime, assaults, etc at interchanges are rarely available and what there is available about personal safety incidents on public transport, in general, does not look that uncommon (compared with other public spaces). In most cases the level of incidents cannot explain the top rankings gained by security related issues in market research studies (see for example Utrecht).
8.9.4 Staffing levels is often seen as a major tool to combat lack of security (as well as aid management, maintain safety, etc). However, under limited resources global solutions are very difficult to achieve. In some cases extra staff presence can be achieved with (more or less) current resources (see for example Customer Care Assistants at London Underground major interchanges) and also add assistance, information as well as an ambassadorial role. At the same time it is important to note differences in staff practices across European countries. In Gare du Nord, for example, special effort is necessary to negotiate with the staff and their unions in order to persuade them to take up such roles.
8.9.5 In most European countries police presence (especially armed police) is considered as an important part of the arsenal to combat crime and boost the feeling of security. It is interesting to notice that some GUIDE Partners (especially the British) did not feel comfortable with (excessive) police

8888 ImprovingImprovingImprovingImproving InterchangeInterchangeInterchangeInterchange atatatat IndividualIndividualIndividualIndividual InterchangeInterchangeInterchangeInterchange LocationsLocationsLocationsLocations
GUIDE - Urban Interchanges - A Good Practice Guide Page 113
presence as a solution to the problem and preferred (uniformed) staff presence who could combine basic security duties with customer care.
8.9.6 Note that security (and safety) are also linked with fraud and the measures to combat the feeling of insecurity also combat fraud. Moreover the feeling of insecurity thrives in environments of recurring fraud. Therefore, implementation of efficient and safe gates and control barriers also promote security.
8.9.7 Other measures such as CCTV, help points, etc appear to be relatively cost effective measures for combating the feeling of insecurity. However, in some countries (e.g. Sweden) the law prevents the use of CCTV (which is also a reminder of the limitations of our recommendations). In addition, it appears that significantly more can be gained from such cost effective measures if their presence and effects are more open and widely known. For example, very few people in London know that most of the help-point areas are completely covered by CCTV and that the member of staff responding to a passenger’s request can also see the passenger and surrounding area. More general, it would be possible to increase the number of notices advertising about the presence of CCTV cameras monitoring activities at the interchange on a continuous basis.
8.9.8 Focusing more on the interchange location, we strongly recommend the use of design features to combat the feeling of insecurity. This mainly applies to new or renovated interchanges and the relatively simple design guidelines include:
• = transparency (horizontal and vertical); • = brightness; • = short and wide passageways; • = access to all areas with clear lines of visibility, etc.
8.9.9 These can be achieved by good use of architectural principles or construction materials and can have a significant impact on users’ (and potential) users’ behaviour. A major positive feature of a number of modern Dutch interchanges (singled out as examples of good practice) is bright conditions and transparent architecture. This feature both encourages a feeling of security and introduces a sense of place and direction.
8.9.10 However, even existing (and old) stations or bus and tram stops can significantly gain from minor design improvements or simple redecoration. Also note that cleanliness, good lighting , modern facilities working and presented in good order, and whatever creates a pleasant environment appear to

8888 ImprovingImprovingImprovingImproving InterchangeInterchangeInterchangeInterchange atatatat IndividualIndividualIndividualIndividual InterchangeInterchangeInterchangeInterchange LocationsLocationsLocationsLocations
GUIDE - Urban Interchanges - A Good Practice Guide Page 114
have similar effects on the feeling of security (mainly by association).
8.9.11 Turning to the interactions between the activity of transferring and other activities at an interchange location, it appears that busy shopping areas and retail services promote the feeling of security. This was reported at a number of sites we visited (e.g. Hammersmith, La Défense). On one hand this seems to be a contradiction, if nothing else busy shopping areas are renowned for attracting crime. On the other hand, note that the issue is the feeling of security and in addition, busy shopping areas are also closely monitored by police and private security staff. It is worth mentioning here that evidence from New York (USA) suggests that increased and improved retail facilities played an important part in modernising The Port Authority Bus Terminal and improving its security image.
8.9.12 Finally, turning to the interactions between the interchange location and other surrounding space and activities, it is noted that most of the security problems at an interchange are mainly imported from the surrounding urban areas. The minimum requirement of this condition is that public transport operators or authorities in general, and interchange managers in particular, need to work in close liaison and coordination with local authorities, employers and interest groups. In addition, there may be significant gains in joining the local authorities to also fight the causes of the problem. In general, we believe its worthwhile linking transport policy to other urban social policies directly related to anti crime.
8.108.108.108.10 Operational SafetyOperational SafetyOperational SafetyOperational Safety
8.10.1 By safety we mean freedom from unacceptable risks of personal harm, ie the avoidance accidents and incidents, because of the operations and infrastructure relating to transfer and interchange space. In most European countries it appears under the title of “health and safety” and is addressed by both public transport operators and government.
8.10.2 Health and safety is one aspect of interchanges that is taken very seriously by operators, given high priority and dealt with responsibly and in a corporate fashion. Most operators have strict requirements and standards for health and safety.
8.10.3 At interchanges they cover all areas including platforms, corridors, ticket hall, etc, as well as terminal tracks, control, evacuation procedures, fire precaution. The principle is that interchanges should provide for the free and safe movement of people (including employees at work).
8.10.4 Factors affecting health and safety include:

8888 ImprovingImprovingImprovingImproving InterchangeInterchangeInterchangeInterchange atatatat IndividualIndividualIndividualIndividual InterchangeInterchangeInterchangeInterchange LocationsLocationsLocationsLocations
GUIDE - Urban Interchanges - A Good Practice Guide Page 115
• = the movement of people and their waiting in normal or abnormal operating conditions;
• = provisions to control overcrowding; • = sizing and treatment of surfaces, concourse, ramps,
escalators, etc; • = the suitability of escalators, lifts, conveyors; • = number and size of exits, halls, etc; • = ventilation, lighting, etc.
8.10.5 It is outside our remit to draw general or specific recommendations on the subject but we have searched publications on principles and guidance available in different countries (see Chapter 4: Literature). Note that the operators have in general been successful and competent in this domain and self-regulation is mostly at play. However, in most countries there also exist health and safety guidelines published by statutory bodies which, though, are not intended to set out mandatory standards (see, for example, Health and Safety published in the UK [247g]).
8.118.118.118.11 Standards and ErgonomicsStandards and ErgonomicsStandards and ErgonomicsStandards and Ergonomics
8.11.1 It is worth noting that there is a plethora of references in the literature (see Chapter 4) dealing with standards and guidelines for bus stations, metro stations, bus stops, etc, as well as for the areas where the different modes meet, or kept segregated. They range from LT’s ‘Station Planning Standards Guidelines’ [236] to the German Handbook issued by the Bundesministerium für Verkehr [247d] which includes alignment design with detailed dimensions.
8.11.2 A number of these references have been documented in GUIDE’s reference data base (see D2). Consulting such references can provide some initial ideas about how to tackle an individual problem, especially when there is not enough local experience.


GUIDE - Urban Interchanges - A Good Practice Guide Page 102
RefRefRefReferenceserenceserenceserences DateDateDateDate NameNameNameName TitleTitleTitleTitle CountryCountryCountryCountry PublisherPublisherPublisherPublisher 1994 Office of the Rail
Regulator Meeting of Needs of Disabled Passengers
UK Office of the Rail regulator
1997 London Transport Buses
Design Guidance on Bus Station Signage
UK LT Buses
1997 London Transport Buses
Bus Infrastructure UK LT Buses
1997 Maunsell Transport
Bus Rail Interchange Study UK LT Planning
1997 Soeren, J.W.A. Van NS-norm Toegankelijkheid Stationscomplex. (NS-norm Accessibility Station Complex).
NL RIB TS, Utrecht
1998 London Transport Marketing
Passenger Access Terminal UK LT Marketing
1998 London Underground
Station Planning Standards and Guildelines
UK London Underground Edition Four
1998 Steer Davies Gleave (SDG) for London Docklands Development Corporation
The Seamless Public Transport Journey
UK LDDC
undated
Disabled Persons Transport Committee (DPTAC)
Legibility of Timetables Books and Leaflets
UK DPTAC
1997 Direkt: Verbesserung der Verkhrsverhaltnisse in den Gemeinden, Heft 51
Burgefreundliche und behindertengerechte Gestaltung von Hastellen des offentlichen Personennahverkehrs
DE Bundesministririum fur Gesundheit, Bonn
1996 Handbuch fur Planer und Praktiker
Verbesserung von visuellen informationen im offentlichen Raum
DE Bundesministirium fur Gesundheit, Bonn
1997 Health and Safety Executive
Railway Safety Principles and Guidance: Part 1 and Part 2 Sections B (Stations), F (Trains) and G (Tramways)
UK Health and Safety Executive
1997 Hagen, M. Van Reistijd een relatief begrip. De betekenis van de verplaatsingstijdfactor voor NS. MOAgrafie 2. (Travel time a relative notion. The meaning of travel time ratio for NS).
NL NSR Moa, Utrecht
1997 GMPTE Low floor bus study UK GMPTE 1995 Cranfield
University of London Transport
The Effects of Lift Access on the London Underground
UK London Transport

GUIDE - Urban Interchanges - A Good Practice Guide Page 103
1998 Colin Buchannan & Partners
Transport Interchange: Best Practice UK DETR
1998 Chartered Institute of Transport UK
Passenger Interchange: a practical way of achieving passenger transport integration
UK Chartered Institute of Transport (CIT) UK
1998 Railtrack Development Modern Facilities at Stations: Consultation Report
UK Railtrack plc UK

GUIDE - Urban Interchanges - A Good Practice Guide Page 103
ReferencesReferencesReferencesReferences DateDateDateDate NameNameNameName TitleTitleTitleTitle CountryCountryCountryCountry PublisherPublisherPublisherPublisher 1998 GUIDE Deliverable 2 Literature Review EU 1998 GUIDE Deliverable 3 (Volume 1) Survey of
Current Practice EU
1998 GUIDE Deliverable 3 (Volume 2) Survey of Passenger Perceptions
EU
1999 GUIDE Deliverable 4 Report on Case Study EU 1998 Terzis G. Group of Urban Interchange
Development and Evaluation, Pan European Transport Issues, PTRC
UK PTRC
1999 Terzis G. Identifying Good and Bad Practice in Passenger Transport Infrastructure, Pan European Issues, PTRC.
UK PTRC