guided low-frequency noise from airgun...
TRANSCRIPT
Geophysical Prospecting 32,690-705, 1984.
GUIDED LOW-FREQUENCY NOISE FROM AIRGUN SOURCES*
B . L . N . K E N N E T T and A.J . H A R D I N G * *
ABSTRACT KENNETT, B .N. and HARDING, A.J. 1984, Guided Low-Frequency Noise ..om Airgun Sources, Geophysical Prospecting 32,690-705.
The presence of the water layer in marine seismic prospecting provides an effective wave- guide for acoustic energy trapped between the sea-bed and the sea-surface. This energy persists to large ranges and can be the dominant early feature on far-offset traces. On airgun records, there is commonly a lower frequency set of arrivals following the water-trapped waves. These arrivais are not as obvious with higher frequency watergun sources. By using a combination of intercept-time/slowness (z - p ) mapping on observational data and theoreti- cal modelling, we are able to identify the origin of the events. If a very rapid increase in a seismic wavespeed occurs beneath the sea-bed sediments, a new waveguide is formed bounded by the sea surface and this transition zone. The low frequency waves are principally guided within this thicker waveguide. Numerical filtering in the z - p domain followed by trace reconstruction is very effective in removing the low frequency noise.
INTRODUCTION In marine seismic prospecting, a portion of the seismic energy radiated by the source is trapped in the water layer by multiple reflections between the sea-bed and the sea-surface. This energy persists to large offsets from the source since there is very little energy loss when reflection occurs at near grazing incidence. On the far traces in a marine source gather the waterguided energy is often the dominant early feature, despite the efforts made in array design to minimize the problem. In rela- tively shallow water (5û-150 m depth) these water arrivals are rich in high frequency components for all types of sources.
A characteristic feature of many airgun records is a lower frequency set of arrivals (around 1 6 1 2 Hz) following the water-trapped waves, but with a similar moveout across the receiver array. Such arrivals are much less prominent on water-
* Paper presented at the 45th meeting of the EAEG, Oslo, June 1983. Final version received December 1983. ** Department of Applied Mathematics and Theoretical Physics, University of Cambridge, Silver Street, Cambridge CB3 9EW, England.

NOISE F R O M AIRGUN SOURCES 69 1
gun records recorded in the same area, so that it is clear that the phenomenon-is linked to the stronger low-frequency radiation of airgun sources.
The strength of the low frequency arrivals varies from place to place and can be very noticeable when high velocity rocks occur fairly close to the sea bed. The origin of these arrivals is therefore to be sought in the nature of the sub-sea-bed velocity structure.
We have used a transformation of observed shot gathers into the intercept time/slowness (z - p ) domain to isolate the portion of the data which corresponds to the low frequency arrivals. The range of slownesses is from 0.48 to 0.66 s/km, corresponding to apparent velocities between 2.1 and 1.5 km/s. This suggests that the waves are trapped by some feature of the velocity structure beneath the sea-bed sediments.
We have studied the nature of the seismic wave propagation for slightly simpli- fied velocity models derived from the observations by inversion of the z - p infor- mation. There are two ways of looking at channelled wave propagation in a stratified medium. The first is to look at the normal modes of the velocity structure. Here we find that in some circumstances we can get isolated minima in the group velocity curves for low order modes around 10 Hz which would correspond to the feature seen in the observed data. The second approach is to calculate full theoreti- cal seismograms for a structure so that we can see how the feature is built up from portions of the response. By working in the slowness/frequency domain we are able to concentrate attention on the slowness range we have identified in the data.
The results of this theoretical modelling show that for a rapid increase in a seismic wavespeed at some depth beneath the sea-bed sediments, a waveguide is formed bounded by the sea-surface and this transition zone. The high frequency energy is trapped in the thin water layer, but the lower frequency waves are prin- cipally guided within this thicker waveguide.
OBSERVATIONS A N D z - p MAPPING
In fig. l a and b we show 72-channel single shot gathers for watergun and airgun sources. These gathers were collected along the same line at comparable locations. Both sets of records are shown without any correction for spherical divergence. In each case we have a prominent set of water waves, and the combination of shallow refractions and waterguided energy lasts for nearly 0.6 s on the farthest traces. Apart from the slightly larger amplitudes of the airgun gather, the presence of the fairly strong suite of low frequency arrivals following the water waves is a striking differ- ence between the two gathers. These arrivals disturb the continuity of many of the reflectors, and if an attempt was made to remove them by muting alone, a substan- tial portion of the records would be lost.
In order to try to pin down the cause of these arrivals we have transformed the data into intercept-time/slowness space (z - p ) to give an alternative representation of the behaviour. The mapping scheme we have used is based on applying an inverse Fourier-Bessel transform to the observed data (Harding 1984a). Since a full treat-


NOISE FROM AIRGUN SOURCES 693
ment of the horizontal phase terms is included the transformation preserves ampli- tude information in the z - p plane and compensates for the effects of geometrical spreading. Later arrivals are therefore enhanced since only transmission losses are important. The finite aperture of the recorded data means that the wide-angle reflections from deep interfaces are not recorded, and so the mapped image cannot be more than part of the full response in the z - p plane. Harding (1984a) gives a full discussion of the effects of truncation on such images. A merit of the mapping we have used, which is similar in approach to the plane wave decomposition of Treitel, Gutowski and Wagner (1982), is that we can come back from the z - p domain, for example after filtering, to reconstruct a set of traces in time and dis- tance.
Figures 2a and b shows the results of the z - p mapping on the data sets shown in fig. 1. For small slownesses, i.e., high apparent velocities across the receiver array, the behaviour in the two plots is very similar although the differing frequency content is clearly visible. However, for larger slownesses we see that the airgun results contain a sequence of late arrivals with low frequency. We can identify these with the low-frequency arrivals seen on the original records (fig. 1); if we remove this portion of the z - p response and then transform back to a shot gather section, the low frequency arrivals have been eliminated. The range of slownesses for which this strong feature follows the bottom reflection is from 0.48 up to 0.66 s/km, which corresponds to the propagation speed of sound in the water.
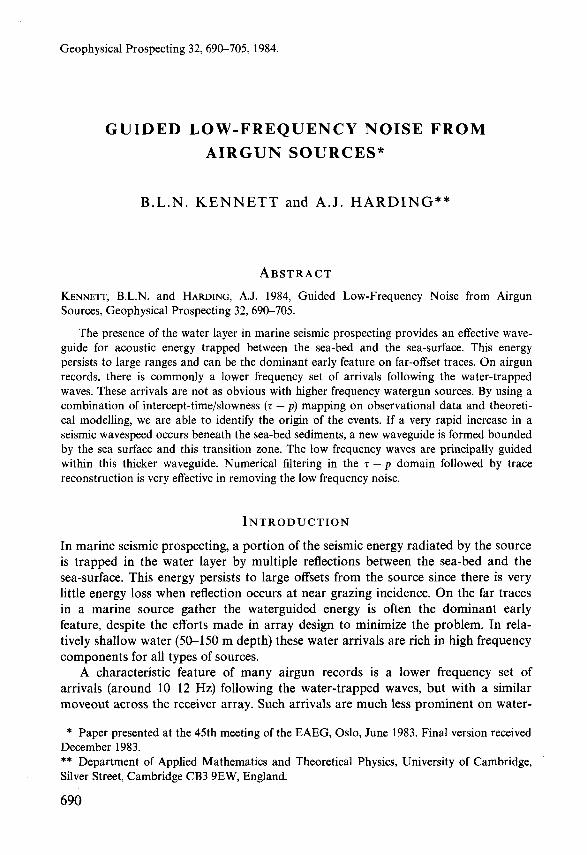
The results of selective filtering in z - p space are illustrated in fig. 3, where we show the reconstruction of the record section for the airgun record of fig. lb. We used a numerical filter in which we zeroed out the portion of the slowness-intercept plane which shows the low frequency train, as indicated in fig. 3a. The position in time was such as to leave the first arrivals unaffected, whilst removing the majority of the guided energy. The reconstructed display in fig. 3b shows that many of the shallow reflectors can be followed out to larger offsets through the region where previously there were strong arrivals (compare with fig. lb). The high-frequency energy appearing on the outermost traces arises from numerical aliasing. We have performed the reconstruction with the broadest frequency band compatible with the spatial sampling of the data, but even so some contamination has occurred. The final results are of slightly lower frequency than the original records.
On the transformed records for the watergun section (fig. 2a) we see a limited train of relatively high frequency waves over the same slowness interval. The large linear feature in both of the z - p displays arises from numerical effects associated with the truncation of the large amplitude seabed reflection at the limits of the array spread. At the very largest slownesses there is a hint of possible P- to S-wave conversions on the airgun display at delays from 0.2 to 0.5 s, associated with the greater penetration achieved with the lower frequency content of the airgun source.
In fig. 4a we show an example of an airgun source gather from deeper water which shows a very prominent reflector at 0.7 s. In this display, without spherical divergence corrections, the low frequency arrivals are not very prominent and only weak reflections are seen at about 2 s. However, once we transform to the z - p domain we get a very different picture (fig. 4b). The prominent reflection can be

c
Cu P
-
II
II
II
II
II
II
II
II
II
II
II
I,
I
II
II
II
II
II
II
II
II
II
II
ll
l E
Y
\
v)
Q
II
II
II
II
II
II
II
II
II
II
II
II
LD
O
."
R
O
,"., '1
. -
,-
y .,*
.*;.-
-. ,..
., , .
.,.. ,,.
. ..,.
..i,.',
...i' .-,..
,. ,fa
.?
..,
,


NOISE F R O M AIRGUN SOURCES 697
traced across the slowness plane with a nearly elliptical trajectory up to the critical point, with associated high amplitudes, where coalescence occurs with the near sea-bed reflections. For larger slownesses than this critical value 0.48 s/km, we have a clear elongated train but with higher frequencies than in fig. 2. The enhancement of deep reflections produced by slowness transformation is clearly seen in the reflec- tions around 2 s. All geometrical effects have been removed without having to make ad hoc decisions about the decay rate.
These examples show that the low frequency wave trains seen on the airgun records are associated with the propagation characteristics of waves with apparent velocities between 2.1 and 1.5 km/s. The upper velocity is too large to correspond to the sediment velocity just below the sea-bed and so we need to look at the effect of deeper structure.
THEORETICAL MODELLING
In order to get some idea of the processes which govern the formation of the low frequency set of arrivals we have seen in the data examples, we have investigated seismic wave propagation in some simple stratified velocity models derived from the observations.
The trajectories of prominent reflections in the z - p plots of figs 2 and 4 were picked by hand. These intercept-time/slowness picks were then used in a nonlinear inversion scheme (Harding 1984b) in which information from both refracted and reflected branches can be combined. This procedure generates models with a sequence of linear gradients separated by velocity jumps; these have been simplified slightly by working in terms of a sequence of uniform layers with constant seismic properties. The resulting models are illustrated in fig. 5. Model S7 (fig. 5b) was derived from the data of fig. 1, it shows a steady gradient in P-wave speed a beneath the sea-bed; the lower portions of the model are somewhat conjectural since they are not well constrained by the inversion. The model S5 (fig. 5a) corresponding to the data of fig. 4a is rather different. The strong reflection which was so clearly seen in fig. 3, is caused by a large increase in P-wave speed at a depth of 650 m; there is a second smaller velocity jump at greater depth. For both models we have introduced plausible distributions of S-wavespeed and density p, although the basic informa- tion was for the P-wave velocities. The model of the sea bed is the same for the two models so that attention could be concentrated on the deeper structure.
Since we are interested in guided-wave phenomena both within the water layer and in the structure beneath a suitable approach to get a qualitative appreciation of the propagation characteristics is to find the dispersion curves for the normal modes which can exist on the structure (e.g., see Kennett 1983). Such normal modes have to satisfy the two conditions of vanishing pressure at the free sea-surface and exponen- tial decay of amplitude in the uniform medium underlying the structure. These requirements are only met along a set of trajectories in the slowness-frequency ( p - O) domain. At fixed slowness we can order the modes in frequency by a mode number which determines the number of zero-crossings in the displacement distribu-

69 8
I I I l I
I
B.L.N. K E N N E T T A N D A.J. H A R D I N G
( a )
1 E
5 n n
Y
aJ
2
3
( b )
1
E
5 n
Y
Q aJ
2
3
M g /m3 km/s
I I
I I I I
! I L - l 7
I I .
P ‘ Ip ‘ i I .
I I . I
I ’ I k 5
i i
Mg/m3 k m/s 1 2 3 4
s5
a
1 5
L I I I L-. ;
I .
I i I .
‘ i I .
I I - 1 i
s7
a
1 Fig. 5. Simplified velocity models derived from inversion of the main reflection trajectories in the z - p plane. (a) Model S5 derived from data in fig. 4; (b) model S7 derived from data in fig. 1.

NOISE FROM AIRGUN SOURCES 699
tion in depth. From our present point of view, the most useful information is the group slowness (g = p + odp/dw) since this determines the relative delays of the different ways in which energy can propagate. In fig. 6 we show the group slowness behaviour as a function of frequency for the two models S7 and S5 of fig. 5.
For model S7 we get relatively broad maxima in group slowness for the lower order modes, and in particular a prominent maximum close to 10 Hz. Each of the group slowness maxima corresponds to an Airy phase (see, e.g., Kennett 1983) and leads to a significant train of waves with frequencies close to 10 Hz. The coincidence with the frequency of the observed train suggests that we are looking at the correct class of structures. Since the water is not very deep (90 m), we also have relatively broad maxima in the higher frequency modes from 20-50 Hz which correspond to the guided propagation in the water layer.
Model S5 has a greater water depth (130 m) and now the group slowness maxima for the higher modes crowd together for the frequency range 25-50 Hz to give a complex pattern. For the lower modes the strong velocity jump also gives pronounced character to the dispersion curves and we have a number of narrow maxima around 10 Hz. Model S5 is less efficient in channelling than model S7; and indeed such a difference is observed in figs 1 and 4.
The dispersion calculations show that there are two different ways in which energy can be channelled through the structure corresponding to different group slowness maxima for the same mode, as in mode 3 for both models S5 and S7. But we are not able to give a definite association of the mode character with the features of the model. An alternative approach which sheds further light on the propagation process is to construct theoretical seismograms for restricted slowness bands so that the results can be directly related to the wavespeed distributions.
In fig. 7 we consider the slowness range from 0.38 to 0.54 s/km corresponding to reflections from depths between 300 m and 1 km. For each of the models S7 and S5 the portions occupied by this slowness range are shown by shading. For model S7 this band includes much of the gradient zone beneath the sediments, whilst for S5 the main feature are reflections from the major velocity jump. The calculations shown in fig. 7 were made using a modification of the calculation scheme described by Kennett (1980) to include all multiples within the surface water layer. ,Weak attenuation (Q, = 500) was introduced in the solid portion to improve the numerical behaviour of the integrands in the calculation and so reduce the total computation time. Each display was calculated using 400 slowness intervals and a frequency band from 0.1 to 45.0 Hz, with an impulsive delta function source. Early arrivals in the displays are numerical artefacts corresponding to the limits of the slowness interval. When results from a number of windows is combined these effects cancel.
The results show the strong influence of multiples in the water, leading to repeti- tion of features with increased delay at greater offsets. For model S7 the reflection display shows a striking low frequency interference pattern arising from the super- position of different orders of multiples in the shallower water. There is also a relatively sharp termination of the reflection pattern which has a moveout similar to that of the water velocity. With the sharp reflector in model S5 we have both P- and S-waves returned from the interface and the multiples appear less prominent,

0.5
s5
I l I I I
f Hz - I l
s7

3
P m
w
u e: 3
O
z 5
c3 d
CA
a E O
e: Ii W
O
z m
CI
I I
-1
~
I I
I I
I I
I I
I I
I I
I I
I I
I I
I I
I I
I: _1 r
-- ----
I
c1
'
I -
N
aÏ----
1-- - ---
h
-[--I ,
I
v)
O
-

IQ
I
N
U z O
CI
- N
..
11
11
11
11
11
11
11
11
11
1I
II
II
II

704 B . L . N . K E N N E T T A N D A.J . H A R D I N G
although the complications of the seismograms imply that they play an important role.
The influence of the water depth on the character of the guided waves in the water layer is clearly seen on the calculations in fig. 8 which show the seismograms for models S7 and S5 corresponding to the slowness band from 0.54-0.68 s/km which includes the water layer itself and the sediments at the sea-bed. In 90 m of water there is an almost continuous band of energy propagating with velocities close to the water velocity (fig. 8b). However, for 130 m water depth this propagation band is beginning to break up into bursts of large amplitude corresponding to multiple reflections from the sea-bed at the critical angle.
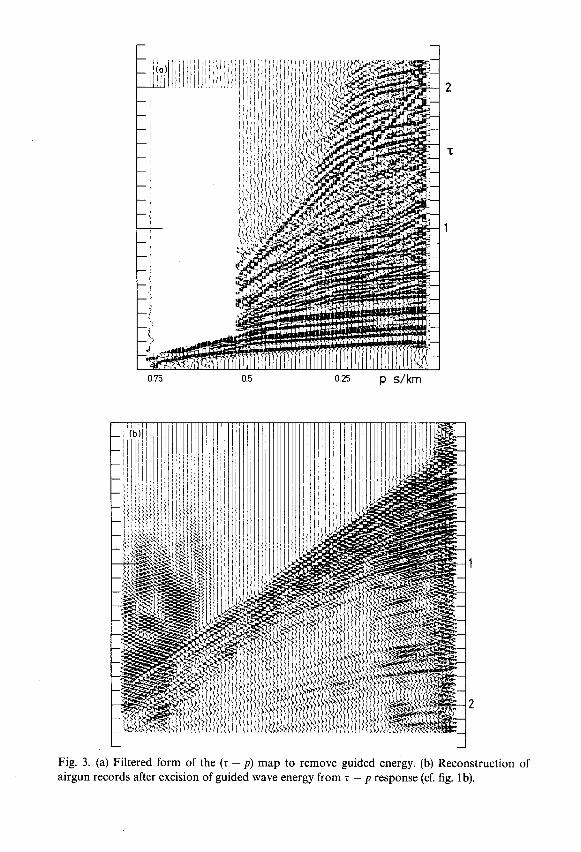
Although the individual slowness panels are interesting, we also need to know how these fit into the complete propagation picture. In fig. 9 we show the full theoretical seismogram calculations for the two models we have been considering. Both sets of seismograms have been convolved with a source pulse derived from the airgun records but are for single source and single receivers rather than for the arrays used in practice. Nevertheless, they show a strong resemblance to the original data and give a good illustration of the guiding phenomena. The calculations cover the slowness range from O to 0.68 s/km and include all surface multiples and internal reverberations within the water layer. The guided waves in the water layer are more strongly developed on the display for model S7, and we begin to see indications of the low frequency arrivals parallelling the high frequency water waves. These would be enhanced with a greater low-frequency component from the source and this would be provided in part by the directivity effects of the source and receiver arrays. For waves of this type which leave the source and reach the receivers at very shallow angles the high frequencies suffer much greater attenuation from the forma- tion of the array sum than the low frequencies. The reflections from depth would not be so affected. In our single source calculations, on the other hand, we have the same source pulse applied to all angles of propagation. For the model S5 the water waves are less continuous. It is also clear that the sharp interface at 650 m is an over-simplification since there is a substantial amount of energy corresponding to conversion between P- and S-waves at this boundary to be seen at large offsets.
DISCUSSION From the theoretical model studies we have been able to isolate the main features of the propagation problem. We see how these influence the character of the chan- nelled wave phenomena in realistic situations.
Normally, there is significant energy guided in the water layer that forms a continuous band once the water depth becomes shallower than about 100 m. The precise character of this set of water waves is determined by the nature of the seabed. If high P-wavespeed material occurs just at the surface, water multiples are very strong and coalesce at larger ranges to give a large guided signal.
The low velocity arrivals seen on the airgun records can be associated with waves trapped between the sea-surface and a zone corresponding to a rapid increase

NOISE F R O M AIRGUN SOURCES 705
in P-wavespeed occurring beneath the sea-bed. There is then coupling between the multiples in the water layer itself and the multiple reflections between the transition zone and the surface. The propagation in this complex waveguide depends on the sharpness of the transition zone and the depth at which it occurs. If it is too deep the various multiple paths separate and no coherent wavetrain is formed. For the examples we have studied it would appear that a steep velocity gradient is slightly more effective than a major discontinuity in producing suitable conditions for wave trapping. For the slowness range corresponding to the gradient there is complete reflection from the gradient zone whereas some energy is transmitted through even a sharp interface.
In summary, strong low-frequency arrivals are most likely when relatively high seismic wave speeds occur close to the sea-bed and arise from the trapping of energy between the high-velocity region and the sea-surface.
ACKNOWLEDGMENTS
We would like to thank Seismograph Services Ltd and Horizon Exploration for the provision of the data sets which led us to investigate this class of guided noise.
REFERENCES HARDING, A.J. 1984a, Slowness-time mapping of near offset reflection seismic data, Geophys-
HARDING, A.J. 1984b, Inversion methods for slant stacks of near offset data-non linear
KENNETT, B.L.N. 1980, Seismic waves in a stratified half space II-Theoretical seismograms,
KENNETT, B.L.N. 1983, Seismic Wave Propagation in Stratified Media, Cambridge University
TREITEL, S., GUTOWSKI, P.R. and WAGNER, D.E. 1982, Plane-wave decomposition of seismog-
ical Journal of the Royal Astronomical Society, 79.
inversion, Geophysics, (in press).
Geophysical Journal of the Royal Astronomical Society 63, 1-10.
Press.
rams, Geophysics 47, 1375-1401.