final final part 2 noise final report-dgr jll 2 -dgr · pdf filecurtains, like has been shown...
TRANSCRIPT

FINAL REPORT
Methods to Reduce Lateral Noise Propagation from
Seismic Exploration Vessels
Part 2:
3D Acoustic Analysis Including Attenuation of the Effectiveness of the Bubble Curtain Concept
Contract MO8PC20003 Issued by the Minerals Management Service
U. S. Department of Interior
Proposal Objective:
Item 5:
“Reduce Lateral Noise Propagation from Seismic Exploration Vessels.”
July 2010
Contractor: Stress Engineering Services, Inc
PN 119364
Contact: Ray R. Ayers, Ph.D., P.E. Phone: (281) 955-2900
E-mail: [email protected] 13800 Westfair East Drive
Houston TX 77041
Part 2: Methods to Reduce Lateral Noise Propagation from Contract MO8PC20003 Seismic Exploration Vessels July 2010
Stress Engineering Services, Inc. i SES PN 119364
DISCLAIMER This report has been reviewed by the U.S. Bureau of Ocean Energy Management,
Regulation and Enforcement and approved for publication. Approval does not signify
that the contents necessarily reflect the views and policies of the Service, nor does
mention of trade names or commercial products constitute endorsement or
recommendation for use.

Part 2: Methods to Reduce Lateral Noise Propagation from Contract MO8PC20003 Seismic Exploration Vessels July 2010
Stress Engineering Services, Inc. i SES PN 119364
TABLE OF CONTENTS
PAGE NO.
DISCLAIMER ................................................................................................................... i
ABSTRACT ..................................................................................................................... 2
INTRODUCTION............................................................................................................. 3
KEY CONCLUSIONS AND RECOMMENDATIONS FROM PART I ............................... 3
RECOMMENDATION FOR FURTHER WORK IN PART 2............................................. 4
THE SEARCH FOR NOISE REDUCTION OPTIONS IN PART 1 ................................... 4
PART 2 SCOPE OF WORK ............................................................................................ 6
PART 2 REFINEMENTS IN THE ACOUSTIC ANALYSIS .............................................. 7
MODELING APPROACH ................................................................................................ 9
ANALYSIS RESULTS ..................................................................................................... 9
CONCLUSIONS FROM THE JASCO ANALYSIS........................................................... 9
RECOMMENDATIONS................................................................................................. 10
CONCLUDING REMARKS ........................................................................................... 11
ACKNOWLEDGMENTS................................................................................................ 12
REFERENCES.............................................................................................................. 12
APPENDIX: MODEL-BASED ASSESSMENT OF AIRGUN ARRAY NOISE
MITIGATION USING A BUBBLE CURTAIN
Part 2: Methods to Reduce Lateral Noise Propagation from Contract MO8PC20003 Seismic Exploration Vessels July 2010
Stress Engineering Services, Inc. 2 SES PN 119364
METHODS TO REDUCE LATERAL NOISE PROPAGATION FROM
SEISMIC EXPLORATION VESSELS
Part 2:
3D Acoustic Analysis Including Attenuation of the Effectiveness of the Bubble Curtain Concept
Ray R. Ayers, PhD, P.E.
Stress Engineering Services, Inc. Houston, Texas, USA
Warren T. Jones, PhD, P.E.
Consultant Houston, Texas, USA
David Hannay, M.Sc. JASCO Research, LTD. Victoria, B.C., Canada
ABSTRACT
This paper covers the development of methods and equipment for reducing lateral noise propagation from seismic exploration vessels operating in the Alaskan Beaufort and Chukchi Seas. Oil exploration activities are currently taking place or are planned, and there is a need for creating methods and equipment to reduce lateral noise propagation from seismic exploration.
This project is supported by the U.S. Bureau of Ocean Energy Management, Regulation and Enforcement, which has the responsibility and authority to ensure that oil and gas exploration and production activities are conducted in a safe and environmentally sound manner.
The reader is referred to our initial report, which we now label as Part 1:
Methods to Reduce Lateral Noise Propagation from Seismic Exploration Vessels Contract M07RS13346 - Issued by the Minerals Management Service
Contractor: Stress Engineering Services, Inc. April 2009 (See also Ayers (2009)
Three principal areas have been explored: (a) Attenuating lateral noise with air bubble curtains, like has been shown in the literature, or with some special bubble curtain material, acting as a more solid curtain-like barrier, (b) Making arrays more directional, and thus narrow the cone of sound, and (c) Changing the structure of the airguns to reduce high frequency sound (noise) while maintaining the strong source signal needed for exploration purposes.

Part 2: Methods to Reduce Lateral Noise Propagation from Contract MO8PC20003 Seismic Exploration Vessels July 2010
Stress Engineering Services, Inc. 3 SES PN 119364
This report, labeled Part 2, shows that as we kept refining our acoustic analysis to include 3D sound propagation and noise attenuation within the bubble plume, we have learned, unfortunately, that deploying bubble curtains outboard of the seismic arrays towed by the same exploration vessel cannot produce the sought-after noise reduction. This result comes after we found promising indications in the literature [Sixma (1996), and Sixma and Stubbs (1996), for instance] that bubble curtains, if designed properly, would work.
Since our work is ‘research’, there is great value in knowing what will not work, so that we can turn our attention to noise attenuation methods that may work (if additional research proves it so).
INTRODUCTION
This bubble curtain evaluation project, now completed, was aimed at creating methods and equipment for reducing lateral noise propagation from seismic exploration vessels operating in the Alaskan Beaufort and Chukchi Seas where oil exploration activities are currently taking place or are planned.
The Bureau of Ocean Energy Management, Regulation, and Enforcement (BOEMRE), formerly the Minerals Management Service, an agency of the U. S. Department of Interior, has the responsibility and authority to ensure that oil and gas exploration and production activities have a minimal impact on the environment and are conducted in a safe and environmentally sound manner.
Part 1 of this BOEMRE-funded research effort included a literature synthesis and review to identify existing seismic exploration technologies associated with firing airgun arrays, and developing promising methods and technologies that could potentially reduce the lateral propagation of sound from those airguns. Included in the scope are evaluation, assessment and comparison of noise reduction technologies that could be used to reduce the lateral propagation of sound sources from seismic exploration vessels. Excluded in this project was an investigation of specific effects of acoustic noise on the various marine mammals.
The key objective of this Part 2 research is to discover and provide analytical proof-of-concept of a reliable cost-effective method and equipment to significantly reduce lateral noise from seismic airgun activities in the Alaskan Beaufort and Chukchi Seas. Implied in this objective is that we want to minimize detrimental effects to the source signal while we are reducing lateral noise.
KEY CONCLUSIONS AND RECOMMENDATIONS FROM PART I
1. Of all of the concepts for lateral noise reduction considered, the simple air bubble curtain, produced by a streaming manifold on either side of the marine seismic

Part 2: Methods to Reduce Lateral Noise Propagation from Contract MO8PC20003 Seismic Exploration Vessels July 2010
Stress Engineering Services, Inc. 4 SES PN 119364
exploration vessel, outboard of the airgun arrays, was found to be the most practical.
2. Contrasted with deployment of more massive structural barrier systems,
deployment of air manifolds – simple inexpensive hoses streaming on either side of the vessel - was relatively simple, and the operational reliability of such manifolds should be relatively high.
3. Fluid dynamics analyses and design work on the air bubble curtain system
provided key sizing information for the manifolds, nozzles, air pressure and compressor horsepower requirements, and bubble parameters needed for the acoustic analysis.
4. We have found that a practical limit on the manifold is about 20 m. Deeper
depths require excessive amounts of horsepower, and the manifold diameter becomes too large to be practically deployed and recovered.
5. Preliminary Two-dimensional acoustic analysis results showed that that deploying
an air bubble curtain outboard of marine seismic vessels to reduce lateral noise could possibly achieve a noise reduction of 20 dB or more. But this preliminary conclusion needed analytical confirmation using three-dimensional analysis before much larger sums of money would be spent on full scale offshore testing.
RECOMMENDATION FOR FURTHER WORK IN PART 2
The acoustic analysis needs to be expanded to a three-dimensional analysis, and the shallow-water seafloor effects should be included. Additionally, the effect of sound attenuation within the bubble curtain must be included in order to achieve the most realistic conditions possible before engaging in full scale testing.
THE SEARCH FOR NOISE REDUCTION OPTIONS IN PART 1
After the initial literature search found papers on marine seismic noise control by Mr. William Dragoset, we contacted him and sought out advice. Mr. Dragoset has spent his career in marine seismic work for Western Geco, designing airgun arrays for seismic exploration of oil and gas. He told us to look in three areas to find potential areas for noise reduction:
1. Attenuate lateral noise with air bubble curtains, like has been shown in the literature, or with some special bubble curtain material, acting as a more solid barrier.
2. Make arrays more directional, and thus, narrow the cone of sound.
Part 2: Methods to Reduce Lateral Noise Propagation from Contract MO8PC20003 Seismic Exploration Vessels July 2010
Stress Engineering Services, Inc. 5 SES PN 119364
3. Change the design of airguns to reduce high frequency sound (noise) while maintaining the strong source signal needed for exploration.
But what are the attributes of a “good solution” for noise reduction of a marine seismic system? From personal experience of the primary author with developing airgun float systems for the RV Shell America, see Ayers (1988), the following attributes were determined to be the most appropriate:
High reliability of any deployed noise reduction towed systems Low weight and volume to handle Easy to deploy, recover and store Low continuous horsepower requirement of any powered noise reduction system Low drag of deployed and towed in-the-water systems Low risk of physical interference with standard towed seismic arrays and listening
systems. Low risk of detrimental acoustic interference with standard towed seismic arrays
and listening systems. Minimum changes to the standard marine seismic system
With these attributes in mind, we focused on each of the three areas for noise reduction above. We used traditional brainstorming to develop possible concepts to consider.
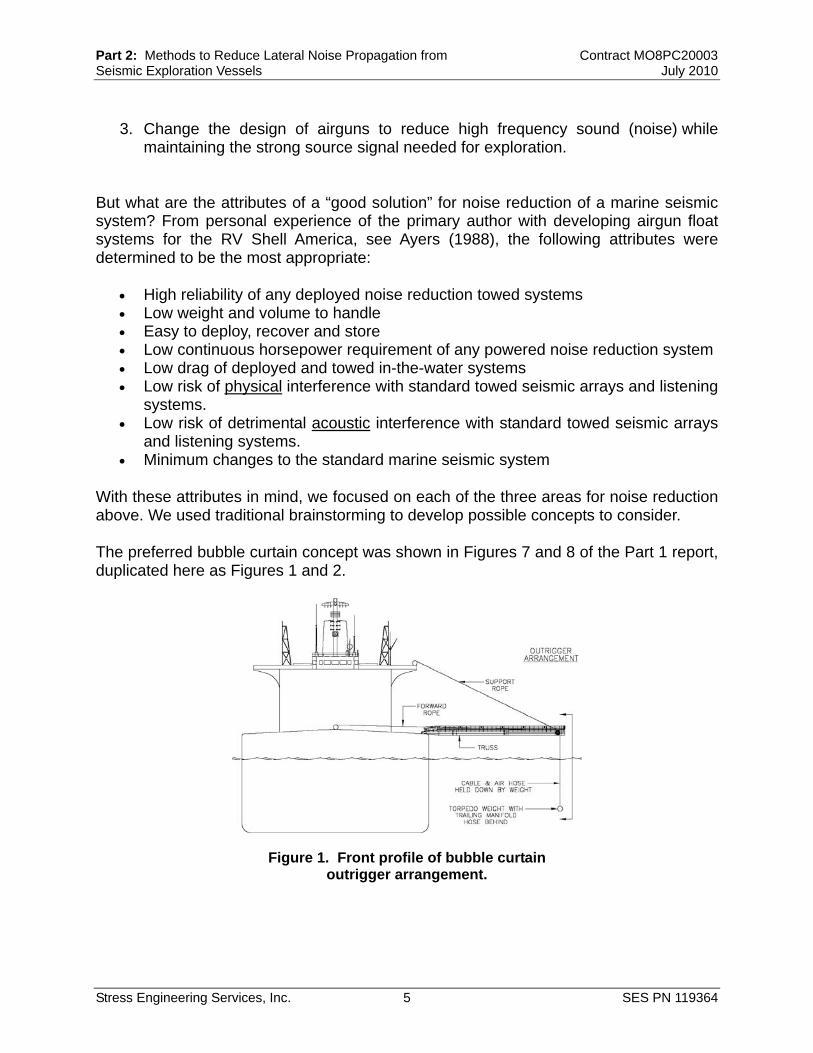
The preferred bubble curtain concept was shown in Figures 7 and 8 of the Part 1 report, duplicated here as Figures 1 and 2.
Figure 1. Front profile of bubble curtain
outrigger arrangement.

Part 2: Methods to Reduce Lateral Noise Propagation from Contract MO8PC20003 Seismic Exploration Vessels July 2010
Stress Engineering Services, Inc. 6 SES PN 119364
Figure 2. Side profile of bubble curtain concept.
PART 2 SCOPE OF WORK
In Part 2 we have focused on refining the acoustic analysis of the most promising opportunity for lateral noise reduction:
1. A towed air bubble hose, like that depicted in Figures 7 and 8 and tested in 1996
by Sixma (1996) is very simple to set up and operate, and it causes only minimal fluid drag, making the support system relatively light. This is a direction that is very promising. Bubble curtains are already being used to reduce noise from static noise sources. If a physical curtain, perhaps having bubbles imbedded, is used, the fluid frictional drag on the "flag" will require higher forces in the support structure, and could be fraught with flutter, creating additional drag. Problems with the durability of a physical curtain is an issue over time in use as compared with that of a manifold hose, and deployment and recovery of the curtain will be more difficult than reeling out and in the manifold hoses.
Pending the results of the 3D analysis using attenuation, we have held the two remaining opportunities for future consideration:
2. Making arrays more directional is more the responsibility of the geophysical
operator and its oil company client. Thus, we did not believe that we should interfere with that relationship. The BOEMRE can suggest that the responsible people consider this potential opportunity. Even so, we considered towing a parabolic reflector to be deployed over the towed arrays. If such a reflector could be deployed successfully, the arrays can be focused. But deploying such a broad floating structure above the airgun arrays, and towing it behind the vessel, along with the arrays and streamer cables, might be a very risky effort because of potential collisions and entanglements.
3. Changing the structure of airguns to add lateral noise reducers without affecting
the required source signal would mean that the airgun manufacturers, Bolt and

Part 2: Methods to Reduce Lateral Noise Propagation from Contract MO8PC20003 Seismic Exploration Vessels July 2010
Stress Engineering Services, Inc. 7 SES PN 119364
Sercel, would have to develop and test a totally new product – and such a development would be outside the scope and funding of this relatively small research project.
PART 2 REFINEMENTS IN THE ACOUSTIC ANALYSIS
In continuing collaboration with Mr. John Ward of Shell Offshore Inc., an interested industry participant in our project, we have worked with Shell to acquire the 3D acoustic computer analysis of the bubble curtain from JASCO Applied Sciences of Victoria B.C. Canada. The prior 2D analysis and the 3D analysis were performed by JASCO and funded by BOEMRE, so Shell agreed to fund the present 3D analysis work of JASCO in which noise attenuation within the bubble curtain is addressed.
The purpose of this Part 2 modeling study is to better predict the effectiveness of bubble curtains at reducing noise levels to the sides of airgun arrays by treating the 3D problem as well as noise attenuation within the bubble plume. Our preliminary modeling study, reported in Part 1, considered absolute pressure reduction as a function of sound frequency due to sound propagation through a specific air curtain configuration. The present work builds on the previous study by incorporating source pressure signatures computed for an a typical airgun array, accounting for multiple acoustic reflections between the two bubble curtains, and modeling the propagation of the pressure waves in both shallow and deep water where acoustic interactions with seabed can influence the received sound levels. Additionally attenuation of sound within the bubble plume is addressed. The Appendix contains a very detailed description of the model.
In summary, the equipment configuration considered in all of the 3D analysis work includes an airgun array with three sub-strings (groups of airguns in a line), with eight guns in each substring and 3 substrings towed 8 m horizontally apart. The individual airgun positions within the overall array are provided in Table I. The airgun array is towed at 6 m depth. The bubble curtains are modeled as uniform layers 4.3 m in thickness, generated by air released from manifolds towed at 20 m depth and separated by 36 m. This configuration provides a 10 m separation between the outer airgun substrings and the curtains. The bubble curtain dimensions are based on the same configuration as the preliminary study.
We have found that a practical limit on the manifold is about 20 m. Deeper depths require excessive amounts of horsepower, and the manifold diameter becomes too large to be practically deployed and recovered.

Part 2: Methods to Reduce Lateral Noise Propagation from Contract MO8PC20003 Seismic Exploration Vessels July 2010
Stress Engineering Services, Inc. 8 SES PN 119364
Table 1: Airgun array configuration used in this modeling study.
Gun Volume (cu.in.) Offset from front (m) Offset from centre (m) 1 30 0 0 2 50 3 0 3 100 6 0 4 150 9 0 5 125 12 0 6 125 12 0 7 250 15 0 8 250 15 0 9 30 0 +8
10 50 3 +8 11 100 6 +8 12 150 9 +8 13 125 12 +8 14 125 12 +8 15 250 15 +8 16 250 15 +8 17 30 0 -8 18 50 3 -8 19 100 6 -8 20 150 9 -8 21 125 12 -8 22 125 12 -8 23 250 15 -8 24 250 15 -8
Total 3240 n/a Na
This study follows from a preliminary study that considered the acoustic transmission coefficient as a function of frequency and incident angle of a specific bubble curtain configuration. The prior study did not account for multiple reflections between curtains, sound escaping beneath the curtains, or the subsequent propagation of sound in the ocean. In the present study, a full-wave airgun array source model was used to compute notional pressure signatures in the 5 Hz to 400 Hz frequency range for the individual airguns of a typical commercial airgun array configuration. A wave number integral-based modeling approach was developed to account for multiple acoustic reflections between the interior walls of the curtains and the subsequent sound transmission through the curtains upon each reflection and its final escape beneath the curtains.
The model also treated subsequent acoustic interactions with the seabed. The combined source and propagation models generated broadband pressure signatures at specified receiver locations. The model was applied to compute received sound levels as a function of receiver depth and distance from the airgun array along a path oriented perpendicular to the tow direction including interactions with the curtains.

Part 2: Methods to Reduce Lateral Noise Propagation from Contract MO8PC20003 Seismic Exploration Vessels July 2010
Stress Engineering Services, Inc. 9 SES PN 119364
Modeling was carried out for two realistic ocean environments: 50 m and 500 m water depth.
MODELING APPROACH
The far-field pressure generated by a seismic airgun array is generally substantially greater than that of the individual constituent airguns, but sound emission is direction-dependent. The acoustic source level of the array varies considerably in both the horizontal and vertical directions due to the complex interactions and arrival time differences of the signals from different airguns. These interactions can be accounted for to predict the sound fields generated by the airgun array in any specified direction. The direction-dependent composite source pressure signature can be computed by summing the contributions of the array elements with appropriate time delays that depend on the relative positions of individual airguns within the array and the direction from the array at which the sound is measured.
JASCO Applied Sciences has developed the full-waveform airgun array source signature model AASM [MacGillivray, (2006)] to compute the source level and directionality of airgun arrays. The source model is based on the physics of the oscillation and radiation of airgun bubbles, as described by Ziolkowski (1970). The model solves a set of parallel differential equations that govern the airgun bubble oscillations.
ANALYSIS RESULTS
A full report on the JASCO analysis is provided in the Appendix. Please refer to this appendix for the methods used and the detailed results obtained.
CONCLUSIONS FROM THE JASCO ANALYSIS
This study used an airgun array source model and a wavenumber integral acoustic propagation model to examine the effectiveness of 20 m vertical air curtains towed on either side of an industry standard 3240 cubic inch 3-string 24-airgun source array towed at 6 m depth. The air curtains were spaced 36 m apart. The models were used to estimate peak, Sound Exposure Level (SEL) and root-mean-square (RMS) pressure levels at receivers near the ocean surface, mid-water and near the bottom in two environments: a 500 m deep environment representative of Gulf of Mexico conditions, and a 50 m shallow environment representative of Chukchi Sea conditions. Model results showed generally poor performance of the air curtains at reducing sound levels except at short distances from the source where direct path sound propagation

Part 2: Methods to Reduce Lateral Noise Propagation from Contract MO8PC20003 Seismic Exploration Vessels July 2010
Stress Engineering Services, Inc. 10 SES PN 119364
was directly shielded by the curtains. In most cases the model predicted little difference between scenarios with and without curtains in place. It appears that sound reflects internally between the curtains with only moderate losses until it escapes beneath. In some circumstances, especially in deep water conditions, the scenarios with curtains in place produced higher sound levels than without. This behavior is attributed to two effects: (1) the curtains steer energy down to the deeper receivers, and (2) the curtains selectively attenuate the surface reflected paths more strongly than the corresponding direct paths. The surface reflected paths normally destructively interfere with the direct paths, but their attenuation decreases the interference thereby increasing the overall received sound levels. The bottom line from this work is that the bubble curtain would not be a viable noise attenuator as proposed. It is possible that the nozzles for bubble production could be dragged on the seafloor at the shallow water depth (50 m) in order to capture the noise within the bubble curtains, but the power to produce effective bubbles would be exorbitant, and the risk of entanglement of the weighted nozzles would be high.
RECOMMENDATIONS
1. We do not advise further development of the bubble curtain for lateral noise
attenuation because little noise, if any would be attenuated.
2. Because the bubble curtain solution will not be viable, then future research should be directed to the following two areas:
a) Making arrays more directional - This is more the responsibility of the
geophysical operator and its oil company client. Thus, we did not believe that we should interfere with that relationship. The BOEMRE can suggest that the responsible people consider this potential opportunity. Even so, we considered towing a parabolic reflector to be deployed over the towed arrays. If such a reflector could be deployed successfully, the arrays can be focused. But deploying such a broad structure, and towing it behind the vessel, along with the arrays and streamer cables, might be a very risky effort due to potential collisions and entanglements.
b) Changing the structural shape of airguns to add lateral noise reducers
without affecting the required source signal would mean that the airgun manufacturers, Bolt and Sercel, would have to develop and test totally new products – and such developments would be outside the scope and funding of this relatively small research project.

Part 2: Methods to Reduce Lateral Noise Propagation from Contract MO8PC20003 Seismic Exploration Vessels July 2010
Stress Engineering Services, Inc. 11 SES PN 119364
REVIEWERS COMMENTS
The following comments were offered by BOEMRE reviewers of the report draft:
Comment 1: It would have been nice to see a depth of 30 m instead of 50 m for the depth to the seafloor for the Alaska case. This is more typical of the depths encountered here. Energy would still have leaked between the base of the bubble curtain and the seafloor, but it should have been less.
Reply: Yes, 30 m or at least 40 m would also have been a good choice for testing. We used 50m as a rounded-up number for depths near the Shell (Burger) lease blocks that are 42-45m depth. The Statoil lease areas are closer to 40m. The ConocoPhillips (Klondike) lease areas however are shallower at 34-38m. The curtain may have been more effective there as Joe mentioned. At this point we would have to perform additional model runs to treat the shallower depth, and that would take additional time and budget.
Comment 2: A second point that I need to think about more is the reflectivity of the bubble curtain. I personally suspect that the models are not capable of adequately predicting this. I would not be so quick to dismiss this technology. Field experiments may show the curtains to be more absorptive than reflective, especially if the bubble sizes and densities can be varied.
Reply: Regarding curtain reflectivity and capability of models to predict: Measurements are the best way to obtain this information. The models show high reflectivity which leads to minimal acoustic energy loss. In reality the reflections may be weaker due to bubble absorption. Our models include some absorptive loss based on simple theory of UT but perhaps underestimate that effect. We must remember that the purpose of this work was to use mathematical modelling of this complex problem in order to determine if there is sufficient promise of this method to justify the high cost of offshore confirmation testing
CONCLUDING REMARKS
Based on all of the perceived attributes of a successful lateral noise mitigation method and equipment discussed in the introduction and in the Part 1 report, we believed that the bubble curtain was the most viable solution: But in the end, the physics of acoustic analysis could not support a result of reasonable noise reduction. So we now believe that any future research done in this area should be directed to the work described in 2(a) and 2(b) above. We thank the BOEMRE for the opportunity to prove out the bubble curtain approach for noise reduction, and we regret that in the end, the results were not positive. As we look back on the work, we cannot see where our process was flawed. The literature reported some positive results, the 2D results were economical and positive, and only

Part 2: Methods to Reduce Lateral Noise Propagation from Contract MO8PC20003 Seismic Exploration Vessels July 2010
Stress Engineering Services, Inc. 12 SES PN 119364
the 3D results were not positive because we had included no attenuation. The obvious next step was to model the noise attenuation within the bubble plume, and we did that. But in the end we could not prove any significant noise reduction.
ACKNOWLEDGMENTS
Thanks is due to Mr. John Ward of Shell, who has given us encouragement and advice throughout the whole project, and has provided funding for the final part of the analysis. Finally the authors wish to thank the U.S. Bureau of Ocean Energy Management, Regulation and Enforcement for project funding, and Mr. Joseph Mullin of the BOEMRE for his project management assistance and encouragement.
REFERENCES
Ayers, R., Hannay, D., and Jones, W., (2009), Methods to Reduce Lateral Noise Propagation from Seismic Exploration Vessels, OMAE2009-79673. Ayers, Ray R., U.S. Patents 4,724,788, 4,974,995, 5,046,443, 4,726,314 and 4,709,356, 1988. MacGillivray, A. O., An Acoustic Modeling Study of Seismic Airgun Noise in Queen Charlotte Basin, M. Sc. Thesis, University of Victoria, BC., 2006. Sixma, E. (1996), “Bubble Screen Acoustic Attenuation Test #1”. Western Atlas/Western Geophysical Report. Conducted for Shell Venezuela. Sixma, E. and Stubbs, S. (1996), “Air Bubble Screen Noise Suppression Tests in Lake Maracaibo”. Sociedad Venexolana de Ingenieros Geofiscos, Congreso Venezolano de Geofisica. Ziolkowski, A., A Method for Calculating the Output Pressure Waveform from an Air Gun, Geophys. J.R. Astr. Soc. 21-137-161, 1970.

Part 2: Methods to Reduce Lateral Noise Propagation from Contract MO8PC20003 Seismic Exploration Vessels July 2010
Stress Engineering Services, Inc. SES PN 119364
APPENDIX
MODEL-BASED ASSESSMENT OF AIRGUN ARRAY NOISE MITIGATION USING A BUBBLE CURTAIN

MODEL BASED ASSESSMENT OF AIRGUN ARRAY NOISE MITIGATION USING A BUBBLE CURTAIN
Version 1.0
By
Caitlin O’Neill
Graham Warner
David Hannay
JASCO Applied Sciences
Suite 2101 – 4464 Markham Street Victoria, B.C. Canada V8Z 7X8
Tel: +1.250.483.3300
Email: [email protected]
for
Stress Engineering Services Inc.
13800 Westfair East Dr. Houston, TX 77041
&
Shell Offshore Inc. 910 Louisiana St
Houston, TX 77002
20 July 2010

1
Table of Contents
TABLE OF CONTENTS ............................................................................................................. 1
1 ABSTRACT ....................................................................................................................... 2
2 INTRODUCTION............................................................................................................. 2
3 PURPOSE .......................................................................................................................... 3
4 MODELING APPROACH .............................................................................................. 4 4.1 Airgun array source levels ............................................................................... 4 4.2 Bubble curtain effects ...................................................................................... 6 4.3 Sound propagation using the wave number integral model ............................ 9 4.4 Noise metrics ................................................................................................ 13
5 MODELING ENVIRONMENTS .................................................................................. 14 5.1 Bathymetry and seafloor properties .............................................................. 14 5.2 Water sound speed profile ............................................................................ 15 5.3 Frequencies .................................................................................................. 15
6 MODEL RESULTS ........................................................................................................ 16 6.1 Pressure synthetics ....................................................................................... 16 6.2 SEL results .................................................................................................... 27 6.3 Peak SPL results ........................................................................................... 33
7 DISCUSSION OF RESULTS ........................................................................................ 39
8 CONCLUSIONS ............................................................................................................. 40
9 LITERATURE CITED .................................................................................................. 42

2
1 Abstract
Stress Engineering Services Inc. and Shell Offshore Inc. have contracted JASCO Applied Sciences to perform a computer modeling study to investigate the effectiveness of bubble curtains at reducing underwater sound pressure levels received to the sides of airgun arrays operated in typical ocean environments. Airgun arrays are the primary seismic sources used for marine seismic survey programs. There is concern that the high sound levels produced by airgun arrays could lead to auditory injury or adverse behavioral reactions by marine wildlife. The goal of the study is to determine if bubble curtains could provide a means of reducing the sound energy and consequent impacts on marine wildlife.
This study follows from a preliminary study that considered the acoustic transmission coefficient as a function of frequency and incident angle of a specific bubble curtain configuration. The initial study did not account for multiple reflections between curtains, sound escaping beneath the curtains, or the subsequent propagation of sound in the ocean. In the present study a full-wave airgun array source model was used to compute notional pressure signatures in the 5 Hz to 400 Hz frequency range for the individual airguns of a typical commercial airgun array configuration. A wavenumber integral – based modeling approach was developed to account for multiple acoustic reflections between the interior walls of the curtains and the subsequent sound transmission through the curtains upon each reflection and its final escape beneath the curtains. The model also treated subsequent acoustic interactions with the seabed. The combined source and propagation models generated broadband pressure signatures at specified receiver locations. The model was applied to compute received sound levels as a function of receiver depth and distance from the airgun array along a path oriented perpendicular to the tow direction including interactions with the curtains. Modeling was carried out for two realistic ocean environments: 50 m and 500 m water depth.
The results indicate that for ranges of at least 2 km from the source, mitigation using the bubble curtain is not particularly effective and in some cases led to increased sound levels over the corresponding unmitigated case. In some cases at very close ranges, the bubble curtain reduces sound levels for receivers near the sea surface due to direct shielding. This effect tends to diminish with receiver depth and range as multiply-reflected sound paths eventually leak out below the curtain or reflect off the bottom to ensonify the area directly shielded by the curtain. Sound levels were in many cases higher for deeper receivers with the air curtains than without. This appears to have occurred because surface-reflected acoustic paths are more strongly attenuated than direct paths. The surface paths would otherwise destructively interfere with direct acoustic paths reducing the overall sound received.
2 Introduction
Airguns produce underwater sounds by rapidly releasing highly compressed air into the surrounding water. The pressurized bubble is initially small but starts to increase in size before undergoing damped oscillations. The resulting acoustic pressure wave emitted into the water is proportional to the pressure variation within the oscillating bubble. It has a high primary pressure peak corresponding to the initial release of air followed by a series of secondary peaks associated with the subsequent volume minima that occur as the air bubble oscillates in size. The secondary peaks are referred to as bubble pulses and these are undesirable from a seismic imaging perspective. The period between bubble pulses increases with the volume of the airgun chamber and airgun arrays use this feature to suppress bubble pulses by simultaneously firing multiple airguns with different volumes. The primary pulses occur at the same time so their pressures add coherently while the bubble pulses do not.
3
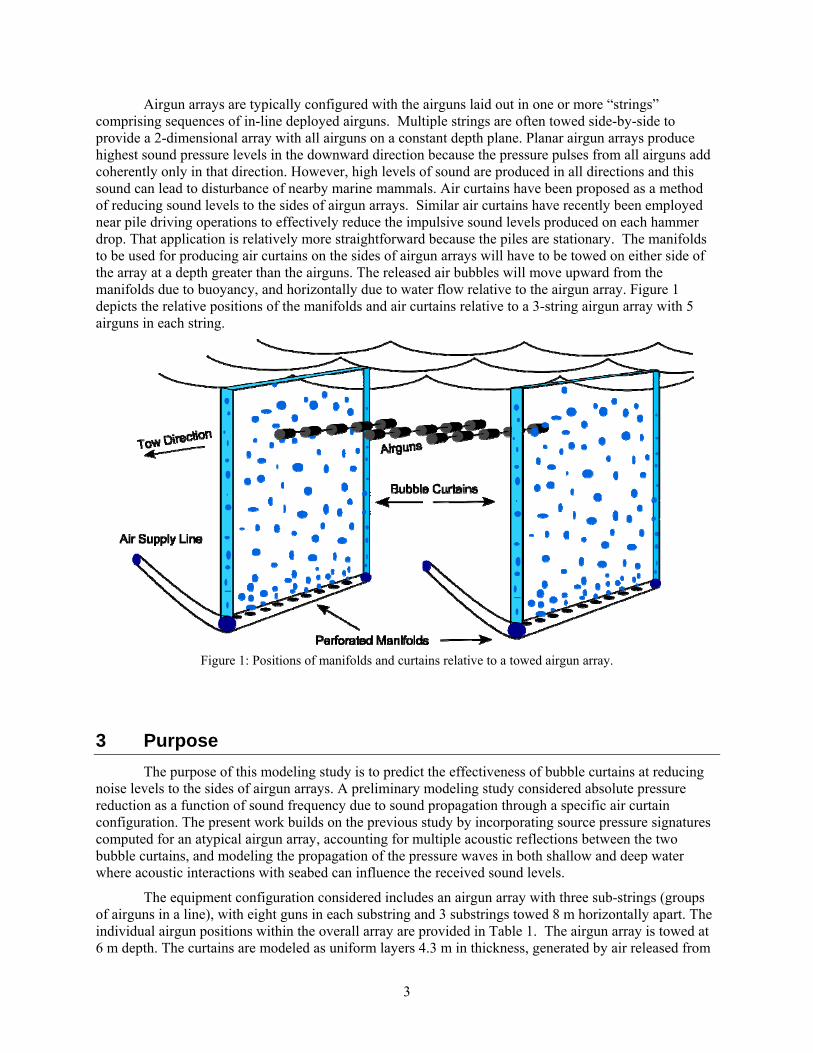
Airgun arrays are typically configured with the airguns laid out in one or more “strings” comprising sequences of in-line deployed airguns. Multiple strings are often towed side-by-side to provide a 2-dimensional array with all airguns on a constant depth plane. Planar airgun arrays produce highest sound pressure levels in the downward direction because the pressure pulses from all airguns add coherently only in that direction. However, high levels of sound are produced in all directions and this sound can lead to disturbance of nearby marine mammals. Air curtains have been proposed as a method of reducing sound levels to the sides of airgun arrays. Similar air curtains have recently been employed near pile driving operations to effectively reduce the impulsive sound levels produced on each hammer drop. That application is relatively more straightforward because the piles are stationary. The manifolds to be used for producing air curtains on the sides of airgun arrays will have to be towed on either side of the array at a depth greater than the airguns. The released air bubbles will move upward from the manifolds due to buoyancy, and horizontally due to water flow relative to the airgun array. Figure 1 depicts the relative positions of the manifolds and air curtains relative to a 3-string airgun array with 5 airguns in each string.
Figure 1: Positions of manifolds and curtains relative to a towed airgun array.
3 Purpose
The purpose of this modeling study is to predict the effectiveness of bubble curtains at reducing noise levels to the sides of airgun arrays. A preliminary modeling study considered absolute pressure reduction as a function of sound frequency due to sound propagation through a specific air curtain configuration. The present work builds on the previous study by incorporating source pressure signatures computed for an atypical airgun array, accounting for multiple acoustic reflections between the two bubble curtains, and modeling the propagation of the pressure waves in both shallow and deep water where acoustic interactions with seabed can influence the received sound levels.
The equipment configuration considered includes an airgun array with three sub-strings (groups of airguns in a line), with eight guns in each substring and 3 substrings towed 8 m horizontally apart. The individual airgun positions within the overall array are provided in Table 1. The airgun array is towed at 6 m depth. The curtains are modeled as uniform layers 4.3 m in thickness, generated by air released from

4
manifolds towed at 20 m depth and separated by 36 m. This configuration provides 10 m separation between the outer airgun substrings the curtains. The bubble curtain dimensions are based on the same configuration as the preliminary study.
Table 1: Airgun array configuration used in this modeling study.
Gun Volume (cu.in.) Offset from front (m) Offset from centre (m) 1 30 0 0 2 50 3 0 3 100 6 0 4 150 9 0 5 125 12 0 6 125 12 0 7 250 15 0 8 250 15 0 9 30 0 +8 10 50 3 +8 11 100 6 +8 12 150 9 +8 13 125 12 +8 14 125 12 +8 15 250 15 +8 16 250 15 +8 17 30 0 -8 18 50 3 -8 19 100 6 -8 20 150 9 -8 21 125 12 -8 22 125 12 -8 23 250 15 -8 24 250 15 -8
Total 3240 n/a n/a
4 Modeling Approach
4.1 Airgun array source levels
The far-field pressure generated by a seismic airgun array is generally substantially greater than that of the individual constituent airguns, but sound emission is direction-dependent. The acoustic source level of the array varies considerably in both the horizontal and vertical directions due to the complex interactions and arrival time differences of the signals from different airguns. These interactions can be accounted for to predict the sound fields generated by the airgun array in any specified direction. The direction-dependent composite source pressure signature can be computed by summing the contributions of the array elements with appropriate time delays that depend on the relative positions of individual airguns within the array and the direction from the array at which the sound is measured.
JASCO Applied Sciences has developed the full-waveform airgun array source signature model AASM (MacGillivray, 2006) to compute the source level and directionality of airgun arrays. The source model is based on the physics of the oscillation and radiation of airgun bubbles, as described by

5
Ziolkowski (1970). The model solves a set of parallel differential equations that govern the airgun bubble oscillations.
In addition to the basic bubble physics, the source model also accounts for non-linear pressure interactions between airguns, port throttling, bubble damping, and GI-gun behavior as described, for example, by Dragoset (1984), Laws et al. (1990), and Landro (1992). The source model includes four empirical parameters that are tuned so that the model output matches observed airgun behavior. The model parameters were fitted to a large library of real airgun data using a “simulated annealing” global optimization algorithm. These airgun data were obtained from a previous study (Racca and Scrimger, 1986) that measured the signatures of Bolt 600/B guns ranging in volume from 5 in3 to 185 in3.
The airgun array source model requires several inputs, including the array layout, volumes, towing depths, and firing pressure. The output of the source model is a set of “notional” signatures for the array elements. The notional signatures are the pressure waveforms of the individual airguns, compensated for the interaction with other airguns in the array, at a standard reference distance of 1 meter. Figure 2 shows the airgun signatures for the present study that were computed using the AASM program. The three groups of 8 airgun signatures are very similar but not identical because they are partially affected by the pressure fields from surrounding guns. Due to symmetry the signatures of the two outer substrings will have identical signatures but those will differ slightly from signatures of the center substring.
Figure 2: Notional airgun signatures for individual airguns of the 24-airgun 3240 cubic inch array.

6
4.2 Bubble curtain effects
Sound propagation and back-scattering in bubbly water has been studied extensively in problems encountered in acoustic oceanography and ultrasonic imaging (Leighton, 1994). Even a very small fractional volume of air bubbles in water can significantly change the sound speed. The primary reason for this effect is that the compressibility of bubbly water is much greater than for non-aerated water. Sound pressure waves incident on the boundaries of bubbly water layers can be reflected strongly due to the large change in acoustic impedance across the boundaries. Bubbles also can absorb energy from acoustic pressure waves if the natural frequency of bubble oscillation is similar to that of the incident pressure wave. The natural resonant frequency of bubbles depends on their radii and depth. The resonance absorption effect is important only for large bubble sizes; bubble diameters corresponding to resonant frequencies 100 Hz and 500 Hz near the surface are respectively 3 cm and 6 mm. It is quite possible that these large bubble sizes could be produced by the air curtain system considered here.
Sound attenuation due to excitation of individual bubble oscillations is complex and depends on the distribution of bubble sizes in the bubbly liquid region, as well as frequency. For this study, the fraction of curtain containing air was 15% and each bubble had a 2.8 mm radius. These values replicated the bubble curtain used in the University of Texas test tank. The relationship between attenuation coefficient and frequency is shown in Figure 3. Attenuation by the bubble curtain was calculated according to the method in Commander and Prosperetti (1989), using a depth of 5 m, with a sound speed of 1540 m/s, and a bubble layer fractional air volume of 0.015. Attenuation was incorporated in the air curtain layer reflection and transmission coefficients using the standard method of making the internal sound speed complex, as described for example by Jensen et al. (1993).
Figure 3: Attenuation of a bubble curtain as a function of frequency.
Scattering loss was also neglected since calculations using an Eckart scattering law based on the expected roughness dimension suggested that the loss at the low frequencies of interest for airgun sounds would be negligible. Here we only consider the macroscopic effect of reduced acoustic impedance in the bubbly air curtain layer on the reflection and transmission coefficients through the layer.
The reflection and transmission coefficients were modeled as a function of frequency through a homogenous planar layer of bubbly water. The layer has reduced sound speed and density relative to the surrounding water. The specific assumptions and parameters used for this modeling study were:
1. Bubble layer thickness of 4.3 m was chosen based on the off-axis distance at which the density factor had decreased to 1/e of its on-axis value at 5 m depth (near the airgun array operating depth).
7
2. Bubble curtain height of 20 m was chosen, corresponding to the depth of the manifolds.
3. Bubble density (air only) was specified as 1.92 kg/m3 which is representative of the nominal density at 5 m depth.
4. Bubble layer fractional air volume was set to 0.015 corresponding to the value from the separate fluid dynamic modeling using a realistic air flow rate and corresponding to the curtain properties at 5 m depth.
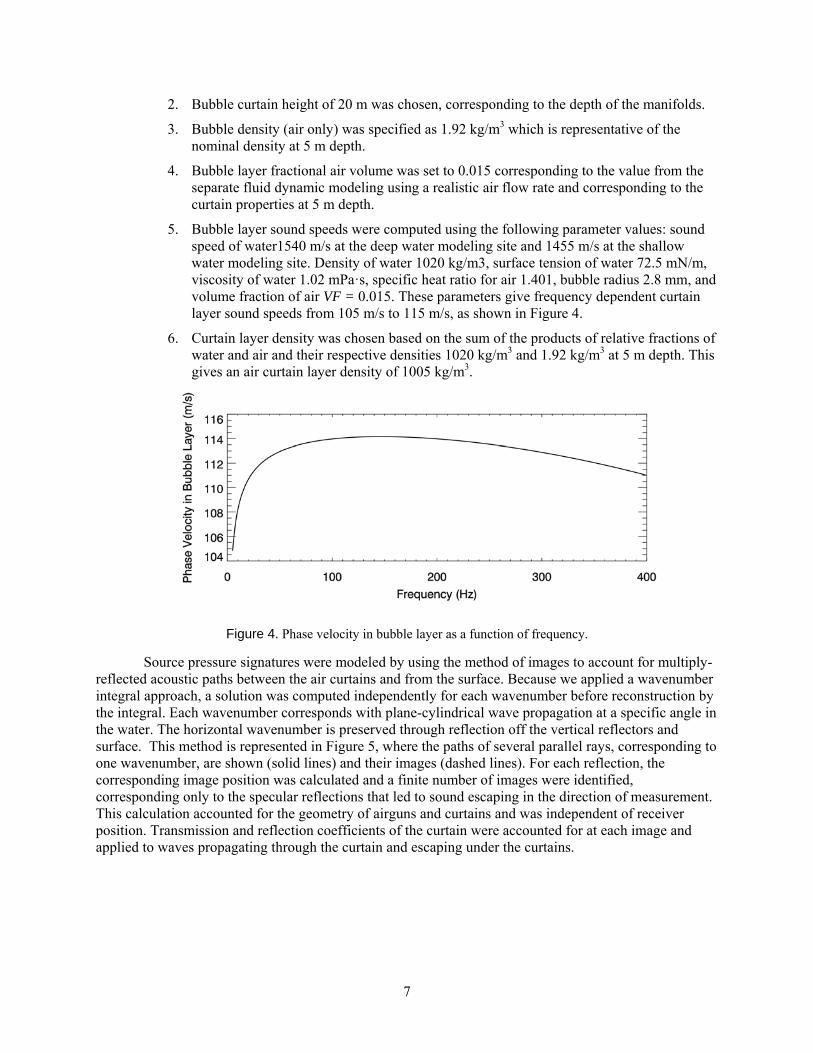
5. Bubble layer sound speeds were computed using the following parameter values: sound speed of water1540 m/s at the deep water modeling site and 1455 m/s at the shallow water modeling site. Density of water 1020 kg/m3, surface tension of water 72.5 mN/m, viscosity of water 1.02 mPa·s, specific heat ratio for air 1.401, bubble radius 2.8 mm, and volume fraction of air VF = 0.015. These parameters give frequency dependent curtain layer sound speeds from 105 m/s to 115 m/s, as shown in Figure 4.
6. Curtain layer density was chosen based on the sum of the products of relative fractions of water and air and their respective densities 1020 kg/m3 and 1.92 kg/m3 at 5 m depth. This gives an air curtain layer density of 1005 kg/m3.
Figure 4. Phase velocity in bubble layer as a function of frequency.
Source pressure signatures were modeled by using the method of images to account for multiply-reflected acoustic paths between the air curtains and from the surface. Because we applied a wavenumber integral approach, a solution was computed independently for each wavenumber before reconstruction by the integral. Each wavenumber corresponds with plane-cylindrical wave propagation at a specific angle in the water. The horizontal wavenumber is preserved through reflection off the vertical reflectors and surface. This method is represented in Figure 5, where the paths of several parallel rays, corresponding to one wavenumber, are shown (solid lines) and their images (dashed lines). For each reflection, the corresponding image position was calculated and a finite number of images were identified, corresponding only to the specular reflections that led to sound escaping in the direction of measurement. This calculation accounted for the geometry of airguns and curtains and was independent of receiver position. Transmission and reflection coefficients of the curtain were accounted for at each image and applied to waves propagating through the curtain and escaping under the curtains.

8
Figure 5: Source reflection images for horizontal reflections off the bubble curtains and vertical reflections from the
surface.
Because each of the three airgun array substrings was oriented parallel to the curtains, the pressures from each string could be coalesced and treated as an equivalent point source for sound propagation perpendicular to the strings. This would not be possible for other directions. A source depth of 5 m was assumed, allowing the entire array to be modeled as three point sources and their corresponding point source images. We limited the number of internal reflections to 20 due to computational effort required and computational stability considerations. Consequently 20 horizontal images were considered. Greater numbers of reflections lead to high reflection losses that attenuate those higher order paths. Receivers were modeled at three depths including a near-surface, mid-water and near-bottom receiver for both water depth environments. The model accounted for 50 bottom reflections for the shallow environment and 5 bottom reflections for the deep environment.

9
Figure 6: Real and image source geometry. Each of the three real airgun point sources represents one substring
(oriented into the page) from the full airgun array.
4.3 Sound propagation using the wave number integral model
A wavenumber integral acoustic modeling method was used to compute the pressure fields presented here. Detailed descriptions of the approach are provided by Jensen et al. (1993) and Frisk (1994). Wavenumber integration methods are also referred to as Fast Field Programs (FFPs) because they often use Fast Fourier Transforms (FFTs) to perform the integrations. In seismology wavenumber integral methods are often referred to as reflectivity methods or discrete wavenumber methods.
The wavenumber integral approach is appropriate for the current problem of planar reflectors because it decomposes the spherical pressure field emitted by each of the airguns into a continuum of outward-propagating plane cylindrical waves. Reflections of the plane waves from the planar sea surface and air curtain walls were performed by treating each reflection as a multiplication by the appropriate plane wave reflection coefficient. Plane wave transmission through the air curtain upon each interaction was treated by multiplying by the plane wave transmission coefficient.
The general form of the Hankel-decomposed pressure field g(r,z) for one source measured by a receiver at range r and depth z is
0 0 )(),(),( rrrr dkkrkJzkgzrg , (1)
where kr is the horizontal component of the wave vector and g(kr,z) is the plane wave solution to the depth-separated wave equation at receiver depth z. Function g(kr,z) is dependent on the source depth,

10
water column properties and seabed reflectivity. Seabed reflectivity is dependent on the seabed layer properties: compressional and shear wave speeds and attenuation coefficients, and layer densities. The seabed reflectivity method used here is the one described by Brekhovskikh (1980). The wavenumber kr is related to slowness s by kr= s where is the angular frequency.
For each real and image source we used an integration range of kr=0, representing straight down propagation, to a truncated upper limit corresponding with slowness (1200 m/s)-1. This slowness represents a horizontal-propagating but depth-evanescent cylindrical plane wave in the water. All computations were carried out from 5 Hz to 400 Hz. The wavenumber step was chosen to give 10 degrees maximum phase error between wavenumber steps at the maximum source-receiver range. The approach requires finer wavenumber sampling at high frequencies than at low frequencies.
Each wavenumber represents a specific cylindrical plane wave propagation angle. For each wavenumber and for each image source we computed the number of times the propagating plane wave reflected off the interior air curtain walls and whether or not the final path transmitted through the curtain or escaped below. A modification to Green’s function was made by multiplying by the product of complex reflection and transmission coefficients for the path. The curtain reflection and transmission coefficients accounted for the angle of incidence of the plane wave component on the curtain.
The model approach developed here makes two primary assumptions that have not been validated. The first assumption is that reflections from the curtains can be treated as mirror images with appropriate complex reflection coefficients applied. This would be a valid assumption if the curtains were infinite in planar extent, or at least much larger than the Fresnel zone size. The assumption is likely valid at high frequencies (shorter wavelengths) but may have reduced accuracy at lower frequencies. The second assumption is that diffraction around the bottom edges of the curtains is not important. Interestingly the truncation of the wavenumber integral at the angle corresponding with sound escape beneath the curtain for each image allows for some leakage of energy around the bottom of the curtain that in some ways mimics diffraction. The mathematical relationship between this truncation and real diffractive effects is not clear and has not been investigated.
Testing of the acoustic model was carried out by examining the impulse response function with only direct path and surface reflected paths included. Figure 7 shows the impulse response (5 Hz to 400 Hz) for a single source with no air curtains and no bottom reflections. The source depth was 6 m and the receiver depth was 30 m. The received responses are time-shifted so all direct path arrivals occur at approximately 0.1 seconds in this figure. This test shows the direct and surface reflected paths converging with increasing offset as expected.

11
Figure 7: Impulse response from a source at 6 m depth of direct and surface reflected paths without air curtains at
ranges from 50 m to 500 m at a fixed receiver depth of 30 m. Signals have been time-aligned so the direct path signal occurs at approximately 0.1 seconds.
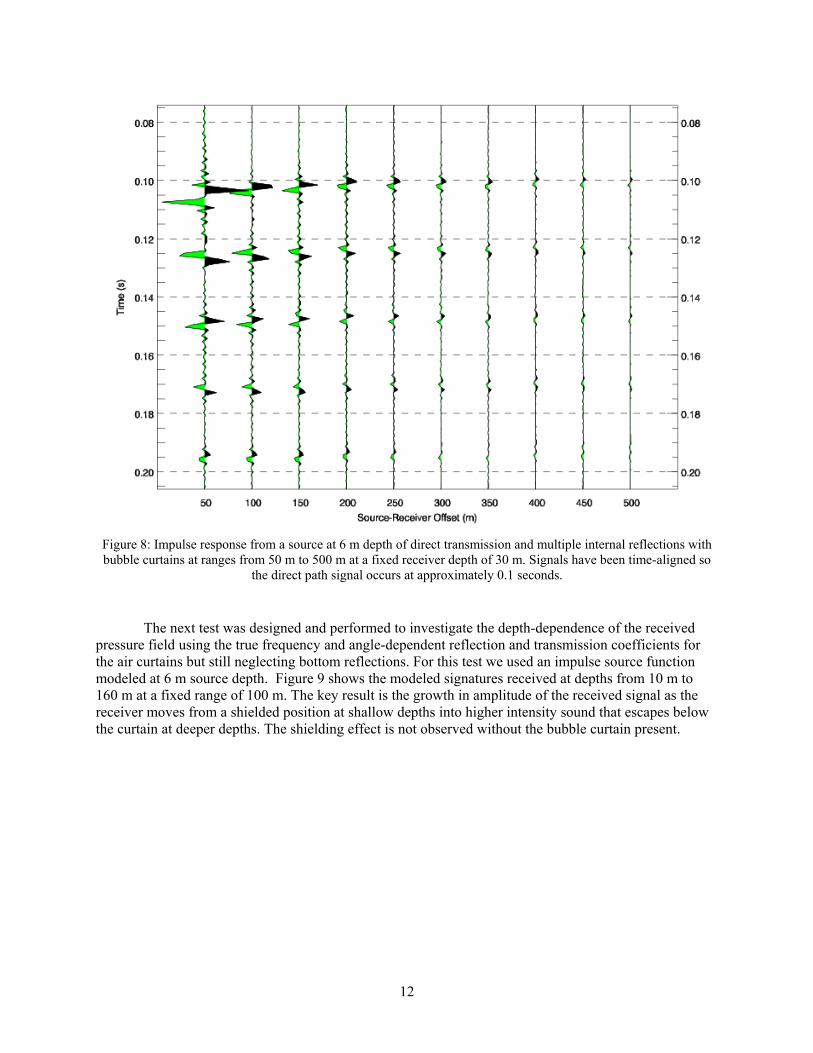
Figure 8 shows a scenario similar to that treated in Figure 7 but with air curtains present. In this test we fixed the interior reflection coefficients of the air curtains to R=-1 and the transmission coefficient to T=1 for all incident angles so the individual reflections would be easier to distinguish. The air curtains here extend 20 m below the surface and are spaced at 36 m with the source mid-way between. The individual paths are spaced as expected and with the proper polarity based on the respective numbers of curtain and surface reflections.
12
Figure 8: Impulse response from a source at 6 m depth of direct transmission and multiple internal reflections with bubble curtains at ranges from 50 m to 500 m at a fixed receiver depth of 30 m. Signals have been time-aligned so
the direct path signal occurs at approximately 0.1 seconds.
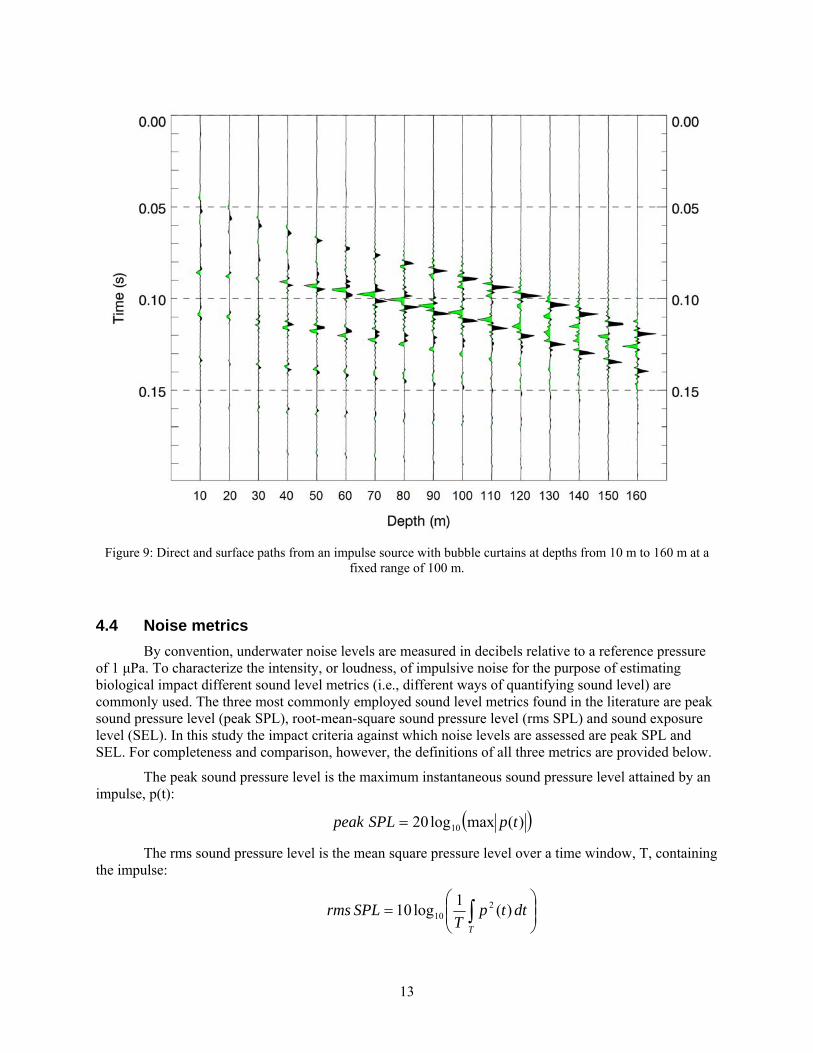
The next test was designed and performed to investigate the depth-dependence of the received pressure field using the true frequency and angle-dependent reflection and transmission coefficients for the air curtains but still neglecting bottom reflections. For this test we used an impulse source function modeled at 6 m source depth. Figure 9 shows the modeled signatures received at depths from 10 m to 160 m at a fixed range of 100 m. The key result is the growth in amplitude of the received signal as the receiver moves from a shielded position at shallow depths into higher intensity sound that escapes below the curtain at deeper depths. The shielding effect is not observed without the bubble curtain present.
13
Figure 9: Direct and surface paths from an impulse source with bubble curtains at depths from 10 m to 160 m at a
fixed range of 100 m.
4.4 Noise metrics
By convention, underwater noise levels are measured in decibels relative to a reference pressure of 1 μPa. To characterize the intensity, or loudness, of impulsive noise for the purpose of estimating biological impact different sound level metrics (i.e., different ways of quantifying sound level) are commonly used. The three most commonly employed sound level metrics found in the literature are peak sound pressure level (peak SPL), root-mean-square sound pressure level (rms SPL) and sound exposure level (SEL). In this study the impact criteria against which noise levels are assessed are peak SPL and SEL. For completeness and comparison, however, the definitions of all three metrics are provided below.
The peak sound pressure level is the maximum instantaneous sound pressure level attained by an impulse, p(t):
)(maxlog20 10 tpSPLpeak
The rms sound pressure level is the mean square pressure level over a time window, T, containing the impulse:
T
dttpT
SPLrms )(1
log10 210

14
By convention, when computing airgun safety radii the time interval T is most often taken to be the “90% energy pulse duration” rather than a fixed time window (Malme et al., 1986; Greene, 1997; McCauley et al., 1998). This time window is computed for each seismic shot as the interval containing 90% of the pulse energy, and the resulting metric is commonly referred to as the 90% rms SPL. Because the window length T is used as a divisor, pulses that are more spread out in time have a lower rms level for the same total acoustic energy.
The sound exposure level or SEL is the time-integral of the square pressure over a fixed time window long enough to include the entire pulse:
T
dttpSEL )(log10 210
SEL has units of dB re μPa2s. It is a measure of sound energy (or exposure) rather than sound pressure. Depending on the application and context SEL for airgun signals may be expressed as a per-pulse metric or as a cumulative metric over multiple pulses.
5 Modeling Environments
5.1 Bathymetry and seafloor properties
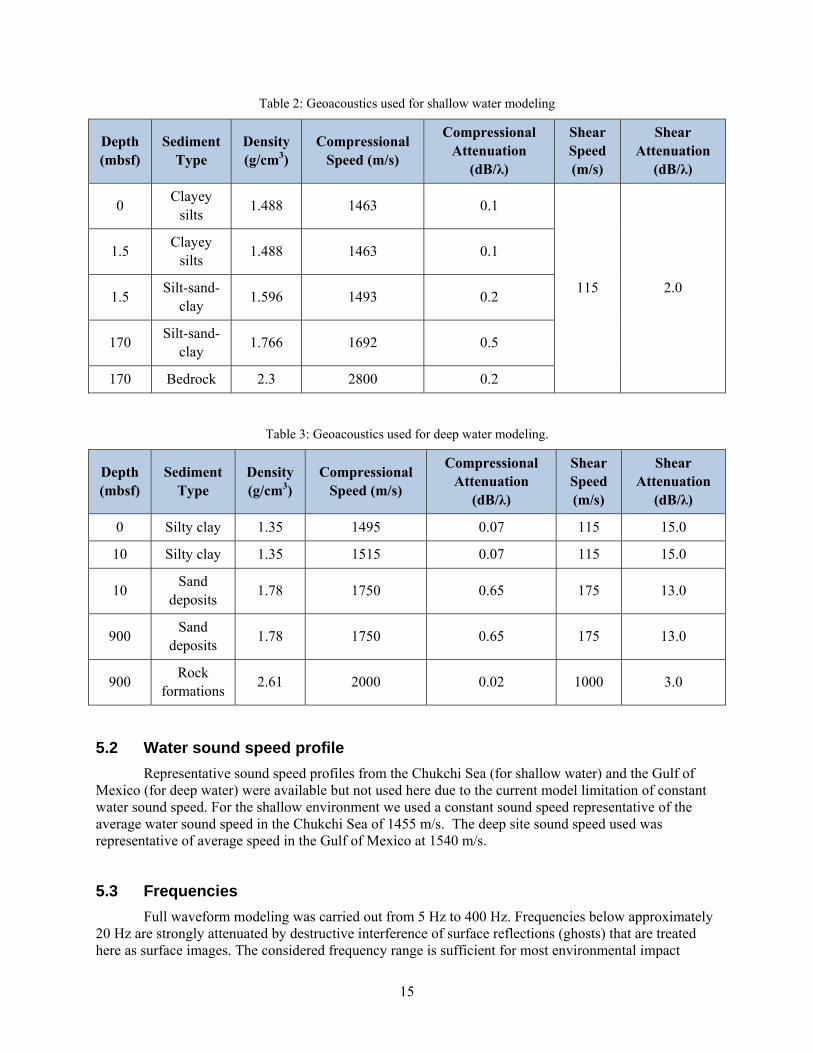
Two bathymetry environments were considered for this study: 50 m and 500 m constant water depth. For location-specific modeling, the bottom geoacoustic properties (layer sound speeds and attenuation coefficients for both the compressional and shear waves, and density) are generally inferred from information about the geology within the study area. This in turn is obtained from a variety of different studies which may include exploratory drilling and surficial sediment sampling. Properties for the shallow water environment were taken from paleontological data from Sherwood et al. (2002) and seabed soil profiles used in a previous study both representative of the Chukchi Sea. Deep water geoacoustics were representative of the Gulf of Mexico, as found in Tashmukhambetov et al. (2008). In both cases, the properties were converted to geoacoustic parameters using the conversions outlined in Hamilton (1980).
15
Table 2: Geoacoustics used for shallow water modeling
Depth (mbsf)
Sediment Type
Density (g/cm3)
Compressional Speed (m/s)
Compressional Attenuation
(dB/λ)
Shear Speed (m/s)
Shear Attenuation
(dB/λ)
0 Clayey
silts 1.488 1463 0.1
115 2.0
1.5 Clayey
silts 1.488 1463 0.1
1.5 Silt-sand-
clay 1.596 1493 0.2
170 Silt-sand-
clay 1.766 1692 0.5
170 Bedrock 2.3 2800 0.2
Table 3: Geoacoustics used for deep water modeling.
Depth (mbsf)
Sediment Type
Density (g/cm3)
Compressional Speed (m/s)
Compressional Attenuation
(dB/λ)
Shear Speed (m/s)
Shear Attenuation
(dB/λ)
0 Silty clay 1.35 1495 0.07 115 15.0
10 Silty clay 1.35 1515 0.07 115 15.0
10 Sand
deposits 1.78 1750 0.65 175 13.0
900 Sand
deposits 1.78 1750 0.65 175 13.0
900 Rock
formations 2.61 2000 0.02 1000 3.0
5.2 Water sound speed profile
Representative sound speed profiles from the Chukchi Sea (for shallow water) and the Gulf of Mexico (for deep water) were available but not used here due to the current model limitation of constant water sound speed. For the shallow environment we used a constant sound speed representative of the average water sound speed in the Chukchi Sea of 1455 m/s. The deep site sound speed used was representative of average speed in the Gulf of Mexico at 1540 m/s.
5.3 Frequencies
Full waveform modeling was carried out from 5 Hz to 400 Hz. Frequencies below approximately 20 Hz are strongly attenuated by destructive interference of surface reflections (ghosts) that are treated here as surface images. The considered frequency range is sufficient for most environmental impact

16
assessment of seismic surveys on mysticetes. It may not be fully sufficient for evaluating all impacts on odonocetes, which have more sensitive hearing at frequencies well above 400 Hz.
6 Model Results
The pressure signatures for model runs at three receiver depths and receiver ranges from 100 m to 2000 m, with and without bubble curtains, are shown in Section 6.1. The pressure signatures were processed as if they were from real acoustic measurements to compute the pressure metrics discussed in Section 6.2 and Section 6.3. Per-shot and cumulative SEL levels are plotted in Section 6.2. Peak and rms SPL levels are plotted in Section 6.3. These results are discussed in Section 6.4.
6.1 Pressure synthetics
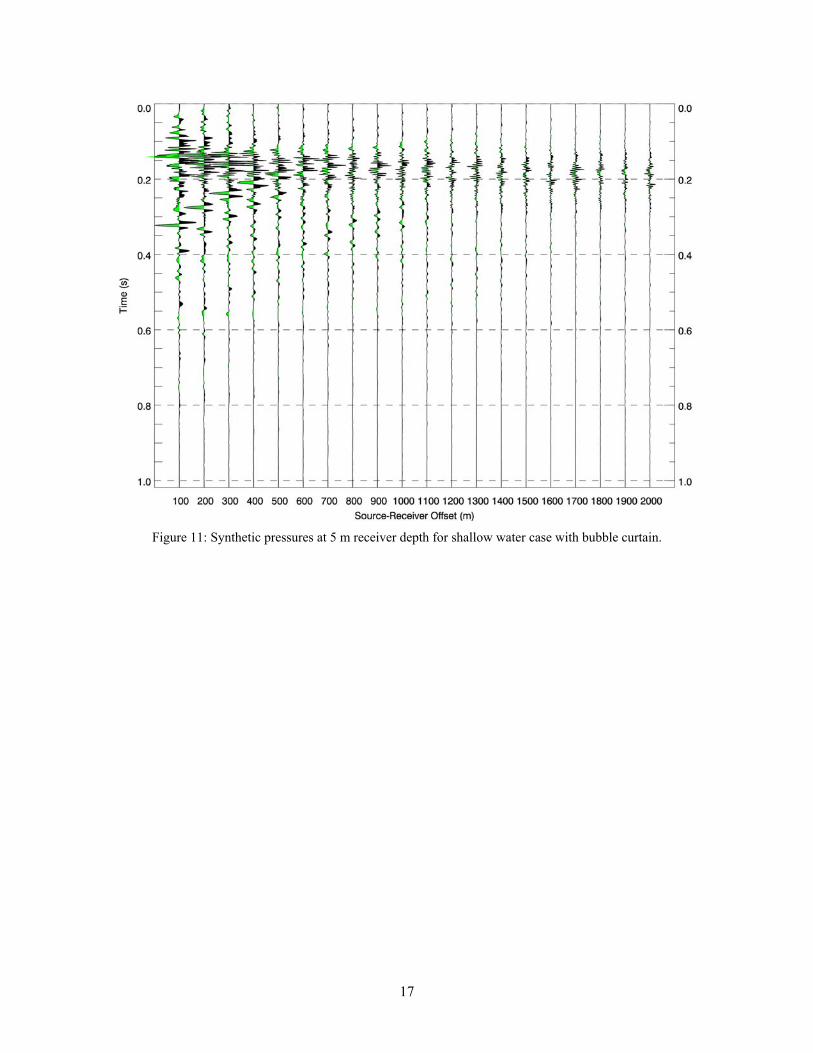
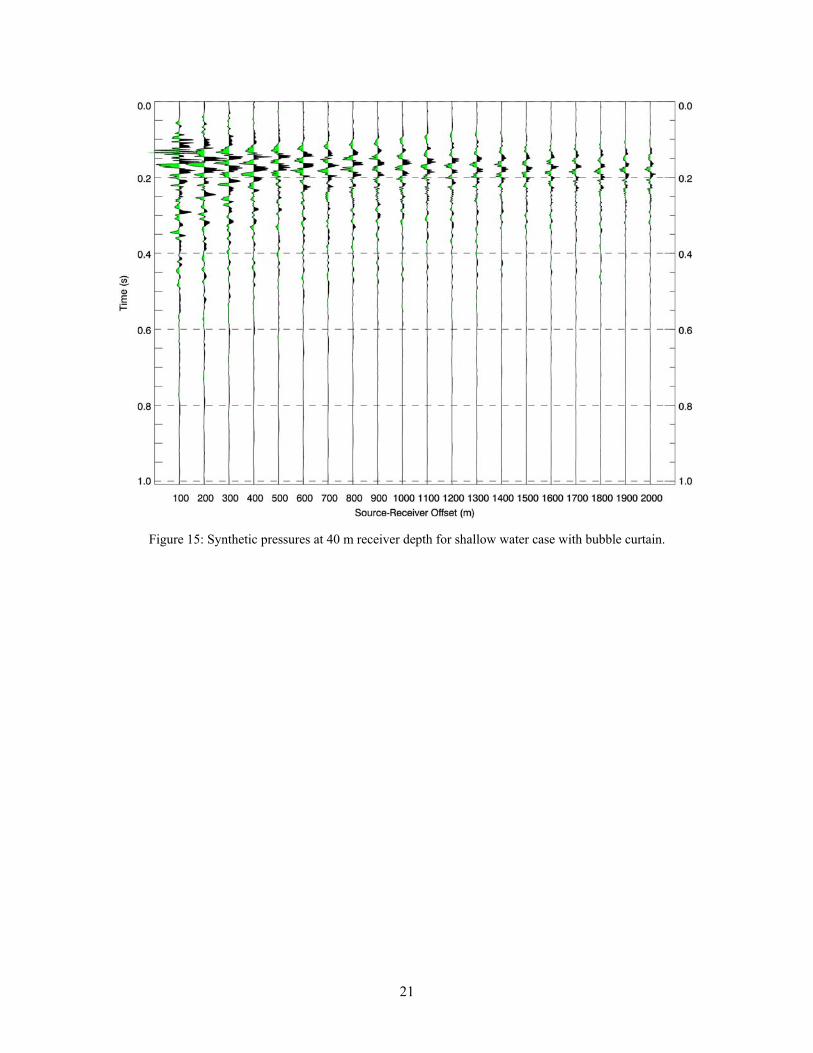
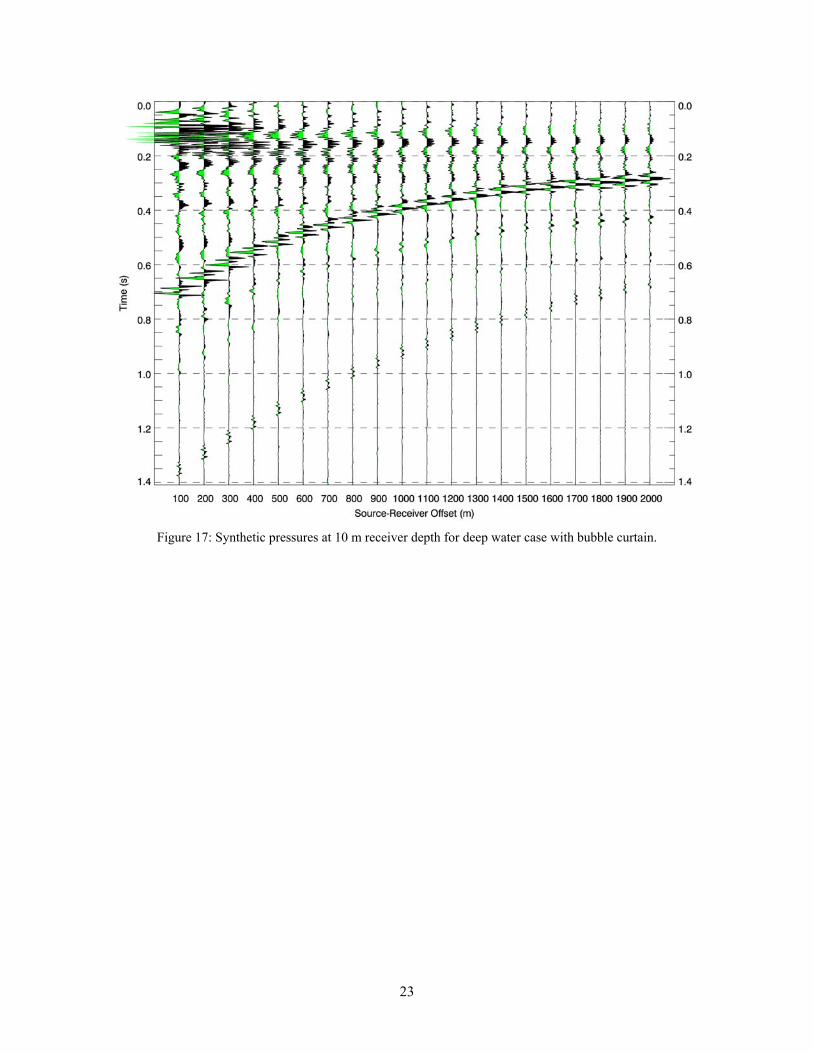
Each run using the wave number integral model produced synthetic pressure data sampled at 1024 Hz containing sound pressure in the 5 Hz to 400 Hz frequency band. These results are presented below in Figure 10 to Figure 21. The pressure synthetics have been time shifted so that each waveform starts at approximately 0.2 s.
Figure 10: Synthetic pressures at 5 m receiver depth for shallow water case without bubble curtain.
17
Figure 11: Synthetic pressures at 5 m receiver depth for shallow water case with bubble curtain.

18
Figure 12: Synthetic pressures at 25 m receiver depth for shallow water case without bubble curtain.

19
Figure 13: Synthetic pressures at 25 m receiver depth for shallow water case with bubble curtain.

20
Figure 14: Synthetic pressures at 40 m receiver depth for shallow water case without bubble curtain.
21
Figure 15: Synthetic pressures at 40 m receiver depth for shallow water case with bubble curtain.

22
Figure 16: Synthetic pressures at 10 m receiver depth for deep water case without bubble curtain.
23
Figure 17: Synthetic pressures at 10 m receiver depth for deep water case with bubble curtain.

24
Figure 18: Synthetic pressures at 250 m receiver depth for deep water case without bubble curtain.

25
Figure 19: Synthetic pressures at 250 m receiver depth for deep water case with bubble curtain.

26
Figure 20: Synthetic pressures at 490 m receiver depth for deep water case without bubble curtain.

27
Figure 21: Synthetic pressures at 490 m receiver depth for deep water case with bubble curtain.
6.2 SEL results
The SEL metric results from the modeling are presented as graphs of per-shot acoustic level, plotted against the distance between the source and the receivers. These results are shown in below in Figure 22 through Figure 27.

28
Figure 22: SEL versus range for the shallow water case at 5 m receiver depth.

29
Figure 23: SEL versus range for the shallow water case at 25 m receiver depth.

30
Figure 24: SEL versus range for the shallow water case at 40 m receiver depth.
31
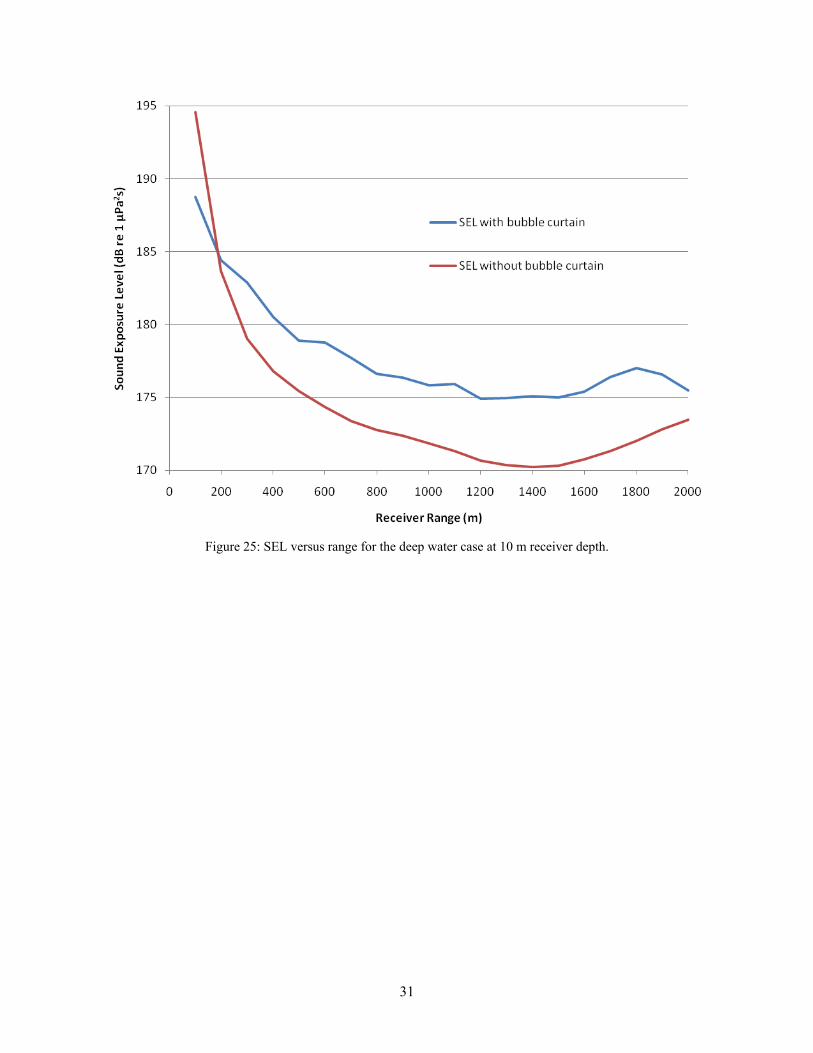
Figure 25: SEL versus range for the deep water case at 10 m receiver depth.
32
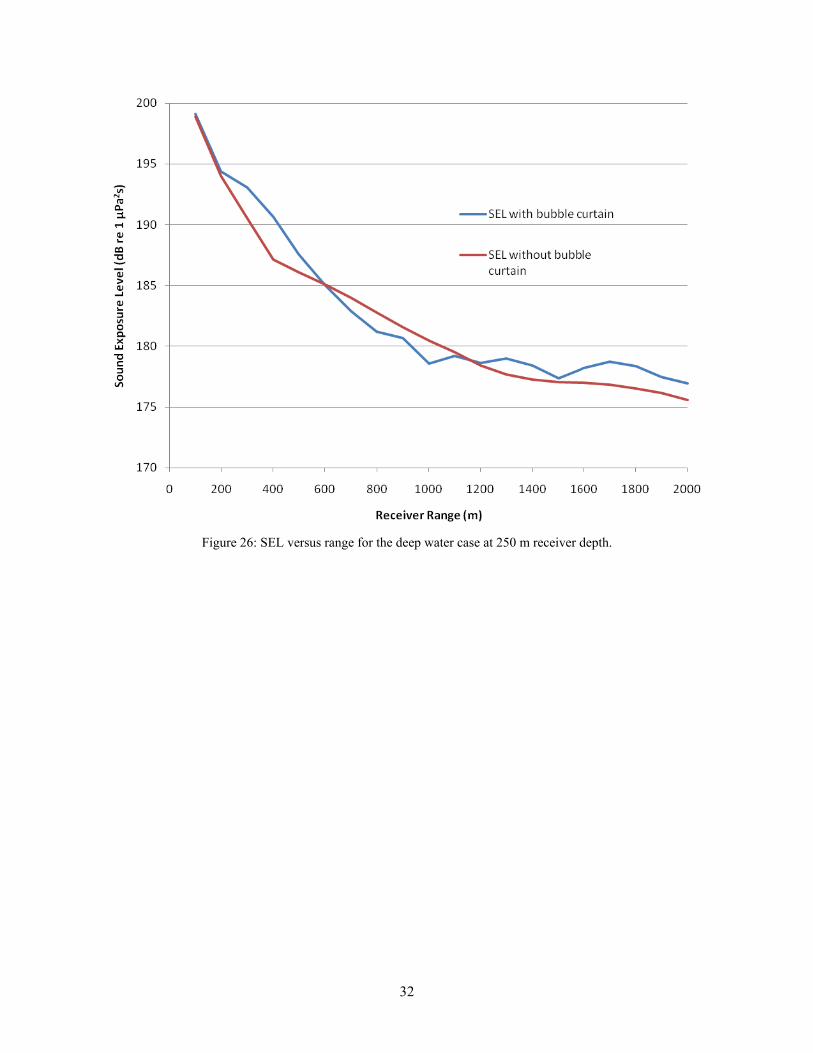
Figure 26: SEL versus range for the deep water case at 250 m receiver depth.

33
Figure 27: SEL versus range for the deep water case at 490 m receiver depth.
6.3 Peak SPL results
The peak SPL metric results from the model are presented as graphs of acoustic level plotted against the distance between the source and the receivers. The 90% rms SPLs are also plotted on the same graphs. These results are found in Figure 28 through Figure 33 below.
34
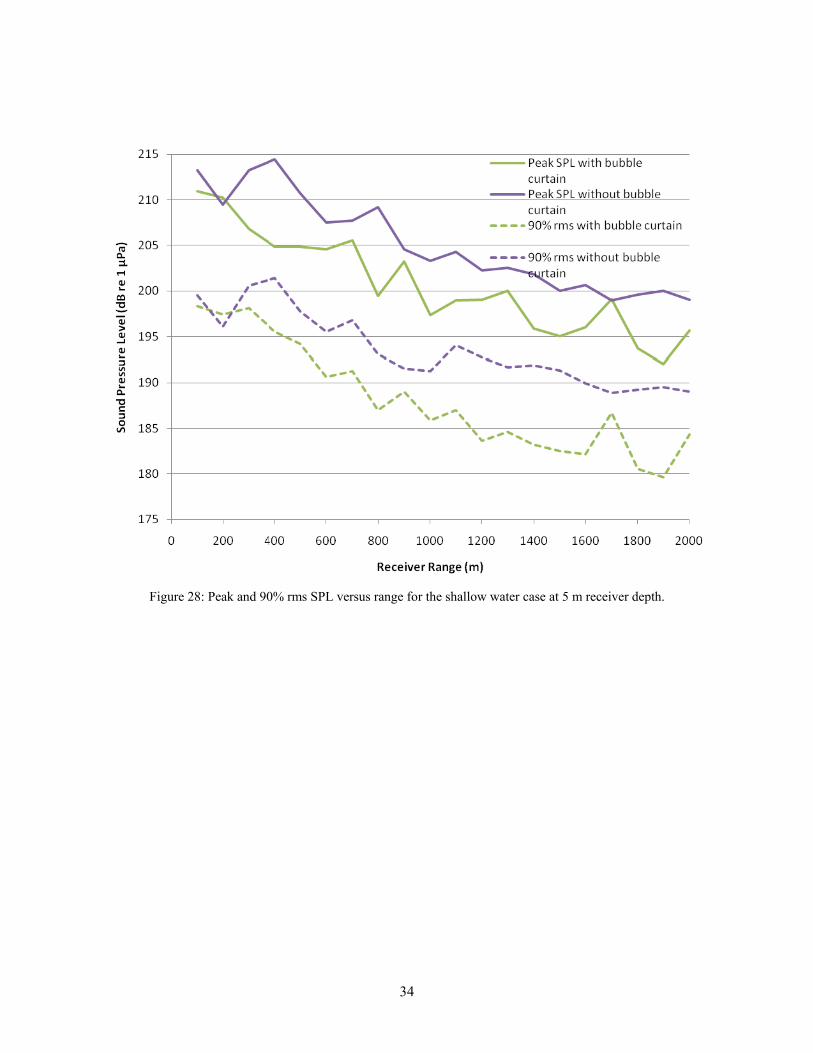
Figure 28: Peak and 90% rms SPL versus range for the shallow water case at 5 m receiver depth.
35
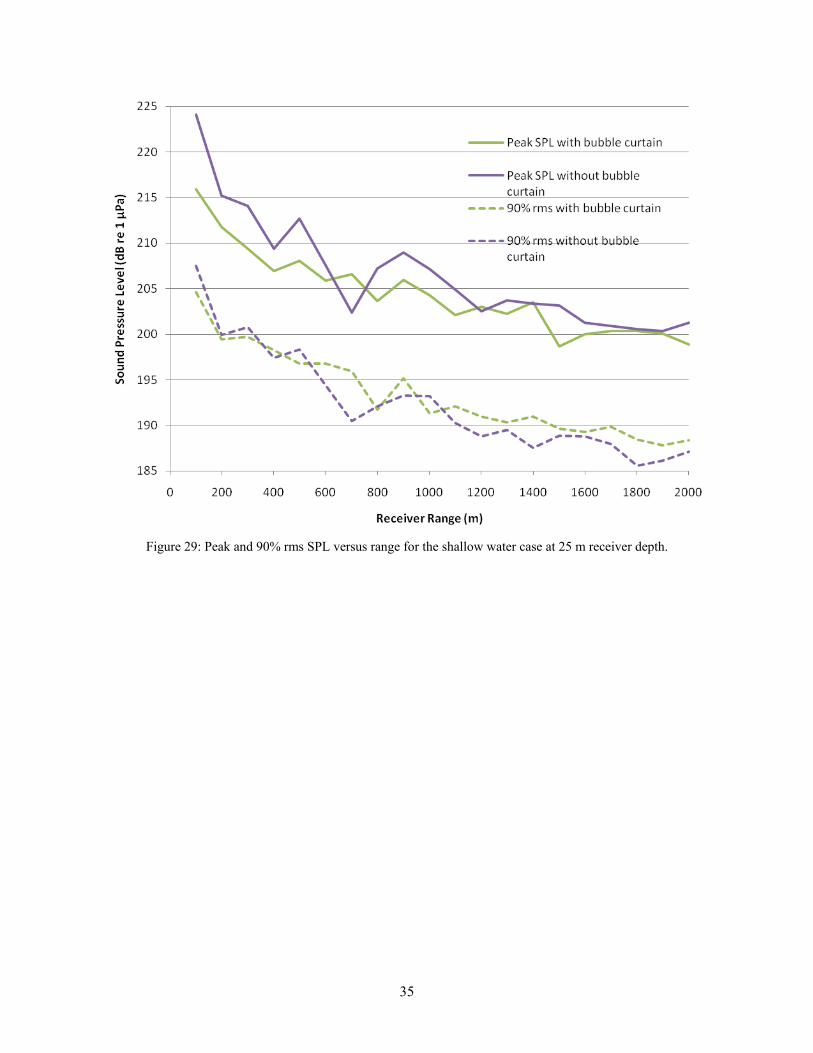
Figure 29: Peak and 90% rms SPL versus range for the shallow water case at 25 m receiver depth.

36
Figure 30: Peak and 90% rms SPL versus range for the shallow water case at 40 m receiver depth.

37
Figure 31: Peak and 90% rms SPL versus range for the deep water case at 10 m receiver depth.

38
Figure 32: Peak and 90% rms SPL versus range for the deep water case at 250 m receiver depth.

39
Figure 33: Peak and 90% rms SPL versus range for the deep water case at 490 m receiver depth.
7 Discussion of Results
The propagation of sound pressure waves originating from an airgun array and travelling through bubble curtains positioned on either side of the array was investigated using computer models. Two modeling sites were examined: a shallow water environment with water depth 50 m, and a deep water environment with water depth 500 m. The environmental modeling parameters used were based on locations in the Chukchi Sea (shallow site) and Gulf of Mexico (deep site), where recent seismic surveys have been performed. The computer model produced received synthetic sound pressure signatures for both environments with and without the bubble curtains present. The resulting sound pressure signatures were then compared, as well as the following computed acoustic pressure and exposure metrics: Sound Exposure Level (SEL), 0-Peak Pressure SPL, and 90% rms SPL.
The synthetic pressure plots in Section 6.1 show that for both the shallow and deep water cases, that the effective pulse duration is greater with the bubble curtain present than without. The extension of pulse duration is attributed to numerous intra-curtain reflections. In shallow water, the first sub-bottom reflection is clearly visible and distinct from the combined direct and surface reflected paths at close range without the bubble curtain (ref. Figure 10, Figure 12, and Figure 14), but with the bubble curtain present it is difficult to distinguish the paths (ref. Figure 11, Figure 13, and Figure 15). This result is caused by the temporal overlap of curtain reflections with the surface and bottom-reflected paths. The bubble curtains attenuate the direct path and also cause an increased number of sound signals propagating downwards, reducing the amplitude of the direct path and creating stronger bottom reflections.

40
The SEL plots in Section 6.2 show that for the shallow water site at 5 m receiver depth, as shown in Figure 22, the bubble curtains reduce SEL at most ranges by up to 5 dB. This effect is attributed to direct shielding by the curtains of shallow angle propagating sound energy. The 25 m and 40 m receiver depths at the shallow site (ref. Figure 23 and Figure 24, respectively) show increased SEL levels by up to 5 dB with bubble curtains present over the unmitigated case. At the deep site at the 10 m and 490 m receiver depths, the bubble curtain produces higher SELs at ranges greater than 200 m, in some cases by up to 5 dB. At the deep site at the 250 m receiver depth the bubble curtains did not have a significant overall affect on the received SELs.
At the shallow water site, the peak SPLs are lower with the presence of a bubble curtain at most ranges and receiver depths, in some cases by up to 8 dB. The 90% rms SPLs are also lower with the presence of a bubble curtain, but only at the surface (5 m depth) receiver. The bubble curtain does not have a significant effect on the 90% rms SPLs at all ranges at the mid-water column and bottom receivers at the shallow water site. At the deep water site, the bubble curtain did not have a significant overall affect on the peak SPLs for the 10 m and 490 m receiver depths at most ranges. At the 10 m receiver depth, the bubble curtain decreased the peak SPLs by up to 14 dB at ranges less than 400 m. At the mid water column receiver (250 m depth) the peak SPLs were overall lower with the bubble curtain at ranges greater than 400 m, at times up to 3 dB.
At the 10 m receiver the 90% rms SPLs were greater with the bubble curtain at most ranges, at times by up to 9 dB. At the 250 m receiver the bubble curtain did not have a significant overall affect on the 90% rms SPLs. At the 490 m receiver the bubble curtain did not have a significant overall affect at ranges less than 1000 m. At further ranges the bubble curtain increased the 90% rms SPLs. The 90% rms SPL values depend greatly on the time window used in the averaging process (as explained in Section 4.4) and are much higher for more concentrated pulses. This explains why at ranges between 1000 m and 1500 m from the source at the 490 m receiver, the 90% rms SPL appears much lower without the bubble curtain in Figure 33, even though the peak SPL is similar.
8 Conclusions
A wave number integral based computer model was used to investigate the effectiveness of bubble curtains at reducing underwater sound pressure levels received to the sides of airgun arrays operated in two environments representative of condition in the Chukchi Sea (shallow site) and Gulf of Mexico (deep site). The curtains were modelled as uniform layers of bubbly water 4.3 m in thickness, generated by air released from manifolds towed at 20 m depth and separated by 36 m. Peak SPL, 90% rms SPL, and SEL were computed at three receiver depths (near the surface, mid-water column, and seafloor) for both ocean environments. Results with and without the bubble curtain were compared.
In general, the results showed that for ranges up to 2 km from the source, mitigation using the bubble curtain was not consistently effective. In some cases the bubble curtains led to slightly higher sound levels than without. The bubble curtain did reduce sound levels near the sea surface (5 m receiver depth) at the shallow site at all ranges from the source, likely due to shielding of the direct acoustic path. It appears much of the energy leaks under the curtain after reflecting internally between the curtains with little loss. The higher peak and SEL levels observed in some cases with the curtains than without could be explained by selectively greater attenuation of the surface-reflected paths than direct paths. The surface paths would otherwise destructively interfere with corresponding direct paths and their weakening would reduce the interference, thereby increasing the resulting sound field.

41
The model results of this study indicate the bubble curtain configuration examined here would not be effective at significantly reducing underwater sound levels from the airgun array considered. This result is primarily attributed to the strong inter-curtain reflections that eventually escape beneath the curtains. Certain assumptions and approximations were made for this study. The model neglected scattering at the bubble curtain interfaces. We expect scattering to be negligible at the low frequencies and long wavelengths considered. The model did not directly account for diffractive effects that are expected at the low frequencies considered. Diffractive effects are expected to increase received sound levels. The method of images applied here to treat inter-curtain reflection multiples likely overestimates path strengths for higher order reflections due to the limited extent of the curtains relative to the sizes of the Fresnel zones for these reflections. This approximation will lead to overestimation of sound levels. Improved model estimates could be obtained by three dimensional Finite element methods. Those methods can account for diffraction and finite curtain extent. They are, however, generally less effective at predicting seabed reflection interactions than the reflectivity-based methods applied here.

42
9 Literature Cited
Brekhovskikh, L.M. 1980, Waves in Layered Media, second edition, Academic Press, New York.
Commander, K.W. and A. Prosperetti. 1988. Linear pressure waves in bubbly liquids: Comparison between theory and experiments. J. Acoust. Soc. Am. 85 (2): 732-746.
Dragoset, W.H. 1984. A comprehensive method for evaluating the design of airguns and airgun arrays. 16th Annual Proc. Offshore Tech. Conf. 3: 75-84.
Greene, C.R., Jr. 1997. Physical acoustics measurements. p. 3-1 to 3-63 In: W.J. Richardson (ed.), Northstar marine mammal monitoring program, 1996: marine mammal and acoustical monitoring of a seismic program in the Alaskan Beaufort Sea. LGL Rep. 2121-2. Rep. from LGL Ltd., King City, Ont., and Greeneridge Sciences Inc., Santa Barbara, CA, for BP Explor. (Alaska) Inc., Anchorage, AK, and Nat. Mar. Fish. Serv., Anchorage, AK, and Silver Spring, MD. 245 p.
Frisk, G.V. 1994. Ocean and Seabed Acoustics: a theory of wave propagation. Prentice Hall, Englewood Cliffs, New Jersey.
Hamilton, E.L. 1980. Geoacoustic modeling of the sea floor. J. Acoust. Soc. Am. 68(5): 1313-1340.
Jensen, F.B., W.A. Kuperman, M.B. Porter and H. Schmidt. 1993. Computational Ocean Acoustics. Springer-Verlag, New York.
Landro, M. 1992. Modeling of GI gun signatures. Geophysical Prospecting, 40 (7): 721-747.
Laws, M., L. Hatton, and M. Haartsen. 1990. Computer modeling of clustered airguns. First Break, 8(9): 331–338.
Leighton, T.G. The Acoustic Bubble. San Diego: Academic Press, 1994. 613 p.
MacGillivray, A.O. 2006. An Acoustic Modelling Study of Seismic Airgun Noise in Queen Charlotte Basin. M.Sc. Thesis. University of Victoria, BC.
MacGillivray, A.O., M.M. Zykov, and D.E. Hannay. 2007. Chapter 3: Summary of Noise Assessment; in Marine Mammal Monitoring and Mitigation During Open Water Seismic Exploration by ConocoPhillips Alaska, Inc. in the Chukchi Sea July-October 2006. Report by LGL Alaska Research Associates and JASCO Research Ltd. January.
Malme, C.I., P.W. Smith, and P.R. Miles. 1986. Characterisation of geophysical acoustic survey sounds. Prepared by BBN Laboratories Inc., Cambridge, for Battelle Memorial Institute to the Minerals Management Service, Pacific Outer Continental Shelf Region, Los Angeles, CA.
McCauley, R.D., M.-N. Jenner, C. Jenner, K.A. McCabe, and J. Murdoch. 1998. The response of humpback whales (Megaptera novaeangliae) to offshore seismic survey noise: preliminary results of observations about a working seismic vessel and experimental exposures. APPEA J.—Austral. Petrol. Prod. & Explor. Assoc. J. 38: 692-707.
Miller, J.H., A.E. Bowles, B.L. Southall, R.L. Gentry, W.T. Ellison, J.J. Finneran, C.R. Greene Jr., D. Kastak, D.R. Ketten, P.L. Tyack, P.E. Nachtigall, W.J. Richardson and J.A. Thomas (2005) Strategies for weighting exposure in the development of acoustic criteria for marine mammals. Journal of the Acoustical Society of America 118:2019 (Abstract). Presentation available at: http://www.oce.uri.edu/faculty_pages/miller/Noise_Weighting_10_18_2005.ppt
Racca, R.G. and J.A. Scrimger. 1986. Underwater Acoustic Source Characteristics of Air and Water Guns. Contractor report by JASCO Research Ltd., Victoria, B.C, for DREP Contract No. 06SB 97708-5-7055.
43
Sherwood, K.W., P.P. Johnston, J.D. Craig, S.A. Zerwick, R.T. Lothamer, D.K. Thurston, and S.B. Hurlbert. 2002. Structure and Stratigraphy of the Hanna Trough, U.S. Chukchi Self, Alaska, in Miller, E.L., A. Grantz, and S.L. Klemperer, eds., Tectonic Evolution of the Bering Shelf-Chukchi Sea-Arctic Margin and Adjacent Landmasses: Boulder, Colorado, Geological Society of America Special Paper 360, p. 39-66.
Southall, B.L., A.E. Bowles, W.T. Ellison, J.J. Finneran, R.L. Gentry, C.R. Greene Jr., D. Kastak, D.R. Ketten, J.H. Miller, P.E. Nachtigall, W.J. Richardson, J.A. Thomas, and P.L. Tyack. 2008. Marine Mammal Noise Exposure Criteria: Initial Scientific Recommendations. Aquatic Mammals, In Press.
Teague, W.J., M.J. Carron and P.J. Hogan. 1990. A comparison between the generalized digital environmental model and Levitus climatologies. J. Geophys. Res. 95(C5): 7167–7183.
Tashmukhambetov, A.M.., G.E. Ioup, J.W. Ioup, N.A. Sidorovskaia, and J.J. Newcomb, 2008. Three-dimensional seismic array characterization study: Experiment and modeling. J. Acoust. Soc. Am. 123, 4094-4108.
Zhang, Z. and C. Tindle. 1995. Improved equivalent fluid approximations for a low shear speed ocean bottom. J. Acoust. Soc. Am. 98, 3391-3396.
Ziolkowski, A. 1970. A Method for Calculating the Output Pressure Waveform from an Air Gun. Geophys. J. R. Astr. Soc. 21, 137–161.