guidelines for electric system planning - oatioasis.com · 1 guidelines for electric system...
TRANSCRIPT
1
Guidelines For
Electric System Planning
(Transmission, Subtransmission, Distribution)
Composed of
Near Term System Development Guidelines & Methodology
Standard Practices Document
Operations Section of Planning Guidelines Document
Line and Equipment Rating Summary
7/24/2007

2
Introduction These Guidelines are intended to be a guide for the development of the Transmission, Subtransmission and Distribution Plans. These Plans are completed during the fourth quarter of each calendar year and become the basis for the Transmission, Subtransmission, and Distribution budget and future facility construction. It is intended that these Guidelines be reviewed as needed as a part of the overall plans process. The Planning Guidelines Committee, composed of representatives from Electric System Engineering, System Design & Construction, Strategic System Planning, Transmission & Generation Operations, Electric System Operations & Maintenance, and Electric System Planning & Performance is responsible for performing this review. Results of this review are summarized in this document. It is intended that the guidelines not be used as a rigid rule for the development of future facility needs. It is recognized that alternative solutions may be developed for problems noted and evaluations and recommendations for these future facilities will be addressed as needed. It is possible that after considering all factors, including but not limited to economics, reliability and impact on system operations, exceptions could be made to the guidelines. It is also recognized that certain parameters may change as a result of in-depth engineering design evaluations and the general evolution of our system. Existing facilities can be modified to meet the guidelines, but should be done so on a cost effective basis. The guidelines presented are for both planning study and operating study purposes. Separate sections of the document are devoted to each of these subjects. The Near Term Guidelines Section and the Standard Practices Section are directed toward the planning process and the Operations Section is devoted to studies of that nature. The Line & Equipment Ratings Section of the document is applicable to both planning and operating studies. The development of alternatives and exceptions to the guidelines will be reviewed during the normal planning process. At that time all affected parties will be made aware of any deviations. A glossary of terms has been provided at the end of the Near Term Guidelines Section and the Standard Practices Section of the document. The definitions contained in the glossary are an important factor in understanding the meaning and intent of these guidelines.

3
NEAR TERM SYSTEM DEVELOPMENT GUIDELINES & METHODOLOGY (ESA portion of planning guidelines document) guidelines_near_term 1.0 GENERAL 3 2.0 STEADY STATE ANALYSIS 8 2.1 Normal Conditions (n-0) 8 2.2 Single Contingency Outage Conditions (n-1) 11 3.0 SYSTEM DYNAMIC RESPONSE ANALYSIS 14 4.0 RELIABILITY ANALYSIS 16 5.0 FOLLOW UP 16 5.1 NEW ISSUES REQUIRING RESOLUTION 16 5.2 OLD ISSUES REQUIRING PERIODIC UPDATE 18 6.0 DEFINITIONS 18 7.0 REFERENCES 20 8.0 INDEX 22 9.0 FIGURES & TABLES 24

4
1.0 GENERAL
The following paragraphs describe the near term system development guidelines, assumptions & study methodology used to plan SRP’s transmission, subtransmission and distribution systems. During all phases of the Bulk Electric System planning process (100 kV and above), Transmission & Generation Operations will be involved as appropriate in the process to ensure that the studies take into account the operational perspective. 1.1 LOAD
1.1.1 FORECAST, ANNUAL: A peak load forecast corresponding to the local area forecast developed annually by Distribution Planning. This forecast is developed using historical local area loads and a per unit saturation curve methodology that defines likely area growth trends and growth knees and the associated electric system expansion risk. The coincident total load including mining and industrial loads is equal to the 10% Risk Forecast generated by Strategic Economic Services reflecting a 1 in 10 probability of extreme weather and economic conditions
1.1.2 FORECAST, SATURATION: A peak load forecast designed to reflect the
theoretical maximum or ultimate level possible in a given area. The recent development of a per unit saturation curve methodology has indicated that most areas will plateau at a load level of 11-12 MW/square mile, and will approach saturation at about 15 MW/square mile. The 2003 Saturation Forecast was developed by substation using 2000/01 load and land use information. The forecast includes load estimates by customer land use type, and since more accurate land use was available, a single saturated load estimate was developed for each substation service area.
1.2 GENERATION: Generation, sales and interchanges will be represented in planning studies in accordance with the latest SRP corporate Loads & Resources. Generating units in power flow cases will be committed and scheduled according to SRP’s planned scheduling practices after consultation with SRP’s Supply and Trading/Power Coordination group. Construction recommendations will generally be based on the economic commitment and scheduling of generating units.
Generation patterns will be varied in system studies to evaluate the results of planned or forced generator outages, seasonal commitment, seasonal scheduling of units, changes in fuel availability or prices, and/or economy interchanges. As a minimum test of the systems capability to accommodate different generation patterns, studies will investigate maximum and MINIMUM GENERATION

5
LEVELS for each normally scheduled valley plant (see TABLE A in Section 9.0 for a description of MINIMUM GENERATION LEVELS). Import and load serving nomograms shall be referenced to determine correct Generation patterns. The following will be considered prior to recommendation of construction for other than economic generating unit commitment and scheduling.
1. Annual hours for which system capability could limit maximum generation at a plant to less than rated output.
2. Cost of energy required above ECONOMIC UNIT COMMITMENT and schedule to avoid system problems without construction of new facilities.
3. Cost of constructing or advancing construction of new facilities. 4. PMax and Pmin for Power Flow Studies will be determined from
Generation Services, O&M Capacity, Generation for Transmission Planning
1.3 DISTRIBUTED GENERATION: Distributed generation options will be modeled
as necessary to evaluate the impact on the electric system plan. 1.4 LOOP FLOW: Power flow & stability studies are run with WECC full loop cases.
Where unscheduled flow (loop flow) is a concern a reasonable amount of WECC loop flow will be simulated. The scheduling practices of phase shifting transformers which are intended to control major and minor loop flow will be considered in system modeling decisions.
1.5 LEAD TIMES: Based on Line siting requirements and EHV equipment
procurement goal in planning is to keep the first three years of the 6-year plan fixed or unchanged if new lines are involved Otherwise, the two year guideline is acceptable. The equipment lead time, public involvement, permitting, right of way constraints, design considerations etc. all contribute to the necessity of this as discussed below. Please note that a 5 mw load addition in remote areas may result in an addition in the fixed 2 year plan.
1.5.1 LINES: For new lines at all voltages above 12kV the primary constraint
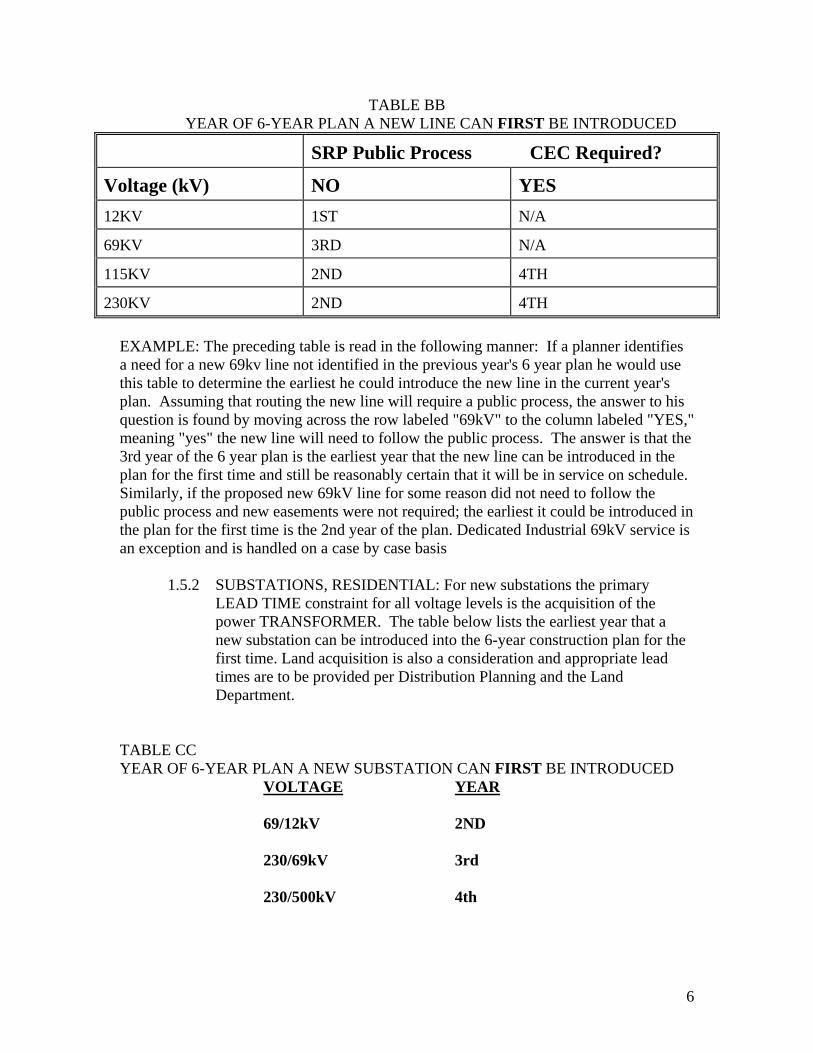
for construction is acquisition of a route and right-of-way. This includes conducting a PUBLIC PROCESS and, in the case of 115kV and above, receiving a CEC (Certificate of Environmental Compatibility) from the Arizona Corporation Commission. The table below lists the earliest year that a new line shall be introduced into the 6 year construction plan for the first time based on whether or not a public process and/or CEC permit will be required.
6
TABLE BB YEAR OF 6-YEAR PLAN A NEW LINE CAN FIRST BE INTRODUCED
SRP Public Process CEC Required?
Voltage (kV) NO YES 12KV 1ST N/A
69KV 3RD N/A
115KV 2ND 4TH
230KV 2ND 4TH EXAMPLE: The preceding table is read in the following manner: If a planner identifies a need for a new 69kv line not identified in the previous year's 6 year plan he would use this table to determine the earliest he could introduce the new line in the current year's plan. Assuming that routing the new line will require a public process, the answer to his question is found by moving across the row labeled "69kV" to the column labeled "YES," meaning "yes" the new line will need to follow the public process. The answer is that the 3rd year of the 6 year plan is the earliest year that the new line can be introduced in the plan for the first time and still be reasonably certain that it will be in service on schedule. Similarly, if the proposed new 69kV line for some reason did not need to follow the public process and new easements were not required; the earliest it could be introduced in the plan for the first time is the 2nd year of the plan. Dedicated Industrial 69kV service is an exception and is handled on a case by case basis
1.5.2 SUBSTATIONS, RESIDENTIAL: For new substations the primary LEAD TIME constraint for all voltage levels is the acquisition of the power TRANSFORMER. The table below lists the earliest year that a new substation can be introduced into the 6-year construction plan for the first time. Land acquisition is also a consideration and appropriate lead times are to be provided per Distribution Planning and the Land Department.
TABLE CC YEAR OF 6-YEAR PLAN A NEW SUBSTATION CAN FIRST BE INTRODUCED VOLTAGE YEAR 69/12kV 2ND 230/69kV 3rd 230/500kV 4th
7
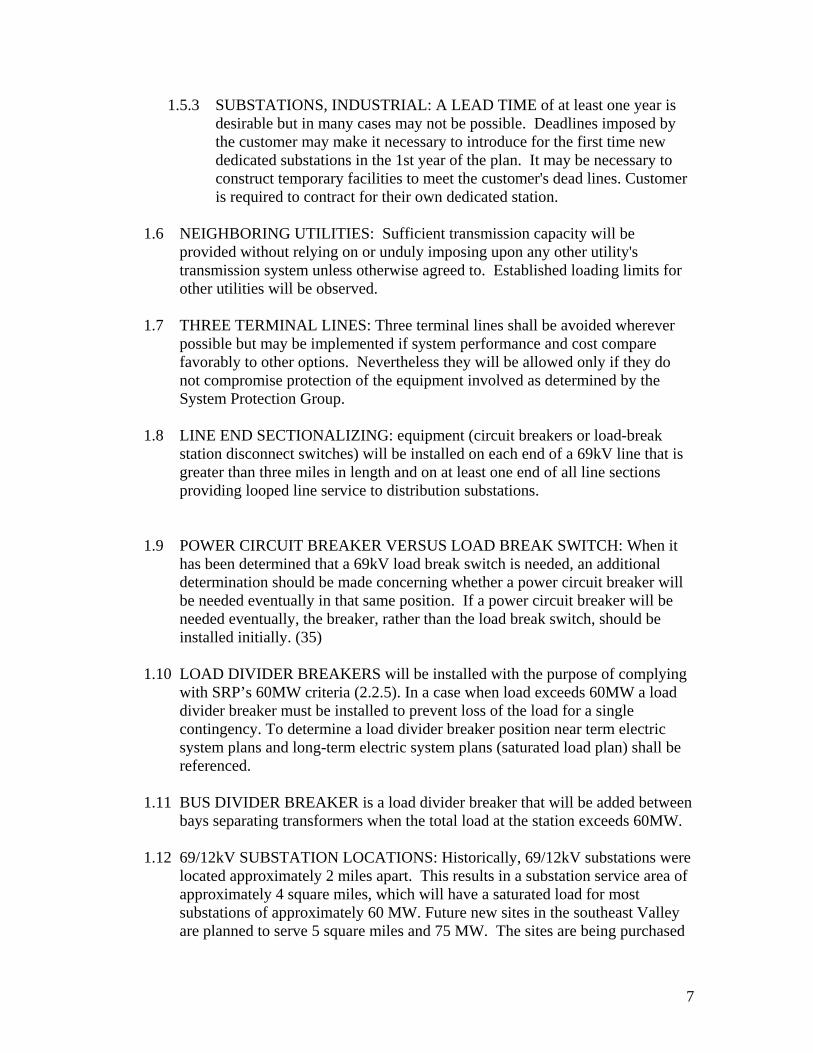
1.5.3 SUBSTATIONS, INDUSTRIAL: A LEAD TIME of at least one year is desirable but in many cases may not be possible. Deadlines imposed by the customer may make it necessary to introduce for the first time new dedicated substations in the 1st year of the plan. It may be necessary to construct temporary facilities to meet the customer's dead lines. Customer is required to contract for their own dedicated station.
1.6 NEIGHBORING UTILITIES: Sufficient transmission capacity will be
provided without relying on or unduly imposing upon any other utility's transmission system unless otherwise agreed to. Established loading limits for other utilities will be observed.
1.7 THREE TERMINAL LINES: Three terminal lines shall be avoided wherever
possible but may be implemented if system performance and cost compare favorably to other options. Nevertheless they will be allowed only if they do not compromise protection of the equipment involved as determined by the System Protection Group.
1.8 LINE END SECTIONALIZING: equipment (circuit breakers or load-break
station disconnect switches) will be installed on each end of a 69kV line that is greater than three miles in length and on at least one end of all line sections providing looped line service to distribution substations.
1.9 POWER CIRCUIT BREAKER VERSUS LOAD BREAK SWITCH: When it has been determined that a 69kV load break switch is needed, an additional determination should be made concerning whether a power circuit breaker will be needed eventually in that same position. If a power circuit breaker will be needed eventually, the breaker, rather than the load break switch, should be installed initially. (35)
1.10 LOAD DIVIDER BREAKERS will be installed with the purpose of complying
with SRP’s 60MW criteria (2.2.5). In a case when load exceeds 60MW a load divider breaker must be installed to prevent loss of the load for a single contingency. To determine a load divider breaker position near term electric system plans and long-term electric system plans (saturated load plan) shall be referenced.
1.11 BUS DIVIDER BREAKER is a load divider breaker that will be added between
bays separating transformers when the total load at the station exceeds 60MW. 1.12 69/12kV SUBSTATION LOCATIONS: Historically, 69/12kV substations were
located approximately 2 miles apart. This results in a substation service area of approximately 4 square miles, which will have a saturated load for most substations of approximately 60 MW. Future new sites in the southeast Valley are planned to serve 5 square miles and 75 MW. The sites are being purchased

8
to accommodate 4-69kV bay positions, 3-69kV lines, and 1-69kV capacitor. This configuration will also allow 3 or 4-69/12kV transformers depending on the need for a 69kV capacitor bank in the area. SRP is currently evaluating a higher 21.6 kV distribution voltage for the southeast Valley. For the 21.6kV voltage substations will serve about 10 square miles. Historically, a substation can serve more than 4 square miles if the load density is less than 15MW/square miles and/or sufficient land is purchased to accommodate more than 2-28MVA transformers. New substation sites are purchased based on a prioritized plan which includes a review of the current substation plan, and other factors.
1.13 69/12kV SUBSTATION SITE SIZE: Currently SRP is purchasing 28 MVA
transformers as a standard for most distribution substations. These units have a planned loading capability of roughly 30 MVA. Since it is difficult to forecast where higher density loads will occur, these substation sites should be purchased large enough to accommodate four 69/12kV transformers even though in most cases two or three transformers will suffice. Substation sites should also have sufficient room to terminate three 69kV lines and in some cases 1-69kV capacitor bank. To accommodate these requirements the usable area within the substation should be 300 feet by 300 feet. Additional land may need to be purchased to account for municipal set back requirements.
1.14 NEW SUBSTATIONS: Consideration is given to opening up a new substation
site when the load in its four square mile service territory exceeds 7MW. Also the delivery voltage for residential subs may be increased to 115kv or 138kv in areas where entirely new infrastructure is required, and the distribution voltage may be increased to 22kv.
1.15 12kV FEEDER LOCATIONS: Desired feeder locations are on the major mile
streets, the 1/4 mile streets and the 3/4 mile streets in the north/south direction and on the mile and 1/2 mile streets in the east/west direction.
1.16 12kV FEEDER GETAWAYS: Historically, 4-12kv feeders have been installed
per each 69/12kV transformer addition. Now new switchgear orders come equipped with 5 feeder breakers allowing for the possibility of installing 5-12kv feeders per transformer. In most residential areas, 5 feeder getaways will be installed per transformer. In light industrial and commercial areas, the need for 4 or 5 feeders will be evaluated as will the potential for a dedicated feeder request.
1.17 12kV FEEDER INTERCONNECTION: 12kV feeders are open looped
interconnected through switches to allow seasonal balancing of loads on 69/12kV transformers and 12kV feeders. Switching is also performed to facilitate construction activities, isolate faulted line segments and restore load following an outage.

9
1.18 VOLTAGE TUNING: For the purpose of building power flow base cases, 69kv & above bus voltages shall be within the target values found in TABLE D in Section 9.0.
1.19 12kV FUSING/SECTIONALIZING-OVERHEAD: Overhead laterals typically
have not been fused. However, reclosers/fuses are now being added where reliability data indicates an unusually high incidence of outages of the entire circuit. Reclosers and sectionalizers are used on feeders and major laterals to limit the amount of load interrupted for certain faults
1.20 12kV FUSING/SECTIONALIZING-UNDERGROUND: The #2 primary
underground cable is normally fused. The 4/0 and feeder cables are not fused. Underground sectionalizing is considered on a case-by-case basis when reliability data indicates an unusually high incidence of outages in a particular area that affects the entire circuit.
2.0 STEADY STATE ANALYSIS
The guidelines listed below are used in conducting a steady state analysis or a power flow study of the system.
2.1 Normal Conditions (n-0)
2.1.1 LOADING LIMITS: Under NORMAL CONDITIONS transmission and
distribution facilities will not be overloaded. Specifically, normal conditions will not cause transformer or line overloads as described below: 2.1.1.1 TRANSFORMERS: 525/230kV and 230/115kV transformers will not be loaded on more than 100% of their highest nameplate rating as measured on the load side of the transformer with all elements in service.
230/69kV transformers will not be loaded to more than 100% of the nameplate rating specified in Transmission/Generation Transformer Loading Limits Document located in the Substations Equipment database @ http://insidesrp/elsyseng/electricsys/SubEquip.html . We need to develop 30 minute ratings in order to identify NERC defined SOL’s for our system. 69/12kV transformers will not be loaded to more than 85% of the emergency limit specified in Substation Transformers\Emergency Loading Data. This access database is located in the Substations Equipment Database @ http://insidesrp/elsyseng/electricsys/SubEquip.html

10
2.1.1.2 OVERHEAD LINES: 500kV, 230kV, 115kV or 69kV lines and substation conductors will not be loaded in excess of 100% of their summer or winter normal limit based on the conditions and assumptions listed in TABLE 1 of the Line/Equipment Ratings Document.
Overhead12kV lines will be loaded on a planned basis to a maximum of 70% of their summer emergency rating noted in TABLE 2 of the Line/Equipment Ratings Document. 2.1.1.3 UNDERGROUND LINES 69kV & 12kV lines should not be loaded in excess of 100% of their maximum ampacity rating based on the conditions and assumptions listed in TABLE 3 of the Line & Equipment Ratings section of this document. Underground 12kV lines will be loaded on a planned basis to a maximum of 70% of their summer emergency rating noted in TABLE 3 of the Line/Equipment Ratings Document. Average planned circuit loading levels per 69/12kV transformer are typically 56% of the emergency rating due to limited switching flexibility between circuits on each transformer and the need to provide adequate margin (30%) on the highest loaded circuit for reliability. Feeder getaway sizes and the related maximum planned and emergency bay loadings for these feeder sizes are shown in the attached table. Table DD - Feeder Loading Impact on Bay Loading
MAX 70% OF EMER 56% 4 FDR 4 FDR EMER LOAD PLANNED MARGIN AVG TOTAL BAY BAY/FDR
FEEDER SIZE AMPS MAX AMPS AMPS AMPS AMPS MVA MVA 266AL/500 MCM 480 336 144 269 1075.2 23.2 27.3
750 MCM AL 540 378 162 302 1209.6 26.1 30.7
397 AL/750 MCM CU 600 420 180 336 1344 29.0 34.2
5 FEEDER 5 FEEDER 5 FEEDER 397 AL/750 MCM CU 600 420 180 336 1680 36.3 42.7
2.1.2 VOLTAGE LIMITS – EQUIPMENT BASED: Equipment high voltage
limits will not be exceeded for normal conditions (n-0) or for the energizing or de-energizing of transmission lines. These normal Voltage Limits are found in TABLE 7 of the Line & Equipment Ratings section of this document.

11
2.1.3 VOLTAGE LIMITS - CUSTOMER BASED: Customer service entrance
voltage limits (high or low) will not be violated for normal conditions (n-0). These limits are described below.
-230kv & above: the voltage shall not be below 1.0 pu -115kv & 69kv: the voltage magnitude will not drop below the minimum
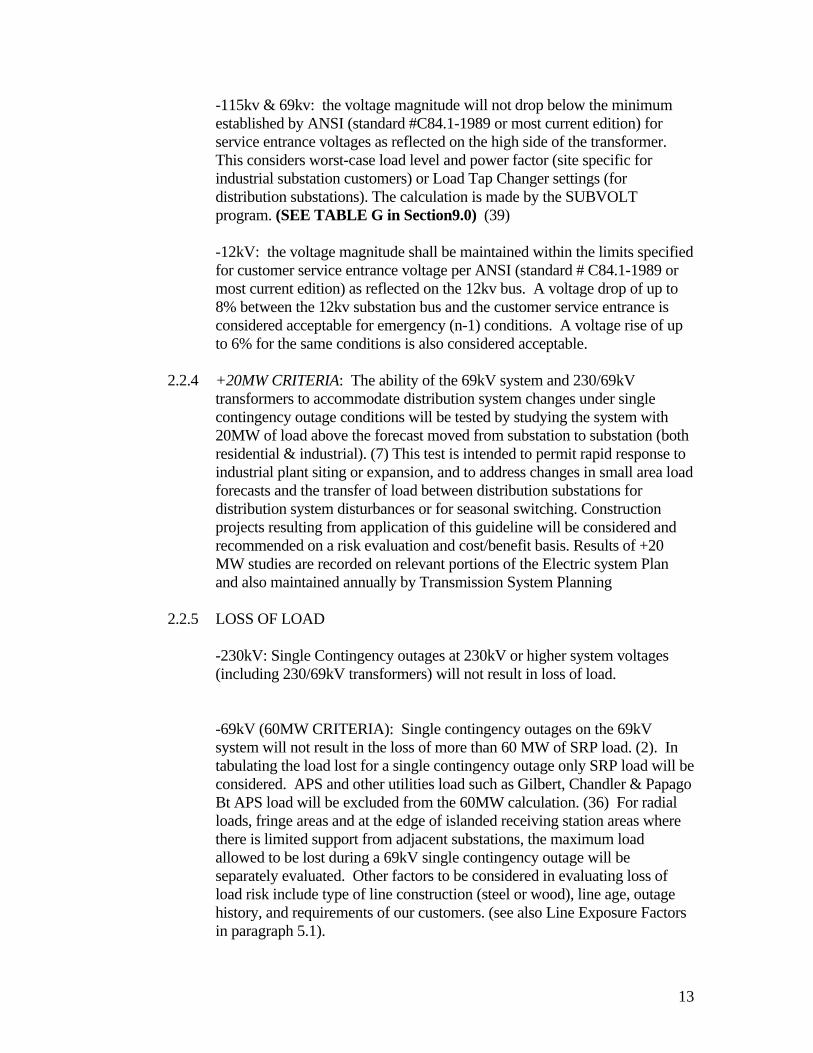
established by ANSI (standard #C84.1-1989 or most current edition, Ref 42) for service entrance voltages as reflected on the high side of the transformer. This considers worst-case load level and power factor (site specific for industrial substation customers) or Load Tap Changer settings (for distribution substations). The calculation is made by the SUBVOLT program. (SEE TABLE G in Section 9.0) (39)
-12kV: the voltage magnitude shall be maintained within the limits
specified for customer service entrance voltage per ANSI (standard # C84.1-1989 or most current edition) as reflected on the 12kv bus. A voltage drop of up to 5% between the 12kv substation bus and the customer service entrance is considered acceptable for normal (n-0) conditions.
2.1.4 VAR INTERCHANGE: Under normal conditions the net VAR flow
interchange with each individual neighboring utility shall be minimized and maintained near zero. Key VAR interchange points are found in TABLE E in Section 9.0
2.1.5 POWER FACTOR: Var requirements shall be evaluated at each
substation. Substation and 12kv line capacitors will be added to produce unity power factor on the 69kv side of the residential transformer. Capacitor additions for industrial substations will be evaluated separately on a case-by-case basis
2.1.6 12kV ZONE LOAD LIMITS: 12kv Line switches with LOAD BREAK
capability will be added to the feeder system to aid transferring load between sources. Switches are also recommended to split up zones with greater than 3,000 kVA connected load, which relates to the typical margin in 12kV feeders and 69/12kV transformers.
2.2 Single Contingency Outage Conditions (n-1) 2.2.1 LOADING LIMITS: SINGLE CONTINGENCY outage conditions will
not result in overloaded electric facilities. Specifically, a single contingency outage will not cause transformer or line overloads as described below:

12
2.2.1.1 TRANSFORMERS: 525/230kV and 230/115kV transformers will not be loaded to
more than 100% of their highest nameplate rating as measured on the load side of the transformer.
230/69kV transformers will not be loaded to more than the
emergency list specified Transmission/Generation Transformer Loading Limits Document located in the Substations Equipment database @ http://insidesrp/elsyseng/electricsys/SubEquip.html
69/12kV transformers will not be loaded to more than 100% of
the limit specified in Substation Transformers/Emergency Loading Data. This access database is located in the Substations Equipment Database @ http://insidesrp/elsyseng/electricsys/SubEquip.html
2.2.1.2 OVERHEAD LINES:
500kV, 230kV, 115kV, 69kV, and 12kV lines and substation conductors will not be loaded in excess of 100% of their emergency limit. For voltages 69kV & above the conditions and assumptions are listed in TABLE 1 of the Line/Equipment Ratings Document. The maximum 12kv feeder loading is based on the conditions and assumptions shown in TABLE 2 of the Line/Equipment Ratings Document.
2.2.1.3 UNDERGROUND LINES:
69kV & 12kV underground conductors will not be loaded in excess of 100% of their emergency limit. These emergency limits are found in TABLE 7 of the Line/Equipment Ratings Document.
2.2.2 VOLTAGE LIMITS – EQUIPMENT BASED: Equipment voltage limits (high or low) will not be exceeded for single contingency outages or for the energizing or de-energizing of transmission lines. Emergency Voltage Limits are found in TABLE 7 of the Line/Equipment Ratings Document.
2.2.3 VOLTAGE LIMITS – EQUIPMENT BASED: Customer service entrance
voltages will be maintained within the high/low established limits for SINGLE CONTINGENCY outages. These limits are described below.
-230kv & above: the voltage deviation at any bus shall not exceed 5% of the pre-outage voltage.
13
-115kv & 69kv: the voltage magnitude will not drop below the minimum established by ANSI (standard #C84.1-1989 or most current edition) for service entrance voltages as reflected on the high side of the transformer. This considers worst-case load level and power factor (site specific for industrial substation customers) or Load Tap Changer settings (for distribution substations). The calculation is made by the SUBVOLT program. (SEE TABLE G in Section9.0) (39) -12kV: the voltage magnitude shall be maintained within the limits specified for customer service entrance voltage per ANSI (standard # C84.1-1989 or most current edition) as reflected on the 12kv bus. A voltage drop of up to 8% between the 12kv substation bus and the customer service entrance is considered acceptable for emergency (n-1) conditions. A voltage rise of up to 6% for the same conditions is also considered acceptable.
2.2.4 +20MW CRITERIA: The ability of the 69kV system and 230/69kV
transformers to accommodate distribution system changes under single contingency outage conditions will be tested by studying the system with 20MW of load above the forecast moved from substation to substation (both residential & industrial). (7) This test is intended to permit rapid response to industrial plant siting or expansion, and to address changes in small area load forecasts and the transfer of load between distribution substations for distribution system disturbances or for seasonal switching. Construction projects resulting from application of this guideline will be considered and recommended on a risk evaluation and cost/benefit basis. Results of +20 MW studies are recorded on relevant portions of the Electric system Plan and also maintained annually by Transmission System Planning
2.2.5 LOSS OF LOAD
-230kV: Single Contingency outages at 230kV or higher system voltages (including 230/69kV transformers) will not result in loss of load. -69kV (60MW CRITERIA): Single contingency outages on the 69kV system will not result in the loss of more than 60 MW of SRP load. (2). In tabulating the load lost for a single contingency outage only SRP load will be considered. APS and other utilities load such as Gilbert, Chandler & Papago Bt APS load will be excluded from the 60MW calculation. (36) For radial loads, fringe areas and at the edge of islanded receiving station areas where there is limited support from adjacent substations, the maximum load allowed to be lost during a 69kV single contingency outage will be separately evaluated. Other factors to be considered in evaluating loss of load risk include type of line construction (steel or wood), line age, outage history, and requirements of our customers. (see also Line Exposure Factors in paragraph 5.1).

14
-12kV: Single contingency outages of 69/12kV transformers and/or 12kV lines will result in loss of customer load because the distribution system is an open-looped radial system. Existing 12kV feeder radials and laterals having greater than 3000 kVA connected should be looped with adjoining feeders using a N.O. switch to allow for quicker restoration of customer loads. -12kV feeder routing should be planned to assure feeders from the same bay do not serve the same area. This only applies when multiple bays serve a specific area. -When multiple bays exist within a substation, two feeders form the same bay should not be constructed on the same overhead pole.
2.2.6 MOBILE / MODULAR TRANSFORMERS: Several mobile and modular
unit substation (MUS) transformers are available for construction, maintenance and emergency conditions such as transformer failures. Most distribution growth areas are constructed with sufficient 12kv ties to restore customer loads without the use of a mobile transformer. In some areas, mobile transformers will be installed following a transformer outage to allow area loading to return closer to normal levels. Table K in Section 9.0 shows which mobiles are appropriate to use at the various substations served by SRP including dedicated substations serving mines and industrial customers. When commercial customers do not have dedicated redundant transformers and when load exceeds capacity of existing mobiles, consideration should be given to purchasing a larger mobile transformer and/or having the customer purchase redundant capacity.
3.0 SYSTEM DYNAMIC RESPONSE
The guidelines listed below are used in conducting transient and inter-area oscillatory stability studies.
3.1 FLOW MARGIN: 7% margin will be factored into stability limits to compensate
for uncertainty in modeling etc. 3.2 FAULT DAMPING: Generator fault damping, which represents machine internal
losses, will be applied for close-in 3-phase faults. Generator fault damping is not represented for simulation of single-line-to-ground faults. Fault damping, when applied, amounts to the following percentage of max generator output as defined below.
Navajo = 6% of generator capability Palo Verde = 7.2% of generator capability Four Corners = 10% of generator capability
15
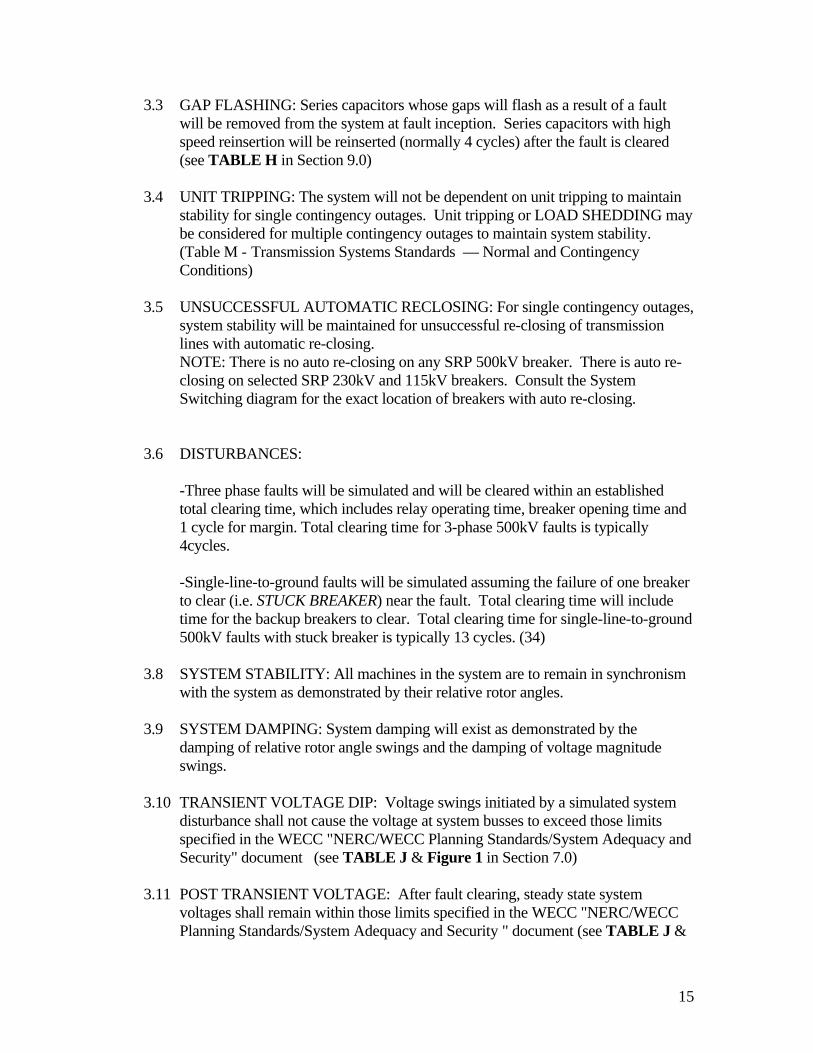
3.3 GAP FLASHING: Series capacitors whose gaps will flash as a result of a fault will be removed from the system at fault inception. Series capacitors with high speed reinsertion will be reinserted (normally 4 cycles) after the fault is cleared (see TABLE H in Section 9.0)
3.4 UNIT TRIPPING: The system will not be dependent on unit tripping to maintain
stability for single contingency outages. Unit tripping or LOAD SHEDDING may be considered for multiple contingency outages to maintain system stability. (Table M - Transmission Systems Standards — Normal and Contingency Conditions)
3.5 UNSUCCESSFUL AUTOMATIC RECLOSING: For single contingency outages,
system stability will be maintained for unsuccessful re-closing of transmission lines with automatic re-closing. NOTE: There is no auto re-closing on any SRP 500kV breaker. There is auto re-closing on selected SRP 230kV and 115kV breakers. Consult the System Switching diagram for the exact location of breakers with auto re-closing.
3.6 DISTURBANCES:
-Three phase faults will be simulated and will be cleared within an established total clearing time, which includes relay operating time, breaker opening time and 1 cycle for margin. Total clearing time for 3-phase 500kV faults is typically 4cycles. -Single-line-to-ground faults will be simulated assuming the failure of one breaker to clear (i.e. STUCK BREAKER) near the fault. Total clearing time will include time for the backup breakers to clear. Total clearing time for single-line-to-ground 500kV faults with stuck breaker is typically 13 cycles. (34)
3.8 SYSTEM STABILITY: All machines in the system are to remain in synchronism
with the system as demonstrated by their relative rotor angles. 3.9 SYSTEM DAMPING: System damping will exist as demonstrated by the
damping of relative rotor angle swings and the damping of voltage magnitude swings.
3.10 TRANSIENT VOLTAGE DIP: Voltage swings initiated by a simulated system
disturbance shall not cause the voltage at system busses to exceed those limits specified in the WECC "NERC/WECC Planning Standards/System Adequacy and Security" document (see TABLE J & Figure 1 in Section 7.0)
3.11 POST TRANSIENT VOLTAGE: After fault clearing, steady state system
voltages shall remain within those limits specified in the WECC "NERC/WECC Planning Standards/System Adequacy and Security " document (see TABLE J &
16
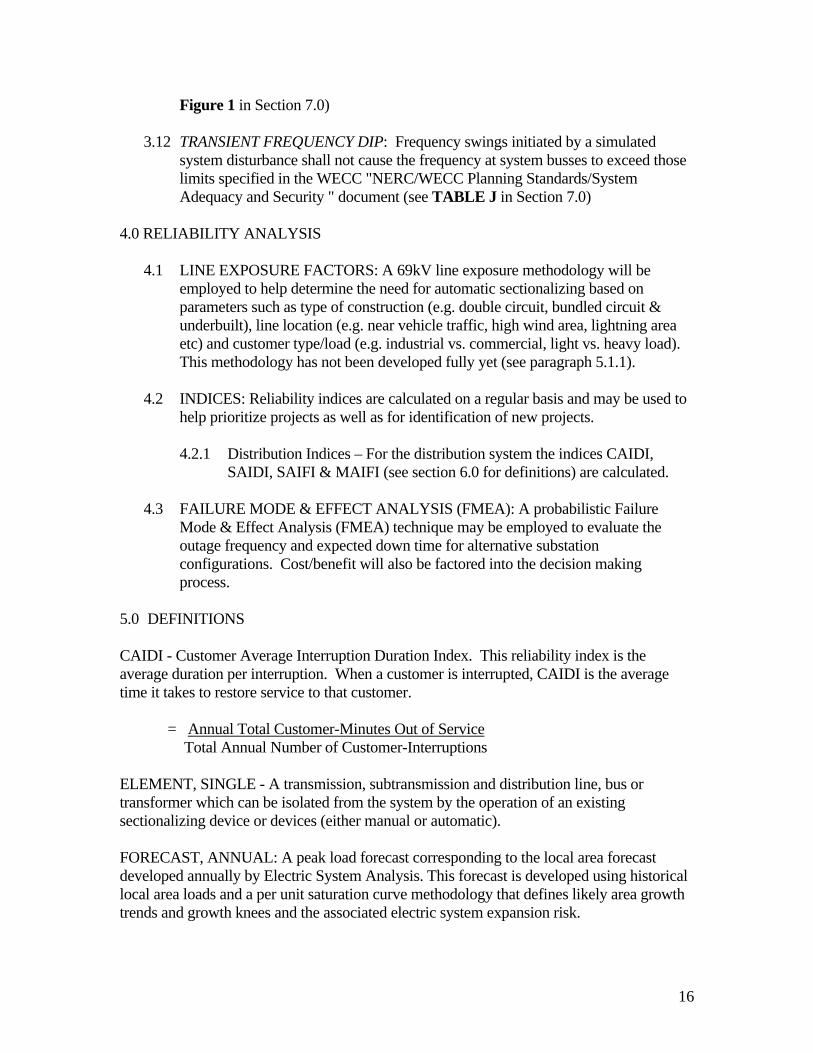
Figure 1 in Section 7.0) 3.12 TRANSIENT FREQUENCY DIP: Frequency swings initiated by a simulated
system disturbance shall not cause the frequency at system busses to exceed those limits specified in the WECC "NERC/WECC Planning Standards/System Adequacy and Security " document (see TABLE J in Section 7.0)
4.0 RELIABILITY ANALYSIS
4.1 LINE EXPOSURE FACTORS: A 69kV line exposure methodology will be
employed to help determine the need for automatic sectionalizing based on parameters such as type of construction (e.g. double circuit, bundled circuit & underbuilt), line location (e.g. near vehicle traffic, high wind area, lightning area etc) and customer type/load (e.g. industrial vs. commercial, light vs. heavy load). This methodology has not been developed fully yet (see paragraph 5.1.1).
4.2 INDICES: Reliability indices are calculated on a regular basis and may be used to
help prioritize projects as well as for identification of new projects.
4.2.1 Distribution Indices – For the distribution system the indices CAIDI, SAIDI, SAIFI & MAIFI (see section 6.0 for definitions) are calculated.
4.3 FAILURE MODE & EFFECT ANALYSIS (FMEA): A probabilistic Failure
Mode & Effect Analysis (FMEA) technique may be employed to evaluate the outage frequency and expected down time for alternative substation configurations. Cost/benefit will also be factored into the decision making process.
5.0 DEFINITIONS CAIDI - Customer Average Interruption Duration Index. This reliability index is the average duration per interruption. When a customer is interrupted, CAIDI is the average time it takes to restore service to that customer. = Annual Total Customer-Minutes Out of Service Total Annual Number of Customer-Interruptions ELEMENT, SINGLE - A transmission, subtransmission and distribution line, bus or transformer which can be isolated from the system by the operation of an existing sectionalizing device or devices (either manual or automatic). FORECAST, ANNUAL: A peak load forecast corresponding to the local area forecast developed annually by Electric System Analysis. This forecast is developed using historical local area loads and a per unit saturation curve methodology that defines likely area growth trends and growth knees and the associated electric system expansion risk.

17
FORECAST, SATURATION: A peak load forecast designed to reflect the theoretical maximum or ultimate level possible in a given area. The recent development of a per unit saturation curve methodology has indicated that most areas will plateau at a load level of 11-12 MW/square mile, and will approach saturation at about 15 MW/square mile. The saturation Forecast is developed by substation using 1993 land use information from Corporate Forecasting and 1994 customer load information down to the 40 acre level. The forecast includes load estimates by customer type so that three forecasts (high, medium, and low) can be developed by substation. NORMAL CONDITIONS - Normal conditions (n-0) exist when all distribution, subtransmission, transmission and generation elements composing the normal system configuration are in service. Under these conditions there are no forced or planned outages. OUTAGE, BREAKER TO BREAKER - An outage of a single element or combination of elements brought about by the operation of automatic sectionalizing devices as invoked by the primary protection scheme. A 69kV bus outage at a Receiving Station would be an example of a Breaker to Breaker Outage. OUTAGE, SINGLE ELEMENT - An outage of a single transmission, subtransmission or distribution element. OUTAGE, SINGLE CONTINGENCY - A single contingency outage (n-1) can be either one of the following two types of outages: 1) BREAKER TO BREAKER OUTAGE which is an outage of a single element or combination of elements brought about by the operation of automatic sectionalizing devices OR 2) SINGLE ELEMENT OUTAGE which is an outage of a single transmission or subtransmission element. NOTE: This definition need comparison with the definition recommended in reference #1. SAIDI - System Average Interruption Duration Index = Annual Total Customer-Minutes Out of Service Total Number of Customers Served SAIFI - System Average Interruption Frequency Index. This reliability index is the average number of interruptions that a customer experiences in a year. = Annual Total Number of Customer-Interruptions Total Number of Customers Served SAIFI SHORT- This reliability index is the same as SAIFI except that it is used only with outages with duration of less than one minute. TACS - Transmission Availability Composite Score or TACS is a reliability index. TACS values are calculated using recent time between failure (TBF), historical mean time between failure (MTBF), outage duration and outage frequency. One composite score is developed

18
to get an overall transmission performance measure that could be compared between utilities. The highest TACS score is 1000, which means that there were no outages in the 5-year timeframe. The lowest possible score is zero. Five years of data is used to calculate the TACS value, however, TACS is age weighted. THREE TERMINAL LINE - A subtransmission or transmission line connecting three stations with a source behind each, requiring circuit breakers at each station to operate to clear faults. 6.0 REFERENCES: 1 Task Report on Single Contingency Definitions as revised on November 8,1979 2 Task Report on Loss-of-Load Limit, J.A.Young, as revised on November 8, 1979 7 ESAR 69kV System Accommodation Guideline, J. D. Smith, June 27,1983 30 Chuck Falls, "Distribution/Subtransmission System Adequacy Review (DSSAR) Final Report" (Power System Analysis, July 1987), Issue S4. 33 Memorandum - Scott D. Cotner to J. A. Young, re: "Minimum Transient Voltage Criteria", March 21, 1988 34 Guidelines Work Group 1987-88 Report, April 1988 36 Memorandum - C. E. Cruz to System Adequacy Review Committee, re: "Notes From SARC Meeting No. 5, May 23, 1988", July 22, 1988 37 "Reliability Analysis For 230kV Switching Arrangements" by Joel Chang, 3/26/95
19
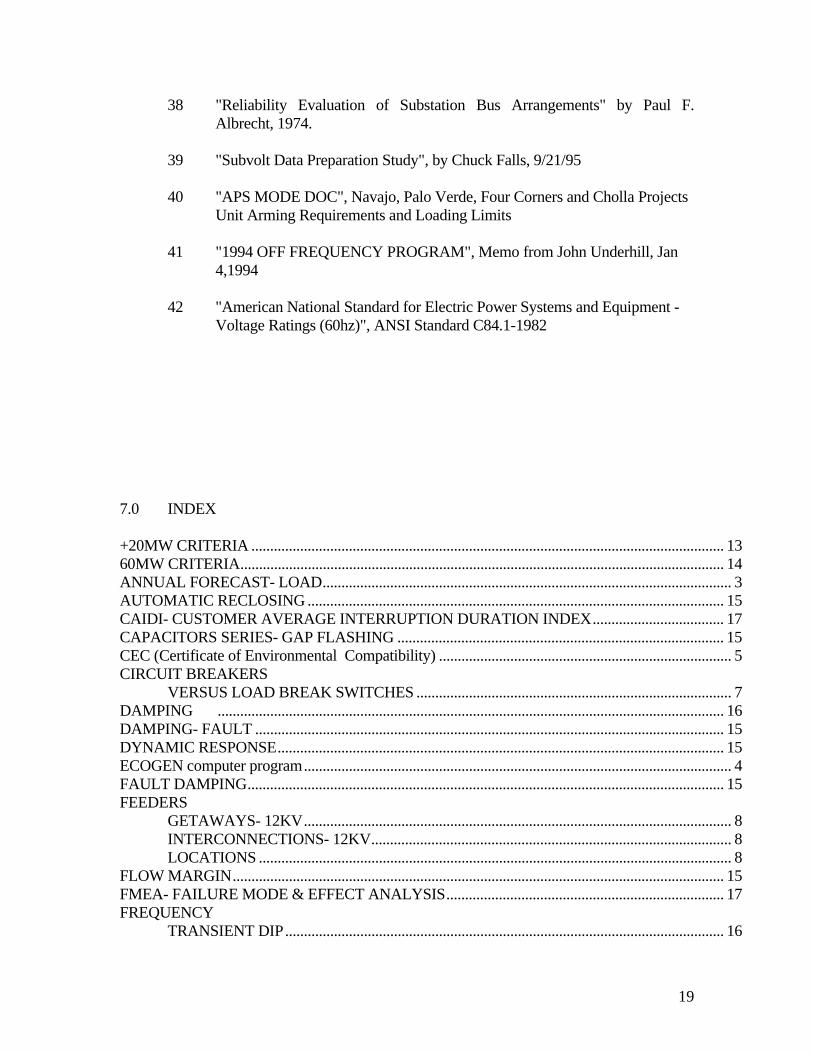
38 "Reliability Evaluation of Substation Bus Arrangements" by Paul F. Albrecht, 1974.
39 "Subvolt Data Preparation Study", by Chuck Falls, 9/21/95 40 "APS MODE DOC", Navajo, Palo Verde, Four Corners and Cholla Projects Unit Arming Requirements and Loading Limits 41 "1994 OFF FREQUENCY PROGRAM", Memo from John Underhill, Jan 4,1994 42 "American National Standard for Electric Power Systems and Equipment - Voltage Ratings (60hz)", ANSI Standard C84.1-1982 7.0 INDEX +20MW CRITERIA .............................................................................................................................. 13 60MW CRITERIA................................................................................................................................. 14 ANNUAL FORECAST- LOAD............................................................................................................. 3 AUTOMATIC RECLOSING ............................................................................................................... 15 CAIDI- CUSTOMER AVERAGE INTERRUPTION DURATION INDEX................................... 17 CAPACITORS SERIES- GAP FLASHING ....................................................................................... 15 CEC (Certificate of Environmental Compatibility) .............................................................................. 5 CIRCUIT BREAKERS VERSUS LOAD BREAK SWITCHES .................................................................................... 7 DAMPING ....................................................................................................................................... 16 DAMPING- FAULT ............................................................................................................................. 15 DYNAMIC RESPONSE....................................................................................................................... 15 ECOGEN computer program.................................................................................................................. 4 FAULT DAMPING............................................................................................................................... 15 FEEDERS GETAWAYS- 12KV.................................................................................................................. 8 INTERCONNECTIONS- 12KV................................................................................................ 8 LOCATIONS .............................................................................................................................. 8 FLOW MARGIN................................................................................................................................... 15 FMEA- FAILURE MODE & EFFECT ANALYSIS.......................................................................... 17 FREQUENCY TRANSIENT DIP..................................................................................................................... 16

20
FUSING/SECTIONALIZING OVERHEAD 12KV.................................................................................................................... 8 UNDERGROUND 12KV .......................................................................................................... 9 GAP FLASHING................................................................................................................................... 15 GENERATION........................................................................................................................................ 4 DISTRIBUTED........................................................................................................................... 5 ECONOMIC UNIT COMMITTMENT.................................................................................... 5 MINIMUM LEVELS ................................................................................................................. 5 GETAWAYS- 12KV FEEDERS............................................................................................................ 8 INDICES- RELIABILITY.................................................................................................................... 17 LEAD TIMES LINES ......................................................................................................................................... 5 SUBSTATIONS- INDUSTRIAL .............................................................................................. 7 SUBSTATIONS- RESIDENTIAL ............................................................................................ 6 TRANSFORMERS..................................................................................................................... 6 LIKELY- SATURATION LOAD.......................................................................................................... 4 LINES CEC (Certificate of Environmental Compatibility)................................................................... 5 LEAD TIMES ............................................................................................................................. 5 LINE END SECTIONALIZING ............................................................................................... 7 LOADING LIMITS- OVERHEAD n-0 .................................................................................. 10 LOADING LIMITS- OVERHEAD n-1 .................................................................................. 12 LOADING LIMITS- UNDERGROUND n-0......................................................................... 10 LOADING LIMITS- UNDERGROUND n-1......................................................................... 12 PUBLIC PROCESS.................................................................................................................... 5 THREE TERMINAL.................................................................................................................. 7 LOAD ANNUAL FORECAST.............................................................................................................. 3 Likely & Plateau Saturation Level ............................................................................................. 4 SATURATION FORECAST..................................................................................................... 4 SHEDDING............................................................................................................................... 15 LOAD BREAK SWITCH VS PCB........................................................................................................ 7 LOADING LIMITS LINES- OVERHEAD n-0 ........................................................................................................ 10 LINES- OVERHEAD n-1 ........................................................................................................ 12 LINES- UNDERGROUND n-0............................................................................................... 10 TRANSFORMERS n-0 ............................................................................................................ 10 TRANSFORMERS n-1 ............................................................................................................ 12 LOCATIONS 12KV FEEDERS......................................................................................................................... 8 69/12 SUBSTATIONS ............................................................................................................... 7 LOOP FLOW ......................................................................................................................................... 5 LOSS OF LOAD ................................................................................................................................... 13 MARGIN FLOW ....................................................................................................................................... 15 STABILITY .............................................................................................................................. 15

21
MOBILE TRANSFORMERS .............................................................................................................. 14 NORMAL CONDITIONS (n-0)........................................................................................................... 10 PLATEAU- SATURATION LOAD...................................................................................................... 4 POST TRANSIENT VOLTAGE.......................................................................................................... 16 POWER FACTOR VAR REQUIREMENTS n-0 ................................................................................................... 11 PUBLIC PROCESS- LINES................................................................................................................... 5 RECLOSING- AUTOMATIC.............................................................................................................. 15 RELIABILITY INDEX CAIDI... ..................................................................................................................................... 17 SAIDI…..................................................................................................................................... 17 SAIFI ....................................................................................................................................... 17 SAIFI SHORT........................................................................................................................... 17 TACS ....................................................................................................................................... 17 SAIDI- SYSTEM AVERAGE INTERRUPTION DURATION INDEX.......................................... 17 SAIFI- SYSTEM AVERAGE INTERRUPTION FREQUENCY INDEX....................................... 17 SATURATION FORECAST- LOAD.................................................................................................... 4 SECTIONALIZING LINE END................................................................................................................................... 7 SHEDDING- LOAD ............................................................................................................................. 15 SINGLE CONTINGENCY OUTAGE CONDITIONS (n-1)............................................................. 12 SITE SIZE- 69/12 SUBSTATIONS....................................................................................................... 8 STABILITY ....................................................................................................................................... 15 MARGIN................................................................................................................................... 15 STUCK BREAKER .............................................................................................................................. 16 SUBSTATIONS LEAD TIMES ............................................................................................................................. 6 LOCATION- 69/12..................................................................................................................... 7 NEW- WHEN TO OPEN UP..................................................................................................... 7 SITE SIZE- 69/12 ....................................................................................................................... 8 SUBVOLT program .............................................................................................................................. 11 SWITCHES LOAD BREAK 12KV.............................................................................................................. 11 LOAD BREAK VS CIRCUIT BREAKER............................................................................... 7 TACS- TRANSMISSION AVAILABILITY COMPOSITE SCORE............................................... 17 THREE TERMINAL LINES.................................................................................................................. 7 TRANSFORMERS LEAD TIMES ............................................................................................................................. 5 LOADING LIMITS n-0 ........................................................................................................... 10 LOADING LIMITS n-1 ........................................................................................................... 12 MOBILE.................................................................................................................................... 14 TRANSIENT FREQUENCY DIP ................................................................................................................... 16 POST VOLTAGE..................................................................................................................... 16 VOLTAGE DIP ........................................................................................................................ 16 TRANSIENT FREQUENCY DIP........................................................................................................ 16
22
TRANSIENT VOLTAGE DIP............................................................................................................. 16 TRIPPING- UNIT.................................................................................................................................. 15 UNIT COMMITTMENT- ECONOMIC ............................................................................................... 5 UNIT TRIPPING................................................................................................................................... 15 VAR INTERCHANGE......................................................................................................................... 11 VOLTAGE LIMITS- CUSTOMER BASED n-0........................................................................................ 10 LIMITS- CUSTOMER BASED n-1........................................................................................ 12 LIMITS- EQUIPMENT BASED n-0 ...................................................................................... 11 LIMITS- EQUIPMENT BASED n-1 ...................................................................................... 13 POST TRANSIENT ................................................................................................................. 16 TRANSIENT DIP..................................................................................................................... 16 TUNING FOR BUILDING BASE CASES.............................................................................. 8 ZONE LOAD LIMITS.......................................................................................................................... 11
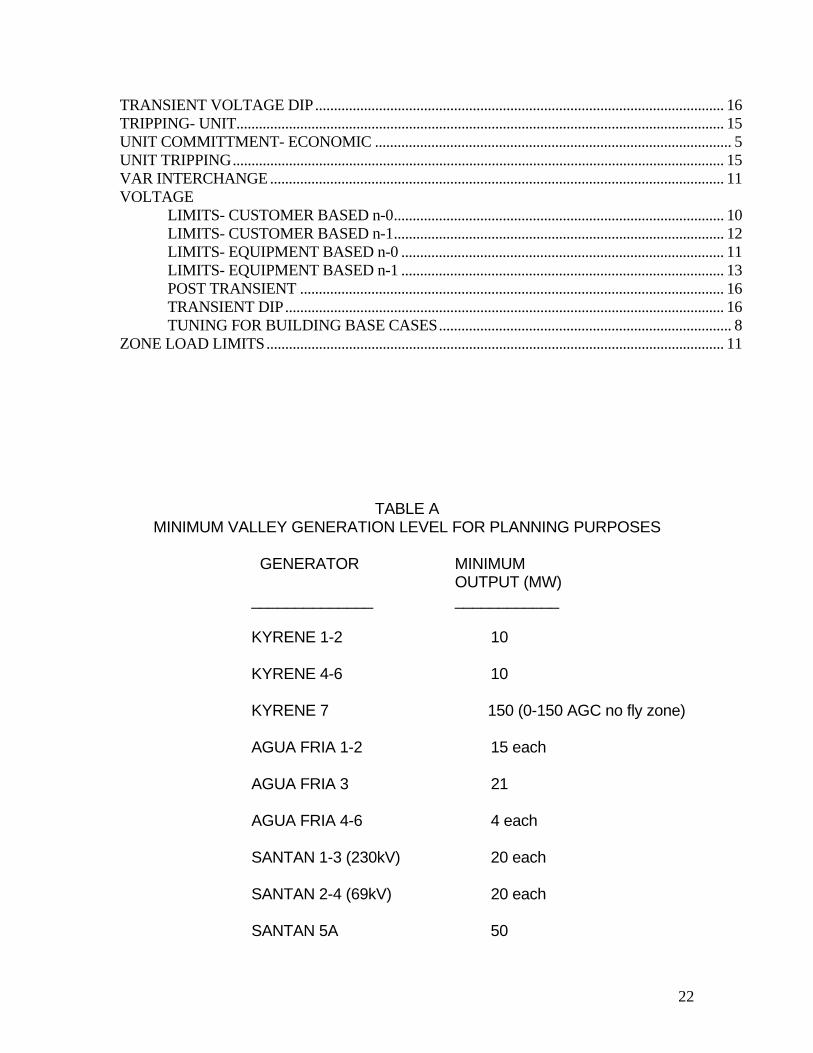
TABLE A MINIMUM VALLEY GENERATION LEVEL FOR PLANNING PURPOSES
GENERATOR MINIMUM OUTPUT (MW) ______________ ____________ KYRENE 1-2 10 KYRENE 4-6 10 KYRENE 7 150 (0-150 AGC no fly zone) AGUA FRIA 1-2 15 each AGUA FRIA 3 21 AGUA FRIA 4-6 4 each SANTAN 1-3 (230kV) 20 each SANTAN 2-4 (69kV) 20 each SANTAN 5A 50

23
SANTAN 5B 50 SANTAN 5S 95 SANTAN 6A 100 SANTAN 6S 67 Information taken from AGC OP’s with a qualifier that the New Kyrene’s low limits are not said to be Stability or Emissions limitations and may need to be verified.
TABLE D BUS VOLTAGE TOLERANCES FOR TUNING
POWER FLOW BASE CASES*
LOWER/UPPER LOWER/UPPER BUS NAME LIMIT (kV) BUS NAME LIMIT (kV) ______________ ______________ _____________ _____________ CHOLLA 500 525.0/540.0 KYRENE 230 232.0/239.0 CORONADO 500 “ LIBERTY 230 “ KYRENE 500 “ PINPKSRP 230 “ NAVAJO 500 “ SANTAN 230 “ PALOVERDE 500 “ SILVERKG 230 “ RUDD 500 “ THUNDRST 230 230.0/235.0 SILVERKG 500 “ WARD 230 “ WESTWING 500 “ WESTWING 230 232.0/241.0 LIBERTY 345 338.0/359.0 GOLDFELD 115 114.0/119.0 PNPKAPS 345 “ HAYDENAZ 115 “ WESTWING 345 “ AGUAFRIA 230 232.0/239.0 PINAL 115 “ ANDERSON 230 230.0/235.0 SUPERIOR 115 “
24
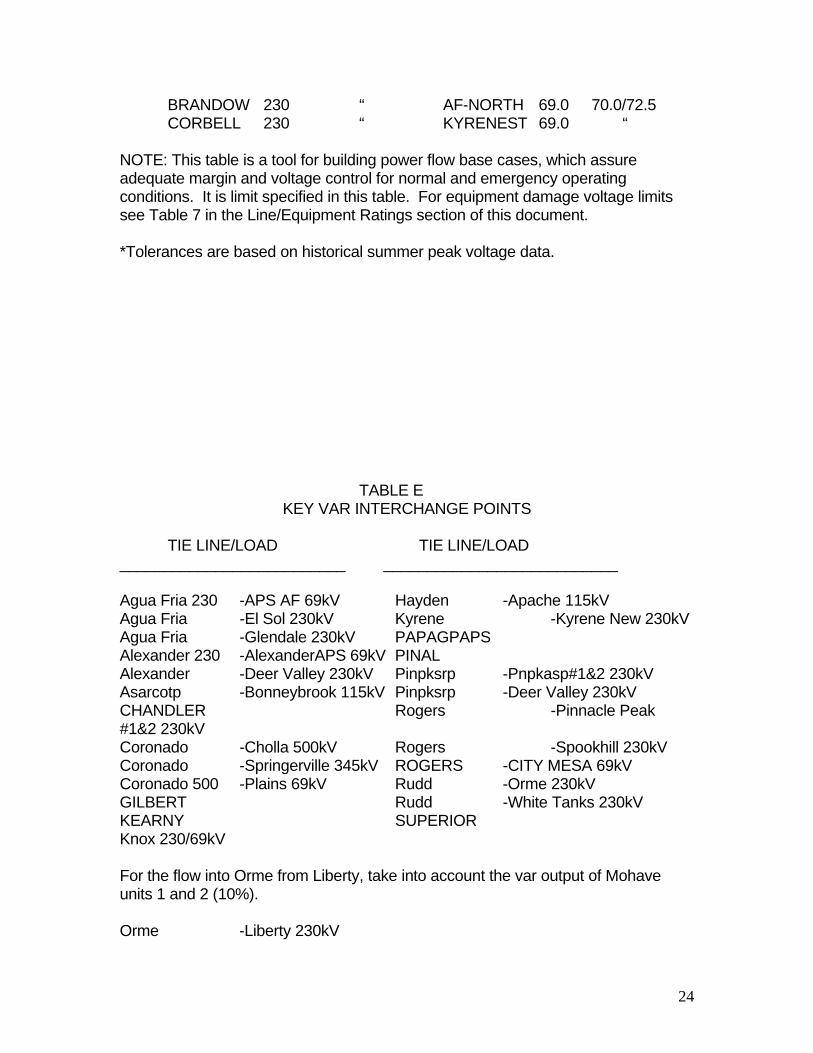
BRANDOW 230 “ AF-NORTH 69.0 70.0/72.5 CORBELL 230 “ KYRENEST 69.0 “ NOTE: This table is a tool for building power flow base cases, which assure adequate margin and voltage control for normal and emergency operating conditions. It is limit specified in this table. For equipment damage voltage limits see Table 7 in the Line/Equipment Ratings section of this document. *Tolerances are based on historical summer peak voltage data. TABLE E
KEY VAR INTERCHANGE POINTS
TIE LINE/LOAD TIE LINE/LOAD __________________________ ___________________________ Agua Fria 230 -APS AF 69kV Hayden -Apache 115kV Agua Fria -El Sol 230kV Kyrene -Kyrene New 230kV Agua Fria -Glendale 230kV PAPAGPAPS Alexander 230 -AlexanderAPS 69kV PINAL Alexander -Deer Valley 230kV Pinpksrp -Pnpkasp#1&2 230kV Asarcotp -Bonneybrook 115kV Pinpksrp -Deer Valley 230kV CHANDLER Rogers -Pinnacle Peak #1&2 230kV Coronado -Cholla 500kV Rogers -Spookhill 230kV Coronado -Springerville 345kV ROGERS -CITY MESA 69kV Coronado 500 -Plains 69kV Rudd -Orme 230kV GILBERT Rudd -White Tanks 230kV KEARNY SUPERIOR Knox 230/69kV For the flow into Orme from Liberty, take into account the var output of Mohave units 1 and 2 (10%). Orme -Liberty 230kV
25
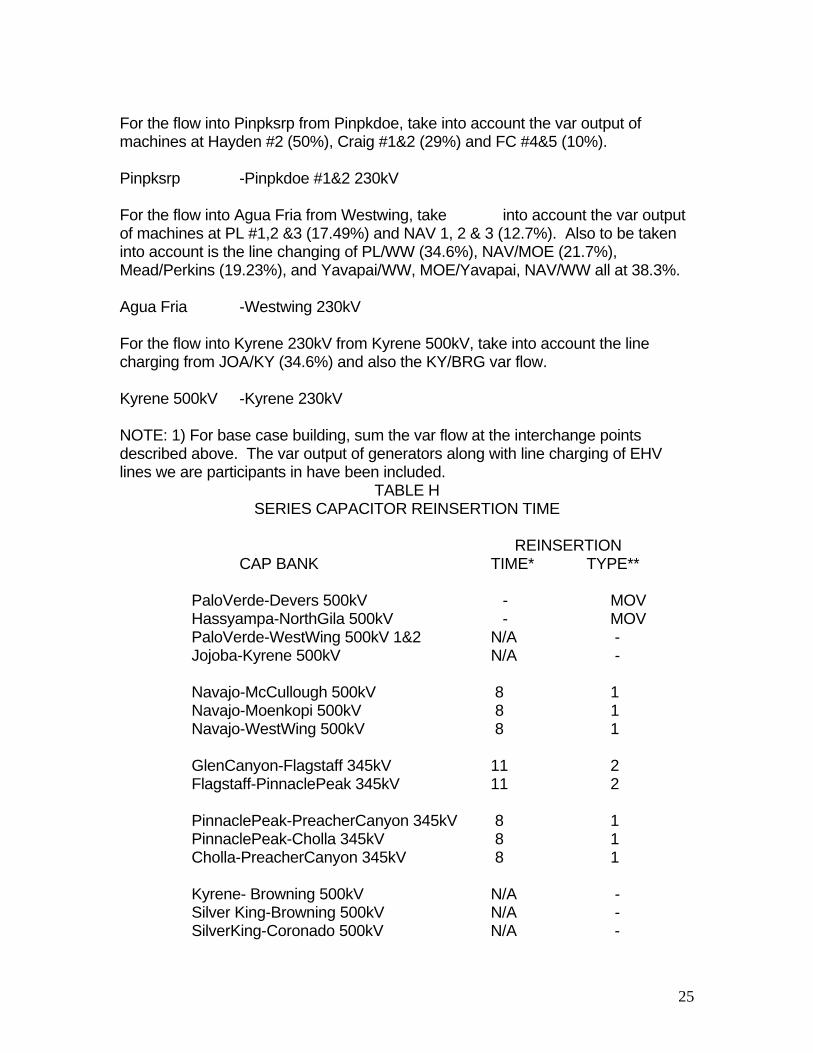
For the flow into Pinpksrp from Pinpkdoe, take into account the var output of machines at Hayden #2 (50%), Craig #1&2 (29%) and FC #4&5 (10%). Pinpksrp -Pinpkdoe #1&2 230kV For the flow into Agua Fria from Westwing, take into account the var output of machines at PL #1,2 &3 (17.49%) and NAV 1, 2 & 3 (12.7%). Also to be taken into account is the line changing of PL/WW (34.6%), NAV/MOE (21.7%), Mead/Perkins (19.23%), and Yavapai/WW, MOE/Yavapai, NAV/WW all at 38.3%. Agua Fria -Westwing 230kV For the flow into Kyrene 230kV from Kyrene 500kV, take into account the line charging from JOA/KY (34.6%) and also the KY/BRG var flow. Kyrene 500kV -Kyrene 230kV NOTE: 1) For base case building, sum the var flow at the interchange points described above. The var output of generators along with line charging of EHV lines we are participants in have been included.
TABLE H SERIES CAPACITOR REINSERTION TIME
REINSERTION CAP BANK TIME* TYPE** PaloVerde-Devers 500kV - MOV Hassyampa-NorthGila 500kV - MOV PaloVerde-WestWing 500kV 1&2 N/A - Jojoba-Kyrene 500kV N/A - Navajo-McCullough 500kV 8 1 Navajo-Moenkopi 500kV 8 1 Navajo-WestWing 500kV 8 1 GlenCanyon-Flagstaff 345kV 11 2 Flagstaff-PinnaclePeak 345kV 11 2 PinnaclePeak-PreacherCanyon 345kV 8 1 PinnaclePeak-Cholla 345kV 8 1 Cholla-PreacherCanyon 345kV 8 1 Kyrene- Browning 500kV N/A - Silver King-Browning 500kV N/A - SilverKing-Coronado 500kV N/A -
26
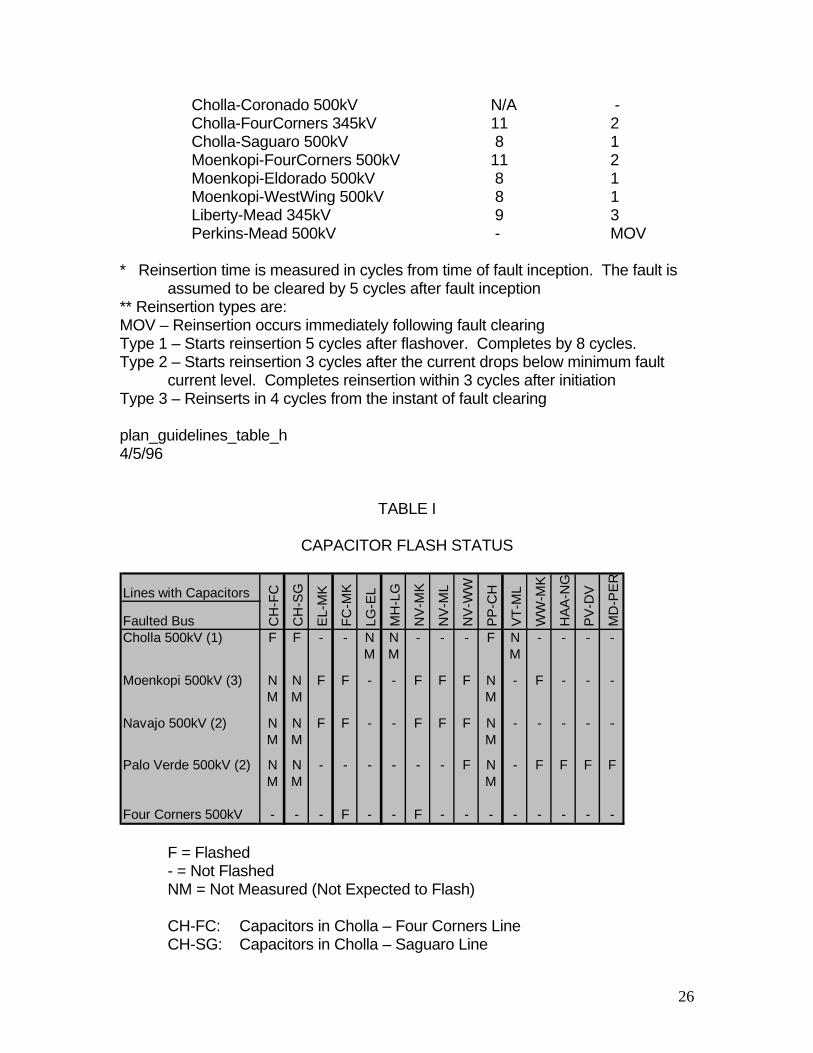
Cholla-Coronado 500kV N/A - Cholla-FourCorners 345kV 11 2 Cholla-Saguaro 500kV 8 1 Moenkopi-FourCorners 500kV 11 2 Moenkopi-Eldorado 500kV 8 1 Moenkopi-WestWing 500kV 8 1 Liberty-Mead 345kV 9 3 Perkins-Mead 500kV - MOV * Reinsertion time is measured in cycles from time of fault inception. The fault is assumed to be cleared by 5 cycles after fault inception ** Reinsertion types are: MOV – Reinsertion occurs immediately following fault clearing Type 1 – Starts reinsertion 5 cycles after flashover. Completes by 8 cycles. Type 2 – Starts reinsertion 3 cycles after the current drops below minimum fault current level. Completes reinsertion within 3 cycles after initiation Type 3 – Reinserts in 4 cycles from the instant of fault clearing plan_guidelines_table_h 4/5/96
TABLE I
CAPACITOR FLASH STATUS
F = Flashed - = Not Flashed NM = Not Measured (Not Expected to Flash) CH-FC: Capacitors in Cholla – Four Corners Line CH-SG: Capacitors in Cholla – Saguaro Line
Lines with Capacitors
Faulted BusCholla 500kV (1) F F - - N N - - - F N - - - -
M M M
Moenkopi 500kV (3) N N F F - - F F F N - F - - -M M M
Navajo 500kV (2) N N F F - - F F F N - - - - -M M M
Palo Verde 500kV (2) N N - - - - - - F N - F F F FM M M
Four Corners 500kV - - - F - - F - - - - - - - -
CH
-FC
CH
-SG
EL-
MK
FC-M
K
LG-E
L
MH
-LG
NV
-MK
NV
-ML
HA
A-N
G
PV
-DV
MD
-PE
R
NV
-WW
PP
-CH
VT-
ML
WW
-MK

27
EL-MK: Capacitors in Eldorado – Moenkopi Line FC-MK: Capacitors in Four Corners – Moenkopi Line LG-EL: Capacitors in Lugo – Eldorado Line MH-LG: Capacitors in McCullough – Lugo Line NV-MK: Capacitors in Navajo – Moenkopi Line NV-ML: Capacitors in Navajo – McCullough NV-WW: Capacitors in Navajo – Westwing Line PP-CH: Capacitors in Pinnacle Peak – Cholla Line VT-ML: Capacitors in Victorville – McCullough Line WW-MK: Capacitors in Westwing – Moenkopi Line HAA-NG: Capacitors in Hassayampa – North Gila Line PV-DV: Capacitors in Palo Verde – Devers Line MD-PER: Capacitors in Mead – Perkins Line
(1) Data received from APS (guidelines_97) (2) 1998 California Operating Studies Subcommittee (OSS) Handbook (3) 1993 EOR/Southern California Import Transmission Operating Study

29
Table K1 VALLEY SUBSTATIONS 69 - 12.47Y (KV)
NOTES: PAGE 1 OF 4
MOBILE UNIT 2 IS 15.0 MVA 69_/12.47Y KV OR 10 MVA 69_/4.16Y KV MOBILE UNIT 4 IS 20.0 MVA 69_/12.47Y KV MOBILE UNIT 5 IS 20.0 MVA 69_/12.47Y KV OR 13.3 MVA 69_/4.16Y KV MOBILE UNIT 9 IS 28.0 MVA 69_/12.47Y KV OR 28.0 MVA 69_/4.16Y KV
* customer owned
STATION CUSTOMER BAY LOADBACKUP 1 BACKUP 2
BIG SPINNER HONEYWELL 2 14.2MW/16.4MVA 22.4 SELF BACKUP MOBILE UNIT3 NEW BAY - 56.0 4, 5 or 9
(shared)CHOPPER BOEING 2 5.9 MW/5.7 MVA 14.0 FALCON MOBILE UNIT
BAY 1, 4 OR 5DELTA MOTOROLA 2 2.8MW/3.1MVA 14.0 MOBILE MOBILE UNIT
UNIT 2 4 OR 5DISPLAY AZ BOARD OF 4 2.4MW/2.7MVA 14.0 MOBILE MOBILE UNIT
REGENTS UNIT 2 4 OR 5FALCON BOEING 1 7.0MW/7.9MVA 14.0 MOBILE MOBILE UNIT
3 RESI BAY 28.0 UNIT 2 4, 5 or 9FOUNDRY M E * 1 14.0 MOBILE MOBILE UNIT
GLOBAL * 2 16.8MW/17.5MVA 6.3 UNIT 4 5 or 9* 3 20.0
GERMANN TRW 1 10.8 MW/12.4 MVA 22.4 MOBILE MOBILE UNIT2 RESI BAY 22.4 UNIT 2 2, 4, 5 or 9
GREENFIELD CITY OF 2 22.4MESA
MEMORY MICROCHIP 1 3.0MW/3.4MVA 14 MOBILE 2 MOBILE 4,5,9MICCHIP MICROCHIP 1 10.2MW/12MVA 28 SELF BACKUP MOBILE 2,4,5
2 0 28
MVA (TOP RATING)
OPERATIONS

30
Table K1 VALLEY SUBSTATIONS 69 - 12.47Y (KV)
NOTES: PAGE 2 OF 4 MOBILE UNIT 2 IS 15.0 MVA 69_/12.47Y KV OR 10 MVA 69_/4.16Y KV MOBILE UNIT 4 IS 20.0 MVA 69_/12.47Y KV MOBILE UNIT 5 IS 20.0 MVA 69_/12.47Y KV OR 13.3 MVA 69_/4.16Y KV MOBILE UNIT 9 IS 28.0 MVA 69_/12.47Y KV OR 28.0 MVA 69_/4.16Y KV * CUSTOMER OWNED
OPPORTUNITY GRAHAM * 1 22.4 SELF BACKUPPEPSICO * 2 22.4
PICO ON 1 8.4 MW/ 8.6 MVA 56.0 SELF BACKUP MOBILE UNITSEMI 2 4.7 MW/ 5.4 MVA 56.0 4, 5 or 9
CONDUCTORIncludes 4.16KV also see
4.16 KV
STELLAR INTEL 2 8.8MW/9.9MVA 56.0 MOBILE MOBILE UNIT3 5.4MW/6.2MVA 22.4 UNIT 2 2, 4, 5 or 94 9.9 MW/11.0 MVA 22.4
SYNERGY INTEL 1 20.7MW/23.4MVA 56.0 SELF BACKUP MOBILE UNIT2 56.0 4, 5 or 93 19.9MW/23.7MVA 56.04 14.8MW/17.2MVA 56.05 16.6MW/19.5MVA 56.06 56.0
UNIFIED * 3 38.0* 4 38.0
WEILER MEDTRONIC 1 6.0MW/6.6MVA 14.0WAFER FREESCALE 1 7.6 MW/8.6 MVA 22.4 SELF BACKUP MOBILE UNIT
2 7.3 MW/8.2 MVA 22.4 2, 4 or 5WESTERN WESTERN * 1 7.0 MW/8.0MVA 14.0 MOBILE MOBILE UNIT
CONTAINER CONTAINER UNIT 2 4 or 5

31
Table K1 VALLEY SUBSTATIONS 69 - 12.47Y (KV)
NOTES: PAGE 3 OF 4 MOBILE UNIT 2 IS 15.0 MVA 69_/12.47Y KV OR 10 MVA 69_/4.16Y KV MOBILE UNIT 4 IS 20.0 MVA 69_/12.47Y KV MOBILE UNIT 5 IS 20.0 MVA 69_/12.47Y KV OR 13.3 MVA 69_/4.16Y KV MOBILE UNIT 8 IS 3-7.5 MVA single phase 12.4/4.16 KV
MOBILE UNIT 9 IS 28.0 MVA 69_/12.47Y KV OR 28.0 MVA 69_/4.16Y KV
Table K1
STATION CUSTOMER BAY LOADBACKUP 1 BACKUP 2
CHAMBERS GENERAL 1 6.7MW/7.9MVA 7.0 MOBILE MOBILE UNITDYNAMICS 2 7.0 UNIT 2 5 or 9
CORTEZ CITY OF * 1 2.3MW/2.7MVA 14.0 MOBILE MOBILE UNITPHOENIX * 2 2.7MW/3.2MVA 12.5 UNIT 2 5 or 9
FLUME CITY OF 2 1.8MW/2.1MVA 7.0 MOBILE MOBILE UNITTEMPE UNIT 2 5 or 9
LINOX AIR 1 5.1 MW/5.7 MVA 28.0 SELF BACKUP MOBILE UNITPRODUCTS 2 11.0MW/12.9MVA 22.4 5 or 9
NOBLE GENERAL 1 1.9MW/2.2MVA 14.0 MOBILE MOBILE UNITDYNAMICS 2 2.8MW/3.3MVA 14.0 UNIT 2 5 or 9
TRES CITY OF 2 7.3MW/8.6MVA 14.0 MOBILE MOBILE UNITRIOS PHOENIX 3 4.8MW/5.6MVA 14.0 UNIT 2 5 or 9VAL CITY OF * 2 2.1MW/2.5MVA 14.0 MOBILE MOBILE UNIT
VISTA PHOENIX * 3 2.4MW/2.8MVA 14.0 UNIT 2 5 or 912-4.16 (kV)
PICO ON SEMI NORTH ? MVA 12.5 SELF BACKUP MOBILE UNIT
NORTH CONDUCTOR (customer owned)
served from Pico 12.4kV 14.0 8
MVA (TOP RATING)
OPERATIONS

32
VALLEY SUBSTATIONS 69 - 12.47Y (KV)
PAGE 4 OF 4 NOTES: MOBILE UNIT 2 IS 15.0 MVA 69_/12.47Y KV OR 10.0 MVA 69_/4.16Y KV MOBILE UNIT 4 IS 20.0 MVA 69_/12.47Y KV MOBILE UNIT 5 IS 20.0 MVA 69_/12.47Y KV OR 13.3 MVA 69_/4.16Y KV MOBILE UNIT 8 IS Three single phase Distribution Transformers. 12,470/2400V, 7.5MVA each – 22.5MVA bank capacity
MOBILE UNIT 9 IS 28.0 MVA 69_/12.47Y KV OR 28.0 MVA 69_/4.16Y KV
STATION CUSTOMER BAY LOADBACKUP 1 BACKUP 2
SPEEDWAY CITY OF 1 0.9 2.5 MOBILE MOBILE UNIT 4 or
PHOENIX UNIT 2 AND 8combined with with
mobile unit 8
MVA (TOP RATING)
OPERATIONS

33
Table K2 110 - 4.16Y EASTERN MINING AREA
PAGE 1 of 6 1 REMAINING CAPACITY AFTER SINGLE OUTAGE 2 POSSIBLE LOAD CURTAILMENT (P) PARALLEL – COULD HAVE IMPEDANCE DIFFERENCE PROBLEM WITH MOBILE NOTE: ASARCO BAY 3 IS DEDICATED TO THE OXYGEN PLANT/MUST RUN AT ALL TIMES PER CUSTOMER AVAILABLE TRANSFORMERS: Mobile 3: 20MVA 115kV_/44kV, 22kVY, 13.8kV_ 12.47kVY 6.9kV_ ,416OY Mobile 6: 20MVA 115kV_/22Y, 12.47Y with LTC Three Single Phase 115-12.7kV 1MVA Units at Silverking
* CUSTOMER OWNED
STATION CUSTOMER BAY LOADBACKUP 1 BACKUP 2
ASARCO ASARCO * 1 10.0MW/11.3MVA 22.4 MOBILE UNIT 6(P) * 2 12.2MW/13.9MVA 22.4 MOBILE WITH DISTRIBUTION
* 3 7.5MW/7.6 MVA 14.0 UNIT 3 TRANSFORMERS 44.8/36.42
MORRIS ASARCO * 1 7.1MW/8.2MVA 14.0 MOBILE MOBILE UNIT 6(P) * 2 7.3MW/8.6MVA 14.0 UNIT 3 WITH DISTRIBUTION
14,1 TRANSFORMERSOAK FLAT BHP * 1 0.5MW/0.6MVA 14.0 SELF BACKUP MOBILE UNIT
* 2 0.7MW/0.8MVA 14.0 3 14,1
CAPACITY (MVA)
OPERATIONS

34
Table K2 110 - 6.9Y EASTERN MINING AREA
NOTE: Hayden Bay 0 is 110 - 6.9Y kV PAGE 2 OF 6
1 REMAINING CAPACITY AFTER SINGLE OUTAGE 2 PROBLEM AREA 3 POSSIBLE LOAD CURTAILMENT 4 CUSTOMER OWNED (P) PARALLEL – FEEDER TIE ON THE LOW VOLTAGE SIDE AVAILABLE TRANSFORMERS: Mobile 3: 20MVA 115kV_/44kV_, 22kVY, 13.8kV_ 12.47kVY 6.9kV_, 4160Y Mobile 6: 20MVA 115kV_/22Y, 12.47Y with LTC • Three Single Phase 115-12.47kV 1MVA Units at Silverking
Table K2
STATION CUSTOMER BAY LOADBACKUP 1 BACKUP 2
ELLISON PHELPS * 1 15.5 MW/17.2 MVA SMALL HAYDEN DODGE 22.400,2 MOBILE UNIT WILL NOT BE
44.8/36.41 UNIT 3 AVAILABLE3
(need shoo-fly)HAYDEN ASARCO 0 0.0 (backs up bay1) 22.400
(P) * 1 12.1 MW/12.4 MVA 22.400 SELF BACKUP MOBILE UNIT 3?* 3 5.9 MW/6.1 MVA 9.375 (Site may be* 5 5.9 MW/6.1 MVA 9.375 inaccessible)
54.5/41.21
MOONSHINE PHELPS * 1 8.3MW9.7MVA 22.400 SELF BACKUP MOBILE UNIT(P) DODGE * 2 8.1MW/9.5MVA 22.400 (curtail call) 3
22.400,1 (2.6 MVA FIRM)
CAPACITY (MVA)
OPERATIONS
STATION CUSTOMER BAY LOADBACKUP 1 BACKUP 2
SUPERIOR -- 2 4.4MW/4.5MVA 7.0 MOBILE MOBILE 0.0,1 UNIT 6 UNIT 3
CAPACITY (MVA)
OPERATIONS
35
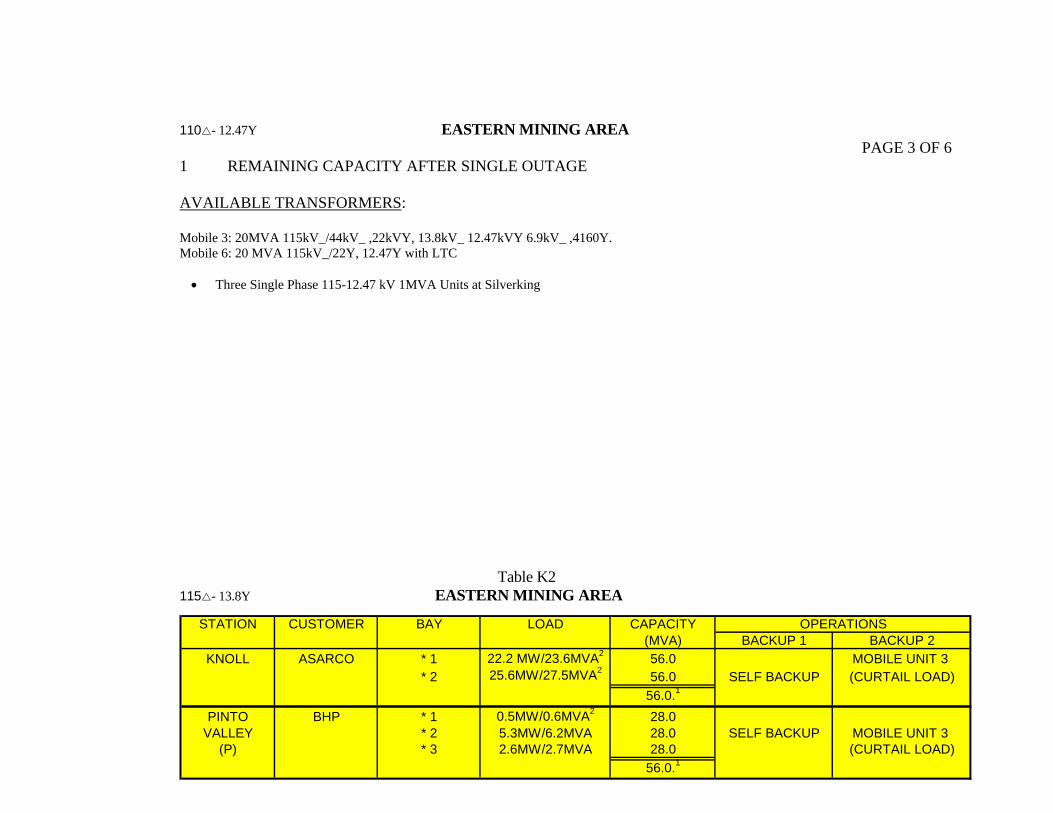
110 - 12.47Y EASTERN MINING AREA PAGE 3 OF 6
1 REMAINING CAPACITY AFTER SINGLE OUTAGE AVAILABLE TRANSFORMERS: Mobile 3: 20MVA 115kV_/44kV_ ,22kVY, 13.8kV_ 12.47kVY 6.9kV_ ,4160Y. Mobile 6: 20 MVA 115kV_/22Y, 12.47Y with LTC
• Three Single Phase 115-12.47 kV 1MVA Units at Silverking
Table K2 115 - 13.8Y EASTERN MINING AREA
STATION CUSTOMER BAY LOADBACKUP 1 BACKUP 2
KNOLL ASARCO * 1 22.2 MW/23.6MVA2 56.0 MOBILE UNIT 3 * 2 25.6MW/27.5MVA2 56.0 SELF BACKUP (CURTAIL LOAD)
56.0.1 PINTO BHP * 1 0.5MW/0.6MVA2 28.0
VALLEY * 2 5.3MW/6.2MVA 28.0 SELF BACKUP MOBILE UNIT 3 (P) * 3 2.6MW/2.7MVA 28.0 (CURTAIL LOAD)
56.0.1
CAPACITY (MVA)
OPERATIONS

36
PAGE 4 OF 6 1 REMAINING CAPACITY AFTER SINGLE OUTAGE 2 PEAK LOADS ON BAYS TEND TO SWAP ABOUT EVERY 2 WEEKS 3 SINCE LAST FEBRUARY ’89, LOADING HAS BEEN AT 2.0 MW PER UNIT (P) PARALLEL = FEEDER TIE ON THER LOW VOLTAGE SIDE AVAILABLE TRANSFORMERS:
Mobile 3: 20MVA 115kV_/44kV_ ,22kVY, 13.8kV_ 12.47kVY 6.9kV_ ,4160Y. Mobile 6: 20 MVA 115kV_/22Y, 12.47Y with LTC
Three Single Phase 115-12.47kV 1MVA Units at Silverking
Table K2 115 - 22Y EASTERN MINING AREA

37
PAGE 5 OF 6 1 REMAINING CAPACITY AFTER SINGLE OUTAGE 2 PROBLEM AREA * CUSTOMER OWNED AVAILABLE TRANSFORMERS:
Mobile 3: 20MVA 115kV_/44kV_ ,22kVY, 13.8kV_ 12.47kVY 6.9kV_ ,4160Y. Mobile 6: 20 MVA 115kV_/22Y, 12.47Y with LTC
• Three Single Phase 115-12.47 kV 1MVA Units at Silverking
Table K2
STATION CUSTOMER BAY LOADBACKUP 1 BACKUP 2
FRAZIER -- 2 2.9MW/3.0MVA 10.5,2 MOBILE MOBILE 0.0,1 UNIT 6 UNIT 3
KEARNY -- 3 6.6MW 10.5,2 MOBILE MOBILE 0.0,1 UNIT 6 UNIT 3
MIAMI BHP 2 3.1MW/3.2MVA 22.4,2 MOBILE MOBILE 0.0,1 UNIT 6 UNIT 3
PINAL -- 2 2.5 MW/2.6MVA 22.400 MOBILE MOBILE(P) 3 0.0MW/0.0MVA 9..375 UNIT 6 UNIT 3
4 0.0MW/0.0MVA 9.37531.0/19.01
110 - 22YELLISON PHELPS * 2 30.2MW/31.7MVA 56.0,2 MOBILE UNIT NONE
DODGE 0.0,1 3 AND 6
CAPACITY (MVA)
OPERATIONS
BACKUP 1 BACKUP 2RAY ASARCO * 1 11.2MW/11.8MVA 14.00 SELF BACKUP MOBILE(P) (curtail load) UNIT 3
115 - 44.0YRAY ASARCO * 3 0 6.25 SELF BACKUP MOBILE(P) * 4 5.9MW/6.2MVA 6.25 (curtail load) UNIT 3
(MVA)
38
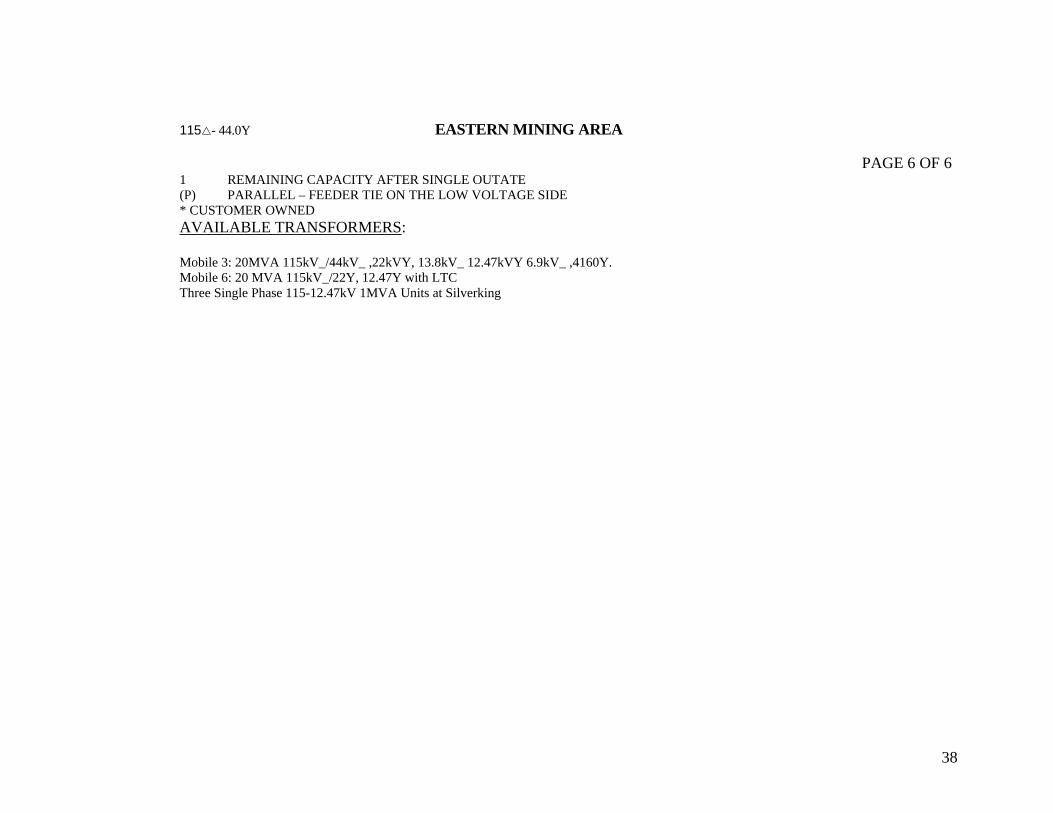
115 - 44.0Y EASTERN MINING AREA
PAGE 6 OF 6 1 REMAINING CAPACITY AFTER SINGLE OUTATE (P) PARALLEL – FEEDER TIE ON THE LOW VOLTAGE SIDE * CUSTOMER OWNED AVAILABLE TRANSFORMERS:
Mobile 3: 20MVA 115kV_/44kV_ ,22kVY, 13.8kV_ 12.47kVY 6.9kV_ ,4160Y. Mobile 6: 20 MVA 115kV_/22Y, 12.47Y with LTC
Three Single Phase 115-12.47kV 1MVA Units at Silverking

39
Table J
WECC DISTURBANCE – PERFORMANCE TABLE OF ALLOWABLE EFFECTS ON OTHER SYSTEMS
Notes: 1. The WECC Disturbance-Performance applies equally to either a system with all
elements in service, or a system with one element removed and the system adjusted.
2. As an example in applying the WECC Disturbance-Performance Table, a
Category B disturbance in one system shall not cause a transient voltage dip in another system that is greater than 20% for more than 20 cycles at load buses, or exceed 25% at load buses or 30% at non-load buses at any time other than during the fault
3. Additional voltage requirements associated with voltage stability are specified in
Standard I-D. If it can be demonstrated that post transient voltage deviations that are less than the values in the table will result in voltage instability, the system in which the disturbance originated and affected system(s) should cooperate in mutually resolving the problem.
NERC/WECC Planning Standards
NERC and WECC
CATEGORIES
Outage Frequency Associated with the Performance Category (outage/year)
Transient Voltage Dip Standard
Minimum Transient Frequency Standard
Post Transient Voltage Deviation Standard (See Note 2)
A Not Applicable
B > 0.33
Not to exceed 25% at load buses or 30% at non-load buses. Not to exceed 20% for more than 20 cycles at load buses.
Not below 59.6 Hz for 6 cycles or more at a load bus.
Not to exceed 5% at any bus.
C 0.033 - 0.33
Not to exceed 30% at any bus. Not to exceed 20% for more than 40 cycles at load buses.
Not below 59.0 Hz for 6 cycles or more at a load bus.
Not to exceed 10% at any bus.
D <0.033
Nothing in addition to NERC
Nothing in addition to NERC

40
4. Refer to Figure W-1 for voltage performance parameters 5. Load buses include generating unit auxiliary loads. 6. To reach the frequency categories shown in the WECC Disturbance-
Performance Table for Category C disturbances, it is presumed that some planned and controlled islanding has occurred. Underfrequency load shedding is expected to arrest this frequency decliner and assure continued operation within the resulting islands.
7. For simulation test cases, the interconnected transmission steady state loading
conditions prior to a disturbance should be appropriate to the case. Disturbances should be simulated at locations on the system that result in maximum stress on other systems. Relay action, fault clearing time, and reclosing practice should be represented in simulations according to the planning and operation of the actual or planned systems. When simulation post transient conditions, actions are limited to automatic devices and no manual action is to be assumend.
NERC/WECC Planning Standards

41
Table M. - - Transmission Systems Standards — Normal and Contingency Conditions
Contingencies
System Limits or Impacts
Category
Initiating Event(s) and Contingency Element(s)
Elements
Out of Service
Thermal Limits
Voltage Limits
System Stable
Loss of Demand or Curtailed Firm Transfers
Cascading
c
Outages A - No Contingencies
All Facilities in Service
None
Applicable
Rating a (A/R)
Applicable
Rating a (A/R)
Yes
No
No
Single Line Ground (SLG) or 3-Phase (3Ø) Fault, with Normal Clearing:
1. Generator 2. Transmission Circuit 3. Transformer
Loss of an Element without a Fault.
Single Single Single Single
A/R A/R A/R A/R
A/R A/R A/R A/R
Yes Yes Yes Yes
No b No b No b No b
No No No No
B - Event resulting in the loss of a single element.
Single Pole Block, Normal Clearing
f:
4. Single Pole (dc) Line
Single
A/R
A/R
Yes
Nob
No
SLG Fault, with Normal Clearing
f:
1. Bus Section 2. Breaker (failure or internal fault)
Multiple Multiple
A/R A/R
A/R A/R
Yes Yes
Planned/Controlledd Planned/Controlledd
No No
SLG or 3Ø Fault, with Normal Clearing
f, Manual System Adjustments,
followed by another SLG or 3Ø Fault, with Normal Clearingf:
3. Category B (B1, B2, B3, or B4) contingency, manual system adjustments, followed by another Category B (B1, B2, B3, or B4) contingency
Multiple
A/R
A/R
Yes
Planned/Controlledd
No
Bipolar Block, with Normal Clearing
f:
4. Bipolar (dc) Line Fault (non 3Ø), with Normal Clearing
f:
5. Any two circuits of a multiple circuit towerlineg
Multiple Multiple
A/R A/R
A/R A/R
Yes Yes
Planned/Controlledd Planned/Controlledd
No No
C - Event(s) resulting in the loss of two or more (multiple) elements.
SLG Fault, with Delayed Clearing
f (stuck breaker or protection system
failure): 6. Generator 8. Transformer 7. Transmission Circuit 9. Bus Section
Multiple Multiple
A/R A/R
A/R A/R
Yes Yes
Planned/Controlledd Planned/Controlledd
No No

42
D e - Extreme event resulting in two or more (multiple) elements removed or cascading out of service
3Ø Fault, with Delayed Clearing
f (stuck breaker or protection system
failure): 1. Generator 3. Transformer 2. Transmission Circuit 4. Bus Section
3Ø Fault, with Normal Clearing
f:
5. Breaker (failure or internal fault) Other:
6. Loss of towerline with three or more circuits 7. All transmission lines on a common right-of way 8. Loss of a substation (one voltage level plus transformers) 9. Loss of a switching station (one voltage level plus transformers)
10. Loss of all generating units at a station 11. Loss of a large load or major load center 12. Failure of a fully redundant special protection system (or remedial
action scheme) to operate when required 13. Operation, partial operation, or misoperation of a fully redundant
special protection system (or remedial action scheme) in response to an event or abnormal system condition for which it was not intended to operate
14. Impact of severe power swings or oscillations from disturbances in another Regional Council.
Evaluate for risks and consequences. May involve substantial loss of customer demand and generation in a
widespread area or areas. Portions or all of the interconnected systems may or may not achieve a new,
stable operating point. Evaluation of these events may require joint studies with neighboring systems.
a) Applicable rating (A/R) refers to the applicable normal and emergency facility thermal rating or system voltage limit as determined and consistently applied by the system or facility owner. Applicable ratings may include emergency ratings applicable for short durations as required to permit operating steps necessary to maintain system control. All ratings must be established consistent with applicable NERC Planning Standards addressing facility ratings.
b) Planned or controlled interruption of electric supply to radial customers or some local network customers, connected to or supplied by the faulted element or by the affected area, may occur in certain areas without impacting the overall security of the interconnected transmission systems. To prepare for the next contingency, system adjustments are permitted, including curtailments of contracted firm (non-recallable reserved) electric power transfers.
c) Cascading is the uncontrolled successive loss of system elements triggered by an incident at any location. Cascading results in widespread service interruption which cannot be restrained from sequentially spreading beyond an area predetermined by appropriate studies.
d) Depending on system design and expected system impacts, the controlled interruption of electric supply to customers (load shedding), the planned removal from service of certain generators, and/or the curtailment of contracted firm (non-recallable reserved) electric power transfers may be necessary to maintain the overall security of the interconnected transmission systems.
e) A number of extreme contingencies that are listed under Category D and judged to be critical by the transmission planning entity(ies) will be selected for evaluation. It is not expected that all possible facility outages under each listed contingency of Category D will be evaluated.
f) Normal clearing is when the protection system operates as designed and the fault is cleared in the time normally expected with proper functioning of the installed protection systems. Delayed clearing of a fault is due to failure of any protection system component such as a relay, circuit breaker, or current transformer (CT), and
not because of an intentional design delay. g) System assessments may exclude these events where multiple circuit towers are used over short distances (e.g., station entrance, river crossings) in accordance with
Regional exemption criteria.

43
STANDARD PRACTICES DOCUMENT (ESP&P and TSP portion of planning guidelines document)
guidelines_std_practices 1/8/97 (Rev. 12/12/07)

44
STANDARD PRACTICES DOCUMENT 1.0 SUBSTATION CONFIGURATION......................................................................……………. 47 1.1 500kV Stations......................................................................................... 47 1.2 230kV Receiving Stations ....................................................................... 47 1.3 115kV Receiving Stations ....................................................................... 49 1.4 69kV Facilities at a 230/69kV Receiving Station..................................... 49 1.5 69kV & 115kV Facilities at Distribution Stations ...................................… 50 1.6 12kV facilities at a 69/12kV Distribution Station....................................... 53 2.0 TRANSFORMERS ..........................................................................................……………………. 54 2.1 500/230kV Transformers ........................................................................ 54 2.2 230/115kV Transformers ........................................................................ 54 2.3 230/69kV Transformers .......................................................................... 54 2.4 69/12kV Transformers ............................................................................ 55 3.0 CIRCUIT BREAKERS, CIRCUIT SWITCHES & TRANSFORMER PROTECTORS.............................................................................................. 55 3.1 500kV Circuit Breakers ........................................................................... 55 3.2 230kV Circuit Breakers ........................................................................... 55 3.3 115kV Circuit Breakers ........................................................................... 55 3.4 69kV Circuit Breakers at Receiving Stations........................................... 56 3.5 69kV Circuit Breakers at Distribution Stations ........................................ 56 3.6. 69kV Transformer Protectors.................................................................. 56 3.7 12kV Circuit Breakers ............................................................................. 56 3.8 12kV Circuit Switches ............................................................................. 56 4.0 COMPENSATION, SHUNT & SERIES..................................................... 56 5.0 TRANSMISSION LINES & 12kV FEEDERS....................................................…………………………………… 58 5.1 500kV Transmission Lines...................................................................... 58 5.2 230kV Transmission Lines...................................................................... 58 5.3 115kV Transmission Lines...................................................................... 58 5.4 69kV Transmission Lines........................................................................ 59 5.5 12kV Feeders ......................................................................................... 59 6.0 DEFINITIONS........................................................................................... 59 7.0 INDEX ...................................................................................................... 60 8.0 FIGURES & TABLES .............................................................................. 64
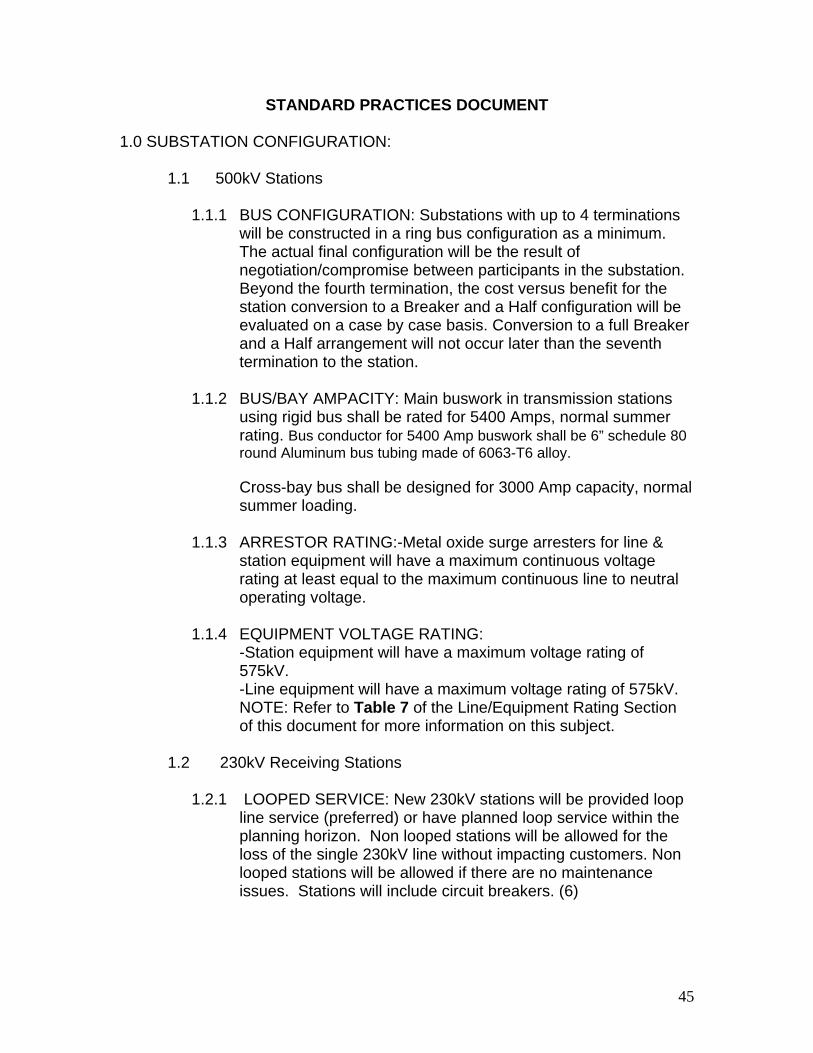
45
STANDARD PRACTICES DOCUMENT
1.0 SUBSTATION CONFIGURATION: 1.1 500kV Stations
1.1.1 BUS CONFIGURATION: Substations with up to 4 terminations will be constructed in a ring bus configuration as a minimum. The actual final configuration will be the result of negotiation/compromise between participants in the substation. Beyond the fourth termination, the cost versus benefit for the station conversion to a Breaker and a Half configuration will be evaluated on a case by case basis. Conversion to a full Breaker and a Half arrangement will not occur later than the seventh termination to the station.
1.1.2 BUS/BAY AMPACITY: Main buswork in transmission stations
using rigid bus shall be rated for 5400 Amps, normal summer rating. Bus conductor for 5400 Amp buswork shall be 6” schedule 80 round Aluminum bus tubing made of 6063-T6 alloy.
Cross-bay bus shall be designed for 3000 Amp capacity, normal summer loading.
1.1.3 ARRESTOR RATING:-Metal oxide surge arresters for line & station equipment will have a maximum continuous voltage rating at least equal to the maximum continuous line to neutral operating voltage.
1.1.4 EQUIPMENT VOLTAGE RATING:
-Station equipment will have a maximum voltage rating of 575kV. -Line equipment will have a maximum voltage rating of 575kV. NOTE: Refer to Table 7 of the Line/Equipment Rating Section of this document for more information on this subject.
1.2 230kV Receiving Stations
1.2.1 LOOPED SERVICE: New 230kV stations will be provided loop line service (preferred) or have planned loop service within the planning horizon. Non looped stations will be allowed for the loss of the single 230kV line without impacting customers. Non looped stations will be allowed if there are no maintenance issues. Stations will include circuit breakers. (6)

46
STANDARD PRACTICES DOCUMENT
1.2.2 BUS CONFIGURATION: Initial development of 230kV
substations will, as a minimum, be a Ring Bus configuration through the sixth termination. Load growth potential and inter-utility or industrial customer interconnection requirements may justify a ring or breaker-and-a-half initial bus configuration. Beyond the sixth termination, the cost versus benefit for the station conversion from Ring Bus Configuration to a Breaker and a half configuration will be evaluated on a case by case basis.
1.2.3 MAX # TRANSFORMERS: A maximum of four 100/133/167-
187 MVA or four 150/200/250-280 MVA 45 C-55 C transformers will be installed for a substation capacity of 560 MVA or 840MVA to allow for an outage of one transformer without dropping load. The maximum number of transformers in a substation is limited by the short circuit duty at the substation and the need for islanding.
1.2.4 LINE TERMINATIONS: The 230kV bus configuration will allow for termination of a minimum of four 230kV lines unless generators or transmission system interconnections with others are involved.
1.2.5. TRANSFORMER ADDITION VS NEW STATION: Consideration
will be given to the relative merits of opening a new 230/69kV station versus adding a transformer to an existing 230/69kV station. Factors to be taken into consideration include initial cost, long term cost, availability of a site, short circuit duty, power quality, reliability, plateau load level etc.
1.2.6 BUS/BAY AMPACITY: Main buswork in transmission stations
using rigid bus shall be rated for 5400 Amps, normal summer rating. Bus conductor for 5400 Amp buswork shall be 6” schedule 80 round Aluminum bus tubing made of 6063-T6 alloy. Cross-bay bus shall be designed for 3000 Amp capacity, normal summer loading,.
1.2.7 ARRESTOR RATING: Metal oxide surge arresters will have a
maximum continuous voltage rating at least equal to the maximum continuous line to neutral voltage.
STANDARD PRACTICES DOCUMENT

47
1.2.8 SHORT CIRCUIT DUTY: Short circuit withstand for rigid bus in transmission stations shall be 50 kA minimum. Additional short circuit withstand may be required based on results of planning studies. Short circuit withstand shall be calculated using the procedure in SRP Design Procedure BM02.01 located in Substation Design Standards @ http://insidesrp/elsyseng/electricsys/substd.html
1.3 115kV Receiving Stations
1.3.1 BUS CONFIGURATION: The bus configuration will be a ring bus through the fourth termination. Beyond the fourth termination a cost/benefit analysis will be conducted to determine if the configuration should be converted to a breaker and a half scheme.
1.3.2 BUS/BAY AMPACITY: 115kV bus and cross-bays shall be
designed for 1200 or 2000 amperes continuous duty on a case-by-case basis.
1.3.3 ARRESTOR RATING: Metal oxide surge arresters for the station
will have a maximum continuous voltage rating at least equal to the maximum continuous line to neutral voltage.
1.3.4 SHORT CIRCUIT DUTY: Short circuit withstand for rigid bus in
transmission stations shall be 40 kA minimum. Additional short circuit withstand may be required based on results of planning studies. Short circuit withstand shall be calculated using the procedure in SRP Design Procedure BM05.01 located SRP Design Procedure BM02.01 located in Substation Design Standards @ http://insidesrp/elsyseng/electricsys/substd.html
1.4 69kV Facilities at a 230/69kV Receiving Station
1.4.1 LINE TERMINATIONS: A maximum of eight 69kV lines will be terminated unless interconnections with generators or with others are involved.
1.4.2 BUS CONFIGURATION: The fully developed 69kV bus
configuration will be a zig-zag bus scheme with double breakers for at least two of the four 280 MVA transformers. The remaining terminations will generally be through single breakers on opposite busess in a zig-zag bus arrangement. Elements will be double breakered to
STANDARD PRACTICES DOCUMENT
meet single contingency outage criteria with special consideration given for sensitive customers.

48
1.4.3 BUS/BAY AMPACITY: Main buswork in transmission stations
using rigid bus shall be rated for 5400 Amps, normal summer rating. Bus conductor for 5400 Amp buswork shall be 6” schedule 80 round Aluminum bus tubing made of 6063-T6 alloy. Cross-bay bus shall be designed for 3000 Amp capacity, normal summer loading.
1.4.4 SHORT CIRCUIT DUTY: Short circuit withstand for rigid bus in
transmission stations shall be 44 kA minimum. Additional short circuit withstand may be required based on results of planning studies. Short circuit withstand shall be calculated using the procedure in SRP Design Procedure BM05.01 located in Substation Design Standards @ http://insidesrp/elsyseng/electricsys/substd.html
1.5 69kV & 115kV Facilities at Distribution Stations
1.5.1 LINE TERMINATIONS, LOCATION: 69kV lines should be
terminated at 69/12kV facilities in the outermost developed bay positions. This is to eliminate removing more than one bay from service for maintenance or construction activity. How and whether this will be physically accomplished will be determined on a case by case basis. (17, 22)
1.5.2 LINE TERMINATIONS, MAX NUMBER: For reliability and single
contingency considerations more than 2 line terminations may be required at a substation When the number of line terminations exceeds two, each line will be terminated with a circuit breaker. A maximum of four 69kV lines will be terminated at a station. (Reference paragraph 1.7 on 3 terminal lines in the NEAR-TERM GUIDELINES)
1.5.3 MAX # TRANSFORMERS: A maximum of four 15/20/25-28
MVA 45 C-55 C 69/12kV transformers will typically be installed to serve a 4 square mile area of 60-75 mw. Most substations will likely require only 2 transformers to serve a four square mile area @ 15mw/sqmi.
STANDARD PRACTICES DOCUMENT
Initial construction should only include two 69kV bays in most cases unless 3-69kV lines are required for line loading considerations.

49
1.5.4 LOOPED SERVICE:
-Industrial substations (both 69kV & 115kV) will be provided looped service if the customer agrees to pay the approximate facilities charge. Facilities additions for 69kV & 115kV industrial substations are determined contractually and will be resolved on a case-by-case basis.
-New residential 69kV stations will initially be provided either radial/tapped 69kV service OR looped 69kV line service as determined after evaluation on a case-by-case basis in the "Load Growth" portion of the budget process. Looped service will be selected only after consideration has been given to the reliability of the 69kV line proposed for providing the service, how soon a 2nd bay or a 3rd 69kV line termination will be needed at the sub, the potential for frequent future construction outages for road widening etc., sensitivity or criticality of the customers served by the new sub, 12kV backup which will be available for the new sub and other issues as appropriate. Irrespective of the outcome ESP&P will document and distribute the results of their evaluation to the Budget Prioritization Process Team membership. If radial/tapped service is selected as the preferred option, the looped service alternative with associated incremental cost will also be automatically introduced in the "Distribution Operational Reliability" portion of the budget process. As a result of this, the question of radial/tapped vs looped service for the new residential sub will be entertained once again as part of the budget prioritization process. NOTE: Once the final decision has been made to provide looped rather than radial service to a new residential sub the new sub will be constructed with only 2 bays.
1.5.5 DROPS: All 69kV line drops will be single 954 ACSS (currently
1900amp) at the time of initial construction. (15)
STANDARD PRACTICES DOCUMENT
1.5.6 BUS/BAY AMPACITY: Initial distribution substation 69kV bus and bay design shall be 2000 amperes.
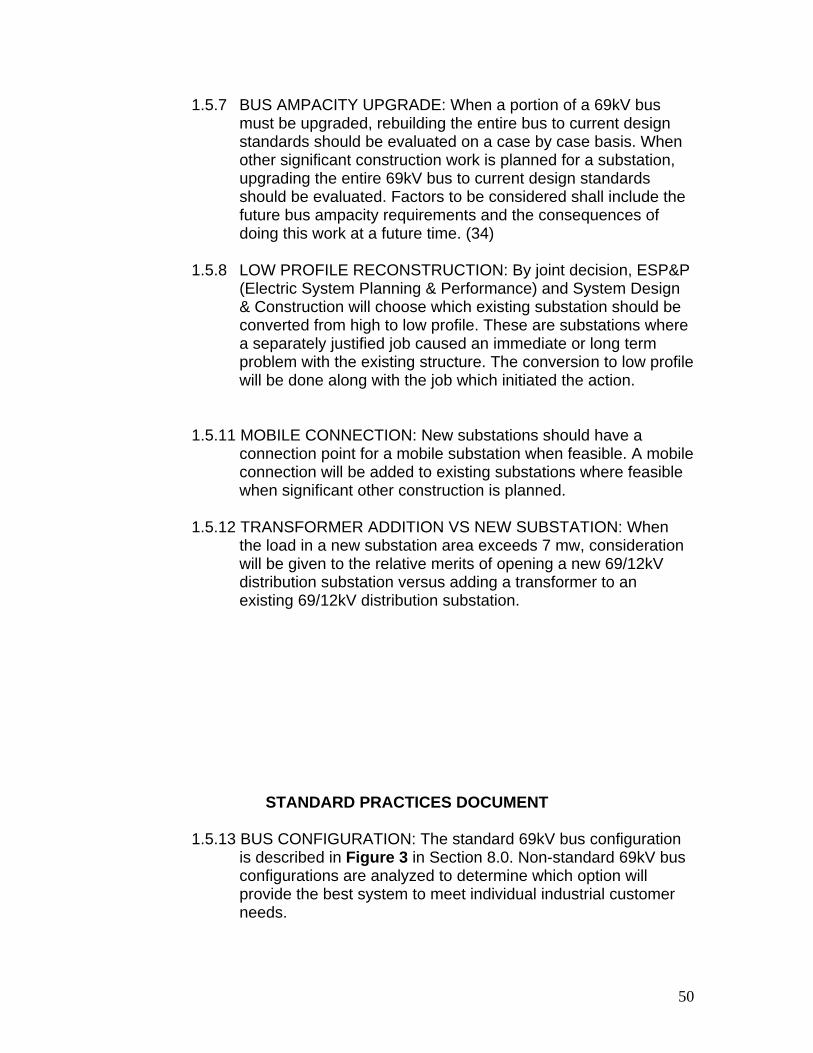
50
1.5.7 BUS AMPACITY UPGRADE: When a portion of a 69kV bus must be upgraded, rebuilding the entire bus to current design standards should be evaluated on a case by case basis. When other significant construction work is planned for a substation, upgrading the entire 69kV bus to current design standards should be evaluated. Factors to be considered shall include the future bus ampacity requirements and the consequences of doing this work at a future time. (34)
1.5.8 LOW PROFILE RECONSTRUCTION: By joint decision, ESP&P (Electric System Planning & Performance) and System Design & Construction will choose which existing substation should be converted from high to low profile. These are substations where a separately justified job caused an immediate or long term problem with the existing structure. The conversion to low profile will be done along with the job which initiated the action.
1.5.11 MOBILE CONNECTION: New substations should have a connection point for a mobile substation when feasible. A mobile connection will be added to existing substations where feasible when significant other construction is planned.
1.5.12 TRANSFORMER ADDITION VS NEW SUBSTATION: When
the load in a new substation area exceeds 7 mw, consideration will be given to the relative merits of opening a new 69/12kV distribution substation versus adding a transformer to an existing 69/12kV distribution substation.
STANDARD PRACTICES DOCUMENT
1.5.13 BUS CONFIGURATION: The standard 69kV bus configuration is described in Figure 3 in Section 8.0. Non-standard 69kV bus configurations are analyzed to determine which option will provide the best system to meet individual industrial customer needs.

51
1.5.14 SHORT CIRCUIT DUTY: The new standard for 69kV circuit breakers is 44kA.
1.5.15 LOAD BREAK SWITCHES: On a case-by-case basis Load
Break Switches at substations will be equipped with supervisory controlled MOD's. In making this decision consideration will be given to geographic location of the sub, sensitivity of the load served in the area and whether or not the switches isolate islands.
1.6 12kV facilities at a 69/12kV Distribution Station
1.6.1 #DISTRIBUTION CIRCUITS: A maximum of five 12.47kV feeders may be served by one 28.0 MVA transformer.
1.6.2 12kV CIRCUITS: The 12.47kV circuits are three phase, four
wire, grounded wye configuration.
1.6.3 12kV TIES: The 12.47kV feeders are open looped radial and when connected to adjacent feeders, are typically connected through manually operated switches which are locked open during normal operation.
1.6.4 FEEDER AMPACITY: Maximum feeder capacity is 600
amperes (13MVA) but may be constrained due to feeder get away heat limitations. Maximum normal operating current will be limited to that value defined in Table 2 (for overhead) and Table 3 (for underground) of the Line & Equipment Ratings Summary section
1.6.6 FEEDER TRANSFER BUS: New 69/12kV substations will be
built to accommodate a 600 amp feeder transfer bus. New transformers added at existing stations will be constructed to include the 600 amp feeder transfer capability with existing 12kV feeders at the station.
STANDARD PRACTICES DOCUMENT
2.0 TRANSFORMERS:
2.1 500/230kV Transformers will have:
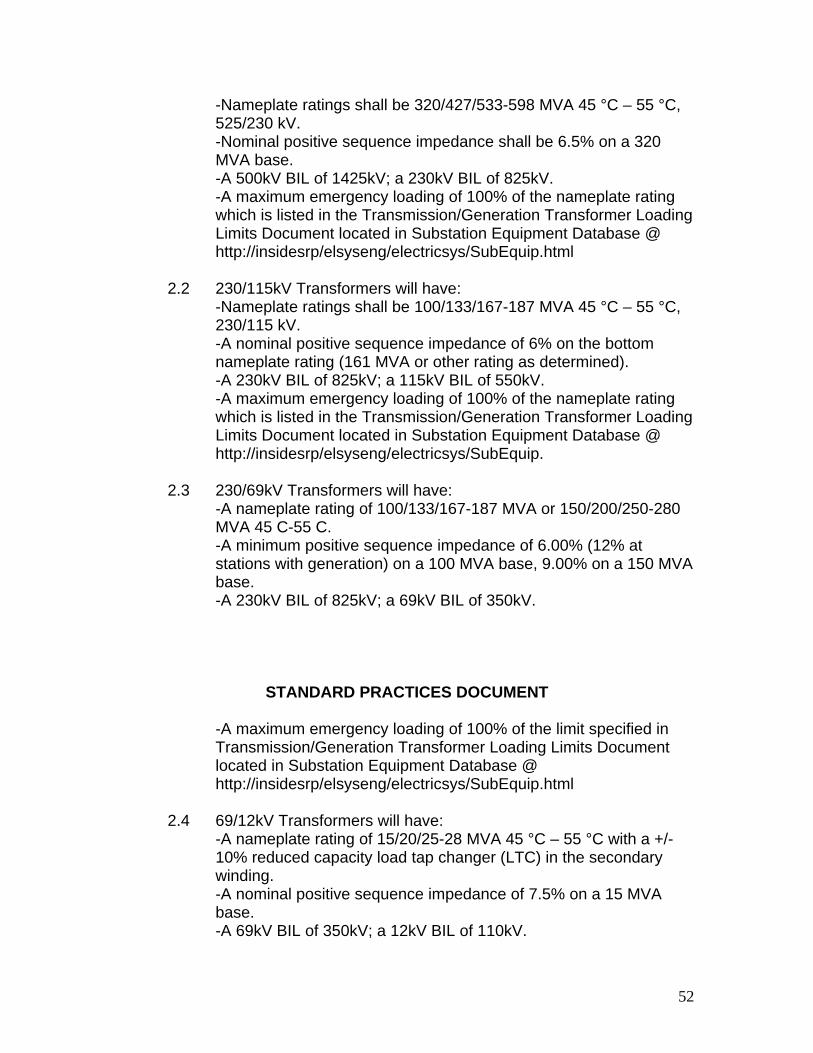
52
-Nameplate ratings shall be 320/427/533-598 MVA 45 °C – 55 °C, 525/230 kV. -Nominal positive sequence impedance shall be 6.5% on a 320 MVA base. -A 500kV BIL of 1425kV; a 230kV BIL of 825kV. -A maximum emergency loading of 100% of the nameplate rating which is listed in the Transmission/Generation Transformer Loading Limits Document located in Substation Equipment Database @ http://insidesrp/elsyseng/electricsys/SubEquip.html
2.2 230/115kV Transformers will have: -Nameplate ratings shall be 100/133/167-187 MVA 45 °C – 55 °C, 230/115 kV. -A nominal positive sequence impedance of 6% on the bottom nameplate rating (161 MVA or other rating as determined). -A 230kV BIL of 825kV; a 115kV BIL of 550kV. -A maximum emergency loading of 100% of the nameplate rating which is listed in the Transmission/Generation Transformer Loading Limits Document located in Substation Equipment Database @ http://insidesrp/elsyseng/electricsys/SubEquip.
2.3 230/69kV Transformers will have: -A nameplate rating of 100/133/167-187 MVA or 150/200/250-280 MVA 45 C-55 C. -A minimum positive sequence impedance of 6.00% (12% at stations with generation) on a 100 MVA base, 9.00% on a 150 MVA base. -A 230kV BIL of 825kV; a 69kV BIL of 350kV.
STANDARD PRACTICES DOCUMENT -A maximum emergency loading of 100% of the limit specified in Transmission/Generation Transformer Loading Limits Document located in Substation Equipment Database @ http://insidesrp/elsyseng/electricsys/SubEquip.html
2.4 69/12kV Transformers will have:
-A nameplate rating of 15/20/25-28 MVA 45 °C – 55 °C with a +/- 10% reduced capacity load tap changer (LTC) in the secondary winding. -A nominal positive sequence impedance of 7.5% on a 15 MVA base. -A 69kV BIL of 350kV; a 12kV BIL of 110kV.
53
-The station design shall limit the maximum distribution substation transformer loading under normal conditions to 83% of nameplate(85% of emergency????) capacity to allow for loading under contingency conditions - The station design shall limit the maximum emergency distribution substation transformer loading of 69/12 kV transformers to the value determined by ESP&E) which historically has been about 125% of their highest nameplate rating under contingency loading conditions. - The station design shall limit the maximum industrial substation transformer loading of 69/12 kV transformers to 100% of their highest nameplate rating under any operating conditions.
3.0 CIRCUIT BREAKERS, CIRCUIT SWITCHES & TRANSFORMER
PROTECTORS
3.1 500kV Circuit Breakers will have: -A minimum continuous current rating of 2000 amperes. -Symmetrical interrupting current (IC) ratings of 40 kAIC or 63 kAIC as required
3.2 230kV Circuit Breakers will have:
-Continuous current ratings of 2,000 or 3,000 amperes depending upon the ultimate station requirements. -Symmetrical interrupting current (IC) ratings of 50 kAIC.
3.3 115kV Circuit Breakers will have:
-A continuous current rating of 2000 amperes-Symmetrical interrupting current (IC) ratings of 40 kAIC
STANDARD PRACTICES DOCUMENT
3.4 69kV Circuit Breakers at Receiving Stations will have: -Continuous current ratings of 3000 amperes. -Symmetrical interrupting current (IC) rating of 44 kAIC
3.5 69kV Circuit Breakers at Distribution Stations will have: -Continuous current ratings of 2,000 amperes. -Symmetrical interrupting current (IC) ratings of 40 kAIC minimum.
3.6 69kV Transformer Protectors will:
-Be installed in new substation installations. Transformer protectors will be installed in existing substation bays where a need is demonstrated and the work can be scheduled. (29) -Have symmetrical interrupting current (IC) ratings >20 kAIC

54
3.7 12kV Circuit Breakers will have: -A continuous current rating of 1200 A, 2000 A or 3000 A as required - 1200 A and 2000 A breakers shall be rated for 20 kAIC - 3000 A breakers shall be rated for 25 kAIC -A nominal voltage rating of 13.8kV. (21) The new 12kV metal clad switchgear units shall have 5-12kV circuit breakers for feeders.
3.8 12kV Circuit Switches -12kV circuit switches are used to isolate or sectionalize loads between operational zones for planned and emergency system switching. -New overhead and underground switches should be the gang operated load break type. -Gang-operated air break switches should be used between all major feeder ties and for "Normally Open" switches between radial feeders. -Blade disconnect switches may be used for parallel switching between feeders within the same 69kV area or to isolate specific loads. -Current ratings for 12kV switches are found in Disconnect Switches AK01.02 part of Substation Design Standards @ http://insidesrp/elsyseng/electricsys/substd.html
4.0 COMPENSATION, SHUNT & SERIES
4.1 500kV
STANDARD PRACTICES DOCUMENT
4.1.1 Shunt Compensation
-500kV line reactors will be used to control open end line voltages and provide voltage control. A load break switching device should be installed on line reactors intended for use in controlling system voltage. This will be studied on a case-by-case basis. -Tertiary windings of EHV transformers may be used as required for shunt capacitors and reactors for voltage control. Nominal shunt reactor size is 50 MVAR.
4.1.2 Series Compensation

55
-Series capacitors may be used on EHV lines to provide for power system stability, power flow distribution and voltage support. -An SSR evaluation may be conducted when a series capacitor addition is proposed. -Series Capacitors shall be sized so that as a minimum they can accommodate continuously the maximum power flow for the worst case single contingency outage plus 10 percent margin. The margin is added to compensate for the possibility of capacitor cans out of service. This will result in the series capacitors not being loaded beyond 90% of their continuous emergency limit.
4.2 230kV
-230kV shunt capacitor bank will be considered for improving the voltage profile on the transmission system. (Requirements for Shunt Capacitor Banks AK09.01 located in Substation Design Standards @ http://insidesrp/elsyseng/electricsys/substd.html)
4.3 115kV
-115kV shunt capacitor banks will be considered for improving the voltage profile on the transmission system. (Requirements for Shunt Capacitor Banks AK09.01 located in Substation Design Standards @ http://insidesrp/elsyseng/electricsys/substd.html)
4.4 69kV
-69kV shunt capacitor banks will be considered for improving the voltage profile on the subtransmission system. (Requirements for Shunt Capacitor Banks AK09.01 located in Substation Design Standards @ http://insidesrp/elsyseng/electricsys/substd.html)
STANDARD PRACTICES DOCUMENT
4.5 12kV
Distribution shunt capacitors are planned for: -12kV distribution feeders to compensate for reactive power consumed by customer loads. -12kV substation busses to compensate for the reactive power consumed by the station transformer.
-Sufficient capacitors should be installed to provide unity power factor atpeak load on the 69kV bus. (see paragraph 2.1.5 in the Near Term Guidelines). (Requirements for Shunt Capacitor Banks AK09.01 located in Substation Design Standards @ http://insidesrp/elsyseng/electricsys/substd.html)

56
4.6 Industrial Customers
-Shunt Compensation will be required of large industrial customers to improve the power factor to 0.85 as defined in SRP's Rules & Regulations.
5.0 TRANSMISSION LINES & 12kV FEEDERS:
5.1 500kV Transmission Lines -The normal conductor size is 2156 MCM (bluebird). Other factors may require a different wire size which will be evaluated on a case by case basis -Single circuit steel tower or steel pole structures. (Transmission line requirements for 500kV lines will be determined on an individual basis).
5.2 230kV Transmission Lines
-The normal conductor size is 954 MCM. Other factors may require a different wire size which will be evaluated on a case by case basis -Bundled ACSR or single conductor ACSS as dictated by a loss evaluation. -230kV line structures will be double circuit steel towers, steel poles or wood structures.
5.3 115kV Transmission Lines
-The normal conductor size is 795 MCM. Other factors may require a different wire size, which will be evaluated on a case-by-case basis -115kV line structures will be steel towers, steel poles or wood structures.
STANDARD PRACTICES DOCUMENT
5.4 69kV Transmission Lines -The standard conductor for new 69kV line construction is 954 MCM ACSS. -Existing single conductor 795 MCM 69kV lines will be upgraded with a single 954 MCM ACSS conductor as required for capacity. (27) -New line extensions from existing single conductor 795 MCM lines will be 954 MCM ACSS. -The standard conductor for new URD 69kV line construction is 1500 MCM copper. This will only be considered when requested and paid for by the customer -69kV line structures will typically be wood poles and may accommodate double 69kV circuits if the lines are serving different

57
230kV receiving station areas or independent loops within a 230kV receiving station area. (32) If loop service to a distribution station is accomplished with a double circuit, single pole line; steel poles should be used. -Line K-P-F or similar disconnect switches shall be removed and replaced by load-break station disconnect switches when a 69kV line is upgraded. -The continuous overload capability of K-P-F or similar disconnect switches will be as listed in Table 4 of the Line & Equipment Rating Summary Document. For summer emergency rating, the ambient is
5.5 12kV Feeders
-Conductor size for new overhead primary feeders will be 397 MCM AA. -The continuous overload capability of K-P-F or similar disconnect switches for overhead primary feeders will be as listed in Table 4 of the Line & Equipment Rating Summary Document. For summer emergency rating, the ambient is assumed to be 45 C. (13) -Conductor size for new underground primary feeder will be 750 MCM AA. -Two overhead 12kV feeders may be placed on common structures only if the circuits are from independent transformers except for new substations. (32)http://insidesrp/elsyseng/electricsys/Distribution/Distribution_Design.htm
6.0 DEFINITIONS BREAKER-AND-A-HALF BUS CONFIGURATION - A substation bus configuration where two elements (lines or transformers) are terminated in each cross bay using 3 circuit breakers (see Figure 2C in Section 8.0).
STANDARD PRACTICES DOCUMENT DOUBLE BREAKER BUS CONFIGURATION - A substation bus configuration where each of the elements in the substation (lines or transformers) is terminated separately between two breakers which are each tied to a main bus (see Figure 2C in Section 8.0). FEED, LOOPED - When a substation is provided with 2 or more sources of power, which are both (or all) normally closed, it is said to have looped feed or looped service. Since both sources are normally closed there is potential for flow through of power across the substation bus.

58
FEED, RADIAL - When a substation is provided with only 1 source of power it is said to have a radial feed or radial service. With radial service the loss of the single feed causes loss of load which must be restored via switching on the substation feeders if available. FEED, TAPPED - A special form of radial feed where the source for a sub is created by attaching a line to an existing line in "T" fashion as opposed to routing the existing line in and out of the sub (Looped Feed) or terminating the new feed at an existing sub. FEED, DUAL - When a substation is provided with 2 or more sources of power only one of which is normally closed it is said to have a dual feed. If the normally closed source of power to the sub is lost, service to the sub must be restored by switching the normally closed source open and closing the normally open source. This may be done manually either locally or remotely if the substation is so equipped. PAIRED ELEMENT BUS CONFIGURATION - A substation bus configuration where two elements (line plus transformer) form a series combination with no automatic sectionalizing device separating them such that a fault on either one causes both to be removed from service. (see Figure 1C in Section 8.0). RING BUS CONFIGURATION - A substation bus configuration where each of the elements in the substation (lines or transformers) are terminated separately between two breakers, which are tied together forming a ring (see Figure 2C in Section 8.0). ZIG-ZAG BUS CONFIGURATION. A substation bus configuration resembling a Double Breaker configuration but with breakers missing resulting in some elements being tied to the main bus through only a single breaker.
STANDARD PRACTICES DOCUMENT 7.0 INDEX ARRESTOR Rating @ 115kV Receiving Stations........................................................ 49 Rating @ 230kV Receiving Stations...................................................... 47 Rating @ 500kV Stations..........................................................………… 47 BREAKER AND A HALF................................................................................…. 47 BUS CONFIGURATION 115kV Receiving Stations....................................................................... 49 230kV Receiving Stations....................................................................... 47 500kV Stations......................................................................................... 47 69kV…………………………………………………………………………… 50 69kV Facilities @ 230/69kV Receiving Stations..................................... 49 BUS DIVIDER BREAKER

59
Breaker vs MOD .................................................................................... 53 When to install........................................................................................ 53 BUS/BAY AMPACITY 115kV Receiving Stations....................................................................... 49 230kV Receiving Stations..................................................….................. 47 500kV Stations........................................................................................ 47 69kV Bus @ Distribution Facilities.......................................................... 53 69kV Facilities @ 230/69kV Receiving Stations..................................... 50
Upgrade of 69kV @ Distribution Stations................................................ 52 CIRCUIT BREAKER
115kV, 230kV, 500kV Continuous Current Rating ................................. 55 115kV, 230kV, 500kV Symmetrical Interrupting Current................……...55 69kV, 12kV Continuous Current Rating .................................................. 56
69kV, 12kV Symmetrical Interrupting Current................…...................... 56 CIRCUIT SWITCH
Between Major Feeders.......................................................................... 56 Blade Disconnect Type........................................................................... 56 Gang Operated Load Break.................................................................... 56 Ratings ................................................................................................... 56 Uses........................................................................................................ 56
COMPENSATION, SERIES Capacitor sizing...................................................................................... 57 SSR Implications...….............................................................................. 57 When used.............................................................................................. 57
COMPENSATION, SHUNT For Voltage Control................................................................................. 57 Industrial Customer application............................................................... 58 Power Factor Correction, 12kV............................................................... 58 When used.….......................................................................................... 58
DOUBLE 69KV CIRCUITS STANDARD PRACTICES DOCUMENT
Steel poles vs Wood poles...................................................................... 59
DROPS 69kV Line ................................................................................................ 52
FEEDERS (12kV Circuits)
Allowable Double Circuits .........….......................................................... 59 Conductor Size........................................................................................ 59 Configuration (i.e. 3-ph 4-wire etc.)......................................................... 53 Max Ampacity.......................................................................................... 53 Max Number per Transformer ................................................................ 53 Ties between circuits............................................................................... 53 Transfer Bus............................................................................................ 53
LINE TERMINATIONS 69kV Circuit Breaker Requirements ....................................................... 53

60
Location of 69kV @ Distribution Stations .............................................. 53 Max Number of 230kV lines @ Receiving Stations................................. 48 Max Number of 69kV lines @ Receiving Stations................................... 49
LOAD BREAK SWITCH MOD & Supervisory Control ...............................................................… 53
LOOPED SERVICE For 230kV Receiving Stations ................................................................ 48 For Residential & Industrial Substations................................................. 51
LOW PROFILE RECONSTRUCTION............................................................... 52 MOBILE TRANSFORMER CONNECTION........................................................ 53 MOD
On Load Break Switches .........…........................................................... 53 RING BUS……………………………………………………………………………. 47 SHORT CIRCUIT DUTY.................................................................................… 49
230kV Buses........................................................................................... 49 115kV Buses........................................................................................... 49 69kV Breakers @ Distribution Stations .................................................. 53 69kV Receiving Station Buses................................................................ 50
TIES, 12kV Feeder..............................................…........................................... 54 TRANSFER BUS
Feeder..................................................................................................... 54 Unit……………………………………………………………………………. 54
TRANSFORMER Addition vs New Distribution Station….................................................... 53 Addition vs New Receiving Station ......................................................... 48
BIL…………………………………………………………………………….. 55 Max Emergency Loading .........….......................................................... 55 Max Number @ Distribution Stations .........…......................................... 51 Max Number @ Receiving Stations......................................................... 48 Mobile Connection .................................................................................. 53
STANDARD PRACTICES DOCUMENT Nameplate Rating .................................................................................. 55 Nominal Impedance................................................................................ 55
TRANSFORMER PROTECTOR Symmetrical Interruptible Rating............................................................. 56 When used.............................................................................................. 56
TRANSMISSION LINE New 69kV Line Extensions .................................................................... 59 Normal Conductor Size........................................................................... 59 Steel Poles for Double Circuits .............................................................. 59 Support Structures ................................................................................. 59 Underground 69kV.................................................................................. 59 Wood Poles for Double Circuits.............................................................. 59
UNIT TRANSFER BUS...................................................................................... 54 UPGRADE 69KV LINE

61
Conductor Size/Type .........…................................................................. 59 KPF Switch Replacement ...................................................................... 59
URD 69kV LINES Conductor Size/Type ............................................................................. 59
VOLTAGE Max Equipment Rating............................................................................. 47
STANDARD PRACTICES DOCUMENT 8.0 FIGURES & TABLES Figure 1C Ring Bus Configuration Figure 2 Standard 69kV Bus Configuration

62

63

64
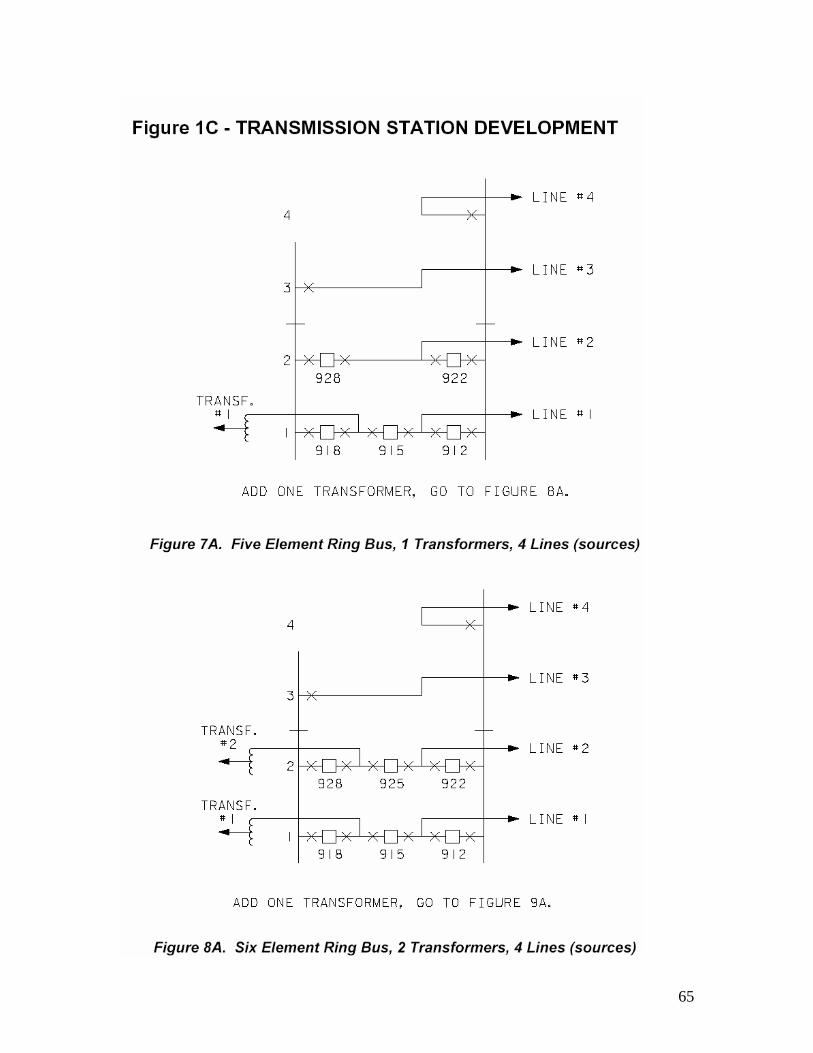
65

66

67
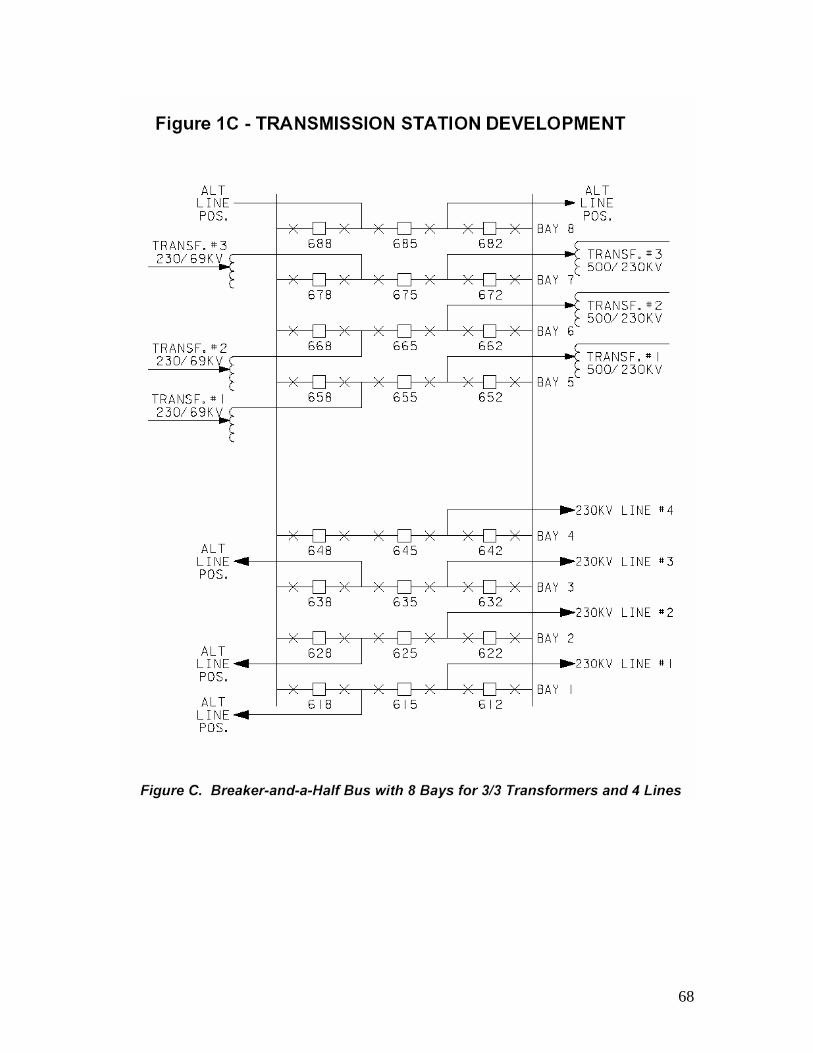
68

69
Figure 2
70
The Following Section being Renovated Expected Completion Feb 2008
9.0 OPERATIONS SECTION OF PLANNING GUIDELINES DOCUMENT guidelines_operations_section 1/8/97 (Rev. 11/1/04)
1.0 OPERATING STUDIES (69KV & ABOVE) ................................................. 77
1.2 Study Areas ..................................................................................... 78 1.3 Contingency Analysis....................................................................... 78 1.4 Problem Resolution.......................................................................... 78 1.5 Planning Study Impact ..................................................................... 79
2.0 CONSTRUCTION OUTAGE STUDIES (69KV & ABOVE) ......................... 79
2.1 Base Cases .........…......................................................................... 79 2.2 Contingency Analysis.....................................................................… 80 2.3 Problem Resolution........................................................................... 80
3.0 SUMMER SWITCHING STUDIES (12KV) .............................................. 81
3.1 Study Case….................................................................................... 81 3.2 New Construction Added .................................................................. 81 3.3 Guidelines For N-0 Studies............................................................... 82 3.4 Study ................................................................................................ 82 3.5 Study Timing..................................................................................... 82 3.6 Single Contingency Studies.............................................................. 82
4.0 69/12kv TRANSFORMER & 12kv BREAKER MAINTENANCE ................. 83 5.0 12 KV AUTOMATED SWITCHING TECHNOLOGY.................................... 83 6.0 FIGURES & TABLES .................................................................................. 84

71
OPERATIONS SECTION OF PLANNING GUIDELINES DOCUMENT Transmission System Planning conducts 4 types of studies for Power Operations on a routine basis. These studies are called Operating Studies, Construction Outages Studies, Breaker Out for Maintenance (BOM) Studies and 12kV Seasonal Switching Studies. Since BOM Studies are conducted infrequently on an "as requested" basis they are not discussed in this section of the guidelines document. The following paragraphs discuss the procedure and assumptions associated with the other three types of studies. 1.0 OPERATING STUDIES (69KV & ABOVE)
Operating studies are done annually on a joint basis with APS and WAPA. The base case used in the analysis is coordinated between the three utilities and used by each in studying their particular portion of the system. SRP uses the following procedure/assumptions to conduct the operating study on its portion of the network. 1.1 Base Cases
1.1.1 Loads- Forecasted peak load is modeled for the coming
summer season and winter season (for those areas where winter load is more severe than summer load).
1.1.2 Circuitry- Construction projects, which are expected to be
completed before May 31, are modeled in the case as though completed. Sensitivities are run to test the effect of the possible delay of projects whose expected date for completion may slip beyond May 31.
1.1.3 Generation- An economic generation pattern is assumed for
the base case. Sensitivities are run as a part of the study to determine the impact of generation extremes.
1.1.4 Ratings- Line and transformer ratings used in the power flow
model are the same as those used in the planning process. The relationship between these planning type ratings and the alarm levels used in the EMS to alert PDO of problems are outlined in Table A in Section 6.0.
72
OPERATIONS SECTION OF PLANNING GUIDELINES DOCUMENT 1.2 Study Areas
1.2.1 Without Generation- Load levels for an area are compared to
the previous year's. Those areas with significant growth are considered for study.
1.2.2 With Generation- Areas with generation are studied
regardless of growth. 1.3 Contingency Analysis
1.3.1 Single Contingencies- Outages will be studied for each 69kV,
115kV, 230kV and 500kV line as well as each 230/69kV, 230/115kV and 500/230kV transformer. Line loadings in excess of their normal ratings, transformer loadings in excess of their emergency rating, and 69 & 115kV bus voltages which fall below the acceptable minimum level (as determined by the Subvolt) will be identified and operating solutions will be explored.
1.3.2 Multiple Contingencies- Outages of 69kV bus sections at
230/69kV receiving stations as well as 230kV tower outages will be studied. Tower outages (multiple outages of 230kV lines using the common towers) will not be studied every year. Line and transformer overloads and voltage problems resulting from these outages will be identified but solutions will not be explored as vigorously as problems resulting from single contingencies outages
1.4 Problem Resolution
1.4.1 69 & 115kV Switching- Line and transformer overload problems will be resolved with temporary switching solutions where ever possible. This solution is preferred because of the relative low cost.
1.4.2 Uneconomical generation- When a switching solution is not
feasible an uneconomical generation pattern should be explored to resolve line/transformer overload problems.

73
OPERATIONS SECTION OF PLANNING GUIDELINES DOCUMENT
1.4.3 Load shedding- When all else fails load shedding solutions will be explored to resolve overload problems. Non-firm load will be shed first. If necessary, firm load may be shed also.
1.4.4 Line Overloads- When during the course of an operating
study a potential line overload problem is discovered, Line Design will be requested to validate the thermal rating for the line in question considering actual field conditions (i.e. minimum tree, line crossing and 12kV underbuilt clearance). This could result in a customized rating either less than or greater than the generic rating for the line. In either case the new rating will become the official rating used in future planning and operating studies.
1.5 Planning Study Impact
Output of the operating study serves as input to the planning studies. Problems discovered as part of the operating study verify the need for long term solutions identified in the planning process.
2.0 CONSTRUCTION OUTAGE STUDIES (69KV & ABOVE)
Construction Outage Studies are conducted by Transmission System Planning throughout the year on an as needed basis.
2.1 Base Cases
2.1.1 Loads- Forecasted peak load is modeled using the historical
patterns of the load for the period being studied. In addition, current load behavior, as well as estimated increase due to new customers, is added to the forecast.
2.1.2 Circuitry- Construction projects which are expected to be
completed before the construction period being studied are modeled in the case as though completed.
2.1.3 Generation- An economic generation pattern is assumed for
the base case. Sensitivities are run as a part of the study to determine the impact of generation extremes. Known long term generation outages should be included in these construction outage studies.
OPERATIONS SECTION OF PLANNING GUIDELINES DOCUMENT

74
2.1.4 Duration & Sequencing- Details regarding the duration and sequence of events for each individual construction outage are ascertain via meetings/communication with the operations department.
2.2 Contingency Analysis
2.2.1 Single Contingencies- Outages will be studied for each 69kV,
115kV 230kV and 500kV line as well as each 230/69kV, 230/115kV and 500/230kV transformer in the areas where the particular construction project of interest will occur. Line and transformer loadings in excess of their emergency seasonal rating and 69 & 115kV bus voltages which fall below the acceptable min level (as determined by the Subvolt) will be identified and operating solutions will be explored.
2.2.2 Multiple Contingencies- In the area where the particular
construction project of interest will occur outages of 69kV bus sections at 230/69kV receiving stations will be studied. Line and transformer overloads and voltage problems resulting from these outages will be identified and operating solutions will be explored.
2.3 Problem Resolution
2.3.1 Shifting Seasons- Scheduling construction during seasons of
the year when load is at its minimum is effective in most instances.
2.3.2 69kV Switching- Line and transformer overload problems and
voltage problems should be resolved with temporary switching solutions wherever possible. This solution is preferred because of the relative low cost.
2.3.3 12kV load transfer- Distribution load will be shifted from one
feeder to another to relieve overload problems where appropriate.
2.3.4 Uneconomical generation- When shifting seasons, 69kV
switching and 12kV load transfer are not appropriate an uneconomical generation pattern should be explored to
OPERATIONS SECTION OF PLANNING GUIDELINES DOCUMENT

75
resolve line/transformer overload problems and voltage problems. 2.3.5 Nomograms- An effective graphical method for
communicating the conditions under which uneconomical generation or season shifting can resolve constructions outage problems is the nomogram (see Figure 2). The nomogram is a plot of load level versus generation in a particular area of the system. If actual conditions are such that the operating point (actual generation and actual load plotted on the graph) is in the "Safe Operating Region" on the nomogram the system will be free of problems. If the operating point is not in the "Safe Operating Region" on the graph, safe operation can be restored by adjusting generation or by rescheduling the construction outage until the load level drops such that the operating point returns to "Safe Operating Region".
2.3.6 Mobile 69/12kV Transformer- Certain construction outages may require the use of the 69/12kV mobile transformer to maintain continuity of service.
3.0 SUMMER SWITCHING STUDIES (12KV)
Distribution Planning conducts summer switching studies for Electric System Operations each year. The goal of the studies is to locate heavily loaded 12kv circuits and 69/12kv transformers before the peak summer season and recommend switching procedures to resolve the loading issues on the circuits and bays. These studies provide advance indication of heavy loading on electrical facilities, provide opportunities to equalize the loading and/or identify additional construction that may be required to alleviate overloads in the future.
3.1 Study Case
The study case is developed from a basecase containing actual loading experienced on the system the previous year. New growth that is anticipated to be in-service is then added to the basecase as well as any weather adjustment that might be necessary to reflect peak loading conditions during the upcoming peak season.
3.2 New Construction Added
OPERATIONS SECTION OF PLANNING GUIDELINES DOCUMENT
New substation transformer additions and other new 12kv feeder work are added to reflect the system that will be in-service during the upcoming peak load season.
76
3.3 Guidelines For N-0 Studies
3.3.1 Substation transformers are typically loaded to a maximum
level of 85% of the emergency rating.(See Table 6 in the ESE line and equipment rating section).
3.3.2 Feeders are loaded to roughly 70% of the emergency loading
limit for the feeder conductor. Historically, this has been assumed to be 70% of 430 amps which was the emergency rating for 500 MCM getaways in-duct. This rating has recently been revised for both 500 MCM and 750 MCM cables. (See Table 2 in ESE line and equipment rating section).
3.3.3 Normal opens should be avoided at blade disconnects, non-
unitized pole risers and live front underground switches.
3.4 Study Where loading on the circuits/bays exceeds the guidelines, switching to lower loaded bays/circuits is recommended using normal open switches. In some cases the loading level cannot be reduced to an acceptable level due to a lack of connections between the heavily loaded equipment and lightly loaded equipment. When this occurs, some new construction of 12kv feeder ties and/or switches may be requested in the area. Typically this construction cannot be completed before the upcoming peak season. For extreme guideline violations, some construction may be completed by the upcoming peak season.
3.5 Study Timing
The summer switching study completion date is May 1
3.6 Single Contingency Studies
In critical areas, single contingency studies may be performed by Distribution Planning to determine if significant switching would be required during peak loading conditions if an outage of a 69/12kv transformer were to occur. Loading to 100% of the emergency
OPERATIONS SECTION OF PLANNING GUIDELINES DOCUMENT rating for lines and transformers is allowed during contingency conditions. Study timing may coincide with N-0 study work or may be requested on a case by case basis.
77
3.6.1 Switching Status Changes - If more than 20 switch status
changes are required to pick up the load, some additional 12kv construction and/or 69/12kv transformer capacity may be needed in the area. In general, the 20 switch status changes represent a threshold at which double tiered switching may be required, i.e., unload a backup circuit or bay so that margin is then available to pickup the load that is out. Double tiered switching can result in a lengthy outage to the customers and therefore construction may be required to reduce the need for this level of switching.
3.6.2 Customer Downtime - The 20 switch status change
requirement is based on goals to restore residential service within 2 hours and commercial service within 2 hours following an outage.
3.6.3 Use of Mobile Transformer - A mobile transformer may be
recommended when the next contingency could cause loss of load. Mobile Transformers take 16-24 hours to install. It is therefore important to provide for backup 12kv ties to use until the Mobile Transformer can be energized. This is typically provided with the 85% transformer guideline and 70% feeder loading guideline.
4.0 69/12kv TRANSFORMER & 12kv BREAKER MAINTENANCE
To meet the customer downtime objectives identified in the seasonal switching section 3.6.2 above, maintenance may be allowed during peak loading conditions if sufficient capacity exists in the area to provide adequate service to customers. Otherwise, maintenance may be restricted to off-peak times. The general rule is that no more than one element can be out for maintenance in an area at any time.
5.0 12 KV AUTOMATED SWITCHING TECHNOLOGY
Recent technology advancements have provided the opportunity to implement automated technology in the 12kv distribution system. This technology may provide SRP the opportunity to reduce margins while at the same time improve customer service. Some operational requirements for this technology are summarized below.
5.1 Visibility & Control

78
DOC requires visibility and control of these devices be made available at the Electric System Operations center.
5.2 Adequate Backup Margin
For devices that automatically transfer the load to an alternate source, adequate backup margin will need to be planned in the alternate source.
5.3 Multiple Devices in the area
It is important to evaluate the location of these devices so that two devices in the same area don't transfer to the same backup circuit.
6.0 FIGURES & TABLES
TABLE A Comparison of Current Planning & Operating Load Limits
OPERATIONS SECTION OF PLANNING GUIDELINES DOCUMENT TABLE A
COMPARISON OF CURRENT PLANNING & OPERATING LOAD LIMITS* plan_guidelines_operations_table_a 1/8/97
TRANSFORMERS
79
Planning PDO a) base loading (n-0) studies a) 1st alarm: 230/69: "Nameplate Rating” in 230/69: "Nameplate Rating" Transmission/Generation Transformer Loading Transmission/Generation Transformer Loading Limits Limits Database Database 69/12: 85% of "Emer. Limit” in 69/12: "Nominal" per Table 7b in Substation Transformers Substation Transformers database database others: highest nameplate rating others: 90% of top 65 deg C nameplate b) contingency (n-1) studies b) 2nd alarm 230/69: "Emergency Max Loading" 230/69: "Emergency Max Loading" summer/winter in summer/winter in Transmission/Generation Transformer Loading Transmission/Generation Transformer Loading Limits Database Limits Database 69/12: "Emer. Limit" in 69/12: "Emer. Limit” in Substation Transformers database Substation Transformers database others: highest nameplate rating others: 100% of top 65 deg C nameplate LINES, 69 TO 500kV Planning PDO a) n-0 studies: "Normal" summer/ a) 1st alarm: 90% of "Normal" summer/
winter rating per Table 1 winter rating per Table 1 b) n-1 studies: "Emer." summer/ b) 2nd alarm: 100% of "Normal" summer/
winter rating per Table 1 winter rating per Table 1 LINES, 12kV Planning DOC** overhead: Table 2 overhead: Table 2 underground: Table 3 underground: Table 3
alarms: 300A on 360A ckts 400A on 480A & 600A ckts
SUMMER VS WINTER Planning PDO Summer ratings are used in summer Summer ratings used when daily high temp
peaking areas > 95 deg F for 3 consecutive days Winter ratings are used in winter Winter ratings used when daily high temp peaking areas < 83 deg F for 3 consecutive days NOTES (1) Tables 1, 2, 3 are found in the Line & Equipment Ratings section of the Planning Guidelines Document (2) Transmission/Generation Transformer Loading Limits Document can be found @ Transmission/Generation Transformer Loading Limits Document located in Substation Equipment Database @ http://insidesrp/elsyseng/electricsys/SubEquip.html (3) Substation Transformers Database can be found in Substation Equipment Database @ http://insidesrp/elsyseng/electricsys/SubEquip.html ** 12kV feeder Time Phase Overcurrent relays are set at 360 Amps (older subs), 480 Amps or 600 Amps. The Time Phase Overcurrent relays are an upper "overload" limit on feeder phase current. DOC trys to keep feeder loading below the feeder overload alarm limit, except in emergencies or during cold load pickup. When feeder loading reaches 450 amps, DOC looks for a way to unload the feeder. In emergencies feeder loading can be over 450 amps, & even approach the Time Phase Overcurrent relay setting, if the only alternative is customer interruption.
80
SRP ELECTRIC SYSTEM LINE AND EQUIPMENT RATINGS SUMMARY
1.0 GENERAL
The following tables summarize the continuous and emergency ratings that are to be applied in planning and operating the SRP electric system. These ratings identify maximum continuous and emergency loadings, which will avoid damage or loss of life to SRP’s transmission and distribution lines and substation apparatus and will provide for

81
the public safety. The notes to each table describe the underlying assumptions that the electric system ratings are based on. 2.0 CONTACTS
Questions regarding this section of the Guidelines should be directed to the following contact people:
Table Contact Backup
(Incumbent as of 1/97) (Incumbent as of 1/97) 1. Overhead transmission ESE Lines Principal Engineer ESE Lines Supervisor conductors (Jim Hunt, ext. 8690) (TBD, ext. 8626)

82
2. Overhead distribution ESE Lines Sr. Principal Engineer ESE Lines Supervisor conductors (Mike Dyer, ext. 8606) (TBD, ext. 8626) 3. Underground ESE Lines Sr. Principal Engineer ESE Lines Supervisor conductors (Mike Dyer, ext. 8606) (TBD, ext. 8626) 4. Line disconnect ESE Lines Principal Engineer ESE Lines Supervisor switches (Jim Hunt, ext. 8690) (TBD, ext. 8626) 5. Substation conductors ESE Substa. Principal Engineer ESE Substation Supervisor
(Brian Wallace, ext. 8622) (Alan Jackovich, ext. 8016)
6. Substation disconnect ESE Substa. Principal Engineer ESE Substation Supervisor switches (Brian Wallace, ext. 8622) (Alan Jackovich, ext. 8016) 7. Transformer loadings ESE Substa. Sr. Principal Engineer ESE Substation Supervisor
(Gary McCulla, ext. 8621) (Alan Jackovich, ext. 8016)
8. Voltage maximums ESE Substa. Sr. Principal Engineer ESE Substation Supervisor (Gary McCulla, ext. 8621) (Alan Jackovich, ext. 8016)
9. Circuit breaker IC ESE Substa. Sr. Principal Engineer ESE Substation Supervisor (Brad Staley, ext. 8607) (Alan Jackovich, ext. 8016)
3.0 SUMMARY LIST OF TABLES Table 1 - Thermal Ratings for Overhead Transmission Conductors 69 kV and Above Table 2 - Thermal Ratings for Distribution Feeder Conductors Table 3 - Thermal Ratings for Underground Conductors

83
Table 4 - Approximate Continuous Overload Capabilities of K-P-F Switches Table 5 - Conductor Ampacity for Substation Design Table 6 - Substation Disconnect Switch Current Ratings Table 7 - Maximum Steady State Voltage
Thermal Ratings for Overhead Transmission Conductors 69 kV and Above
CONDUCTOR SUMMER NORMAL
SUMER EMER. *
WINTER NORMAL
WINTER EMER.*
ACSR (ALUMINUM CONDUCTOR STEEL REINFORCED) AMPS AMPS AMPS AMPS

84
2312kCM 76/19 ACSR "THRASHER" 1390 1680 1810 2020 2156kCM 84/19 ACSR "BLUEBIRD" 1330 1610 1740 1930 1780kCM 84/19 ACSR "CHUKAR" 1180 1430 1540 1710 1590kCM 45/7 ACSR "LAPWING" 1250 1500 1430 1590 954kCM 45/7 ACSR "RAIL" 910 1100 1050 1170 795kCM 45/7 ACSR "TERN" 825 975 940 1040 477kCM 26/7 ACSR "HAWK" 600 700 690 760 266.8kCM 26/7 ACSR "PARTRIDGE" 420 490 470 520 4/0 (211.6kCM) 6/1 ACSR "PENGUIN" 320 375 385 429 372 433 3/0 (167.7kCM) 6/1 ACSR "PIGEON" 260 300 330 350 #2 (66.4kCM) 6/1 ACSR "SPARROW" 150 180 190 200
ACSS (ALUMINUM CONDUCTOR STEEL SUPPORTED)
1272kCM 45/7 "BITTERN/SSAC" 2350 2350 2350 2350 954kCM 45/7 "RAIL/SSAC" 1900 1900 1900 1900 795kCM 45/7 "TERN/SSAC" 1700 1700 1700 1700
AAC (ALL ALUMINUM CONDUCTORS)
1590kCM 61 Strand AAC "COREOPSIS" 1250 1475 1400 1560 1272kCM 61 Strand AAC "NARCISSUS" 1100 1300 1220 1350 954kCM 37 Strand AAC "MAGNOLIA" 900 1070 1040 1150 795kCM 37 Strand AAC "ARBUTUS" 810 950 920 1020 477kCM 19 Strand AAC "COSMOS 590 700 670 740 397kCM 19 Strand AAC "CANNA" 470 560 590 660 266.8kCM 7 Strand AAC "DAISY" 370 430 460 500 3/0 (167kCM) 7 Strand AAC "PHLOX" 270 320 340 370 1/0 (105kCM) 7 Strand AAC "POPPY" 200 240 250 280 #2 (66kCM) 7 Strand AAC "IRIS" 150 180 190 210
AAAC (ALL-ALUMINUM-ALLOY CONDUCTORS)
312kCM 19 Strand AAAC "BUTTE" 420 500 480 530 Delta "10" Ratings * 2 Hours per event
TABLE 1 (cont’d) THERMAL RATINGS FOR OVERHEAD TRANSMISSION CONDUCTORS
TEMPERATURE CONDITIONS
1. SUMMER NORMAL: CONDUCTOR = 167°F (75°C)
AMBIENT = 104°F (40°C) 2. SUMMER EMERGENCY: CONDUCTOR = 200°F (93°C)
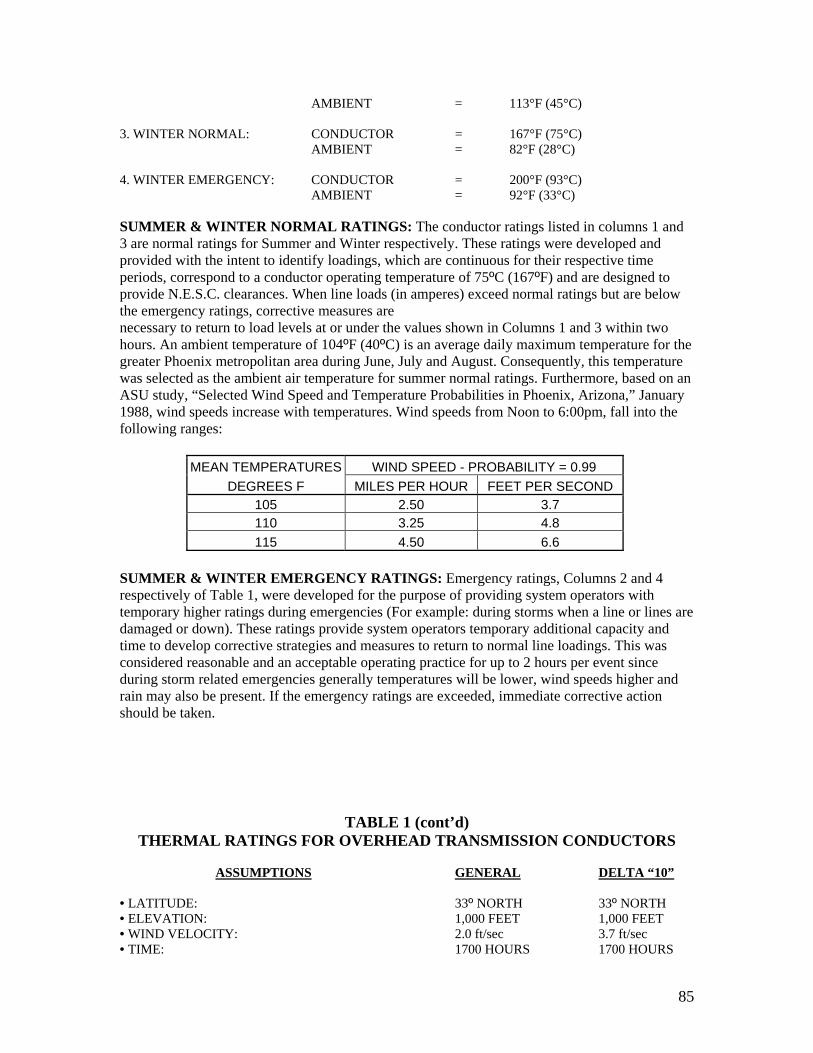
85
AMBIENT = 113°F (45°C) 3. WINTER NORMAL: CONDUCTOR = 167°F (75°C)
AMBIENT = 82°F (28°C) 4. WINTER EMERGENCY: CONDUCTOR = 200°F (93°C)
AMBIENT = 92°F (33°C) SUMMER & WINTER NORMAL RATINGS: The conductor ratings listed in columns 1 and 3 are normal ratings for Summer and Winter respectively. These ratings were developed and provided with the intent to identify loadings, which are continuous for their respective time periods, correspond to a conductor operating temperature of 75ºC (167ºF) and are designed to provide N.E.S.C. clearances. When line loads (in amperes) exceed normal ratings but are below the emergency ratings, corrective measures are necessary to return to load levels at or under the values shown in Columns 1 and 3 within two hours. An ambient temperature of 104ºF (40ºC) is an average daily maximum temperature for the greater Phoenix metropolitan area during June, July and August. Consequently, this temperature was selected as the ambient air temperature for summer normal ratings. Furthermore, based on an ASU study, “Selected Wind Speed and Temperature Probabilities in Phoenix, Arizona,” January 1988, wind speeds increase with temperatures. Wind speeds from Noon to 6:00pm, fall into the following ranges:
MEAN TEMPERATURES WIND SPEED - PROBABILITY = 0.99 DEGREES F MILES PER HOUR FEET PER SECOND
105 2.50 3.7 110 3.25 4.8 115 4.50 6.6
SUMMER & WINTER EMERGENCY RATINGS: Emergency ratings, Columns 2 and 4 respectively of Table 1, were developed for the purpose of providing system operators with temporary higher ratings during emergencies (For example: during storms when a line or lines are damaged or down). These ratings provide system operators temporary additional capacity and time to develop corrective strategies and measures to return to normal line loadings. This was considered reasonable and an acceptable operating practice for up to 2 hours per event since during storm related emergencies generally temperatures will be lower, wind speeds higher and rain may also be present. If the emergency ratings are exceeded, immediate corrective action should be taken.
TABLE 1 (cont’d) THERMAL RATINGS FOR OVERHEAD TRANSMISSION CONDUCTORS
ASSUMPTIONS GENERAL DELTA “10”
• LATITUDE: 33º NORTH 33º NORTH • ELEVATION: 1,000 FEET 1,000 FEET • WIND VELOCITY: 2.0 ft/sec 3.7 ft/sec • TIME: 1700 HOURS 1700 HOURS

86
• COEFFICIENT OF EMISSIVITY 0.5 0.5 • COEFFICIENT OF SOLAR ABSORPTION 0.5 0.5 NOTES: 1. These values do not apply to conductors within a substation. (See Table 4 for
substation conductors.) 2. One rating is applied to ACSS conductors for all conditions to ensure that the
conductor does not exceed the 200 oC operating temperature which could potentially damage the steel core.
3. Summer ratings should be used from May 1 until November 1 unless the high ambient temperature exceeds 95 oF for 3 consecutive days prior to May 1.
4. Winter ratings should be used from November 1 until May 1 unless the high temperature is below 83oF for 3 consecutive days prior to November 1.
Table 2 Thermal Ratings for Overhead Distribution Conductors
Conductor Size and Type Ampacity *#2 ACSR "Sparrow" 155 #2/0 ACSR "Quail" 240
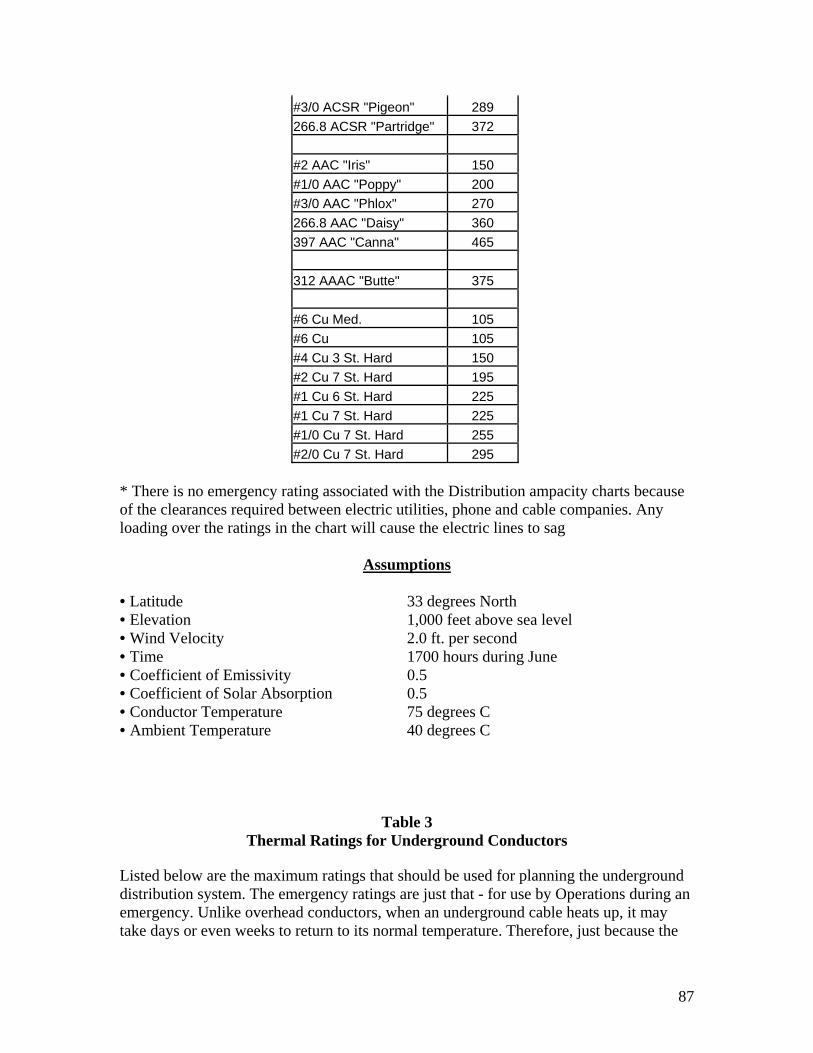
87
#3/0 ACSR "Pigeon" 289 266.8 ACSR "Partridge" 372 #2 AAC "Iris" 150 #1/0 AAC "Poppy" 200 #3/0 AAC "Phlox" 270 266.8 AAC "Daisy" 360 397 AAC "Canna" 465 312 AAAC "Butte" 375 #6 Cu Med. 105 #6 Cu 105 #4 Cu 3 St. Hard 150 #2 Cu 7 St. Hard 195 #1 Cu 6 St. Hard 225 #1 Cu 7 St. Hard 225 #1/0 Cu 7 St. Hard 255 #2/0 Cu 7 St. Hard 295
* There is no emergency rating associated with the Distribution ampacity charts because of the clearances required between electric utilities, phone and cable companies. Any loading over the ratings in the chart will cause the electric lines to sag
Assumptions • Latitude 33 degrees North • Elevation 1,000 feet above sea level • Wind Velocity 2.0 ft. per second • Time 1700 hours during June • Coefficient of Emissivity 0.5 • Coefficient of Solar Absorption 0.5 • Conductor Temperature 75 degrees C • Ambient Temperature 40 degrees C
Table 3 Thermal Ratings for Underground Conductors
Listed below are the maximum ratings that should be used for planning the underground distribution system. The emergency ratings are just that - for use by Operations during an emergency. Unlike overhead conductors, when an underground cable heats up, it may take days or even weeks to return to its normal temperature. Therefore, just because the

88
cable can be loaded up today, it may not be able to carry the same current the next day. It should be assumed that the substation transformer is loaded to its nameplate for normal operation.
Conductor Maximum Ampacity Voltage Size & Type Application DB* Duct 15 kV #2 Al 1 Phase 152 105
#2 Al 3 Phase 155 126 #4/0 1 Phase 225 148 #4/0 3 Phase 301 243 Feeder 500 MCM Al. 3 Phase 462 396 750 MCM Al. 3 Phase 484 415
22 kV #1/0 1 Phase 200 139 #1/0 3 Phase 203 168
69 kV 1500 MCM Cu 3 Phase 1 conductor 900 2 conductors 1550
* Direct burial ampacity is only to be used for existing cable. All new cables are installed in duct.
Application Guidelines
The following four scenarios provide perspective in the application of underground system ratings. Scenario 1. #2 and 4/0 Distribution Primary Cable These cables are restricted by other equipment, not their ultimate current carrying capacity. #2 is limited by the fusing in the fuse cubicles or the riser poles they are fed from. The typical fuse is 80 amps, but 100 amp fuses could be used if necessary. 4/0 is limited by the 200 amp rating of the 4/0 elbows used to terminate the cable.
Rating (Amps) Time Duration Cable Size Normal Emergency Normal Emergency
#2 80 80 Continuous Continuous 4/0 200 200 Continuous Continuous
Scenario 2. Distribution Feeder in trench alone This feeder can be loaded to 600 amps for 6 hours. If loaded to 600 amps longer than 6 hours, cable damage will occur.
Rating (Amps) Time Duration Cable Size Normal Emergency Normal Emergency 500 MCM 396 600 Continuous 6 750 MCM 415 600 Continuous 6

89
Scenario 3. Multiple (4 or 5) Distribution Feeders in duct bank There are many different cases that can occur, but the only ones that can be monitored with any degree of accuracy are the feeders between the breakers in the substation and the first manhole just outside the substation wall. If all 4 or 5 feeders are balanced, the loading will not be a problem for normal operation. If the feeders are not balanced, then the Thermal Loading Program shall be run to determine if a problem exists. One of the feeders can be loaded to 600 amps for a 6 hour period. If the feeder is loaded to 600 amps longer than 6 hours, cable damage will occur. Scenario 4. Transmission Cable - 2 circuits per trench The transmission cable can be loaded to the values listed below. If the duration exceeds the tabulated values, damage will occur.
Normal Emergency Cable Size Rating (Amps) Time Duration Rating (Amps) Time Duration
1-1500 MCM CU 900 Continuous
1500 1400 1300
2 4 6
2/1500 MCM CU 1550
(775 amps/cable) Continuous
3000 2800 2600
2 4 6
Insert custom ug 69 ratings document….
Table 4 Approximate Continuous Overload Capabilities of Gang-Operated Line Switches
NAMEPLATE VOLTAGE, Kv MANUFACTURER
NAMEPLATE CURRENT, AMPERES
CONTINUOUS RATING,
AMPERES
EMERGENCY RATING,
AMPERES

90
12kV OH K-P-F (1) 400 550 720 12kV OH S & C (2) 600 1000 1000
UG 600 600 600
69kV K-P-F 600 700 800 69kV K-P-F 800 900 1075 69kV Turner 200 200 200
115kV K-P-F 1200 1200 1200
Notes: (1) The above values based on certified test reports provided by KPF, carried out in
accordance with ANSI 37.34, which are representative of KPF’s production switches. Reference: Memo from Dennis Gerlach to J. T. Underhill, dated 7/2/91.
(2) Based on calculations at 40oC ambient, 2 ft/sec wind velocity. (3) Pole riser switch ratings shown only cover gang-operated switches.
Table 5 Conductor Ampacity for Substation Design
Ampacity ratings for the conductors most commonly found in substations are shown in the following tables. Design will be based on the summer rating. Planning and Operations may use the winter ratings as conditions permit. Conductors can be loaded at these rated levels continuously.

91
Wire, ACSR (Aluminum Conductor Steel Reinforced)
Code name Wire size (MCM) Ampacity (Summer) Ampacity (Winter) Bluebird 2156 1609 Amps 1895 Amps Lapwing 1590 1340 Amps 1474 Amps 1573 Amps Rail 954 980 Amps 1078 Amps 1144 Amps Tern 795 873 Amps 960 Amps 1018 Amps Hawk 477 642 Amps 706 Amps 745 Amps Partridge 266 444 Amps 488 Amps 513 Amps
Rating based on 3.7 ft/sec wind speed, applicable only to high profile Valley receiving stations.
Wire, ACSS (Aluminum Conductor Steel Supported)
Code name Wire size (MCM) Ampacity (Summer) Ampacity (Winter) Bittern/SSAC 1272 2350 Amps 2350 Amps
Rail/SSAC 954 1900 Amps 1900 Amps
Tern/SSAC 795 1700 Amps 1700 Amps
Rating based on 3.7 ft/sec wind speed, applicable only to high profile Valley receiving stations. Since the rating of ACSS is based on a 200oC operating temperature, it should not be used after the first disconnect in a station. Wire, AAC (All Aluminum Conductor)
Code name Wire size(MCM) Ampacity (Summer) Ampacity (Winter) Bluebonnet 3500 2229 Amps 2466 Amps Trillium 3000 2063 Amps 2283 Amps Lupine 2500 1865 Amps 2064 Amps Cowslip 2000 1647 Amps 1851 Amps Jessamine 1750 1521 Amps 1684 Amps Coreopsis 1590 1435 Amps 1589 Amps Narcissus 1272 1249 Amps 1384 Amps Magnolia 954 947 Amps 1038 Amps 1150 Amps Arbutus 795 846 Amps 929 Amps 1030 Amps Cosmos 477 667 Amps 739 Amps Canna 397.5 591 Amps 656 Amps Daisy 266 456 Amps 506 Amps
Rating based on 3.7 ft/sec wind speed, applicable only to high profile Valley receiving stations.
Table 5 (continued) Wire, AAC (All Aluminum Conductor - Ropelay Stranding)
Wire size (MCM) Ampacity (Summer) Ampacity (Winter) 1272 1291 Amps 1430 Amps
Wire, Copper
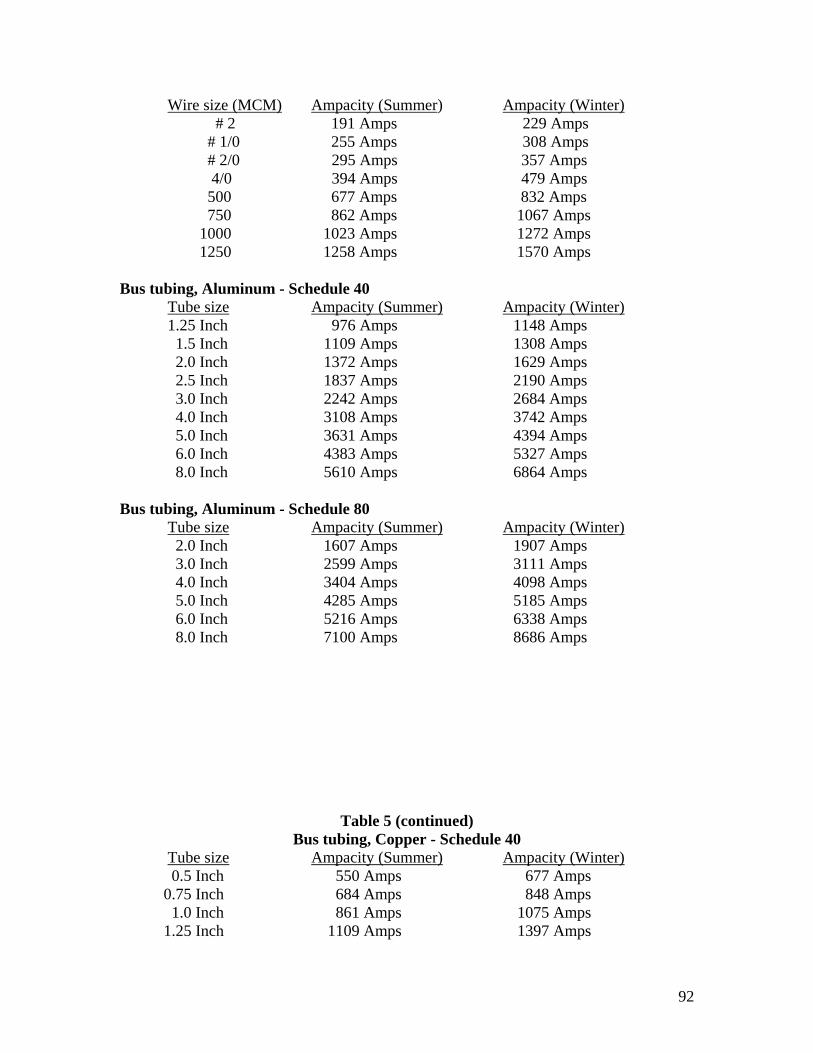
92
Wire size (MCM) Ampacity (Summer) Ampacity (Winter) # 2 191 Amps 229 Amps
# 1/0 255 Amps 308 Amps # 2/0 295 Amps 357 Amps
4/0 394 Amps 479 Amps 500 677 Amps 832 Amps 750 862 Amps 1067 Amps 1000 1023 Amps 1272 Amps 1250 1258 Amps 1570 Amps Bus tubing, Aluminum - Schedule 40
Tube size Ampacity (Summer) Ampacity (Winter) 1.25 Inch 976 Amps 1148 Amps 1.5 Inch 1109 Amps 1308 Amps 2.0 Inch 1372 Amps 1629 Amps 2.5 Inch 1837 Amps 2190 Amps 3.0 Inch 2242 Amps 2684 Amps 4.0 Inch 3108 Amps 3742 Amps 5.0 Inch 3631 Amps 4394 Amps 6.0 Inch 4383 Amps 5327 Amps 8.0 Inch 5610 Amps 6864 Amps Bus tubing, Aluminum - Schedule 80
Tube size Ampacity (Summer) Ampacity (Winter) 2.0 Inch 1607 Amps 1907 Amps 3.0 Inch 2599 Amps 3111 Amps 4.0 Inch 3404 Amps 4098 Amps 5.0 Inch 4285 Amps 5185 Amps 6.0 Inch 5216 Amps 6338 Amps 8.0 Inch 7100 Amps 8686 Amps
Table 5 (continued)
Bus tubing, Copper - Schedule 40 Tube size Ampacity (Summer) Ampacity (Winter)
0.5 Inch 550 Amps 677 Amps 0.75 Inch 684 Amps 848 Amps 1.0 Inch 861 Amps 1075 Amps 1.25 Inch 1109 Amps 1397 Amps

93
1.5 Inch 1249 Amps 1581 Amps 2.0 Inch 1530 Amps 1957 Amps 2.5 Inch 1948 Amps 2508 Amps 3.0 Inch 2481 Amps 3219 Amps 4.0 Inch 3258 Amps 4270 Amps Bus tubing, Copper - Schedule 80
Tube size Ampacity (Summer) Ampacity (Winter) 1.0 Inch 1009 Amps 1260 Amps 1.5 Inch 1435 Amps 1817 Amps 2.0 Inch 1791 Amps 2290 Amps 3.0 Inch 2681 Amps 3738 Amps 4.0 Inch 3762 Amps 4931 Amps These tables are based on the following conditions and assumptions: 1. Temperature – AAC Conductor Maximum: 200° F (93.3° C)
Cu Conductor Maximum: 176° F (80° C) Summer ambient: 113° F (45° C) Winter ambient: 82° F (27.8° C)
2. Latitude - 33 degrees north 3. Elevation - 1,000 feet 4. Wind velocity - 7200 ft/hr. (1.4 mi./hr.) 5. Time - 17:00 6. Coefficient of emissivity - 0.5 (aged conductor) 7. Coefficient of solar absorption - 0.5 (aged conductor) 8. The solar heat gain was determined when the solar and conductor azimuths were
perpendicular. 9. Calculation method – Consistent with IEEE Std. 738 10. Aluminum resistance values from the Aluminum Association handbook 1998 11. Aluminum conductor is 1350 alloy, aluminum tube is 6063 alloy 12. Copper resistance values from the Hubbell Anderson Data book 1990 13. Copper tube is hard drawn Notes: 1. For elevations more than 1000 feet above sea level, the table values are to be
derated by 1% per 1,000 feet. 2. Aged conductor is conductor that has been installed two to three years. 3. Summer ratings should be used from May 1 until November 1 unless the high
ambient temperature exceeds 95 oF for 3 consecutive days prior to May 1.

94
4. Winter ratings should be used from November 1 until May 1 unless the high temperature is below 83oF for 3 consecutive days prior to November 1.
Table 6 Substation Disconnect Switch Current Ratings (Amps)
ACCC Rating D06 (most switches since 1979) Ambient SWITCH RATING (AMPS)

95
Rating Type oC oF Nominal Rating 600 1200 1600 2000 2500 3000
Summer Normal (2) 40 104 647 1294 1725 2157 2696 3235 Summer Emergency 45 113 738 1476 1968 2460 3075 3690
Winter Normal 27.8 83 722 1443 1924 2405 3007 3608 Winter Emergency 33.3 93 792 1584 2112 2640 3300 3960
ACCC Rating D04 (some switches since 1979)
Ambient Rating Type oC oF SWITCH RATING (AMPS)
Nominal Rating 600 1200 1600 2000 2500 3000 Summer Normal (2) 40 104 624 1248 1664 2080 2599 3119 Summer Emergency 45 113 732 1464 1952 2440 3050 3660
Winter Normal 27.8 83 713 1425 1900 2376 2969 3563 Winter Emergency 33.3 93 804 1608 2144 2680 3350 4020
ACCC Rating D01 (all disconnects in ANSI class per C37.30-1962) Ambient
Rating Type oC oF SWITCH RATING (AMPS) Nominal Rating 600 1200 1600 2000 2500 3000
Summer Normal (2) 40 104 600 1200 1600 2000 2500 3000 Summer Emergency 45 113 738 1476 1968 2460 3075 3690
Winter Normal 27.8 83 712 1423 1898 2372 2965 3558 Winter Emergency 33.3 93 828 1656 2208 2760 3450 4140
Notes: 1. ACCC = Allowable Continuous Current Class in ANSI C37.37-1979. 2. Normal ratings are based on continuous loading. Emergency ratings are based on two
hour maximum loading per event. 3. ANSI C37.37-1979, Section 4.5, Item 1 - Loadability factors greater than unity should be
applied only to new switches and switches that have been properly maintained in order that they can carry rated continuous current without exceeding their limit of observable temperature rise.
4. Individual switch rating data is being incorporated in the ESEINFO database. For switches not yet included, most switches purchased since 1979 have ACCC rating D06. The D06 ratings should be applied for switches with known manufacture dates of 1979 or later. Most other switches should use the A01 ratings.
5. The following corrections for high altitude should be applied: 3300 feet to 4000 feet: 0.995 times rating in table 4000 feet to 5000 feet: 0.9 times rating in table
Table 7 Maximum Steady State Voltage
BACKGROUND:
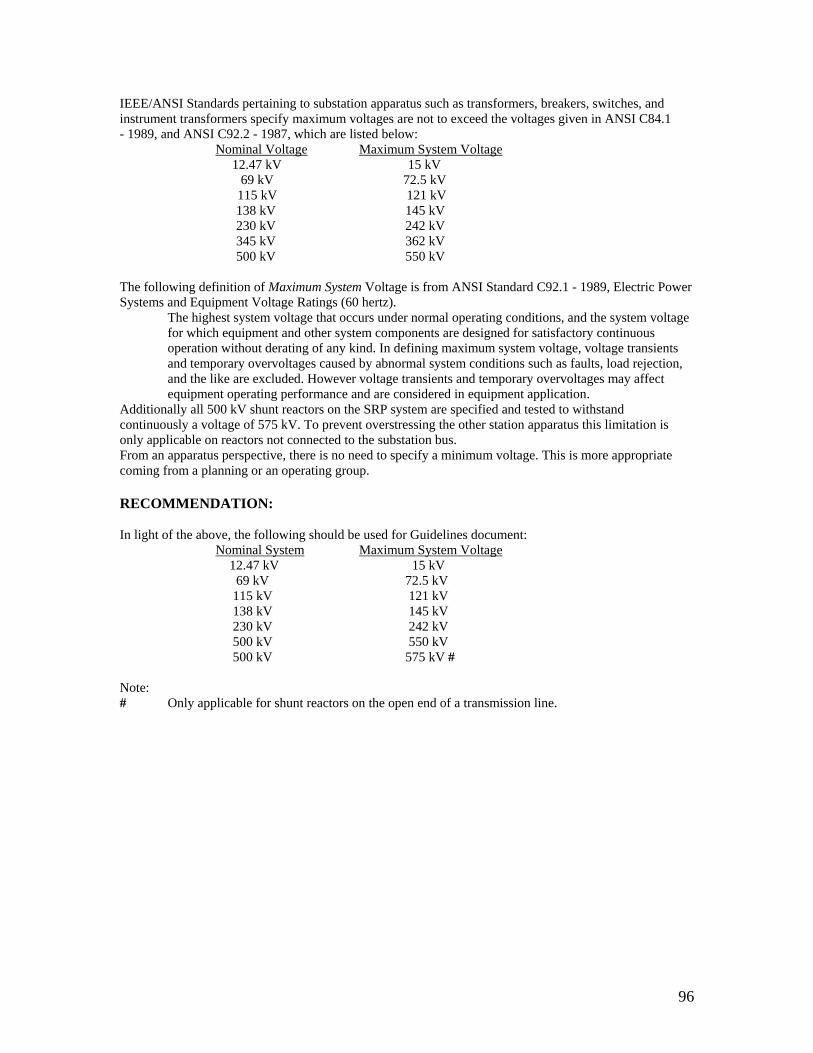
96
IEEE/ANSI Standards pertaining to substation apparatus such as transformers, breakers, switches, and instrument transformers specify maximum voltages are not to exceed the voltages given in ANSI C84.1 - 1989, and ANSI C92.2 - 1987, which are listed below:
Nominal Voltage Maximum System Voltage 12.47 kV 15 kV
69 kV 72.5 kV 115 kV 121 kV
138 kV 145 kV 230 kV 242 kV 345 kV 362 kV 500 kV 550 kV The following definition of Maximum System Voltage is from ANSI Standard C92.1 - 1989, Electric Power Systems and Equipment Voltage Ratings (60 hertz).
The highest system voltage that occurs under normal operating conditions, and the system voltage for which equipment and other system components are designed for satisfactory continuous operation without derating of any kind. In defining maximum system voltage, voltage transients and temporary overvoltages caused by abnormal system conditions such as faults, load rejection, and the like are excluded. However voltage transients and temporary overvoltages may affect equipment operating performance and are considered in equipment application.
Additionally all 500 kV shunt reactors on the SRP system are specified and tested to withstand continuously a voltage of 575 kV. To prevent overstressing the other station apparatus this limitation is only applicable on reactors not connected to the substation bus. From an apparatus perspective, there is no need to specify a minimum voltage. This is more appropriate coming from a planning or an operating group. RECOMMENDATION: In light of the above, the following should be used for Guidelines document:
Nominal System Maximum System Voltage 12.47 kV 15 kV 69 kV 72.5 kV 115 kV 121 kV 138 kV 145 kV 230 kV 242 kV 500 kV 550 kV 500 kV 575 kV # Note: # Only applicable for shunt reactors on the open end of a transmission line.