gulf states policy institute - rand corporation to determine the extent of the damage and recommend...
TRANSCRIPT

This document and trademark(s) contained herein are protected by law as indicated in a notice appearing later in this work. This electronic representation of RAND intellectual property is provided for non-commercial use only. Unauthorized posting of RAND PDFs to a non-RAND Web site is prohibited. RAND PDFs are protected under copyright law. Permission is required from RAND to reproduce, or reuse in another form, any of our research documents for commercial use. For information on reprint and linking permissions, please see RAND Permissions.
Limited Electronic Distribution Rights
This PDF document was made available from www.rand.org as a public
service of the RAND Corporation.
6Jump down to document
THE ARTS
CHILD POLICY
CIVIL JUSTICE
EDUCATION
ENERGY AND ENVIRONMENT
HEALTH AND HEALTH CARE
INTERNATIONAL AFFAIRS
NATIONAL SECURITY
POPULATION AND AGING
PUBLIC SAFETY
SCIENCE AND TECHNOLOGY
SUBSTANCE ABUSE
TERRORISM AND HOMELAND SECURITY
TRANSPORTATION ANDINFRASTRUCTURE
WORKFORCE AND WORKPLACE
The RAND Corporation is a nonprofit research organization providing objective analysis and effective solutions that address the challenges facing the public and private sectors around the world.
Visit RAND at www.rand.org
Explore the RAND Gulf States Policy Institute
View document details
For More Information
GULF STATES POLICY INSTITUTE
A study by RAND Infrastructure, Safety, and Environment
Purchase this document
Browse Books & Publications
Make a charitable contribution
Support RAND

This product is part of the RAND Corporation technical report series. Reports may
include research findings on a specific topic that is limited in scope; present discus-
sions of the methodology employed in research; provide literature reviews, survey
instruments, modeling exercises, guidelines for practitioners and research profes-
sionals, and supporting documentation; or deliver preliminary findings. All RAND
reports undergo rigorous peer review to ensure that they meet high standards for re-
search quality and objectivity.

Post-Katrina Recovery of the Housing Market Along the Mississippi Gulf Coast
Kevin F. McCarthy, Mark Hanson
Supported by Oxfam America, the Foundation for the Mid South, the Mississippi Association of REALTORS®, and the National Association of REALTORS
GULF STATES POLICY INSTITUTE
A study by RAND Infrastructure, Safety, and Environment

The RAND Corporation is a nonprofit research organization providing objective analysis and effective solutions that address the challenges facing the public and private sectors around the world. RAND’s publications do not necessarily ref lect the opinions of its research clients and sponsors.
R® is a registered trademark.
© Copyright 2008 RAND Corporation
All rights reserved. No part of this book may be reproduced in any form by any electronic or mechanical means (including photocopying, recording, or information storage and retrieval) without permission in writing from RAND.
Published 2008 by the RAND Corporation1776 Main Street, P.O. Box 2138, Santa Monica, CA 90407-2138
1200 South Hayes Street, Arlington, VA 22202-50504570 Fifth Avenue, Suite 600, Pittsburgh, PA 15213-2665
RAND URL: http://www.rand.orgTo order RAND documents or to obtain additional information, contact
Distribution Services: Telephone: (310) 451-7002; Fax: (310) 451-6915; Email: [email protected]
This research was sponsored by Oxfam America, the Foundation for the Mid South, the Mississippi Association of REALTORS®, and the National Association of REALTORS and was conducted within the RAND Gulf States Policy Institute (RGSPI)—a partnership involving the RAND Corporation and seven universities in the Gulf of Mexico coastal region.
Library of Congress Cataloging-in-Publication Data
McCarthy, Kevin F., 1945- Post-Katrina recovery of the housing market along the Mississippi Gulf Coast / Kevin F. McCarthy, Mark Hanson. p. cm. Includes bibliographical references. ISBN 978-0-8330-4293-4 (pbk. : alk. paper) 1. Housing—Mississippi—Gulf Coast. 2. Housing development—Mississippi—Gulf Coast. 3. Hurricane Katrina, 2005—Economic aspects. I. Hanson, Mark, 1966– II. Rand Corporation. III. Title.
HD7303.M7M25 2007 333.33'8097621—dc22
2007040839

iii
Preface
In August 2005, Hurricane Katrina devastated the U.S. Gulf Coast, inflicting major damage to commercial property, infrastructure, and housing within the region. The hurricane’s effects, however, were most pronounced in a half a dozen counties that included Mississippi’s three coastal counties: Hancock, Harrison, and Jackson. As part of the state’s recovery effort, Mis-sissippi Governor Haley Barbour appointed the Commission on Recovery, Rebuilding, and Renewal to determine the extent of the damage and recommend policies to aid its recovery.
The RAND Gulf States Policy Institute (RGSPI)—a partnership involving the RAND Corporation and seven universities in the Gulf of Mexico coastal region—served as advi-sors to the commission. Because the full extent of the damage and the specific effects on the Gulf of Mexico coastal housing market remained unclear during the course of the commis-sion’s work, one of RGSPI’s recommendations was for a more detailed study of the housing market and what might be done to promote its recovery. In summer and fall 2006, a group of sponsors—Oxfam America, the Foundation for the Mid South, a private donor, the Missis-sippi Association of REALTORS®, and the National Association of REALTORS—sponsored RAND to conduct that study.
This report has several objectives, including the following:
to describe the structure of the housing market in the three countiesto estimate the damage done to the housing marketto assess the status of repair and rebuilding effortsto identify major bottlenecks facing the recovery process.
Although two years have now passed since Katrina, this is the first comprehensive, quan-titative assessment of both the extent and nature of the damage the storm did to the housing stock and the progress that has been made toward recovery. As such, it provides a needed stock-taking for the public, policymakers, and others involved in the housing-recovery effort by pro-viding an assessment of what has been done. In addition, by identifying which segments of the market’s recovery appear to be lagging, the report suggests where additional resources might be most needed and effective. Finally, Katrina was not the first major hurricane to devastate the area in recent memory (Camille, a category 5 hurricane when it made landfall, struck in 1969), nor is it likely to be the last. This report considers the lessons that the Katrina experience may offer not just for the current recovery effort but also for mitigating the damage that might be done in future storms.
A valuable supplement to the analysis in this report would be an exploration of why recov-ery rates differ so substantially across the jurisdictions affected by Katrina and its aftermath.

iv Post-Katrina Recovery of the Housing Market Along the Mississippi Gulf Coast
Approximately 98 percent of the housing units severely damaged by Katrina were in Louisiana and Mississippi, and the vast majority of those units were either in the New Orleans metropoli-tan area or in the three Mississippi counties along the coast. While beyond the scope of this study, such a comparative analysis would provide further guidance to policymakers about how to steer toward more successful and sustainable recovery.
This report has been revised from its prepublication online version to include changes to some of the tables and figures, as well as an additional section in the appendix.
The RAND Gulf States Policy Institute
RGSPI is a collaboration among RAND and seven universities (Jackson State University, Tulane University, Tuskegee University, University of New Orleans, University of South Ala-bama, University of Southern Mississippi, and Xavier University) to develop a long-term vision and strategy to help build a better future for Louisiana, Mississippi, and Alabama in the wake of hurricanes Katrina and Rita. RGSPI’s mission is to support a safer, more equitable, and more prosperous future for the Gulf of Mexico region by providing officials from the government, nonprofit organizations, and the private sector with relevant policy analysis of the highest caliber.
RGSPI is housed at the RAND Corporation, an international nonprofit research organi-zation with a reputation for rigorous and objective analysis and effective solutions.
For additional information about RGPSI, contact its director:
George PenickRAND Gulf States Policy InstituteP.O. Box 3788Jackson, MS [email protected]
For a profile of RGSPI, see http://www.rand.org/about/katrina.html. More information about RAND is available at http://www.rand.org.

v
Contents
Preface . . . . . . . . . . . . . . . . . . . . . . . . . . . . . . . . . . . . . . . . . . . . . . . . . . . . . . . . . . . . . . . . . . . . . . . . . . . . . . . . . . . . . . . . . . . . . . . . . . . . . . . . . . . iiiFigures . . . . . . . . . . . . . . . . . . . . . . . . . . . . . . . . . . . . . . . . . . . . . . . . . . . . . . . . . . . . . . . . . . . . . . . . . . . . . . . . . . . . . . . . . . . . . . . . . . . . . . . . . . . viiTables . . . . . . . . . . . . . . . . . . . . . . . . . . . . . . . . . . . . . . . . . . . . . . . . . . . . . . . . . . . . . . . . . . . . . . . . . . . . . . . . . . . . . . . . . . . . . . . . . . . . . . . . . . . . ixSummary . . . . . . . . . . . . . . . . . . . . . . . . . . . . . . . . . . . . . . . . . . . . . . . . . . . . . . . . . . . . . . . . . . . . . . . . . . . . . . . . . . . . . . . . . . . . . . . . . . . . . . . . xiAcknowledgments . . . . . . . . . . . . . . . . . . . . . . . . . . . . . . . . . . . . . . . . . . . . . . . . . . . . . . . . . . . . . . . . . . . . . . . . . . . . . . . . . . . . . . . . . . . . . xvAbbreviations . . . . . . . . . . . . . . . . . . . . . . . . . . . . . . . . . . . . . . . . . . . . . . . . . . . . . . . . . . . . . . . . . . . . . . . . . . . . . . . . . . . . . . . . . . . . . . . . . xvii
CHAPTER ONE
Introduction . . . . . . . . . . . . . . . . . . . . . . . . . . . . . . . . . . . . . . . . . . . . . . . . . . . . . . . . . . . . . . . . . . . . . . . . . . . . . . . . . . . . . . . . . . . . . . . . . . . . . 1Study Purpose . . . . . . . . . . . . . . . . . . . . . . . . . . . . . . . . . . . . . . . . . . . . . . . . . . . . . . . . . . . . . . . . . . . . . . . . . . . . . . . . . . . . . . . . . . . . . . . . . . . . 2Data and Methods . . . . . . . . . . . . . . . . . . . . . . . . . . . . . . . . . . . . . . . . . . . . . . . . . . . . . . . . . . . . . . . . . . . . . . . . . . . . . . . . . . . . . . . . . . . . . . . 2Organization of This Report . . . . . . . . . . . . . . . . . . . . . . . . . . . . . . . . . . . . . . . . . . . . . . . . . . . . . . . . . . . . . . . . . . . . . . . . . . . . . . . . . . . . 3
CHAPTER TWO
Profile of the Pre-Katrina Housing Market . . . . . . . . . . . . . . . . . . . . . . . . . . . . . . . . . . . . . . . . . . . . . . . . . . . . . . . . . . . . . . . . 5Sociodemographic Background: How the Counties Differ from the Rest of Mississippi . . . . . . . . . . . . . . . 5Differences Among the Counties . . . . . . . . . . . . . . . . . . . . . . . . . . . . . . . . . . . . . . . . . . . . . . . . . . . . . . . . . . . . . . . . . . . . . . . . . . . . . . 7Detailed Analysis of the Housing Market. . . . . . . . . . . . . . . . . . . . . . . . . . . . . . . . . . . . . . . . . . . . . . . . . . . . . . . . . . . . . . . . . . . . . 8
Profile of Housing Stock . . . . . . . . . . . . . . . . . . . . . . . . . . . . . . . . . . . . . . . . . . . . . . . . . . . . . . . . . . . . . . . . . . . . . . . . . . . . . . . . . . . . . . 8Geographic Distribution of Housing Stock. . . . . . . . . . . . . . . . . . . . . . . . . . . . . . . . . . . . . . . . . . . . . . . . . . . . . . . . . . . . . . . . . 9
Submarket Analysis . . . . . . . . . . . . . . . . . . . . . . . . . . . . . . . . . . . . . . . . . . . . . . . . . . . . . . . . . . . . . . . . . . . . . . . . . . . . . . . . . . . . . . . . . . . . . 12Submarket Characteristics . . . . . . . . . . . . . . . . . . . . . . . . . . . . . . . . . . . . . . . . . . . . . . . . . . . . . . . . . . . . . . . . . . . . . . . . . . . . . . . . . . . 14Household Characteristics by Submarket . . . . . . . . . . . . . . . . . . . . . . . . . . . . . . . . . . . . . . . . . . . . . . . . . . . . . . . . . . . . . . . . . . 17
Affordability Prior to Katrina . . . . . . . . . . . . . . . . . . . . . . . . . . . . . . . . . . . . . . . . . . . . . . . . . . . . . . . . . . . . . . . . . . . . . . . . . . . . . . . . . . 19Summary . . . . . . . . . . . . . . . . . . . . . . . . . . . . . . . . . . . . . . . . . . . . . . . . . . . . . . . . . . . . . . . . . . . . . . . . . . . . . . . . . . . . . . . . . . . . . . . . . . . . . . . . . 19
CHAPTER THREE
Damage Done to Housing Stock . . . . . . . . . . . . . . . . . . . . . . . . . . . . . . . . . . . . . . . . . . . . . . . . . . . . . . . . . . . . . . . . . . . . . . . . . . . . 21Introduction . . . . . . . . . . . . . . . . . . . . . . . . . . . . . . . . . . . . . . . . . . . . . . . . . . . . . . . . . . . . . . . . . . . . . . . . . . . . . . . . . . . . . . . . . . . . . . . . . . . . . 21Sources and Extent of Damage: Data and Approach . . . . . . . . . . . . . . . . . . . . . . . . . . . . . . . . . . . . . . . . . . . . . . . . . . . . . . . 21Sources and Extent of Damage: Overall Findings . . . . . . . . . . . . . . . . . . . . . . . . . . . . . . . . . . . . . . . . . . . . . . . . . . . . . . . . . 23Sources and Extent of Damage: Location . . . . . . . . . . . . . . . . . . . . . . . . . . . . . . . . . . . . . . . . . . . . . . . . . . . . . . . . . . . . . . . . . . . 24Damage by Housing Submarket . . . . . . . . . . . . . . . . . . . . . . . . . . . . . . . . . . . . . . . . . . . . . . . . . . . . . . . . . . . . . . . . . . . . . . . . . . . . . 28Damage to the Affordable Housing Stock . . . . . . . . . . . . . . . . . . . . . . . . . . . . . . . . . . . . . . . . . . . . . . . . . . . . . . . . . . . . . . . . . . 30Cost of Repair . . . . . . . . . . . . . . . . . . . . . . . . . . . . . . . . . . . . . . . . . . . . . . . . . . . . . . . . . . . . . . . . . . . . . . . . . . . . . . . . . . . . . . . . . . . . . . . . . . . 31

vi Post-Katrina Recovery of the Housing Market Along the Mississippi Gulf Coast
CHAPTER FOUR
Progress of Recovery . . . . . . . . . . . . . . . . . . . . . . . . . . . . . . . . . . . . . . . . . . . . . . . . . . . . . . . . . . . . . . . . . . . . . . . . . . . . . . . . . . . . . . . . . . 35Introduction . . . . . . . . . . . . . . . . . . . . . . . . . . . . . . . . . . . . . . . . . . . . . . . . . . . . . . . . . . . . . . . . . . . . . . . . . . . . . . . . . . . . . . . . . . . . . . . . . . . . . 35Data Sources and Approach . . . . . . . . . . . . . . . . . . . . . . . . . . . . . . . . . . . . . . . . . . . . . . . . . . . . . . . . . . . . . . . . . . . . . . . . . . . . . . . . . . . 35Progress of Recovery Efforts . . . . . . . . . . . . . . . . . . . . . . . . . . . . . . . . . . . . . . . . . . . . . . . . . . . . . . . . . . . . . . . . . . . . . . . . . . . . . . . . . . . 37Summary of Key Recovery Findings . . . . . . . . . . . . . . . . . . . . . . . . . . . . . . . . . . . . . . . . . . . . . . . . . . . . . . . . . . . . . . . . . . . . . . . . 46
CHAPTER FIVE
Key Issues . . . . . . . . . . . . . . . . . . . . . . . . . . . . . . . . . . . . . . . . . . . . . . . . . . . . . . . . . . . . . . . . . . . . . . . . . . . . . . . . . . . . . . . . . . . . . . . . . . . . . . . 47Introduction . . . . . . . . . . . . . . . . . . . . . . . . . . . . . . . . . . . . . . . . . . . . . . . . . . . . . . . . . . . . . . . . . . . . . . . . . . . . . . . . . . . . . . . . . . . . . . . . . . . . . 47General Considerations . . . . . . . . . . . . . . . . . . . . . . . . . . . . . . . . . . . . . . . . . . . . . . . . . . . . . . . . . . . . . . . . . . . . . . . . . . . . . . . . . . . . . . . . 48Short-Term Recovery Issues . . . . . . . . . . . . . . . . . . . . . . . . . . . . . . . . . . . . . . . . . . . . . . . . . . . . . . . . . . . . . . . . . . . . . . . . . . . . . . . . . . . . 51
Construction Capacity . . . . . . . . . . . . . . . . . . . . . . . . . . . . . . . . . . . . . . . . . . . . . . . . . . . . . . . . . . . . . . . . . . . . . . . . . . . . . . . . . . . . . . . 51Financing . . . . . . . . . . . . . . . . . . . . . . . . . . . . . . . . . . . . . . . . . . . . . . . . . . . . . . . . . . . . . . . . . . . . . . . . . . . . . . . . . . . . . . . . . . . . . . . . . . . . . . 52
Insurance . . . . . . . . . . . . . . . . . . . . . . . . . . . . . . . . . . . . . . . . . . . . . . . . . . . . . . . . . . . . . . . . . . . . . . . . . . . . . . . . . . . . . . . . . . . . . . . . . . . . . . . . . 52Grants . . . . . . . . . . . . . . . . . . . . . . . . . . . . . . . . . . . . . . . . . . . . . . . . . . . . . . . . . . . . . . . . . . . . . . . . . . . . . . . . . . . . . . . . . . . . . . . . . . . . . . . . . . . 54Loans . . . . . . . . . . . . . . . . . . . . . . . . . . . . . . . . . . . . . . . . . . . . . . . . . . . . . . . . . . . . . . . . . . . . . . . . . . . . . . . . . . . . . . . . . . . . . . . . . . . . . . . . . . . . . 55Other . . . . . . . . . . . . . . . . . . . . . . . . . . . . . . . . . . . . . . . . . . . . . . . . . . . . . . . . . . . . . . . . . . . . . . . . . . . . . . . . . . . . . . . . . . . . . . . . . . . . . . . . . . . . . 57
Financing Summary . . . . . . . . . . . . . . . . . . . . . . . . . . . . . . . . . . . . . . . . . . . . . . . . . . . . . . . . . . . . . . . . . . . . . . . . . . . . . . . . . . . . . . . . . . 58The Supply of Available Housing . . . . . . . . . . . . . . . . . . . . . . . . . . . . . . . . . . . . . . . . . . . . . . . . . . . . . . . . . . . . . . . . . . . . . . . . . . . 58Long-Term Considerations . . . . . . . . . . . . . . . . . . . . . . . . . . . . . . . . . . . . . . . . . . . . . . . . . . . . . . . . . . . . . . . . . . . . . . . . . . . . . . . . . . 60
APPENDIX
Methodology . . . . . . . . . . . . . . . . . . . . . . . . . . . . . . . . . . . . . . . . . . . . . . . . . . . . . . . . . . . . . . . . . . . . . . . . . . . . . . . . . . . . . . . . . . . . . . . . . . . 65
References . . . . . . . . . . . . . . . . . . . . . . . . . . . . . . . . . . . . . . . . . . . . . . . . . . . . . . . . . . . . . . . . . . . . . . . . . . . . . . . . . . . . . . . . . . . . . . . . . . . . . . . 79

vii
Figures
2.1. Distribution of Housing Units Across the Three-County Area . . . . . . . . . . . . . . . . . . . . . . . . . . . . . . 10 2.2. Distribution of Housing Units, by Coastal Adjacency and Jurisdiction . . . . . . . . . . . . . . . . . . . . 11 2.3. Distribution of Owner- and Renter-Occupied Units, by County and Geographic
Area . . . . . . . . . . . . . . . . . . . . . . . . . . . . . . . . . . . . . . . . . . . . . . . . . . . . . . . . . . . . . . . . . . . . . . . . . . . . . . . . . . . . . . . . . . . . . . . . . . 12 2.4. Distribution of Renter- and Owner-Occupied Housing Units for the 10 Coastal
Cities . . . . . . . . . . . . . . . . . . . . . . . . . . . . . . . . . . . . . . . . . . . . . . . . . . . . . . . . . . . . . . . . . . . . . . . . . . . . . . . . . . . . . . . . . . . . . . . . 14 2.5. Race of Household Head, by Tenure . . . . . . . . . . . . . . . . . . . . . . . . . . . . . . . . . . . . . . . . . . . . . . . . . . . . . . . . . . . . 17 2.6. Homeowner and Renter Incomes . . . . . . . . . . . . . . . . . . . . . . . . . . . . . . . . . . . . . . . . . . . . . . . . . . . . . . . . . . . . . . . . 18 2.7. Owner and Renter Spending on Housing . . . . . . . . . . . . . . . . . . . . . . . . . . . . . . . . . . . . . . . . . . . . . . . . . . . . . . 18 3.1. Extent by Source of Damage . . . . . . . . . . . . . . . . . . . . . . . . . . . . . . . . . . . . . . . . . . . . . . . . . . . . . . . . . . . . . . . . . . . . 23 3.2. Storm Surge and Flooding, by Location and Jurisdiction . . . . . . . . . . . . . . . . . . . . . . . . . . . . . . . . . . . . 25 3.3. Severity of Damage . . . . . . . . . . . . . . . . . . . . . . . . . . . . . . . . . . . . . . . . . . . . . . . . . . . . . . . . . . . . . . . . . . . . . . . . . . . . . . . 26 4.1. Relative Rates of Damage and Permit-to-Damage Ratios for the 10 Coastal Cities . . . . . . 40


ix
Tables
2.1. Counties’ Demographic Characteristics . . . . . . . . . . . . . . . . . . . . . . . . . . . . . . . . . . . . . . . . . . . . . . . . . . . . . . . . . 7 2.2. Characteristics of the Pre-Katrina Housing Stock in Coastal Counties . . . . . . . . . . . . . . . . . . . . . 8 2.3. Distribution of Units, by County, Tenure, and Structure Type (%) . . . . . . . . . . . . . . . . . . . . . . . . . . 9 2.4. Housing Units by Tenure, Jurisdiction, and County . . . . . . . . . . . . . . . . . . . . . . . . . . . . . . . . . . . . . . . . . . 13 2.5. Distribution of Owner-Occupied Units, by Submarket and County . . . . . . . . . . . . . . . . . . . . . . . 15 2.6. Distribution of Rental Units, by Submarket and County . . . . . . . . . . . . . . . . . . . . . . . . . . . . . . . . . . . . 15 2.7. Distribution of Owner Units, by Submarket and Proximity to Coast . . . . . . . . . . . . . . . . . . . . . . 16 2.8. Distribution of Rental Units, by Submarket and Proximity to Coast . . . . . . . . . . . . . . . . . . . . . . . 16 2.9. Estimate of the Demand for Affordable Housing Units . . . . . . . . . . . . . . . . . . . . . . . . . . . . . . . . . . . . . 20 3.1. Geographic Scope and Severity of Damage to Housing Stock, by County and
Jurisdiction . . . . . . . . . . . . . . . . . . . . . . . . . . . . . . . . . . . . . . . . . . . . . . . . . . . . . . . . . . . . . . . . . . . . . . . . . . . . . . . . . . . . . . . . 27 3.2. Housing Damage: Extent and Severity, by Tenure and Structure Type . . . . . . . . . . . . . . . . . . . 28 3.3. Housing Damage: Extent and Severity, by Value Quartile . . . . . . . . . . . . . . . . . . . . . . . . . . . . . . . . . . . 29 3.4. Housing Damage: Extent and Severity, by Rent Tercile . . . . . . . . . . . . . . . . . . . . . . . . . . . . . . . . . . . . . . 29 3.5. Affordable Rental Housing Stock: Pre- and Post-Katrina . . . . . . . . . . . . . . . . . . . . . . . . . . . . . . . . . . . 30 3.6. Estimated Repair Costs . . . . . . . . . . . . . . . . . . . . . . . . . . . . . . . . . . . . . . . . . . . . . . . . . . . . . . . . . . . . . . . . . . . . . . . . . . . 32 4.1. Comparison of Key Features of Building Permit and Treen Data Sets . . . . . . . . . . . . . . . . . . . . 36 4.2. Comparison of Building Permits Issued to Damaged Units, by Jurisdiction and
Damage Level (Fourth Quarter of 2005 Through Second Quarter of 2006) . . . . . . . . . . . . . 38 4.3. Timing of Recovery, by Type of Property and Activity . . . . . . . . . . . . . . . . . . . . . . . . . . . . . . . . . . . . . . . 41 4.4. Comparison of Permits Issued to Damaged Units, by Category . . . . . . . . . . . . . . . . . . . . . . . . . . . . 42 4.5. Value of Permits, by Structure Type and Date of Permit . . . . . . . . . . . . . . . . . . . . . . . . . . . . . . . . . . . . 44 A.1. Occupied and Damaged Units, by Type and Tenure. . . . . . . . . . . . . . . . . . . . . . . . . . . . . . . . . . . . . . . . . . 74 A.2. Total Damage, by Source, According to FEMA, SBA, and HUD (2006) . . . . . . . . . . . . . . . . . 75


xi
Summary
In the immediate aftermath of the devastation wrought by Hurricane Katrina, Mississippi Governor Haley Barbour appointed the Commission on Recovery, Rebuilding, and Renewal. The RAND Gulf States Policy Institute (RGSPI) served as an advisor to the housing compo-nent of that commission. When the commission reported its findings in December 2005, the extent of the damage done to the housing stock was still unclear. Moreover, it was still too early to assess the status of the recovery effort or to identify what problems, if any, might be affecting the recovery process. As a result, one of the commission’s recommendations was that a study be conducted to examine these issues. In summer 2006, RAND was funded to conduct such a study. Its objectives were first, to describe the state of the housing markets in Mississippi’s three coastal counties (Hancock, Harrison, and Jackson) prior to Katrina; second, to estimate the damage the storm did to their housing markets; third, to describe the status of the recovery effort; and fourth, to identify the problems that might inhibit that recovery.
Data availability and comparability were major issues for this analysis, because the scope of the research required (with the exception of the pre-Katrina analysis) near–real-time infor-mation on a diverse array of issues. In fact, several information sources were used (the 2000 Census [U.S. Census Bureau, 2007c] and the 2005 American Community Survey [U.S. Census Bureau, 2007d] for pre-Katrina descriptions of the population and the housing market; FEMA and U.S. Army Corps of Engineers (ACOE) data on the sources and extent of the damage done by Katrina; building-permit data on recovery; and an array of sources on various aspects of the potential obstacles to the recovery efforts). As a result, the analysis needed to deal with a variety of comparability issues related to the units of analysis, timing, and geographic scope. Our approach to these issues is discussed in the appendix.
The pre-Katrina description of the coastal area’s housing market served as a benchmark both for measuring the extent of the damage done by the storm and for assessing the state of the recovery effort. Prior to Katrina, 70 percent of the occupied housing stock was owner occupied—85 percent of which was single-family residences and 15 percent mobile homes. The remaining 30 percent of the stock (renter occupied) consisted of single-family residences (40 percent), units on multiunit properties (50 percent), and mobile homes (10 percent). Since 85 percent of the single-family units (owner and renter occupied) and 95 percent of the multiunit properties were located either immediately on the coast or in the next zone (coastal adjacent), they were particularly vulnerable to storm damage. Indeed, more than 60 percent of the rental stock was located in the region’s three largest cities (Gulfport, Biloxi, and Pascagoula), all of which are on the gulf, making the housing located there particularly vulnerable to the storm. The majority of mobile homes, on the other hand, were located in inland areas of the three counties and thus less exposed to the ravages of Katrina.

xii Post-Katrina Recovery of the Housing Market Along the Mississippi Gulf Coast
Although household incomes in the three counties are somewhat higher than in the rest of Mississippi, so are housing costs (market values for owner-occupied homes and monthly rents for rental units). As a result, housing affordability was a major issue prior to Katrina. Indeed, prior to Katrina, 40 percent of the renters were either spending more than one-third of their monthly incomes on housing (the U.S. Department of Housing and Urban Development [HUD] affordability standard) or were living in subsidized or public housing.
Katrina damaged about 60 percent of the three counties’ housing stock, but the extent and intensity of that damage varied substantially, depending on the source of that damage. Although 47 percent of all the damage to units was caused by wind or rain, the vast major-ity of that damage was of a limited nature (valued at $5,000 or less). Storm surge alone was responsible for about 35 percent of the damaged units, and almost half of those units suf-fered severe damage. Flooding rarely occurred by itself, but the combination of storm surge and flooding (experienced by about 16 percent of the damaged units) was by far the most devastating—more than 65 percent of those units were severely damage or destroyed.
Hancock County (where almost three-quarters of the housing stock was damaged) was the hardest hit by the storm, but the damage done in Harrison County (where more than 60 percent of the units were damaged) had the greatest effect on the housing market, because two-thirds of all units were located there. Slightly less than half of the units in Jackson County were damaged, but much of that damage was limited. Despite the widespread nature of the damage done to the housing stock throughout the region, there were significant differences in the extent and intensity of that damage in various submarkets. The most severely affected was the multifamily rental submarket—almost 80 percent of such units were damaged, and one-third of all multifamily rental units suffered severe or moderate damage (repairs averaging more than $50,000). About one-half of the single-family residences (owned and rented) suffered damage, and almost 20 percent of all single-family units were severely or moderately damaged. Although between 30 percent and 50 percent of owner-occupied and renter-occupied mobile homes, respectively, were damaged, that damage was less severe than in other submarkets.
Assessing the current state of recovery efforts is not straightforward, because there is no up-to-date source of information on those efforts. Our assessment is based on a comparison of information on building permits issued in the months immediately after the storm through the second quarter of 2007. These comparisons provide only an estimate of actual recovery and rebuilding, since they relate only to permits issued and not to construction completed or even necessarily begun. Overall, perhaps as many as 46,000 permits had been issued, com-pared with the approximately 77,000 damaged units. This overall rate of 60 percent, however, varies substantially across incorporated and unincorporated areas. (There are 11 incorporated municipalities.)
Our estimates reveal several important features of the recovery effort. First, they suggest that the recovery process got off to a slow start, as relatively few of the permits were issued in the fourth quarter of 2005. Although the pace of permits issued picked up substantially in the first and second quarters of 2006, it appeared to slow noticeably in the third and fourth quar-ters and then to rise again in the first two quarters of 2007. Second, the pace of recovery seems to have moved more rapidly in some submarkets than in others. In particular, the ratio of per-mits issued to damages appears higher for single-family than for multifamily units and higher for moderately than for severely damaged units. Third, the costs of repair appear high relative to the market values reported in the 2000 Census (U.S. Census Bureau, 2007c). Fourth, at the

Summary xiii
current pace, it appears that recovery will take at least another two to three years. Finally, it seems certain that the final costs of the recovery effort will exceed $4 billion.
Based on our analysis, we have identified three sets of issues that will affect the recov-ery effort: The first includes a series of general considerations about the recovery process; the second involves three critical issues facing the short-term recovery effort; and the third includes a set of longer-term issues.
In light of the scope of the damage that Katrina did to the housing market and the enormity of the recovery effort, public and private decisionmakers might well keep three con-siderations in mind. First, although pressures to expedite the recovery effort are likely to be pronounced, it is important to recognize the potential tensions between the short-term goal of a speedy recovery and the need to take mitigation measures to protect the region from future storms. Second, although probably obvious, the range of resources needed for recovery is huge and will include not just labor and materials but also the organizational skills to coordinate the efforts of the diverse range of public, private, and nongovernmental organizations involved in this process. Since public expectations, perceptions of progress, and the reality of the situa-tion may well differ, broad dissemination of accurate information about what is happening and inclusion of the various parties involved in decisions about the process may be very important to promoting cooperation in the recovery effort. Finally, the scope of the damage that Katrina did was very broad and included damage not just to the housing stock but also to the region’s economy, infrastructure, and public sector. Recovery in the various areas will be interrelated and should not proceed independently.
In addition, our analysis of the short-term recovery effort indicates that three issues will be critical to that effort: first, the capacity of the construction sector; second, the availability of funds to finance recovery; and third, providing an adequate supply of housing, especially affordable housing, to those whom the storm displaced from their residences.
Although the construction sector has geared up its capacity to deal with increased demand, there are signs (construction employment levels and sales of building materials) that the sector’s capacity may have peaked by the third quarter of 2006. Additional steps may need to be taken to deal with continued demand.
Despite the availability of multiple sources (insurance, government grants and loans, and various special tax incentives) with which to finance recovery, a rapid increase in housing values and high rebuilding costs appear to have left gaps in the financing picture. This situa-tion appears to be most acute for those who were un- and underinsured, those whose proper-ties were most severely damaged, and landlords—especially those with large, multiunit rental properties.
Finally, the very tight market for affordable housing pre-Katrina, the loss of a significant portion of the rental stock, a 20 percent increase in rents, and a substantial drop in employment, have created a very tight market for those households that the storm displaced. This problem is particularly acute in the affordable-rental sector. Alleviating this problem is important not just to the recovery of the housing market but also to economic recovery more generally.
Although there is evidence that both state and local officials are aware of the need to consider longer-term mitigation efforts to protect the region from future hurricanes, the expe-rience after Hurricane Camille, the last devastating hurricane to hit the U.S. Gulf Coast, sug-gests that following through on these intentions often requires considerable resolve. Indeed, as the recovery period after storms lengthens, political pressures may well increase to expedite

xiv Post-Katrina Recovery of the Housing Market Along the Mississippi Gulf Coast
the recovery, even at the cost of longer-term mitigation efforts. Such pressures may be difficult to resist, given the political context of local planning decisions.
However, a recent study of prior floods (Kahan et al., 2006) indicates the importance of such mitigation measures, particularly those that rely less on traditional, “structural” measures, e.g., levees and dikes, to control floodwaters than on such nontraditional measures as strength-ening building codes, retrofitting existing structures, and zoning policies that leave otherwise vulnerable but flood-prone areas uninhabited. Finally, given the coastal region’s recent growth history and economic development prospects, the region might well consider developing a longer-term growth strategy that incorporates not just current recovery efforts and preparation for mitigating future storms but also a broader development strategy that incorporates infra-structure, housing, employment, and public facility needs.

xv
Acknowledgments
We want to thank the various individuals and organizations whose assistance was instru-mental in this research. First, we want to thank our RAND colleagues Michael Toman and Debra Knopman for their support and advice throughout the course of our research. We are also indebted to Adrian Overton for his programming assistance, particularly with the GIS work, Lisa Bernard for her editing, David Adamson for his help in drafting the document, Lisa Sodders for her assistance on the press release, and Paul Steinberg for his help in drafting the fact sheet. Special thanks are due to Isabel Sardou for her invaluable assistance in typing and producing this document, to Paul Sorenson for his thoughtful review of our draft report, and to Liisa Ecola for her thorough review of the tables and figures. Finally, we want to thank George Penick, the director of RGSPI for all the help he provided us through the course of the research.
We also owe a particular debt of gratitude to the sponsors of this research, Oxfam America, the Foundation for the Mid South, the National Association of REALTORS, the Mississippi Association of REALTORS, and a private donor. We want to particularly thank Bernadette Orr and Kimberly Miller of Oxfam, Robert Barr of the National Association of REALTORS, Angela Cain and Pam Powers of the Mississippi Association of REALTORS, and Jason Spell-ings and Jamie Miller of the Mississippi governor’s office for their advice and assistance.
We are particularly indebted to Brian Richard, director of the Economic Development Resource Center at the University of Southern Mississippi, for his work as liaison with indi-viduals and groups in Mississippi and to two other Mississippians, Stephanie Trapp and Louisa Dixon, for their help on the ground. Finally, we wish to thank John Landis for his review of the draft and Mark Bernstein and Bruce Karatz, who provided inspiration for this work.


xvii
Abbreviations
ACOE U.S. Army Corps of Engineers
ACS American Community Survey
AMI area’s median income
CDBG Community Development Block Grant
ESRI Environmental Systems Research Institute
FIRM flood insurance rate map
GIS geographical information system
GO Zone Gulf Opportunity Zone
GPS Global Positioning System
GRPC Gulf Regional Planning Commission
HPG Housing Preservation Grant
HUD U.S. Department of Housing and Urban Development
HWM high water mark
LIDAR Light Detecting and Ranging
MMC Multihazard Mitigation Council
MRD minor roof damage
NFIP National Flood Insurance Program
OFHEO Office of Federal Housing Enterprise Oversight
RGSPI RAND Gulf States Policy Institute
SBA Small Business Administration
SIL surge inundation limit


1
CHAPTER ONE
Introduction
In August 2005, Hurricane Katrina devastated the U.S. Gulf Coast. The storm inflicted major damage to commercial property, infrastructure, and housing all along the coast of the Gulf of Mexico, but its effects were most pronounced in about a dozen counties that included Missis-sippi’s three coastal counties: Hancock, Harrison, and Jackson.1
The massive damage inflicted by Katrina, the first catastrophic hurricane to hit the Mis-sissippi coastline since Camille in 1969, prompted the state to mount a major recovery effort. As part of this effort, Mississippi Governor Haley Barbour appointed the Commission on Recovery, Rebuilding, and Renewal to determine the extent of the damage and to recommend policies to aid in recovery.
The RAND Gulf States Policy Institute (RGSPI)—a partnership involving the RAND Corporation and seven universities in the Gulf of Mexico coastal region—served as advisor to the commission on housing recovery. RGSPI made several recommendations to the com-mission, which were published in the commission’s final report to the governor as well as in a RAND occasional paper. (See Bernstein et al., 2006.)
Because the full extent of the damage and the specific effects on the coastal housing market remained unclear during the course of the commission’s work, one of the recommen-dations was for a more detailed study of the housing market and what might be done to pro-mote its recovery, both in the near and longer term, including consideration of strategies to protect from future storms. In summer and fall 2006, a group of sponsors—Oxfam America, a private donor, the Mississippi Association of REALTORS®, and the National Association of REALTORS—funded RAND to conduct such a study. This report presents our results.
1 Approximately 98 percent of the housing units severely damaged by Katrina were in Louisiana and Mississippi, and the vast majority of those units were either in the New Orleans metropolitan area or in the three Mississippi counties along the coast of the Gulf of Mexico. The damage done in these areas, however was very different. In the city of New Orleans (Orleans parish), the damage to the housing stock was primarily a result of the flooding of the city after the levees col-lapsed, subsequent to the storm. The damage to the housing stock along the Mississippi coast—as well as in St. Bernard and Plaquemine parishes, the two parishes that, in addition to Orleans, suffered the most extensive damage in Louisiana—was primarily a result of the storm surge and flooding caused by the storm itself. Although recovery in all of these areas is occur-ring more slowly than the residents affected would undoubtedly prefer, recovery appears to be moving more rapidly in Mis-sissippi than it is in Louisiana. We have not done an analysis of housing-market recovery in Louisiana, but several of the issues that appear to be problematic in Mississippi—e.g., rising construction, insurance, and housing costs—also appear to be issues in Louisiana. There also appear to be important differences between the two areas in that the Mississippi Home-owner Assistance Grant program has cleared almost all the grant applications it received, while Louisiana’s Road Home program has been much slower to process applications—the majority of which remain unresolved.

2 Post-Katrina Recovery of the Housing Market Along the Mississippi Gulf Coast
Study Purpose
The study’s overarching goal was to assess the damage sustained by the housing market in three Mississippi counties—Hancock, Harrison, Jackson.
The study had several specific objectives:
Describe the structure of the housing market before Katrina in the state as a whole and within the three counties.Estimate the damage done to the housing market, including to the homeowner and rental submarkets.Assess the status of repair and rebuilding.Identify major bottlenecks or problems.
Each of these objectives was designed to provide information needed to assess the housing situation along the gulf coast before and after Katrina. By describing the most salient features of the housing market pre-Katrina, for example, the first objective provided a benchmark for assessing how the market operated and what problems may have existed before the storm and for measuring how the storm affected the operation of the market as a whole as well its various submarkets. The second objective provided that assessment by identifying what sectors of the market were hit hardest, how the storm exacerbated preexisting housing problems, e.g., afford-able housing, and what it will cost to make the needed repairs. The third objective provided an estimate of the progress of the recovery effort and how that progress varies across different components of the market and suggests some reasons for those differences.2 The final objective was to examine the potential sources of problems in the recovery effort, the resources available to solve those problems, and both the short- and long-term issues that need to be addressed not just to restore the housing market but also to protect it from future storms.
Data and Methods
Collecting and processing the data needed to address these issues posed a major challenge for this analysis, for several reasons. First, the range of topics to be covered was broad in its scope. This range includes the pre-Katrina characteristics of the housing market and its occupants by submarket, the damage done to different segments of that market after Katrina, and recovery efforts subsequent to the storm. Moreover, these data span the period from 2000 (the date of the census) to the present. Indeed, assessing the status of recovery efforts requires near–real-time information. Finally, and, in all likelihood, most importantly, the various data sources needed were collected for different geographic units, considerably complicating the process of tying together different types of data collected in different periods for the same geographic areas.
2 Although our analysis identifies several factors that help explain differences in the pace of recovery in the housing market, we note that one important finding in this respect—the differential pace of recovery across jurisdictions—remains unex-plained. We have, however, suggested several potential reasons for its existence. Understanding the causal links between public and private actions and consequent recovery rates would provide valuable guidance to policymakers now and in the future.

Introduction 3
We used a variety of data sources in this analysis. For our pre-Katrina housing assessment, we drew household and housing market data from the 2000 Census (U.S. Census Bureau, 2007c) and the 2005 American Community Survey (U.S. Census Bureau, 2007d). To assess sources of housing damage, we used two data sets from FEMA. The first consisted of maps of the traditional flood plain as listed in flood insurance rate maps (FIRMs) as well as the surge inundation limits (SILs) of Katrina’s storm surge to describe the sources of damage to the housing stock. The second estimated the damage to the stock in terms of five FEMA damage categories—catastrophic, extensive, flooded, moderate, and limited. We also used a third data set, from the U.S. Army Corps of Engineers (ACOE), on wind damage. To assess recovery progress, we examined building permits from 11 jurisdictions and the unincorporated areas of Hancock and Jackson counties; we also examined data from an independent source of build-ing permits, Treen Permit Reports (2006). The specific methods used to assemble and analyze each data source are described in the appendix.
Organization of This Report
This report is organized as follows. Chapter Two presents a pre-Katrina overview of the popu-lation and a detailed description of the housing market in these three counties. The chapter concludes with an examination of affordability issues prior to Katrina. Chapter Three presents an assessment of the damage done by Katrina by measuring sources and severity of damage, with a particular focus on the key rental housing submarket. Chapter Four provides a picture of the housing market’s recovery to date, again focusing on specific sectors and identifying major problem areas. Chapter Five discusses key issues that emerge from the analysis, includ-ing short- and longer-term concerns.


5
CHAPTER TWO
Profile of the Pre-Katrina Housing Market
This chapter profiles the pre-Katrina housing market in Mississippi’s Hancock, Harrison, and Jackson counties. As such, it provides benchmarks against which to measure the damage that Katrina inflicted and to assess the progress that has been made toward recovery. These bench-marks are presented in four parts. First, we compare the sociodemographic and economic char-acteristics of the three coastal counties with those in the rest of the state. Next, we compare population and housing characteristics across the three counties. Third, we provide a detailed picture of the housing market before Katrina, looking at the housing stock, profiling the hous-ing submarkets, and describing the characteristics of households within these submarkets. Finally, we examine the housing affordability issue as it appeared before Katrina.1
Sociodemographic Background: How the Counties Differ from the Rest of Mississippi
To set the context for the pre-Katrina analysis, it is important to recognize that Hancock, Har-rison, and Jackson counties were more affluent, economically vibrant, and ethnically diverse than Mississippi as a whole. These differences have their roots in the history of the U.S. Gulf Coast.
The modern history of the Mississippi Gulf Coast is a story of successive settlements by French, Spanish, and American pioneers. In 1699, the first capitol at Old Biloxi was founded. . . . In the 1760s France ceded the area to Spain who sent many settlers to secure the area. After the Louisiana Purchase in 1803 thousands of Americans poured into the new US territory. Seeking to escape New Orleans’ yellow fever epidemics in the salt air of the coastal plain, wealthy entrepreneurs built handsome summer “cottages” along the beaches of Mississippi. . . .
The New Orleans, Chattanooga and Mobile Railroad built in 1869 introduced Mid- Western “snowbirds” to the charms of the coast, starting a seasonal migration that con-tinues today. The railroad also allowed the establishment of sawmills and brickyards that employed European immigrants from Ireland, Germany and Italy. A huge cannery indus-try developed causing the relocation of fishers and canners from the Chesapeake Bay area and Louisiana. With the outbreak of World War II, Keesler Air Base was built in Biloxi.
1 As noted above, the comparisons reported in this chapter are based on information reported in the 2000 U.S. Census of Population and Housing (U.S. Census Bureau, 2007c) and the 2005 American Community Survey (U.S. Census Bureau, 2007d).

6 Post-Katrina Recovery of the Housing Market Along the Mississippi Gulf Coast
In Pascagoula Ingalls Shipbuilding Company, now Northrup Grumman Ship Systems, built ships for the US Navy. NASA established the Stennis Space Center in the mid-1960s in Hancock County to test the Saturn V rocket engine. Today these military and federal installations, along with the tourism industry that was boosted by the opening of gaming casinos in the 1990s, remain cornerstones of the Mississippi coastal economy. (GRPC, undated)
The three coastal counties are more urban than is the state as a whole. All three coun-ties, for example, are located in metropolitan areas, in contrast to the rest of the state, which is predominantly nonmetropolitan in character. Hancock and Harrison counties form the Gulfport-Biloxi metropolitan area, and Jackson County contains the central city of the Pas-cagoula metropolitan area. These counties have also grown more rapidly than the state has. Between 1990 and 2000, for example, their populations increased by 16.5 percent, compared with 10.5 percent for the state as a whole. Although their rates of growth slowed between 2000 and 2005—only 0.8 percent, compared with the state’s 2.2 percent—two of the three counties still grew more rapidly than the state did. Subsequent to Katrina, all three of these counties lost population (an average of 6.6 percent) while the state’s population remained stable (growth of 0.1 percent) (U.S. Census Bureau, undated[a], undated[b], undated[c], 2007a).
The racial and ethnic characteristics of the coastal counties’ populations also differed from those of the state as a whole. Their populations had higher percentages of white (76 per-cent versus 61 percent), Asian (3 percent versus 0.7 percent) and Latino (2 percent versus 0.7 percent) residents than the state as a whole. On the other hand, the counties had a lower pro-portion of black residents than the state overall (19 versus 38 percent) (U.S. Census Bureau, undated[a], undated[b], undated[c], 2007a).
The coastal counties’ populations also had different socioeconomic profiles from those of the state population as a whole. Their residents had higher levels of education (80 percent had high school degrees, compared with the state average of 73 percent, and 17.6 percent had col-lege degrees, compared with the state average of 16.9 percent). They also had higher incomes (a median household income of $32,027 versus $31,330 for the state) and lower poverty rates (11.1 percent of the counties’ families had incomes below the poverty level, compared with 15 percent statewide, and 11.4 percent of seniors [65 years or older] had incomes below the pov-erty level, compared with 18.8 percent statewide) (U.S. Census Bureau, undated[d]).
These socioeconomic differences reflect the distinctive employment base of the coastal region, which includes several military and government installations (3.7 percent of the adult population in the three counties was in the armed forces versus 0.7 percent of the adult popu-lation statewide, and the region enjoyed substantial civilian employment at the Stennis Space Center) as well as a flourishing gaming industry (classified within the entertainment sector) that has spurred population and employment growth in the region. Seventeen percent of the workforce in these counties, compared with 8 percent statewide, was employed in the enter-tainment sector (U.S. Census Bureau, undated[d]).
The housing stock in the three coastal counties also differed from that statewide in terms of its structural characteristics—e.g., before the storm, they had proportionately more renters (31 percent versus 28 percent statewide), more large rental properties (11.4 percent of the rent-ers lived on properties with more than five units compared with 7.6 percent statewide) and slightly fewer mobile homes (13.4 percent versus 16.6 percent statewide). Finally, consistent with its more rapid population growth, the housing stock in the coastal counties was somewhat

Profile of the Pre-Katrina Housing Market 7
younger than the stock statewide (40.5 percent of the housing units were built within the past 25 years compared with 38.8 percent statewide) (U.S. Census Bureau, undated [e]).
The most pronounced difference between the housing stock in the coastal counties and that statewide was in its cost. The median cost of owner-occupied housing was 20 percent higher along the coast than statewide ($85,222 versus $71,400), and median gross rents were 21 percent higher ($533 versus $439). Despite these higher housing costs, however, households in the coastal counties spent about the same percentage of their incomes on their housing as did households statewide. About 20 percent of the owners in the coastal counties, for example, spent more than 30 percent of their monthly incomes on housing, compared to 21.4 percent statewide. The comparable figures for renters were 38.5 percent along the coast and 39.9 per-cent statewide.2
Differences Among the Counties
There were also noteworthy differences in the population and housing characteristics among the counties themselves (see Table 2.1). Harrison County, where the two largest cities, Gulfport and Biloxi, are, is by far the most populous county, followed by Jackson (where the third larg-est city, Pascagoula, is). Hancock County is the smallest but has grown the most rapidly since 1990 and is the most ethnically homogeneous of the counties. Although education levels in the counties were similar, incomes are highest and poverty levels lowest in Jackson County.
Table 2.1Counties’ Demographic Characteristics
Characteristic Hancock Harrison Jackson
Population, 2000 42,967 189,601 131,420
Population growth, 1990–2000 (%) 35.3 14.7 14.0
Population growth, 2000–2005 (%) 7.6 –1.6 2.2
Population change post-Katrina (%) –12.6 –7.9 –2.7
Ethnic composition (%)
White 90 73 75
Black 7 21 21
Latino 2 3 2
Asian 1 3 2
High school education (%) 78 80 81
Average household income ($ thousands) 35.2 35.6 39.1
Families below poverty line (%) 11.2 18.4 10.5
SOURCES: U.S. Census Bureau (2007a, 2007c).
2 The U.S. Department of Housing and Urban Development (HUD) defines affordable housing as that which costs no more than 30 percent of a household’s monthly income.

8 Post-Katrina Recovery of the Housing Market Along the Mississippi Gulf Coast
The characteristics of the housing stock also differed among these counties (see Table 2.2). In Hancock County, homeownership rates were highest, the housing stock newest, and house values highest. By contrast, Harrison County had a much higher fraction of rental units, and more of those rental units were on large (five or more unit) properties as well as the high-est monthly rents. The housing stock in Jackson County generally fell between the values in Hancock and Harrison counties on these measures.
Affordability—the percentage of households spending more than 30 percent of their income on housing—was an issue in all the counties, but it was more of a problem in Hancock and Harrison than in Jackson. In Hancock, 40 percent of renters and 23 percent of owners were spending more than 30 percent of the household income on housing. In Harrison, the fig-ures were 39 percent and 21 percent, respectively, while, in Jackson, the figures were 31 percent and 14 percent, respectively. Nationally, by way of comparison, the figures were 37 percent for renters and 22 percent for homeowners.
Detailed Analysis of the Housing Market
With these differences as background, we turn to a detailed analysis of the housing market across the three counties in terms of the distribution of the stock by tenure and structure type (single family, mobile, home, or multifamily unit). Next, we examine in finer detail the loca-tion of the stock by proximity to the coast and jurisdiction. Finally, we look at the characteris-tics of the housing stock by submarket.
Profile of Housing Stock
A little more than half of all the occupied units in the housing market were located in Har-rison County (see Table 2.3 and Figure 2.1). This percentage varied, however, by tenure and structure type. Although Harrison County contained a little less than half of all the owner-occupied units, almost two-thirds of the rental units and more than two-thirds of the large, multiunit rental properties were located there. By contrast, Hancock and Jackson counties contained a disproportionate share of owner-occupied units and a less than proportionate share of rental units of all types.
In all three counties, the overwhelming majority of owner-occupied units were single-family houses, and the rest were mostly mobile homes—only a handful of owner-occupied
Table 2.2Characteristics of the Pre-Katrina Housing Stock in Coastal Counties
Characteristic Hancock Harrison Jackson
Homeownership rate (%) 80 63 75
5+-unit rental properties (%) 5 15 8
Units built since 1980 (%) 49 34 37
Median home value ($) 92,500 87,200 80,300
Median monthly rent ($) 510 543 522
SOURCE: U.S. Census Bureau (2007c).

Profile of the Pre-Katrina Housing Market 9
Table 2.3Distribution of Units, by County, Tenure, and Structure Type (%)
Characteristic Hancock Harrison Jackson Total
Owner occupied 13 48 39 100
Single family 12 48 40 100
Mobile home 18 46 36 100
Renter occupied 8 63 29 100
Single family 9 60 31 100
Multiunit 6 68 26 100
Mobile home 16 56 28 100
All Units 11 54 35 100
SOURCE: Calculations based on U.S. Census Bureau (2007c).
units were located on multiunit properties. In contrast, roughly equal numbers of single-family houses and units on multiunit properties were in the rental market. Mobile homes comprised a small fraction of the rental market.
Geographic Distribution of Housing Stock
To this point, we have distinguished location only by county, but two other dimensions of the geographic distribution of housing are important to this analysis. The first, proximity to the coast, is important for understanding the sources and extent of the damage that Katrina caused. As our analysis will demonstrate, both the proportion of damaged units and the extent of that damage vary substantially among housing units in the coastal zone, those that are adja-cent to the coastal zone, and those that are located in the inland areas. In addition, municipal jurisdiction is relevant to the recovery process, because such regulatory processes as the grant-ing of building permits and planning and zoning are executed at the jurisdictional level.
The housing stock was unevenly distributed among the three coastal zones (see Figure 2.2). Eighty percent of the housing units in these counties, for example, were located in the coastal or coastal-adjacent zones. As will be discussed in considerably greater detail in the next chapter, the prevalence and severity of damage to the stock was much higher in these two zones than in the inland zone. Although this proportion did not differ much between the rental and ownership markets (see Figure 2.3), it did differ somewhat by county—the largest fraction of all housing units in Hancock and Jackson counties were located in the coastal zone in contrast to the predominance of the housing stock in Harrison county which is located in the coastal adjacent area.
The market value of owner-occupied homes varied by proximity to the coast but not in a straightforward manner. Values were highest in the coastal zone (the median $91,591), somewhat lower in inland areas ($89,063), and lowest in the coastal adjacent zone ($79,167). Although monthly rents varied notably by county, with the highest rents found in Harrison ($517), somewhat lower in Jackson ($502), and lowest in Hancock ($486), they did not vary much by proximity to the coast (the median monthly rent was $512 in the coastal zone, $507 in the coastal-adjacent zone, and $510 in inland areas).

10 Post-K
atrina R
ecovery o
f the H
ou
sing
Market A
lon
g th
e Mississip
pi G
ulf C
oast
Figure 2.1Distribution of Housing Units Across the Three-County Area
SOURCES: U.S. Census Bureau (2005a, 2007b).RAND TR511-2.1
Waveland
Hancock CountyHarrison County
Jackson County
Bay St. LouisPass Christian
Long Beach
GulfportBiloxi D’Iberville
OceanSprings Gautier
MossPoint
Pascagoula
1 dot = 25 housing units 2000 Census housing units I-10 CSX railroad Incorporated cities
252015
Miles
1050 30

Profi
le of th
e Pre-K
atrina H
ou
sing
Market 11
Figure 2.2Distribution of Housing Units, by Coastal Adjacency and Jurisdiction
Waveland
Hancock County
Harrison County
Jackson County
Bay St. LouisPass Christian
Long Beach
GulfportBiloxi D’Iberville
OceanSprings Gautier
MossPoint
Pascagoula
2015
Miles
1050
SOURCES: U.S. Census Bureau (2005a, 2005b, 2007b). Housing counts based on 2000 Census.RAND TR511-2.2
NOTE: Designations of coastal, coastal-adjacent, and inland are drawn by location relative to the Gulf of Mexico and major infrastructure, viz. the CSX railroad and I-10 freeway. Both run east to west. Coastal areas have been defined as census block groups that are south of the CSX or directly abut the gulf. Adjacent areas include block groups that do not abut coastal waters but are south of I-10. Inland areas include the remaining block groups within the study area north of I-10. Where a block group spans these infrastructure boundaries, it is categorized in terms of the designation nearer the coast. Jurisdiction refers to the political boundaries of incorporated cities and unincorporated county areas. There are two incorporated areas in Hancock County: Bay St. Louis and Waveland; five in Harrison County: Biloxi, D’Iberville, Gulfport, Long Beach, and Pass Christian; and four within Jackson County: Gautier, Moss Point, Ocean Springs, and Pascagoula. The remaining areas within these counties are unincorporated. Planning and permitting activity within incorporated areas are dealt with at the municipal level; those in unincorporated areas are at the county level.
1 dot = 25 housing units 2000 Census housing units I-10 CSX railroad Incorporated cities Inland block groups Adjacent block groups Coastal block groups

12 Post-Katrina Recovery of the Housing Market Along the Mississippi Gulf Coast
Figure 2.3Distribution of Owner- and Renter-Occupied Units, by County and Geographic Area
SOURCES: U.S. Census Bureau (2005b, 2007b).RAND TR511-2.3
90
80
70
60
50
40
30
20
10
100
HarrisonHancockOwn Rent Own Rent Own Rent
Jackson
County by tenure
0
Perc
ent
of
tota
l ho
usi
ng
un
its
InlandAdjacentCoast
In addition to examining the geographic distribution of the housing stock by proximity to the coast, we also compared the distribution of both owner-occupied and rented proper-ties across the different municipal jurisdictions in the three counties (see Table 2.4 and Figure 2.4). These communities fall into three size categories: the smallest places, with populations fewer than 10,000 inhabitants (Bay St. Louis, Waveland, D’Iberville, Pass Christian); mid-sized towns, with populations between 10,000 and 20,000 (Long Beach, Gautier, Moss Point, and Ocean Springs) and the three largest cities, with populations of more than 25,000 (Gulf-port, Biloxi, and Pascagoula). About two-thirds of all the occupied housing units were located in these 11 municipalities. The remaining third were located in the unincorporated areas of these three counties, but that percentage varied by county. Two-thirds of all occupied units in Hancock County were located in unincorporated areas versus about 45 percent in Jackson County and less than 20 percent in Harrison.
Consistent with the predominance of owner-occupied housing in the region, the housing in the unincorporated areas was overwhelmingly owner occupied (at least 85 percent) and that of the small and midsized communities predominantly owner occupied (between 70 and 80 percent). Only in the largest cities did rental units exceed 40 percent of the stock, and only in Biloxi were the majority of units rented. Indeed, 60 percent of all rental units in the coastal counties were located in the three largest cities (Gulfport, Biloxi, and Pascagoula).
Submarket Analysis
We next focused our analysis at an even finer level of analysis to examine housing submar-kets. We define submarkets in terms of tenure, structure type (single-family houses, units on

Profile of the Pre-Katrina Housing Market 13
Table 2.4Housing Units by Tenure, Jurisdiction, and County
Jurisdiction Total Owner Rental
Hancock
Bay St. Louis 3,271 2,152 1,119
Waveland 2,731 1,961 770
Unincorporated 10,895 9,334 1,561
Subtotal 16,897 13,447 3,450
Harrison
Biloxi 19,588 9,573 10,015
D’Iberville 2,827 2,049 778
Gulfport 26,943 15,827 11,116
Long Beach 6,560 4,348 2,212
Pass Christian 2,687 1,940 747
Unincorporated 12,933 11,089 1,844
Subtotal 71,538 44,826 26,712
Jackson
Gautier 4,260 2,982 1,278
Moss Point 5,714 4,237 1,477
Ocean Springs 6,650 4,801 1,849
Pascagoula 9,878 5,607 4,271
Unincorporated 21,174 17,923 3,251
Subtotal 47,676 35,550 12,126
Total 136,111 93,823 42,288
SOURCE: U.S. Census Bureau (2007c).
multifamily properties, and mobile homes), and costs (market value for owners and monthly rent for renters). Using these dimensions, we have identified 13 housing submarkets in the coastal counties (five in the owner-occupied market and eight in the rental market).3
Detailed information on submarkets is important because households differ in terms of the types of housing units they need and can afford as well as in the information and resources they command. Correspondingly, the characteristics of households will vary across submar-kets as will their ability to respond to the types of damages their housing has suffered due to
3 These submarkets were constructed to divide both the owner and renter markets into approximately equal-sized group-ings. In practice, the sizes of submarkets differ for two reasons. First, the market itself is structured unevenly, e.g., there are many more owner-occupied than rental units and more single-family houses than multiunit. Second, the value and rent levels used to define submarkets in this analysis were based on areal aggregate data that group value and rent distributions into broad dollar intervals rather than individual values. Thus, the number of units in each submarket category was deter-mined by the data intervals provided by the data.

14 Post-Katrina Recovery of the Housing Market Along the Mississippi Gulf Coast
Figure 2.4Distribution of Renter- and Owner-Occupied Housing Units for the 10 Coastal Cities
SOURCES: U.S. Census Bureau (2007b), FEMA (2005).RAND TR511-2.4
WavelandBay St. Louis
Pass Christian
Long Beach
GulfportBiloxi D’Iberville Ocean Springs
GautierMoss Point
Pascagoula
1 dot = 25 housing units Renter occupied Owner occupied Incorporated cities
Katrina. In addition, damage levels may also differ by submarket as a function of their loca-tion and construction quality. For example, we expect that mobile homes suffered less damage because they are concentrated in inland areas. By contrast, multifamily rental housing was likely to suffer disproportionately because it was concentrated in Harrison County. Finally, several studies have indicated that the extent of damage done by hurricanes can differ substan-tially depending on the quality of housing construction.
In addition, the pace of recovery will likely differ across submarkets, because access to the resources needed to finance rebuilding and repairs differs. Homeowners, for example, can buy insurance to indemnify themselves against damage to their property, while renter’s insur-ance will cover no more than damage to personal property. In addition, government-sponsored disaster-assistance programs, such as Small Business Administration (SBA) loans or Missis-sippi homeowner grants, are typically targeted at homeowners. Finally, higher-income resi-dents (both homeowners and renters) typically have greater resources with which to repair their housing or to find new housing.4
Submarket Characteristics
The distribution of owner and renter units by submarkets in the three counties is shown in Tables 2.5 and 2.6. The results in Table 2.5 indicate the predominance of single-family homes in the owner-occupied market (85 percent of the owned units were single-family houses) and that the majority of these homes were valued at less than $90,000. But these data also indicate that the prevalence of these various submarkets differed across the three counties. Hancock County had a disproportionate share of high-value, single-family homes and mobile homes. The ownership market in Harrison County is comprised of a disproportionate share of single-family homes in the middle and upper range of the value distribution, while the homes in Jackson County were disproportionately of lower value.
The rental market was more evenly distributed between single-family homes (41 percent of the market) and multiunit dwellings (49 percent). Mobile homes comprised a smaller share
4 Financing issues are discussed more fully in Chapter Five.

Profile of the Pre-Katrina Housing Market 15
Table 2.5Distribution of Owner-Occupied Units, by Submarket and County
Submarket Hancock (%) Harrison (%) Jackson (%) Total (%) Percent of Total
Single family
<$60,000 11 42 47 100 19
$60,000–90,000 10 50 40 100 27
$90,000–125,000 14 48 38 100 18
$125,000+ 15 51 34 100 20
Mobile homes
<$90,000 16 45 39 100 8
$90,000+ 20 48 32 100 7
Total 13 48 39 100 100
SOURCE: Tabulations based on U.S. Census (2007c).
Table 2.6Distribution of Rental Units, by Submarket and County
Submarket Hancock (%) Harrison (%) Jackson (%) Total (%) Percent of Total
Single family
<$450 10 58 32 100 16
$450–600 10 58 32 100 11
$600+ 10 58 32 100 14
Multifamily
<$450 6 67 27 100 19
$450–600 5 66 29 100 14
$600+ 4 71 29 100 16
Mobile home
<$450 17 55 28 100 4
$450+ 15 57 28 100 6
Total 8 63 29 100 100
SOURCE: Tabulations based on U.S. Census Bureau (2007c).
of the renter than the owner-occupied market. However, the predominance of these different submarkets across the three counties was very uneven. Disproportionate shares of the single-family rental units were located in Hancock and Jackson counties, while the multifamily units were disproportionately concentrated in Harrison County. Rented mobile homes were, once again, disproportionately located in Hancock (U.S. Census Bureau, undated[e], undated[g], undated[h]).
The vulnerability of these different owner and renter submarkets to damage from Katrina varied with their location relative to the coast. Units located in the coastal zone were most vul-

16 Post-Katrina Recovery of the Housing Market Along the Mississippi Gulf Coast
nerable to damage from Katrina, those in the coastal adjacent zone somewhat less vulnerable, and those in the inland zone least vulnerable. As a prelude to the damage estimates provided in the next chapter, Tables 2.7 and 2.8 compare the geographic distribution of these various submarkets across the three coastal zones. As the results in Table 2.7 indicate, single-family homes, especially those in the highest-value owner submarkets (more than $90,000 in value) were disproportionately located in the coastal zone and most vulnerable to storm damage. The lower-value submarkets (values less than $90,000), on the other hand, were disproportionately
Table 2.7Distribution of Owner Units, by Submarket and Proximity to Coast
Submarket Coastal (%) Adjacent (%) Inland (%) Total (%)
Single family
<$60,000 36 48 16 100
$60,000–90,000 34 47 19 100
$90,000–125,000 42 37 21 100
>$125,000 49 32 19 100
Mobile home
<$90,000 17 32 52 100
$90,000+ 22 31 57 100
Total 37 40 23 100
SOURCE: Tabulations based on U.S. Census Bureau (2007c).
Table 2.8Distribution of Rental Units, by Submarket and Proximity to Coast
Submarket Coastal (%) Adjacent (%) Inland (%) Total (%)
Single family
<$450 40 46 14 100
$450–600 48 38 14 100
$600+ 40 46 14 100
Multifamily
<$450 46 50 4 100
$450–600 55 41 4 100
$600+ 46 50 4 100
Mobile homes
<$450 19 40 41 100
$450+ 22 37 41 100
Total 43 45 12 100
SOURCE: Tabulations based on U.S. Census Bureau (2007c).

Profile of the Pre-Katrina Housing Market 17
located in the coastal-adjacent zone. Units in the two mobile-home submarkets, in contrast, were located in the inland areas and less likely to have suffered major damage as a result of the storm.
The single-family and multifamily submarkets within the rental sector were likely to have been even more vulnerable to the storm, since they were both overwhelmingly located in the coastal and coastal-adjacent zones (see Table 2.8). This is particularly the case with the units in the multifamily submarkets, since 95 percent of the housing units in these submarkets were located in these two geographic areas. Although units in the two mobile-home submarkets were less vulnerable to storm damage given their prevalence in the inland zone, they were still likely to have been more vulnerable to storm damage than were owned mobile homes. In com-bination, the results in these two tables suggest that a higher proportion of units in the rental market were vulnerable to storm damage than were those in the owner-occupied market.
Household Characteristics by Submarket
As suggested above, there were also notable differences in the characteristics of households in these various submarkets. For example, homeowners were more affluent, had higher education levels, and were likelier to be white than were renters (see Figures 2.5 and 2.6). In addition, incomes generally rise with housing costs, so that average income levels rise with submarkets defined by value and rent levels. This pattern explains why homeowners spend a lower percent-age of their income on housing than renters do (Figure 2.7). Indeed, almost 40 percent of rent-ers were spending more than 30 percent of their incomes on housing, compared with about 20 percent of owners.
Figure 2.5Race of Household Head, by Tenure
SOURCE: U.S. Census Bureau (2007c).RAND TR511-2.5
90
80
70
60
50
40
30
20
10
100
Own Rent Total
Tenure
0
Perc
ent
OtherBlackWhite

18 Post-Katrina Recovery of the Housing Market Along the Mississippi Gulf Coast
Figure 2.6Homeowner and Renter Incomes
SOURCE: Tabulations from U.S. Census Bureau (2007c).RAND TR511-2.6
90
80
70
60
50
40
30
20
10
100
Own Rent Total
Tenure
0
Perc
ent
$60k+$35–60k$20–35k<$20k
Figure 2.7Owner and Renter Spending on Housing
SOURCE: Tabulations from U.S. Census Bureau (2007c).RAND TR511-2.7
60
50
40
30
20
10
70
Own Rent Total
Tenure
0
Perc
ent
of
inco
me
<25%25–35%>35%

Profile of the Pre-Katrina Housing Market 19
Affordability Prior to Katrina
As these comparisons indicate, housing affordability (i.e., the ability of households to find standard housing at a price that they can afford) was a major problem in the coastal housing market before Katrina. This problem was particularly acute in the rental market, in which 40 percent of the households were spending more than 30 percent of their incomes before the storm. Moreover, as the data on the location of housing by coastal zone suggests, the afford-ability problem is likely to have become more acute given the vulnerability of large segments of the rental market to storm damage.
To develop a more complete picture of affordability concerns, we calculated pre-Katrina demand for housing that is considered nonaffordable by the HUD definition. To do this, we estimated the number of households spending more than 30 percent of income on housing and combined that figure with an estimate of households living in subsidized (assisted) and public housing. These results (see Table 2.9) suggest that, prior to Katrina, there was demand for close to 38,000 affordable housing units.
Summary
Our pre-Katrina baseline analysis of Hancock, Harrison, and Jackson counties shows that, relative to the rest of the state, these counties are high-growth and economically prosperous areas. In addition, the residents have higher income and education levels. A substantial amount of economic growth and employment are tied to the gaming industry, which suffered substan-tially from Katrina—although it appears to be making a rapid recovery.
There were some important demographic differences among these counties. Harrison was larger than the others and contained two-thirds of the area’s rental housing and also a higher share of multifamily housing. Ownership rates were highest in Hancock County, which also had the newest housing stock and the lowest percentage of rental housing.
Two-thirds of households owned their own homes—the vast majority of which were single-family units—but there was more variety in the rental housing stock.
Geographic location of the area’s housing stock is important to understanding its vulner-ability to hurricane damage:
Eighty percent of units were on the coast or in coastal-adjacent areas.Ninety-five percent of multifamily units were in coastal and coastal-adjacent areas.Mobile homes were mostly located inland, so they had less exposure.
Approximately two-thirds of the housing stock in the coastal region was located in the 11 municipalities of the three counties. Although the overwhelming majority of housing units in these jurisdictions were owner occupied, 60 percent of the rental units were located in the three largest cities in the region (Gulfport, Biloxi, and Pascagoula).
Our submarket analysis showed that lower-value submarkets of all kinds were dispropor-tionately represented in Jackson County. For the rental market, Harrison dominated all sub-markets but especially that for the highest- and lowest-value multifamily units.
Affordability issues were a concern in all three counties prior to Katrina. This was espe-cially true for renters, who spend more on housing than owners do. Almost 40 percent of

20 Post-Katrina Recovery of the Housing Market Along the Mississippi Gulf Coast
Table 2.9Estimate of the Demand for Affordable Housing Units
Demand Hancock Harrison Jackson Total
Spending > 30 percent 3,420 16,248 9,363 29,031
Public and assisted 806 5,630 2,597 9,033
Total 4,225 21,878 11,960 38,064
SOURCES: U.S. Census Bureau (2007c), W. S. Loper and Associates (2004), Mississippi Development Authority (2006a).
renters were spending more than 30 percent of their income on housing. Demand for such rental housing was being met from three sources: low-cost rentals (those in the bottom third of market), assisted housing, and public housing. Harrison County had the highest share of all three.
Combining the results of the geographical analysis and the submarket analysis, we find that the clearest threat to affordable housing posed by Katrina likely was found in the effect on rental properties adjacent to as well as on the coast. The latter bore a greater brunt of the storm, while more moderate-value housing was more prevalent in the areas immediately adjacent to the coast. Because affordability was already a greater concern for renters than for owners, who also have more access to resources to rebuild, the burden of the damage done by Katrina is likely to have fallen particularly heavily on the rental market.

21
CHAPTER THREE
Damage Done to Housing Stock
Introduction
Katrina devastated the coastal housing stock. The damage that the storm caused was a product of a storm surge that reached 30 feet, widespread flooding, wind, and rain—and often a com-bination of these elements. As we will demonstrate, the severity of the damage done varied by its source—a pattern that is relevant both to the residents whose housing was damaged, since their ability to receive compensation for their loss is often tied to its source, and to planners who must consider how to reduce the damages that future hurricanes may cause.1
Although the effects of Katrina were widespread, they were not felt equally across either areas or housing submarkets. Those jurisdictions located in the coastal and coastal-adjacent areas suffered more intensive damage than did those in inland areas—primarily because they were likeliest to be hit by a combination of storm surge and flooding, which proved to be most devastating to the housing stock. Correspondingly, those housing submarkets that were dis-proportionately concentrated in these areas were harder hit than were other submarkets.
Finally, although a precise estimate of the costs of repairing the housing stock is probably impossible, we have used data on building permits during the postrecovery period to estimate what it might cost to renew the coastal counties’ residential properties. This figure seems cer-tain to exceed $4 billion.
The discussion below begins with the sources and extent of the damage and how it varied across areas and jurisdictions. This discussion includes a description of the data sources and methods used to make these estimates; the appendix offers a more complete description of our approach. The next section describes the variation in damages across submarkets and includes a description of the damage done to affordable housing. The final section then provides our estimate of what it will cost to repair the stock as well as the approach we used to make that estimate.
Sources and Extent of Damage: Data and Approach
We used two sets of FEMA data in conjunction with data from ACOE to make our damage estimates. The first set of FEMA data plotted the geographic extent of the traditional flood
1 The importance of applying lessons learned from past hurricanes was underscored by the Governor’s Commission on Recovery, Rebuilding, and Renewal (2005), which noted that failure to apply the lessons learned from Hurricane Camille in 1969 might well have increased the damage that Katrina caused. Indeed, this point was demonstrated by Louisiana State University Hurricane Center and T. Eric Stafford and Associates (2006).

22 Post-Katrina Recovery of the Housing Market Along the Mississippi Gulf Coast
plain2 as well as the areas that were affected by Katrina’s storm surge. This data set plots the extent of flooding and storm surge—two of the four damage sources.3 The second set of FEMA estimates, based on overflight inspection of the damaged areas, sorts the three counties into five damage category areas including, first, areas of catastrophic damage (most solid struc-tures were destroyed); second, areas of extensive damage (some solid structures were destroyed, and most sustained exterior and interior damage); third, flooded areas (structures sus- tained severe damage due to flooding); fourth, areas of moderate damage (solid structures sus tained exterior damage, and lighter structures, including mobile homes, were damaged or destroyed); and finally, areas of limited damage (solid structures experienced superficial damage, and some light structures were damaged or displaced). To obtain estimates of the number of properties in each category, these damage areas were then plotted at the census block level, and properties were then assigned to damage categories in terms of the proportion of each block in the different categories. By overlapping these two sets of spatial estimates, we could identify both the primary sources of damage and the extent of the damage across the three counties.
The major omission from these estimates is damage that was caused primarily by wind and rain. Although major roof damage is likely to have been captured in the FEMA estimates, this may not be true of less severe wind or rain damage. However, ACOE made an indepen-dent estimate of minor roof damage on individual properties.4 These roof damage estimates identify individual structures with limited roof damage (2 to 15 percent). The damaged roofs were then plotted with a GPS and were then mapped at the census block level.
These two damage estimates are likely to be complementary. The FEMA data provide a more comprehensive picture of damage at all levels of intensity (e.g., according to the five damage categories) but only at the census block level, but they may not capture individual properties with minor roof damage alone, since they do not report damage for individual prop-erties. ACOE’s estimates, on the other hand, identify individual properties with roof damage.5 Integrating these two sets of damage estimates provides us with a more comprehensive and complete set of estimates of damage to the housing stock and enables us to compare the extent and severity of damage wrought by different sources.6 Adding ACOE’s damage data increases our estimate of damaged structures by approximately 25 percent.
In the damage estimates described below, the five FEMA damage categories and ACOE’s estimate of roof damage were sorted into three general categories: severe damage, which includes the catastrophic, extensive, and flooded categories; moderate damage; and limited
2 These data are used for National Flood Insurance Program and describe the traditional FIRM. As it turned out, the geo-graphic extent of flooding due to Katrina exceed the traditional flood plain, and these maps are currently being revised.3 Although wind and rain affected all areas, the distinction we draw here is between areas in which the damage was due primarily to flooding and the storm surge and those areas in which neither flooding nor storm surge was present but in which the housing stock nonetheless suffered damage. We attribute this damage to wind and rain.4 Like the FEMA damage data, ACOE’s estimates were based on information collected by flying over the damaged areas.5 ACOE’s estimates do not differentiate between residential and other structures, e.g., barns and sheds on a property.6 Overall, about half (52 percent) of the damage was due to wind or rain versus about one-third to the storm surge and about 15 percent to a combination of surge and flooding. Very little was due to flooding alone. However, the storm surge (and particularly the combination of storm surge and flooding) produced the severest damage. Almost 80 percent of the units that experienced the combination of these two elements were severely damaged. By contrast, more than 90 percent of the units that were damaged by wind and rain alone suffered only limited damage.

Damage Done to Housing Stock 23
damage. Properties identified as damaged in the ACOE data that overlapped damage areas identified by FEMA were not added to the total, to avoid potential double-counting. Prop-erties identified in the ACOE data set as damaged that the FEMA data did not evaluate as damaged are placed in the limited-damage category. Based on values reported in building-permit data from various jurisdictions in the three counties, we estimate that repairing units in the severe-damage category could cost $100,000 or more. Repairing units in the moderate-damage category could cost between $10,000 and $75,000 each, and repairing properties in the limited-damage category is likely to cost less than $10,000 each.
The damage estimates discussed here relate only to the units that were occupied at the time of the 2000 census. In addition to these 116,000 occupied units, an additional 16,275 units were vacant in April 2000, the date of the census.7
Sources and Extent of Damage: Overall Findings
Figure 3.1 shows the extent of the damage (in terms of the number of residential units) caused by the four different damage sources: surge alone; flooding alone; the combination of surge and flooding; and wind and rain exclusively. The most prevalent source of damage was wind and rain. More than 35,000 units (about 47 percent of all damaged units) suffered damage from the combination of these sources. However, about 90 percent of these units suffered only limited damage (less than $5,000).8 By contrast, the storm surge damaged almost 30,000
Figure 3.1Extent by Source of Damage
RAND TR511-3.1
35,000
30,000
25,000
20,000
15,000
10,000
5,000
40,000
Surge Flood Both Wind and rain
Source of damage
0
Un
its
dam
aged
Damagecategory
LimitedModerateSevere
7 Estimates of the total number of units damaged would be higher if calculated on the basis of total units rather than occupied units. See the discussion in the appendix concerning methodology.8 The damage costs cited here are based on the building-permit data described below.

24 Post-Katrina Recovery of the Housing Market Along the Mississippi Gulf Coast
units (about 35 percent of the total), and almost half of those units (44 percent) suffered major damage. Flooding overwhelmingly occurred in combination with storm surge, but, in the few cases (less than 1,000 units or about 1 percent of the total) in which it alone was the source of the damage, that damage was mostly limited (about 90 percent of these units suffered limited damage). By far, the most devastating effects were caused by the combination of storm surge and flooding, which together damaged more than 12,000 units (16 percent of the total), and more than 65 percent of these suffered major damage.
As we suggested above, these patterns have implications both for the financing of short-term recovery efforts and for planning to reduce the damage that future hurricanes do. The short-term implications arise from the fact that insurance coverage for damage is closely related to the source of that damage. Standard homeowner policies routinely exclude damage due to flooding (both storm surge and flooding), since homeowners living in traditional flood plain areas (as denoted on FIRMs) are required to obtain such insurance through the National Flood Insurance Program (NFIP).9 However, the low rates of participation in NFIP among owners living in the coastal flood plain10 suggest that many owners whose properties were damaged were, in fact, uninsured for damage to their homes caused by the storm surge and flooding. Moreover, the storm surge and flooding that occurred during Katrina was considerably more extensive than the traditional flood area as mapped by FIRMs. Since few owners who live outside the flood plain purchased NFIP insurance nationwide (see Dixon et al., 2006), we can expect that many of the owners of properties that were damaged by flooding and surge in Katrina will go uncompensated.
These patterns are also relevant to longer-term planning efforts in the coastal counties in two ways. First, although the damage due exclusively to wind and rain was predominantly limited, the combination of these two elements was the most prevalent. In light of this pat-tern and the fact that the estimates of wind damage cited above suggest that stronger building codes can reduce the damage that these sources cause, local planning authorities would do well to strengthen these codes to reduce the potential damage from future hurricanes. Second, although solely strengthening building codes may not mitigate the devastating effects of storm surge and flooding, zoning guidelines that limit or prohibit development or require homes to be elevated in areas likely to experience flooding and surge in future storms can reduce them (as noted in Governor’s Commission on Recovery, Rebuilding, and Renewal, 2005).
Sources and Extent of Damage: Location
As Chapter Two demonstrated, the majority of the coastal counties’ housing stock was in coastal and coastal-adjacent areas and the jurisdictions situated there. Not surprisingly, these areas were far likelier to experience surge and flooding and the combination of the two than were inland areas. This pattern can be seen in Figure 3.2, which shows the spatial extent of the surge inundation area and the 100-year flood plain by coastal location and jurisdiction. As
9 Homeowners living in FIRM areas who seek mortgage loans are routinely required to have proof of national flood insur-ance, and, in some cases (in which their properties are located at or below sea level), they may be required to elevate their homes.10 Recent estimates indicate that fewer than 20 percent of the owners living in the coastal counties had purchased flood insurance from NFIP (Dixon et al., 2006).

Dam
age D
on
e to H
ou
sing
Stock 25
Figure 3.2Storm Surge and Flooding, by Location and Jurisdiction
SOURCES: U.S. Census Bureau (2005a, 2005b, 2007a), FEMA (2006, 2007).RAND TR511-3.2
WavelandBay St. Louis
Pass Christian
Long Beach
GulfportD’IbervilleBiloxi
OceanSprings Gautier
MossPoint
Pascagoula
252015
Miles
1050 30
Surge inundation limit100-year flood plain
1 dot = 25 housing units 2000 Census housing units I-10 CSX railroad
Inland block groupsAdjacent block groupsCoastal block groups
Hancock County
Harrison County
Jackson County

26 Post-K
atrina R
ecovery o
f the H
ou
sing
Market A
lon
g th
e Mississip
pi G
ulf C
oast
Figure 3.3Severity of Damage
SOURCES: U.S. Census Bureau (2005a, 2005b, 2007a), FEMA (2006, 2007).RAND TR511-3.3
Waveland
Hancock County
Harrison County
Jackson County
Bay St. LouisPass Christian
Long Beach
GulfportBiloxi D’Iberville
OceanSprings Gautier
MossPoint
Pascagoula
I-10
CSX railroad
Severe damage
Moderate damage
Limited damage
252015
Miles
1050 30

Damage Done to Housing Stock 27
this map indicates, all of the coastal and coastal-adjacent areas were subject to the destructive power of these forces—often to their combined forces. As Figure 3.3 shows, these areas also suffered the most intensive damage to their housing stock.
The effects of these patterns on the housing stock in various jurisdictions are shown in Table 3.1, which indicates the percentage of units in each jurisdiction that experienced damage as well as the extent of that damage. As these data indicate, almost three-quarters of the hous-ing stock in Hancock County, which the eye of the storm hit, suffered damage, and close to 60 percent of these units experienced severe or moderate damage.11 Moreover, the municipali-ties of Bay St. Louis and Waveland, both of which are located along the coast, experienced
Table 3.1Geographic Scope and Severity of Damage to Housing Stock, by County and Jurisdiction
Jurisdiction by County
Total Occupied Units
Damaged Units (%)
Severity of Damage (%)
Severe Moderate Limited
Hancock County
Bay St. Louis 3,481 85.2 25.6 58.0 1.6
Waveland 3,157 95.7 38.8 55.2 1.7
Unincorporated area 10,259 59.7 28.3 3.3 28.1
Total 16,897 71.7 29.7 24.3 17.7
Harrison County
Biloxi 20,974 60.8 26.2 0.3 34.3
D’Iberville 2,762 52.1 16.0 0.1 36.0
Gulfport 27,839 67.9 15.0 0.9 52.0
Long Beach 7,044 80.7 35.6 0.4 44.7
Pass Christian 3,029 91.3 61.3 11.3 18.7
Unincorporated area 9,890 41.9 1.6 2.1 38.2
Total 71,538 63.9 20.4 1.3 42.1
Jackson County
Gautier 4,249 52.3 2.3 1.3 48.7
Moss Point 5,813 42.5 0.6 1.5 40.4
Ocean Springs 7,645 40.6 5.5 1.3 33.8
Pascagoula 10,191 55.3 8.2 3.1 44.0
Unincorporated area 19,778 33.7 4.0 0.3 29.4
Total 47,675 42.2 4.6 1.3 36.3
Total for all counties 136,110 57.2 16.0 4.1 37.0
SOURCES: Calculations based on FEMA and ACOE damage estimates (FEMA, 2005, 2006, 2007).
11 The building-permit data indicate that the average cost of repairing a unit with severe damage was likely to exceed $100,000, and the cost of repairing a unit with moderate damage was likely to be at least $25,000.

28 Post-Katrina Recovery of the Housing Market Along the Mississippi Gulf Coast
virtually total devastation—between 85 and 90 percent of the units were damaged, and close to 90 percent of those damaged units suffered severe or moderate damage.
The housing stock in Harrison County also experienced enormous damage—about 60 percent of these units were damaged, and about one-quarter of these units suffered severe or moderate damage. Although the overall level of damage in Harrison County was somewhat less than that in Hancock County, those jurisdictions that were close to the eye of the hurri-cane, namely Pass Christian and Long Beach, suffered damage of the same general magnitude as did those in Hancock County. By contrast, the levels of damage in Jackson County—although still substantial—were less severe than were those in the other two counties. About half of the units in Jackson County sustained damage, but about 90 percent of those units had only limited damage.
Damage by Housing Submarket
Although the level and severity of damage to the housing stock in Harrison County were somewhat less widespread than in Hancock county, they had a more pronounced effect on the housing market in the coastal counties, because more than 50 percent of the units occupied prior to Katrina were located there. This, no doubt, explains why Katrina appears to have had a more pronounced effect on the rental market—two thirds of all the rental units were located in Harrison County (see Chapter Two). Table 3.2 compares the number of damaged units and the extent of that damage by tenure and structure type. Although Katrina damaged about 20,000 more owned than rental units, the higher incidence of damage in the rental market (65 percent of the rental units were damaged versus 54 percent of the owned units) and the greater intensity of that damage in the rental market (26 percent of the rental units sustained severe
Table 3.2Housing Damage: Extent and Severity, by Tenure and Structure Type
Structure by Tenure
Damaged Units (%)
Extent of Damage (%)Total Occupied
UnitsSevere Moderate Limited
Owner
Single family 57.3 14.6 4.4 38.3 80,054
Mobile home 34.3 7.8 1.8 24.7 13,796
Total 53.9 13.6 4 36.3 93,850
Renter
Single family 51.2 18.2 4.7 28.3 17,115
Multifamily 78.5 26.3 4.7 47.6 20,750
Mobile home 51.1 11.1 2.8 37.2 4,395
Total 64.6 21.4 4.5 38.7 42,260
Total for all units 57.2 16.0 4.1 37.0 136,110
SOURCES: Calculations based on FEMA and ACOE damage estimates (FEMA, 2005, 2006, 2007).
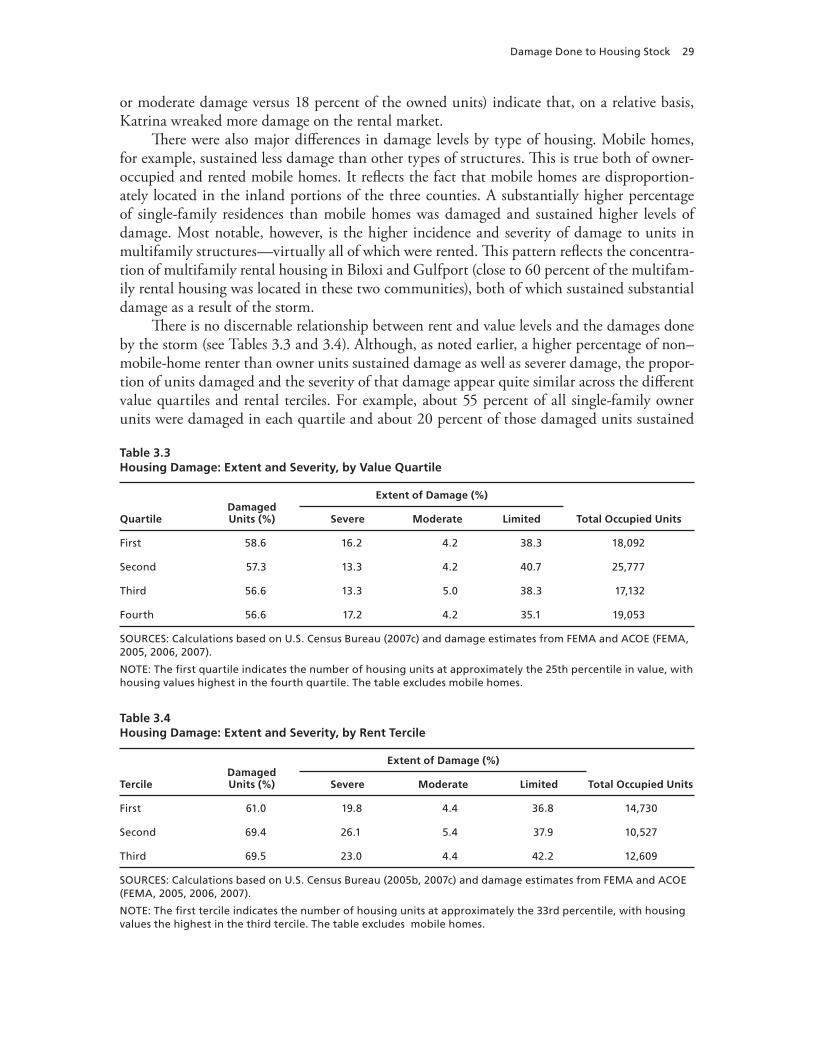
Damage Done to Housing Stock 29
or moderate damage versus 18 percent of the owned units) indicate that, on a relative basis, Katrina wreaked more damage on the rental market.
There were also major differences in damage levels by type of housing. Mobile homes, for example, sustained less damage than other types of structures. This is true both of owner-occupied and rented mobile homes. It reflects the fact that mobile homes are disproportion-ately located in the inland portions of the three counties. A substantially higher percentage of single-family residences than mobile homes was damaged and sustained higher levels of damage. Most notable, however, is the higher incidence and severity of damage to units in multifamily structures—virtually all of which were rented. This pattern reflects the concentra-tion of multi family rental housing in Biloxi and Gulfport (close to 60 percent of the multifam-ily rental housing was located in these two communities), both of which sustained substantial damage as a result of the storm.
There is no discernable relationship between rent and value levels and the damages done by the storm (see Tables 3.3 and 3.4). Although, as noted earlier, a higher percentage of non–mobile-home renter than owner units sustained damage as well as severer damage, the propor-tion of units damaged and the severity of that damage appear quite similar across the different value quartiles and rental terciles. For example, about 55 percent of all single-family owner units were damaged in each quartile and about 20 percent of those damaged units sustained
Table 3.3Housing Damage: Extent and Severity, by Value Quartile
QuartileDamagedUnits (%)
Extent of Damage (%)
Total Occupied UnitsSevere Moderate Limited
First 58.6 16.2 4.2 38.3 18,092
Second 57.3 13.3 4.2 40.7 25,777
Third 56.6 13.3 5.0 38.3 17,132
Fourth 56.6 17.2 4.2 35.1 19,053
SOURCES: Calculations based on U.S. Census Bureau (2007c) and damage estimates from FEMA and ACOE (FEMA, 2005, 2006, 2007).
NOTE: The first quartile indicates the number of housing units at approximately the 25th percentile in value, with housing values highest in the fourth quartile. The table excludes mobile homes.
Table 3.4Housing Damage: Extent and Severity, by Rent Tercile
TercileDamagedUnits (%)
Extent of Damage (%)
Total Occupied UnitsSevere Moderate Limited
First 61.0 19.8 4.4 36.8 14,730
Second 69.4 26.1 5.4 37.9 10,527
Third 69.5 23.0 4.4 42.2 12,609
SOURCES: Calculations based on U.S. Census Bureau (2005b, 2007c) and damage estimates from FEMA and ACOE (FEMA, 2005, 2006, 2007).
NOTE: The first tercile indicates the number of housing units at approximately the 33rd percentile, with housing values the highest in the third tercile. The table excludes mobile homes.

30 Post-Katrina Recovery of the Housing Market Along the Mississippi Gulf Coast
severe or moderate damage. Similarly, a little less than two-thirds of the single- and multi-family rental units in each tercile were damaged and about one-quarter of those units sustained severe or moderate damage at each rent level.
Damage to the Affordable Housing Stock
As we discussed in Chapter Two, affordable housing, particularly in the rental market, was a major problem even before Katrina. Based on the proportion of households spending more than the HUD-designated 30 percent of their income on housing and the supply of assisted and public housing, we estimate that the demand for affordable housing was approximately 38,000 units before Katrina. This included 29,000 households occupying market-rate hous-ing but spending more than 30 percent of their income (14,256 renters and 14,776 owners), 6,338 subsidized rental units, and 2,695 public housing units. Katrina has, of course, intensi-fied this supply problem by shrinking the available affordable stock. The net effect has been to exacerbate the affordability problem in the coastal counties—especially in the rental market (see Table 3.5).
Prior to Katrina, for example, there were about 25,000 rental units in the affordable rental market—more than 60 percent of which were located in Harrison County. However, Katrina reduced that stock by almost 6,000 units (3,836 market-rate units, 1,630 assisted units, and 233 public housing units) that suffered moderate to severe damage and thus were likely to
Table 3.5Affordable Rental Housing Stock: Pre- and Post-Katrina
Stock
County
TotalHancock Harrison Jackson
Stock Pre-Katrina
Market rate (low) 1,441 9,937 4,823 16,201
Assisted 630 3,892 1,816 6,338
Public 176 1,738 781 2,695
Total 2,247 15,567 7,420 25,234
Units with Severe or Moderate Damage
Market rate (low) 1,029 2,455 352 3,836
Assisted 571 903 156 1,630
Public 72 150 11 233
Total 1,672 3,508 519 5,699
Decline (%) 74.4 22.5 7.0 22.6
Remaining 575 12,059 6,901 19,535

Damage Done to Housing Stock 31
have been removed from the market at least temporarily.12 The effects of Katrina on the stock of affordable rental housing were proportionately severest in Hancock County, where close to three-quarters of the affordable stock was badly damaged. But the effect on the total affordable stock was most influenced by the damage done in Harrison County, where the majority of the affordable units were located and where the available stock declined by close to 25 percent. The damage in Jackson County had the least effect because less than 10 percent of the available stock there sustained severe or moderate damage.
These figures almost certainly underestimate the scale of the affordability problem post-Katrina, because they do not account for the storm’s impact either on the price of remaining housing or on the loss of income and employment among lower-income households. Aver-age monthly rents in the Gulfport-Biloxi metropolitan area (Harrison and Hancock coun-ties) increased more than 20 percent (from $706 to $857 per month), and total employment dropped 22 percent in the 12 months following the storm.13 As we will discuss in greater detail in Chapter Four, these findings indicate a key aspect of the affordable-housing problem: It is not simply a by-product of the damage to the housing stock but is also closely related to the loss of employment and wages that has made it more difficult for renters to afford the price increases that have followed the storm.
Cost of Repair
To estimate the costs of repairing the damage to the housing stock, we used building-permit data from the municipal jurisdictions within the three counties.14 Our approach assumes that different types of construction (rebuilding, repairs, and replacing roofs) equate to the costs of repairing different categories of damage.15 We then estimated the potential costs of repairing using two different methods. The first approach uses typical cost figures across all jurisdictions; the second uses the same basic method but, instead of applying a single set of costs for each jurisdiction, uses the actual cost figures for each jurisdiction.16 The two estimates are reported in Table 3.6, and the detailed estimates for method one are reported for different types of structures.
12 These estimates are based first on damage to rental units in the low tercile market, second on the assumption that assisted housing was damaged at the same rate as lower-tercile market-rate rentals, and third on damage estimates to the public housing stock as reported by the Mississippi Development Authority (2006a).13 See BLS (undated[a]). Total employment in August 2005 was 118,043, and, for December 2005, it was 92,219. The latest employment total (for July 2007) was 105,900.14 Building-permit data are available for all the incorporated jurisdictions within the three-county area as well as for the unincorporated portions of Hancock and Jackson counties.15 For example, we assumed that the costs to repair severely damaged properties would be equivalent to the costs of new construction. In addition, we assumed that the costs to repair moderately damaged properties would be equivalent to the median costs of repairs. Finally, we assumed that the costs of making repairs to properties with limited damage would be equivalent to the lower-quartile repairs in the building-permit data; most of these were for roof repairs.16 There is substantial variation in the estimated cost figures across jurisdiction. For example, the cost of repairs (both severe and limited) is consistently higher in Hancock County and consistently lower in Jackson County—a finding that accords with the different levels of damage in the two counties. The Harrison County estimates generally fall between the figures for the other two counties. Overall, the average (unweighted) values are as follows: new construction (rebuilding), $127,000; moderate repairs, $25,000; and limited repairs, $18,000. There is, however, substantial variation around these averages.

32 Post-Katrina Recovery of the Housing Market Along the Mississippi Gulf Coast
Table 3.6Estimated Repair Costs
Structure Type
Repair Type
TotalMajor Moderate Limited
Single family
Units 14,812 4,301 35,503
Average cost ($ thousands) 110 25 8
Subtotal ($ thousands) 1,629,320 107,525 284,024 2,020,869
Multifamily
Units 5,451 966 9,882
Average cost ($ thousands) 85 20 5
Subtotal ($ thousands) 463,335 19,320 49,410 532,065
Mobile home
Units 1,562 367 5,043
Average cost ($ thousands) 80 20 5
Subtotal 124,960 7,340 25,215 157,515
Total ($ thousands) 2,217,615 134,185 358,649 2,710,449
NOTE: Estimate using counts of units by jurisdiction and average value of building permits by level yields $3,669,275,222. Major repair uses median value of new construction by jurisdiction. Moderate repair uses median value of repairs by jurisdiction. Limited (general) repair uses 25th percentile value of repairs by jurisdiction. Limited (roof) repair uses $5,000 per roof.
It is important to note that these are estimates, not actual costs. The actual costs will differ from these estimates for several reasons. First, the values entered on the building permits are estimates before construction has actually begun. The actual costs of remodeling or rebuild-ing will often exceed these estimates.17 Second, about one-third of the building permits do not contain estimated values, and these missing figures may be higher or lower than the reported costs.18 Third, the information that jurisdictions collect on the permit application often differs as to the detail they provide on the nature of the work to be done and how that work is classi-fied. Despite these limitations, these are the best data available not only for estimating repair costs but also for monitoring the progress of the recovery effort.19
17 Indeed, anecdotal reports from residents in the three counties indicate that actual construction costs have often been much higher than the estimated costs.18 This percentage varies not only by jurisdiction but also by type of permit. Values were reported on about 85 percent of the new construction and major repair permits and almost 70 percent of the permits for repair but only about 65 percent of the permits for roof repairs.19 In addition to these building permit data, a Louisiana firm, Treen Building Reports, publishes data on permits for Han-cock, Harrison, and Jackson counties. The Treen reports exclude permits for less than $50,000. Moreover, the number of permits reported in the Treen data is about 75 percent smaller for approximately the same period as the data collected from the individual jurisdictions. The average value of the permits is also substantially higher; for example, the average permit value for new, single-family construction is 20 percent higher in the Treen data than in the building-permit data. More importantly, the Treen data report an average value for repair work that is 330 percent higher than in the building-permit data.

Damage Done to Housing Stock 33
The two estimates reported in Table 3.6 suggest that the costs of repairing the damages to the housing stock are likely to range from $2.7 billion to $3.7 billion. Given the likelihood that both of these numbers are underestimates (because actual costs are likely to exceed estimated costs), we suspect that the actual costs will almost certainly exceed $4 billion.
More than 80 percent of this total will be required to repair the approximately 22,000 units with the greatest damage—the vast majority of which are single-family units (both renter- and owner-occupied). By contrast, the cost of repairing the approximately 50,000 units with limited damage could be only one-seventh of this amount (about $350 million). Two factors drive these estimates: the estimated costs of repairs for each damage category and the number of units in those categories. Based on the building-permit data, we estimate that the average costs of repairing severely damaged units could approach or exceed $110,000 for single-family homes and $80,000 to $85,000 for units in multifamily structures and for mobile homes. By contrast, the costs of repairing moderately damaged units (of all types) are likely to be closer to $20,000 to $25,000. The costs of repairing properties with limited damage (often, but by no means exclusively, roof damage) are likely to be less than $10,000. Indeed, the building-permit data suggest that the median cost of roof repairs has been between $5,000 and $10,000.
Judging from the information provided in the building-permit data, it appears that most of the recovery efforts to date—at least as reflected in the permits—have focused on the single-family ownership market. Thus, the estimates cited here are likely to be heavily weighted by repairs in that segment of the market. Consequently, we attempted to identify permits for repairs to multifamily residential and commercial properties.20 The average value of permits for work on multiunit residential properties was much higher and varied even more substantially across jurisdictions than did the costs for other units.21 For example, the value of the work covered by these permits varied from a little less than $200,000 in Han-cock County, where the majority of the rental units are in buildings with only a few units, to more than $2 million in Biloxi, where there are many rental properties with many units. In contrast to the building-permit data from individual jurisdictions, a second source of infor-mation on construction in these counties, the Treen data, clearly distinguishes both among single-family, multiunit residential, and multiunit commercial properties and between new construction and rebuilding and repairs. However, the Treen data set reports only permits for work estimated to cost in excess of $50,000 and thus seems certain to overestimate the costs of repairs to single-family properties. Indeed, the estimated average repair value in the Treen data is three times as high as that reported in the building-permit data from indi-vidual jurisdictions. The Treen data, however, may well provide a better guide to the costs of repairing or rebuilding multiunit residential and commercial properties. In the Treen data, the average value for new construction or rebuilding of multiunit residential properties is almost $1 million and close to $700,000 for repairs to such properties. Their estimates for commercial properties are more than $100,000 and close to $200,000 for new construction and repairs, respectively.
Although the estimates reported in this section should be considered provisional, they clearly suggest that the costs of rebuilding will vary not only by the extent of the damage but
20 It is unclear in the building-permit data—and this may well vary by jurisdiction—whether permits for apartments are treated as residential or commercial properties. This arises from the fact that very few jurisdictions differentiate among property types.21 These issues are discussed in greater detail in the next chapter.

34 Post-Katrina Recovery of the Housing Market Along the Mississippi Gulf Coast
also by the nature of the residential property—a factor that needs to be taken into consider-ation in assessing the rates of recovery and the problems that recovery will confront. We discuss these issues in the next chapter.

35
CHAPTER FOUR
Progress of Recovery
Introduction
Having identified the damage that Katrina did to the housing stock, the next step is to evalu-ate the progress that has been made toward recovery. This step is critical to an assessment of the progress of recovery efforts and to identify where the major problems in the recovery effort may be occurring. Unfortunately, there is no definitive data source that can serve this purpose. However, the two sources of data on building permits described in Chapter Three (the data from individual jurisdictions and the Treen Permit Reports) provide a basis for estimating the extent, pace, and character of the recovery process.
This chapter begins by describing these sources, their complementary strengths and weak-nesses, and how they can be used to describe the recovery effort. It then uses these data to make estimates of the overall extent of recovery, the rate at which it is occurring, and how it differs by type of structure, degree of damage done to the stock, and location. These estimates are then used to suggest how the pace of recovery varies across the owner-occupied and rental markets. Finally, based on these findings, we suggest the major problems that need to be addressed to expedite the recovery process.
Data Sources and Approach
Although the Treen data set is reportedly compiled from the building-permit data of the indi-vidual jurisdictions in the three counties, there are significant differences in the information reported in these data sets. Table 4.1 summarizes these key differences. Both data sets contain building-permit information for the three counties, but, in fact, there are minor differences in the jurisdictions covered. The Treen data, for example, do not report detailed information for Bay St. Louis, while the data from the individual jurisdictions do not include information from the unincorporated area of Harrison County.1 A more significant difference is in the periods covered in the two data sets. The Treen data begin in the fourth quarter of 2005 and continue to the present.2 The data included reported by the individual jurisdictions cover different inter-vals, but 95 percent of the permits included (including all jurisdictions except D’Iberville) were issued between the last quarter of 2005 and the first two quarters of 2006. The permits issued for D’Iberville extend into the third and fourth quarters of 2006.
1 Less than 20 percent of the housing stock in Harrison County is in the unincorporated areas of the county.2 The Treen data used in this analysis cover the period from November 2005 through June 2007.

36 Post-Katrina Recovery of the Housing Market Along the Mississippi Gulf Coast
Table 4.1Comparison of Key Features of Building Permit and Treen Data Sets
Data Set Jurisdictional Data Treen
Coverage All jurisdictions except Harrison unincorporated
All jurisdictions except Bay St. Louis
Timing October 2005 to July 2006 November 2005 to June 2007
Value All values Only permits above $5,000
Types of work New and reconstruction New and reconstruction
Repairs (all levels) Repairs and renovations
Demolition NA
Temporary site permits NA
Types of property Unidentified Single and multifamily and commercial
Unit of analysis Individual permits Aggregate data (numbers and average $s) by category
A second significant difference between the two data sets is the value of the work that the permits cover. The individual jurisdiction data include all permits issued regardless of costs.3 The Treen data, on the other hand, explicitly exclude permits when the estimated value of the proposed work is less than $5,000. In fact, the values of the building activities included in the Treen file suggest that the lower limit on estimated values is substantially greater than $5,000.4
A third significant difference between these data sets is the information they include about the nature of the work for which the permits have been issued. The jurisdictional data contain information on all types of building activity, including demolitions, preparation of building sites, temporary housing,5 new construction and complete rebuilding, major repairs, and a variety of more limited repairs—primarily, but not exclusively, roof repairs. By con-trast, the Treen data focus overwhelmingly on new construction, major rebuilding, and major repairs (the average value of the permits for single-family units exceeds $120,000).
Fourth, the Treen data contain information on the types of properties for which the permit was issued—specifically, this data set distinguishes among single-family and multifam-ily residential properties and commercial properties. By contrast, only three of the jurisdictions (Biloxi, Pascagoula, and Bay St. Louis) report information on property type. Thus, we do not know from the individual jurisdiction data whether the work for which the permit was issued was for a single-family home, an apartment complex, a school or church, or even a commercial property. However, where the jurisdictional data include information on property type (e.g.,
3 Indeed, about one-third of permits included in the jurisdictional data contain no estimate of costs. The majority of the permits without cost estimates were issued in the last quarter of 2005 and the first quarter of 2006. It is unclear whether this finding reflects the decision of individual jurisdictions to waive permit fees for owners whose properties were damaged or destroyed in the immediate aftermath of the storm.4 As demonstrated in the tables reported below, the average values reported for particular types of building activity in the Treen data set almost never fall below $50,000.5 Indeed, permits were issued for site preparation for more than 8,000 temporary housing units, primarily in Hancock and Harrison counties.

Progress of Recovery 37
Biloxi, Pascagoula, and Bay St. Louis) the overwhelming majority of permits issued were for residential properties. Thus, we assume that the number of permits listed in the jurisdictional database is limited to residential properties.
Finally, the data reported by the jurisdictions contain information on individual permits, in contrast to the Treen data, which report only aggregate information (e.g., number of per-mits issued and the average value of the work) for general categories of properties and activities, (e.g., permits for new construction of single-family residential properties).
As this discussion indicates, there are notable gaps in both of these data sets. But using both in combination, we can address a series of issues about the progress of the recovery effort. For example, because the jurisdictional data set includes all types of construction activity at all estimated dollar levels, it can be used to gauge the overall progress of the recovery effort, by comparing the number of permits issued to the number of damaged units. The Treen data, which exclude permits for building activity of relatively low value, are less well suited to addressing this issue, because the majority of damaged units sustained limited damage (esti-mated repair costs of less than $20,000). On the other hand, the Treen data are better suited to addressing the timing of recovery efforts, because they include permits over a longer period—in general, a year longer than that reported in the jurisdiction data. In addition, because the Treen data report property type more completely than the jurisdictional data do, they are better suited for estimating how the recovery activity varies across different kinds of property, e.g., single-family versus multiunit properties. Finally, by combining data on damage levels by jurisdiction with the building-permit data on types and timing of repairs (the Treen data set), we can evaluate whether recovery efforts appear to differ for jurisdictions that suffered signifi-cantly different levels of damage.
It is important to note that both of these data sets are based on building-permit informa-tion and not on actual construction activity. As a result, although building permits may be a sign of an owner’s intention to repair or rebuild his or her property, a permit—unlike a certifi-cate of occupancy—cannot be taken as an indication that the construction work has actually occurred.
Progress of Recovery Efforts
In the comparisons reported below, we address several aspects of the recovery process. First, we estimate the overall progress of recovery by comparing the number of building permits to the number of damaged units. Our initial comparison uses the jurisdictional permit data, because these data include all construction activity at all estimated value levels. Next, because the Treen data include an additional 12 months of activity (July 2006 through June 2007) we estimate how the overall level of recovery efforts might have changed between July 2006 and July 2007, under the assumption that the ratio of permits reported in both data sets for the fourth quarter of 2005 and the first two quarters of 2006 remained constant for the following 12 months.
Table 4.2 compares the number of permits issued to the estimated number of units dam-aged in each jurisdiction, using the jurisdictional data. To determine whether the pace of recovery varies by damage levels, we classify jurisdictions into three damage categories, based on the percentage of units damaged (reported in Table 3.1 in Chapter Three). The first cat-

38 Post-Katrina Recovery of the Housing Market Along the Mississippi Gulf Coast
egory includes four areas in which damage levels exceeded 75 percent.6 The moderate category includes six areas in which more than half but less than three-quarters of the housing units sustained damage. The low damage category includes four areas in which damage levels were less than 50 percent. When viewing these comparisons, it is important to note that building
Table 4.2Comparison of Building Permits Issued to Damaged Units, by Jurisdiction and Damage Level (Fourth Quarter of 2005 Through Second Quarter of 2006)
Jurisdiction
Damaged Unitsa Permitsb
% Number Number Ratio
High damage
Waveland 95.7 3,021 598 0.20
Pass Christian 91.3 2,766 550 0.20
Bay St. Louis 85.2 2,964 2,448 0.83
Long Beach 80.7 5,682 623 0.11
Subtotal 86.4 14,433 4,219 0.29
Moderate damage
Gulfport 67.8 18,903 786 0.04
Biloxi 60.8 12,747 3,403 0.27
Hancock (unincorporated) 59.7 6,125 4,019 0.66
Pascagoula 55.3 5,628 4,247 0.75
Gautier 52.4 2,223 325 0.15
D’Iberville 52.1 1,440 685 0.48
Subtotal 61.7 47,066 13,465 0.29
Low damage
Moss Point 42.5 2,468 487 0.20
Harrison (unincorporated) 41.9 4,144 NA NA
Ocean Springs 40.6 3,101 885 0.29
Jackson (unincorporated) 33.7 6,676 298 0.04
Subtotalc 28.4 12,245 1,670 0.14
Grand totald 57.2 77,888 19,354 0.25
a Damage estimates from Chapter Three.b Permits: Building permits by jurisdiction.c Excludes 4,144 for Harrison (unincorporated).d Includes 4,144 for Harrison (unincorporated).
6 Although, as reported in Table 3.1, a high proportion of the housing units in the unincorporated areas of Jackson County was damaged, the vast majority of those units sustained limited damage. In the other four jurisdictions in this cat-egory, the majority of the damaged units sustained severe or moderate damage.

Progress of Recovery 39
permits do not reflect finished (or even actual) construction activity; thus, they are best viewed as a measure of planned rather than actual rebuilding activity.
Overall, these comparisons suggest that, by the second quarter of 2006, building permits had been issued for about one-quarter of all damaged units. At this pace, it will take at least three more years for the number of permits to equal the number of damaged units. The prog-ress of recovery activity, however, appears to vary substantially by jurisdiction (see Figure 4.1). In some communities, most notably Bay St. Louis and Pascagoula, the pace of recovery appears to be very rapid; in others, most notably in unincorporated Jackson County and Gulfport, the rate lags substantially.
Understanding why rates of progress differ across jurisdictions is important to current recovery efforts (and may well be relevant to recovery from future storms). The reasons for these differences, however, are unclear. Several factors could play a role. They could simply be a by-product of variations in how and when jurisdictions report building permits.7 In addi-tion, some jurisdictions encouraged applicants to file for permits as soon as possible by waiving permit fees in the immediate aftermath of the storm. This practice could result in the period between permit issuance and actual construction varying across jurisdictions. We suspect that both of these factors play roles, but we do not know their importance.
These differences could also be by-products of differences in the types of households and their housing units across jurisdictions. Such differences could affect permitting practices in several ways. If, for example, the proportion of different types of either households or housing units differs across jurisdictions in ways that affect the rate at which units are repaired, then that could be reflected in the rate at which permits are issued. For example, as indicated in the preceding chapter, the rental market sustained a higher incidence of damage as well as more serious damage than did the owner-occupied market, and that might account for the differ-ence, since repairing or rebuilding more seriously damaged units generally takes longer. Thus, the rate at which permits are issued could well be slower in areas in which a large fraction of properties are rental units. Similarly, there may well be differences in the resources that differ-ent types of homeowners and landlords have available, due to differences in insurance cover-age, access to homeowners’ grants and loans, or their own assets, to finance rebuilding and repair; such differences could account for variations in the rates at which permits were issued.8 Finally, the average seriousness of the damage done to the housing stock across jurisdictions might account for these differentials. However, as Table 4.2 indicates, those jurisdictions that sustained the lowest average severity of damage appear to have lower ratios of permits to dam-aged units than do those jurisdictions with high to moderate damage levels. However, we do not have a theory as to why this is the case.
From a policy perspective, understanding precisely why recovery rates appear to differ substantially across jurisdictions—e.g., why they appear to be so high in Bay St. Louis but much lower in Gulfport—could well be critical to understanding not only why recovery is proceeding at its current pace but also what might be done to expedite it. While this issue
7 As indicated, there are differences in the periods for which jurisdictions reported these data as well as in the types of information they collected. We were also told that several jurisdictions delayed the reporting of permits when, due to staff shortages, the individuals who handled these duties were assigned to other tasks (Richard, 2006).8 These differences could occur even if the procedures that insurance companies and the state homeowner-assistance program used to process claims did not vary across jurisdiction, if the likelihood differed between households maintaining insurance and filing for claims from the insurers or from the state’s grant program.

40 Post-Katrina Recovery of the Housing Market Along the Mississippi Gulf Coast
Figure 4.1Relative Rates of Damage and Permit-to-Damage Ratios for the 10 Coastal Cities
RAND TR511-4.1
Damage level
Ratio of building permitsissued to damage level
SevereModerateLow
0.04–0.150.16–0.500.51–0.82
WavelandBay St. Louis
Pass Christian
Long Beach
GulfportBiloxi D’Iberville Ocean Springs
GautierMoss Point
Pascagoula
WavelandBay St. Louis
Pass Christian
Long Beach
GulfportBiloxi D’Iberville Ocean Springs
GautierMoss Point
Pascagoula
is beyond the scope of the current analysis, it is certainly an issue that should be addressed in the short run. Based on our observations and analysis, we have identified several possible expla-nations for these differences, but we can only speculate as to which factors are the most impor-tant. Thus, we remain uncertain as to what actions policymakers can and should take if they wish to accelerate the pace of recovery in the jurisdictions that are lagging. We note, however, that this is certainly an issue that requires further analysis to determine what actions might be taken to promote a more rapid and complete recovery of the housing market.
However, if differences in levels of damage contribute to this differential, they are not likely to have an effect beyond the limited-damage category, since the differences across the two higher damage categories are neither large nor consistent, i.e., the ratio of permits to dam-aged units appears to be approximately the same for jurisdictions in the severe- and moderate-damage categories. Indeed, this comparison suggests that the differences appear to be greater across jurisdictions, including among jurisdictions within each category, than across damage categories. In sum, although there are several potential reasons for the differences in rates of recovery across jurisdictions, we do not know precisely why they occur.9
The key question, of course, is whether the rate of recovery will change over time. Recov-ery could accelerate if, for example, households that have delayed rebuilding and repairing as they wait for settlement of their insurance claims or for their applications for Mississip-pi’s Homeowner Assistance Grants to be processed begin to rebuild when they receive that financing.10 On the other hand, if backlogs in construction activity (due to demand exceeding
9 Although finding a definitive answer to this issue might be possible, it is beyond the scope of this analysis.10 By mid-March 2007, the Mississippi Homeowner Assistance Grant program had made payments to approximately 80 percent of the eligible applicants to the first phase of its grant program. In addition, the Insurance Information Institute reported that approximately 95 percent of the claims filed with private insurers in Mississippi and Louisiana had been

Progress of Recovery 41
supply), disputes about insurance coverage, or substantial numbers of uninsured losses have proliferated, that may slow down the recovery process even after those who are better able to afford to rebuild have done so.11
To examine this issue, we compare the timing with which permits were issued using the Treen data (see Table 4.3) for different types of recovery activities (new construction, rebuild-ing, and repairs) and for single-family and multifamily residential properties. These data indi-cate that the recovery process was just getting under way in the last quarter of 2005. Less than 10 percent of all the permits issued for single-family properties and less than 5 percent of the permits for multifamily properties had been issued by the end of 2005. Subsequently, the number of permits issued climbed steadily, reaching a first peak in the second quarter of 2006, slowing somewhat in the next two quarters, and then climbing again in the first two quarters of 2007.
Assuming that the ratio of the total number of permits issued in the jurisdictional data to those contained in the Treen data that was observed between the fourth quarter of 2005 and the second quarter of 2006 ([19,354/2,706] = 7.17) remains constant for the next four quarters (third quarter of 2006 through second quarter of 2007), then the number of permits issued by the jurisdictions will have increased by 26,916 (3,754 × 7.17) between July 2006 and June 2007. If so, the overall ratio of permits issued to damaged units would have climbed to 0.60 (46,270/77,888).
Whether this pace will change in the future is unclear. One major factor affecting this pace is likely to be the capacity of the construction sector. Assessing this capacity, construction
Table 4.3Timing of Recovery, by Type of Property and Activity
Quarter
Single Family Multifamily
New (n = 4,260)Repair
(n = 2,200) Total (n = 6,460) New (n = 120) Repair (n = 38) Total (n = 158)
4th 2005 3 13 6 1 5 2
1st 2006 11 27 16 8 40 16
2nd 2006 18 22 19 14 26 17
3rd 2006 15 12 14 13 24 16
4th 2006 16 8 13 13 0 10
1st 2007 20 10 16 20 0 15
2nd 2007 17 9 14 30 5 24
SOURCES: Treen Permit Reports (November 2005 through June 2007).
settled by August 2006. Finally, FEMA reported that, by December 2006, 97 percent of the claims filed under NFIP had been paid.11 See Mead (2006) and Hipp (2007). Moreover, there is substantial reason to believe that residents of the coastal counties suffered substantial uncompensated loss. Estimates suggest that less than 20 percent of the homeowners living in Harrison and Jackson counties participated in NFIP (Dixon et al., 2006). Finally, state homeowners’ grants were initially limited to homeowners whose residences were damaged by storm surge or flooding and who maintained homeowners’ or flood insurance on their properties (phase I). The program was subsequently expanded in phase II to provide assistance to those homeowners who suffered flood or surge damage but whose properties were not insured.

42 Post-Katrina Recovery of the Housing Market Along the Mississippi Gulf Coast
Table 4.4Comparison of Permits Issued to Damaged Units, by Category
Damaged Units
Level of Damage
TotalSevere Moderate
All single family 14,812 4,301 19,113
% 29 51 34
Owner-occupied single family 11,697 3,503 15,200
% 36 63 43
SOURCES: Treen Permit Reports (November 2005 through June 2007).
activity. For example, after climbing through the first half of 2006, the number of permits issued dropped off somewhat in the last two quarters of the year. However, the pace once again picked up in the first two quarters of 2007. It is unclear whether this pattern reflects a tempo-rary variation or a more consistent seasonal pattern—with construction activity rising during the first half of the year and then falling in the second half. Data on tax revenues from retail sales of lumber and other building materials also demonstrate some seasonal variation. Retail sales tax revenues, for example, climbed steeply from a December 2005 total of $2 million to monthly totals of between $5.5 and $7 million between January and June 2006. This total then dropped over the next few months—reaching a low of less than $3 million in October. Revenues subsequently rose to $6 million in December 2006 but plummeted again in early 2007. Sales tax revenue from contracting services shows a similar, although not identical, pat-tern of variability, with January 2007 totals at the lowest levels since January 2005—before the storm.12
Finally, the pattern of construction employment in the coastal region suggests that, after rising rapidly in the immediate aftermath of Katrina (total construction employment rose from 8,200 in August to 11,400 in December 2005 and then continued to climb through the first two quarters of 2006, reaching a total of 11,800 in June 2006), total employment has fluctu-ated within a relatively narrow band of 11,500 to 12,300. Overall, it is unclear whether the seasonality of construction activity will continue.
Regardless of the overall pace of recovery, there are significant differences in the progress being made in different submarkets (see Table 4.3). The pace at which permits have been issued (and recovery is proceeding) has been more rapid in the single-family than the multifamily markets and in repairs rather than rebuilding. Recovery, for example, started sooner in the single-family than the multifamily market (almost 30 percent of the permits for new, single-family units were issued by the second quarter of 2006 versus less than one-quarter of permits for new, multifamily properties). In addition, half of the permits issued for new construction of multifamily properties were issued in 2007, by which time substantial activity had already taken place in the single-family market. In addition, the pace of repairs (in both the single-family and multifamily markets) has proceeded more rapidly than has that of new construc-tion. For example, more than 60 percent of the permits issued for repairs to single-family units were issued by the end of the second quarter of 2006, versus less than one-third of the permits
12 These data are compiled by the Mississippi State Tax Commission and were provided to the authors in a memo from Brian Richard, director of the Economic Resource Center at the University of Southern Mississippi.

Progress of Recovery 43
for new, single-family construction. Similarly, more than 70 percent of the permits issued for repair to multiunit properties were issued through the second quarter of 2006, versus less than 30 percent of the permits for new construction.
Cost differentials no doubt contribute to these differences. For example, although the per-unit cost of rebuilding and repairing multifamily properties is less than that for single-family homes (see Table 3.6 in Chapter Three), the total costs of construction are much higher for multifamily properties. Similarly, the costs of rebuilding residential properties exceed those of repairing them. Given these cost differentials, owners who need to rebuild their residences as well as landlords may be slower to begin reconstruction than those whose reconstruction costs are likely to be substantially lower.
The comparisons reported above focus exclusively on the total number of permits issued, without regard for the damage done in different market sectors. To gain a clearer sense of amount of construction (both rebuilding and repairs) relative to the number of units damaged, Table 4.4 compares the number of permits issued with our estimates of damaged units. This comparison looks first at the number of new construction and reconstruction permits issued as a percentage of the estimated number of single-family units that sustained severe and moderate damage in the storm. Because the Treen data set does not identify whether the permits were issued for owner-occupied or rental units, we list both the total (owned and rented) number of single-family residences and the number of owner-occupied single-family residences in both damage categories. These numbers provide a rough estimate of how construction activity com-pares with the approximate demand both for new construction (severe damage) and repairs (moderate damage) in the single-family market.13
The results suggest that not only has the pace of permits issued for repairs been more rapid than that for new construction and rebuilding but also that these repairs cover a larger share of the existing demand. For example, the permits for repairs represent between 51 and 63 per-cent of the demand for single-family homes needing major repairs, versus between 29 and 36 percent of the single-family homes needed to be rebuilt.14 These comparisons are based on the Treen data and thus include only the higher-cost repairs for which permits have been issued. As a result, they almost certainly underestimate number of repairs actually made, since the more complete jurisdictional data indicate that the total number of permits issued for repairs (including roof repairs, which cost substantially less than other repairs) outnumber the number of permits issued for new building and reconstructions by roughly 10 to 1.
Although we have no corresponding base to use in estimating the demand for multifam-ily repairs versus new construction and rebuilding, it seems clear that the number of permits issued for single-family units far exceeds that issued for multifamily properties (6,460 versus 158, or 40 to 1). These comparisons strongly suggest both that repairs are proceeding more rapidly than new building or reconstruction and that repairs to the single-family (presumably owner-occupied) stock are proceeding more rapidly than they are to the multifamily (over-whelmingly rental) stock.
To gain a clearer picture of the costs of both new construction and repairs, Table 4.5 compares the average costs of construction activity (both new building or reconstruction and
13 Although these comparisons contrast permits issued with the number of single-family units damaged (both owner- and renter-occupied), we suspect that most of the permits were issued for owner-occupied units.14 The higher figures in these comparisons assume that all single-family homes are owner occupied; the lower figure assumes that they include both owner- and renter-occupied units.

44 Post-Katrina Recovery of the Housing Market Along the Mississippi Gulf Coast
Table 4.5Value of Permits, by Structure Type and Date of Permit
Permit Date
New or Reconstruction Repair Total
Number Value ($) Number Value Number Value
Single family
November–December 2005 125 124,496 279 89,416 404 100,270
1st quarter 2006 463 161,607 584 88,227 1,047 120,677
2nd quarter 2006 774 154,302 481 107,865 1,255 136,504
3rd quarter 2006 640 160,077 269 96,217 909 141,670
4th quarter 2006 683 141,355 178 83,848 425 128,338
1st quarter 2007 839 130,691 214 100,332 1,053 124,521
2nd quarter 2007 736 129,544 195 74,774 931 118,073
Total 4,206 144,805 2,200 93,279 4,040 128,621
Multifamily
November–December 2005 1 260,000 2 7,500,000 3 5,026,667
1st quarter 2006 10 399,000 15 325,000 25 354,600
2nd quarter 2006 17 251,176 10 141,309 27 210,485
3rd quarter 2006 16 231,500 9 372,333 25 282,200
4th quarter 2006 16 3,051,060 0 0 16 3,051,060
1st quarter 2007 24 320,542 0 0 24 320,542
2nd quarter 2007 36 1,287,806 2 65,000 38 1,223,497
Total 120 967,569 38 669,435 158 885,209
Commercial
November–December 2005 26 263,769 0 0 26 263,769
1st quarter 2006 41 7,668,463 69 283,203 110 3,053,891
2nd quarter 2006 62 484,710 64 203,422 126 341,833
3rd quarter 2006 83 574,434 41 375,000 124 508,082
4th quarter 2006 44 646,341 80 99,988 124 293,855
1st quarter 2007 61 445,672 40 207,963 101 351,530
2nd quarter 2007 96 1,316,656 238 121,996 334 465,371
Total 413 1,053,678 532 191,323 945 713,524
SOURCES: Treen Permit Reports.
repairs) in the single- and multifamily residential sectors as well as for commercial construc-tion. These results highlight several important points about the costs of construction activity.
First, the costs of both rebuilding and repairing single-family units are very high when compared with the market values reported in the 2000 Census. The average cost of rebuilding,

Progress of Recovery 45
for example, is approximately $145,000, and the average cost of repairs is more than $90,000, versus the median estimated value of $85,522 reported in the 2000 Census. In addition to suggesting that market values (and thus replacement costs) have risen sharply since 2000, this finding could also signal a serious underinsurance problem among homeowners. In other words, to the extent that homeowners based their insurance coverage on the original value of their homes, their insurance policies are unlikely to provide coverage for the current replace-ment values of their homes.
Second, these findings clearly document the significant cost differences between single- and multifamily properties and between the costs of rebuilding versus repairs. The average costs of new construction within the multifamily market, for example, are more than six times higher than the costs of new construction within the single-family market ($967,569 versus $144,805). Similarly the costs of new construction are between 50 percent (in the single-family market) and 40 percent (in the multifamily market) that of repairs.15 These costs underscore the potential importance of an owner’s (both homeowners’ and landlords’) ability to secure the financing to repair or rebuild their units to the pace of recovery in both markets.
Third, the fact that the average costs of reconstruction in the single-family market peaked in the third quarter of 2006 and then steadily declined suggests that higher-income owners (whose houses are likely to cost more to replace) were quicker to rebuild their homes than lower-income homeowners. Problems with underinsurance as well as the time lag at which Mississippi Homeowners Assistance Grants were distributed could well account for this pat-tern, since the high cost of replacing badly damaged units could have led such households to delay their rebuilding plans until they had secured adequate financing.Finally, it is interesting to note the greater scale and more rapid pace of construction activity in the commercial than the multifamily residential sector. Indeed, the number of commercial permits issued by the second quarter of 2007 exceeds that in the multifamily residential sector by more than 6 to 1 (945 versus 158), despite the fact that the average value of that activity is similar ($713,524 versus $885,209). This difference in construction activity is especially pronounced for repair activity, for which the number of permits in the commercial sector exceeds those in the multifamily residential sector by more than 10 to 1. Moreover, virtually all of the permits issued for repairing multifamily properties were issued by the third quarter of 2006. Unfortunately, there is no definitive way to gauge the relative demand and thus the relative progress toward recovery across these two sectors. However, we suspect that financ-ing issues may play a role in accounting for these differences. For example, to the extent that landlords had insurance policies that failed to provide for the replacement value of their prop-erties (which appears to be an issue in the single-family market) then they may face more dif-ficulty in securing adequate financing to repair or replace their properties. Owners of commer-cial property may not only have had more complete insurance coverage; many will also have had business-interruption insurance that helps maintain their cash flow during periods when their businesses are shut down. In addition, unlike homeowners, landlords do not qualify for grants from the Mississippi Homeowners Assistance program. Finally, a federal SBA loan, a potential source of funds to finance repair, has a $250,000 cap, which would appear to limit its use among landlords, whose average repair and rebuilding costs far exceed this amount. In combination, high construction costs and limitations of insurance coverage and financing
15 The actual cost differential within the single-family market is, in all likelihood, even greater than this, because the Treen data set excludes low-cost repairs.

46 Post-Katrina Recovery of the Housing Market Along the Mississippi Gulf Coast
options may represent a major impediment for landlords who lacked adequate insurance cov-erage, depended heavily on the cash flows from rents, or lacked the personal assets and access to financing that is necessary to repair or rebuild their properties. This may be a particular impediment to smaller (“mom and pop”) landlords.
Summary of Key Recovery Findings
Although building permits are imperfect measures of housing market recovery, these data indicate that recovery is proceeding along the Mississippi Gulf Coast. By the end of the second quarter of 2007, permits appear to have been issued for at least 60 percent of the housing units that Katrina damaged. However, the pace of the recovery effort appears to have been uneven both over time and across market sectors. The recovery effort started slowly so that, by the end of 2005, permits had been issued for only about 5 percent of the damaged stock. The pace of recovery then picked up through the first half of 2006 before slowing somewhat in the last half of the year. But recovery perked up again in the first two quarters of 2007.
Progress toward recovery has also been uneven across market sectors. It has been more rapid in the single-family (predominantly owner-occupied) market than in the multifamily (overwhelmingly rental) market. In addition, more progress has been made in repairing than rebuilding damaged units—at least in the single-family market—suggesting that more prog-ress has been made among units with moderate or minor damage than among those in which the damage was more severe. Within the single-family market, progress appears to have been more rapid among more rather than less expensive units—suggesting that financing recovery may be problematic for many households—especially for those with lower financial means.
The high costs of repair and rebuilding the damaged stock (the average costs of repair-ing and especially rebuilding units significantly exceeds the median value of units reported in the 2000 Census) suggest that financing may be a major problem slowing down the pace of recovery efforts, both for households of moderate and lower means and for smaller-property landlords.
The greater damage levels in the rental market (see Chapter Three) and its slower pace of recovery have no doubt reduced the available supply of habitable rental units. This has increased the tightness of the market and resulted in a 20 percent increase in rents. In combination with a 13 percent employment loss in the Gulfport-Biloxi area, these rent increases will have com-pounded the problems of finding affordable housing—an issue that, even before Katrina, was a major problem. This problem will be particularly severe for lower-income renters and owners who were displaced from the housing they occupied prior to Katrina.
Chapter Five builds on this analysis by identifying the key issues for recovery.

47
CHAPTER FIVE
Key Issues
Introduction
The preceding chapters have described the characteristics of the housing market in Mississip-pi’s three coastal counties before Hurricane Katrina; estimated the source, intensity, and loca-tion of Katrina’s effects on that market; and assessed the recovery efforts made by July 2007. These comparisons indicate that, although Katrina’s effects on the housing market were wide-spread, they were not even. Indeed, a higher percentage of the rental stock, especially multi-family rental properties, was damaged and damaged more severely than in the owner-occupied market. Similarly, housing units in the coastal and coastal-adjacent zones were likelier to have sustained moderate and severe damage than were those located inland.
Although recovery in the housing market began slowly, the pace of repairs has since picked up. By July 2007, permits had been issued for 60 percent of the units damaged by the storm. Once again, however, this progress has been uneven. Recovery has been more rapid in the owner-occupied market than in the rental market, among single-family than multi-family units, and among units that sustained limited or moderate damage than among those that sustained severe damage. Our previous analysis suggested that several factors might have contrib uted to these findings, including the high cost of repairs, a potential backlog in the con-struction market, and the difficulties that homeowners and small-property landlords face in obtaining financing. Moreover, the combination of slower recovery in the rental market, rising housing rents, and the fact that employment levels—although recovering—remain below pre-Katrina levels, have exacerbated what was already a very tight affordable-housing market.
In this chapter, we look in more detail at the problems facing recovery and the current attempts to deal with these problems. We begin with a discussion of some general consider-ations that policymakers should bear in mind as they attempt to craft remedies to the housing problems created by Katrina. We then discuss the construction, financing, and affordable-housing issues in some depth. Finally, we examine some longer-term questions that will need to be considered during the short-term recovery process.
Before we begin, however, we highlight the principal findings of our analysis.
There is considerable evidence (rising construction costs, stable employment levels, and fluctuating sales of building materials) that, at least in the short term, suggest that the growth in construction capacity has not matched the recovery need. However, over the long run, construction capacity does not appear to be the major constraint on recovery.

48 Post-Katrina Recovery of the Housing Market Along the Mississippi Gulf Coast
Access to financing appears to be the single most important obstacle to recovery in the Mississippi coastal housing market. Despite the availability of potential financing from a variety of sources (insurance, Mississippi Homeowner Assistance Grants, and govern-ment loans), there are gaps in the funding they provide. Those holes appear to be most pronounced for the un- and underinsured households that have suffered major damage to their units and for landlords. Filling these holes would probably do more to expedite recovery than would any other policy action.Affordable housing was in short supply before Katrina. The damage wrought by the storm—particularly to the rental stock—rising rent levels, and the pace of recovery have compounded this supply problem. Although efforts have been made to expand the afford-able-housing supply, the full effects of these measures have yet to be felt. In the meantime, the available supply remains limited—a factor that has, no doubt, slowed the overall pace of economic recovery along the U.S. Gulf Coast.Understandably, the immediate pressures of restoring the housing stock have taken prece-dence in recovery efforts over efforts to remediate potential damage from future storms. However, Katrina was not the first devastating hurricane to hit the area—nor will it likely be the last. Although local officials clearly realize this fact, the pressures to deal with the immediate recovery can conflict with the need to recognize the importance of longer-term mitigation actions. Correspondingly, three types of action need to be taken: efforts by state and local governments to limit damages from future storms (e.g., land-use planning and zoning); enactment of regulations to encourage mitigation of damages to individuals and their housing (e.g., building codes); and, finally, better planning for and application of assistance throughout the region to ensure better and faster reconstruction after the next major hurricane.
General Considerations
Although the Mississippi coast has weathered hurricanes before, the damage that Katrina wrought was of a different order of magnitude than that caused by prior storms. As two federal reports on the emergency response to the storm indicated, this feature of Katrina severely complicated the emergency response efforts, since it totally overwhelmed the capac-ity of the traditional model used to respond to natural disasters.1 Similarly, the scale and scope of the damage caused by Katrina complicate the recovery effort in ways that may chal-lenge the capacity of the traditional approaches to recovery. Policymakers should keep this in mind as they craft policies to promote housing recovery in the gulf region. In addition, as the region’s experience with recovery from Camille in 1969 indicates, there are likely to be conflicts between the goals of the immediate recovery process (e.g., rebuilding the housing
1 See EOP and Assistant to the President for Homeland Security and Counterterrorism (2006) and USJFCOM (2006). These reports document the operational problems that occurred during the response efforts and attribute them in large part to the fact that the damage caused by Katrina made the federal government’s typical “pull model” of response (in which the federal government responded to requests from state and local officials) infeasible.

Key Issues 49
stock) and the longer-term objective of mitigating the damage that future storms may do.2 Each of these issues is discussed later.
The scale of the damage caused by Katrina complicates the recovery process in several ways. For example, and although this point may appear self-evident, the range and amount of resources needed for recovery will be enormous. Moreover, it will include not just the material and financial resources that have been the focus of much of the recovery effort but also the ability to coordinate the activities of the wide range of actors involved in the recovery effort. These parties include not just governmental officials at the federal, state, and local levels but also the private sector as financers, builders, developers, and employers, as well as a wide array of nongovernmental organizations and volunteers. Coordinating the activities of these various actors so that they are working in concert rather than at cross-purposes will require consider-able organizational skill and goodwill as well as sharing of information.
Indeed, given the range of interests and actors involved, there may be a real potential for discrepancies among the expectations of these parties, their perceptions of the progress of the recovery effort, and the reality of the situation. To prevent this from occurring, it is important that there be accurate information and transparency about the various recovery efforts as well as inclusion of various interests in the decisionmaking process.
In addition, the damage Katrina caused involved not just the region’s housing stock but also the region’s infrastructure, economy, and public sector. Recovery along these dimensions is interrelated, and focusing on a single dimension to the exclusion of the others may be coun-terproductive. Solving the housing affordability problem, for example, will require not simply repairing the damaged stock and building new units but also replacing the employment and wages that were lost in the storm. Restoring employment, however, will require dealing with the housing affordability and availability issues. The president of Northrop Grumman’s Ship System facility in Moss Point, who stated that the shortage of affordable housing was the major challenge to his firm’s attempt to hire new workers, underscored this linkage between hous-ing and employment (see Teel, 2007). Moreover, the Gulf Coast Business Council recently established the Gulf Coast Renaissance Corporation to acquire and develop land to provide workforce housing (Sanderson, 2007). Furthermore, securing the capital needed for this effort will also require information about the levels of infrastructure and services needed to support this development and where they should be located.3 In sum, the scale of the damage wrought by Katrina increases the complexity of the recovery process and the need for coordination and planning in the recovery effort.4
An additional factor in this complexity is the real possibility that efforts to expedite short-term recovery in the housing market will result in insufficient attention being paid to
2 The Governor’s Commission on Recovery, Rebuilding, and Renewal (2005) highlighted this point in its report. Pielke, Simonpietri, and Oxelson (1999) discussed the potential conflict between these two objectives after Hurricane Camille.3 The president of the Renaissance Corporation, for example, told us that projections of future employment and popula-tion growth by location was a critical need.4 Another example of the interrelationship among recovery along these multiple dimensions is provided by the absence of needed information on permitting and construction activity. As we noted in the previous chapter, the building-permit data from the individual jurisdictions does not generally extend beyond the second quarter of 2006. This situation is appar-ently due to local officials being overwhelmed by the magnitude of the tasks facing them. However, as a result, information needed to make decisions about where resources are most needed is incomplete. Strengthening local governments’ capacity in this and other areas could significantly improve the planning and recovery processes. This should, we believe, be a prior-ity for local governments.

50 Post-Katrina Recovery of the Housing Market Along the Mississippi Gulf Coast
the longer-term goal of mitigating damage from future storms. As several sources have noted (e.g., Governor’s Commission on Recovery, Rebuilding, and Renewal, 2005; Pielke, Simon-pietri, and Oxelson, 1999), this appears to have occurred in the recovery efforts after Camille. A study by Pielke, Simonpietri, and Oxelson (1999) on the damage that Camille did noted the following:
A massive rebuilding effort took place in the months and years following the hurricane. Ironically, hurricane mitigation was not a key thought to those rebuilding immediately after Camille. A need for structures to live and work out of led to a rapid rebuilding effort. The same characteristics that led to absolute destruction of homes and businesses were repeated in the months immediately following the hurricane. Confusion immediately fol-lowing Camille allowed unregulated repair and rebuilding. Building permits were initially waived, then a non-uniform moratorium was imposed, then lifted again, prior to the new building code being in place. (Pielke, Simonpietri, and Oxelson, 1999, p. 14)
The perils of repeating these mistakes after Katrina appear to have been recognized in the current recovery efforts. The Mississippi Homeowner Assistance Grant program, for example, conditions its grants on the recipients’ agreement to comply with new and stricter building codes, the enforcement of elevation requirements, and the purchase of flood and homeowners’ insurance. Similarly, the penalty that uninsured homeowners who lived in the flood plain must pay to receive homeowners’ grants is clearly designed to minimize the moral hazard that arises from individuals assuming that the government will provide relief in the event of a disaster.5
However, the application of these requirements and stricter zoning regulations relating to minimum lot sizes, setbacks, and design guidelines, as well as “smart growth” zoning prin-ciples, will increase building and land costs and thus make it costlier and more difficult to rebuild and repair the current stock and to provide affordable housing.6 In fact, as we discuss shortly, home prices appear to have been increasing sharply in the coastal market during the past year. Moreover, as Pielke, Simonpietri, and Oxelson (1999, p. 14) noted, “The introduc-tion of development management by regional authorities and the state and federal government was politically unpopular but crucial to the acceptance of even the barest minimum of land use regulation after the storm.”
Thus, despite the fact that current recovery efforts appear to have learned the lesson from the Camille experience, if prices continue to climb and the pace of recovery seems to be lag-ging, political pressure to ignore these lessons and to expedite the recovery process may well increase.
Indeed, these considerations suggest that, in light of the complexity of the recovery pro-cess, the need to coordinate the efforts of multiple parties, the linkage across recovery in differ-ent areas, and the need to balance short-term and longer-term goals, the recovery effort might well benefit from the establishment of an overall coordinator for recovery efforts. The role of such an office would be to serve both as a clearinghouse for information about the recovery process and as a coordinator of recovery efforts. The role of this office would not be that of
5 This creates a moral hazard problem, an issue that Weiss (2006), Litan (2006), and Burby (2006) discuss more fully. Moral hazard refers to the fact that government aid provided to individuals after the disaster relieves those individuals from the consequences of what might have been prevented if they had taken care to prevent what was a foreseeable event before the fact.6 See the discussion in Bernstein et al. (2006).

Key Issues 51
a “czar” (since the private sector will drive much of the effort) but rather that of a coordina-tor who receives and disseminates information, reviews and evaluates developments, identifies problems, and raises issues arising during the recovery process.
Short-Term Recovery Issues
As discussed in the preceding chapter, recovery in the coastal counties’ housing markets has been uneven. More progress appears to have been made repairing single-family homes than multiple-unit properties, more in the owner than the rental market, and more in repairing moderately damaged than destroyed units. Moreover, as we suggest in Chapter Four, at the current pace, it appears that recovery will take at least another three to four years. In light of this situation, three specific issues arise. First, to what extent is the capacity of the construc-tion sector adequate? Second, what are the sources of funds to finance recovery, and are they adequate to the task? Third, how big a problem is replacement housing, and what can be done to increase its supply? This section discusses each of these issues in turn.
Construction Capacity
The capacity of the construction sector to meet the increased demand of the housing sector caused by Katrina will depend on having adequate supplies of building materials and labor at reasonable prices. The discussion in the previous chapter provides mixed evidence on these issues and thus on how well the construction industry is meeting the increased demand for construction capacity caused by Katrina. Specifically, those data suggested that the rate of housing repair and rebuilding might well have slowed since reaching a post-Katrina peak in the second and third quarters of 2006. Construction employment in the coastal region as a whole has been at approximately the same level (11,500) since June 2006.7 Sales of building materials have fluctuated considerably but dropped sharply in the third quarter of 2006 and, after rising slightly in November and December, fell again in January 2007. We have no direct evidence of price levels in the construction market, but the repair and rebuilding costs reported in the permit data in the preceding chapter exceed substantially the median values of owner occu-pied homes reported in the 2000 Census. In addition, there is evidence to suggest that housing prices in the Gulfport-Biloxi area grew at double the national rate (and at the highest rate ever recorded for those areas) between the second quarter of 2005 and the second quarter of 2006.8 Several factors appear to have contributed to these increases in value, including reductions in the stock (and therefore supply) and increases in insurance premiums, as well as increases in land prices; therefore, it is probably impossible to identify the impact of a tight construction market on prices. However, although the slowdown in new construction nationwide should have benefited the construction industry in the Mississippi coastal region, the surge in activity in the Gulf of Mexico coastal region has, no doubt, increased prices there (see Doyle, 2006).
7 Construction employment in Jackson County actually declined 17 percent from January 2006 to January 2007 (from 4,100 to 3,400).8 See Lawler (2006). Also note that the median value of single-family homes reported in the 2000 Census was $85,000, while the average cost for rebuilding reported in the permit data was almost twice that ($153,000), and even the average costs of major repairs exceeded it ($94,000). Finally, David Berson (2006) of Fannie Mae cited data indicating that home prices in the three coastal counties increased by more than 20 percent between the third quarter of 2005 and the third quarter of 2006.

52 Post-Katrina Recovery of the Housing Market Along the Mississippi Gulf Coast
In addition, informal reports suggest that a shortage of affordable housing for construction workers migrating to the region may have placed a constraint on increases in labor supply. Thus, there is reason to expect that higher prices and tighter labor market conditions may have placed some constraints on the capacity of the industry—at least in the short term. Over the longer term, however, it would appear that other factors probably play a larger role in slowing the pace of recovery in the housing market.
Financing
As we have already noted, housing prices in the coastal counties have risen sharply in the after-math of Katrina. Lawler (2006), for example, reported that house prices in Gulfport-Biloxi rose 15 to 18 percent between the third quarters of 2005 and 2006, while Berson (2006) sug-gested that the increase might have been closer to 20 percent. Although neither provided a precise reason for the magnitude of these increases (although both suspected that the destruc-tion of a significant share of the stock is the primary factor), there is evidence that a similar phenomenon occurred in Florida after Hurricane Andrew in 1992.
The Office of Federal Housing Enterprise Oversight (OFHEO), for example, reports that, within eight months of Andrew, housing prices in the most seriously affected portion of Miami-Dade County (the county hit most severely by the storm) began to experience a rapid escalation of prices—more modest price increases occurred earlier in the less affected areas of the county. The price increases in both the least and hardest hit areas continued for two years before returning to pre-Andrew levels (OFHEO, 2005).
This information suggests that the availability of funding to finance rebuilding could be a major obstacle to the rebuilding effort. Although property owners have a variety of sources from which to seek funding, these sources tend to be targeted at different types of house-holds, depending on the nature, value, and location of their property. The principal sources of funding available in the gulf region include insurance, grants, loans, and a variety of tax incentives—designed to encourage landlords, in particular, to rebuild, repair, and build new rental units—as well as one’s own assets. As suggested, the relative importance of these sources appears to vary between the owner and renter markets as well as for different groups of owners within these markets.
Insurance
The single most important source of financing in two recent disasters (the Northridge earth-quake and Hurricane Andrew) was insurance.9 Insurance coverage for damage that occurred due to Katrina was available in a variety of ways for different types of perils. Indemnification for losses due to flooding and storm surge, especially in the traditional floodplain,10 which are
9 See Peacock (2005). He suggested that insurance payouts provided about 65 percent of the funding for reconstruction after the Northridge earthquake and about 90 percent of the funding for reconstruction after Hurricane Andrew.10 A distinction is made within the coastal counties between areas (and properties) in the traditional floodplain (sometimes referred to as special flood hazard areas and identified on the FIRM) and those outside that area. Property owners living in the FIRM-designated areas are typically required to maintain flood insurance to obtain financing. Although property owners living outside the floodplain may also purchase insurance from NFIP, in fact, very few do so. For example, although 60 percent of the properties within special flood hazard areas in the South purchase protection from NFIP, only about 3 percent of the owners of property outside the floodplain do so (III, undated[a]; also see Dixon et al., 2006). Dixon et al.

Key Issues 53
excluded from traditional homeowners’ policies, was covered by NFIP. Insurance for wind damage, which, in the coastal counties, is also frequently excluded from most homeowners’ policies, was instead provided by the Mississippi Windstorm Underwriting Association, a state government program that requires insurance companies doing business in the state to pool the risk for indemnifying property owners who cannot otherwise obtain coverage for wind damage. Finally, traditional homeowners’ policies for damage to property and contents are available either from individual insurance companies or from the Mississippi Residential Prop-erty Insurance Underwriting Association for property owners who cannot otherwise obtain coverage.11
Coverage and claim payments from these sources vary widely. Although less than 20 percent of all the single-family property owners throughout Harrison and Hancock appear to have flood insurance, coverage rates within the coastal areas were much higher.12 By the end of January 2007, more than 19,000 claims were filed with NFIP, and 98 percent of those claims were settled with an average payment of almost $130,000.13 Since an unknown proportion of these claim payments were for damage both to property and contents, the average claim pay-ment, although substantial, still left a gap between the property loss and the claim payment.14 In addition, it appears that approximately 9,000 to 10,000 (about 25 percent) of the house-holds living in single-family residences in the coastal areas of these two counties did not have flood insurance.
Although the data needed to disaggregate claim payments from the other sources of insur-ance are not available, the total number of Katrina-related insurance claims paid in the three counties exceeded 235,000, with an average payout of $35,454.15 Since many of these claims were for automobiles, other personal property (e.g., contents of residences), and non–real estate commercial losses, it appears that there was considerable uncompensated loss for structural damage even among property owners who had insurance.16 An additional factor contributing to the uncompensated loss problem is the fact that deductibles for hurricane-related policies are higher than for other perils.17 The problems of uncompensated loss will, of course, be severer for property owners who had severe losses, for those with lower incomes and assets, and for
report NFIP participation rates for about 20 percent in both Harrison and Jackson counties—a below-average rate for coastal areas in the South.11 In addition to these sources of indemnification for property damage, there is a variety of other types of insurance avail-able for individuals and households who may have suffered losses due to the storm, including automobile insurance, com-mercial multiperil insurance, and business-interruption insurance.12 Judging by the ratio of claims filed to coastal single-family properties, the coverage rates in the coastal areas of Harrison County was 77 percent and, in Jackson County, about 50 percent.13 NFIP figures cited in III (undated[a]). These payments are for damage to property and contents.14 As noted in Chapter Four, the average repair cost for severely and moderately damaged single-family houses was about $125,000.15 Excluding the NFIP claims settled and paid from these totals yields about 217,000 claims paid at an average payout of $43,014. Data on all insurance claims reported by Mississippi Insurance Department (2006b) and III (2006).16 This is less likely to be true for households whose units experienced limited damage, since these payouts are likely to cover a substantial share of the costs of minor repairs, which, as we noted in Chapter Three, are lower.17 Traditionally, insurance deductibles were calculated on a dollar basis, but, in recent years, they have increasingly been calculated on a percentage basis. Hurricane deductibles typically range from 2 to 15 percent, and, for wind and hail damage, 1 to 5 percent. See III (undated[c]).

54 Post-Katrina Recovery of the Housing Market Along the Mississippi Gulf Coast
landlords who depended primarily on rents for cash flow and income—presumably owners of small rental properties.18
Although a precise estimate of the percentage of funds available for rebuilding coming from insurance payments is impossible at this point, the payout rates to date suggest that this percentage will be lower in the case of Katrina than either of the other two disasters cited earlier.
In addition to providing a major source of financing for recovery, the insurance sector has also contributed to the escalation of housing costs in the market as companies have attempted to reduce their exposure by increasing their rates (see Hedde, 2007). Indeed, the increasing costs of providing insurance coverage in coastal areas has led insurers in the coastal regions of Mississippi to raise prices and to discontinue coverage or refuse to write new policies in the coastal region. The net effect has been to raise recovery costs (Johnson, 2007).
Grants
The second major source of financing is grants—specifically those provided by the Mississippi Homeowner Assistance Grant program. This program, funded by Community Development Block Grant (CDBG) funds from HUD, consists of two components. The first component, phase I, provides grants of up to $150,000 to repair structural damage to the owner’s primary residence.19 These grants are available only for properties outside the FIRM and to homeown-ers who maintained insurance on their property prior to Katrina. Rental properties and second homes are not eligible. Applicants are required to maintain flood insurance on their proper-ties, to comply with applicable building codes, and to satisfy FEMA flood elevation standards. Additional grants of up to $30,000 are available to bring properties into compliance with FEMA flood elevation standards. As of March 14, 2007, 18,235 applications for phase I grants had been received, of which 14,744 were determined to be eligible, and 11,640 claims were paid an average of $69,235.
Presumably in recognition of the special financing problems facing low-income hom-eowners as well as those who lived in the floodplain but who lacked flood insurance, the state subsequently instituted a phase II grant program. The phase II program provided grants up to $100,000 (plus an additional $30,000, if needed to comply with FEMA flood elevation stan-dards) to households whose primary residence was damaged by flood and storm surge. The phase II program was available only to households whose incomes fell below 120 percent of the area’s median income (AMI) and to households whose head was aged 65 or older or were disabled. The program also included households who lacked flood insurance, whether the resi-dence was inside or outside the flood plain, but their grants would cover only 70 percent of the estimated damage.20 Grantees of the phase II program are also subject to the requirement that they maintain flood insurance and comply with applicable building codes and flood elevation
18 For a discussion of the problems with the coastal insurance market, see Hipp (2007).19 Grant amounts are calculated based on the property’s original value plus 35 percent minus the percentage of total damage to the property caused by the storm. The grant amount is subsequently reduced by any amount received from insur-ance, amounts that may have been received from an SBA loan, mortgage payments that might be in arrears, and any taxes due to state and local governments. A third-party assessment is required to calculate the damage percentage.20 This feature of the program was presumably designed to reduce the moral hazard problem discussed above.

Key Issues 55
standards. There are currently no data available on the number of applications or grants paid under phase II.
The Mississippi Development Authority has provided a third and special category of grants to public-housing authorities in the three counties. These grants, totaling $105 million21 and also funded by HUD’s CDBG funds, are slated for repairing or rebuilding public hous-ing damaged or destroyed by Katrina. These units are provided for low-income households in the coastal regions whose incomes are at or below 60 percent of the AMI. These grants also specify that the public-housing authorities must maintain the same number of units as existed before the storm. In addition to the funds provided by the Mississippi Development Authority, public-housing authorities in Biloxi and Gulfport (Regional Housing Authority VII) received $25 million in grants from HUD to repair public housing units (see HUD, 2007).
Although these grant programs cover some of the gaps in insurance payments, espe-cially for low-income and special-needs households who were un- or underinsured (whether they lived in or outside the floodplain), they still leave some holes in certain property owners’ financing needs. First, with the exception of the public-housing grants, these programs exclude all rental properties (both single-family and multiunit properties). Second, homeowners whose properties were severely damaged and who were un- or underinsured are likely to face a sig-nificant gap between the funds available from phase I and II grants and the amount needed to repair or rebuild their homes. Third, low-income individuals who had fallen behind in their mortgage or tax payments and who face a major repair bill are also likely to find themselves short of needed cash to rebuild.22
Loans
Loans are a third source of financing. There are several categories of loans available for owners of property that suffered damage in Katrina. The SBA provides two categories of loans to disaster victims. The first is loans to individuals for up to $40,000 for personal-property losses (not available for real property) with documentation of actual losses. The second, and more relevant to this discussion, is real-property loans to repair damages up to $200,000. These loans are designed to help owners (individuals and landlords) to repair and rebuild damaged properties and bring them back to their prestorm condition. They cannot be used to upgrade damaged properties, although they do allow loan recipients to upgrade their properties to meet existing building codes. They also allow an owner to spend up to 20 percent of the loan to protect against future disasters (including funds to modify the unit to meet elevation standards). They can also be used to refinance mortgages if the owner cannot obtain credit elsewhere, if the property suffered an uncompensated loss of at least 40 percent of the original value, and if the applicant can demonstrate his or her ability to repay the loan. Finally, they can incorporate the costs of debris removal if it is paid to a third party. SBA
21 Of the $105 million, only $5 million can be used for administration; the remainder must be spent on repairing or rebuilding the damaged housing units.22 Mortgage foreclosures have not been a major problem in the coastal region despite the significant loss of jobs in the region (7.3 percent of subprime loans and 1 percent of prime loans; see Thompson, 2007) because Mississippi state law mandates that, after a declaration of disaster, all mortgage foreclosures must be filed in chancery court, and the law autho-rizes the chancery court to delay foreclosures for up to two years, so long as the mortgagee makes some payment to the lien holder. This period ends October 4, 2007. See State of Mississippi (2005).
56 Post-Katrina Recovery of the Housing Market Along the Mississippi Gulf Coast
loans are provided for 30 years with varying interest rates depending on the applicant’s abil-ity to obtain credit elsewhere. If alternative financing is available, SBA disaster loans charge either the market rate or 8 percent, whichever is lower. If financing is not available from an alternative source, the interest rate charged is either half the market rate or 4 percent, which-ever is less.
In addition to SBA loans, the USDA has a variety of loan programs available for indi-vidual homeowners and those who want to be homeowners as well as to individuals and groups who seek to buy or rehabilitate affordable multifamily housing. These loans are designed to promote both homeownership and affordable rental housing in rural areas of demonstrated need.23
Direct ownership loans are available for the purchase, repair, and renovation of “modest homes”24 for households with very low (below 50 percent AMI) and low (50–80 percent of AMI) incomes that cannot secure credit elsewhere and who currently occupy inadequate hous-ing. These direct loans are for terms of between 33 and 38 years (depending on the household’s income) and are provided at below-market interest rates.25 In addition to USDA’s direct loan program to very low and low-income households, USDA also provides a guaranteed mortgage loan program to moderate-income households (up to 115 percent of AMI). This program, like the direct loan program, is for the purchase, repair, and renovation of single-family homes and requires no down payment, and the payment for the mortgage, insurance, and taxes cannot exceed 22 to 26 percent of the household’s income. These loans are for 30-year terms at an interest rate set by the lender.
In addition to these loan programs for individuals, USDA also has a variety of loan pro-grams to sponsoring agencies to promote rental housing.26 Most of these programs are designed to be used in conjunction with USDA’s rental assistance program (§521) that provides direct rental subsidies to old, disabled, and low-income residents of multifamily housing so that their total rental payment remains less than 30 percent of their total income.
The specific loan programs available in this category include the following: the Hous-ing Preservation Grant (HPG) program, which provides grants to sponsoring agencies for the repair and rehabilitation of homes to be occupied by very low and low-income households and for which the sponsoring agency acts as the homeowner; a direct mortgage program (Sec 515) to provide affordable rental housing to very low and low-income households on favor-able mortgage terms (up to 50-year terms at 1 percent interest);27 and a guaranteed mortgage program to provide new and renovated housing for very low and low-income tenants as well
23 Rural areas appear to be defined as places with less than 20,000 inhabitants, which would cover all of the incorporated and unincorporated areas of the coastal region except Biloxi, Gulfport, and Pascagoula.24 Modest homes are described in terms of size, design, and costs (see USDA, 2007).25 The rates paid are based on the household’s ability to pay, which is assessed on the basis that the total payment for the mortgage, insurance, and taxes cannot exceed 26 percent of the household income.26 Sponsoring agencies may be individuals, trusts, associations, partnerships, and for-profit and nonprofit organizations. For-profit sponsors must operate on a limited for-profit basis—that is, they receive less than an 8 percent return on their initial investment.27 In new projects, 95 percent of the tenants must be very low or low-income renters. In existing projects, 75 percent of the tenants must meet these criteria. These loans can be for amounts up to $1.5 million, but nationwide, this program provides only $100 million.

Key Issues 57
as special-needs households28 with incomes of up to 115 percent of the AMI. These loans are guaranteed for up to 90 percent of the loan with 40-year terms. The rates are to be negotiated with the lender.
Although these loan programs, unlike the grant programs, include both renter- and owner-occupied housing, they have various features that may limit their utility to specific housing submarkets. The SBA loans, for example, would appear to be well suited to households that lack insurance or have limited to moderate damage and have sufficient assets and income to repay their loans. They would appear to be less useful to landlords of large properties with moderate or severe damage, because they are limited to $200,000. Small-property landlords, on the other hand, may be discouraged from applying by the loss of rental income and thus the cash flow to repay the loan as well as the potential complexity of the loans and the loan process.29 The USDA programs, on the other hand, often have limited funding,30 appear to be limited to the smaller jurisdictions in the three counties,31 require a nonprofitlike sponsoring agency,32 often require cooperation from market lenders, and may well require agreement and permission on siting and zoning from the jurisdictions in which these properties are located.
Other
The final sources of financing are the various tax incentives and bonding provisions authorized by the Gulf Opportunity Zone (GO Zone) legislation. The most relevant of these to the hous-ing market’s recovery is a variety of tax incentives to encourage commercial enterprises to speed repairs of real estate (treating up to 50 percent of the cleanup and demolition costs of damaged properties as a deductible business expense), bonus depreciation allowances (up to 50 percent in the first year) for real estate expenditures, to supply housing for their employees (a 30 per-cent tax credit of up to $600 per month per employee for up to six months), and an employee retention tax credit (up to 40 percent of the first $6,000 in wages) to continue paying wages while the business is disrupted.33 Probably the most important of the GO Zone measures for the recovery of the housing market was raising the per capita bonded indebtedness limit from $1.9 to $18 per capita to provide loans to supply housing to low- and moderate-income house-holds. This provision has enabled the state to issue $380 million in bonds to provide loans for
28 Special-needs households are defined as those whose head is over 65 or disabled.29 It is important to bear in mind that the majority of rental units are on properties with few units. Single-family homes (detached and attached), for example, constitute 41 percent of the rental stock in the three counties; small two- to nine-unit properties 29 percent of the stock; and large properties (with 10 or more units) only about 20 percent of the stock.30 Nationwide funding for the HPGs is about $10 million, with an additional $100 million each for the rental housing direct and guaranteed loan programs. The direct and guaranteed homeowner loan programs have somewhat higher levels of funding for Mississippi, but the total statewide funding for these two programs is $17.8 million and $47.7 million, respectively.31 Fifty-eight percent of all rental housing in the three counties is located in Biloxi, Gulfport, and Pascagoula.32 Although there are currently several nonprofits working on housing recovery, the long-term nature of their involvement in not just the funding and repair or rebuilding of these properties but also their management may discourage them from taking on this type of commitment.33 This tax credit was limited to the period ending January 1, 2006.
58 Post-Katrina Recovery of the Housing Market Along the Mississippi Gulf Coast
affordable housing for 3,400 households in the coastal counties.34 Although the cost per unit of these loans (about $112,000/unit) may be considered high and it will take some time for the new units to be constructed, this provision will provide a direct boost to the affordable housing stock in the coastal region.35
Financing Summary
Financing is probably the single most important resource needed for recovery in light of the high costs of repair and rebuilding and the escalation in housing prices in the ownership market. A lack of sufficient financing to repair and rebuild the housing stock will slow the pace of recovery and limit its ability to restore the overall capacity of the market. As this discussion indicates, there is a variety of sources available to finance housing recovery along the coast. However, these various sources differ both in the amount of funding they provide and in their applicability to specific segments of the housing market.
Undoubtedly, the two largest sources are insurance payments and the Mississippi Hom-eowner Assistance Grants. Insurance, particularly flood insurance, provides a base on which to build the recovery effort. However, that base is incomplete, since it leaves uncompensated losses for those who were un- and underinsured. Mississippi Homeowner Assistance Grants help to fill some of those gaps, particularly for homeowners who had uncompensated losses. But these grants are less generous for some than others, since they both are reduced for unin-sureds living within the floodplain and exclude rental housing.
Loans, particularly SBA disaster loans, are the least selective source of financing, since all those who suffered losses and lived in the disaster area are eligible to receive them. However, they are more generous to homeowners than renters, since renters are limited to the much smaller personal-property loans than to real estate loans. Moreover, within the rental market, they are likely to provide a more generous source of financing to smaller than larger landlords, because the size of the loans are capped at $200,000. USDA loans, on the other hand, provide selective support, given their limitation to smaller communities, the overall limits on pro-gram funding in the coastal counties, and their requirement for sponsoring agencies for rental- property loans. They do, however, directly address the problem of providing funding for afford-able housing for low-income and special-needs households. In sum, these various programs and sources of funding provide a base for financing recovery but not without leaving some holes in funding for specific submarkets. These gaps are most evident for the un- and under-insured, those whose units suffered the severest damage, and for landlords, particularly those with large, multiunit properties.
The Supply of Available Housing
The third major issue for short-term recovery is providing an adequate supply of replacement housing for those who were displaced by Katrina. More than 22,000 units were severely dam-aged by the storm, and another 10,000 sustained moderate damage. Even if one-quarter of
34 The Mississippi Home Corporation (undated) describes these bond measures.35 Although the tax credit provisions of the GO Zone legislation are directly relevant to economic recovery, they are likely to be less pertinent to the housing market for several reasons. First, some have expired, e.g., the employee retention tax credit; second, others require business to supply employees with housing, which they may be disinclined to do; and third, and probably most relevant, they apply only to businesses with sufficient income to benefit from tax credits—something that is likely to be less relevant to small landlords.
Key Issues 59
these units have subsequently been made habitable, there still would be more than 15,000 severely damaged and more than 7,000 moderately damaged units to be made habitable. This problem is likely to be particularly acute in the affordable-housing submarket, in which 20 percent of the housing stock sustained severe damage, rents have risen by more than 20 percent since Katrina,36 and almost 40 percent of the households were already paying more than 30 percent of their incomes for housing before the storm. Although all three counties have subse-quently lost population, the number of households that has left is still only about one-third of the number of units lost.37 Moreover, not all those residents who left the three coastal counties will have left the region altogether. As Teel (2007) noted, the number of Northrop Grumman employees living in Jackson County (where the company’s facilities are) has dropped, but the number living in surrounding counties has increased.
As a result, the coastal region has a tremendous need for replacement housing after Katrina. Recognizing this problem, the state, in conjunction with FEMA, has taken a variety of actions to deal with this problem. First, FEMA provided trailers and mobile homes to house displaced residents in southern Mississippi.38 Second, since the FEMA program under which these trailers were obtained limited their use to 18 months, the state appealed to FEMA and was given an extension to keep the trailers in place until August 2007. Third, cognizant of the fact that the FEMA trailers provide only a temporary solution to the replacement-housing problem, the state issued the bonds described above to construct 3,400 new affordable units. This number, however, is substantially lower than the number of units that the storm severely damaged, and they will not be ready for occupancy until well into the future. Fourth, the Mis-sissippi Development Authority has authorized $105 million to repair damaged and destroyed public housing units in the three counties (also as discussed above). Finally, the state has sought funding from FEMA for a pilot program to demonstrate the feasibility of a model cottage house as a longer-term substitute for FEMA trailers.
Although these initiatives may have relieved some of the short-term pressure of providing housing for those displaced by Katrina, none is a long-term solution. The occupants of FEMA trailers, for example, are required to move to permanent housing within two years. The new construction that has been authorized will not be ready for occupancy for some time and will not be sufficient to house all those who have been displaced. The rebuilding of public hous-ing units will, similarly, house only a small portion of those who lost their housing. And the pilot program is just that: a pilot. Clearly, a longer-term solution to this problem needs to be found.
36 HUD reports that the average monthly market rent for a two-bedroom apartment went from $600 before the storm to $820 six months later. It estimates that apartment rents increased between 25 and 30 percent between August 2005 and March 2006. Moreover, it expects upward pressure on rents to continue for at least the next 12 to 24 months (HUD, 2006b).37 Using census estimates of the population of the three counties for July 1, 2006, Hancock County had lost a little more than 1,000 households since the 2000 Census (the county gained population between the census and Katrina and subse-quently lost that gain plus about 1,000 households). Harrison County, which lost about 1,200 households between the date of the census and Katrina, subsequently lost about 6,700 more after Katrina. Jackson County, after having gained about 1,000 households between the census and Katrina, lost about 1,300 in the period after Katrina.38 At this program’s peak, there were more than 38,000 of these trailers in the southern portion of the state. By mid- February, the number was down to 29,000. We do not know exactly how many of these trailers were in the three coastal counties, but the building-permit data from Hancock and Harrison counties included approximately 6,000 to 8,000 per-mits for providing site facilities for temporary trailers.
60 Post-Katrina Recovery of the Housing Market Along the Mississippi Gulf Coast
Over the longer term, the supply of available housing, including affordable housing, will recover with the rebuilding and repairing of the damaged housing stock. The recent establish-ment of the Gulf Coast Renaissance Corporation by the Gulf Coast Business Council should help in this regard, but, as our analysis of the recovery efforts to date suggests, that will take time. There is, however, a variety of other actions that might expedite this process.
First, as we demonstrated in Chapter Three, the costs of repairs vary enormously with the severity of the damage. Thus, it would seem to make sense to assign a high priority to the repair of limited and moderately damaged units to return them to the available stock as soon as possible.39 The critical issue is how to do this. For ownership units, the key may be provid-ing information about financing together with assisting the homeowner in arranging for and making repairs. For rental properties, on the other hand, the problem is somewhat different. Landlords of large properties are likely to be relatively sophisticated about financing and real estate matters. But as we noted above, almost 60 percent of the rental properties in this market are either single-family homes or two- to four-unit properties. The owners of these properties may be less familiar with the financing options available and may also be willing to provide rental discounts to tenants who are willing and able to help them with repairs. Both the public and nonprofit sectors can play important roles in facilitating such efforts.
Finally, although Katrina has no doubt worsened the affordable-housing problem, this problem predated the storm and will, in all likelihood, continue as recovery nears comple-tion. Thus, longer-term efforts such as those represented by the Renaissance Corporation are a step in the right direction. However, affordability is not simply a housing problem; it is just as much an income and employment problem. Indeed, the sharp drop in employment caused by the storm has undoubtedly contributed significantly to the worsening of the affordable- housing situation. Thus, as we suggested at the beginning of this chapter, housing recovery in all its dimensions is not really separable from economic recovery.
Long-Term Considerations
Katrina was not the first major weather event to severely impact the gulf coast (and elsewhere). Nor will it be the last. Thus, recovery in the coastal region requires attention not just to the task of repairing the damage done by Katrina but also to making efforts to mediate the poten-tial damage that future storms will do. Indeed, as we have already suggested, the importance of taking mitigation measures now appears to have been one of the lessons learned from the expe-rience with Camille. The importance the Governor’s Commission gave to this issue, as well as the organization of the annual Coastal Development Strategies Conference and charettes that took place in the immediate aftermath of the storm, provide evidence of this.
Nonetheless, it is important to recognize the special circumstances that arise in the wake of a major disaster and the pressures that they can exert on the recovery process. First, the scale of the damage done by Katrina creates, in a real sense, a clean slate and drives the public to attempt to recover what was lost. This can place real pressure on the recovery effort—especially as the time after the hurricane lengthens. Despite an initial commitment to longer-term con-
39 The average cost of repairing these units is less than half that of rebuilding severely damaged units. Although we assume that a good portion of the units that suffered limited damage is already habitable, there are more than 50,000 units in this category, and returning any of them that are not currently habitable to habitability would cost limited funds and presum-ably take little time. There are many fewer moderately damaged units (about 7,000), but they are less likely to have been habitable than are units with limited damage. They are also considerably less expensive to repair than are severely damaged units. Thus, they may offer a good target for focused efforts.

Key Issues 61
siderations, the pressures to expedite recovery are likely to increase. Moreover, as the mayor of Charleston noted in reflecting on his city’s recovery from the devastation of Hurricane Hugo, major disasters accelerate market trends already in place.40 Given the gulf coast’s recent history, those trends have favored rapid growth and development keyed to the region’s location on the Gulf of Mexico and the desire to live and work on the coast.
These circumstances could well increase the pressure on local planning efforts. Indeed, the local planning context may lend itself to responding to such pressures. Planners and decision-makers, for example, deal with multiple influences on the decisions they make. Their decisions typically include a range of social, economic, and environmental considerations, and they gen-erally seek to maximize the benefits to society and minimize the costs. But these decisions are also made in a political context, and decisionmakers will struggle with the conflicting pressures between achieving the short-term goals of facilitating recovery and finding additional housing, on the one hand, and the longer-term goals of protecting the region from future disasters and strengthening the region’s economic base on the other.
Local planning decisions will also be influenced by policies at the state and federal levels as, for example, in requiring flood insurance in flood-prone areas and in the incentives pro-vided for directing economic development and fulfilling housing needs. In combination, these feed back to decisions on how to develop land within their jurisdictions and have direct impli-cations for contending with the environmental concerns tied to those lands.
Dealing with environmental issues is also challenging for local officials. Regional and global environmental concerns largely fall outside the control of local planning authorities, and responding to them will have longer-term implications for local residents that do not always mesh well with local, immediate needs.
In light of this context, it may be useful to take a longer and broader view of flood events of the past to inform planning for the future. Kahan et al. (2006), for example, examined the experience in four major floods that have occurred since 1948 and paid close attention to the cycle of restoration (the anticipation of the event, the actuality of the event, the immediate crisis, and the aftermath.) In Kahan’s framework, Mississippi is currently dealing with the after-math of Katrina, which includes both the recuperation from the event and making decisions about changes that must be made to better anticipate the next cycle. In reviewing both the prior history and subsequent experience with flood-control efforts in these flood-prone areas, Kahan and his colleagues concluded that there had been a clear shift away from reliance solely on what they termed structural remedies (those that depend on controlling floodwaters, e.g., levees, dams) to nonstructural approaches (those that focus on managing the flood hazard). As they describe it, a successful approach to limiting future disasters in flood-prone areas employs a concept of integrated water management policy, (e.g., zoning policies that include leaving otherwise valuable land unprotected and uninhabited) to serve as a buffer, building codes that minimize damage to existing structures, and comprehensive planning for future economic development. In contrast, increased development induced by adding structural barriers (e.g., levees) often increases flood risk. Local planning decisions might do well to bear these prin-ciples in mind in preparing for future hurricanes along the coast.
In this context, longer-term planning would seem to require that considerable atten-tion be devoted to three sets of issues: first, actions that state and local officials might take to
40 See interview with Mayor Joseph P. Riley (O’Bryon, 2006).

62 Post-Katrina Recovery of the Housing Market Along the Mississippi Gulf Coast
avoid damage from future storms (e.g., land-use planning, environmental policy, and struc-tural measures to limit future damage); second, individual actions that local officials, property owners, and developers might take to mitigate the damage that future storms might do (e.g., elevating properties in the floodplain and using more stringent building practices and codes to limit damage); and third, steps that the coastal region might take (based on lessons learned from the Katrina recovery process) to ensure better and faster reconstruction after the next major hurricane.41
In terms of the first of these issues, for example, local jurisdictions should consider zoning policies that take inventories of lands that are likely to experience severe damages in the future (as demonstrated by the past). These may be those enclosed by current advisory base flood elevation maps prepared by FEMA. A choice here may be whether to build or rebuild on lands where floods are expected to occur. Where building in such areas is allowed, the choice here may not simply be whether to allow landowners to self-insure or be required to buy insurance against future flood damage, but what types of incentives to enact to ensure that future devel-opments (housing, businesses, major infrastructure) not be placed in locations that face known future disasters—even if that means surrendering lands to nature where these lands are prone to environmental hazards.
In addition, given the coastal region’s recent growth history and its economic develop-ment prospects, local officials might well consider embarking on a longer-term development strategy that envisions not just its current recovery efforts and preparations for mediating future storms but a broader long-term strategy that incorporates its infrastructure, housing, employment, and public facility needs. Thus, despite the devastating effects of Katrina, the aftermath of this disaster could create an opportunity for considering broad improvements to social and physical infrastructure that go beyond mere flood control.
In terms of individual mitigation, both individuals and local building and zoning officials might consider longer-term planning decisions to enact and enforce building codes for new construction and retrofitting old structures and whether such codes include policies to sub-stantially reduce the risks of damage from future severe weather events. The LSU Hurricane Center, for example, has estimated that several mitigation measures (e.g., protecting building openings, improved roof sheathing attachments, and improved roof-wall connections) reduced destruction of buildings by 50 to 93 percent, which translated to an estimated $3 billion reduc-tion in economic loss caused by a modeled category 3 hurricane passing through Mississippi (Louisiana State University Hurricane Center and T. Eric Stafford Associates, 2006).
The Multihazard Mitigation Council (MMC) (National Institute of Building Sciences, Multihazard Mitigation Council, and Applied Technology Council, 2005) has concluded that mitigation (e.g., enforcing strong building codes, land use, and zoning measures) is sufficiently cost-effective to warrant federal funding on an ongoing basis before disasters and during post-disaster recovery (National Institute of Building Sciences, Multihazard Mitigation Council, and Applied Technology Council, 2005). Further, the MMC concluded that mitigation is most effective when it is carried out on a comprehensive, communitywide, long-term basis and that continuing analysis of the effectiveness of mitigation activities is essential for building resilient communities.
41 We are indebted to John Landis for suggesting this formulation of issues.

Key Issues 63
Finally, local and state officials might well consider an after-action study of the Katrina experience to identify lessons to apply to future storms. Unlike the U.S. military’s and the White House’s after-action reviews (see USJFCOM, 2006; and EOP and Assistant to the Pres-ident for Homeland Security and Counterterrorism, 2006), which focused on the lead-up to the storm and the immediate emergency response, this review should cover the whole Katrina experience, beginning with the preparation taken well in advance of the storm, continuing up through the actions taken before Katrina made landfall, including the immediate response, and especially examining the actions taken during the ongoing recovery phase. The review should look in particular at how the various actions taken have affected different sectors of the market, what problems these sectors have faced, and consider how different approaches might have produced different outcomes. Finally, this review should examine both the short- and longer-term issues discussed above, the effects that they have had on different sectors of the market, and consider whether alternative policies might have produced different outcomes.
In combination, careful consideration of these issues and the potential effects of alterna-tive policies may not only expedite the short-term recovery process but also provide guidance for mitigating the effects of future major hurricanes. If so, Katrina would have provided an opportunity for creating an even more vital and sustainable future for the Mississippi Coast.


65
APPENDIX
Methodology
This appendix describes the methodology we developed for our study. First, we describe the study area and key informational requirements. Second, we describe several challenges in work-ing with spatial data generally and how we deal with them in our study. Third, we describe the data available to us, the specific problems they present, and how we minimized the effect of these problems on our results. Fourth, we provide additional detail on the technical steps we employed. Finally, we draw some conclusions about our methodology as it relates to interpreta-tion of our results.
Key Information Requirements
Our analysis intends to (1) characterize the housing market in coastal Mississippi before Hurricane Katrina, (2) estimate the damage that Katrina caused to the housing market, and (3) describe post-Katrina recovery efforts relating to the housing market. Key informational requirements for our analysis according to these are summarized below. Additional details regarding the data we used are provided under “Data Used in This Study” in this appendix.
Study Area and Unit of Analysis
The three coastal counties of Mississippi (Hancock, Harrison, and Jackson counties) comprise the study area. The unit of analysis is the housing unit.
Location is an important characteristic that links the three components of our analysis. Preliminary review of the human settlement in the study area suggested that the majority of housing is clustered nearer the coast, especially within the 11 incorporated cities along the coast. These were also the areas of the most devastating damage by Katrina as well as the areas where much of the recovery efforts to date have been focused. Thus we aggregated and reported our results according to the following:
proximity to coastcoastal area –coastal-adjacent area –inland area. –
jurisdictional areacounties (three) –incorporated cities (11) –unincorporated county areas (three). –

66 Post-Katrina Recovery of the Housing Market Along the Mississippi Gulf Coast
For purposes of our study, the CSX railroad and the I-10 freeway delineated coastal, coastal-adjacent, and inland subareas. Both run east to west with the CSX railroad being nearer the coast. Coastal areas were defined as the collection of census block groups (discussed further below) that are either south of the CSX railroad or directly abutting coastal waters (whether south of the railroad or not). Coastal-adjacent areas do not abut coastal waters but are south of I-10. Inland areas included those remaining block groups within the study area that lie north of I-10. Delineation by planning jurisdiction areas associated census block groups with the city or unincorporated county areas within which they generally lie.
Pre-Katrina Housing Market
Within the above areas, our study requires information describing several characteristics of housing structures and households, including
housing structure characteristicssingle-family residences –multifamily residences –mobile homes –other housing –value –rent. –
household characteristicstenure –housing cost burden. –
locationproximity to coast –jurisdictional area. –
We required information on single-family residences, including both detached and attached homes; multifamily residences, which include apartments and condominiums of any total building size; mobile homes, counted separately from single-family residences; and any other structures used for housing, including boats, vans, and recreational vehicles. We fur-ther required that housing units be differentiated by home value (for owner-occupied units) and gross monthly rent (for renter-occupied units), and we finally required information that described housing cost burden (i.e., that portion of household income that accounts for hous-ing costs, whether these costs are for rents or mortgage payments).
Post-Katrina Damages to Housing Market
Our study required information on several dimensions of damage, including the source and severity of the damage and the estimated cost to repair it, as follows:
source of damagecoastal surge –flooding –wind and rain. –
severity of damagesevere –

Methodology 67
moderate –limited. –
estimated cost to repair damagemajor –moderate –limited. –
locationproximity to coast –jurisdictional area. –
Regarding damage source information, we required information that describes damages by flooding, coastal surge, and wind and rain, because the source of damage is tied to the insur-ance claim process. We also required information that described the severity of damage caused by these and the associated costs to repair damages. Damage information is not expected to follow census block group boundaries, but it must have been collected with sufficient precision to be combined meaningfully with available information describing housing and household characteristics within these areas.
Post-Katrina Recovery of Housing Market
Our study required information describing the recovery effort to date, including
recovery effortnumber of building permits issued –type of work permitted –cost estimates for permitted work. –
locationproximity to coast –jurisdictional area. –
In summary, our study required information on a variety of phenomena and that this information be related across several analytic components of our study. Our approach was to relate information within a geographical information system (GIS), based on the spatial attributes of the information gathered. The next two sections describe problems with this approach.
Potential Problems with Combining Spatial Data
The data available to us for this study were collected at different times, for different purposes, and for different geographic areas. Combining disparate data sets presents several challenges. Regarding challenges dealing with combining spatial data, there are two fundamental prob-lems with which to contend: aggregation effects and zoning effects.
Aggregation and Zoning Effects
Aggregation refers to the grouping of smaller groups of data into larger groups; aggregation effect describes the reduction of the uniqueness of individual data in their aggregate represen-

68 Post-Katrina Recovery of the Housing Market Along the Mississippi Gulf Coast
tation. Zoning effect describes variation in results when data are gathered in different groups (but at similar levels of aggregation). In short, transforming spatial data or combining them in a manner to meet particular analytic needs creates new, different variables with new and different properties, which may or may not accurately describe the underlying data. The con-cern for these effects, and thus the accuracy of inferences drawn from spatial data and models, increases when underlying data are highly variable with respect to the spatial unit of analysis. An important property of spatial data, which mitigates some concern for these effects, is spatial autocorrelation. Spatial autocorrelation describes the degree to which features tend to cluster, or be evenly dispersed, across an area.1
Gotway and Young (2002) discussed aggregation effects, zoning effects, and spatial auto-correlation more fully and provided a review of several geostatistical techniques that minimize the problems associated with combining spatial data. More accurate results tend to be derived from spatial models that
encompass areas in which data exhibit high spatial autocorrelationcan be scaled up without introducing unknown aggregation or zoning effectsgenerally use rates rather than absolute measures to report spatial relationshipsare built from data collected as points or as small areas.
Addressing Problems with Combining Spatial Data
The above observations are reflected in our research design. First, as noted above, the vast majority of housing is clustered nearer the coast, especially within the 11 incorporated cities. These were also the sites of the most devastating damages by Katrina. An important advantage of this, at least for analytic purposes, is that spatial autocorrelation is likely at work to reduce aggregation effects in our results that might otherwise be expected if settlements were more dispersed across the study area. That is, the accuracy of our results likely increases where most housing, damages, and recovery efforts also occur.
Further, we have grouped data by several measures of location: by county, by proximity to coast, and by planning jurisdiction. These groups sort pre-Katrina housing units according to the reach of Hurricane Katrina and according to the various jurisdictional authorities tied to post-Katrina recovery. An important advantage of grouping data in several ways is that it allows us to detect occurrences of possible aggregation and zoning effects.
In addition, we generally report results in terms of percentage of total housing stock (i.e., relative rates) that share common characteristics. Where we have reported both percentages and total counts of housing units within areas, reports in percentage terms are likely more accurate representations of housing-unit distributions. While percentages may be useful for informing broad policy decisions, local decisionmakers will likely be interested in the counts themselves. Thus we have reported these estimates as well.
Finally, we have based our model on data that have been collected in small areas and as points. Household and housing data, for example, are available at census block and block group levels (discussed further below). These are the smallest areas for which the U.S. Census Bureau collects data. Our estimates of damages are based on data from a variety of sources: Some are based on observations of individual building structures, and others, while often
1 In our study, housing and areas inundated by Katrina’s coastal surge have a high degree of spatial autocorrelation. Infer-ences regarding damage to housing are made stronger knowing that coastal surge affected much of the housing.

Methodology 69
reported with lower spatial precision, are derived from interpretation of high-resolution aerial images and on-the-ground survey work.2
Data Used in This Study
As suggested above, there are several challenges in combining data that have been collected at different times, within different spatial areas, and for different purposes. In this section, we describe in greater detail the data that were used in our study and their specific merits and limitations.
Study Area Subareas
As described above, we divided our study area into several subareas—coastal, coastal-adjacent, inland, county, incorporated city, and unincorporated county—each of which defines col-lections of census block groups.3 Where a given block group crossed the CSX railroad, I-10, or incorporated city lines, it was assigned to the subarea in which most of its housing units already occurred.4 Grouping our results according to these various subareas provided several useful summaries of the data—according to proximity to coast, by counties, by planning jurisdiction—as well as an additional check for possible errors in various calculations, and finally to detect possible aggregation and zoning effects.
Pre-Katrina Housing Market
We used data that were collected in the smallest areas possible, i.e., census blocks and block groups, and according to the last complete census (U.S. Census Bureau, 2005a, 2005b, 2007c). The data at census-block level are compiled in Summary File 1 (SF1), available from the U.S. Census Bureau. SF1 data represent a complete census and provide information on population, household, and housing counts. A richer array of social, economic, and housing measures is provided in the Census Summary File 3 (SF3), based on the long form of the census questionnaire. However, SF3 data are based on just a sampling of one in every six households, and the smallest scale of spatial resolution at which they are made available is the block group (where each block group contains several census blocks). We assigned counts of housing units and households at the scale of census blocks and characteristics of these housing structures and households according to the block groups that subsume them. We reported results at the level of subareas described above.
2 High resolution has been defined here as sufficiently precise to detect damages to individual structures. Indeed, some of the images and survey work used to support our damage estimates have spatial resolution of 1 meter on the ground.3 Census block groups are groups of census blocks. Census blocks are areas that are generally bounded by physical fea-tures such as streets, railroads, and streams or by jurisdictional boundaries such as county, city and property lines. There are 10,476 census blocks in our study area, each containing 15 housing units on average (although can contain up to 650 in urban areas of Harrison County). Blocks in our study area cover between 90 square feet and 12 square miles, with the greater block areas occurring in more rural areas. Census block groups follow the boundaries of their collective census blocks. Block groups never span county or state lines, but they often cross city limits and major infrastructure (e.g., high-ways, railroads). There are 275 block groups in our study area, each containing 579 housing units, on average. The greatest number of housing units, 1,956, occurs in urban areas of Harrison County. Block groups in our study area cover approxi-mately 9 square miles in area, on average, but as much as 167 square miles in more rural areas.4 This assignment is made by inspecting block-level counts of housing units within block groups.

70 Post-Katrina Recovery of the Housing Market Along the Mississippi Gulf Coast
As reported above, housing characteristics described whether they were single-family resi-dences, multifamily residences, mobile homes, and other housing, as well as their market value or rents collected. Household characteristics included tenure and cost burden. Owner-occu-pied housing units were further divided into four groups based on home value, with cutoffs at $60,000, $90,000, and $125,000. Renter-occupied units were divided into groups based on monthly gross rent, with cutoffs at $450 and $600. These cutoffs approximated quartile breaks along distributions of value and rent.5 Housing units were also divided according to the guide-line that housing costs (whether for rents or mortgage payments) should not exceed about 30 percent of total household income. We considered groups in which housing costs accounted for less than 25 percent, 25 to 35 percent, and more than 35 percent of household income. Pre-Katrina housing-unit counts were thus categorized by various housing and household charac-teristics and summarized for the various subareas at block group precision.
While the decision to use small area data addressed a key concern for combining spatial data, it created another concern: the census block and block group–level data available to us were products of Census 2000, which was conducted five years prior to Hurricane Katrina. Population growth and new housing construction occurred in the study area since that time.
The alternative to using Census 2000 data is to use data from the 2005 American Com-munity Survey (ACS) (U.S. Census Bureau, 2007d). However, ACS samples only one in every 100 households and reports results in the three-county area at no finer than county-level pre-cision. Furthermore, results for Hancock County are aggregated with those of Pearl River, Stone, and George counties to the north, obscuring their meaning for a more focused analysis of the study area. Finally, the margin of error reported for housing-unit counts by housing characteristics of interest is quite large—in Harrison County, for example, the margin of error is reported to be up to 175 percent. Thus, in a trade for more current data from the ACS, we would lose substantial spatial precision and gain considerable sampling error (see also Mac-Donald, 2006).
As we noted in the report, the population of the coastal counties has changed since the 2000 census. The U.S. Census Bureau’s Special Population Estimates for Impacted Counties in the Gulf Coast Area estimates that the populations of Hancock, Harrison, and Jackson counties have increased 7.6 percent, decreased 1.6 percent, and increased 2.2 percent, respec-tively, between 2000 and 2005. The special population estimates were created only at the county level, so we do not know how the growth rates of individual cities and unincorporated areas varied. We also do not know how this growth was distributed across housing and house-holds and thus how this growth has affected our results, but it seems unlikely that all growth occurred in only one or few of the housing or household categories. Indeed, if we assume that recent growth is distributed according to the housing and household characteristics evident in 2000, our results reported in overall percentage terms are unaffected.
Finally, cross-tabulations of housing type by value or rent, by tenure, and by housing cost burden were not available from the Census Bureau at the spatial precision we required. Therefore, we estimated these under the assumption that these housing and household charac-teristics vary independently of one another. That is, the distribution of value or rent (or tenure or housing cost burden) does not vary by housing type. Note also that data on these charac-
5 A quartile is one of four equally sized groups in an ordered sample. The first quartile for a distribution of home values, for example, describes the quarter of all homes that have lowest value. Census does not provide data grouped according to the true quartile breaks for our study area.

Methodology 71
teristics are available only for specified occupied housing units, which does not include single-family residences on more than 10 acres or having a business or medical office on the property. The overall effect of these data limitations and assumptions in our analysis is unknown but is believed to be small.
Post-Katrina Damage to the Housing Market
Having categorized pre-Katrina housing units by various housing and household charac-teristics within the study area, we further categorized them according to damages they sus-tained from Hurricane Katrina. To do this, we overlaid available data describing both the type and severity of damages by Hurricane Katrina on the data describing pre-Katrina housing and household characteristics to estimate the number of housing units that sustained damages.
We used several data sets that were prepared immediately after Hurricane Katrina to esti-mate these damage levels. FEMA and ACOE prepared these data. These data sets are timely and were derived from sources with high spatial precision. However, they were collected for different purposes (described further below) and for geographical areas that do not match pre-cisely the boundaries of census blocks and block groups. The procedures used to make these estimates are described under “Technical Details” below.
FIRM data. FEMA manages NFIP, which produces FIRMs. FIRMs depict flood eleva-tions and conditions that have a 1 percent chance of being equaled or exceeded in any given year. These elevations are more commonly known as the 100-year floodplain. We have used third-quarter flood data, which are a digital representation of certain features of FIRMs, to represent areas that were likely flooded during Hurricane Katrina. While FIRM flood eleva-tions are intended to include additional effects due to wave height or wave run-up in coastal areas, vetted FIRMs currently in circulation are more than 25 years old and do not include more recent flood frequency analyses or the experience of Hurricane Katrina.
SIL data. FEMA also provides data describing the SIL of Hurricane Katrina, i.e., how far coastal surge traveled over land. These data are based on high water mark (HWM) data recorded by field crews deployed by FEMA and equipped with highly accurate Global Position-ing System (GPS) devices.6 This fieldwork supplied FEMA analysts with detailed information on the location and physical basis of each HWM, which was then used to model inundation limits of the coastal surge using pre-Katrina topographic contour data developed from Light Detecting and Ranging (LIDAR) surveys.7 According to SIL maps, the coastal surge extended beyond limits depicted by currently available FIRM maps in some areas.
FEMA damage assessment data. FEMA mapped damaged areas soon after Hurricane Katrina subsided. These maps were based on the interpretation of many high-resolution aerial images acquired immediately after the storm. FEMA categorized the severity of structural damages into four mutually exclusive categories: catastrophic, extensive, moderate, and lim-ited. FEMA included a fifth category—flooded—that describes areas that were under standing water at time of their assessment or where floodwaters had recently receded. In our analysis, we grouped catastrophic, extensive, and flooded descriptors into the major damage severity
6 According to FEMA, coastal HWM locations are precise to 0.25 foot vertically and 10 feet horizontally, with a 95 per-cent confidence level.7 LIDAR is a new technology that employs lasers mounted to aircraft that measure ground elevation every 15 feet with precision on the order of inches. In some cases, engineering judgment was used to interpolate the inundation limit between coastal HWMs, where HWM elevations differed by more than 3 feet.

72 Post-Katrina Recovery of the Housing Market Along the Mississippi Gulf Coast
category. We also added another category, not detected, which describes areas in which FEMA did not report damages to housing units, presumably because no housing units occurred in those areas or because damage did not meet thresholds for categorization.
FIRM, SIL, and damage assessment data are available from FEMA as polygon shapefiles. As described above, they are based on high-resolution aerial imagery and on-the-ground recon-naissance data. FEMA’s FIRM and SIL data provided the basis of our estimates of damages by flood and surge and were also primary source of our estimates of the severity of damage. Our damage assessment largely derives from results of overlaying these three layers on the census data described previously.
Minor roof damage (MRD) data. The FEMA data described above relate to areas affected by flooding and storm surge. To estimate damage by wind and rain alone, we used information on MRD, as compiled from aerial imagery by ACOE analysts. Roof damage assessments were produced to assist temporary roofing and housing response teams. These data are available as point shapefiles. According to ACOE, MRD is equivalent to roof cover loss of 2 to 15 percent. We reasoned that many areas affected by wind were also affected by flooding and surge. How-ever, those areas that lie beyond the reach of flooding and coastal surge were likely damaged less severely. For housing units that experienced only wind and rain damage that FEMA did not detect (i.e., they were contained within an area that was not categorized as damaged in the FEMA data set), we supplemented our count of damaged units based on ACOE’s MRD esti-mates. ACOE did not identify whether those units were used for residential purposes, but we assumed that most were housing units. Because ACOE identified only units with minor roof damage, these units were categorized in the limited damage category.
Combining data from these multiple sources, collected for different purposes, at different spatial scales and at different times, introduces potential error into our spatial analysis. How-ever, these errors are mitigated by the high degrees of spatial autocorrelation among these data, our use of small areas to group them, by reporting damage estimates in percentage terms, and by grouping these data in ways that allow for checks on our results.
Other Estimates of Post-Katrina Damage to the Housing Market
In addition to the FEMA and ACOE data described previously, HUD produced a set of damage estimates using other FEMA data in February 2006.8 According to the explanation provided in the document, these data are “largely based on direct inspection of housing units by FEMA to determine eligibility for FEMA housing assistance.” The FEMA/HUD data pro-duce higher estimates of numbers of units damaged by Katrina. We did not use these data in our analysis because they were not available at the spatial resolution required for our analysis, and because of our concerns that damaged units were overcounted in some areas. It is impor-tant to acknowledge at the outset, however, that different approaches to counting damaged units at different spatial scales can lead to different results. This discussion explains these points in more detail.
The FEMA/HUD data are publicly available only at the county level of aggregation.9 In our discussions with HUD staff familiar with the data (Richardson, 2007, 2008), we con-firmed that the data have not been aggregated at the census-block or block-group level, which
8 See FEMA, SBA, and HUD (2006).9 Since they are assembled from information provided in part by individual residents, there are significant privacy issues to be overcome in making the complete data set publicly available.

Methodology 73
were the levels of analysis we used for this report. Therefore, we would not have been able to use the FEMA/HUD data for the finer-grained analysis of damage and housing recovery within counties that we believed to be an important component of this study. As we noted in our description of the analysis, no one of the several data sets we used contained all of the infor-mation needed for the analysis. Consequently, it was critical that whatever data sets were used contain information at the lowest geographic scale possible to enable us to link data across data sets. In general, this was at the census-block or block-group level, although, in the case of the building-permit data, this was at the jurisdictional level. More highly aggregated data could not be linked to data on such housing-unit characteristics as rent or value, type of area (coastal, coastal adjacent, inland), or jurisdiction (incorporated or not).
There also are questions about the FEMA/HUD data that we could not resolve within the scope of this study. The methodology section in the February 2006 HUD report acknowl-edged a risk of overcounting, derived from the fact that the data set is based on inspections conducted in response to residents’ claims for damage reimbursement. If multiple persons at the same address filed a claim, the housing unit may be counted twice. Other factors could have led to undercounting, including occupants who did not register with FEMA or whose housing units had not been inspected at the time the report was written (although FEMA reported that most inspections had been completed).
Based the numbers provided within the February 2006 HUD report, we note other dif-ferences from our estimates. For example, in Hancock County, the report shows that 4,175 rental housing units were damaged, but, as of the 2000 Census, the county had only 3,400 occupied rental units. While it is possible that population and housing growth from 2000 to 2005 account for some of this difference, the difference is larger than the growth in Hancock County over this period.
While the overall total of damaged units in the FEMA/HUD report is approximately 94,000 and ours is 78,000 (depending on rounding), we cannot identify any systematic dis-crepancy in a particular direction that accounts for this difference. (See Tables A.1 and A.2.) We examined both sets of data broken down by several characteristics—damage source (wind versus flood or rain), housing tenure (owner versus renter), and housing type (single-family versus multifamily) and could find no pattern in the discrepancies between the two data sets. (The FEMA/HUD data do not contain a breakdown by jurisdiction, so such a comparison was not possible.) We are left with two broad explanations. First, different methodologies yield different results. Our top-down assessment of damages on a percentage basis is likely to differ from a bottom-up count of all damaged units. Second, any methodology attempting to accu-rately assess damages after the most disruptive storm in decades is simply going to contain some errors of varying types. Not knowing where those errors are, it is impossible to determine how close each data set is to counting the actual number of damaged units.
Post-Katrina Recovery of Housing Market
Estimating post-Katrina recovery presented additional challenges. The Gulf Regional Plan-ning Commission (GRPC) provided building-permit records, beginning in fall 2005 and con-tinuing to the second quarter of 2006, for the study area. A second data set, Treen Permit Reports, also summarizes permitted work but extends into summer 2007. The Treen data

74 Post-K
atrina R
ecovery o
f the H
ou
sing
Market A
lon
g th
e Mississip
pi G
ulf C
oast
Table A.1Occupied and Damaged Units, by TYpe and Tenure
Type County
Occupied UnitsaDamaged Units, According to FEMA, SBA,
and HUD (2006)b Damaged Units, According to RAND
Owner Occupied Rental Total
Owner Occupied Rental Total
Owner Occupied Rental Total
Single family (attached and detached)
Hancock 10,626 1,610 12,236 11,017 3,197 14,214 — — —
Harrison 37,801 10,236 48,037 27,678 10,523 38,201 — — —
Jackson 30,590 5,322 35,912 21,649 5,452 27,101 — — —
Total 79,017 17,168 96,185 60,344 19,172 79,516 45,865 8,765 54,630
Multifamily Hancock 150 1,105 1,255 — 978 978 — — —
Harrison 675 13,980 14,655 — 10,416 10,416 — — —
Jackson 198 5,556 5,754 — 3,398 3,398 — — —
Total 1,023 20,641 21,664 — 14,792 14,792 — 16,290 16,290
Mobile home Hancock 2,616 685 3,301 — — — — — —
Harrison 6,306 2,448 8,754 — — — — — —
Jackson 4,703 1,228 5,931 — — — — — —
Total 13,625 4,361 17,986 — — — 4,720 2,245 6,965
Total by tenure Hancock 13,392 3,400 16,792 11,017 4,175 15,192 — — 12,111
Harrison 44,782 26,664 71,446 27,678 20,939 48,617 — — 45,678
Jackson 35,491 12,106 47,597 21,649 8,850 30,499 — — 20,096
Total 93,665 42,170 135,835 60,344 33,964 94,308 50,585 27,300 77,885
a Does not include boats or recreational vehicles. Source: U.S. Census Bureau, 2000 Census.b Mobile homes are included as single- or multifamily units depending on whether they are located on individual properties or in a mobile home park. Source: FEMA, SBA, and HUD (2006).

Methodology 75
Table A.2Total Damage, by Source, According to FEMA, SBA, and HUD (2006)
Damage Amount
Source, According to FEMA, SBA, and HUD (2006) Source, According to RAND
Flood Wind or Rain Total Flood Wind or Rain Total
More than $10,000
12,056 2,207 14,263 24,127 3,331 27,458
Less than $10,000
32,812 47,233 80,045 16,936 33,491 50,427
Total 44,868 49,440 94,308 41,063 36,822 77,885
reports permits only for work that was estimated to cost more than $50,000.10 The permit applications in these data sets indicate the location of work, the type of work, and an estimate of cost of the work. Together, these provide a useful indication of recovery efforts and costs to date.
Compiling these data in a common framework required that we combine data sets of varying completeness in different formats. Some of these data sets included precise locations of permitted work, while others aggregated building-permit data at the level of jurisdiction only. The permit data also varied in how they described the work covered by the permit. Moreover, the cost estimates may not accurately reflect the actual cost of work and issuance of a permit does not guarantee that work has been completed or even begun.
As a result, we developed a framework to characterize building-permit data according to jurisdiction, the date of issuance, the estimated costs, the type of structure, and the nature of the work. Structure type included single-family, multifamily, and mobile homes. Type of work included demolition, new construction, repair, temporary, and other. Demolition refers to removal of structure and debris in preparation for new construction. New construction refers to replacement of a home that was damaged to the level of the foundation. Repairs refers to a variety of permitted work—both internal and external to the home—ranging from limited to major. The temporary category refers to placement of mobile homes. The other cat-egory refers to a variety of remaining permitted actions. Extracting jurisdiction, date, and cost estimate information, where available, was relatively straightforward. Categorization of the type of work was achieved by a combination of semantic analysis11 and further recoding results according to values reported in the estimated cost fields.12
10 The Treen reports state that they include permits estimated to cost more than $5,000, but a review of these data indicates that the actual cutoff was $50,000.11 By semantic analysis, we refer to a process of searching for words within work description and value fields of the various permit data sets to infer meaningful categorization of all permit data. For example, work descriptions that included “demo” or “level” were assumed to describe permitted demolition work and were categorized as such.12 Following the semantic analysis step, the assignment of permits to major, moderate, and limited repair categories were based on median cost estimate for new construction, median cost estimate for repairs, and first quartile cost estimate for repairs.
76 Post-Katrina Recovery of the Housing Market Along the Mississippi Gulf Coast
Technical Details
This section provides additional technical detail on our methodology. We used several soft-ware tools, including Environmental Systems Research Institute (ESRI) ArcGIS® and ArcInfo®, Microsoft® Access™, and Microsoft Excel®.
Analysis of the Pre-Katrina Housing Market
County, city, block group, and block boundaries (as well as the location of major highways and roadways) were based on U.S. Census Bureau information. SF1 and SF3 data are Census 2000 files. FIRM and SIL data were acquired from FEMA. MRD data were acquired from ACOE.
Housing-unit counts were compiled for each of the three counties according to the vari-ous housing and household characteristics reported in SF1 and SF3 data files. Countywide distributions of housing-unit counts were inspected, and data were then sorted by the charac-teristics of interest (e.g., housing type, tenure) and grouped according to percentile rankings (e.g., home values by quartiles, rents by terciles). These data were then linked to their relevant block and block group shapefiles.
Block and block group shapefiles were mapped against county, city, roads, railroads, and the various damage layers. General patterns of settlement and damage due to Katrina were then inspected for the study area. All layers were clipped to the three-county study area. Subareas describing proximity to coast and jurisdictional area were defined. That is, whole block groups were assigned to the various incorporated city areas, unincorporated county areas, and coastal, coastal-adjacent, and inland areas, as described under “Key Information Requirements” earlier in this appendix.
Housing counts were summarized by housing and household characteristics for the vari-ous subareas.
Analysis of Post-Katrina Damage to Housing Units
Next, we characterized housing units by damage levels. Following Bernstein et al. (2006), block group boundaries were intersected with the various damage layers. Damage was assigned to housing units according to the proportion of block group areas that damage layers over-laid. The accuracy of this approach depends on the uniformity with which housing units are distributed across block groups. This uniformity is often absent, as close inspection of block-level housing-unit counts within block groups demonstrates. While the error this introduces remains small in areas with fewer housing units, this error increases in more populated coastal-adjacent and inland areas.
Given the availability of block-level housing counts, we sought to incorporate this addi-tional information into our model to reduce this error. However, the processing time required to repeat the areal interpolation approach at block level (generating many thousands of poly-gons from the intersection of blocks with the various damage layers) was also too high. Thus, we used the following procedure to balance our need for greater accuracy concurrent with our need for computational efficiency.
Specifically, ESRI ModelBuilder® was used to create a series of intersecting location layers (e.g., coastal, coastal-adjacent, inland, incorporated cities, unincorporated county areas), type of damage (i.e., flood, surge, either, neither, both), and severity of damage (catastrophic, exten-sive, flooded, moderate, limited, none detected). The result was the generation of more than

Methodology 77
500 layers, each of which contains one or more polygons representing a unique combination of location, type, and severity of damage attributes.
Block centroids13 were then created for all blocks in the study area, and housing-unit counts at block level were joined to these points. Block group–level housing and household characteristics were also joined to these points. ModelBuilder was used again to intersect the plane of damage combination polygons with the block centroids. Minor roof damage data (also points) were also intersected with the plane of damage polygons and sorted accordingly.
Housing-unit counts were reported according to their various housing and household characteristics and by the damage (source and severity) they experienced. Likewise, instances of minor roof damage were also reported according to their location and damage characteris-tics for areas in which neither flooding nor surge was experienced.
Reducing block-level housing-unit counts and block group–level housing and household characteristics to a single point, and assigning this point to a single damage category raises some concern about aggregation and zoning effects. The critical issue, however, is whether we have increased overall error using this approach relative to alternative approaches. Arguably, this approach meshes census data with FEMA data that have been collected at much higher spatial precision. As with other approaches, the concern for misrepresenting housing units and damage decreases nearer the coast, where block and block group areas are smaller (approach-ing that of points), housing-unit densities are higher, and the damages are uniform and severe. This approach improves upon areal interpolation of block group–level data that were previ-ously employed, particularly by allocating housing units to areas that are nearer their actual locations, and associating them with the damages that they likelier sustained.
Analysis of Post-Katrina Recovery
Building-permit data from all jurisdictions were inspected independently, and general similari-ties and differences noted. Next, they were compiled in a single database based on their com-monalities—jurisdiction, permit number, date issued, value of work ordered, type of structure, and description of work. Terms indicating demolition, new construction, repair, and mobile home placements were searched and permits sorted accordingly. The distributions of cost esti-mates by type of work were inspected. Permits were further sorted according to value of the cost estimate field.
The number of permits issued (relative both to damaged housing units and according to housing type) was then summarized for each of the subareas. Estimates of recovery costs were developed based on value of homes, severity of damage, and cost estimates for the various types of work permitted in each of the subareas.
Conclusions
We have characterized the housing market in coastal Mississippi before and immediately after Hurricane Katrina as well as recovery efforts to date. A variety of data has been used to sup-port a spatial analysis in which several potential problems have been minimized to the extent possible. This approach does not guarantee absolute precision, but our results lead to important
13 A centroid describes the geometric center of a polygon, i.e., the balance point of a two-dimensional shape.

78 Post-Katrina Recovery of the Housing Market Along the Mississippi Gulf Coast
considerations for advancing recovery from Hurricane Katrina’s devastating effects on housing in the three coastal counties of Mississippi.
Data
Data sources used include U.S. Census Bureau (undated[h], 2003b, 2005a, 2005b, 2007b), FEMA (undated, 2005, 2006), and building-permit data from GRPC and Treen Building Reports.

79
References
AFF1990—see U.S. Census Bureau (undated[b]).
Bernstein, Mark A., Julie Kim, Paul Sorensen, Mark Hanson, Adrian Overton, and Scott Hiromoto, Rebuilding Housing Along the Mississippi Coast: Ideas for Ensuring an Adequate Supply of Affordable Housing, Santa Monica, Calif.: RAND Corporation, OP-162-RC, 2006. As of August 30, 2007: http://www.rand.org/pubs/occasional_papers/OP162/index.html
Berson, David, Federal National Mortgage Association, “The Outlook for the Economy, Housing, and Mortgage Markets,” briefing, November 8, 2006.
BLS—see U.S. Department of Labor, Bureau of Labor Statistics.
Burby, Raymond J., “Hurricane Katrina and the Paradoxes of Government Disaster Policy: Bringing About Wise Governmental Decisions for Hazardous Areas,” Annals of the American Academy of Political and Social Sciences, Vol. 604, No. 1, March 2006, pp. 171–191.
Dixon, Lloyd, Noreen Clancy, Seth A. Seabury, and Adrian Overton, The National Food Insurance Program’s Market Penetration Rate: Estimates and Policy Implications, Santa Monica, Calif.: RAND Corporation, TR-300-FEMA, 2006. As of September 6, 2007: http://www.rand.org/pubs/technical_reports/TR300/
Doyle, Lisa, “Arkansas, Louisiana, Mississippi, Oklahoma, Western Tennessee, 2006,” Construction Forecast, April 15, 2006. As of September 12, 2007: http://www.acppubs.com/article/CA6323809.html
EOP—see Executive Office of the President.
Executive Office of the President, and Assistant to the President for Homeland Security and Counterterrorism, The Federal Response to Hurricane Katrina: Lessons Learned, Washington, D.C.: White House, February 2006. As of September 12, 2007: http://purl.access.gpo.gov/GPO/LPS67263
Federal Emergency Management Agency, “Q3 Digital Flood Data and Coastal Barrier Resource Area (CBRA) Q3 Data,” undated Web page. As of September 17, 2007: http://msc.fema.gov/webapp/wcs/stores/servlet/CategoryDisplay?catalogId=10001&storeId=10001&categoryId=12003&langId=-1&userType=G&type=2
———, “FEMA-1604-DR, Mississippi—Imagery Derived Assessment: Mississippi Affected Population from Flooding as of 09/08/2005 18:00 EDT,” September 8, 2005. As of September 17, 2007: http://www.gismaps.fema.gov/2005graphics/dr1604/rs_MS_Floodpop_090805_1800.pdf
———, “Hurricane Katrina Flood Recovery Maps (Mississippi),” last modified April 28, 2006. As of September 17, 2007: http://www.fema.gov/hazard/flood/recoverydata/katrina/katrina_ms_gis.shtm
Federal Emergency Management Agency, Small Business Administration, and U.S. Department of Housing and Urban Development, Current Housing Unit Damage Estimates: Hurricanes Katrina, Rita, and Wilma, Washington, D.C.: Federal Emergency Management Agency, Office of the Federal Coordinator for Gulf Coast Rebuiding, 2006.
FEMA—see Federal Emergency Management Agency.

80 Post-Katrina Recovery of the Housing Market Along the Mississippi Gulf Coast
Gotway, Carol A., and Linda J. Young, “Combining Incompatible Spatial Data,” Journal of the American Statistical Association, Vol. 97, No. 458, 2002, pp. 632–648.
Governor’s Commission on Recovery, Rebuilding, and Renewal, After Katrina: Building Back Better Than Ever: A Report to the Hon. Haley Barbour, Governor of the State of Mississippi, Jackson, Miss.: Governor’s Commission on Recovery, Rebuilding, and Renewal, December 31, 2005. As of September 6, 2007: http://www.mississippirenewal.com/documents/Governors_Commission_Report.pdf
GRPC—see Gulf Regional Planning Commission.
Gulf Regional Planning Commission, “The Gulf Coast Region,” undated Web page. As of August 30, 2007: http://www.grpc.com/gulfcoast.html
Hedde, Carl, Protecting Lives and Property at Our Coastline: Economic Impacts of Insurance and Reinsurance, New York: Munich Re America, March 28, 2007. As of September 12, 2007: http://dels.nas.edu/dr/docs/dr19/Hedde.pdf
Hipp, Laura, “Insurance Stunts Coast’s Return,” Clarion-Ledger, February 26, 2007.
HUD—see U.S. Department of Housing and Urban Development.
III—see Insurance Information Institute.
Insurance Information Institute, “Facts and Statistics: Flood Insurance: National Flood Insurance Program,” undated Web page (a). As of February 26, 2007: http://www.iii.org/media/facts/statsbyissue/flood/
———, “Issues Updates: Catastrophes: Insurance Issues,” undated Web page (b). As of February 16, 2007: http://www.iii.org/media/hottopics/insurance/catastrophes/
———, “Issues Updates: Hurricane and Windstorm Deductibles,” undated Web page (c). As of March 23, 2007: http://www.iii.org/media/hottopics/insurance/hurricanwindstorm/
———, “Nearly 95 Percent of Homeowners Claims from Hurricane Katrina Settled and Tens of Billions of Dollars Paid to Affected Communities in Louisiana and Mississippi, Insurance Information Institute Reports,” press release, August 22, 2006. As of September 12, 2007: http://www.iii.org/media/updates/press/archive/press.760032
Johnson, Neil, “Coastal Property Values Get Blame for Spikes in Insurance,” Tampa Tribune, April 7, 2007, p. 5.
Kahan, James P., Mengjie Wu, Sara Hajiamiri, and Debra Knopman, From Flood Control to Integrated Water Resource Management: Lessons for the Gulf Coast from Flooding in Other Places in the Last Sixty Years, Santa Monica, Calif.: RAND Corporation, OP-164-RC, 2006. As of August 30, 2007: http://www.rand.org/pubs/occasional_papers/OP164/
Lawler, Patrick, chief economist, Office of Federal Housing Enterprise Oversight, The Housing Bubble and Its Implications for the Economy, testimony before the U.S. Senate Committee on Banking, Housing, and Urban Affairs, Subcommittee on Housing and Transportation and the Subcommittee on Economic Policy, September 13, 2006. As of September 12, 2007: http://banking.senate.gov/index.cfm?Fuseaction=Hearings.Detail&HearingID=236
Litan, Robert E., Preparing for Future “Katrinas,” Washington, D.C.: Brookings Institution, Brookings Institution policy brief 150, March 2006.
Louisiana State University Hurricane Center, and T. Eric Stafford Associates, LLC, Summary of LSU Hurricane Center Study: Residential Wind Damage in Mississippi: Potential Hurricane Damage Reduction Through Improved Building Codes and Construction Practices, Baton Rouge, La.: January 19, 2006. As of September 6, 2007: http://hurricane.lsu.edu/files/misscodesummary.pdf
MacDonald, H., “The American Community Survey: Warmer (More Current), but Fuzzier (Less Precise) Than the Decennial Census,” Journal of the American Planning Association, Autumn 2006, p. 491.
Mead, Julia C., “Flood Insurance Often Insufficient,” New York Times, July 30, 2006, p. 14-3.

References 81
Mississippi Development Authority, Public Housing Program CDBG Disaster Recovery Action Plan, Amendment 1, Jackson, Miss.: Mississippi Development Authority, c. 2006a. As of August 30, 2007: http://www.mississippi.org/UserFiles/File/Home_Owners_Assistance_Program/comment_public%20housing.pdf
———, Homeowner Assistance Program: Modification Number 4—Phase II, Jackson, Miss.: Mississippi Development Authority, December 15, 2006b. As of August 30, 2007: http://www.mississippi.org/UserFiles/File/Home_Owners_Assistance_Program/p2_action_plan.pdf
———, “Homeowner Assistance Program—Phase 1,” last updated September 19, 2007. As of September 21, 2007: http://www.mississippi.org/content.aspx?url=/page/hoassistprogram1&
Mississippi Home Corporation, “About MHC,” undated Web page. As of September 12, 2007: http://www.mshomecorp.com/about%20mhc/press%20room.htm
Mississippi Homeowner Assistance Grant Program, “Hurricane Katrina Homeowner Assistance Program: Phase II FAQ,” updated July 31, 2007a. As of September 12, 2007: http://www.mshomehelp.gov/p2_faq.pdf
———, “Hurricane Katrina Homeowner Assistance Program: FAQ,” updated August 29, 2007b. As of September 12, 2007: http://www.mshomehelp.gov/faq.pdf
Mississippi Insurance Department, “Claims Figures,” October 15, 2006a. As of September 12, 2007: http://www.doi.state.ms.us/katrina/claimsfigures.htm
———, “Hurricane Katrina Claims Paid by County,” October 15, 2006b. As of September 12, 2007: http://www.doi.state.ms.us/katrina/katrinaclaims.htm
National Institute of Building Sciences, Multihazard Mitigation Council, and Applied Technology Council, Natural Hazard Mitigation Saves: An Independent Study to Assess the Future Savings from Mitigation Activities, Vol. 1: Findings, Conclusions, and Recommendations, Washington, D.C.: The Council, 2005.
O’Bryon, Linda, “The Gulf Coast: Road to Renewal—Charleston,” Nightly Business Report, April 14, 2006. As of September 12, 2007, transcript: http://www.pbs.org/nbr/site/features/special/gulf_coast_2/
OFHEO—see Office of Federal Housing Enterprise Oversight.
Office of Federal Housing Enterprise Oversight, “House Price Appreciation Slows from Record-Setting Pace, but Remains Strong,” press release, Washington D.C., December 1, 2005. As of September 12, 2007: http://www.ofheo.gov/media/pdf/3q05hpi.pdf
Peacock, Walter Gillis, “Hurricane Andrew: Three Lessons on Disaster Impacts and Housing Recovery,” briefing, December 13, 2005. As of September 24, 2007: http://www.ametsoc.org/atmospolicy/documents/December13.2005WalterPeacock.pdf
Pielke, Roger A., Chantal Simonpietri, and Jennifer Oxelson, Thirty Years After Hurricane Camille: Lessons Learned, Lessons Lost, Boulder, Colo.: National Center for Atmospheric Research, July 12, 1999. As of September 12, 2007: http://sciencepolicy.colorado.edu/homepages/roger_pielke/camille/index.html
Richard, Brian, director, Economic Development Resource Center, University of Southern Mississippi, personal communication with the authors, Hattiesburg, Mississippi, 2006.
Richardson, Todd, email and telephone communication with Michael Toman, December 6–7, 2007.
———, email and telephone communication with Liisa Ecola, January 8, 2008.
Sanderson, Brian W., “Solving the Affordable Housing Crisis in the Gulf Region Post Katrina: Why No Progress and What Are the Obstacles to Success?” day two, panel three of field hearing before the U.S. House of Representatives Committee on Financial Services, Subcommittee on Housing and Community Opportunity, Gulfport, Miss., February 23, 2007. As of September 12, 2007: http://www.house.gov/apps/list/hearing/financialsvcs_dem/htsanderson022307.pdf

82 Post-Katrina Recovery of the Housing Market Along the Mississippi Gulf Coast
State of Mississippi, Attorney General, “Attorney General Announces Mortgage Foreclosure Relief,” press release, December 20, 2005. As of September 12, 2007: http://www.ago.state.ms.us/pressreleases/mortgageforeclosure.pdf
Teel, Philip, corporate vice president and president, Northrop Grumman Ship Systems, “Workers and Neighbors: Progress in the Region We Call Home,” presentation to Jackson County (Miss.) Chamber of Commerce, April 24, 2007. As of September 12, 2007: http://www.northropgrumman.com/presentations/2007/042407_pt_jccoc.html
Thompson, Ron, “A Regional Look at Subprime Mortgage Foreclosures,” Perspectives, March 26, 2007. As of September 12, 2007: http://www.globalinsight.com/Perspective/PerspectiveDetail8780.htm
Treen Permit Reports, “Reports for Mississippi Coastal Counties,” Slidell, Louisiana, October 2005–June 2007.
U.S. Census Bureau, “2006 American Community Survey Data Profile Highlights,” undated Web page (a). As of September 24, 2007: http://factfinder.census.gov/servlet/ACSSAFFFacts
———, “American FactFinder: DP-1: General Population and Housing Characteristics: 1990,” undated Web page (b). As of September 24, 2007: http://factfinder.census.gov/servlet/QTTable?_bm=y&-geo_id=04000US72&-qr_name=DEC_1990_STF1_DP1&-ds_name=DEC_1990_STF1_
———, “American FactFinder: DP-1: Profile of General Characteristics: 2000,” undated Web page (c). As of September 24, 2007: http://factfinder.census.gov/servlet/QTTable?_bm=y&-geo_id=01000US&-qr_name=DEC_2000_SF1_U_DP1&-ds_name=DEC_2000_SF1_U&-_lang=en&-redoLog=false&-_sse=on
———, “American FactFinder: DP-3: Profile of Selected Economic Characteristics: 2000,” undated Web page (d). As of September 24, 2007: http://factfinder.census.gov/servlet/QTTable?_bm=y&-geo_id=01000US&-qr_name=DEC_2000_SF3_U_DP3&-ds_name=DEC_2000_SF3_U&-redoLog=false&-_sse=on
———, “American FactFinder: QT-H4: Physical Housing Characteristics—All Housing Units: 2000,” undated Web page (e). As of September 24, 2007: http://factfinder.census.gov/servlet/QTTable?_bm=y&-state=qt&-qr_name=DEC_2000_SF3_U_ QTH4&-ds_name=DEC_2000_SF3_U&-redoLog=false&-_caller=geoselect&-geo_id=01000US&-format=&-_lang=en
———, “American FactFinder: QT-H13: Gross Rent as a Percentage of Household Income in 1999: 2000,” undated Web page (f). As of September 24, 2007: http://factfinder.census.gov/servlet/QTTable?_bm=y&-state=qt&-qr_name=DEC_2000_SF3_U_ QTH13&-ds_name=DEC_2000_SF3_U&-redoLog=true&-_caller=geoselect&-geo_id=01000US&-geo_id=NBSP&-format=&-_lang=en
———, “American FactFinder: QT-H16: Selected Monthly Owner Costs as a Percentage of Household Income in 1999: 2000,” undated Web page (g). As of September 24, 2007: http://factfinder.census.gov/servlet/QTTable?_bm=y&-state=qt&-qr_name=DEC_2000_SF3_U_ QTH16&-ds_name=DEC_2000_SF3_U&-redoLog=true&-_caller=geoselect&-geo_id=01000US&-geo_id=NBSP&-format=&-_lang=en
———, “Population Estimates,” undated Web page (h). As of September 17, 2007: http://www.census.gov/popest/estimates.php
———, United States Summary, 2000: Summary Social, Economic, and Housing Characteristics, Washington, D.C.: U.S. Dept. of Commerce, Economics and Statistics Administration, June 2003a. As of September 17, 2007: http://purl.access.gpo.gov/GPO/LPS36102

References 83
———, United States Summary, 2000: Summary Social, Economic, and Housing Characteristics, Appendix A: Geographic Terms and Conditions, Washington, D.C.: U.S. Dept. of Commerce, Economics and Statistics Administration, June 2003b. As of September 17, 2007: http://www.census.gov/prod/cen2000/phc-2-a.pdf
———, “United States Census 2000 Summary File 1 (SF 1), last revised February 18, 2005a. As of August 30, 2007: http://www.census.gov/Press-Release/www/2001/sumfile1.html
———, “United States Census 2000 Summary File 3 (SF 3),” last revised February 18, 2005b. As of August 30, 2007: http://www.census.gov/Press-Release/www/2002/sumfile3.html
———, “Special Population Estimates for Impacted Counties in the Gulf Coast Area,” press release, created May 25, 2006, last modified March 22, 2007a. As of August 30, 2007: http://www.census.gov/Press-Release/www/emergencies/impacted_gulf_estimates.html
———, “TIGER®, TIGER/Line® and TIGER®-Related Products,” last modified April 17, 2007b. As of September 17, 2007: http://www.census.gov/geo/www/tiger/
———, “United States Census 2000,” created January 25, 2002, last modified June 19, 2007c. As of August 30, 2007: http://www.census.gov/main/www/cen2000.html
———, “2005 ACS Special Product for the Gulf Coast Area,” last modified August 22, 2007d. As of August 30, 2007: http://www.census.gov/acs/www/Products/Profiles/gulf_coast/
USDA—see U.S. Department of Agriculture.
U.S. Department of Agriculture, “Rural and Community Development: Housing Assistance,” last modified April 9, 2007. As of April 6, 2007: http://www.usda.gov/wps/portal/!ut/p/_s.7_0_A/7_0_1OB?navid=HOUSING_ASSISTA&navtype=RT&parentnav=RURAL_DEVELOPMENT
U.S. Department of Housing and Urban Development, Programs of HUD: Major Grant, Assistance, and Regulatory Programs, Washington, D.C., 2006b. As of September 12, 2007: http://www.huduser.org/resources/hudprgs/ProgOfHUD06.pdf
———, Gulfport-Biloxi, Mississippi Housing Market Area: Economic and Housing Market Conditions Pre- and Post-Katrina: A Comprehensive Market Analysis Special Report, Washington, D.C.: U.S. Department of Housing and Urban Development, March 1, 2006a. As of September 24, 2007: http://www.huduser.org/Publications/PDF/CMAR_GulfportMS.pdf
———, “HUD Awards $27 Million to Five Mississippi Housing Authorities to Help Repair Hurricane Damaged Public Housing,” press release, January 30, 2007. As of September 12, 2007: http://www.hud.gov/news/release.cfm?content=pr07-006.cfm
U.S. Department of Labor, Bureau of Labor Statistics, “Metropolitan Area at a Glance: Gulfport-Biloxi, MS,” undated Web page (a). As of September 6, 2007: http://www.bls.gov/eag/eag.ms_gulfport_msa.htm
———, “Metropolitan Area at a Glance: Pascagoula, MS,” undated Web page (b). As of September 6, 2007: http://www.bls.gov/eag/eag.ms_pascagoula_msa.htm
USJFCOM—see U.S. Joint Forces Command.
U.S. Joint Forces Command, Joint Center for Operational Analysis, Hurricane Katrina, National Response to Catastrophic Events: Applied Lessons Learned for Consequence Management, August 21, 2006.
W. S. Loper and Associates, Mississippi Gulf Coast Apartment Survey, Jackson, Miss.: Gulf Regional Planning Commission, November 30, 2004. As of August 30, 2007: http://www.grpc.com/PDF/documents/MSGC%20Apartment%20Survey%202004.pdf

84 Post-Katrina Recovery of the Housing Market Along the Mississippi Gulf Coast
Weiss, N. Eric, Rebuilding Housing After Hurricane Katrina: Lessons Learned and Unresolved Issues, Washington, D.C., Congressional Research Service, Library of Congress, CRS Report RL33761, December 19, 2006.