gwec | global wind report – annual market update 2013
TRANSCRIPT

T H E E U ROPE A N U N ION
GLOBAL WIND REPORT ANNUAL MARKET UPDATE 2013

GWEC – opening up the frontiers
follow us on
Navigating the global wind power market
Phot
o by
Will
Her
man
The Global Wind Energy Council is the international trade association for the wind power industry – communicating the benefits of wind power to national governments, policy makers and international institutions. GWEC provides authoritative research and analysis on the wind power industry in more than 80 countries around the world.
Our next publications to watch for include:
Our mission is to ensure that wind power establishes itself as the answer to today's energy challenges, providing substantial environmental and economic benefits.
GWEC represents the industry with or at the UNFCCC, the IEA, international financial institutions, the IPCC and IRENA.
Global Wind Energy Outlook October 2014
GWEC China Wind Development Report 2014(English/Chinese) Q4 2014
Global Statistics February 2015
C
M
Y
CM
MY
CY
CMY
K
GWEC_Advert01.pdf 1 04.04.14 11:51

3GWEC – Global Wind 2013 Report
Foreword 4
Fresh wind for the next big step 5
Redefining the cost debate – the Concept of Society’s Cost of Electricity 6
A Renewable Energy future 10
The Global Status of Wind Power in 2013 16
Market Forecast for 2014 – 2018 26
Australia 32
Belgium 34
Brazil 36
Canada 38
Central and South America & The Caribbean 40
PR China 42
Denmark 46
The European Union 48
France 50
Germany 52
Global offshore 54
India 58
Japan 60
Mexico 62
Poland 64
South Africa 66
Sweden 68
Turkey 70
Ukraine 72
United Kingdom 74
United States 76
About GWEC 78
TABLE OF CONTENTS

4 GWEC – Global Wind 2013 Report
FOREWORD
For the first time in more than 20 years, the annual global market for wind energy shrank in 2013 We knew
that this was likely to be the case when we did our forecast for 2013 one year ago, but we didn’t expect the drop in the United States to be as dramatic as it was – going from 13 GW in 2012 to just 1 GW in 2013 China once again emerged as the global leader, installing 16 GW, and European numbers were steady, resulting in a global market of just over 35 GW, and cumulative market growth of 12 5% As has been the case for three of the past four years, the majority of installations were outside the OECD, and this is a trend which will continue to intensify with the emergence of significant markets in Latin America and Africa along with those in Asia which currently drive global growth
Ironically, partly because of the precipitous drop in the US in 2013, 2014 promises to be a record year The US had an all-time high of more than 12,000 MW under construction in December of 2013, and the nature of last year’s PTC extension means that not only 2014 but 2015 will be solid and productive years for US installations as a result But what comes next? There are proposals before Congress now which would end the destructive boom-bust cycle in the US - let’s hope they succeed China’s market continues its ‘comeback’, driven at least in part by public anger at the choking smog engulfing China’s major cities; and the offshore segment in China is expected to take off in the next year or two Brazil will most likely double its total installed capacity in 2014, and nearly do so again in 2015; and the South African market is finally out of the starting blocks Canada had a record year in 2013 and will likely set a new one in 2014, although the prospects after 2015 are also very uncertain Europe remains mired in a debate about its support for renewable energy after 2020, and policy retrenchments in a number of countries have meant that although Europe’s
market posted strong numbers in 2013, future growth now hinges on the debate over whether or not to have binding national targets for renewable for the period from 2020 to 2030 Installing just over 12 GW, the market was concentrated in a smaller number of countries, with Germany and the UK comprising just under 50% of the total, reversing the diversification trend of recent years, which is not a good sign The Indian market is likewise in a state of uncertainty, with erratic policymaking from Delhi, although it is hoped that the elections in May will help get that market back on track So, for 2014 and beyond we can look for most of the growth in the global market to come from both new and established markets outside the OECD “A rising tide floats all ships”, in the sense that it’s much easier for wind to get strong market share in a dynamic and growing economy with significant demand growth It’s much tougher in markets with low or no demand growth, where the competition and mud-slinging from incumbents is fierce In the absence of a global price on carbon, or anything close to it, wind energy’s other attributes come to the fore Today in many markets its most compelling selling point is cost-competitiveness – wind is already competing successfully against heavily subsidized incumbents in a growing number of markets around the world, as the technology and its implementation steadily improve; and job creation remains a priority just about everywhere Furthermore, recent events in the Ukraine and elsewhere also point to wind energy’s contribution to energy security This is the ninth annual report on the status of the global wind industry by the Global Wind Energy Council It provides a comprehensive overview of the global industry at a moment in time; an industry now present in more than 80 countries, 24 of which have more than 1,000 MW installed The information contained in the report – market data, profiles and analysis have been collected primarily through GWEC’s member associations around the world, as well as from governments and independent analysts We thank all our contributors and look forward to continuing our close cooperation in the future
April 2014
Steve SawyerSecretary GeneralGlobal Wind Energy Council
Klaus RaveChairmanGlobal Wind Energy Council

5GWEC – Global Wind 2013 Report
The worldwide demand for energy is steadily growing At the same time, this trend is being accompanied by
rising greenhouse gas emissions We urgently need to correct this current course Our job is to find the right solutions for meeting tomorrow’s energy needs, and to implement a sustainable energy mix Wind power offers great potential for tackling this enormous challenge Many countries have already begun to restructure their energy systems in the direction of renewable sources Yet the euphoria of the pioneering era has since faded The global financial and economic crisis has unsettled governments and economies alike, and in many countries discussions regarding the conversion of energy systems now center only on short-term costs As a result, we are increasingly losing sight of the long-term benefits offered to economies and societies by the development of renewable energy
Raising awareness of the benefitsBy our calculations, by 2035, renewables will be generating more than 25% of world’s electricity, with a quarter of this coming from wind, being the second largest renewable energy source after hydro power according to the International Energy Agency (IEA) This will lead to a substantial reduction in CO2 emissions and create jobs for hundreds of thousands of people In addition, modern infrastructure will be created, especially in remote areas, providing job opportunities for young people But wind energy also offers major advantages for geopolitical reasons: wind is widely available throughout the world and can help reduce energy and fuel import dependency Since it entails no fuel price risks or constraints, it also improves the security of supply, thus stabilizing the cost of power generation over the long term Our industry must drive public awareness of these advantages
For a fair cost-benefit calculationElectricity production costs are still measured by the LCOE (Levelized Cost of Energy) method alone Yet this energy cost parameter takes only part of the overall picture into account In order to get a more realistic cost-benefit calculation, Siemens has developed the ‘Society’s Cost of Electricity’ (SCoE) concept This formula is based on official sources like
the IEA and the Organization for Economic Co-operation and Development (OECD) plus third-party studies, e g by Ernst & Young It takes into account the costs of hidden subsidies, grid development costs, social costs, employment effects and geopolitical factors When all these aspects are taken into consideration in the cost calculation, the advantages of wind energy can already be comprehensively quantified today (see article on p 6) It quickly becomes clear: if you look at the overall costs to the economy, then wind power – onshore as well as offshore – has long been on equal footing with conventional fuels, if not actually superior to them
Keep the big picture in mindThe wind industry should not hide from the public debate about the supposed high costs of renewable energy The SCoE calculation clearly demonstrates that there’s no way of getting around developing renewable energy based on wind – and not only for reasons of environmental policy, but also from an economic perspective
FRESH WIND FOR THE NEXT BIG STEP
Dr. Markus Tacke CEO of the Wind Power Division of Siemens Energy

6 GWEC – Global Wind 2013 Report E X PE RT OPI N ION : R E DE F I N I N G T H E CO S T DE B AT E – T H E CON C E P T OF S O C I E T Y ’S CO S T OF E L EC T R IC I T Y
O ffshore wind is under some pressure at the moment The apparent cost gap relative to more conventional
power (including onshore wind) remains substantial, and we are at least a decade away from wholesale grid parity There is a risk that some countries might say, “We like the concept and we want clean, stable energy, but we can’t afford offshore wind ”From society’s perspective, the selection of electricity sources should be based on their true costs Unfortunately, standard measures of electricity costs reveal only part of the picture According to Siemens internal forecasts, global generation capacity of electricity is expected to nearly double from today’s 6,500 GW to 10,500 GW by 2030 And by 2035, renewables will already be generating more than 25% of world’s electricity, with a quarter of this coming from wind, being the second largest renewable energy source after hydro power according to the International Energy Agency (IEA) Market regulations need to adapt to the changing energy landscape As renewables installation levels have been high in recent years, we are currently in a period of adjustment and the regulatory frameworks need rebalancing In the cost debate related to this rebalancing, the wind sector often serves as a scapegoat for the rising costs of the entire system Most prominently, offshore wind is attacked for its apparent cost gap with conventional power technologies In some countries,
the wind sector is being seriously challenged by declining political support and regulatory uncertainties Needless to say, societies need the right technologies and the right framework conditions to ensure that populations can be supplied with climate-friendly, reliable and affordable energy in the future But the selection of electricity sources should be based on their true costs and benefits In our opinion, the most prominently used Levelized Cost of Electricity (LCOE) comparison does not reflect the complete cost-benefit ratio of the various technologies on a macro-economic scale At Siemens Wind Power, we encourage the energy sector and societies in general to widen their perspective and consider what we call Society’s Cost of Electricity (SCoE) when it comes to selecting energy technologies Today, Levelized Cost of Electricity (LCOE) is generally used as the yardstick for comparing energy sources, or for assessing
investment viability The LCOE is calculated as the ratio of the lifetime sum of discounted capital and operating costs, including fuel and emission costs, divided by the lifetime sum of discounted electricity output However, to arrive at a better estimate of what benefits our societies the most, additional factors need to be considered The total direct or “system” cost of electricity is the sum of the LCOE, plus:
• Subsidies: When talking about renewables, the debate often turns straight to the issue of subsidies – usually with a call for renewables to “grow up and become independent of subsidies ” However, it is often overlooked that conventional technologies such as coal or nuclear also receive substantial levels of subsidies, in effect keeping their prices artificially low
• Grid costs: As the share of renewables in the energy mix grows, grids often need to be reinforced on the transmission level, since renewable sources are either not centrally located (solar, biomass, onshore wind) or are remote (offshore)
• Variability costs: These are payments to keep gas power plants on stand-by as a backup for fluctuating renewable feed-ins; this is mainly a cost factor for renewables – at least until grid-level storage systems are developed
Another cost element that is already part of the LCOE is the cost of CO2, at least in some parts of the world At present, however, the costs of CO2 certificates are artificially low; they simply do not reflect the negative impacts of greenhouse gas emissions on the environment and their accompanying costs This situation is encouraging us to burn coal rather than gas, polluting our air for years to come Calculating a fair price of CO2 – let’s say 40 EUR/t – we would see surcharges of 23 EUR/MWh for coal and 11 EUR/MWh for gas The above factors represent direct costs of electricity which are only partially or not at all taken into account when applying the current LCOE yardstick Integrating these system costs into an
“expanded LCOE” calculation provides a more comprehensive picture and thereby has the potential to balance the ongoing debates on the cost of electricity At Siemens, we use the term
“system costs” or “LCOE+” for the “expanded LCOE” model
EXPERT OPINION
REDEFINING THE COST DEBATE – THE CONCEPT OF SOCIETY’S COST OF ELECTRICITY
Henrik Stiesdal Chief Technology Officer, Wind Power Division of Siemens Energy

7GWEC – Global Wind 2013 Report E X PE RT OPI N ION : R E DE F I N I N G T H E CO S T DE B AT E – T H E CON C E P T OF S O C I E T Y ’S CO S T OF E L EC T R IC I T Y
However, not even the LCOE+ model fully reflects the total cost of electricity for society To calculate a truly comprehensive cost assessment – what one might call “Society’s Cost of Electricity”, or SCoE – additional factors need to be taken into account:
• Social costs: In addition to the greenhouse gas emissions already covered, burning coal creates significant particulate matter, putting our health at risk And nuclear power plants always come with the risk of a severe accident, where the (financial) damage could reach hundreds of billions of euros in a single case Moreover, nuclear and coal-fired power plants consume large amounts of water, which is then no longer available for other use; this dependency could force them to shut down during a drought Yet, these costs are not reflected in the standard LCOE – either as benefits of renewables or as disadvantages of conventional energy sources The potential decline in property prices near power plants — including wind farms — also falls into this category and has to be taken into account; although current studies vary widely on this subject
• Economic impact: The economic impact of a particular energy source is the job creation and the resulting extra growth and consumption associated with the full lifecycle application of the respective energy source The generation of electricity by any source of energy creates jobs and added value, but renewables and nuclear are more labor-intensive than other energy sources during the construction phase When deciding for renewables, society gets an employment scheme “for free” Particularly for offshore wind, components are of a scale that requires local assembly In addition, jobs are created during installation and maintenance
• Geopolitical impact: Wind power hedges against future fuel price increases that are subject to political power plays, political alliances and sometimes even war Deciding in favor of a stable and independent energy source can be seen as simple but efficient insurance against the volatility of the future energy market
Applying the simple LCOE calculation at today’s costs of CO2 typically gives the impression that fossil fuels offer what appears to be the lowest cost of electricity However, if instead we apply our concept of “Society’s Cost of Electricity,” the costs change radically This is particularly obvious when considering offshore wind Offshore wind is a young and pioneering industry that creates jobs, reduces fossil fuel imports and offers huge expansion and export opportunities Yet offshore wind is currently under fire Therefore, we at Siemens have decided to focus particularly on offshore wind when assessing the SCoE concept And quite frankly, we were surprised by the results Here is what we see for installations in the UK in 2025:
Nuclear Coal Gas Photo-voltaics
WindOnshore
WindO�shore
83
88
105
126
76
55
71
59
95
109
60
115
118
79
133
100
= SCoE
€ / MWh
95106
LCOE+ Subsidies+ Transmission+ Variability
When judged according to the social cost of electricity (SCoE) concept, wind onshore and wind o�shore will be the most competitive power sources in the UK by 2025;
gas fired power plants remain the most competitive back up technology.
= LCOE+ system costs+ Social impact+ Employment e�ects+ Geopolitical impact
In a first step, the system cost or LCOE+ is calculated as the sum of:
• LCOE: As a result of ongoing industrialization efforts, the LCOE of offshore wind is set at 95 EUR/MWh by 2025 There is consensus in the wind industry that the cost will be less than 100 EUR/MWh by 2020, so 95 EUR/MWh by 2025 is a conservative assumption Onshore wind and PV costs will also go down, while nuclear, coal and gas are expected to maintain their present cost levels (when excluding the cost of CO2 certificates), although fuel prices will increase We assume 81 EUR/ton for CO2, which might appear high, but matches the lifetime value of CO2 for 2025 installations as defined by the UK carbon floor price
›Wind power hedges against future fuel price increases that are subject to political power plays, political alliances and sometimes even war. Deciding in favor of a stable and independent energy source can be seen as simple but efficient insurance against the volatility of the future energy market.‹

8 GWEC – Global Wind 2013 Report E X PE RT OPI N ION : R E DE F I N I N G T H E CO S T DE B AT E – T H E CON C E P T OF S O C I E T Y ’S CO S T OF E L EC T R IC I T Y
• Subsidies: Since subsidies for renewables are transparent and are applied as a price subsidy, we do not account for them in the above calculation For conventional technologies, subsidies are calculated on the basis of figures from the International Energy Agency (IEA) and the Organization for Economic Co-operation and Development (OECD) and, in addition, include estimates for virtual insurance against a nuclear MCA (maximum credible accident) The highest
“hidden” subsidies are received by nuclear, and amount to 53 EUR/MWh
• Grid costs: Grid cost adders are taken as an incremental adder applied to renewable energy sources only Any overall expansion of the transmission systems required by the overall growth in electricity consumption will apply equally to all energy sources and is set at zero For offshore wind, grid costs amount to around 2 EUR/MWh according to National Grid (2011)
• Variability costs: Compensation for the variability of wind power plants by establishing stand-by gas power plants leads to a cost addition of around 13 EUR/MWh Large-scale storage would be another option, but such technologies are not yet available at an industrial scale However, this situation is likely to change by 2030 since many research initiatives are currently on track
As shown above, the cost adders introduced when going from the simple LCOE calculation to the more comprehensive LCOE+ calculation are higher for renewables than for fossil fuel sources The largest adders apply to nuclear, however, due to the much higher hidden subsidies The picture changes dramatically when introducing the additional cost elements of SCoE:
• Social impact: The social costs of the various energy sources are relatively moderate Onshore wind comes in highest, at 4 8 EUR/MWh due to the impact on neighboring property value There are many studies showing no effect on this, but to be on the safe side, we assume figures in line with Heintzleman/Tuttle 20111 For offshore wind, the social costs are zero
• Economic impact: Offshore wind has more potential to create local employment and a positive GDP impact than almost all other energy sources And this is usually in structurally weak coastal areas and ports where jobs and investments are urgently needed If you decide to go offshore, for many components and production steps there is simply no other choice for turbine producers than to stay close to the point of installation And where there is more employment, there is also more consumption, of which a significant share is spent locally This employment effect acts like a cushion to the electricity bill since a lot of this money returns into the economy, generating wealth and consumption And the numbers are impressive
According to the latest Offshore Wind Industrial Strategy Report published by the UK government and industry, the offshore sector has the potential to create 30,000 jobs and contribute more than EUR 8 billion to the economy in the UK alone by 2020 In Germany, the sector already employs some 14,000 people according to the German Wind Energy Agency (WAB) The value of the economic impact ranges from 21 EUR/MWh for gas to 70 EUR/MWh for offshore wind These are gross effects; in order not to inflate figures too much, we account only for the positive difference to the lowest value (i e vs 21 EUR/MWh) These calculations are based on a study by Ernst & Young (EY) from 20122 They also state that wind power creates 21,000 jobs for a year for every billion invested in offshore wind
21,000 new jobs for a year 1
billion €
For every billion EUR invested in wind power, 21,000 new jobs for a year are created in the EU.
• Geopolitical impact: Wind energy is an inexhaustible renewable energy source available for free It is ideally suited to reduce fuel dependency and the risk of future fuel price increases that will invariably result from energy-hungry societies As a proxy for estimating the cost of the geopolitical impact, we have applied the price adder required to pay for hedging of fossil fuel prices for a period of only two years In the UK, the cost effect for coal is 1 2 EUR/MWh; for
›When talking about renewables, the debate often turns straight to the issue of subsidies – usually with a call for renewables to grow up and become independent of subsidies. However, it is often overlooked that conventional technologies such as coal or nuclear also receive substantial levels of subsidies, in effect keeping their prices artificially low.‹

9GWEC – Global Wind 2013 Report E X PE RT OPI N ION : R E DE F I N I N G T H E CO S T DE B AT E – T H E CON C E P T OF S O C I E T Y ’S CO S T OF E L EC T R IC I T Y
gas it is 5 4 EUR/MWh When applying these values for the decades beyond 2025, we consider them to be conservative For renewables, the geopolitical impact is zero
The overall effect of applying the SCoE calculation methodology is to shift the cost balance significantly All renewable energy sources provide substantial economic impact, as does nuclear The net effect is that, when all relevant factors are taken into account, both onshore and offshore wind power beat all other sources hands-down for the cost of electricity
SUMMARY
Wind power is a main pillar of tomorrow’s energy supply It generates clean and climate-friendly electricity, creates jobs and reduces risks on several levels, such as exposure to particulate matter and susceptibility to the price volatility of imported fuel Jobs related to the installation and maintenance of wind turbines can be localized and hence create employment directly, and additional jobs will be created for offshore wind in turbine assembly and embarkation ports These jobs will lead, in turn, to additional consumption However, wind power can`t be a stand-alone solution as it needs balancing energy For this purpose, gas
power remains the most competitive solution Consequently, wind together with high-efficiency combined cycle power plants can provide a reliable and economical low-CO2 power supply system When broadening the scope of electricity cost calculation from LCOE to SCoE – Society’s Cost of Electricity – we account for (partially hidden) subsidies, grid access costs, variability costs, social costs, economic benefits and geopolitical impact When comparing different technologies on the basis of all these parameters, the cost of wind power in general, but offshore wind in particular, declines considerably from the high price tag indicated by LCOE This is primarily due to the very positive effect on local employment For example, in our projection for the UK in 2025, the SCoE for offshore wind is on the same level as for onshore wind and lower than for any other technology This example for the UK in 2025 demonstrates that applying the SCoE concept would lead to a paradigm shift –which one hopes would ensure a redefined, more balanced and fruitful cost debate for the benefit of society
1 Values in the wind, http://papers ssrn com/sol3/papers cfm?abstract_id=1803601 2 Ernst & Young 2012: Analysis of the value creation potential of wind energy policies July 2012,
www ey com/Publication/vwLUAssets/EY_Acciona_EDP_Value_creation_of_wind_policies_summary/$FILE/EY_Acciona_EDP_Value%20creation%20of%20wind%20policies_summary pdf
© Siemens
10 GWEC – Global Wind 2013 Report A R E N E WA B L E E N E RG Y F U T U R E
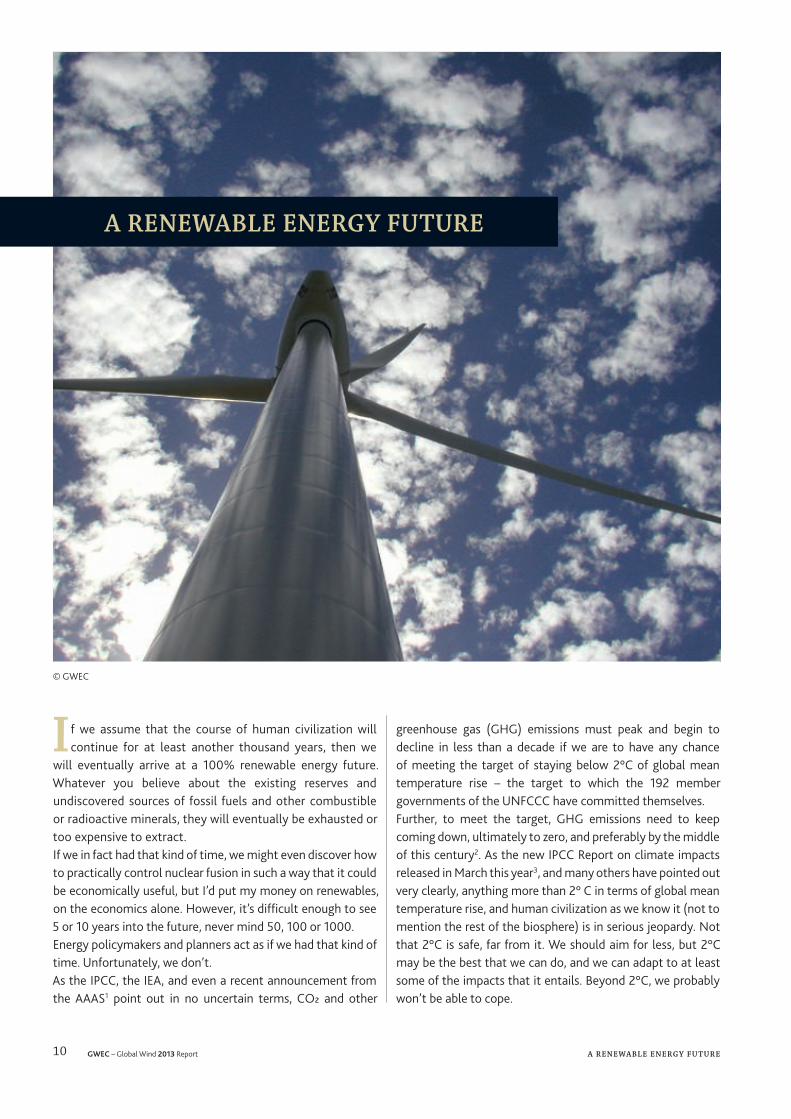
I f we assume that the course of human civilization will continue for at least another thousand years, then we
will eventually arrive at a 100% renewable energy future Whatever you believe about the existing reserves and undiscovered sources of fossil fuels and other combustible or radioactive minerals, they will eventually be exhausted or too expensive to extract If we in fact had that kind of time, we might even discover how to practically control nuclear fusion in such a way that it could be economically useful, but I’d put my money on renewables, on the economics alone However, it’s difficult enough to see 5 or 10 years into the future, never mind 50, 100 or 1000 Energy policymakers and planners act as if we had that kind of time Unfortunately, we don’t As the IPCC, the IEA, and even a recent announcement from the AAAS1 point out in no uncertain terms, CO2 and other
greenhouse gas (GHG) emissions must peak and begin to decline in less than a decade if we are to have any chance of meeting the target of staying below 2°C of global mean temperature rise – the target to which the 192 member governments of the UNFCCC have committed themselves Further, to meet the target, GHG emissions need to keep coming down, ultimately to zero, and preferably by the middle of this century2 As the new IPCC Report on climate impacts released in March this year3, and many others have pointed out very clearly, anything more than 2° C in terms of global mean temperature rise, and human civilization as we know it (not to mention the rest of the biosphere) is in serious jeopardy Not that 2°C is safe, far from it We should aim for less, but 2°C may be the best that we can do, and we can adapt to at least some of the impacts that it entails Beyond 2°C, we probably won’t be able to cope
© GWEC
A RENEWABLE ENERGY FUTURE
11GWEC – Global Wind 2013 Report A R E N E WA B L E E N E RG Y F U T U R E
So, the question about a 100% renewable energy future becomes not ‘if?’ but ‘how?’ and most importantly, ‘how quickly can we do it?’ According to the latest science, the middle of this century seems to be the latest that we can wait for a zero emissions energy system if we are to have any chance at all of stabilizing the climate Of course, energy related CO2 emissions only amount to a bit less than three-quarters of total greenhouse gas emissions, so there are other issues to consider as well, such as agriculture, forestry and the chemical industry The power sector accounts for about 40% of overall CO2 emission, or around 25% of the total However, for the purposes of this chapter, we’ll stick to energy We have the technology to deal with the problem, but we need a “Marshall Plan” for our energy system, which cannot be built on the premise of an “all of the above” strategy ‘All of the above’ is not a strategy, and it dooms our children and theirs to a life on a rather inhospitable planet
Surely Renewables can’t do it on their own? Today? No. Tomorrow? Why not?While you will find no shortage of pundits and experts who will say that renewables cannot fully power our energy system, you see precious little analysis to back these statements up One generally hears something like, ‘what do you do when the sun doesn’t shine or the wind doesn’t blow?’, and then on to tout their favorite technology, whether it be nuclear, ‘clean coal’, carbon capture and storage (CCS) or some other variation on the energy system that has gotten us into this mess in the first place They conveniently forget that hydro, biomass, solar-thermal, geothermal and down the road, ocean energy are not variable as are wind and solar PV They forget that Brazil, Norway and New Zealand are nearly at a 100% renewable electricity supply, and that Denmark, Sweden and others are already moving in that direction They forget that with broad grid coverage areas and strong interconnections power can be moved about quite efficiently, and they forget the growing movement of homeowners
and businesses that are increasingly moving towards self-sufficiency, primarily through the use of solar PV and other small scale technologies which have come down dramatically in cost in recent years With sufficient storage (pumped, compressed air, batteries, fuel cells), sufficient dispatchable renewable sources such as those listed above, and sufficient energy efficiency, energy conservation, smart grids and demand management systems, it is certainly technically feasible to power our economy completely on renewable energy, as a number of simulations in different parts of the world have shown Further, in the places with large RE penetration such as Denmark, you see a much greater role for electricity in the overall energy system, not only for transport but for heating as well The fact is, a 100% renewable energy future is technically feasible, and at low or no cost to GDP, especially when you consider the fuel savings involved for most economies AND the necessary removal of the 650 billion or so USD/year in subsidies to fossil fuel production and consumption The questions are whether it is politically feasible; and how much it would cost The fact is that we are engaged in a long-term struggle for the future of our energy system The incumbents represent the largest concentration of wealth on the planet, both public and private So it’s not surprising that while CitiGroup proclaimed in March that ‘the age of renewables has begun4’; you will still find many ‘experts’ who still ‘believe’ that renewables ‘just can’t do it’ We do not have ready-made answers for every place on earth at hand We’re just beginning a transition that is going to take 50 years, and we are going to need fossil fuels (in decreasing quantities) in one form or another for decades; but the renewables industry has come a very long way in the last 10 years We’re certainly a lot further ahead in the game than any of the ‘alternative’ means to deal with the climate issue, i e , nuclear power, gas and CCS The cost of nuclear continues to go up and up and building a plant takes longer and longer, and it seems unlikely that the rate of new build will even maintain nuclear power’s current share of the global electricity supply (which is currently less than hydro) As for gas as a ‘bridging’ fuel, the question has been rightly asked if it’s a bridge or a gangplank5 as it produces less CO2 at the point of combustion than coal, but add up the methane leakage from fracking and the general leakiness of the gas pipeline system, and as far as the climate is concerned, we may well be better off burning coal as efficiently as we can Of course, there are many other reasons not to burn coal – and CCS has yet to convince anyone that it is even remotely financially viable, and remember, while existing and tested carbon capture technology reduces emissions, it doesn’t eliminate them – you still have something between 15 and 30 percent of the emissions, which we can’t afford
›What gets us into trouble is not what we don’t know. It’s what we know for sure that just ain’t so.‹ Mark Twain

12 GWEC – Global Wind 2013 Report A R E N E WA B L E E N E RG Y F U T U R E
The cost of solar and wind keeps going down, and we have enough proven resource from either to power the world many times over, wind about 7 and solar about 50
So why is a future powered by 100% renewables impossible again?Of course if for one or another reason, one just doesn’t believe it’s possible, then there’s little that can be said here which will make a difference We’ll just have to show you But the science is clear, and we can’t change the physics of the climate system So we have to change what we can, i e , the politics; and we have to change these ‘beliefs’, especially the beliefs of those who aren’t wedded to the fossil fuel industry
STOCKTAKING: WHERE ARE WE NOW?
At present, we are stuck in a competition between the “old” and “new” energy system models, especially in places where energy demand is not growing However, economics, scientific evidence and public opinion are beginning to impact political and lately even national military strategy6 By the end of 2012, 138 countries had introduced some kind of renewable energy targets By the end of 2012 renewable power accounted for 1,470 GW of which modern renewable energy sources accounted for 480 GW Renewables made up half of the total net additions to electric generating capacity from all sources in 2012 (GSR 20137) By the end of 2013, wind power had added another 35 5 GW and Solar had added another 36 7 GW of new capacity to the 2012 total Since 2010, more than a quarter of a trillion dollars have been invested annually in renewable energy, energy efficiency and supporting technologies Global investment in clean energy was USD 254 bn (EUR 183 bn) last year, USD 286 2 bn (EUR 206 bn) in 2012 and a record USD 317 9 bn (EUR 229 bn) of 2011 (BNEF, 20148) Additionally in an increasing number of markets renewables are becoming competitive with new-build coal, and in a number of markets with new-build gas power plants
US ©Wild Horse Renewable Energy Center
›It is difficult to get a man to understand something, when his salary depends upon his not understanding it!‹ Upton Sinclair

13GWEC – Global Wind 2013 Report A R E N E WA B L E E N E RG Y F U T U R E
RISING RISKS TO GLOBAL INFRASTRUCTURE
The global conventional energy sector is a major focus of efforts to slow the growth of greenhouse gas emissions and to lower the carbon footprint of human development activities The energy sector itself will be severely affected by unavoidable consequences from the already induced warming of the atmosphere Energy services and resources, as well as seasonal demand, will be increasingly affected by changing climate trends: increasing variability, greater extremes and large inter-annual variations in climate, and particularly changes in the hydrological cycle All evidence suggests that climate change is not a minor variable but a long-term business risk In one example, in March 2014 a report by the US Department of Energy9 details how the US’s aging interconnected infrastructure network is under greater threat from climate change The US Government Accountability Office10 (GAO)—a federal watchdog agency—finds that the US’s energy infrastructure is increasingly vulnerable to a range of climate change impacts, especially in areas prone to severe weather and water shortages It states that the damage from such events can impose large costs on the energy industry, as well as impact the local and national economies The GAO also did a series on the Water-Energy-Nexus11, which shows how water and energy are “inextricably linked and mutually dependent” Water shortages will impact energy
supply, by both slowing down extraction of raw fuels and production of electricity, not only for hydro power plants, but also at the thermal, natural gas, and nuclear power plants that require significant amounts of water, as do coal mining and hydrocarbon extraction
COSTS
The development of renewable electricity generation over the past 20 years has been characterised by considerable growth rates, and sometimes dramatic cost reductions Geographically, renewables are no longer limited to the OECD markets In the last five years non-OECD markets emerged strongly, especially in Asia and Latin America During the 2008-11 recession this geographical diversification helped mitigate the risk of over exposure to a single region or a handful of markets for some companies In addition to providing new, indigenous, cost-competitive and clean power supply, RE has also had an impact on the market prices itself An increased penetration of renewables for example wind and solar in the EU have led to lower wholesale spot prices This phenomenon is known as the ‘Merit Order Effect13’ However, as many countries regulate consumer-prices and use electricity bills to levy taxes that are not directly related to power production, low energy costs do not always pass through to end consumers
G L OB A L L E V E L I S E D C O S T OF P O W E R G E N E R AT ION R A N G E S 1 2 ( Q 1 OF 2 0 1 3 )
Bioe.co-�ring Solar PV Hydro
Windo�shore
Newgas CCGT
SolarPV
Bioenergy Geo-thermal
CSP Windonshore
New coal Microhydro
Biogas
200
150
100
50
0
250
300
350
400 USD / MWhUtility scale Small scale
Average 2012 wholesale power prices
Italy
CW Europe
US (PJM)
Notes: costs are indicative and ranges reflect differences in resources, local conditions and the choices of sub-technology. CCGT = combined-cycle gas turbine. Central-Western (CW) Europe = Austria, France, Germany, Switzerland. United States (US). PJM = regional transmission organisation covering 13 states and the district of columbia (DC). Source: IEA analysis with power price data from Bloomberg LP, 2013

14 GWEC – Global Wind 2013 Report A R E N E WA B L E E N E RG Y F U T U R E
The cost of support mechanisms for renewable-energy was over EUR 30 bn in 2010 across the EU, of which EUR 2 2 bn was for wind energy [WPM, 201414] On the other hand in 2012 EU’s fossil-fuel imports - a key driver of energy bills - was as high as EUR 421 bn, over 3% of the EU’s GDP
THE WAY FORWARD
Renewable energy faces stiff opposition from conventional power sector players and utilities as the zero marginal cost of solar and wind is upsetting the old and established business models This fight is casting a shadow on the political debate in several markets In some EU member countries, electricity prices have become a political football and renewables are incorrectly blamed for rising prices; but this is making consensus around the 2030 RE targets for the EU difficult However, the ongoing drama in Ukraine brings home the point that the path to safeguarding Europe’s energy security concerns will be easier with renewables based supply At an event in February 2014 in Indonesia15, the US Secretary of State John Kerry said “climate change ranks among the world’s most serious problems”, such as disease outbreaks, poverty, terrorism and the proliferation of weapons of mass destruction and called on all nations to respond to “the greatest challenge of our generation” Two weeks later in March 2014 the Chinese Premier at the annual opening session of the country’s Parliament said, “We will resolutely declare war against pollution as we declared war against poverty16” These strong statements made by senior representatives of the world’s largest polluter historically (US) and the world’s largest current emitter (China) is indicative of a change in political sentiment and gives at least some hope for action under the UN for the post 2020 climate agreement
In the meantime, a political strategy for a transition to a renewables future will have to be developed in steps. The first step would be to transition to 100% RE based electricity generation, as the EU’s current 2050 climate strategy nearly does 100% RE heating and cooling and a zero emissions transport sector are achievable too; but not as long as governments continue to subsidize CO2 emissions to the tune of USD 110/tonne (EUR 79 5)17 There are obvious solutions that involve managing different combinations of energy efficiency, energy sector reforms, RE penetration, and phasing out fossil fuel subsidies The individual solution-set for each city, state or region will be different, and would need to be backed by long-term stable policy There are a number of global mitigation/energy scenarios including those reviewed by the IPCC18, the IEA (450 Scenario), Greenpeace and WWF/Ecofys available in the public domain for reference Some of these institutions have modeled pure renewables-based electricity systems including Greenpeace19 and WWF/Ecofys20 Others have modeled high-efficiency diversified energy systems with high penetration of RE based generation In either case, the impediments are non-technical and the solution will need at least two things to happen: unlocking steady and higher levels of investment and ensuring stable policy regime backed by long-term targets According to the IEA’s Energy Technology Perspectives report from 2012, achieving the 2°C scenario would require USD 36 trillion (EUR 25 8 tn) more in capital investments between 2013 and 2050 than under a scenario in which reducing carbon emissions was not a priority The first step to unlocking some of this investment would be to introduce a price on carbon emissions Unless a fair price of carbon is set and fossil fuel subsidies (producer and consumer) are eliminated in the near future, the RE sector may do well, but we’re not going to reach our climate goals
United Kingdom © GWEC

15GWEC – Global Wind 2013 Report A R E N E WA B L E E N E RG Y F U T U R E
CONCLUSION
The transformation of the global energy system has begun More money has been invested in new renewables-based generation capacity than on non-renewables-based generation capacity Investments in renewable energy are first and foremost investments in long-term ecological and economic stability The switch to a 100% RE based electricity system is well underway in some countries, and we have the technology to do it economically Heating, cooling and transport provide other challenges, but they are (mostly) not technological
We have a very short window in which can act before climate impacts go from bad to catastrophic, and before the decisions are effectively taken out the hands of democratically elected governments and put first in the hands of the emergency services, and ultimately, the military The higher capital costs of investing in a renewable future now will be more than paid back by fuel savings down the line, not to mention all the other savings from reduced expenditure on mitigating and adapting to climate However, the real question is not whether or not we can afford it We very clearly can’t afford NOT to
1 AAAS: American Association for the Advancement of Science http://www theguardian com/environment/2014/mar/18/climate-change-world-risk-irreversible-changes-scientists-aaas
2 http://www ecofys com/en/publication/feasibility-of-ghg-emissions-phase-out-by-mid-century/3 The IPCC Working Group II (WG II) assesses the vulnerability of socio-economic and natural
systems to climate change, negative and positive consequences of climate change, and options for adapting to it It also takes into consideration the inter-relationship between vulnerability, adaptation and sustainable development WGII contribution to the 5th Assessment Report on impacts, adaptation and vulnerability were released in Yokohama, Japan, on 31 March 2014 www ipcc ch
4 http://reneweconomy com au/2014/citigroup-says-the-age-of-renewables-has-begun-69852 original paper at: https://ir citi com/xeUMamE0QAMjDWK1qbUUGA8nPGVahyb675iYliub5pCz8P3yz63Gyh1e3dzYIK4fKsXHnW6qM%3D
5 http://thinkprogress org/climate/2013/08/07/2426441/methane-leakage-gas-fields/6 In April 2012, the US announced that its Defense Department was making one of the largest
commitments to clean energy in history, by setting a goal to deploy 3 GW of RE – including solar, wind, biomass or geothermal – on Army, Navy and Air Force installations by 2025 This is a congressionally mandated energy goal of 25% production and consumption of energy from RE sources by 2025 and improving installation energy security and sustainability while remaining cost conscious
7 GSR 2013: Global Status Report by REN21 includes hydropower under renewable energy sources http://www ren21 net/Portals/0/documents/Resources/GSR/2013/GSR2013_lowres pdf
8 BNEF 2014: http://about bnef com/press-releases/clean-energy-investment-falls-for-second-year/ 9 Climate Change and Infrastructure, Urban Systems and, Vulnerabilities – Technical Report for US
Department of Energy (Released: Mar, 2014)10 Climate Change: Energy Infrastructure Risks and Adaptation Efforts GAO-14-74: (Released: Mar 4,
2014) http://www gao gov/products/GAO-14-74 11 http://www gao gov/key_issues/energy_water_nexus/issue_summary 12 IEA Medium-term Renewable Energy Market Report 2013 (pp 17)
13 Each generator, or source of electricity, is used according to cost; with lowest cost generation being used first This is referred to as a “merit order” dispatch system Price is determined by cost of fuel and operating costs Renewables have no fuel costs; this alters the “merit order” High-cost generators in that case may not be used, resulting in lower prices Household (distributed) renewables like rooftop solar PV through net metering can have a similar effect on the merit order
14 http://www windpowermonthly com/article/1281875/europe-fails-deliver-policy 15 http://edition cnn com/2014/02/16/politics/kerry-climate/ 16 http://www reuters com/article/2014/03/05/us-china-parliament-pollution-
idUSBREA2405W20140305 17 http://www ewea org/news/detail/2013/02/04/eu-wind-industry-faces-tough-challenge-and-
politicians-should-not-make-it-worse/ 18 IPCC Special Report on Renewable Energy Sources and Climate Change Mitigation http://srren
ipcc-wg3 de 19 Energy [R]evolution http://www greenpeace org/international/en/campaigns/climate-change/
energyrevolution/ 20 The Energy Report: 100% Renewable Energy by 2050 http://www wwf org uk/wwf_articles
cfm?unewsid=4565 21 There are many groups and coalitions working on promoting climate actions and clean energy
practices in cities Some such groups include C40CITIES (www c40 org ); ICLEI Local Governments for Sustainability (www iclei org )
22 For a detailed list of targets, policies and measures supporting RE across the countries, visit IEA-IRENA Joint Policies and Measures Database http://www iea org/policiesandmeasures/renewableenergy/
23 http://www os is/gogn/os-onnur-rit/orkutolur_2011-enska pdf 24 http://www cityofsydney nsw gov au/vision/sustainable-sydney-2030/sustainability/
carbon-reduction/renewable-energy 25 http://energy gov/eere/articles/greensburg-kansas-deployment-project
Cities21 & Countries22 moving towards 100% RE in electricity systems
Country Target
Iceland (OECD) Produces 100% of its electricity from hydropower and geothermal energy23
Cook Islands (Small Island State) Ensure the policy and regulatory environment is aligned with the 50% by 2015 and 100% by 2020 renewable energy goal
Costa Rica (Central America) In 2013, Costa Rica proposed a climate change law that aims to establish the country’s goal of carbon neutrality. Costa Rica publically launched efforts to reduce deforestation and it has a 95% renewables goal for 2014, mostly from indigenous hydro resources.
Denmark (OECD) Denmark proposes to meet more than 50% of its electricity supply with renewables by 2020, 100% of electricity and heat by 2035, and 100 per cent in transport by 2050
Maldives (Small Island State) In 2009, Maldives pledged to go completely carbon neutral by 2020. This entailed embracing an almost 100% renewables based energy system. However political upheavals since 2012 have slowed down the political push
Scotland (OECD) Scotland has a mandate to achieve 100% renewable power supply by 2020.
Tokelau (Small Island State) Tokelau has a target of producing a 100% of its electricity from renewable energy. In 2012, the Tokelau Renewable Energy Project installed solar arrays on each atoll and Tokelau now already produces over 10% of its electricity from solar energy
Tuvalu (Small Island State) In 2012, Tuvalu set a goal to generate a 100% of its electricity from renewable energy by 2020 and to increase energy efficiency on Funafuti by 30%
Tasmania (Australian Territory) Tasmanian Government has beaten mainland Australia by launching a new climate action plan that will commit the state to 100% renewables by 2020 and a 35% reduction in emissions.
City Target
Sydney (Australia) Sydney’s renewable energy master plan outlines measure for procuring 100% of the City’s electricity, heating and cooling from RE sources, such as solar, wind and energy from waste, by 203024
Malmo (Sweden) The City of Malmo is expected to be climate neutral by 2020 and all its municipal operations will run on 100% RE by 2030
Greensburg, Kansas25 (US)On May 4, 2007, a tornado damaged 95% of the town’s homes and businesses. The town thereafter developed a green master plan with help from the NREL and the US Department of Energy. It set itself a goal of 100% renewable electricity besides energy efficiency and LEED certified buildings. Today the town sources a 100% of electricity from a 12.5 MW wind farm.
San Francisco, California (US) The city through San Francisco Public Utilities Commission under CleanPowerSF - the program will provide San Francisco with 100% electricity generation from renewable sources.

16 GWEC – Global Wind 2013 Report T H E G L OB A L S TAT U S OF W I N D P O W E R I N 2 0 1 3
More than 35 GW of new wind power capacity was brought online in 2013, but this was a sharp decline in
comparison to 2012, when global installations were in excess of 45 GW In terms of overall investments the global wind sector saw a small decline to USD 80 3bn (EUR 58 7bn1) in 2013, down from USD 80 9bn (EUR 59 2bn) in 20122 The new global total at the end of 2013 was 318,105 MW, representing cumulative market growth of more than 12 5 percent, strong growth for a manufacturing industry given the economic climate, even though it is lower than the average annual rate over the last 10 years of approximately 21 percent At the end of 2012, the expectations for wind power market growth were uncertain, as continued economic slowdown in Europe and the political uncertainty in the US made it difficult to make projections 2013 turned out to be another difficult year for the industry, mainly due to the dramatic drop in the US market after record installations in 2012 China, the largest overall market for wind since 2009, had a good year, and once again gained the top spot in 2013 Installations in Asia again led global markets, with Europe reliably in the second spot, and North America a distant third
A result of this was that in 2013, unlike in 2012, the majority of wind installations globally were outside the OECD once again This was also the case in 2010 and 2011, and is likely to continue to be the case for the foreseeable future By the end of last year the number of countries with more than 1,000 MW installed capacity was 24: including 16 in Europe;3 4 in Asia-Pacific (China, India, Japan & Australia); 3 in North America (Canada, Mexico, US) & 1 in Latin America (Brazil) By the end of last year six countries had more than 10,000 MW in installed capacity including China (91,412 MW), the US (61,091 MW), Germany (34,250 MW), Spain (22,959 MW), India (20,150 MW) and the UK (10,531 MW) China will at some point in 2014 cross the 100,000 MW mark, adding another milestone to its already exceptional history of renewable energy development since 2005 Largely driven by China, Asia is likely to overtake Europe as the region with the most deployed wind capacity by the end of 2014 Looking ahead, while 2014 is likely to be much better than 2013 in terms of overall installations, the picture is complex across various regions Europe’s framework legislation and its 2020 targets ensure a degree of stability, but a wave of policy uncertainty and the lack of clarity on its post 2020 regime
Brazil ©Hahn / GWEC
THE GLOBAL STATUS OF WIND POWER IN 2013

17GWEC – Global Wind 2013 Report T H E G L OB A L S TAT U S OF W I N D P O W E R I N 2 0 1 3
G L OB A L I N S TA L L E D W I N D P O W E R C A PAC I T Y ( M W ) – R E G ION A L DI S T R I B U T ION
End 2012 New 2013 Total (End of 2013) A F R IC A & M I DD L E E A S T
Ethiopia 81 90 171 Egypt 550 - 550
Morocco 291 - 291 Tunisia 104 - 104
Iran 91 - 91 Cape Verde 24 - 24
Other (1) 24 - 24 Total 1,165 90 1,255
A S I APR China 75,324 16,088 91,412
India 18,421 1,729 20,150 Japan 2,614 50 2,661
Taiwan 571 43 614 South Korea 483 79 561
Thailand 112 111 223 Pakistan 56 50 106
Sri Lanka 63 - 63 Mongolia - 50 50
Other (2) 71 16 87 Total 97,715 18,216 115,927
E U ROPEGermany 31,270 3,238 34,250
Spain 22,784 175 22,959 UK 8,649 1,883 10,531
Italy 8,118 444 8,552 France 7,623 631 8,254
Denmark 4,162 657 4,772 Portugal 4,529 196 4,724 Sweden 3,746 724 4,470
Poland 2,496 894 3,390 Turkey 2,312 646 2,959
Netherlands 2,391 303 2,693 Romania 1,905 695 2,600
Ireland 1,749 288 2,037 Greece 1,749 116 1,865 Austria 1,378 308 1,684
Rest of Europe (3) 4,956 832 5,737 Total Europe 109,817 12,031 121,474
of which EU-28 (4) 106,454 11,159 117,289 L AT I N A M E R IC A & C A R I B BE A N
*Brazil 2,508 953 3,461 Chile 205 130 335
Argentina 142 76 218 Costa Rica 148 - 148 Nicaragua 146 - 146 Honduras 102 - 102
Dominican Republic 33 52 85 Uruguay 56 4 59
Carribean (5) 136 - 136 Others (6) 54 20 74
Total 3,530 1,235 4,764 N ORT H A M E R IC A
USA 60,007 1,084 61,091 Canada 6,204 1,599 7,803 Mexico 1,537 380 1,917
Total 67,748 3,063 70,811 PAC I F IC R E G ION
Australia 2,584 655 3,239 New Zealand 623 - 623
Pacific Islands 12 - 12 Total 3,219 655 3,874
World total 283,194 35,289 318,105 Source: GWEC
1 Israel, Jordan, Kenya, Libya, Nigeria, South Africa2 Bangladesh,Philippines, Vietnam3 Bulgaria, Cyprus, Czech Republic, Estonia, Finland, Faroe Islands, FYROM, Hungary, Iceland, Latvia, Liechtenstein, Lithuania, Luxembourg,Malta,Norway, Romania, Russia, Switzerland, Slovakia, Slovenia, Ukraine.4 Austria, Belgium, Bulgaria, Cyprus, Croatia, Czech Republic, Denmark, Estonia, Finland, France, Germany, Greece, Hungary, Ireland, Italy, Latvia, Lithuania, Luxembourg, Malta, Netherlands, Poland, Portugal,
Romania, Slovakia, Slovenia, Spain, Sweden, UK5 Caribbean: Aruba, Bonaire, Curacao, Cuba, Dominica, Guadalupe, Jamaica, Martinique, Granada6 Bolivia, Colombia, Ecuador, Peru, VenezuelaNote:* Projects fully commissioned, grid connections pending in some casesProject decommissioning of approximately 374 MW and rounding affect the final sums
18 GWEC – Global Wind 2013 Report T H E G L OB A L S TAT U S OF W I N D P O W E R I N 2 0 1 3
for renewables, combined with the on-going economic crunch means that the outlook for the 2014 market is subdued The slowdown in Asia in 2012-2013 was a result of a combination of factors, but these conditions are expected to be short-lived, and Asian dominance of global wind markets is expected to continue Market consolidation and rationalisation in China is now almost over which could lead to installations at 2010/11 levels A partial reinstatement of support mechanisms (GBI) in India is likely to lead to a better 2014 outcome than in 2013, but the market is unlikely to return to 2011 levels before 2015-16 Canada, Brazil and Mexico are expected to have strong years in 2014, and more than five hundred megawatts from sub-Saharan Africa will come on line for the first time: in South Africa, Ethiopia and possibly Kenya Global installations will be further propped up by new projects coming on line in Japan, Australia, Pakistan, Vietnam and Thailand Although in the US, the Production Tax Credit expired again at the end of 2013, the new PTC rules mean there will be strong installations in 2014 and 2015, and a more comprehensive set of tax reform legislation may be in the works
ASIA: CHINA AND INDIA REMAIN AT THE TOP
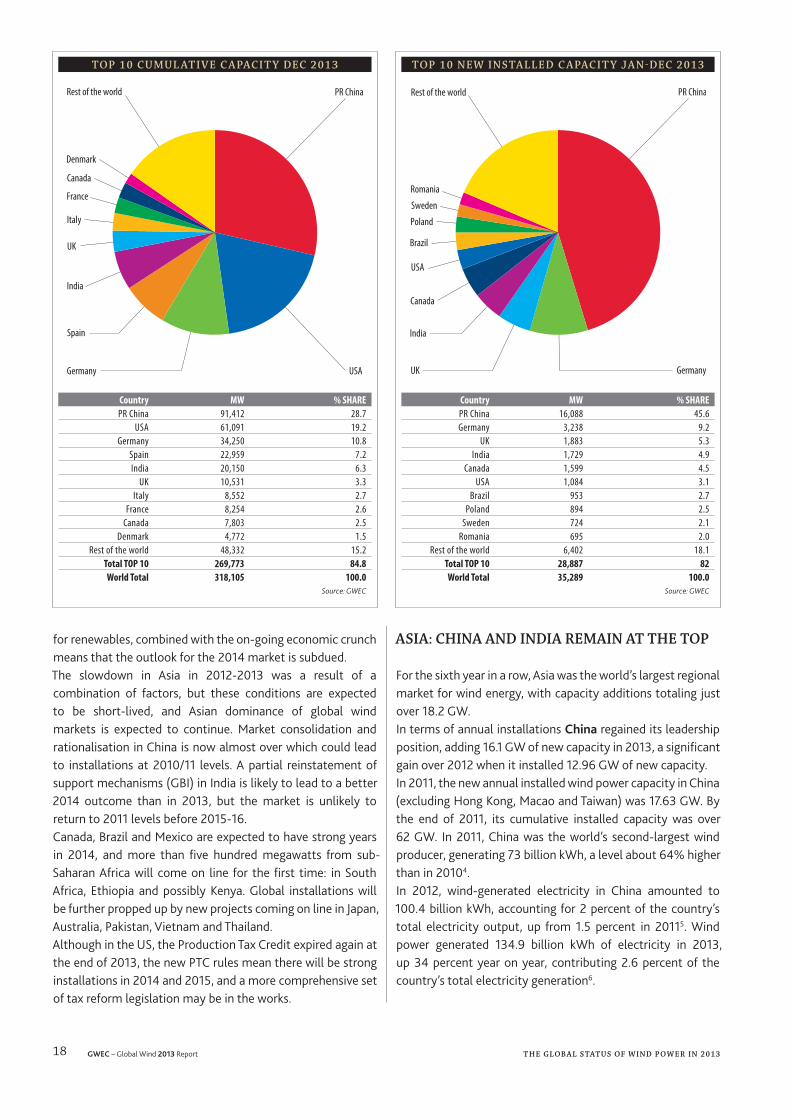
For the sixth year in a row, Asia was the world’s largest regional market for wind energy, with capacity additions totaling just over 18 2 GW In terms of annual installations China regained its leadership position, adding 16 1 GW of new capacity in 2013, a significant gain over 2012 when it installed 12 96 GW of new capacity In 2011, the new annual installed wind power capacity in China (excluding Hong Kong, Macao and Taiwan) was 17 63 GW By the end of 2011, its cumulative installed capacity was over 62 GW In 2011, China was the world’s second-largest wind producer, generating 73 billion kWh, a level about 64% higher than in 20104 In 2012, wind-generated electricity in China amounted to 100 4 billion kWh, accounting for 2 percent of the country’s total electricity output, up from 1 5 percent in 20115 Wind power generated 134 9 billion kWh of electricity in 2013, up 34 percent year on year, contributing 2 6 percent of the country’s total electricity generation6
TOP 1 0 C U M U L AT I V E C A PAC I T Y DE C 2 0 1 3
Rest of the world
Denmark
Canada
France
Italy
UK
India
Spain
Germany USA
PR China
Country MW % SHAREPR China 91,412 28.7
USA 61,091 19.2Germany 34,250 10.8
Spain 22,959 7.2India 20,150 6.3
UK 10,531 3.3Italy 8,552 2.7
France 8,254 2.6Canada 7,803 2.5
Denmark 4,772 1.5Rest of the world 48,332 15.2
Total TOP 10 269,773 84.8World Total 318,105 100.0
Source: GWEC
TOP 1 0 N E W I N S TA L L E D C A PAC I T Y J A N - DE C 2 0 1 3
Rest of the world
Romania
Sweden
Poland
Brazil
USA
Canada
India
UK Germany
PR China
Country MW % SHAREPR China 16,088 45.6 Germany 3,238 9.2
UK 1,883 5.3 India 1,729 4.9
Canada 1,599 4.5 USA 1,084 3.1
Brazil 953 2.7 Poland 894 2.5
Sweden 724 2.1 Romania 695 2.0
Rest of the world 6,402 18.1 Total TOP 10 28,887 82 World Total 35,289 100.0
Source: GWEC

19GWEC – Global Wind 2013 Report T H E G L OB A L S TAT U S OF W I N D P O W E R I N 2 0 1 3
China’s total installed electricity generation capacity was an estimated 1,145 GW at the beginning of 2013 By the end of 2012, wind energy (5 percent) had the third largest installed capacity after coal (66 percent) and hydropower (22 percent), surpassing natural gas (3 percent) and nuclear (1 percent)7 By the end of 2013, wind’s contribution had risen to 6 percent8 The Chinese wind market more than doubled its capacity from 44 7 GW in 2010 to reach 91 4 GW by the end of 2013, cementing China’s global lead in terms of cumulative installed wind power capacity Everyone has been surprised by the astonishing growth of China’s wind sector since 2006, but it is now entering a more steady development and refinement stage The pace of growth in the Chinese wind energy market had in the period from 2010-12 outstripped the ability of the power grid and system operators to manage it effectively Curtailment of electricity generation became a new challenge for wind power projects In 2011 alone, more than 10 billion kWh of wind power was lost because the grid had no capacity to absorb it In the meantime, however, the NEA and State Grid are working to solve the transmission bottlenecks and other grid issues The NEA is also actively encouraging wind farm development in lower wind zones that are closer to load centers
India today is the second largest wind market in Asia, presenting substantial opportunities for both international and domestic players The Indian wind sector has struggled in the last couple of years to repeat the strong market in 2011 when over 3 GW was installed, and 2013 was a slower year due to a lapse in policy in 2012 Nonetheless, India saw new wind energy installations of 1,729 MW in 2013, for a total of 20,150 MW This pace of growth kept the Indian wind power market firmly in the top five rankings globally As of January 2014, total wind installations had risen to 20,298 8 MW bringing the total grid connected renewable energy installations in the country to 30,177 9 MW9 By the end of 2012, renewable energy accounted for over 12 8% of total installed capacity, and about 5% of electricity generation, up from 2% in 1995 Wind power accounted for about 66% of total renewable energy capacity and about 8 6% of the total installed capacity of 234 GW at the end of January 201410 With the acute need for electrification and rising power consumption in the country, wind energy is going to provide an increasingly significant share of the renewables based capacity While the rest of Asia did not make much progress in 2013, there are some favourable signs on the horizon
India © GWEC

20 GWEC – Global Wind 2013 Report T H E G L OB A L S TAT U S OF W I N D P O W E R I N 2 0 1 3
The Japanese market saw new installations of 50MW in 2013 to reach a cumulative capacity of 2,661 MW This represents around 0 5% of the total power supply in Japan After the Fukushima accident in March 2011, Japan is slowly moving towards a transformation of its energy system to allow for a more diverse energy mix including more wind power and other renewables However, removing existing barriers will still take some time Offshore wind development, in particular floating turbines, is a promising prospect for the future The Government of South Korea made “green growth” one of its national development priorities Although wind power is still a relatively small energy generation technology in South
Korea, 2013 saw 79 MW of new installations onshore, which brought the total installed capacity to 561 MW The Korean government had earlier put forward a strategy for offshore wind development with a target of 2 5 GW by 2019 Thailand added 111 MW of new capacity in 2013, bringing its total up to 223 MW Pakistan commissioned another large-scale commercial wind farm of 50 MW in 2013, with total installed capacity reaching 106 MW by the end of the year Taiwan added 43 MW of new capacity, bringing its total installed capacity up to 614 MW As for the rest of Asia, we expect new projects to come on line in Vietnam and the Philippines in 2014
V-Shape semi-sub floater prototype with 7 MW turbine © Mitsubishi Heavy Industries, Ltd

21GWEC – Global Wind 2013 Report T H E G L OB A L S TAT U S OF W I N D P O W E R I N 2 0 1 3
G L OB A L C U M U L AT I V E I N S TA L L E D W I N D C A PAC I T Y 1 9 9 6 - 2 0 1 3
0
50,000
100,000
150,000
200,000
250,000
300,000
350,000
201320122011201020092008200720062005200420032002200120001999199819971996
7,6006,100
MW
10,200 13,600 17,400 23,900 31,100 39,431 47,620 59,091 73,93893,889
120,624158,975
198,001
238,126
283,194318,105
G L OB A L A N N UA L I N S TA L L E D W I N D C A PAC I T Y 1 9 9 6 - 2 0 1 3
05,000
10,00015,00020,00025,00030,00035,00040,00045,00050,000
201320122011201020092008200720062005200420032002200120001999199819971996
1,5301,280
MW
2,520 3,440 3,7606,500 7,270 8,133 8,207
11,53114,703
20,285
26,872
38,467 39,059 40,63645,169
35,289
A N N UA L I N S TA L L E D C A PAC I T Y B Y R E G ION 2 0 0 5 - 2 0 1 3
0
5,000
10,000
15,000
20,000
25,000
2013
2012
2011
2010
2009
2008
2007
2006
2005
Paci�c RegionAfrica & Middle EastLatin AmericaAsiaNorth AmericaEurope

22 GWEC – Global Wind 2013 Report T H E G L OB A L S TAT U S OF W I N D P O W E R I N 2 0 1 3
NORTH AMERICA: RECORD INSTALLATIONS IN CANADA
1,599 MW of new wind capacity came online in Canada in 2013, making it the fifth largest market globally Compared to the 938 9 MW added in 2012, Canada’s wind power market saw significant growth in 2013, its best year ever Wind power now supplies approximately 3 percent of Canada’s electricity Ontario leads Canada with more than 2,470 MW, now supplying over 3% of the province’s electricity Ontario’s Independent Electricity System Operator (IESO) confirmed that the production of wind energy in Ontario had doubled over the past four years, from 2 3 to 5 2 TWh between 2009 and 201311 Quebec ranks a close second with 2,398 3 MW in installed capacity Quebec is likely to see a total of 3,300 MW of wind energy commissioned by 201512 The Canadian industry expects another record year in 2014 with the addition of almost 2,000 MW of new capacity, led by Ontario and Quebec Uncertain federal policies in the US continue to inflict a ‘boom-bust’ cycle on the country’s wind industry The US had its strongest year ever in 2012, but 2013 saw a precipitous drop in installations of over 92% year on year with just 1,084 MW in new installations, most of that in the fourth quarter The US is now home to over 61 GW of wind power capacity, up from 60 GW in 2012 By the end of 2013, wind provided 5 23% of total installed generation capacity in the US13 The production tax credit for wind and other renewable energy technologies expired at the end of 2013 However, an important provision was included in the American Taxpayer Relief Act of 2012 (enacted in January 2013) allowing eligible projects that were ‘under construction’ before January 1, 2014 to qualify for the PTC Although the US market came to a near complete stop in 2013, the nature of the extension has created a combined pipeline of over 12 GW of projects under construction14 In terms of total capacity, Texas again leads the Top-5 rankings with 12,355 MW, followed by California (5,830 MW), Indiana (5,178 MW), Illinois (3,568 MW) and Oregon (3,153 MW) In the US, 29 of the 50 states have firm RPSs, and seven states have renewable energy goals According to AWEA, by the end of 2025 RPS markets will drive the development of more than 63 wind equivalent gigawatts (GWe) of new capacity15 Mexico installed 380 4 MW of new capacity to reach a total of 1917 MW by the end of 2013 Last year was an important year for the wind industry in Mexico especially with the Constitutional Amendment enabling energy reform in December 2013 The market reforms for the electricity sector will have a significant impact on the future of wind power in the country Mexico has a target of 35% of electricity from renewable energy by 2024 2014 is set to mark a year of change for the wind industry in Mexico thanks to the new legislation
EUROPE: STRONGER THAN EXPECTED MARKET
During 2013, 12,031 MW of wind power was installed across Europe, with European Union (EU-28) countries accounting for 11,159 MW of the total The 2013 figures reflect orders made before the wave of political uncertainty that has swept across Europe since 2011, which is taking a toll on the wind power sector There are now just over 117 GW installed in the EU-28, and a total cumulative capacity of 121 4 GW for all of Europe Wind is now meeting 8% of EU electricity demand, up from 7% at the end of 2012, 6 3% at the end of 2011 and 4 8% at the end of 2009 The overall EU installation levels mask significant volatility across Europe In a number of previously healthy markets such as Spain, Italy and France installations decreased significantly compared to 2012, by 84%, 65% and 24% respectively This has contributed to 46% of all new installations in 2013 being in just two countries (Germany and the United Kingdom), a significant change compared to previous years when installations were less concentrated and spread across many more healthy European markets Wind energy represented 32% of all new EU power capacity installed last year, and investments of between EUR 13 bn and EUR 18 bn Renewable power installations accounted for 72% of new installations during 2013 - 25 GW of a total 35 GW of new power capacity, up from 70% the previous year 2013 installations were led by Germany (29%), the UK (17%), Poland (8%), Sweden (6%), Romania (6%), Denmark (6%), France (6%), Italy (4%), Austria (3%) and all others accounted for 12% Offshore accounted for almost 14% of total EU wind power installations last year, up from 10% in 2012 It was a record year for offshore installations, with 1,567 MW of new capacity grid connected Currently, destabilized legislative frameworks, economic crises and austerity measures being implemented across Europe are hitting the wind industry The year ahead will be tough, and the long-term prospects for the wind industry are closely linked to the outcome of the debate over the EU’s 2030 targets for climate and energy The German wind energy market continued its steady growth in 2013, adding 3,238 MW to bring Germany’s total installed capacity up to 34 25 GW The German wind industry expects a solid 2014 as well The Renewable Resources Act (EEG) will be amended some time in 2014 Chancellor Merkel’s government agreed to phase out nuclear power in favour of renewables; however, her new coalition has talked about reducing the support available to renewables In January 2014, Vice Chancellor and Economy Minister Sigmar Gabriel proposed a plan for the reform of the EEG The

23GWEC – Global Wind 2013 Report T H E G L OB A L S TAT U S OF W I N D P O W E R I N 2 0 1 3
proposal includes a cap on renewables of 45% of German electricity output by 2025, and of 60% by 2035 It also stipulates a 10% to 20% cut in feed-in tariffs for onshore wind and an annual cap to its expansion, as well as more hardship for PV16 The German and European renewables industry has been critical of the terms being discussed The United Kingdom was the second largest market for wind in Europe last year, adding 1,883 MW in 2013 of which 1,150 MW was onshore and 733 MW was offshore The UK is the largest offshore wind market in the world with total installations of almost 3,681 MW, accounting for over half of the European (and global) offshore market The UK Department for Energy and Climate Change (DECC) statistics released in February 2014 show that the amount of electricity produced by wind grew 38% from 2012 to 2013 In total the amount of electricity generated by wind grew from 5 5% in 2012 to 7 7% in 201317 Following on from the 2012 launch of the Offshore Wind Cost Reduction Taskforce report, the UK government and industry are working together through the Offshore Wind Programme Board The UK’s offshore industry has signed up to a target of reducing costs by 30% by 2020, based on the delivery of 18GW of offshore wind18
The other noteworthy European markets last year include Poland, Sweden, Italy, Turkey and Denmark Poland has had strong annual growth in the past couple of years despite a difficult political environment for renewables It now has a total installed capacity of 3,390 MW, up from 2,496 MW in 2012, the ninth largest wind market in Europe Sweden installed 724 MW in 2013 to reach a total installed capacity of 4,470 MW At the end of 2013, wind power accounted for 7% of Sweden’s total electricity consumption France’s wind capacity is also growing steadily and has now reached 8,254 MW The French government set a target of 25 GW by 2020, but it looks like it will be hard pressed to meet it Italy installed only 444 MW for a total of 8,552 MW, 65% below its installations for 2012 Denmark installed 657 MW for a total of 4,772 MW In 2013 wind power accounted for over 33% of Denmark’s total electricity consumption Turkey continued to be a growth market for wind power in 2013 It installed 646 MW for a total of 2,959 MW Looking ahead, the future of Turkey’s wind sector looks very promising Facing extensive impacts from domestic austerity measures Spain continued to be the second largest market in the EU in cumulative terms, but just 175 MW in new capacity was added in 2013, to reach 22 9 GW of cumulative capacity The future of the Spanish wind market at present is very uncertain
Denmark © GWEC

24 GWEC – Global Wind 2013 Report T H E G L OB A L S TAT U S OF W I N D P O W E R I N 2 0 1 3
LATIN AMERICA: GROWING STRONGER, BRAZIL LEADS
Wind power is reaching critical mass in a number of Latin American markets, and the region has begun developing a substantial wind power industry to complement its rich hydro and biomass (and potentially solar) resources In the medium to long-term, the demand for energy security and diversity of supply is expected to foster the growth of wind power in Latin America For the second year in a row the Latin American market installed over 1 GW of new capacity In 2012, six markets in the region installed 1,225 MW of new wind capacity for a total installed capacity of just over 3 5 GW In 2013, just four markets including Brazil, Chile, Argentina and Uruguay accounted for 1,163 MW of new wind power capacity for a total installed capacity of 4 8 GW Brazil once again led Latin America, adding 953 MW of new capacity; although the projects were fully commissioned not all of them could be given a grid connection before the end of the year Brazil is one of the most promising onshore markets for wind energy, for at least the next five years Brazil contracted for a total of 4 7 GW of new wind power in 2013 in three auctions, and has a strong pipeline of almost 7 GW to be completed by the end of 2015 Government projections foresee 17 5 GW of wind power installed in the country by the end of 2022 Chile added 130 MW to reach a total of 335 MW, and Argentina added 76 MW of new capacity to bring its total installed capacity up to 218 MW last year Both Chile and Argentina are potentially promising markets, which have substantial wind resources Uruguay added to its total tally with the commissioning of 4 MW of new capacity, bringing its total installed capacity up to 59 MW In the Caribbean, the Dominican Republic added 52 MW of new capacity last year, bringing the total installed capacity across the Caribbean to 221 MW by the end of 2013
PACIFIC: WIND IN AUSTRALIA GIVES CONFIDENCE
Total installed capacity across the region reached 3 8 GW last year The Australian market added 655 MW in 2013 (up from 358 MW in 2012), bringing its total installed capacity up to 3,239 MW According to recent research conducted by the Clean Energy Council, wind farms have reportedly generated more than AUD 4 bn (EUR 2 6 bn) in investment in Australia since their introduction19 Last year Australia saw a new coalition government led by Prime Minister Tony Abbott come to power During the elections last year his party had stated that it would look again at Australia’s Renewable Energy target, which mandates
that 20% of Australia’s power should come from renewables by 2020, with a 41 TWh annual generation goal from large-scale renewable sources A review panel has been constituted and will report to the government by the middle of this year, in time for its findings to be fed into an energy white paper This policy uncertainty may jeopardize up to AUD18 bn (EUR 11 6 bn) worth of investments and almost 30,000 jobs20 New Zealand and the rest of the Pacific did not add any new wind power capacity in 2013
AFRICA AND THE MIDDLE EAST
Africa and the Middle East are awakening to the opportunity of their enormous wind power potential Growth in 2013 was still small in absolute terms, with just 90 MW installed across the region, for a cumulative total of 1,255 MW However, the South African market will take off in 2014, and several countries have announced long-term plans for installing commercial scale wind power: Ethiopia, Morocco, Kenya, Jordan, Tanzania and Saudi Arabia, among others Africa’s wind resource is best around the coasts and in the eastern highlands, but until last year it was in North and East
Rio do Fogo, Brazil © Wind Power Works

25GWEC – Global Wind 2013 Report T H E G L OB A L S TAT U S OF W I N D P O W E R I N 2 0 1 3
Africa that wind power has been developed at scale This, too, is where current national policies are set to grow the sector further At the end of 2013, over 99% of the region’s total wind installations of 1,255 MW were to be found across nine countries - Egypt (550 MW), Morocco (291 MW), Ethiopia (171 MW), Tunisia (104 MW), Iran (91 MW), Cape Verde (24 MW), South Africa (10 MW), Israel (6 25 MW) and Kenya (5MW) Africa is likely to emerge as a new hot spot for wind energy development with new projects in Ethiopia, Tanzania and Mauritius coming online, along with a resurgence in Morocco 2014 will be a milestone for the South African market, where up to 1 GW of new capacity will come online
2013: SLOW YEAR DUE TO POLICY UNCERTAINTY
2013 was a market with downward pressure on prices through oversupply in the turbine market; fierce competition with incumbents; and a wave of downward revisions to support mechanisms in an austerity driven economic landscape The industry continues to be challenged to compete on a price
basis directly with heavily subsidized fossil fuel and nuclear energy plants, particularly in the OECD Having said that, all the fundamental drivers for wind power development still hold, and there is a need around the world for new power generation, which is clean, affordable, indigenous, reliable and quick to install
1 Exchange rates used for conversion to Euro values in this section are from 28-02-142 http://about bnef com/press-releases/clean-energy-investment-falls-for-second-year/ 3 See http://www ewea org/fileadmin/files/library/publications/statistics/EWEA_Annual_
Statistics_2013 pdf 4 http://www eia gov/countries/cab cfm?fips=CH accessed on 27-02-145 http://english peopledaily com cn/90778/8109836 html Accessed on 27-02-146 http://www chinadaily com cn/bizchina/greenchina/2014-02/26/content_17306185 htm Accessed
on 27-02-147 http://www eia gov/countries/cab cfm?fips=CH Accessed on 27-02-148 http://english cntv cn/20140226/102504 shtml Accessed on 27-02-149 http://mnre gov in/mission-and-vision-2/achievements/ Accessed on 27-02-14 The month of
January in 2013 saw total wind installations of 149 35 MW 10 http://cea nic in/reports/monthly/executive_rep/jan14 pdf Accessed on 27-02-1411 http://www canwea ca/media/release/release_e php?newsId=199 12 http://www canwea ca/news/release/release_e php?newsId=198 13 https://www ferc gov/legal/staff-reports/2013/dec-energy-infrastructure pdf 14 http://awea files cms-plus com/FileDownloads/pdfs/AWEA%204Q2013%20Wind%20Energy%20
Industry%20Market%20Report_Public%20Version pdf 15 http://awea files cms-plus com/FileDownloads/pdfs/AWEA%20State%20RPS%20Market%20
Assessment%202013_Executive%20Summary pdf 16 http://www rechargenews com/wind/article1350640 ece 17 https://www gov uk/government/uploads/system/uploads/attachment_data/file/285862/
press_notice_february_2014 pdf 18 http://www thecrownestate co uk/energy-infrastructure/offshore-wind-energy/working-with-us/
offshore-wind-programme-board/ 19 http://www abc net au/rural/news/content/201303/s3702991 htm 20 http://www theaustralian com au/national-affairs/opinion/critics-of-policy-in-denial/
story-e6frgd0x-1226833102706#
Rio do Fogo, Brazil © Wind Power Works

26 GWEC – Global Wind 2013 Report M A R K E T F OR EC A S T F OR 2 0 1 4 – 2 0 1 8
California, US © GWEC
MARKET FORECAST FOR 2014 – 2018

27GWEC – Global Wind 2013 Report M A R K E T F OR EC A S T F OR 2 0 1 4 – 2 0 1 8
On the whole, the market diversification trend which has emerged over the past several years intensified
during 2013, and is expected to continue to do so over the next several years New markets outside the OECD continue to appear, and some of them will begin to make a significant difference to overall market figures Inside the OECD, as wind power approaches double digit penetration levels in an increasing number of markets, and as demand growth either stalls or goes backwards, incumbents feel increasingly threatened The fight for market share and policy support in these markets is becoming more and more intense As a result, most of the growth in the coming years will be in markets outside the OECD The competition with incumbent fossil generation will continue until and unless there is a global price on carbon, a prospect which few look for any time soon However, regional and national carbon markets are starting to show some promise, although it will take some time to see if they begin to have a systemic effect on the market The shine is starting to come off of the notion of the ‘Golden Age of Gas’, much touted in recent years, as the environmental and climate impacts of the fracking revolution in the US begin to emerge, and as artificially low prices begin to rise That, combined with political unrest in the hydrocarbon-rich parts of the world, has given wind and other renewables a competitive boost in terms of price Today, in the absence of a concerted effort to combat climate change, it is wind’s cost competitiveness that is its greatest advantage in the market place In Brazil, South Africa, Turkey, Mexico and elsewhere, wind is competing directly and successfully with heavily subsidized incumbents – so successfully in fact that in an auction last August in Brazil, wind power was excluded to ‘give the other energy sources a chance’ Wind is coming in about 30% cheaper than the notorious giant World Bank financed coal-fired power plants in South Africa, and we have heard tell of PPAs being signed for wind power in the US as low as USD 20/MWh; which of course translates into about USD 43 with the PTC, but still extremely competitive National and regional policy are still the main drivers for wind energy deployment The boom and bust cycle in the US is driven by on-again, off-again policy; China’s support for wind as a major pillar of its energy strategy supports the continued growth in that market; and in the EU, the debate over 2030 climate and energy policy dominates the perspective for wind going forward, both on and offshore But it is safe to say that market growth over the next five years will be concentrated in Asia, Latin America, and Africa – that’s where the ‘easy’ growth from rapid increase in demand and strong economic growth will come from The 2013 market saw China back on top, installing about five times as much wind power as Germany in the number two spot The 2012 market leader, the US, dropped back to sixth
place, behind Canada (which had a record year), and just ahead of Brazil Despite a lackluster year, India moved into fourth place, right behind the UK, which had a good year both on and offshore When we did our projections for the 2013-2017 market one year ago, we underestimated the drop in the US market by about 3 GW; but because of the nature of the PTC re-authorisation and the strong pipeline of new projects, we look to make up that 3 GW in 2014 All in all, 2014 looks to be a record year, with annual market growth of about 34%, to bring the annual market to about 47 GW, with strong installations in North America and Asia, and the Brazilian market really beginning to come into its own Brazil, Mexico and South Africa will figure increasingly strongly in the annual market figures in the years to come After 2014, we expect the market to return to a more ‘normal’ annual market growth of 6-10% out to 2018 Cumulative growth will rise to nearly 15% in 2014, but average 12-14% from 2015 to 2018 Total installations should nearly double from today’s numbers by the end of the period, going from just over 300 GW today to just about 600 GW by the end of 2018 This puts us more or less on track although a bit behind the ‘moderate’ scenario in our last Global Wind Energy Outlook published in 2012 In order to put the industry back on the track of the strong growth numbers from the last decade, we will either need to see a global price on carbon or unexpectedly strong economic and demand growth, or both; and neither of them seem likely from the vantage point of March 2014, at least within the five year period out to 2018
REGIONAL DISTRIBUTION
While global markets will continue to be dominated by Asia, Europe and North America, new markets start to make a real difference over the next five years We can expect Brazil to move up to 3rd or 4th place in the annual market rankings over the next couple of years, and break into the top ten in terms of cumulative installations as early as the end of 2014 South Africa is finally taking off, and this will hopefully lead to a mini-boom in Southern and Eastern Africa over the next five years The real wild cards at this point in time are Saudi Arabia, with its ambitious goal of up to 50 GW of solar and wind by 2030; and Russia, where there are early signs that it might begin to exploit its enormous wind resources in the not too distant future
ASIA
Last year we were somewhat skeptical about the Chinese government’s ambitious target of 18 GW in new installations in 2013; in fact they installed just over 16 GW, rebounding from 2012’s slump to ‘only’ 12 9 GW In the meantime, the government has set a new target of 200 GW of wind by 2020,

28 GWEC – Global Wind 2013 Report M A R K E T F OR EC A S T F OR 2 0 1 4 – 2 0 1 8
which implies a market of at least 15.5 GW a year for the rest of the decade; and if the past is any indication, they are likely to exceed it. Furthermore, the Chinese offshore segment is expected to get underway in earnest in 2014.In India, much will depend on the outcome of the national elections to be held in May of 2014. The paralysis that currently plagues New Delhi, resulting in the stop/start policy situation which has hampered market growth over the past two years, will hopefully come to an end. A new ‘National Wind Mission’ is a welcome step, but what is really needed is clear, stable national policy and government investment in infrastructure, including strengthening transmission, to continue to fuel India’s economic growth.The post-Fukushima energy revolution continues to stall in Japan, at least as far as wind power is concerned, and we expect moderate markets of 2-300 MW per year over the coming period, until and unless the electricity market reform, which was almost passed last year, becomes a reality. While heavily emphasizing offshore, this market will probably not rack up large numbers until at least the end of this decade. South Korea will move steadily forward with its offshore programme while the onshore industry struggles; and we are likely to see a steady stream of new projects in Mongolia, the Philippines, Pakistan and Thailand. All in all, nearly 120 GW of new wind power will be installed in Asia over the five year period, and Asia will very likely pass Europe in terms of cumulative installed capacity when we do the totals at the end of 2014.
EUROPE
The European market shrunk by almost 6% in 2013, which was less than many expected; but somewhat worryingly, there was more concentration in the two leading markets (Germany and the UK) than has been the case for a number of years. Chopping and changing of policies by politicians continues to be the bane of many markets, and the economic collapse in Spain has hit Europe’s second largest market very hard. France, Italy and Bulgaria are just a few of the promising markets which have stalled in the last year.The offshore segment increased its annual market by 50% to install over 1,500 MW, but given the debate in a number of key markets it’s not clear if and how Europe is going to meet its target of somewhere in the vicinity of 40 GW in the water by 2020. However, it is expected that Germany will finally pick up some of the slack in offshore and its onshore market is expected to remain strong, along with Poland, Sweden, Denmark, Portugal and some others; but it’s going to be a rocky few years until and unless the debate over 2030 policy is decided. Regardless, the strength of the existing 20/20/20 legislation will support the installation of about 68 GW over the period from 2014 to 2018.
NORTH AMERICA
The US finished a disastrous 2013 with its strongest ever pipeline of projects – more than 12,000 MW under construction – and this bodes well for 2014 and 2015 installations. But what next? Will the PTC be extended again? Solid proposals for comprehensive energy tax reform are in the works, but do they have a chance of passing a fractious Congress? Anyone
M A R K E T F OR E C A S T F OR 2 0 1 4 – 2 0 1 8
[GW] [%]
0
100
200
300
400
500
600
700
12.3% 14.9% 14.0% 13.4% 12.8% 12.0%
-21.8%
34.0%
7.8% 9.2% 8.1% 6.3%
-30
-20
-10
0
10
20
30
40
2013 2014 2015 2016 2017 2018 Cumulative [GW] 318.1 365.4 416.4 472.1 532.3 596.3 Cumulative capacity growth rate [%] 12.3% 14.9% 14.0% 13.4% 12.8% 12.0%
Annual installed capacity ([GW] 35.3 47.3 51.0 55.7 60.2 64.0 Annual installed capacity growth rate [%] -21.8% 34.0% 7.8% 9.2% 8.1% 6.3%
Source: GWEC

29GWEC – Global Wind 2013 Report M A R K E T F OR EC A S T F OR 2 0 1 4 – 2 0 1 8
with answers to these questions should step to the head of the class Canada had a record year in 2013, and is likely to have another in 2014, and a strong 2015, but beyond that remains a question mark, and a question to be answered on a province-by-province basis Mexico’s energy market reform is actually a long term bright spot, as combined with a national renewable electricity target of 35% by 2024, it amounts to the government challenging the wind industry to install
~2,000 MW a year from now until 2024, which is the most likely means for achieving that target Key implementing legislation following the constitutional amendment last December is expected in April 2014, and much will be clearer by when this is settled Needless to say, North America is the most difficult part of this forecast, as it is the most volatile of all markets Nonetheless, we expect to see an additional 61 GW of new wind power installations coming on line in the region from 2014-18
A N N UA L M A R K E T F OR E C A S T B Y R E G ION 2 0 1 3 - 2 0 1 8
0
5
10
15
20
25
30 [GW]
2013 2014 2015 2016 2017 2018 Europe 12.03 11 13 14 15 15 North America 3.06 10 11 12.5 13.5 14 Asia 18.22 20.5 22.5 23.5 24.5 26 Latin America 1.24 3 2 2.2 3 4 Pacific 0.66 0.8 1 1 1.2 1 Middle East and Africa 0.09 2 1.5 2.5 3 4
Source: GWEC
C U M U L AT I V E M A R K E T F OR E C A S T B Y R E G ION 2 0 1 3 - 2 0 1 8
0
50
100
150
200
250 [GW]
2013 2014 2015 2016 2017 2018 Europe 121.5 132.5 145.5 159.5 174.5 189.5 North America 70.8 80.8 91.8 104.3 117.8 131.8 Asia 115.9 136.4 158.9 182.4 206.9 232.9 Latin America 4.8 7.8 9.8 12.0 15.0 19.0 Pacific 3.9 4.7 5.7 6.7 7.9 8.9 Middle East and Africa 1.3 3.3 4.8 7.3 10.3 14.3
Source: GWEC

30 GWEC – Global Wind 2013 Report M A R K E T F OR EC A S T F OR 2 0 1 4 – 2 0 1 8
LATIN AMERICA
In Brazil, the government has already contracted more than 10 GW for the period out to 2018, and is likely to add to that figure with upcoming auctions in June of this year as well as next There may be some slippage as the infrastructure struggles to catch up, although a new system to auction transmission lines in anticipation of the expected award of new projects should take some of the pressure off as the market develops Chile is finally beginning some substantial wind installations but it is not expected that the market will ever be very large, and the same is true in Uruguay, although the government of this small country has very ambitious plans in terms of its overall portfolio Central America and Caribbean markets will add some substantial capacity over the period, but they will not be large numbers There is, unfortunately, still a political cloud over Argentina due to the government’s policies, and we don’t expect much activity in that market until the government changes or there is a clear change of policy There are early rumblings of development in Venezuela and Colombia, the other large economies in the region, but it’s too early to say much Overall, we rather conservatively project that just over 14 GW will be installed over the period to 2018, although if all goes according to plan, then Brazil alone could achieve that number However, dependence on one large market where the economy has shown some recent signs of shakiness has led us to look forward with a bit of caution Despite the fact that not much happened in Africa and the Middle East in 2013, we are bullish on this region South Africa has achieved lift-off after an extremely long countdown, and we expect installations of 500-1000 MW in 2014, and a similar amount annually going forward, especially given the extremely competitive prices achieved in the latest bidding round It could in fact become the hub for a major industry in a part of world which has 6 of the world’s 10 fastest growing economies Ethiopia installed another 90 MW in 2013, in line with its government’s very ambitious plans for build-out of up to 7 GW by 2030 There is a new tender process in Morocco, and Jordan’s first large-scale commercial wind farm reached financial close last year Projects are underway in Kenya, Tanzania, Senegal and elsewhere This, combined with the ongoing effort to tie-together regional energy markets in eastern and southern Africa means that there is a reasonably likelihood that the region’s substantial wind resources will begin to be tapped in earnest over the next five years The Egyptian market will come back to life sooner or later, and Saudi Arabia’s ambitious RE programme is just getting underway; all this leads us to believe that about 13 GW will be installed in the region from 2014 to 2018
PACIFIC
In the Pacific region, Australia has been the main market for some years now, and wind power supplies more than 25% of South Australia’s electricity requirement The 2013 market was a healthy 623 MW However, the fickle winds of political change put this burgeoning industry under threat The new government led by Tony Abbott has placed the national
US © Puget Sound Energy

31GWEC – Global Wind 2013 Report M A R K E T F OR EC A S T F OR 2 0 1 4 – 2 0 1 8
Renewable Energy Target under review, and the other signals given off by the government are worrying to say the least New Zealand has a long pipeline of projects, but not much demand growth; and the islands are small markets which will see some new projects, but in absolute terms are quite small On the whole, we expect about 5 GW to be added over the period to 2018, but much of that depends on the outcome of the current political debate in Australia
In conclusion, the market looks set for a period of steady but unspectacular growth led by Asia, Latin America (powered by Brazil), and Africa (powered by South Africa) Europe will be steady - if unexciting, North America will be volatile – as usual; and the Pacific region’s fate will be dominated by Australian politics
US © Puget Sound Energy

32 GWEC – Global Wind 2013 Report AU S T R A L I A
AUSTRALIA
Australia’s wind industry made a significant leap forward in 2013 with the completion of the Southern
Hemisphere’s largest wind farm, the 420 MW Macarthur project in Victoria Driven largely by Australia’s vast resource potential and supportive government policies, wind power now supplies over 9,200 GWh of the nation’s electricity each year Australia’s Renewable Energy Target (RET) calls for at least 20 per cent of the nation’s power to come from renewable sources by the end of the decade It remains the greatest incentive for the development of wind energy in Australia and has taken domestic wind capacity from approximately 71 MW in 2001 to 3,239 MW at the end of 2013 At the end of 2013, Australia had 1651 operating turbines across 68 wind farms Wind power attracted almost AUD 1 5 billion (EUR 98bn/USD 1 35bn) of new financial investment during the 2013 calendar year
MAJOR MARKET DEVELOPMENTS IN 2013
Six new projects were commissioned in 2013, adding 655 MW of new wind capacity to the Australian electricity grid This is an 80% increase on the 358 MW of new wind projects commissioned the year before
New wind farms 2013Owner Location State Installed Capacity
(MW)Hydro Tasmania and Guohua Energy
Musselroe Tasmania 168
AGL and Malakoff Corp BHD
Macarthur Victoria 420
Denmark Community Wind Farm
Denmark Western Australia 2.4
Verve Energy Mumbida Western Australia 55Blair Fox Karakin Western Australia 5Blair Fox Sumich Western Australia 5
Projects in the pipelineAnother 14 projects totaling 1,820 MW are under construction and expected to be commissioned within the next three years The size of Australian wind farms continues to increase The 420-megawatt Macarthur Wind Farm, the largest in the South Hemisphere, was commissioned during 2013 The project is owned jointly by AGL Energy and Malakoff Corp BHD Australia’s wind farms are mostly distributed along its southern coastline and to the west, which are the regions with the most favourable wind resources Most states have multiple wind farms, with the exception of the sparsely populated Northern Territory and Queensland, which has only one small wind farm
South Australia remains the state with the highest wind power capacity, successfully capitalising on an excellent wind resource, a relatively small population and government policies supportive of investment It produced around 25% of its electricity from wind power in 2013 Australia currently has no plans to develop offshore wind farms due to the availability of onshore wind resources and a narrow continental shelf
Installed wind capacity in Australia by stateState Installed Capacity (MW)South Australia 1,205Victoria 939Western Australia 491Tasmania 310New South Wales 282Queensland 12Total: 3,239
Bloomberg New Energy Finance estimated that wind power generated AUD 1468 9 million (EUR 962 6mn/USD 1319 4mn) of new financial investment in 2013 Turbine manufacturers Senvion (formerly Repower/Suzlon Energy) and Vestas continue to dominate the Australian market, but new market entrants are beginning to provide an increasingly competitive environment Siemens has supplied turbines for South Australia’s Snowtown II wind project and GE provided turbines for the new 55 MW Mumbida project in Western Australia Chinese company Goldwind is currently constructing its second Australian wind farm
RECENT POLICY DEVELOPMENTS
The Australian Government’s Renewable Energy Target (RET) scheme aims to bridge the gap between the cost of generating renewable energy and the cost of generating electricity from traditional fossil fuel sources The RET is designed to deliver at least 20 per cent of Australia’s electricity supply from renewable sources by 2020, or more than 45,000 GWh of renewable energy The RET is crucial in supporting investment in the renewable energy industry An independent study released in 2012, Benefits of the Renewable Energy Target to Australia’s Energy Markets and Economy, found that the RET had delivered AUD 18 5 billion (EUR 12 1bn/USD 16 6bn) of investment in renewable energy since 20011

33GWEC – Global Wind 2013 Report AU S T R A L I A
Modelling commissioned by the CEC showed that if the RET is left as currently designed, between 2012 and 2030:
• An additional investment of AUD 18 7 billion (EUR 12 25bn/ USD 16 79bn) will be made in renewable energy infrastructure
• Wholesale energy prices are expected to be up to AUD 9/MWh (EUR 5 9/USD 8 1) lower
• 1,000 MW less gas-fired generation capacity is expected to be required
• Generation from gas-fired power stations is expected to be 13% less
• Generation from coal-fired power stations is expected to be 12% less
As wind power is one of the lowest-cost large scale technologies, it has been the dominant form of renewable generation to receive support under the RET The Australian Energy Technology Assessment (AETA) published by the Bureau of Resources and Energy Economics (BREE)2 has shown that wind energy is fast becoming one of the lowest cost forms of electricity generation technology available in Australia The RET was the subject of a comprehensive review in 2012 by the independent Climate Change Authority, which resisted lobbying to reduce the scheme’s target from those who view it as a competitor to their fossil fuel interests Modelling commissioned by the Climate Change Authority suggested that the saving to consumers from reducing the target would be minimal Another review is legislated for 2014 Wind farm planning approval and compliance is regulated by state governments in Australia, and there have not been many changes or developments during 2013 The New South Wales Government’s planning guidelines are still in draft form and it is unclear when they may be finalised
OUTLOOK FOR 2014 AND BEYOND
While the upcoming review of the Renewable Energy Target is creating a level of uncertainty, the wind industry is working hard to demonstrate the many benefits of renewable energy to the Australian economy
The Australian Energy Market Commission (AEMC) has reported that the amount of wind energy in South Australia is having a moderating effect on power prices in the state In their 2012 report Retail Electricity Price Movements3 the AEMC concluded that:Wholesale energy costs in South Australia have traditionally been high due to the relatively small market, high dependence on gas fired generation and limited interconnection capability. This looks likely to ease with an increasing volume of wind generation that now accounts for about 24% of generation capacity.
An independent report on AGL’s Oaklands Hill and Macarthur wind farm projects in Victoria found that the projects added over AUD 160 million (EUR 105mn/USD 144mn) to the Australian economy Independent modelling estimates that the total number of direct jobs resulting from pre-operation activities (i e development and construction) was approximately 400 jobs locally and across the country The renewable energy industry in Australia is also working hard on community engagement The industry funded and developed a set of best practice community engagement guidelines4 to raise the bar for engagement across the industry, and this was launched in 2013 These guidelines describe several methods for effectively interacting with members of the community as well as some models for sharing the financial benefits of the project through such mechanisms as community funds The CEC believes that lessons learned in the wind industry can be applied to other large-scale renewable energy projects Various approaches are being applied at individual projects in Australia that seek to include members of the community as beneficiaries of a project These approaches go further than distributing funds into local councils or community funds, striving to engage community members as partners in the project
With input from the Clean Energy Council (CEC), Australia
1 SKM, 2012, Benefits of the Renewable Energy Target to Australia’s Energy Markets and Economy, https://www cleanenergycouncil org au/policy-advocacy/reports html
2 Bureau of Resources and Energy Economics: http://www bree gov au/publications/aeta html3 Australian Energy Market Commission Market Reviews: http://www aemc gov au/Market-Reviews/
Completed/retail-electricity-price-movements-2012 html4 https://www cleanenergycouncil org au/technologies/wind-energy/community-engagement-guidelines html
TOTA L I N S TA L L E D C A PAC I T Y
0500
1,0001,5002,0002,5003,0003,500
year 2001 2002 2003 2004 2005 2006 2007 2008 2009 2010 2011 2012 2013MW 73 105 198 380 708 817 824 1,306 1,712 1,990 2,226 2,584 3,239
Source: GWEC

34 GWEC – Global Wind 2013 Report BE L G I U M
A DECADE OF GROWTH
The Belgian wind energy sector has grown steadily during the past decade The growth has been more prominent
in Wallonia, the southern part of Belgium, where an efficient permitting procedure (one-stop shop) and favorable legislation for wind energy, the so-called “cadre de reference éolien”, was put in place some years ago However, since 2012, Wallonian wind development has slowed due to legislative and financial uncertainty Consequently, onshore wind development is currently more stable in Flanders, even if the permitting procedure and targets for wind are less ambitious in the northern part of the country Belgium’s onshore wind resource is average for Europe Although wind potential is higher in Flanders, the area is more densely populated and therefore has less suitable open areas for wind development than Wallonia When it comes to offshore wind development, Belgium is a pioneer country with 572 MW of capacity installed, even though the country has less than 100 km of coastline This is mainly due to spatial planning with a zone specifically devoted to offshore development Currently, wind power supplies about 5% of Belgian power consumption A law on phasing out nuclear power in Belgium by 2025 is likely to have an impact on future wind development, as today nuclear power provides 50% of Belgium’s power
MAIN MARKET DEVELOPMENTS IN 2013
After several years of rapid growth, annual wind installations in Belgium have remained stable, ranging from 190 MW to 350 MW between 2010 and 2013 Thanks to impressive offshore wind installations, a total of 276 MW1 of new capacity was added in 2013
New wind installations have remained at a steady level during the past three years in Flanders, in contrast with Wallonia, whose market has shrunk significantly since 2010
Annual installed capacity at regional level and offshore in 2013Installed capacity (MW) New installation 2013 (MW)Flanders 57Wallonia 27Offshore 192Belgium 276
The low installation rate in Wallonia is as a result of a number of policy changes, and from three regulatory changes within a year There is an on-going debate over the support system, and a new tender system is expected to begin in 2014-2015 Meanwhile, 2,300 MW of projects are under development but there is no clarity about the support level for projects which are already in the pipeline Moreover, already approved projects are pending at State Council level due to regulatory uncertainty and the absence of specific rules, regarding noise, in particular The main operators of wind farms in Flanders are Aspiravi, Electrabel and Electrawinds, with more than 50% of the Flemish market; and in Wallonia, Eneco Wind Belgium, Windvision and EDF account for about 50% of the installations The key onshore turbine suppliers are Enercon (53%), Vestas (18%) and Senvion (15%)
SUPPORT FRAMEWORK FOR WIND ENERGY
In Belgium, electricity from renewable energy sources is mainly promoted through a quota system based on trading green certificates The promotion of renewable energy is governed by the different regions, although offshore wind power is governed by the central government Accordingly, each region has its own support scheme based on a national framework Electricity suppliers are obliged to obtain green
Belgium © C-Power
BELGIUM

35GWEC – Global Wind 2013 Report BE L G I U M
certificates to prove that a certain quota of the electricity supplied to final consumers is generated by renewable energy This quota varies according to region In Wallonia, the support level is currently at EUR 65/USD 89 8 per MWh, and in Flanders at EUR 74/USD 102 per MWh The price for offshore wind in Belgium is set at EUR 107/USD 148 MWh for the first 216 MW installed, and at EUR 90/124 USD MWh for further installed megawatts
NEW POLICY DEVELOPMENTS IN 2013
Belgium has a target of reaching 13% of renewable energy consumption by 2020 as required by the EU’s renewable energy directive Wallonia is the only Belgian region that has set its own target for 2020: 20% RES consumption, including 8 TWh/year of renewable power The onshore wind energy target in Wallonia is 3,8 TWh/year for 2020 The federal government has also set specific targets for offshore wind: 2,000 MW by 2020 and 3,800 MW by 2030 Additionally, Wallonia has a specific regulation “nouveau cadre de reference éolien” for wind energy, which was adopted in 2013 Although this regulation is not binding, it defines the most important installation criteria (e g turbine distance to housing, infrastructure etc )
Key barriers for wind energy developmentThe main barriers to wind energy development in Belgium are:• Uncertainty over the support mechanism: The legislation
regarding the support system for renewable energy is under revision and there is no certainty on the support for future projects
• Lack of regulatory certainty: Some installation criteria are not sufficiently supported by legislation leading to several legal disputes and frequent project cancellations
• Lack of clarity regarding new permitting procedure: A new decree is under preparation in Wallonia reviewing the functioning of the current permitting procedure The decree will introduce the auctioning system in Belgium
• Lack of clarity and objectivity regarding environmental requirements: The environmental constraints imposed on wind energy are unclear, excessive, based on a worst case
scenario and are open to interpretation This has an impact on investment security since it is difficult to anticipate the environmental measures that will be required to be implemented on the basis of the EIA results
• Aeronautical constraints: A considerable proportion of appropriate wind development sites are under aeronautical restrictions due to military training areas, radar vicinity or airport zones Additionally, the Air Traffic Control (ATC) has developed other exclusion zones in the vicinity of civil radars and airports Due to a densely populated country the aeronautical constraints dramatically undermine the development of Belgian onshore wind and could complicate the determination of new offshore zones for wind development
• Insufficient measures to enhance social acceptance: Although opinion polls show strong support for wind energy from local communities, anti-wind groups are getting more and more vocal and organised, disseminating negative information and stimulating a NIMBY (Not In My Backyard) attitude Further measures to enhance social acceptance are needed
OUTLOOK FOR 2014 AND BEYOND
Belgium is likely to add about 300 MW of new wind energy in 2014, of which 87 MW will be offshore The mid-term perspective for offshore wind is not promising taken that strong grid reinforcement is urgently needed to exceed 800 MW of installed offshore capacity, and plans to do so are currently blocked In Wallonia, the sector is expecting to get new legislation in place in 2014 in order to provide more legal certainty (mainly regarding noise rules) and the new decree on specific rules for wind energy spatial planning This decree will review the permitting system and introduce a tendering system
With input from Belgian Renewable Energy Federation, EDORA
1 Belgian official annual figure after review for 2013 was 329 MW, of which 245 MW was offshore GWEC uses official EWEA figures in order to maintain consistency EWEA publishes European statistics at thes beginning of each year
TOTA L I N S TA L L E D C A PAC I T Y
0
500
1,000
1,500
2,000
year 2001 2002 2003 2004 2005 2006 2007 2008 2009 2010 2011 2012 2013MW 31 35 63 96 158 186 274 406 538 886 1,078 1,375 1,651
Source: GWEC

36 GWEC – Global Wind 2013 Report B R A Z I L
BRAZIL
MAIN MARKET DEVELOPMENTS IN 2013
A t the end of 2013, Brazil had 3 5 GW of installed wind capacity, enough to power eight million households and
accounting for 3% of national electricity consumption In 2013 alone, 34 new wind farms became online, adding 953 MW of new capacity to the Brazilian electricity grid The wind industry and its supply chain are becoming firmly established in Brazil, and nine international manufacturers have opened facilities in the country The Brazilian government’s Decennial Energy Plan (PDE 2022) sets a goal of 17 GW of installed wind capacity to be reached by 2022, accounting for 9 5% of national electricity consumption Nearly half of the new capacity installed in 2013 came from three new wind farm complexes: the 160 MW Asa Branca complex consisting of five wind farms, the 150 MW Calango complex also spread over five wind farms and the 120 MW Renascença complex made up of four wind farms The impressive results of the competitive wind auctions held in 2013 show the growing maturity of the entire supply chain in the Brazilian wind market:
Wind Auction Results in 2013Auction Contracted Capacity (MW)LER 1,505A-3 868A-5 2,338Total 4,711
It is estimated that the 2013 wind auctions will create more than 70,000 jobs and bring an investment of USD 8 8 billion (EUR 6 3bn) to the wind power industry The A-5 auction held in December 2013 exceeded all expectations with 2 3 GW of wind power contracted Five new developers won for the first time in the 2013 auctions: CEEE–GT,
PEC Energia, Rio Energy, Serveng and Sowitec The projects are still funded by the financing programme of machinery and equipment (FINAME) rules
RECENT POLICY DEVELOPMENTS
Three new regulations with an impact on wind development came into force in 2013 in Brazil: Resolution No 391/2009, Decree No 274/2013 and Decree No 310/2013 • Resolution No. 391/2009: Establishes requirements for
the permits needed for wind development in Brazil This resolution also allows the company to request information about interested distributors and about the National System Operator – ONS
Brazil © ABEEólica
Brazilian Energy Mix - installed Capacity (in GW)Thermal Nuclear
2Thermal Other
1.4Natural Gas12.4
Coal3
PetroleumDerived7.7
Biomass11.4
Hydroelectric85.9
Wind3.5
Source: ABEEólica
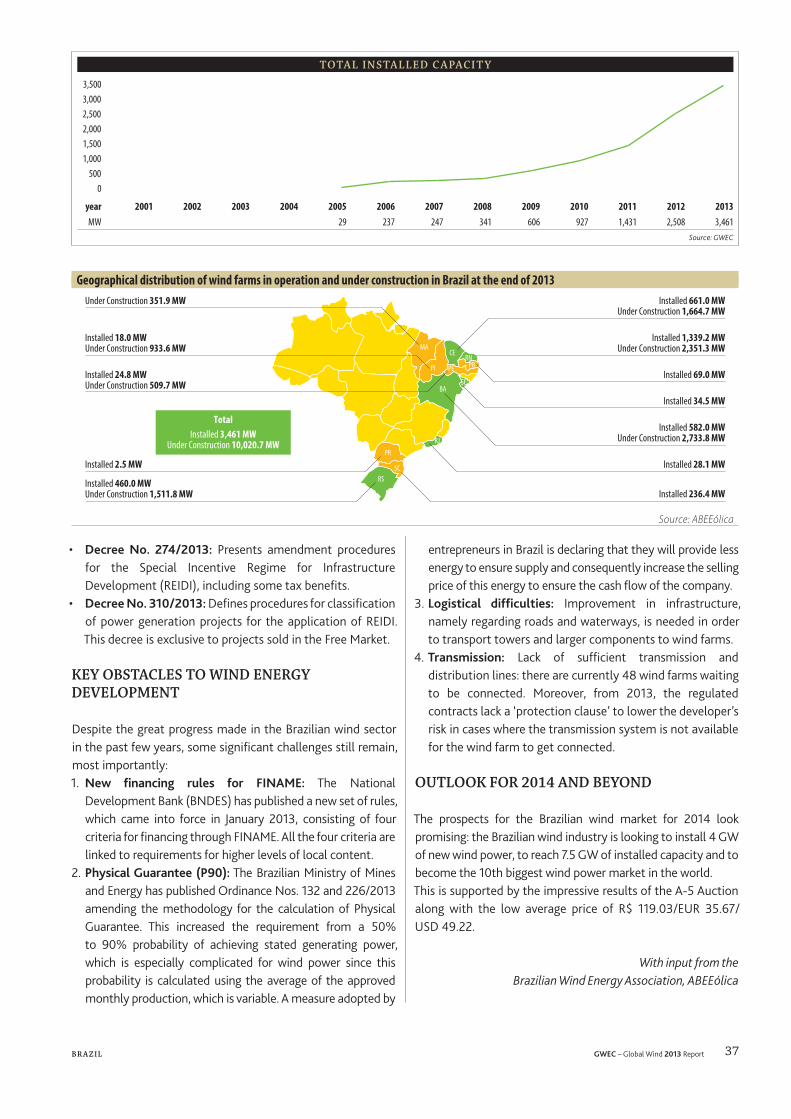
37GWEC – Global Wind 2013 Report B R A Z I L
• Decree No. 274/2013: Presents amendment procedures for the Special Incentive Regime for Infrastructure Development (REIDI), including some tax benefits
• Decree No. 310/2013: Defines procedures for classification of power generation projects for the application of REIDI This decree is exclusive to projects sold in the Free Market
KEY OBSTACLES TO WIND ENERGY DEVELOPMENT
Despite the great progress made in the Brazilian wind sector in the past few years, some significant challenges still remain, most importantly:1 New financing rules for FINAME: The National
Development Bank (BNDES) has published a new set of rules, which came into force in January 2013, consisting of four criteria for financing through FINAME All the four criteria are linked to requirements for higher levels of local content
2 Physical Guarantee (P90): The Brazilian Ministry of Mines and Energy has published Ordinance Nos 132 and 226/2013 amending the methodology for the calculation of Physical Guarantee This increased the requirement from a 50% to 90% probability of achieving stated generating power, which is especially complicated for wind power since this probability is calculated using the average of the approved monthly production, which is variable A measure adopted by
entrepreneurs in Brazil is declaring that they will provide less energy to ensure supply and consequently increase the selling price of this energy to ensure the cash flow of the company
3 Logistical difficulties: Improvement in infrastructure, namely regarding roads and waterways, is needed in order to transport towers and larger components to wind farms
4 Transmission: Lack of sufficient transmission and distribution lines: there are currently 48 wind farms waiting to be connected Moreover, from 2013, the regulated contracts lack a ‘protection clause’ to lower the developer’s risk in cases where the transmission system is not available for the wind farm to get connected
OUTLOOK FOR 2014 AND BEYOND
The prospects for the Brazilian wind market for 2014 look promising: the Brazilian wind industry is looking to install 4 GW of new wind power, to reach 7 5 GW of installed capacity and to become the 10th biggest wind power market in the world This is supported by the impressive results of the A-5 Auction along with the low average price of R$ 119 03/EUR 35 67/USD 49 22
With input from the Brazilian Wind Energy Association, ABEEólica
TOTA L I N S TA L L E D C A PAC I T Y
0500
1,0001,5002,0002,5003,0003,500
year 2001 2002 2003 2004 2005 2006 2007 2008 2009 2010 2011 2012 2013MW 29 237 247 341 606 927 1,431 2,508 3,461
Source: GWEC
Geographical distribution of wind farms in operation and under construction in Brazil at the end of 2013Under Construction 351.9 MW
MA
PI
CE
Installed 460.0 MWUnder Construction 1,511.8 MW Installed 236.4 MW
Installed 2.5 MW Installed 28.1 MW
Installed 34.5 MW
Installed 69.0 MW
Installed 582.0 MWUnder Construction 2,733.8 MW
Installed 24.8 MWUnder Construction 509.7 MW
Installed 1,339.2 MWUnder Construction 2,351.3 MW
Installed 661.0 MWUnder Construction 1,664.7 MW
Installed 18.0 MWUnder Construction 933.6 MW
RNPBPE
BA
RJ
PR
SCRS
SE
TotalInstalled 3,461 MW
Under Construction 10,020.7 MW
Source: ABEEólica

38 GWEC – Global Wind 2013 Report C A N A DA
CANADA
RECORD YEAR FOR WIND IN CANADA
The year 2013 was a record year for wind energy development in Canada, with new installed capacity
from 23 wind energy projects totalling nearly 1,600 MW Canada finished the year with a total of 7,803 MW of total installed capacity and wind energy is now positioned to supply approximately 3% of Canada’s electricity demand; enough power to meet the annual needs of over 2 million Canadian homes In 2013, wind energy projects were built and commissioned in the Canadian provinces of Prince Edward Island, Nova Scotia, Quebec, Ontario, British Columbia and Saskatchewan At the end of the year, Ontario and Quebec led the country in total installed capacity with close to 2,500 MW each
The year 2013 also saw a wide variety of development models commissioned in Canada, demonstrating the widening diversity and maturity of a growing renewable energy industry This includes a First Nation owned and operated wind project with battery storage; a 500-kW workers union wind project; a not-for-profit 10 MW wind and storage R&D project; a municipal-private partnership wind project; and larger commercial projects that are owned and operated by private developers The largest wind project in Canada today is the Lac Alfred wind farm built in 2013 with a total installed capacity of 300 MW Wind projects in 2013 primarily used Enercon, Senvion (formerly REpower) and Vestas turbines, each supplying over 25% of new wind turbines installed in Canada The progress of Canada’s wind energy sector in 2013 provides a strong foundation on which to build As the provinces begin to lay out plans for what their future electricity supply mix will look like, they have signalled a common desire to seek affordable power that provides strong economic development potential and minimal environmental impacts
– characteristics highly favourable to future wind energy development
NEW POLICY DEVELOPMENTS IN 2013
In May 2013, the Government of Quebec announced plans to procure another 800 MW of wind energy In December, Hydro-Québec issued a Request For Proposals (RFP) for 450 MW of that total divided in two blocks that will be commissioned between 2016 and 2017 In September, CanWEA presented its vision to the Quebec Commission on
energy issues, recommending further development of wind energy at 500 MW per year between 2018 and 2025 In Ontario, CanWEA provided a submission to the Ontario Long-Term Energy Plan (LTEP) Review In December 2013, the Government of Ontario released an updated LTEP that reaffirmed wind energy’s role in electricity supply and called for the procurement of up to 600 MW of new wind energy over the next two years CanWEA released WindVision 2025: A Strategy for Alberta1 in May 2013 Characterized as bold, CanWEA’s WindVision2 provides compelling options for the Government of Alberta for overcoming the barriers to wind energy in a province with significant potential In December, the Premier of Alberta announced the creation of a new Cabinet portfolio responsible for electricity and renewable energy and the Government of Alberta plans to launch consultations on an Alternative and Renewable Energy strategy for the province in 2014 The Government of British Columbia adopted the Integrated Resource Plan (IRP) of BC Hydro, which includes a Clean Energy Strategy While the document includes no short-term commitments to new wind energy procurement, CanWEA and BC Hydro have committed to working together to update information on the cost of wind energy resources, improve the Standing Offer Program for new small-scale wind projects, and develop a more effective procurement process for large wind energy projects prior to the 2015 IRP review, which has the potential to open the door to new wind energy procurement
Installed capacity by province as of December 31, 2013
Source: CanWEA

39GWEC – Global Wind 2013 Report C A N A DA
KEY BARRIERS TO WIND ENERGY DEVELOPMENT
While 2013 was a record year for Canada and numerous projects have been contracted and are being built in the country over the next few years, few new commitments have been made to wind energy development beyond 2016 The good news is that governments in all of Canada’s key markets are now turning their attention to electricity supply needs for the coming decade and all are looking for new electricity supply that is affordable, sustainable, reliable, socially acceptable and economically beneficial Wind energy is well-positioned to address these public priorities The wind energy industry is now working to make its case to secure new procurement opportunities and to facilitate a stable and sustainable wind energy industry over the long-term in Canada – a challenging task because every jurisdiction is unique Decisions taken by governments in the next 18 months, informed by these processes, will shape the wind energy market in this country for years to come A strong majority of Canadians support more wind energy development, so it remains important to continue to work with allies to have wind energy supporters’ voices heard in discussions on Canada’s electricity future While the future for wind energy in Canada is bright, the industry needs to continue to make
the case for further wind energy development Continued political support and policy stability is critical to ensure wind energy continues to deliver clean, safe and affordable power to Canadian families and businesses
OUTLOOK FOR 2 014 AND BEYOND
2014 is expected to be another record year in Canada, with up to 2,000 MW of new installed capacity projected to come online The largest portion of new developments will take place in Quebec, Ontario and Alberta with new contracts that are also expected to be awarded for projects in Saskatchewan, Quebec and Nova Scotia The future is positive for wind energy in Canada with projects now contracted and on track to meet expectations of more than 1,000 MW of new wind energy capacity commissioned annually for the next few years Wind energy will continue to play an important and growing role in Canada’s energy mix, creating new investment and jobs in Canadian communities while also contributing to a cleaner environment for future generations
With input from the Canadian Wind Energy Association, CanWEA
1 www canwea ca/pdf/canwea-alberta-windvision-FINAL pdf2 www canwea ca/images/uploads/File/Windvision_summary_e pdf
Canada © GWEC
Caption © GWEC
TOTA L I N S TA L L E D C A PAC I T Y
01,0002,0003,0004,0005,0006,0007,0008,000
year 2001 2002 2003 2004 2005 2006 2007 2008 2009 2010 2011 2012 2013MW 198 236 322 444 684 1,460 1,846 2,369 3,319 4,008 5,265 6,204 7,803
Source: GWEC

40 GWEC – Global Wind 2013 Report C E N T R A L A N D S O U T H A M E R IC A & T H E C A R I B BE A N
W ind power grew by 36% in Central and South America and the Caribbean in 2013, with more than 1 2 GW
of new capacity added, bringing total installed capacity up to nearly 5 GW Brazil is the driving force and the leading market in the region, accounting for 72% of the total capacity, and for over 74% of the new installations in 2013 The Chilean market, encouraged by the government’s new policy framework for renewable energy, added two wind farms in 2013 totalling 130 MW, representing a 63% increase in total installed capacity and by far the highest growth rate in the region In Central America, Nicaragua shares the top position with Costa Rica, thanks to the 84 MW of new capacity added in 2012; the country also has a strong pipeline of projects The sub-region can now benefit from the recently established Central American electricity market and its regional transmission system infrastructure, giving a boost to wind power investments which have until now been on hold due to limited grid access The Andean region is slowly starting to see new investment coming into the wind sector The first 3 megawatts of wind capacity came online in Bolivia, while Ecuador added 16 5 MW and Venezuela added 30 3 MW last year
Argentina added 76 MW of new capacity in 2013, including 51 MW at the Loma Blanca IV wind farm located in the province of Chubut, consisting of seventeen 3 MW turbines supplied by the Spanish company Isolux, bringing total wind power capacity up to 218 MW Lack of access to finance and incentives for renewable energy development are the major barriers to wind development in Argentina The main reason for this is policy uncertainty discouraging financial institutions from getting on board Meanwhile, demand for energy is rapidly growing and there are currently up to 2,000 MW of wind projects in the pipeline waiting for permitting Efforts have been made by the industry to open the scope for electricity off- take agreements in order to allow operators and large consumers to conclude PPAs Brazil led the Latin American wind market once again, adding 953 MW of new capacity to the country’s electricity grid This brought total wind power capacity up to 3 5 GW spread over 142 wind farms and accounting for 3% of national electricity consumption A healthy local wind industry and its supply chain are becoming firmly established in Brazil In 2013, a record total of 4 7 GW of wind power was contracted as a result of the three auctions held in August (LER), November (A-3) and December
Guadeloupe © GWEC
CENTRAL AND SOUTH AMERICA & THE CARIBBEAN

41GWEC – Global Wind 2013 Report C E N T R A L A N D S O U T H A M E R IC A & T H E C A R I B BE A N
(A-5) This creates a robust pipeline of projects for the next five years, thanks to the strong competitiveness of wind power compared to other technologies The average price in the 2013 auctions was R$ 117 99/MWh At present, Brazil has an existing pipeline of contracted projects of more than 10 GW Although there is a concern over about 600 MW of projects waiting to become grid connected, the government has announced a new rule to ensure grid connection rights regarding future auctions and the new transmission lines are currently under construction Installed wind power capacity in operation in the country is mostly located in the states of Ceará, Rio Grande do Norte and Rio Grande do Sul However, the state of Bahia is soon to become a top wind power state in Brazil due to the new capacity allocated in this year’s auctions In Chile, two new wind farms came online in 2013 with a combined capacity of 130 MW: The Talinay wind farm (97 MW) located in the region of Coquimbo; and the PE Negrete Cuel (phase I) wind farm (33 MW) in the region of Biobío The total of 335 MW of wind power installed in Chile supplies just under 2% of the country’s electricity consumption Meanwhile, Chile has a strong pipeline of 6,445 MW of wind projects under various stages of development, of which 450 MW are expected to come online in 2014 and a further 1,400 MW during 2015-2018 A new law updating the renewable energy target was approved in 2013, increasing the country’s renewable electricity target to 20% by 2024 The industry is now waiting for the secondary regulations to be passed which will hopefully create the market conditions to ensure that the target can be met Nicaragua added 84 MW of new capacity in 2012, bringing total capacity up to 146 MW, representing about 11% of the total installed power capacity in the country Nicaragua plans to reduce its dependence on non-renewable sources and has an ambitious target to supply 74% of the country’s electricity consumption from renewable sources by 2017 According to the Nicaraguan Transmission System Operator Centro Nacional de Despacho de Carga, at times wind power already provides 50% of the country’s electricity demand
Uruguay has a total of 59 3 MW of wind power capacity, of which 4 MW came online in 2013 Despite the favourable policy environment for wind power in Uruguay, logistical bottlenecks hamper the deployment of the 150 MW resulting from the country’s first auction A further 200 MW of wind power have recently been awarded for industrial projects The price for wind power is very competitive at USD 60/ EUR 43 5/MWh
THE CARIBBEAN
Dominican Republic - 52 MW of new wind power was installed in 2013 at the Los Cocos wind farm, located in the municipality of Juancho The Dominican Republic now has 85 MW of wind power, accounting for 2 5% of the total power capacity in the country, which makes it the leading wind market among the Caribbean islands, having twice the capacity of Jamaica which ranks second, followed by Aruba The Dominican Republic is strongly committed to reducing its exceptionally high electricity prices caused by its dependence on imported diesel However, the sector suffers from lack of sufficient grid infrastructure and uncertainty about land rights, which form the most significant barriers to more wind development on the island
OUTLOOK FOR 2014 AND BEYOND
Wind power shows stable growth in the region and this is expected to continue in 2014 The Brazilian market will continue to be the driving force with by far the largest share of new installed capacity and a large number of projects coming online in 2014 Increased capacity is expected in the Southern Cone due to the existing pipeline of projects in Chile, where nearly 100 MW has been installed in the first quarter of 2014 alone Meanwhile, Central America is likely to recover and add up to 200 MW of new capacity in Panama and some additional projects may come online in Costa Rica
Caption © GWEC
TOTA L I N S TA L L E D C A PAC I T Y
0
1,000
2,000
3,000
4,000
5,000
year 2007 2008 2009 2010 2011 2012 2013MW 446 574 1,133 1,540 2,281 3,530 4,764
Source: GWEC

42 GWEC – Global Wind 2013 Report PR C H I N A
PR CHINA
MAIN MARKET DEVELOPMENTS IN 2013
S ince 2011, the Chinese wind market has been in a consolidation phase, following nearly a decade of
explosive growth However, the market in set to recover substantially, and in 2013 new wind installations were up by 24 1% from 2012, with 16 1 GW of new capacity connected to the grid, bringing total capacity up to 91 4GW This makes China once again the global leader, both in terms of annual market and cumulative wind capacity
In the meantime, turbine prices have also recovered, reaching an average price of RMB 4000-4100/kWh (EUR ~470/USD 650), up by about 10% from the previous year Margins are still very thin for most manufacturers, who have cut their expenses to a minimum in the past two years Electricity generated by wind power accounted for 2 6% of the national total in 2013, an increase of 0 5% from 2012 The average annual full load hours reached 2080 hours, which represents an increase of 151 hours from 2012 This is partly due to improved system management and the fact that 2013 was a good year for wind The top ten turbine manufacturers dominated the Chinese wind market in 2013 with 78% of the market share Goldwind consolidated its leading position with a market share of 23 31%, accounting for nearly a quarter of the national market, followed by United Power with 9 25% (1,487 MW), Ming Yang 7 9% (1,286 MW), Envision 7 01% (1,128 MW) and XEMC 6 54% (1,052MW)
Top ten manufactures in Chinese wind market in 2013Manufacturer New Installations (MW) Market Share Cumulative MWGold Wind 3,750 23.31% 18,951Guodian United Power
1,488 9.25% 8,799
MingYang 1,286 7.99% 5,543Envision 1,128 7.01% 2,421XEMC 1,052 6.54% 3,747Shang Hai Electric 1,014 6.30% 3,617.45Sinovel 896 5.57% 15,076CSIC 787 4.89% 2,061Dong Fang 574 3.56% 7,938Windey 539 3.35% 2,001
2013 also marked a substantial increase in exports: 341 turbines totaling 692 MW were exported to 17 countries, including the US, Italy and Australia
WIND DEVELOPMENT AT REGIONAL LEVEL
In 2013, Xin Jiang ranked as the No 1 province in China in terms of wind development with a record capacity addition of 3,146 MW, which is comparable to Germany’s annual installation rate Xinjiang has also a solid project pipeline for the next 2 to3 years, as it is expected that a new HVDC line will be commissioned, facilitating the transmission of the output of 8 GW of wind power to the densely populated Henan Province
The other top wind power provinces were Inner Mongolia, adding 1 6 GW to the Chinese grid, followed by Shanxi with record installations of 1 3 GW in 2013 The lower wind speed area Yunnan, a province with very high biodiversity, dropped out of the list in 2013 due to environmental concerns expressed by the local government, halting all on-going projects Installations slowed down in the northeast provinces of Hei Longjiang, Jilin and Liaoning, due to decreased electricity demand and lack of sufficient grid infrastructure
Top 10 provinces with new capacity installed in 2013Province 2013 (MW) 2013 Cumulative (MW)
1 Xin Jiang 3,146 6,4522 Inner Mongolia 1,647 20,2703 Shan Xi 1,309 4,2164 Shan Dong 1,290 6,9815 Ning Xia 885 4,4506 Gui Zhou 683 1,1907 Liao Ning 640 6,7588 Hei Longjiang 623 4,8879 Gan Su 617 7,096
10 Shaan Xi 583 1,293
SUPPORT FRAMEWORK FOR WIND ENERGY
Feed-in tariff premiums, which consist of the difference between the wholesale price of electricity and the feed-in tariff, have in the past been paid by the central government to the grid companies at the end of each fiscal year, after which they were then paid out to operators The government raises the funds through a Renewable Surcharge which is paid by all electricity customers In 2011, premium payments began to be delayed due to the huge numbers of wind projects, and the backlog built up to a high level during 2012 The premium accounts for more than half of the feed-in tariff, thus having a considerable impact on the cash flow of project owners and consequently on the entire supply chain

43GWEC – Global Wind 2013 Report PR C H I N A
At the end of 2012 a new mechanism for payments was put in place by the National Energy Administration (NEA), providing for quarterly instead of annual payments, which is gradually solving the problem However, the rapid growth of the wind (and now the solar PV) industry has meant that the availability of support for renewable electricity is still very tight At the end 2013 the government had to raise the Renewable Surcharge, which is added on top of each kWh of renewable electricity produced, up to RMB 1 5 cent/kWh (EUR 0 17/USD 0 25 cent), almost doubling the previous level of the tariff (RMB 0 8 cent/kWh (EUR 0 09/USD 0 13 cent)
The rapidly expanding renewable energy industry has put great pressure on the government to finance its development This has initiated an on-going debate as to whether wind energy will reach grid parity by 2020, therefore making the case for lowering the FIT in the next few years The current feed-in tariff, which came into force in 2009, has four categories based on the quality of wind resources in the different provinces The FIT will be reviewed for the first time in 2014
China © GWEC
TOTA L I N S TA L L E D C A PAC I T Y
0
20,000
40,000
60,000
80,000
100,000
year 2001 2002 2003 2004 2005 2006 2007 2008 2009 2010 2011 2012 2013MW 404 470 568 765 1,272 2,599 5,910 12,020 25,805 44,733 62,364 75,324 91,412
Source: GWEC

44 GWEC – Global Wind 2013 Report PR C H I N A
Air pollution: New opportunity for the renewables industryChina is suffering from an increasingly severe air pollution problem and the situation has further deteriorated, especially in northern China Prime Minister Li Keqiang announced a new
“Combating Air Pollution Action Plan”, which aims to curb pollution in particular by targeting the reduction of the use of coal This was followed by another action plan published by the government in 2014 to combat air pollution, which includes a prohibition of new coal-fired power plants in the region of Beijing, Tianjin, and Hebei and Shandong provinces The plan also aims to reduce coal consumption below 65% of the national total energy consumption, compared to 65 7% in 2013 The severe air pollution problem offers the renewables industry an opportunity to further expand and to consolidate its role as a clean energy provider
Restructuring of the NEA and the project approval processIn 2013 the new Chinese government carried out a reform of the energy administration by giving project approval authority to the provincial governments In the new system the NEA is
responsible for overall strategic planning of the energy policy, leaving project permitting to local officials working closer to the ground Moreover, in 2013, the NEA was re-structured and merged with the State Electricity Regulatory Commission (SERC) The latter was established in 2002 after the initial round of electricity reform, which separated the transmission companies from the utilities However, the electricity reform did not advance further at the time, and did not separate distribution and transmission companies, and hence the SERC’s role was to further facilitate the reform and to open the electricity market The fact that the grid companies are the biggest monopolies in China, however, made advancing the reform difficult Now the merger of the NEA with the SERC shows signs that the new government is aiming to create an electricity market, including opening the sector for private investment This discussion, however, is still on-going
OBSTACLES TO WIND DEVELOPMENT
The grid remains the most serious challenge facing the wind industry in China The real bottleneck is the transmission system and the curtailment of wind production at peak
China © GWEC

45GWEC – Global Wind 2013 Report PR C H I N A
periods due to the grid companies’ inability to manage the transmission system effectively However, the rate of curtailment has slightly decreased; reaching 11% nationwide, down by about 6% from previous year, yet in some areas the rate goes up to 25-35% at certain periods of time A series of measures to tackle the curtailment problem were put in place in 2013 and the government has put an increasing focus on “increasing the flexibility of the grid” Additionally, a new HVDC line of 800 kV was commissioned to connect Hami, XinJiang and Zhengzhou provinces with the load center in densely populated Henan province This immediately caused a series of orders for about 8 GW for wind projects in the Hami area, giving a significant boost to the industry at the end of 2013 Some further innovative solutions were also suggested in order to solve the curtailment issue, including a wind heating system along with a number of pilot projects which started operation at the end of 2013 in the eastern part of Inner Mongolia The long awaited Renewable Energy Portfolio Standard (RPS) is expected to be introduced in 2014, which should be by far the strongest policy measure to date to force the grid companies to respect the Renewable Energy Law, which gives wind and other renewable electricity sources priority access to
the grid The responsibility for meeting the RPS would fall on the shoulders of the local grid companies (subsidiaries of the national grid company) and the provincial governments The tricky part is the level of penetration: if the level is too low, it will be used as a ceiling for further renewable electricity to be fed into the grid All in all, the RPS is a compromise solution to the curtailment problem But given the enforcement situation in China, the RPS seems to be the best way forward at this stage
OUTLOOK FOR 2014 AND BEYOND
Despite the challenges the Chinese wind market is set to further recover in 2014 – annual installations are expected to continue to grow over the next few years, as the grid connection becomes easier and the government establishes more favourable policies Furthermore, the offshore sector is expected to take off in the next year or two The Chinese government has also set a new ambitious target of 200 GW by 2020 and if the past is any indication, the target will certainly be achieved, and likely exceeded
With input from the Chinese Wind Energy Association, CWEA, and Chinese Renewable Energy Industry Association, CREIA
China © Kaj Iversön
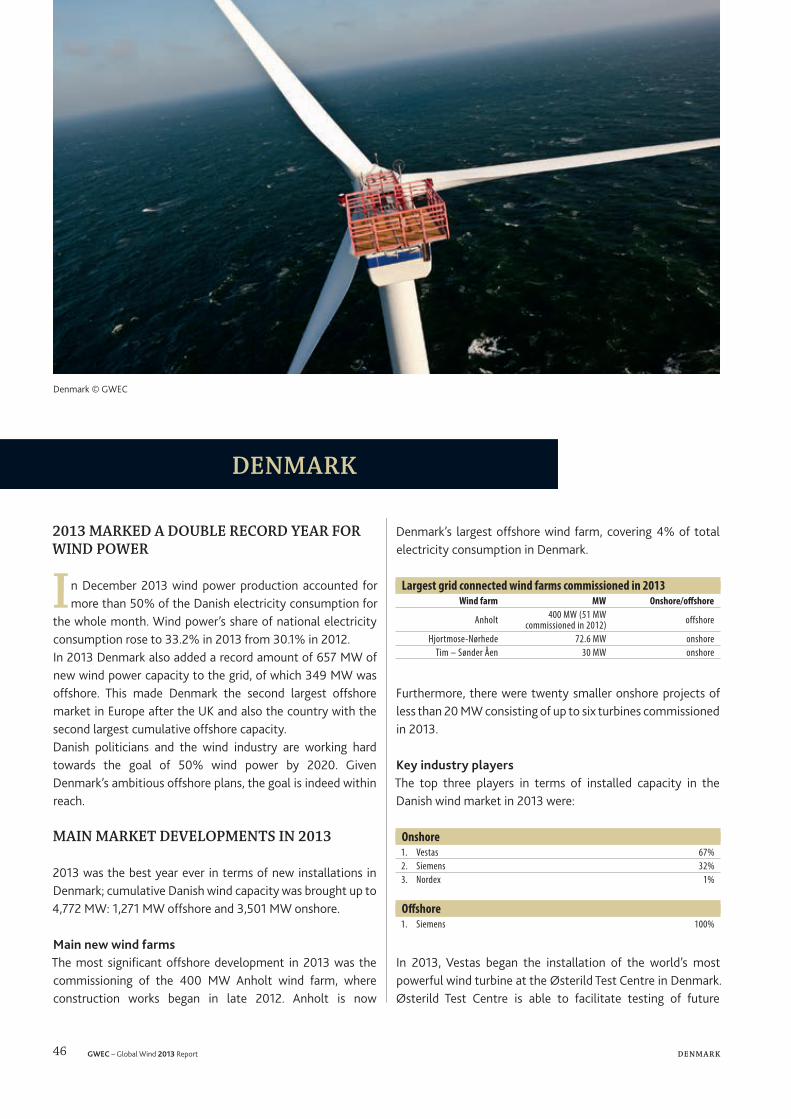
46 GWEC – Global Wind 2013 Report DE N M A R K
DENMARK
2013 MARKED A DOUBLE RECORD YEAR FOR WIND POWER
In December 2013 wind power production accounted for more than 50% of the Danish electricity consumption for
the whole month Wind power’s share of national electricity consumption rose to 33 2% in 2013 from 30 1% in 2012 In 2013 Denmark also added a record amount of 657 MW of new wind power capacity to the grid, of which 349 MW was offshore This made Denmark the second largest offshore market in Europe after the UK and also the country with the second largest cumulative offshore capacity Danish politicians and the wind industry are working hard towards the goal of 50% wind power by 2020 Given Denmark’s ambitious offshore plans, the goal is indeed within reach
MAIN MARKET DEVELOPMENTS IN 2013
2013 was the best year ever in terms of new installations in Denmark; cumulative Danish wind capacity was brought up to 4,772 MW: 1,271 MW offshore and 3,501 MW onshore
Main new wind farmsThe most significant offshore development in 2013 was the commissioning of the 400 MW Anholt wind farm, where construction works began in late 2012 Anholt is now
Denmark’s largest offshore wind farm, covering 4% of total electricity consumption in Denmark
Largest grid connected wind farms commissioned in 2013Wind farm MW Onshore/offshore
Anholt 400 MW (51 MW commissioned in 2012) offshore
Hjortmose-Nørhede 72.6 MW onshoreTim – Sønder Åen 30 MW onshore
Furthermore, there were twenty smaller onshore projects of less than 20 MW consisting of up to six turbines commissioned in 2013
Key industry playersThe top three players in terms of installed capacity in the Danish wind market in 2013 were:
Onshore1. Vestas 67%2. Siemens 32%3. Nordex 1%
Offshore1. Siemens 100%
In 2013, Vestas began the installation of the world’s most powerful wind turbine at the Østerild Test Centre in Denmark Østerild Test Centre is able to facilitate testing of future
Denmark © GWEC

47GWEC – Global Wind 2013 Report DE N M A R K
generations of wind turbines up to 250 metres The 220 metre V164-8 0 MW prototype was commissioned on 28 January 2014 Also, Siemens Wind Power is testing their 197 meter SWT-6 0-154 at Østerild
RECENT POLICY DEVELOPMENTS
In March 2012, the Danish parliament adopted a new energy agreement for the period from 2012-2020 This agreement sets a target of 50% of Danish electricity consumption to come from wind power by 2020 This ambition to reach 50% wind by 2020 entails an onshore target of 1,800 MW of new installations, and additionally replacing aging onshore turbines The government’s target includes 1,500 megawatts of new offshore installations by 2020, as follows:
• Horns Reef 3 Offshore Wind Farm with a capacity of 400 MW in the North Sea March 2014 has been set as the deadline for prequalification and February 2015 for binding tenders Grid connection will be guaranteed from January 2017, and a fully operational wind farm is expected in early 2020
• Kriegers Flak Offshore Wind Farm with a capacity of 600 MW in the Baltic Sea with a grid connection to Germany as well as Denmark Prequalification is expected during winter 2014/2015 and the deadline for binding tenders is in August 2015 Grid connection will be guaranteed from July 2018 and a fully operational wind farm is expected in early 2020
• An additional 500 MW of near shore installations (distance to shore >4 km) with 50 MW dedicated to test turbines The 450 MW near shore installations are distributed over six projects, which are to compete with each other in one tender with a prequalification deadline during spring 2015 and the deadline for final tenders in March 2016 Grid connection will be guaranteed from January 2017 The near shore projects are covered by a local ownership scheme, where at least 20% ownership shares are to be offered for sale to local citizens Local citizens can thereby have a share in the revenue created by the wind farms
SUPPORT FRAMEWORK FOR WIND ENERGY
Tariff levels for onshore and offshore windIn 2013 onshore wind got a feed-in premium of 0 25 DKK (EUR 0 03/USD 0 05) per kWh for the first 22 000 full load hours As of 1 January 2014, the system changed to include a 0,58 DKK (EUR 0 08/ USD 0 11) ceiling, with a 1:1 subsidy deduction when/if the combined market price and premium exceeds 0 58 DKK per kWh The amount of full load hours will from 2014 onwards depend on both the capacity of the generator and the swept rotor area giving a relatively higher weight to the rotor area than the size of the generator The offshore tariff in Denmark continues to be driven by a tendering system The winner of a tender is the one with the lowest bid for a feed-in-tariff for 50,000 full load hours
KEY OBSTACLES TO WIND ENERGY DEVELOPMENT
In the long run from around 2018-2020 and onwards when the next wave of offshore wind farms will be grid connected and 50% of the Danish electricity consumption will be supplied by wind power, a very important challenge will be to establish an adequate technical and regulatory framework for the integration of wind power in the energy system including the need for increased use of wind electricity in the district heating system
OUTLOOK FOR 2014 AND BEYOND
No further grid connected offshore wind farms are expected to be erected before the period of 2017-2020 in Denmark; however, 2-300 megawatts of onshore wind power are likely to be added to the Danish grid in 2014
With input from the Danish Wind Industry Association, DWIA
TOTA L I N S TA L L E D C A PAC I T Y
2,000
3,000
4,000
5,000
year 2001 2002 2003 2004 2005 2006 2007 2008 2009 2010 2011 2012 2013MW 2,489 2,889 3,115 3,123 3,127 3,136 3,136 3,158 3,468 3,801 3,956 4,162 4,772
Source: GWEC

48 GWEC – Global Wind 2013 Report T H E E U ROPE A N U N ION
MAIN MARKET DEVELOPMENTS IN 2013
Annual installations
During 2013, 12,030 MW of wind power was installed across Europe, with European Union countries
accounting for 11,159 MW of the total, 8% less than in 2012 Of the 11,159 MW installed in the EU, 9,592 MW was onshore and 1,567 MW offshore Compared to 2012 installations, the onshore market decreased in the EU by 12%, whilst offshore installations grew by 34% Germany was the largest annual market in 2013, adding 3,238 MW of new capacity, 240 MW of which was offshore The UK came in second with 1,883 MW, including 733 MW offshore The two leading markets were followed by Poland (894 MW), Sweden (724 MW), Romania (695 MW), Denmark (657 MW), France (631 MW) and Italy (444 MW) The emerging markets of the EU’s central and eastern countries, including Croatia, installed 1,755 MW, 16% of total
installations In 2013, these countries represented a slightly smaller share of the total EU market than in 2012 (18%) Beyond the EU, 871 MW were installed in other European countries, of which 646 MW was in Turkey Turkish installations were up 28% compared to 2012, continuing the strong growth trend of the past years However, 46% of all new EU installations in 2013 were in just two countries (Germany and the UK), a significant concentration compared to the trend of previous years when installations were increasingly spread across Europe This is a level of concentration that has not been seen in the EU’s wind power market since 2007 when the three wind energy pioneering countries (Denmark, Germany and Spain) together represented 58% of all new installations that year This concentration is explained in part by a push in Germany and the UK to complete projects before wind energy market reforms, including changes to the support mechanisms However, a number of previously large markets such as Spain, Italy and France have seen their rate of wind energy installations decrease significantly in 2013, by 84%, 65% and 24% respectively EU wind power installations for 2013 show the negative impact of the market, regulatory and political uncertainty sweeping across Europe Destabilised legislative frameworks for wind energy are undermining investments
Member State share of new installations in Europe in 2013 (MW)Ireland
288Austria
308Italy444
France631
Denmark657
Romania695
Sweden724
Poland894
Others1,395
UK1,883
Germany3,238
Source: EWEA
Cumulative installations
A total of 121 5 GW of wind energy capacity are now installed in Europe, of which 117 GW is in the European Union, for a cumulative growth rate of over 10% Germany remains the EU country with the largest installed capacity, followed by Spain, the UK, Italy and France Eleven other EU countries have over 1 GW of installed capacity: Austria, Belgium, Denmark, France, Greece, Ireland, the Netherlands, Poland, Portugal, Romania and Sweden Eight of the latter (Denmark, France, Germany, Italy, Portugal, Spain, Sweden, United Kingdom), have more than 4 GW of installed wind energy capacity Annual wind power installations in the EU have increased steadily over the past 13 years from 3 2 GW in 2000 to 11 GW in 2013, representing an average annual growth rate of over 10% Outside the EU, Turkey now has almost 3 GW of installed capacity, Norway 768 MW and the Ukraine 371 MW The wind energy capacity currently installed in the EU would produce in an average wind year 257 TWh of electricity, enough to cover 8% of the EU’s total electricity consumption
TRENDS
In 2000, new renewable power capacity installations totalled a mere 3 6 GW Since 2010, annual renewable capacity additions have been between 24 7 GW and 35 2 GW, eight to ten times higher than in 2000
THE EUROPEAN UNION

49GWEC – Global Wind 2013 Report T H E E U ROPE A N U N ION
The share of renewables in total new power capacity additions has also grown In 2000, those 3 6 GW represented 22 4% of new power capacity installations, increasing to 25 GW representing 72% in 2013 In total, 385 GW of new power capacity has been installed in the EU since 2000 Of this, over 28% has been wind power, 55% renewables and 92% renewables and gas combined The net growth since 2000 of gas power (131 7 GW), wind (115 4 GW) and solar PV (80 GW) was at the expense of fuel oil (down 28 7 GW), coal (down 19 GW) and nuclear (down 9 5 GW) The other renewable technologies (hydro, biomass, waste, CSP, geothermal and ocean energies) have also been increasing their installed capacity over the past 13 years, albeit more slowly than wind and solar PV The EU’s power sector continues to move away from fuel oil, coal and nuclear while increasing its total installed generating capacity with gas, wind, solar PV and other renewables
EU OFFSHORE
2013 was a record year for offshore installations, with 1,567 MW of new capacity grid connected, 34% more capacity than the previous year Offshore wind power installations represent over 14% of the annual EU wind energy market, up from 10% in 2012 For more details on the EU’s offshore sector see the Chapter on Global Offshore
RECENT POLICY DEVELOPMENTS
The main legislation in the European Union pushing the deployment of wind energy remains the so-called Renewable Energy Directive that came into force in 2009 and sets a target of 20% renewable energy in final energy consumption at EU level, broken down into 28 national targets However, in light of the climate negotiations in Paris in 2015 and the need to map out the path to reach the EU’s goal of decarbonising the economy by 80% to 95% in 2050, discussions have begun in Brussels on post-2020 climate and energy policy After considerable discussions within the Commission, at the end of January the European Commissioners proposed
a climate and energy package with targets for 2030 The EU should reduce greenhouse gas emissions by 40% compared to 1990 levels, and reach 27% renewable energy penetration This latter target would be binding on the EU, but not split among the 28 Member States The proposal was heavily criticised by the renewable energy industry, highlighting how a 27% renewables target is not in the least ambitious and would have very little effect in promoting wind energy investments Moreover, with no binding legislation at member state level, the proposal comes across as impractical and hard to enforce Moreover, the Commission’s proposal ignored a European Parliament committee vote just days before calling for a 30% renewable energy target and an impact assessment showing that the EU’s expensive energy is largely due to reliance on fossil fuel imports (costing EUR 421 billion (USD 575bn) in 2012 – over 3% of the EU’s GDP) In late March 2014, the Heads of State of the EU’s 28 Member States will meet to discuss the Commission’s proposal for a 2030 climate and energy framework Led by a number of countries, including Germany, they need to show leadership and demand more ambition, including a renewables target of over 30% with national targets for all Member States
With input from the European Wind Energy Association (EWEA)
TOTA L I N S TA L L E D C A PAC I T Y
0
20,000
40,000
60,000
80,000
100,000
120,000
year 2001** 2002** 2003** 2004* 2005* 2006* 2007 2008 2009 2010 2011 2012 2013MW 17,315 23,159 28,598 34,371 40,776 48,483 57,327 66,068 76,605 84,952 94,432 106,454 117,289
** EU 15 * EU 25 Source: GWEC
›The Heads of State of the EU’s 28 Member States need to show leadership and demand more ambition for a 2030 climate and energy framework, including a renewables target of over 30%.‹

50 GWEC – Global Wind 2013 Report F R A N C E
FRANCE
F rance has the second largest wind potential in Europe, and the wind resource is well distributed across the
country The government has set a target of 25 GW of wind power, including 6 GW of offshore, as part of its obligation under the EU renewables directive, which requires France to meet 23% of final energy demand with renewable energy sources by 2020 In 2013, 631 MW of new wind power was connected to the grid, bringing the total installed capacity up to 8,254 MW, with 4,200 operating wind turbines spread across the country Overall, wind power now accounts for 3 3% of national electricity consumption with annual production reaching 15 9 TWh However, the annual wind market shrunk significantly, by 24%, in 2013 The slow-down is the result of several of factors, including a complex permitting process, the high number of appeals and uncertainty over the onshore tariff
MAIN MARKET DEVELOPMENTS IN 2013
In January 2013, the French government announced the much awaited second phase of a call for tenders for the construction of 1,000 MW of offshore wind farms The projects are planned northern France, and near the Noirmoutier and Île d’Yeu islands on the Atlantic coast, and are expected to come online from 2021 to 2023 Contracts for a first offshore wind tender of four wind farms worth an investment of around EUR 7 billion were awarded by the French government in April 2012 It is expected that the first call alone will result in the creation of 10,000 new jobs and new wind power development from 2018 onwards
In 2013, the key players in the French wind market were Vestas, Repower, Enercon, Gamesa, Nordex and Siemens Three main turbine manufacturers dominate the onshore market in France: Vestas, Repower and Enercon, with a total share of more than 79%
THE POLICY FRAMEWORK FOR WIND ENERGY
The level of the feed-in tariff in France is EUR 8 2 cent/kWh (USD 11 4 cent/kWh) for onshore installations for the first ten
4ème Colloque Eolienne Louvre, 2013 © FEE
Key players in the French wind market in 2013Vestas243.7 MW
Repower130 MW
Enercon121.5 MW
Gamesa60 MW
Nordex60 MW
Siemens16 MW
3%9%
9%
19%
21%
39%
Total631 MW
Source: FRANCE ENERGIE EOLIENNE1

51GWEC – Global Wind 2013 Report F R A N C E
years of operation, and then adjusted for the following five years to between EUR 2 8 to 8 2 cent/kWh depending on the actual wind conditions and corresponding turbine performance For offshore wind the tariff is set at EUR 13 cent/kWh (USD 18 1 cent/kWh) for the first ten years and then adjusted to between EUR 3 to 13 cent/kWh for the following ten years according to the site location Since 2012, tenders are organized for offshore wind farms, and consequently the level of the offshore tariff is defined by the winning bidder As a part of its environmental law, Grenelle 23% of the country’s energy must come from a mix of renewable energy sources by 2020 For the wind sector this means a target of 25 GW by 2020 Moreover, each region will have to define a regional wind energy development plan (SRE) which includes a target and a definition of favorable areas for wind power development The total target set in these plans amounts to 28,377 MW However, this year, less than half the 1,400 megawatts needed annually to reach the objective of 19,000 MW of onshore wind by 2020 were installed At least two administrative permits delivered by the local Prefect need to be completed before starting a new wind project in France: a building permit and an operating permit Additionally, on a case by case basis, further permits may be required A simplified ‘single step procedure’ for permitting will be tested in seven French regions in 2014
In 2013 the French government adopted new measures, through the so-called Brottes Act, with the aim of simplifying regulations, including:
• Removal of the Wind Energy Development Areas (ZDE) in local planning documents which defined specific zones for wind projects in order to benefit from the feed-in tariff The planning is now made at the regional, not any longer at the local, level
• Discarding the rule requiring a minimum of 5 wind turbines per wind farm in order to benefit from the feed-in tariff
• Exemption to the Coastal Act in overseas departments (DOM) to allow wind development in these regions
KEY OBSTACLES TO WIND ENERGY DEVELOPMENT
The constant changes in the legislative framework and regulations bring uncertainty and complexity to wind energy development in France, slowing down the market and threatening the achievement of the 2020 targets set for wind power Currently, it takes up to 6-8 years to develop a wind project in France Moreover, in 2008 the validity of the French feed-in tariff was being challenged before the French administrative Supreme Court, the Conseil d’Etat, by an anti-wind group In December 2013, the Court of Justice of the European Union ruled that the support in the form of feed-in tariffs to wind farms in France engage government resources and are therefore a form of government subsidy and should be notified to the European Commission Currently, this case is pending at the French Supreme Court which could cancel the tariff because the correct procedure has not been respected A decision from the European Commission on this case is also pending The French government has now announced the feed-in-tariff and the European Commission is expected to confirm if it this follows the European common market rules Other barriers that challenge wind development in France are linked to grid access, cost and radar and aviation constraints
OUTLOOK FOR 2014 AND BEYOND
A third call for tender for offshore wind capacity has been announced but the date is still pending There is no certainty about the scale of onshore wind development in 2014 yet, but the recent regulatory changes along with the current litigation over support for wind energy cause growing concern about France’s ability to reach its 23% 2020 renewables target
With input from the French Wind Energy Association, FEE
1 Note on figures: Shares of grid connected capacity are established with collected figures provided by wind turbine manufacturers
TOTA L I N S TA L L E D C A PAC I T Y
0
2,000
4,000
6,000
8,000
1,0000
year 2002 2003 2004 2005 2006 2007 2008 2009 2010 2011 2012 2013MW 148 253 390 757 1,711 2,495 3,577 4,713 5,977 6,809 7,623 8,254
Source: GWEC

52 GWEC – Global Wind 2013 Report G E R M A N Y
GERMANY
MAIN MARKET DEVELOPMENTS IN 2013
Germany maintained its position as the European leader in wind energy in 2013, ending the year with
a total of 34,250 megawatts installed capacity spread over 23,761 operating wind turbines 3,238 MW came online in 2013, representing 29% annual market growth, and included 766 MW in repowering and 520 MW of offshore wind 258 MW of onshore turbines were decommissioned in 2013 Renewable energy accounted for 23 5% of electricity generation in Germany, with wind being the single largest contributor, supplying about 8% of Germany’s net electricity consumption The average size of newly installed onshore turbines was about 2 6 MW, average rotor diameter about 95 meters and average hub height of about 117 meters
In terms of wind power deployment, Lower Saxony is the leading German federal state with a total of 7,646 MW Although a growing share of new installations can be found in remote coastal areas, in 2013, 60% of new onshore projects were installed in the so-called Binnenland, located in the midlands and Southern Germany The four top states adding each about 400 MW were Schleswig-Holstein, Rhineland-Palatinate, Mecklenburg-Vorpommern and Lower Saxony
RECENT POLICY DEVELOPMENTS
Amendment to the Renewable Energy Sources ActThe amended Renewable Energy Sources Act (EEG)1, which came into force on 1 January 2012, continues to provide stable support for onshore wind power and has improved support for offshore wind power However, the new German government is revising the Renewable Sources Act again during 2014 and is expected to make fundamental changes to the law, in particular with regards to future targets The new law is likely to set a target for renewable energy of 40 to 45% by 2025 and of 55 to 60% by 2035 Although the amendment will not have an effect on projects which were approved before 22 January 2014, it is a threat to projects which do not yet have a permit and were in the pipeline to become operational in 2014 The first ministerial draft of the new law also includes a reduction of tariffs by up to 25% compared to 2013
Onshore RepoweringRepowering can and will play a stronger role in Germany in the future, with the potential to double the amount of
capacity and to triple the energy yield at repowered sites with significantly fewer turbines deployed
Grid system transformationOne of the key challenges for expanding renewable energy is system optimisation and a speedy grid expansion in Germany It will also be important to improve the overall grid transport capacity through soft measures such as temperature monitoring, high temperature conductors, load flow management and other smart grid options There is an on-going discussion of this important topic and the first projects for improved renewable electricity integration at the regional level have been implemented, with so-called feed-in grids2
Offshore wind developmentIn 2013, 48 offshore wind turbines totaling 240 MW came online bringing the total number of offshore turbines, located in the North and Baltic Sea, up to 116 and the total offshore capacity in Germany up to 520 MW A further 2,432 MW are under construction and scheduled to be operational in 2014 or 2015 The average size of an offshore wind turbine in Germany in 2013 had a capacity of 5 MW, a rotor diameter of 126 meters and a hub height of 90 meters It is expected that about 1,500 MW will be connected to the grid in 2014, and a further 1,000 MW in 2015 A further EUR 10 billion of investment has been earmarked for 3,000 MW of offshore wind, subject to favourable political conditions The German government has set a target of 6,500 MW of offshore wind by 2020 and 15,000 MW by 2030
›Germany maintained its position as the European leader in wind energy in 2013, ending the year with a total of 34,250 megawatts installed capacity spread over 23,761 operating wind turbines. 3,238 MW came online in 2013, representing 29% annual market growth.‹

53GWEC – Global Wind 2013 Report G E R M A N Y
The review of the Renewable Energy Sources Act (Erneuerbare-Energien-Gesetz/EEG), which will take place in August 2014, may have an impact on the future of the German offshore wind sector Maintaining the existing framework conditions until the end of 2019, which was agreed in the Coalition agreement of December 2013, has strengthened the planning security for investors and for the industry However, this has now been challenged by a recent announcement on a reduction of support for 2018 and 2019 According to the German government’s energy strategy, offshore wind power will become the second most important renewable energy source in Germany However, due to the risks involved, financing difficulties and grid connection delays, deployment is lagging behind projections Therefore, offshore wind receives an additional ‘starter bonus’ of EUR 3 5 cent/kWh (USD 4 9 cent) included in the initial tariff for offshore wind power which is set at 15 cent/kWh (USD 21 cent) and paid for at least twelve years depending on distance to shore and water depth Moreover, a so-called “optional compression model” was introduced for offshore turbines which come online before the end of 2017 This gives developers the option of an initial tariff of EUR 19 cent/kWh (USD 26 5 cent) for 8 years, instead of EUR 15 cent/kWh for 12 years The annual degression rate for new offshore wind turbines increased from 5% to 7% from 2018 onwards For more information on Germany’s offshore wind development see the Chapter on Global Offshore
OUTLOOK FOR 2014 AND BEYOND
The domestic market has been very stable for the past few years and further growth depends upon the removal of key administrative barriers These are primarily political issues, yet both national and federal state level targets for renewable electricity require a growing contribution from wind energy In 2014, the German wind industry expects new installations of about 2,500 to 3,000 MW of onshore and about 1,500 MW of offshore wind Offshore projects are expected to gain a larger share of the market over the coming years; but the main impetus for growth will continue to be in new onshore
installations and repowering Beyond this, it is currently difficult to draw longer term projections due to uncertainty about future legislation However, with regards to the new feed-in tariffs, special attention is needed on further development of turbines designed in particular for areas with low wind conditions
With input from the German Wind Energy Association, BWE, and VDMA Power Systems
1 http://www eeg-aktuell de http://www erneuerbare-energien de/fileadmin/ee-import/files/english/pdf/application/pdf/
eeg_2012_en_bf pdf (in English)2 Feed-in grids connect various (renewable) generation units directly to the high-voltage network
(220 kV or 380 kV), thereby bypassing the distribution network
Germany © GWEC
TOTA L I N S TA L L E D C A PAC I T Y
5,000
10,000
15,000
20,000
25,000
30,000
35,000
year 2001 2002 2003 2004 2005 2006 2007 2008 2009 2010 2011 2012 2013MW 8,754 11,994 14,609 16,629 18,415 20,578 22,194 23,826 25,673 27,097 29,071 31,270 34,250
Source: GWEC
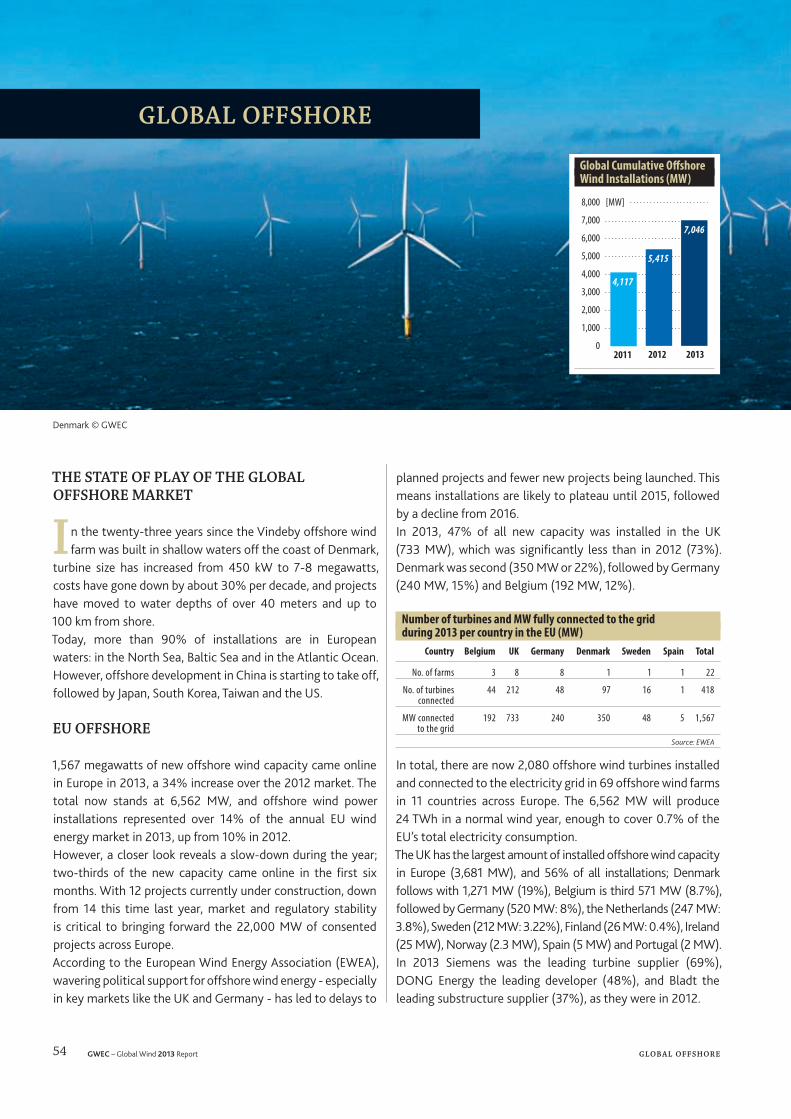
54 GWEC – Global Wind 2013 Report G L OB A L OF F SHOR E
THE STATE OF PLAY OF THE GLOBAL OFFSHORE MARKET
In the twenty-three years since the Vindeby offshore wind farm was built in shallow waters off the coast of Denmark,
turbine size has increased from 450 kW to 7-8 megawatts, costs have gone down by about 30% per decade, and projects have moved to water depths of over 40 meters and up to 100 km from shore Today, more than 90% of installations are in European waters: in the North Sea, Baltic Sea and in the Atlantic Ocean However, offshore development in China is starting to take off, followed by Japan, South Korea, Taiwan and the US
EU OFFSHORE
1,567 megawatts of new offshore wind capacity came online in Europe in 2013, a 34% increase over the 2012 market The total now stands at 6,562 MW, and offshore wind power installations represented over 14% of the annual EU wind energy market in 2013, up from 10% in 2012 However, a closer look reveals a slow-down during the year; two-thirds of the new capacity came online in the first six months With 12 projects currently under construction, down from 14 this time last year, market and regulatory stability is critical to bringing forward the 22,000 MW of consented projects across Europe According to the European Wind Energy Association (EWEA), wavering political support for offshore wind energy - especially in key markets like the UK and Germany - has led to delays to
planned projects and fewer new projects being launched This means installations are likely to plateau until 2015, followed by a decline from 2016 In 2013, 47% of all new capacity was installed in the UK (733 MW), which was significantly less than in 2012 (73%) Denmark was second (350 MW or 22%), followed by Germany (240 MW, 15%) and Belgium (192 MW, 12%)
Number of turbines and MW fully connected to the grid during 2013 per country in the EU (MW)
Country Belgium UK Germany Denmark Sweden Spain Total
No. of farms 3 8 8 1 1 1 22
No. of turbines connected
44 212 48 97 16 1 418
MW connected to the grid
192 733 240 350 48 5 1,567
Source: EWEA
In total, there are now 2,080 offshore wind turbines installed and connected to the electricity grid in 69 offshore wind farms in 11 countries across Europe The 6,562 MW will produce 24 TWh in a normal wind year, enough to cover 0 7% of the EU’s total electricity consumption The UK has the largest amount of installed offshore wind capacity in Europe (3,681 MW), and 56% of all installations; Denmark follows with 1,271 MW (19%), Belgium is third 571 MW (8 7%), followed by Germany (520 MW: 8%), the Netherlands (247 MW: 3 8%), Sweden (212 MW: 3 22%), Finland (26 MW: 0 4%), Ireland (25 MW), Norway (2 3 MW), Spain (5 MW) and Portugal (2 MW) In 2013 Siemens was the leading turbine supplier (69%), DONG Energy the leading developer (48%), and Bladt the leading substructure supplier (37%), as they were in 2012
Denmark © GWEC
GLOBAL OFFSHORE
Global Cumulative Offshore Wind Installations (MW)
[MW]
0
1,000
2,000
3,000
4,000
5,000
6,000
7,000
8,000
2011
4,117
2012
5,415
2013
7,046
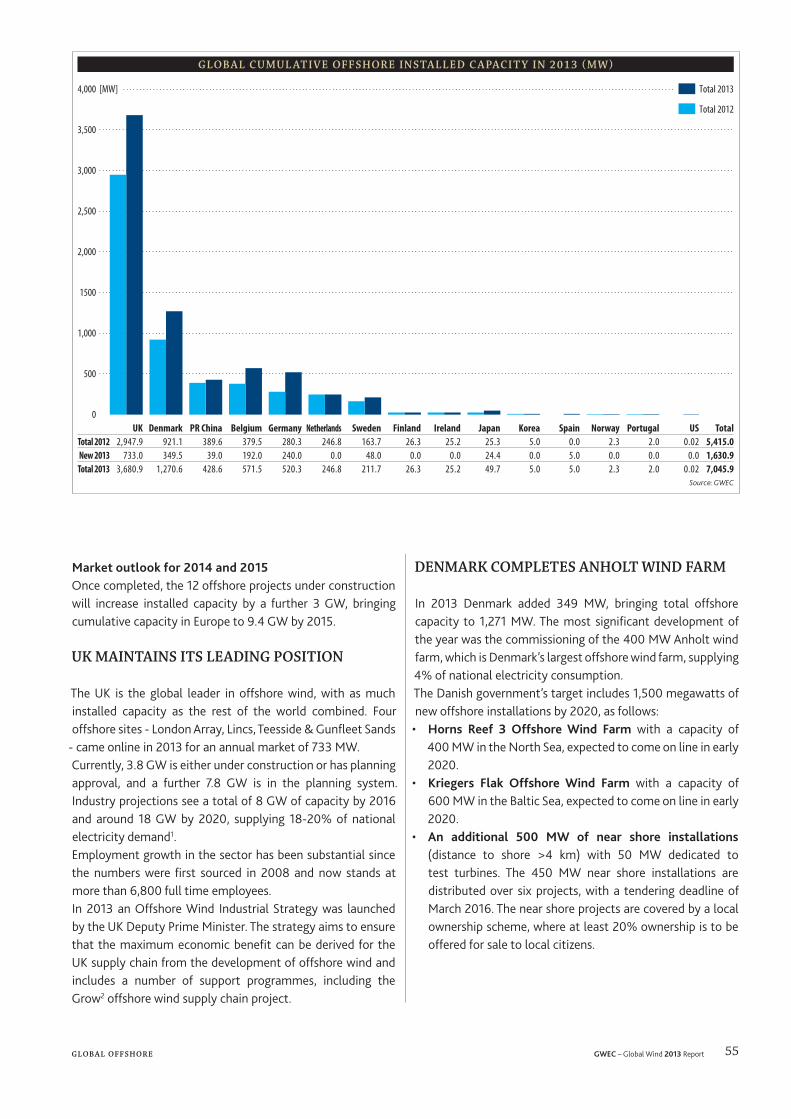
55GWEC – Global Wind 2013 Report G L OB A L OF F SHOR E
Market outlook for 2014 and 2015Once completed, the 12 offshore projects under construction will increase installed capacity by a further 3 GW, bringing cumulative capacity in Europe to 9 4 GW by 2015
UK MAINTAINS ITS LEADING POSITION
The UK is the global leader in offshore wind, with as much installed capacity as the rest of the world combined Four offshore sites - London Array, Lincs, Teesside & Gunfleet Sands
- came online in 2013 for an annual market of 733 MW Currently, 3 8 GW is either under construction or has planning approval, and a further 7 8 GW is in the planning system Industry projections see a total of 8 GW of capacity by 2016 and around 18 GW by 2020, supplying 18-20% of national electricity demand1 Employment growth in the sector has been substantial since the numbers were first sourced in 2008 and now stands at more than 6,800 full time employees In 2013 an Offshore Wind Industrial Strategy was launched by the UK Deputy Prime Minister The strategy aims to ensure that the maximum economic benefit can be derived for the UK supply chain from the development of offshore wind and includes a number of support programmes, including the Grow2 offshore wind supply chain project
DENMARK COMPLETES ANHOLT WIND FARM
In 2013 Denmark added 349 MW, bringing total offshore capacity to 1,271 MW The most significant development of the year was the commissioning of the 400 MW Anholt wind farm, which is Denmark’s largest offshore wind farm, supplying 4% of national electricity consumption The Danish government’s target includes 1,500 megawatts of new offshore installations by 2020, as follows:
• Horns Reef 3 Offshore Wind Farm with a capacity of 400 MW in the North Sea, expected to come on line in early 2020
• Kriegers Flak Offshore Wind Farm with a capacity of 600 MW in the Baltic Sea, expected to come on line in early 2020
• An additional 500 MW of near shore installations (distance to shore >4 km) with 50 MW dedicated to test turbines The 450 MW near shore installations are distributed over six projects, with a tendering deadline of March 2016 The near shore projects are covered by a local ownership scheme, where at least 20% ownership is to be offered for sale to local citizens
G L OB A L C U M U L AT I V E OF F S HOR E I N S TA L L E D C A PAC I T Y I N 2 0 1 3 ( M W )
0
500
1,000
1500
2,000
2,500
3,000
3,500
4,000 [MW] Total 2013
Total 2012
UK Denmark PR China Belgium Germany Netherlands Sweden Finland Ireland Japan Korea Spain Norway Portugal US TotalTotal 2012 2,947.9 921.1 389.6 379.5 280.3 246.8 163.7 26.3 25.2 25.3 5.0 0.0 2.3 2.0 0.02 5,415.0New 2013 733.0 349.5 39.0 192.0 240.0 0.0 48.0 0.0 0.0 24.4 0.0 5.0 0.0 0.0 0.0 1,630.9Total 2013 3,680.9 1,270.6 428.6 571.5 520.3 246.8 211.7 26.3 25.2 49.7 5.0 5.0 2.3 2.0 0.02 7,045.9
Source: GWEC

56 GWEC – Global Wind 2013 Report G L OB A L OF F SHOR E
BELGIUM IS THE WORLD’S 3RD LARGEST OFFSHORE MARKET
When it comes to offshore wind development, Belgium is a pioneer country with 572 MW of capacity installed, even though the country has less than 100 km of coastline This is mainly due to a spatial planning zone specifically devoted to offshore development In 2013, Belgium added 192 MW of offshore capacity making it the world’s third largest offshore market However, the mid-term perspective for offshore wind is not promising, given that strong grid reinforcement is urgently needed to exceed 800 MW of offshore capacity, and plans to do so are currently blocked Belgium expects to add about 90 MW of new offshore capacity in 2014, and the federal government has set a target of 2,000 MW by 2020 and 3,800 MW by 2030
GERMANY HAS AN AMBITIOUS TARGET OF 15 GW BY 2020
In 2013, 48 offshore wind turbines totalling 240 MW came online bringing the total number of offshore turbines in the German zone in the North and Baltic Seas up to 116, and total offshore capacity up to 520 MW A further 2,432 MW are under construction and scheduled to become operational in 2014 or 2015 The average offshore wind turbine installed in Germany in 2013 had a capacity of 5 MW, a rotor diameter of 126 meters and a hub height of 90 meters A review of the Renewable Energy Sources Act (EEG) will take place in August 2014 and may have an impact on the future of the German offshore wind sector Maintaining the existing framework conditions until the end of 2019, which were agreed in the Coalition agreement of December 2013, has strengthened planning security for investors and for the industry However, this has now been challenged by the recent announcement of a reduction of support for 2018 and 2019 According to the German government’s energy strategy, offshore wind power will become the second most important renewable energy source in Germany However, due to the risks involved, financing difficulties and grid connection delays, deployment is lagging behind projections Therefore, offshore wind receives an additional ‘starter bonus’ of EUR 3 5 cent / kWh (USD 4 9 cent) included in the initial tariff for offshore wind power which is set at 15 cent/kWh (USD 21 cent) and paid for at least twelve years depending on distance to shore and water depth Moreover, a so-called “optional compression model” was introduced for projects which come online before the end of 2017 This gives developers the option of an initial tariff of EUR 19 cent/kWh (USD 26 5 cent) for 8 years, instead of EUR 15 cent/kWh for 12 years The annual degression rate for
new offshore wind turbines increases from 5% to 7% from 2018 onwards Germany expects to add about 1,500 MW of offshore wind energy in 2014, and another 1,000 MW in 2015 The German government has set a target of 6,500 MW of offshore wind by 2020 and 15,000 MW by 2030
CHINESE OFFSHORE SLOWLY STARTING TO TAKE OFF
China installed 39 MW of offshore wind in 2013, much less than in 2012, for a total of 428 6 MW, making it the fifth biggest market globally The majority (70%) of Chinese offshore projects are inter-tidal (300 5 MW), and the remaining 128 1 MW are near shore demonstration projects The top three players in the Chinese offshore market are Sinovel, Goldwind and Siemens (Siemens formed a joint venture with Shanghai Electric in 2012) Sinovel and Siemens have mainly installed near shore projects, while Goldwind’s projects are predominantly inter-tidal
Manufacturers and market share in China 2013Manufacturers Number of Turbines Installed Capacity Market Share
Sinovel 56 170 39.7Goldwind 44 109.5 25.5Siemens* 21 49.98 11.7
United Power 22 39 9.1CSIC 4 14 3.3SHE 6 13.6 3.2DEC 2 8 1.9
XEMC 2 7.5 1.7Envision 3 7 1.6
Mingyang 3 6 1.4Sanyi 2 4 0.9Total 165 428.58 100
*Siemens here before the JV with SHE
Offshore development in China has been relatively slow, but there are more than 1,000 MW currently under construction However, it is unlikely that the target of 5 GW by 2015 will be reached One of the major reasons is the lack of a feed-in tariff for offshore wind, which is crucial for covering the huge investment and financing needed for the development of the sector Moreover, improved coordination between various administrations is needed to ensure a more efficient permitting procedure for offshore projects Solving these two key bottlenecks could lead to a breakthrough for offshore wind development in China in the next few years
JAPAN’S OFFSHORE NEEDS A NEW PUSH
Japan is an island country with a strong maritime industry and the world’s 6th largest marine Exclusive Economic Zone This makes offshore wind an attractive option, and Japan currently has 49 6 megawatts of offshore capacity, including 4 MW of floating turbines

57GWEC – Global Wind 2013 Report G L OB A L OF F SHOR E
At the moment there are four offshore projects totalling 254 MW which are under the EIA procedure, including two floating wind turbines (14 MW) developed by the FukushimaFORWARD project The Japanese government set a new tariff for offshore wind of JPY 36/kWh (EUR 0 26/USD 0 35) in March 2014, with effect from 1 April 2014 According to the Japanese industry, however, this level is not sufficient, given the lack of costly infrastructure needed for offshore wind development, including under-sea-cables, jack-up ships and port facilities In the short-term offshore wind development will be limited to shallow waters near port areas using 2-3 megawatt turbines with monopile or gravity foundations
SOUTH KOREA - NEW PROJECTS OFF JEJU ISLAND
2013 was a quiet year for Korean offshore, but at the end of the year Hyundai Heavy Industries (HHI) began installation of their 5 5 MW turbine off Jeju Island Samsung is also currently building an 84 MW wind farm off Jeju Island using their new 7 MW turbines Meanwhile, a government-led initiative involving six utilities is in the early stages of development of a test field off the coast of Jeollanam and Jeollabuk provinces to test 20 different turbines from a number of Korean manufacturers The Korean government uses an RPS as an incentive to support the renewable energy industry, after scrapping the FIT system in 2010 This obliges Korean utilities to generate 3 5% of their electricity from renewable sources by 2015 and 10% by 2022 While the development of onshore wind in Korea is slow due to limited land availability and costly and time-consuming planning processes, more offshore wind power is needed to meet the RPS target Korea has set a target of 900 MW of offshore wind by 2016 and 1 5 GW by 2019
TWO NEW PILOT PROJECTS START IN TAIWAN
The Taiwanese government has set targets of 600 MW by 2020 and 3 GW by 2030 for offshore wind By 2030, the Bureau of Energy (BOE) estimates the offshore industry will be worth TWD 500 billion (EUR 11 9/USD 16 4 bn)
Taiwan’s Ministry of Economic Affairs (MOEA) has signed an agreement to build two offshore wind farms off the country’s coast by 2015 The deal with Formosa Wind Power (FWP) and Fuhai Wind Farm (FWF) will see four to six offshore wind turbines set up for testing before 2015 The projects awarded will have TWD 2,500 million (EUR 59 4/USD 81 9 mn) to cover the cost of the pre-work of the project and an incentive of up to 50% of the construction cost Two turbines from each project are aimed to be installed by 2015
THE FIRST US OFFSHORE PROJECTS
The two most advanced projects in the US are the 468 MW Cape Wind Project developed by Energy Management Inc (EMI), and Deepwater Wind’s 30 MW Block Island project, both of which had made sufficient investment to qualify for the latest version of the PTC, which expired at the end of 2013 The Cape Wind project, located in Nantucket Sound south of Cape Cod, MA, has been pursued by EMI for 12 years Despite various legal and political difficulties over the past decade, Cape Wind is moving ahead and has secured a PPA for 77 5% of its output and a wide array of investors both domestic and international have come up with the $2 6 billion (EUR 1 9 bn) needed for what will be the largest US offshore wind farm The investors include Siemens, which will supply the turbines The $250 million (EUR 182 mn) Block Island project, located in state waters off Rhode Island, has secured a PPA with utility National Grid for 20 years for 100% of its output Deepwater Wind aims to begin construction of foundations in autumn 2015, with cabling and erection of its Alstom turbines in the first half of 2016 Deepwater Wind has also secured permission for an additional 1 GW in federal waters off Massachusetts and Rhode Island There is a long list of other projects in the pipeline, mainly located off the northeast coast and in the Great Lakes The US Department of Interior’s Bureau of Ocean Energy Management (BOEM) has in recent years streamlined the permitting process for offshore projects In 2013, BOEM started leasing tracts for offshore wind development in federal waters off the coasts of Massachusetts, Rhode Island and Virginia, with more leases expected in the not too distant future
1 http://www renewableuk com/en/renewable-energy/wind-energy/offshore-wind/index cfm2 http://www growoffshorewind com/
New offshore wind projects in Japan 2013Project Turbine Provider Model Total Installation Foundation Developer Commission DateWindpower Kamisu No.2 offshore wind farm Hitachi 2MW 16MW Monopile foundation Wind Power Group Feb. 2013Choshi offshore wind power demonstration project MHI 2.4MW 2.4MW gravity NEDO / TEPCO Mar. 2013Hibikinada offshore wind power demonstration project
Japan Steelworks (JSW) 2MW 2MW Jacket & Gravity hybrid foundation
NEDO / J Power Aug. 2013
GOTO FOWT floating offshore wind turbine demonstration project
Hitachi 2MW 2MW spar type floater MOE / Toda Co. Oct. 2013
Fukushima FORWARD floating offshore wind farm demonstration project
Hitachi 2MW 2MW semi-sub type floater METI / Nov. 2013
58 GWEC – Global Wind 2013 Report I N DI A
INDIA
During 2013 India added 1 7 GW to rise to the fourth spot for new annual capacity installation globally, with total
capacity of just over 20 GW However, the rate of growth has slowed over the past three years, after an abrupt policy shock in April of 2012, when both the accelerated depreciation of 80% (AD) and the generation-based incentive (GBI) of INR 500/MWh (EUR 5 9/MWh) were stopped The GBI was retroactively (w e f April 2012) restored by the government in late 2013, which helped to partially resuscitate an otherwise depressed market towards the second half of 2013 At present, wind power accounts for about 67% of total renewable energy installed capacity in the country Grid-connected renewable power (29 9 GW) accounts for almost 12 8% of India’s overall installed power generation capacity (~232 GW) and accounts for about 5% of electricity generation A target of an additional 30 GW of grid connected renewable power is set in the 12th five year plan (2012-2017), of which 15 GW is projected to come from wind power alone
MAIN MARKET DEVELOPMENTS IN 2013
With the original AD benefit gone, wind projects are eligible for 15% AD under the Income Tax Act of 1961 Additionally, with the introduction of 20% additional depreciation benefit for all power projects introduced in April 2012, a total of 35% AD benefit can be claimed for wind projects in the first year1 GBI initially was valid up to 31 March 2012 In 2013 it was amended and extended up to the end of 12th plan period i e 31 March 2017 The revised GBI scheme has a cap of INR 10 million (approximately EUR 117,490/USD 163,605) per MW between the 4th and 10th year of the project’s operations Budgetary allocation for GBI in the current fiscal year (2013-14) was INR 8 billion (EUR 93 9/USD 130 8 million) Though the market response to the GBI scheme initially was not encouraging, the outflow for the current fiscal year2 (2013-2014) under the GBI scheme reached INR 2 25 billion (EUR 26 4/USD 36 8 million) at the end of the 3rd quarter as compared to that of INR 450 million (EUR 5 3/USD 7 4 million) during FY 2012-13 The Renewable Energy Certificate (REC) scheme (1 REC = 1 MWh) began in February 20113 However, due to poor enforcement and monitoring of the RPO obligation, while the total volume of RECs being issued is increasing, the prices have been low, with a majority of RECs being sold at the floor price About 10 12 million RECs had been issued by the REC Registry as of 6th March 20144 This consisted of 9 9 million non-solar RECs Wind power accounted for almost 52% of the total accredited capacity of 4470 MW under the REC Registry
The Central Electricity Regulatory Commission (CERC) recently reduced the issuance fee of an REC from INR 10 (EUR 0 12/USD 0 17) to INR 4 (EUR 0 05/USD 0 07) per certificate in a move to strengthen demand for RECs The new fee would be effective from 1 April 2014 To narrow the country’s power deficit and reduce its dependence on coal, the Indian government announced plans for a ‘Green Energy Corridor’ project to address grid integration and availability issues for renewables based electricity generation It announced an initial allocation of INR 430 billion (approximately EUR 505/USD 703 million) In the first phase this project aims to add 30 GW of renewables to the national grid by 2020 Germany has committed technical and financial assistance for the green energy corridor under the Indo-German bilateral development cooperation programme and will be investing almost EUR 1/USD 1 4 billion5 In January 2014, KfW, the German Development Bank provided Tamil Nadu’s transmission utility TANTRANSCO with INR 15 9 billion (approximately EUR 18/USD 25 million) to strengthen the state’s transmission network6
NATIONAL WIND ENERGY MISSION
The government of India is planning to launch a National Wind Energy Mission (NWEM) sometime in 2014 This is expected to give a boost to wind power It is widely expected that a NWEM will help streamline the support mechanisms and enhance development in the wind sector Through this mission, the government aims to have a generating capacity of 100 GW of wind power installed by 2022, from the present 20 GW The proposed mission draft would include large-scale promotion of onshore and offshore wind power as well as small (<100 kW) wind turbine systems
MANUFACTURING CAPACITY IN INDIA
At the end of 2013, 19 existing manufacturers offered approximately 50 models of wind turbines and have a combined annual production capacity of over 10 GW By the end of 2014, more than 20 wind turbine manufacturing and turbine supply companies will be operating from India
Installation across the Indian StatesStates Up To 31 January, 2014
1. Andhra Pradesh 648 MW2. Gujarat 3,384 MW3. Karnataka 2,312 MW4. Kerala 35 MW5. Madhya Pradesh 386 MW6. Maharashtra 3,472 MW7. Rajasthan 2,734 MW8. Tamil Nadu 7,251 MW9. Others 4 MW
Total 20,226 MWSource: MNRE (www.mnre.gov.in) website accessed on 25th February 2014

59GWEC – Global Wind 2013 Report I N DI A
Leading manufacturers like Suzlon, Wind World, and RRB Energy and players like Regen Powertech, Gamesa, Inox, Kenerys, GE, Siemens, Nupower, Sinovel and Garuda have set up wind turbine production or assembly facilities in India Among the new entrants Inox, Kenersys, Sinovel, Nupower and Global Wind Power (Reliance Group company) are supplying 1 5 MW, 2 MW, 2 05 MW and 2 5 MW wind turbines China’s Ming Yang Wind Power Company has recently entered the Indian market with its 1 5 MW machine in collaboration with Global Wind Power They aim to install 2 5 GW of wind power capacity over three years with financing support from the China Development Bank
OBSTACLES TO WIND ENERGY DEVELOPMENT
Annual wind installations fell from over 3 GW in 2011 to 2 3 GW in 2012 to 1 7 GW in 2013 2013 has been one of the toughest years for the Indian wind industry since the economic recession of 2008 The industry has faced various challenges including the withdrawal of accelerated depreciation benefits, challenges in transmission, scheduling and forecasting, lack of an integrated energy plan among others which precipitated a significant drop in capacity additions Though wind power accounted for over half of the registered generation capacity under the REC registry, making RECs a widely accepted instrument and a revenue stream for the project financing community remains a challenge in India, especially with the limited validity of five years of the REC certificates
OUTLOOK FOR 2014 AND BEYOND
According to the 12th five-year plan renewable energy must play an increasing role in achieving energy security and energy access The approved outlay for 12th plan for New and Renewable Energy programmes was INR 33 billion (approximately EUR 387/USD 539 million), which is almost 3 times that for the 11th five-year plan period (2007-12) In addition to streamlining various existing policy initiatives, new actions such as the NWEM are considered essential to accelerating the pace of deployment of clean energy technologies After the recent announcement of the NWEM, the industry is hopeful of a recovery over 2014-2015 The strength of the recovery will be closely linked to how effectively the NWEM and its contents can be made operational and how well it is designed If everything goes according to expectation then during the Indian financial year 2014-15 wind capacity addition is likely to cross 2,500 MW
With input from World Institute of Sustainable Energy, India
1 http://www ireda gov in/writereaddata/Clarifications%20for%20the%20GBI%20Applications%20under%20Extension%20Wind%20GBI%20Scheme%20announced%20by%20MNRE(1) pdf
2 In India the fiscal year runs from 1st of April to 31st of March next year For example the 2013-14 fiscal year will run from 1-April-2013 to 31-March-2014
3 The market clearance price for non-solar RECs is between INR 1500 (EUR 17 6/USD 24 5) to INR 3300 (EUR38 7/USD 53 9) per REC
4 https://www recregistryindia nic in/ 5 http://www thehindu com/news/national/green-energy-corridor-projects-get-international-aid/
article5462831 ece 6 http://www thehindu com/news/national/tamil-nadu/german-bank-to-fund-green-energy-
corridors-project/article5694235 ece
India © GWEC
TOTA L I N S TA L L E D C A PAC I T Y
0
5,000
10,000
15,000
20,000
25,000
year 2001 2002 2003 2004 2005 2006 2007 2008 2009 2010 2011 2012 2013MW 1,456 1,702 2,125 3,000 4,430 6,270 7,845 9,655 10,926 13,065 16,084 18,421 20,150
Source: GWEC
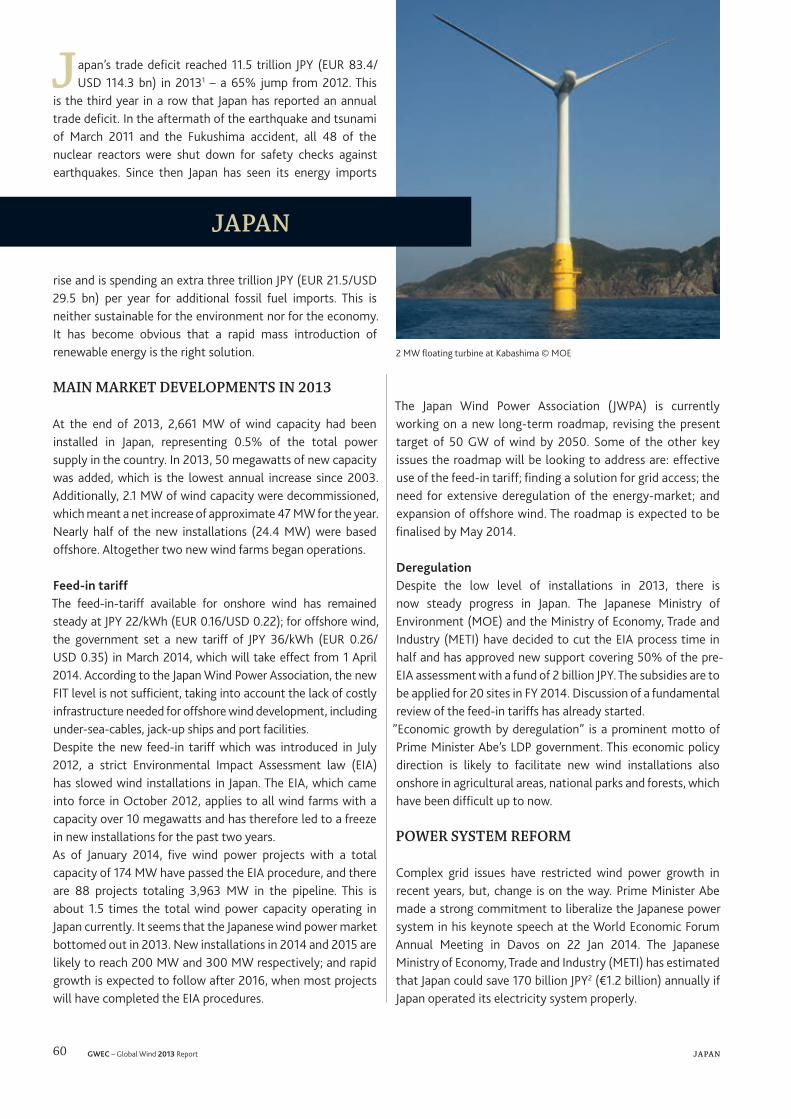
60 GWEC – Global Wind 2013 Report JA PA N
Japan’s trade deficit reached 11.5 trillion JPY (EUR 83.4/USD 114.3 bn) in 20131 – a 65% jump from 2012. This
is the third year in a row that Japan has reported an annual trade deficit. In the aftermath of the earthquake and tsunami of March 2011 and the Fukushima accident, all 48 of the nuclear reactors were shut down for safety checks against earthquakes. Since then Japan has seen its energy imports
rise and is spending an extra three trillion JPY (EUR 21.5/USD 29.5 bn) per year for additional fossil fuel imports. This is neither sustainable for the environment nor for the economy. It has become obvious that a rapid mass introduction of renewable energy is the right solution.
MAIN MARKET DEVELOPMENTS IN 2013
At the end of 2013, 2,661 MW of wind capacity had been installed in Japan, representing 0.5% of the total power supply in the country. In 2013, 50 megawatts of new capacity was added, which is the lowest annual increase since 2003. Additionally, 2.1 MW of wind capacity were decommissioned, which meant a net increase of approximate 47 MW for the year. Nearly half of the new installations (24.4 MW) were based offshore. Altogether two new wind farms began operations.
Feed-in tariffThe feed-in-tariff available for onshore wind has remained steady at JPY 22/kWh (EUR 0.16/USD 0.22); for offshore wind, the government set a new tariff of JPY 36/kWh (EUR 0.26/USD 0.35) in March 2014, which will take effect from 1 April 2014. According to the Japan Wind Power Association, the new FIT level is not sufficient, taking into account the lack of costly infrastructure needed for offshore wind development, including under-sea-cables, jack-up ships and port facilities.Despite the new feed-in tariff which was introduced in July 2012, a strict Environmental Impact Assessment law (EIA) has slowed wind installations in Japan. The EIA, which came into force in October 2012, applies to all wind farms with a capacity over 10 megawatts and has therefore led to a freeze in new installations for the past two years.As of January 2014, five wind power projects with a total capacity of 174 MW have passed the EIA procedure, and there are 88 projects totaling 3,963 MW in the pipeline. This is about 1.5 times the total wind power capacity operating in Japan currently. It seems that the Japanese wind power market bottomed out in 2013. New installations in 2014 and 2015 are likely to reach 200 MW and 300 MW respectively; and rapid growth is expected to follow after 2016, when most projects will have completed the EIA procedures.
The Japan Wind Power Association (JWPA) is currently working on a new long-term roadmap, revising the present target of 50 GW of wind by 2050. Some of the other key issues the roadmap will be looking to address are: effective use of the feed-in tariff; finding a solution for grid access; the need for extensive deregulation of the energy-market; and expansion of offshore wind. The roadmap is expected to be finalised by May 2014.
DeregulationDespite the low level of installations in 2013, there is now steady progress in Japan. The Japanese Ministry of Environment (MOE) and the Ministry of Economy, Trade and Industry (METI) have decided to cut the EIA process time in half and has approved new support covering 50% of the pre-EIA assessment with a fund of 2 billion JPY. The subsidies are to be applied for 20 sites in FY 2014. Discussion of a fundamental review of the feed-in tariffs has already started.
”Economic growth by deregulation” is a prominent motto of Prime Minister Abe’s LDP government. This economic policy direction is likely to facilitate new wind installations also onshore in agricultural areas, national parks and forests, which have been difficult up to now.
POWER SYSTEM REFORM
Complex grid issues have restricted wind power growth in recent years, but, change is on the way. Prime Minister Abe made a strong commitment to liberalize the Japanese power system in his keynote speech at the World Economic Forum Annual Meeting in Davos on 22 Jan 2014. The Japanese Ministry of Economy, Trade and Industry (METI) has estimated that Japan could save 170 billion JPY2 (€1.2 billion) annually if Japan operated its electricity system properly.
2 MW floating turbine at Kabashima © MOE
JAPAN

61GWEC – Global Wind 2013 Report JA PA N
Most of Japan’s onshore wind resource exists in the northern rural regions of Hokkaido and Tohoku These regions have poor grid infrastructure and limited local demand that has restricted wind power installation in these regions The METI has approved plans to build new grid lines for wind power in Hokkaido and Tohoku regions METI commissioned two groups involving five companies on 21 October 2013 for this work These companies will build new grid lines in northern Hokkaido with support from the government The Japanese wind power industry has begun cooperating with the academic community to find solutions for the grid problem For example, ‘aggregation’ is a familiar tool for stabilizing the variability of wind power generation The Japan Wind Energy Association (JWEA) and the Japan Electrical Manufacturers’ Association (JEMA) have introduced European grid operation experiences including ‘aggregation’ to Japan by translating many reports including IEA’s Wind Task 25 into Japanese JWPA has also conducted research with the University of Tokyo to confirm the levelling effect of increases in wind farm size, using actual wind farm operation data from the association members As the result of this study, Shikoku Electric Co has expanded its target for wind power capacity from 250MW to 600MW in June 2013 JWPA will look to strengthen such collaboration in the other important areas in the near future
MANUFACTURING
Three Japanese wind turbine manufacturers hold more than 60% of the domestic market share They are busy developing new types of wind turbines
New wind turbines developed by Japanese manufacturersCompany Wind turbine Rated output Start of operations TypeMHI MWT167/ 7.0 7.0 MW 2014 Digital hydraulic driveHitachi HTW 5.0-126 5.0 MW 2014 Downwind
HTW 2.0-86 2.0 MW 2014 DownwindJSW J100-2.7 2.7 MW 2013 Gearless PMSG
Due to the small size of the domestic market, Japanese companies intend to expand their business globally by merging or collaborating with foreign companies For instance,
Mitsubishi Heavy Industries and Vestas have established a new JV company for the offshore wind business, with the aiming of achieving a larger share of the offshore market Toray has acquired Zoltek, which produces carbon fiber for wind turbine blades for Vestas and Gamesa, for $ 610 million Mr Sadayuki Sakakibara, who is the former chairman of Toray, is slated to become the president of Japan’s Federation of Economic Organizations (“Keidanren”) after April 2014 This change of leadership might bring about a change within Japanese business societies in favour of renewable energy Yasukawa Electric Co is collaborating with Finnish wind-power technology specialist The Switch The combination of Yasukawa’s high voltage technology and The Switch’s wind power experience could enable the production of compact generators for larger wind turbines Likewise many Japanese companies have started investing in the European offshore wind power business
OFFSHORE WIND POWER DEVELOPMENT
Japan is an island country with a strong maritime industry and the world’s 6th largest marine Exclusive Economic Zone This makes offshore wind an attractive option in Japan Currently, Japan has 49 6 megawatts of offshore capacity including 4 MW of floating turbines The Ministry of Environment has estimated Japan’s realistic potential at about 1,000 GW For more details on Japan’s offshore sector see the Chapter on Global Offshore
OUTLOOK FOR 2014 AND BEYOND
The Japanese wind power market is at dawn now, and waiting for the sunrise Many changes have been introduced for wind power expansion Japan’s domestic market will grow quickly after 2016 We keep on making every effort to realize this dream for the future of wind power in Japan
With input from the Japan Wind Power Association (JWPA) and the Japan Wind Energy Association (JWEA)
1 http://www bloomberg com/news/2014-01-26/japan-record-annual-trade-deficit-shows-import-drag-on-recovery html
2 According to Nikkei Asian Review, December 2013
TOTA L I N S TA L L E D C A PAC I T Y
0
500
1,000
1,500
2,000
2,500
3,000
year 2000 2001 2002 2003 2004 2005 2006 2007 2008 2009 2010 2011 2012 2013MW 136 303 339 582 812 1,050 1,309 1,538 1,880 2,085 2,334 2,536 2,614 2,661
Source: GWEC

62 GWEC – Global Wind 2013 Report M E X ICO
MEXICO
MAIN MARKET DEVELOPMENTS IN 2013
W ind power plays an increasingly important role in Mexico’s energy mix accounting for about 20% of
total renewable energy capacity in the country Mexico added 380 MW to the country’s electricity grid in 2013, bringing total capacity up to 1,917 MW The slightly slower pace of growth compared to 2012 was due to anticipation of the new Energy Reform
THE POLICY FRAMEWORK FOR WIND ENERGY
At present, the private sector can participate in the electricity market through generation by Independent Power Producers, through self-generation, as a small producer (<30MW) or via exporting to other countries The Mexican Renewable Energy Law (LAERFTE) sets a target of 35% of electricity from renewable energy by 2024 The government has established some incentive schemes, such as the Energy Bank and fixed Transmission and Distribution (T&D) prices per MWh to help reach the target
Additionally, there is a General Climate Change Law which includes an objective to reduce CO2 emissions by 30% by 2020 Renewable energy plays a vital role in achieving this goal
THE ENERGY REFORM
Landmark legislation and a Constitutional amendment was passed by the Mexican Congress in December 2013, which marks the beginning of the end of Mexico’s 75 year-old oil, gas and electricity monopoly, establishes an electricity market, and will give wind power the opportunity to compete The Federal Electricity Commission (CFE) will become a ‘state productive entity’, i e , a state owned company which will compete with other generators For now, CFE will continue to own all transmission and distribution, but crucially, the Energy Regulatory Commission (CRE) will issue permits, set rates and regulate the market as an independent entity; and an Independent System Operator (ISO) will be established during the course of 2014 - the National Energy Control Centre (CENACE) The ISO will control the operation of the system and the new electricity market, as well as grant open and non-discriminatory access for all the generators to the national grid
Moreover, the following changes were established by the Reform:
• Different types of contracts regarding financing, installations, maintenance, management, operation and extension of infrastructure for electric energy transmission and distribution on behalf of the State will be legislated by the Congress by April;
• The newly established Mexican Oil Fund’s resources can be assigned to renewable energy projects (when the balance of public savings investments is 3% or more);
• A new legal framework for environmental protection will be established including a national program for energy use with a strategy for transition to the use of clean energy technologies and fuels
OBSTACLES TO WIND ENERGY DEVELOPMENT
The shortage of transmission lines has become the main barrier facing the Mexican wind sector The Mexican Wind Energy Association (AMDEE) is working hard to find solutions for the creation of a bigger transmission grid enabling a much larger wind power industry in the country
© Wikimedia Commons

63GWEC – Global Wind 2013 Report M E X ICO
OUTLOOK TO 2014 AND BEYOND
Mexico has one of world’s richest wind resources 2014 is set to be a year of great changes for the Mexican wind industry, given the Energy Reform The reform will open the market to a higher level of flexibility for the private sector The clean energy requirement which is binding for all the players in the sector will rely heavily on wind power to reach the 35% by 2024 target A more open and transparent interconnection procedure, through the new ISO, will give incentives for the development
of new projects Furthermore, the participation of the private sector in the development of T&D networks means that the areas of high wind energy potential will be able to be connected to the grid The Mexican Wind Energy Association (AMDEE) has set a target of 12,000 megawatts of wind power by 2022, this would mean a market of about 2,000 MW/year going forward
With input from the Mexican Wind Energy Association, AMDEE
TOTA L I N S TA L L E D C A PAC I T Y
0
500
1,000
1,500
2,000
2,500
year 2005 2006 2007 2008 2009 2010 2011 2012 2013MW 3 85 85 165 213 519 569 1,537 1,917
Source: GWEC
W I N D FA R M S I N OPE R AT ION A N D U N DE R C ON S T RU C T ION I N M E X IC O
Project Location Project State Developer/Investor Manufacturer Operation Date Capacity (MW)
OPERATIONLa Venta Oaxaca Operation CFE Vestas, 225 kW 1994 1.57La Venta II Oaxaca Operation CFE Gamesa, 850 kW 2006 83.30La ventosa II Oaxaca Operation Iberdrola Gamesa 2008 49.30La Ventosa Oaxaca Operation Iberdrola Gamesa 2008 30.60Eurus, 1st Phase Oaxaca Operation Cemex/Acciona Acciona, 1.5 MW 2009 37.50Eurus 2nd Phase Oaxaca Operation Cemex/Acciona Acciona, 1.5 MW 2010 212.50Bii Nee Stipa I Oaxaca Operation Cisa-Gamesa Gamesa, 850 kW 2010 26.35
La Mata - La Ventosa Oaxaca Operation Electrica del Valle de México (EDF-EN) Clipper, 2.5 MW 2010 67.50
Fuerza Eólica del Istmo Oaxaca Operation Peñoles Clipper, 2.5 MW 2011 50.00Oaxaca II, III y IV Oaxaca Operation CFE/Acciona Acciona, 1.5 MW 2011 306.00La Venta III Oaxaca Operation CFE/Iberdrola Gamesa, 850 kW 2012 102.85Oaxaca I Oaxaca Operation CFE/EYRA (ACS) Vestas, 2 MW 2012 102.00Fuerza Eólica del Istmo Oaxaca Operation Peñoles Clipper, 2.5 MW 2012 30.00Bii Nee Stipa II (Stipa Nayaá) Oaxaca Operation ENEL Green Power Gamesa, 2MW 2012 74.00Bii Nee Stipa III (Zopiloapan) Oaxaca Operation ENEL Green Power Gamesa, 2MW 2012 70.00Piedra Larga Oaxaca Operation Renovalia/Demex Gamesa 2012 90.00Bii Stinú Oaxaca Operation EDF Energies Nouvelles Gamesa, 2MW 2012 164.00La Ventosa III Oaxaca Operation Iberdrola Gamesa 2013 20.00Eoliatec del Pacifico Oaxaca Operation EDF Energies Nouvelles Gamesa 2013 160.00Bii Nee Stipa II Fase III El Retiro Oaxaca Operation Cisa-Gamesa Gamesa, 2MW 2013 74.00Guerrero Negro Baja California Operation CFE Gamesa 1999 0.6La Rumorosa Baja California Operation Turbopower Gamesa 2009 10.0Arriaga Chiapas Operation Grupo Salinas Vestas 2012 28.8Los Altos Jalisco Operation Grupo Dragón Vestas 2013 50.4El Porvenir Tamaulipas Operation GEMEX Vestas 2013 54.0Sta. Catarina Nuevo León Operation Comexhidro/Asergen GE 2013 22.0
CONSTRUC TIONBii Hioxo Oaxaca Construction GNF Gamesa, 2MW 2014 234.00Bii Nee Stipa II Fase IV Dos Arbolitos Oaxaca Construction Cisa-Gamesa Gamesa, 2 MW 2014 70.00Piedra Larga II Oaxaca Construction DEMEX Gamesa 2014 138.00Sureste I Fase II Oaxaca Construction CFE/ENEL Undefined 2014 102Granja SEDENA Oaxaca Construction SEDENA Vestas 2014 15.00Energía Sierra Juarez Baja California Construction IENOVA (SEMPRA) Vestas 2014-2015 155.1
Source: AMDEE

64 GWEC – Global Wind 2013 Report P OL A N D
POLAND
The pace of development of the wind energy sector in Poland has accelerated in recent years The Ernst &
Young Renewable energy country attractiveness indices from February 2013 ranks Poland 8th worldwide for wind energy Wind power is the fastest growing renewable energy source in the country Despite existing barriers, companies investing in wind power in Poland have successfully found ways of overcoming market obstacles, and the country is attracting significant foreign investment, particularly in component manufacturing
MAIN MARKET DEVELOPMENTS IN 2013
In Poland, wind energy is the largest source of electricity from renewables The annual installed capacity growth in 2013 was 894 MW, for a total installed capacity of 3,390 MW by the end of the year; generating 5 822 TWh, approximately 3 6% of all electricity produced in Poland
Taking advantage of Poland’s good wind resources, wind power is growing rapidly to meet the demand for clean energy The 2005 - 2013 period saw significant increase in installed wind energy capacity The Polish wind turbine market is dominated by Vestas, Gamesa, GE, Senvion (Repower) and Enercon, which between them cover 70% of the market Vestas has the largest share (30%), followed by Gamesa (17%), GE (9%), Enercon (7%) and Senvion (7%) The rest of the market is divided between other companies, including Fuhrländer, Siemens, & Nordex (PWEA, 2013)
SUPPORT FRAMEWORK FOR WIND ENERGY
In Poland, the support mechanism for renewable energy is based on tradable green certificates and on the obligation for electricity sellers to purchase electricity produced by renewable energy sources The Energy Law obliges power system operators and energy supply companies selling energy to end customers to fulfil a specified quota of certificates of origin/green certificates The amount of the quota does not depend on the technology used In 2014 this quota is 13%, up from 12% in 2012, and will increase each year to reach 20% in 2021 All energy companies that sell electricity to final consumers connected to the Polish grid are obliged to obtain certificates of origin to fulfill this quota As an alternative to the certificates, energy companies may pay a substitution fee or penalty The substitution fee is calculated according to a statutory formula and published
every year in March by the national Energy Regulatory Office (ERO)Each year, the substitution fee increases in line with the national inflation rate The value of the substitution fee, hence the reference value of the green certificates, has grown as follows:
Year PLN/MWh EUR/ MWh USD/MWh2008 248.46 59.8 79.42009 258.89 62.3 82.72010 267.95 64.5 85.62011 274.92 62 87.82012 286.74 68.44 92.502013 297.35 70.98 95.92
The reference value of a certificate of origin is set annually by the ERO through the substitution fee, which defines the green certificate price when demand exceeds supply There is no cap on available budget or the volume of new installations, only the quota of RES-E which should be purchased that year The electricity is purchased at the average price of electricity in the previous year These ranged from PLN 197 21/MWh (EUR 47 8/USD 63 8) in 2010, PLN 195/MWh (EUR 47 19/USD 63) in 2011, to PLN 201,36/MWh (EUR 48 06/USD 64 96) in 2012 The collapse of certificate prices at the Polish Power Exchange began towards the end of 2012 contributed to a number of projects in the development phase being put on hold, and created challenges for the viability of many existing wind farms This price collapse revealed the weakness of the current support model and the need for a thorough overhaul, and
Shares of RE installed capacityBiogas2.94%
PV0.03%
Hydro17.60%
Wind61.51%
Biomass17.91%
Source: PWEA

65GWEC – Global Wind 2013 Report P OL A N D
not only for its extension Available statistics and analyses show that more than 40% of the renewable energy support scheme is currently taken-up by co-firing facilities This is the main reason for the over-supply of certificates of origin Furthermore, the support level currently received by that technology is seen to be excessive and disproportionate However, this support system is likely to change The proposed draft Renewable Energy Sources Act, which is currently under review, will introduce an auctioning based support mechanism
RES LAW IN TRANSITION
In order to meet the EU Renewables Directive target, Poland must source 15% of its final energy demand from renewable sources by 2020, up from 7 2% in 2005 In 2011, the Polish government submitted its National Renewable Energy Action Plan (NREAP) to the European Commission, anticipating a 15 5% share by 2020 The NREAP is based on ‘Energy Policy of Poland up to 2030’ strategy, which was released in 2009; and on a detailed study on renewable energy resources in the country Wind is the fastest growing renewable energy source in Poland and it is expected to contribute about half of the renewable electricity required to reach the 2020 target The NREAP target projects that wind power will reach 6,550 MW by 2020, including 500 MW offshore and 550 MW in small installations The latest concept for the support mechanism for renewable energy sources provides for a transition from the tradable certificates system to an auction based system Under the new system, support will be granted for each project separately, by way of an auction conducted by the President of the Energy Regulatory Office The auction system will tender for a number of MWh generated The support will be offered for 15 years to bids with the lowest price Every year the amount of energy purchased from eligible projects will be determined, taking account of the demand for energy from renewable energy sources and the upper limit of support for the eligible projects Only advanced projects that have passed a prequalification procedure would be allowed to participate in the auction Investors will have to demonstrate a project’s compliance with the local zoning
plan, must have all the administrative approvals as required by law Bids exceeding the so-called reference prices, that will be determined for individual technologies and installation capacities, will be rejected
OUTLOOK FOR 2014 AND BEYOND
Poland is set to continue its healthy wind power development pathway with an average annual growth of 500 MW, in line with the government’s commitment of reaching 6,550 MW by 2020 However, some of the changes that are being considered under the current work on the draft RES Act raise concerns within Poland’s wind industry, as they could adversely impact wind power development The final provisions of the RES Act will regulate the Polish renewables market and will determine the future of the wind power sector The Act is likely to come into force sometime in 2014
With input from the Polish Wind Energy Association (PWEA)
Poland © GWEC
TOTA L I N S TA L L E D C A PAC I T Y
0500
1,0001,5002,0002,5003,0003,500
year 2001 2002 2003 2004 2005 2006 2007 2008 2009 2010 2011 2012 2013MW 18 59 60 65 84 152 288 451 725 1,180 1,616 2,496 3,390
Source: GWEC

66 GWEC – Global Wind 2013 Report S O U T H A F R IC A
W ind power in South Africa has moved from the planning to the execution phase, scaling up rapidly to
make the country one of the most vibrant wind development areas on the globe The country’s wind resource is exceptional1 Although it took almost a decade for the first 10 MW of wind power to be installed, South Africa’s long-term energy blueprint, the Integrated Resource Plan2 (IRP), gives wind power a significant allocation, about 9,000 MW of new capacity in the period up to 2030 The IRP is presently being updated and clarity about the details of the plan are expected in the second quarter of 2014 Currently, the wind industry in South Africa is looking to develop about 5 GW of wind power by 2019, of which 1,198 MW has reached financial close and the first 634 MW will be commissioned very soon A further 787 MW is approaching financial close These projects comprise the wind component of the first three rounds of the country’s Renewable Energy Independent Power Producer Procurement Programme (REIPPPP)
SOUTH AFRICA’S ENERGY SYSTEM
South Africa has world’s seventh largest coal reserves, so it is no surprise that about 77% of South Africa’s primary energy comes from coal, followed by oil, solid biomass and waste South Africa’s energy balance also includes relatively small shares of natural gas, nuclear, and hydroelectricity South Africa’s dependence on hydrocarbons, particularly coal, has made the country the 12th largest CO2 emitter in the world Electricity prices in recent years have been rising quickly and still face upward pressure, consistently narrowing the difference between the unit cost of wind power and conventional power generation, and in 2013 the price for wind energy dropped well below the cost of new coal power The average selling price of electricity is around ZAR 66 cent/kWh (EUR 4 /USD 5 6 cent) The latest Round 3 of the REIPPPP saw an average price for wind of ZAR 74 cent/kWh (EUR 5/ USD 6 7 cent) New coal-based power from the Eskom’s Medupi power plant is likely to cost ZAR 1 05/kWh (EUR 7/USD 9 7 cent) Much work has been done in synthesising the regulatory framework for renewables; and with a few exceptions it is now largely resolved Wind projects under the REIPPPP sell electricity to the national utility on a 20 year Power Purchase Agreement backed by the national government, with dispatch priority There is draft legislation under consideration for the
creation of an Independent System and Market Operator (ISMO), but the liberalization of the electricity market is unlikely any time soon South Africa’s National Energy Regulator (NERSA), oversees electricity matters in the country, including issues related to pricing and the licensing of electricity generation, transmission and distribution REIPPPP projects are however procured on a competitive tender basis with 70% of the scoring going to price and 30% to socio-economic factors Up to this point all these projects have been licensed by NERSA
MAIN MARKET DEVELOPMENTS IN 2013
By the end of 2013 a total of 1,985 MW of projects had been awarded The top three developers in the market are African Clean Energy Developments (ACED), Mainstream Renewable Power Jeffreys Bay Pty Limited and Windlab The developer with the greatest number of projects with financial closure was Innowind Many of the international turbine manufacturers were involved in the first two procurement rounds including Acciona, Nordex, Siemens, Sinovel, Suzlon and Vestas Procurement rules show a strong desire by the South African government to create high levels of local content
South Africa © SAWEA members
SOUTH AFRICA

67GWEC – Global Wind 2013 Report S O U T H A F R IC A
OBSTACLES TO WIND ENERGY DEVELOPMENT
Some remaining obstacles to the wind industry include:• The IRP (energy master plan until 2030) is reviewed every
two years Until the outcome of the review is settled there won’t be certainty as to whether the present regime will continue in the same form
• Rising thresholds for localisation will create challenges for developers
• To maintain political support for wind power, the industry must continue to deliver on the socio-economic undertakings under the REIPPPP bids (especially rounds 1 and 2)
• Government plans for grid integration issues and the costs thereof are not completely settled as yet
• The costs involved in tendering for the procurement programme are high and create a challenge for smaller players
OUTLOOK FOR 2014 AND BEYOND
The industry in South Africa is in a very rapid growth phase While some setbacks are likely, it seems quite certain that South Africa is moving towards a large wind industry with a domestic installed capacity in excess of 5,000 MW within ten years Moreover, the IPR calls for a total of 9,000 MW by 2030 and with the early signs of market development across southern Africa, South Africa could very well evolve into the hub for manufacturing and development that the industry has been looking forward to for many years
With input from the South African Wind Energy Association (SAWEA)
1 An indicative Wind Atlas of South Africa (WASA) can be consulted for a meso-scale assessment in the southern provinces at www wasaproject info/
2 www energy gov za/IRP/irp%20files/IRP2010_2030_Final_Report_20110325 pdf
South Africa © SAWEA members
TOTA L I N S TA L L E D C A PAC I T Y
2
4
6
8
10
12
year 2002 2003 2004 2005 2006 2007 2008 2009 2010 2011 2012 2013MW 3.16 3.16 3.16 3.16 3.16 3.16 8.36 8.36 10.16 10.16 10.16 10.16
Source: GWEC

68 GWEC – Global Wind 2013 Report S W E DE N
MAIN MARKET DEVELOPMENTS IN 2013
W ind power in Sweden has grown rapidly in recent years, increasing more than tenfold since the introduction
of the green certificate system in 2003 In the last three years Sweden has doubled its wind power capacity In 2013, 724 MW of new onshore wind power was installed in Sweden, bringing the total capacity to 4,470 MW, of which 211 7 MW is offshore, accounting for about 7% of the country’s total electricity consumption, an increase of 2% from 2012 The average size of new turbines installed in 2013 was 2 6 MW with an average expected capacity factor of about 34% The Jädraås wind farm (200 MW), the largest in Sweden and one of the largest onshore farms in northern Europe, was commissioned in 2013 Other large wind projects that came online in 2013 were the Skogberg wind farm with 82 8 MW, Mullberget with 78 MW and Blaiken 2 with 72 MW, along with the only offshore project, the Kårehamn wind farm with 48 MW In 2011, Sweden was divided into four separate bidding areas by the Swedish Transmission System Operator (Svenska Kraftnät) This division identified the areas where the national electricity grid needs to be expanded, and provided a clear indication of areas where increased electricity production is required in order to better meet consumption, thereby reducing the need for transporting electricity over long distances While in northern Sweden (SE1 and SE2 bidding areas) there is a surplus of electricity production, in southern Sweden (SE4 bidding area) the circumstances are reversed The system of different bidding areas helps to ensure that regional market conditions are reflected in the price Due to bottlenecks in the transmission system, the bidding areas may have different prices (i e area prices) When there are constraints in transmission
capacity between two bidding areas, the power will always be transferred from the low price area to the high price area Currently, most of the wind farms in Sweden are located in the SE3 bidding area, where the power consumption is also the highest However, at present there is a concentration of wind farms under construction in the northern part of the country, where larger wind farms are feasible In the next three years it is expected that most of the new installed wind capacity will be in the SE2 bidding area
Support framework for wind energySince January 2012, Sweden has had a joint Electricity Certificate System1 with Norway with a joint target of increasing electricity production from renewable energy sources to 26 4 TWh annually by 2020 The joint market will permit trading in both Swedish and Norwegian certificates,
SWEDEN
Sweden © GWEC
Wind power development and projections up to 2017
02,0004,0006,0008,000
10,00012,00014,00016,00018,000
2008 2009 2010 2011 2012 2013 2014 2015 2016 2017
Annual production [GWh]Total installed capacity [MW]Total number of WTGs
As of 1/1 every year
Expected capacity (MW) per price area 1th of January 2017
0
500
1,000
1,500
2,500
2,000
3,000
SE1
The four bidding (power price) areas in the Swedish Electricity System
SE2 SE3 SE4
Under permission processAll permissions recievedUnder constructionIn operation
1
2
3
4
Source: Svensk Vindenergi

69GWEC – Global Wind 2013 Report S W E DE N
and a generator can receive certificates for renewable electricity production in either country A surplus of certificates occurs if the supply of certificates exceeds demand In general this happens if the development of renewable energy has been faster and electricity demand lower than expected at the time the quotas were set When this happens the development of renewable energy decreases until the price of the certificate reaches again a level that makes investing in renewable energy profitable (in theory) In the previous two years, the price of a certificate reached low levels due to a large surplus of certificates resulting from forecast errors at the time when the Swedish quotas were set However, this has not yet slowed down investment, despite the low price of both electricity and the green certificates One explanation might be that building wind power in Sweden has become much cheaper recently, but also the entrance of larger institutional investors requiring lower returns on investment In order to maintain balance in the system and to ensure that the 2020 renewables target is met, the Swedish Energy Agency proposed technical quota adjustments in February 2014 with the first adjustment expected to take place in 2016
NEW POLICY DEVELOPMENTS IN 2013
In addition to the proposal for new quotas for the green certificate system, the government has published a proposal to overcome a problem linked to grid connection - the so-called ‘threshold’ effect At present grid operators are obliged to connect wind power plants and reinforce the grid if necessary The most problematic issue regarding grid connection is the threshold effect, which occurs if ‘large’ grid reinforcement is required In that case the operator of the new plant to be connected must bear the entire costs of the ‘large’ grid investment This causes delays in wind development, as many developers are reluctant to be the first to be connected to the grid and to bear all the costs The new proposal suggests that the TSO estimates how much wind power is expected to be built in a certain area and plans grid development accordingly Each developer in that area must only pay for part of the grid development In practice,
this means that the TSO will grant an advance loan for the necessary grid development for a specific area and eventually the costs will be split among the connected wind farm owners
OBSTACLES TO WIND ENERGY DEVELOPMENT
Grid: The high penetration of wind power in the northern part of Sweden will further increase the load on already congested transmission corridors, particularly between price areas 2 and 3 The Swedish TSO has, however, already decided to start reinforcing these sections In the long run further integration with the European continental grid will also be necessary in order to avoid
“locking in” scenarios for Nordic wind power However, in the short and medium term, Sweden’s substantial hydropower capacity is well suited to regulate the increasing wind power production in the country Offshore wind power: Due to lack of a sufficient support system for offshore wind power in Sweden, new development is currently difficult Only some near shore wind projects (such as Kårehamn) can be developed within the current support system Therefore, the introduction of an additional support regime for offshore wind power is necessary if it is to grow substantially in Sweden
OUTLOOK FOR 2014 AND BEYOND
Sweden expects a record year of installations in 2014 with 1 GW of new capacity After 2014, much depends on the new quotas; if the technical adjustments of the quotas are insufficient, Sweden will most likely face a sharp slowdown in wind development and renewable energy in general for the next 3 to 4 years If sufficient adjustments are made, about 20 TWh of wind power production could be reached in Sweden by 2020, which is twice as much as today
With input from the Swedish Wind Energy Association, Svensk Vindenergi
1 See further information about the Swedish/Norwegian support system at: www energimyndigheten se/en/Sustainability/The-electricity-certificate-system/
TOTA L I N S TA L L E D C A PAC I T Y
0
1,000
2,000
3,000
4,000
5,000
year 2001 2002 2003 2004 2005 2006 2007 2008 2009 2010 2011 2012 2013MW 295 345 404 474 531 595 831 1,048 1,560 2,163 2,901 3,746 4,470
Source: GWEC

70 GWEC – Global Wind 2013 Report T U R K E Y
TURKEY
RECENT MARKET DEVELOPMENTS
Turkey added 646 MW of new wind power capacity in 2013 for a total of 2,959 MW Turkey’s installed capacity
has grown at over 500 MW per year since 2010 and Turkey’s National Transmission Company expects annual installations to reach 1,000 MW per year from 2014 onwards The Turkish market at present has a large pipeline of projects The Turkish Wind Energy Association estimates that under the current regulatory framework a total installed capacity of about 10 5 GW will be reached within the next 10 years, but it could be as high as 20 GW with the right amendments to the regulatory framework Regardless, Turkey’s vast wind resources are likely to attract significant investment in the coming years
Turkey’s best wind resources are located in the provinces of Çanakkale, Izmir, Balıkesir, Hatay and Istanbul As of the end of 2013, the Aegean region had the highest installed wind capacity with a total of 1,210 MW, followed by the Marmara region with 1,054 MW and the Mediterranean region with 435 MW The Turkish wind market is mostly dominated by local developers The three leading players in the Turkish wind market are Polat Energy (326 MW), Demirer Holding (314 MW) and Bilgin Energy (295 MW), followed by Enerjisa A S (211 MW) and Aksa Energy (187 MW) Turkey has one of the fastest growing power markets in the world and up until now it has not seen any adverse impacts from the global financial crisis With very limited oil and gas reserves, Turkey is increasingly turning into renewable energy sources to improve its energy security, and seeking to provide 30% of its electricity from renewable energy by 2023 However, to match the rapidly growing energy demand, more investments are needed
SUPPORT FRAMEWORK FOR WIND ENERGY
Turkey’s Renewable Energy Law (No 5346 dated 18th May 2005) was amended in December 2010 and the notification was issued on 8th January 2011 (Law No: 6094) After the amendment of the law the feed-in tariff was set at USD 7 3 cent/kWh (EUR 5 4 cent) for wind power, for a period of ten years and will apply to power plants that come into operation before 1st January 2016 The RE Law allows for an additional bonus of up to USD 3 7 cent (EUR 2 74 cent) for using locally manufactured components for up to five years Wind power
producers are also free to sell to the national power pool or engage in bilateral power purchase agreements Another incentive is the 85% discount for the right of use or right of easement on State owned land for transportation and transmission These incentives apply to facilities that commence operations before 1st January 2016 The discount will apply during the first ten years after the establishment of the wind farm The amended law also allows for the construction of renewable energy power projects in national and natural parks, protected regions, conserved forests, wildlife development zones, special environmental protection zones and natural protected areas, provided that the necessary permissions are obtained from the Ministry of Environment and/or regional protection boards
NEW POLICY DEVELOPMENTS IN 2013
A new Energy and Electricity Market Law was initially published on March 30, 2013 in the Official Gazette, repealing the previous Electricity Market Law of 3rd March 2001 According to the new law, the new Electricity Market License Communiqué entered into force on 2nd of November 2013 Under this Communiqué, there are now two stages for the licensing procedure: pre-license; and license In the pre-license period, applicants are given a maximum of 24 months to seek the necessary permits for urban planning, construction, land acquisition etc If the necessary permits cannot be obtained over a period of 24 months, or the requirements specified by Turkey’s Electricity Market Regulatory Authority (EMRA) cannot be fulfilled, the applicant will not be granted an electricity generation license1
›To ensure Turkey’s energy security, steps have to be taken in the medium and long-term for continued energy resource diversification. The Turkish Wind Energy Association expects the market to reach an installed capacity of 3,800 MW by the end of 2014 and 5,000 MW by 2015.‹

71GWEC – Global Wind 2013 Report T U R K E Y
Another change under the Electricity Market License Communiqué is related to transformer capacity, which is established on a regional basis The Turkish Electricity Transmission Company (TEİAŞ) will announce this capacity, which determines how much wind power can be connected to the regional grid system, every year on a fixed date
OUTLOOK FOR 2014 AND BEYOND
One of the objectives set out in the 2009 Electric Energy Market and Supply Security Strategy Paper for Wind Energy is to reach a total installed capacity of 20 GW by 2023 To ensure Turkey’s energy security, steps have to be taken in the medium and long-term for continued energy resource diversification
The Turkish Wind Energy Association expects the market to reach an installed capacity of 3,800 MW by the end of 2014 and 5,000 MW by 2015 To ensure that these interim targets are met, the transmission system operator has announced investments in grid reinforcements in the period from 2014 to 2020 Presently, Turkey is one of the biggest on-shore wind markets in Europe with an 11 GW pipeline of wind power projects
With input from the Turkish Wind Power Association (TUREB)
1 http://www renewableenergyworld com/rea/news/article/2013/11/developments-progress-in-turkeys-renewable-energy-market
Turkey © GWEC
TOTA L I N S TA L L E D C A PAC I T Y
0
5,00
1,000
1,500
2,000
2,500
3,000
year 2001 2002 2003 2004 2005 2006 2007 2008 2009 2010 2011 2012 2013MW 19 19 20 20 20 51 147 458 801 1,329 1,806 2,312 2,959
Source: GWEC

72 GWEC – Global Wind 2013 Report U K R A I N E
UKRAINE
Ukraine has excellent wind resources, which, coupled with the existing transmission infrastructure and load
requirements, would allow significant wind development in the country The windiest regions of Ukraine are located along the Black Sea coast, mainly in Crimea, along the southern coast of Ukraine in the Donbass region, as well as along the Dniper river in Central Ukraine and in the Carpathians
MAIN MARKET DEVELOPMENTS IN 2013
Ukraine installed 95 MW of new wind power capacity in 2013, bringing its total up to 473 MW, out of which 371 MW were connected to the national electricity grid This represents a cumulative growth of 34 4% compared to the 276 MW of total capacity at the end of 2012, making Ukraine once again the leader in wind power among the CIS countries1 In 2013, wind power generated more than 630,000 MWh and
supplied 0 33% of the country’s total electricity demand, avoiding 512,000 tons of CO2 emissions The driving force for wind development in the country is currently the favorable legislation and, in particular, the Green Tariff Law At present the top two producers in Ukraine are the Wind Parks of Ukraine with 188 MW and Wind Power (DTEK), whose 120 MW Botievskaya wind farm in the Zaporozhye region is the largest wind farm in the country In 2013, 35 new Vestas V-112 wind turbines were erected in the Botievskaya wind farm, out of which nine turbines were fully grid connected as of the end of December 2013 When completed, the installed capacity of the Botievskaya will reach 200 MW Two further 3 MW Vestas V-112 wind turbines were commissioned at the Novorossiyskaya wind farm by developer Vindktaft Ukraina
SUPPORT FRAMEWORK FOR WIND ENERGY
The electricity generated by renewable energy sources is supported by feed-in tariffs (“green tariffs”) The law was introduced in 2009 and is applicable until 1 January 2030 According to the legislation, the feed-in tariff rate for turbines of more than 2 MW is set at a minimum of EUR 0 113 per kWh The amount of the feed-in tariff varies depending on when the wind farm comes into operation, and after 2014, 2019 and 2024 the tariff will decrease by 10%, 20% and 30% respectively
From January 2013, the feed-in tariff is eligible only to projects which meet the local content requirement (LCR) In July 2013, a new principle was added to the Green Tariff Law, changing the way in which content is calculated, including a list of elements and operations that need to be carried out domestically with a specific share of local content to each component in a facility From 1 July 2013, the share of domestic components had to be at least 30%, rising to a minimum of 50% on 1 July 2014
Local Component Elements
Operations to be performed in Ukraine
Fixed share, %
Rotor blades Manufacturing 15Tower Manufacturing 15Nacelle Assembly 30Main frame Manufacturing 5Main shaft Manufacturing 5Rotor Manufacturing (casting) 5
Assembly 5Construction works Performance 20Total 100
UKRAINIAN ELECTRICITY MARKET
The Ukrainian energy sector is regulated by the National State Energy Regulation Implementing Commission (NERC) It sets tariffs and issues licenses for electricity generation, transmission and distribution
Installed capacity by region in 2013 (MW)Khershon 12.2Kiev 0.6
Lugansk 25
Nikolaev 37.5
AR Crimea 87.5 Donetsk 88.03
Zaporoshye 120
Source: UWEA
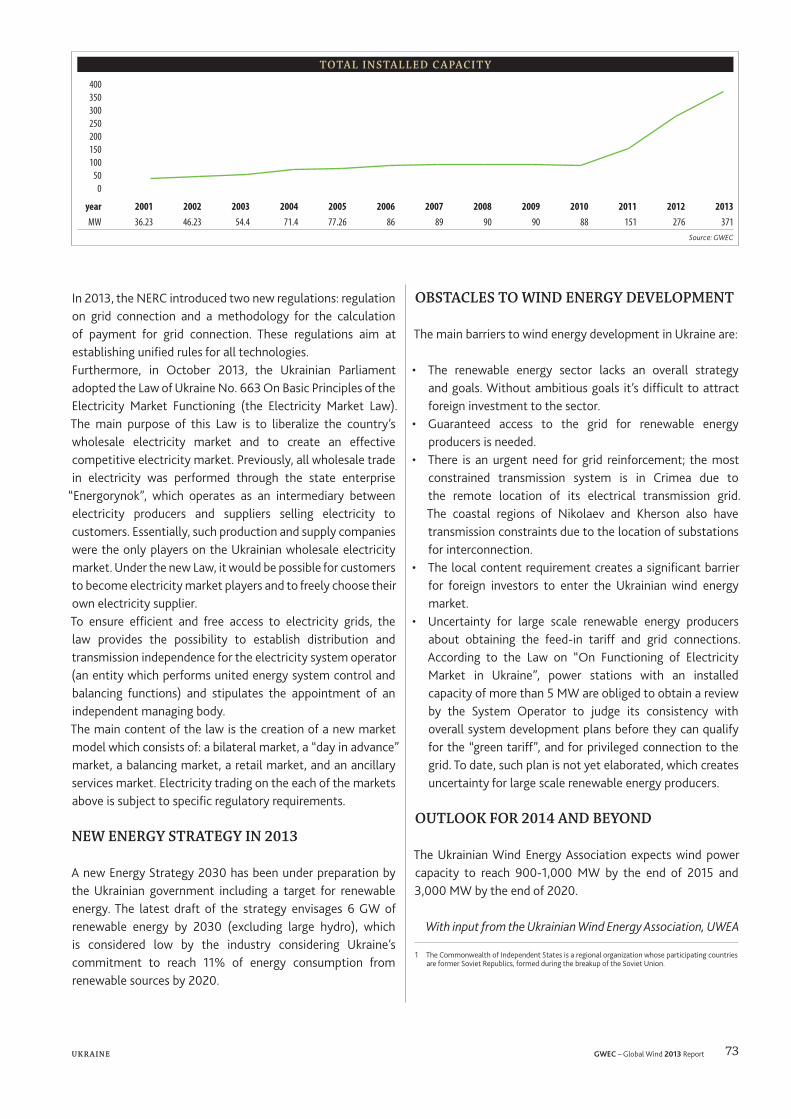
73GWEC – Global Wind 2013 Report U K R A I N E
In 2013, the NERC introduced two new regulations: regulation on grid connection and a methodology for the calculation of payment for grid connection These regulations aim at establishing unified rules for all technologies Furthermore, in October 2013, the Ukrainian Parliament adopted the Law of Ukraine No 663 On Basic Principles of the Electricity Market Functioning (the Electricity Market Law) The main purpose of this Law is to liberalize the country’s wholesale electricity market and to create an effective competitive electricity market Previously, all wholesale trade in electricity was performed through the state enterprise
“Energorynok”, which operates as an intermediary between electricity producers and suppliers selling electricity to customers Essentially, such production and supply companies were the only players on the Ukrainian wholesale electricity market Under the new Law, it would be possible for customers to become electricity market players and to freely choose their own electricity supplier To ensure efficient and free access to electricity grids, the law provides the possibility to establish distribution and transmission independence for the electricity system operator (an entity which performs united energy system control and balancing functions) and stipulates the appointment of an independent managing body The main content of the law is the creation of a new market model which consists of: a bilateral market, a “day in advance” market, a balancing market, a retail market, and an ancillary services market Electricity trading on the each of the markets above is subject to specific regulatory requirements
NEW ENERGY STRATEGY IN 2013
A new Energy Strategy 2030 has been under preparation by the Ukrainian government including a target for renewable energy The latest draft of the strategy envisages 6 GW of renewable energy by 2030 (excluding large hydro), which is considered low by the industry considering Ukraine’s commitment to reach 11% of energy consumption from renewable sources by 2020
OBSTACLES TO WIND ENERGY DEVELOPMENT
The main barriers to wind energy development in Ukraine are:
• The renewable energy sector lacks an overall strategy and goals Without ambitious goals it’s difficult to attract foreign investment to the sector
• Guaranteed access to the grid for renewable energy producers is needed
• There is an urgent need for grid reinforcement; the most constrained transmission system is in Crimea due to the remote location of its electrical transmission grid The coastal regions of Nikolaev and Kherson also have transmission constraints due to the location of substations for interconnection
• The local content requirement creates a significant barrier for foreign investors to enter the Ukrainian wind energy market
• Uncertainty for large scale renewable energy producers about obtaining the feed-in tariff and grid connections According to the Law on “On Functioning of Electricity Market in Ukraine”, power stations with an installed capacity of more than 5 MW are obliged to obtain a review by the System Operator to judge its consistency with overall system development plans before they can qualify for the “green tariff”, and for privileged connection to the grid To date, such plan is not yet elaborated, which creates uncertainty for large scale renewable energy producers
OUTLOOK FOR 2014 AND BEYOND
The Ukrainian Wind Energy Association expects wind power capacity to reach 900-1,000 MW by the end of 2015 and 3,000 MW by the end of 2020
With input from the Ukrainian Wind Energy Association, UWEA
1 The Commonwealth of Independent States is a regional organization whose participating countries are former Soviet Republics, formed during the breakup of the Soviet Union
TOTA L I N S TA L L E D C A PAC I T Y
050
100150200250300350400
year 2001 2002 2003 2004 2005 2006 2007 2008 2009 2010 2011 2012 2013MW 36.23 46.23 54.4 71.4 77.26 86 89 90 90 88 151 276 371
Source: GWEC

74 GWEC – Global Wind 2013 Report U N I T E D K I N G D OM
UNITED KINGDOM
W ith its extensive wind resources the UK is the world leader in offshore wind development, although large-
scale onshore sites have by now mostly been completed In 2013, wind power supplied on average about 5-6% of the country’s total electricity demand
MAIN MARKET DEVELOPMENTS IN 2013
The total market size for the UK is currently just over 10 5 GW, spread over 557 wind farms and over 5,327 turbines 105 onshore wind farms and four offshore sites - London Array, Lincs, Teesside & the Gunfleet Sands demonstration projects
- came online in 2013 for an annual market of 1,883 MW, of which 733 MW was offshore The two biggest onshore sites in the UK were Fallago Rig with 144 MW and 48 turbines, and Whitelee Phase 2 Extension with 109 MW and 39 turbines respectively Major manufacturing capacity was added in 2013 in both small and medium wind sectors with Hutchinson Engineering, who
supply towers for medium size turbines, and Endurance Wind Power, who manufacture small wind turbines In addition, TAG Energy on Teesside secured its first offshore wind order, providing monopiles for the E ON Humber Gateway Project February 2013 also saw the completion of the £50mn (EUR60 7 mn/USD 83 3 mn) logistics facility in Belfast Harbour for DONG Energy and ScottishPower Renewables, supporting up to 300 long term jobs The top four market players in the UK for 2012-2013 were: Siemens (25%), Vestas (22%), Senvion (13%) and Alstom (13%) The ongoing financial and economic difficulties across Europe have made it difficult for some wind projects to proceed in the UK This has been coupled with the Electricity Market Reform (EMR) process which was legislated for via an Energy Act and completed just before the end of 2013 This will change the entire financial support system in the UK, with the Renewables Obligation (RO) being phased out to new entrants by 2017 and the Contract for Difference being introduced from 2014 As a result, two planned offshore wind projects - Argyll Array and Atlantic Array - were halted in 2014
SUPPORT FRAMEWORK FOR WIND ENERGY
The Renewables ObligationThe UK’s RO has been the main financial instrument for stimulating growth in renewable energy since 2002, but will be replaced by the Contracts for Difference (CfD) in 2014
The RO requires power suppliers to derive a specified portion of the electricity they supply to customers from renewable sources Eligible renewable generators receive Renewables Obligation Certificates (ROCs) for each MWh of electricity generated and these certificates can then be sold to power suppliers in order to meet their obligation According to the latest figures approximately 50% of the total ROCs go to onshore and offshore wind developments Following an onshore wind cost review which took place in 2013, support levels were retained at 0 9 ROC/MWh This level is consistent throughout the United Kingdom, although when the contract for difference is introduced there will be a higher rate for onshore Scottish Island projects, due to their economics There are also plans for offshore wind support levels to be brought down from 2 to 1 9 ROC/MWh for new projects coming online in 2015/16, and to 1 8 ROC/MWh for projects coming on line in 2016/17
The feed-in tariff for small renewable energy systemsIn 2010, the government introduced its long-awaited feed-in tariffs for renewable energy projects up to 5 MW, helping to stimulate a significant increase in domestic and small-scale deployment of renewable energy systems The feed-in tariffs, in the form of a premium to the power price, were set at 34 5 pence (EUR 41 cents/USD 56 cents) per kWh for installations smaller than 1 5 kW, dropping to 4 5 pence (EUR 5 3 cents/USD 7 3 cents) per kWh for installations of 1 5-5 MW This has stimulated the installation of more than 17,000 small and medium wind systems across the UK The feed-in tariff rates were revised and reduced in July 20121 and degression triggers were introduced
NEW POLICY DEVELOPMENTS IN 2013
The UK Government is committed to sourcing 15% of its energy from renewables by 2020 under the 2009 Renewable Energy Directive
Energy ActThe Energy Act which will implement the new support system for all forms of low carbon technologies from 2017 onwards was passed in December 2013 The Act changes the support for renewables from a fixed certificate price to a guaranteed strike price for their power, with a levy on energy bills funding the difference payments from a day-ahead reference price The contracts are also reduced to 15 years compared to the Renewables Obligation’s 20 year run

75GWEC – Global Wind 2013 Report U N I T E D K I N G D OM
Community BenefitsFollowing an Onshore Wind Call for Evidence launched by the Department of Energy and Climate Change a recommendation was made that new onshore wind farm projects of above 5 MW should contribute £5,000 (EUR 6,070/USD 8,347) per MW per year to the local community RenewableUK subsequently revised its community benefit protocol to suggest all wind farms which were yet to gain consent should provide £5000 per annum per MW installed
Planning PolicyNew guidance was issued clarifying that landscape and visual effects needed to be taken into consideration
Offshore Wind Industrial StrategyIn August 2013 the UK Deputy Prime Minister launched the Offshore Wind Industrial Strategy This document aims to ensure that the maximum economic benefit can be derived for the UK supply chain from the development of offshore wind and announced a number of support programmes, including the Grow: offshore wind supply chain project2, in which RenewableUK is a partner
Green Deal LaunchThis scheme offers financial incentives for both insulation and micro technology such as small wind turbines
Electricity Market Reform Delivery PlanLinked to the Energy Act (above) this confirms the future strike prices for each technology and also the concept of auctions for more developed technologies
MAIN OBSTACLES TO WIND ENERGY DEVELOPMENT
Within the UK there is an increasingly well-organised opposition to wind power, onshore in particular, that is leading to political and media debate In addition, there has been much policy disruption this year, due to the new Energy Act and also to a review of financial support for onshore
wind in the short-term While delays in planning have been reduced, time for decisions is still too long, and issues around aviation are still not yet fully resolved In addition, the grid needs to be strengthened to accommodate renewable energy and the economic situation dictates that costs need to be reduced, particularly for offshore, which has faced challenges in attracting sufficient levels of financing
OUTLOOK FOR 2014 AND BEYOND
With the Energy Act now passed, and decisions taken on project qualification for investment, the economic climate is likely to become more attractive for investors However, the General Election in the UK in May 2015 is expected to heat up debate around wind energy in the second half of 2014, following local and European Elections
With input from RenewableUK
1 http://www renewableuk com/en/our-work/current-priorities/getting-the-feedintariff-right- cfm2 http://www growoffshorewind com
Burbo Bank, Liverpool Bay © RenewableUK
TOTA L I N S TA L L E D C A PAC I T Y
0
2,000
4,000
6,000
8,000
10,000
12,000
year 2001 2002 2003 2004 2005 2006 2007 2008 2009 2010 2011 2012 2013MW 474 552 648 888 1,353 1,968 2,428 3,161 4,257 5,259 6,593 8,649 10,531
Source: GWEC

76 GWEC – Global Wind 2013 Report U N I T E D S TAT E S
UNITED STATES
WIND ENERGY MARKET IN 2013
The US wind industry powered through a tough 2013, a year for change and transformation With many major
national players announcing new contracts and expanding their operations, and big names in the technology sector adding wind power to their balance sheets, the US wind industry is set for an exciting and productive 2014 The more than 61 1 gigawatts of total installed wind power as of 2013 made up an important part of the US power supply last year, with wind actively supporting the grid both in day-to-day operations and in times of extreme stress on the power system The current operating fleet of wind capacity in the US can power the equivalent of more than 15 million average American homes At the end of 2013 there was more wind power under construction than ever before: over 12,000 MW of new generating capacity was under construction, with a record-breaking 10,900 MW starting construction during the fourth quarter At least 60 long-term contracts for wind energy for nearly 8,000 MW were signed by electric utilities and large corporate purchasers The record growth for wind energy at the end of 2013 resulted not only from the extension of the Production Tax Credit (which provides up-front tax relief of USD 2 3 cents per kilowatt-hour (EUR 1 67/kWh) for the first 10 years of a project), but also from investments in technological
advancements that have driven down the cost of wind energy by 43% in just four years
RECENT POLICY DEVELOPMENTS
Question marks throughout 2012 surrounding the pending extension of the federal Production Tax Credit (PTC), which caused the industry supply chain and project development pipeline to drastically slow down, meant manufacturers and developers had to work especially hard to ramp back up and secure new growth The US wind industry installed 1,084 MW during 2013, a 92% drop in new installations compared to 2012, primarily due to policy uncertainty over this key tax incentive A one-year PTC extension did eventually come, but not until the day after its expiration, on 1 January 2013 Fortunately, following 2012’s dramatic slowdown in the supply chain (even as the industry’s project side turned in record completion numbers that year because of the looming PTC expiration), the industry was able to secure important changes in the eligibility rules for the PTC, helping to offset the uncertainty associated with 2012’s last-minute renewal With these changes in place, projects that started construction in 2013 will qualify for the PTC even beyond 2014 And in another sign of the industry’s strength, last year saw a record number of power purchase agreements signed, as utilities continued to display ever-increasing understanding of wind power’s cost-competitiveness and ease of integration onto the grid
US © Jeff Schwane / AWEA

77GWEC – Global Wind 2013 Report U N I T E D S TAT E S
Heading into 2014, the industry’s supply chain is flush with orders, with the change in the PTC language helping to drive growth; developers rushed to break ground on projects before the end of 2013 to qualify While the if and when of overall tax reform remains undecided in Congress, the industry must secure the PTC’s passage (and its sister legislation, the Investment Tax Credit, an important incentive for the offshore sector) in order to ensure the certainty necessary for the industry to continue to support the tens of thousands of jobs in more than 550 manufacturing facilities Signals of the industry’s strength came via news on several other fronts in 2013 Major players in the energy and tech industries showcased the power of wind as an affordable, fuel-free resource during 2013, with announcements from Facebook, Microsoft, and Google, all concerning commitments to build wind-powered datacenters Moreover, billionaire investor Warren Buffet’s MidAmerican Energy, a Midwestern energy giant, announced its intention to invest more than USD 1 9 billion (EUR 1 38bn) in wind power in Iowa, signaling to investors that even while the industry is subject to the booms and busts of Congress’s unpredictability on the PTC, wind power is an important and growing feature of the US energy landscape With major corporations and institutional investors showcasing their confidence in wind energy, it is no wonder
that US wind power has attracted an average investment of USD15 billion (EUR 10 9bn) annually in recent years At the state level, renewable portfolio standards (RPS) have helped drive the build-out of renewable energy projects Twenty-nine states and the District of Columbia have established RPS programmes, requiring a targeted amount of energy to come from renewable sources The RPS is a significant driver of wind energy development in the US, and wind power has fulfilled 86% of RPS requirements through 2011 This year, numerous challenges to already-established RPS laws were successfully rebuffed, underscoring those laws’ popularity, and state governments continue to embrace renewable energy as an important way to grow their economies through new manufacturing, jobs, and private investment
OUTLOOK FOR 2014 AND BEYOND
A few states stand out as role models for the country, powering past old records and setting new standards for renewable energy sources across the United States One particular day in May 2013, Colorado set a new record by producing over 60% of its electricity from wind In Texas, wind power is approaching 10% of the state’s total electricity generation Iowa is producing 25% of its power from wind, and overall, nine states obtain 10% or more of their electricity from wind energy Wind power is more affordable than ever, having established itself as an important part of the American energy landscape, but there is still much to do Further extension of the PTC represents an important hurdle to clear in the coming months while Congress debates whether or not to take up comprehensive tax reform The industry will continue to see challenges to state RPS laws from well-funded and well-equipped opponents, but remains confident in the renewables sector’s ability to successfully repel any serious attacks The industry kept its cool during last year’s significant slowdown, and entered 2014 with a strong lineup of projects under construction and a supply chain that is once again humming strong
With input from the American Wind Energy Association (AWEA)
TOTA L I N S TA L L E D C A PAC I T Y
01,00002,00003,00004,00005,00006,00007,00008,0000
year 2001 2002 2003 2004 2005 2006 2007 2008 2009 2010 2011 2012 2013MW 4,275 4,685 6,372 6,725 9,149 11,575 16,824 25,076 35,086 40,298 46,929 60,007 61,091
Source: GWEC
›The more than 61.1 gigawatts of total installed wind power made up an important part of the US power supply last year. The current operating fleet of wind capacity in the US can power the equivalent of more than 15 million average American homes.‹

ABOUT GWECGWEC is a member-based organisation that represents the entire wind energy sector The members of GWEC represent over 1,500 companies, organisations and institutions in more than 70 countries, including manufacturers, developers, component suppliers, research institutes, national wind and renewables associations, electricity providers, finance and insurance companies
Our mission is to ensure that wind power establishes itself as the answer to today’s energy challenges, providing substantial environmental and economic benefits:
While there is wind power in more than 80 countries, it is important for the industry’s growth to keep expanding GWEC works with national and international policy makers and industry associations to help open new markets for wind power i e UNFCCC, the IEA, international financial institutions, the IPCC and IRENA GWEC has a proven track record of success in helping to build the wind power industry in emerging markets around the world, including China, Brazil, Mexico, South Africa, and India
Do your part to build the wind industry and join GWEC today!
GWEC membership benefitsKnowledge that you are supporting the growth of the industry, which directly relates to sales opportunities for your company
Input into how we communicate the benefits of wind power to national governments, policy makers and international institutions
Access to first-hand market analysis – we provide authoritative research and analysis on the wind power industry around the world
Exclusive networking opportunities, including contacts with companies, national governments and trade associations around the world, which helps GWEC members stay one step ahead of the competition
Speaking opportunities at leading industry events attended by government officials and influential industry players
Optimisation of your marketing budget with discounts to events (booths and delegate passes) and on advertising in major industry media
For more information, please contact:Global Wind Energy CouncilHeadquartersRue d’Arlon 801040 BrusselsBelgium
Tel +32 2 213 18 97Fax +32 2 213 18 90info@gwec net
Text edited by Lauha Fried, Steve Sawyer, Shruti Shukla and Liming QiaoLayout Bitter GrafikCover photo Anholt Wind Farm © Siemens
›GWEC is incredibly influential. You might not be aware of this, but these guys single-handedly opened up the Latin American market for wind, and all developments we’re seeing there are a direct result of this work.‹ Stewart Mullin, Siemens
Find out more about GWEC’s policy work, publications, events and other membership benefits on our website www.gwec.net

DISCOUNT FOR
MEMBERS AT
GWEC EVENTS!
GWEC – opening up the frontiers
follow us on
GWEC events – organised by the industry… for the industry
Join us today www.gwec.net
GWEC_Advert02_A4.indd 1 31.03.14 13:38

80 GWEC – Global Wind 2013 Report T H E E U ROPE A N U N ION
CHAPTER HEADLINE