h. l 2004 - 2008 annual report 08 · annual report 08 the specialist in psychiatry and pioneer in...
TRANSCRIPT

AnnuAlREPORT
08
The specialist in psychiatryand pioneer in neurology
Photos
Patient photos: Joachim Ladefoged and Simon Ladefoged.All patients have had their photos taken after preceding agreement. The patients have no connection to Lundbeckor to pharmaceuticals marketed by Lundbeck. Other photos: Joachim Ladefoged, Simon Ladefoged and Ricky John Molloy.
H. Lundbeck A/S
Ottiliavej 9
2500 Copenhagen - Valby
Denmark
Corporate Reporting
Tel. +45 36 30 13 11
Fax +45 36 30 19 40
www.lundbeck.com
CVR nr. 56759913
2008 2007 2006 2005 2004 2008 2008 DKKm DKKm DKKm DKKm DKKm EURm1 USDm2
Revenue 11,282 10,985 9,221 9,070 9,733 1,513 2,219
Research and development costs 2,992 2,187 1,958 1,782 1,776 401 589
Profit from operations 2,352 2,695 1,784 2,170 2,554 315 463
Net financials (185) (50) (64) 108 16 (25) (36)
Profit for the year 1,510 1,770 1,107 1,574 1,689 202 297
Total assets 12,607 12,326 11,631 11,628 11,509 1,692 2,385
Equity 7,592 7,185 6,765 7,492 7,839 1,019 1,437
Cash flows from operating and investing activities 2,193 1,610 1,633 1,587 884 294 431
Property, plant and equipment investments, gross 229 474 567 447 305 31 43
% % % % % % %
EBIT margin 20.8 24.5 19.3 23.9 26.2 20.8 20.8
Return on capital employed 29.8 34.9 25.2 32.0 37.0 29.8 29.8
Return on equity 20.4 25.3 15.6 20.7 23.2 20.4 20.4
Research and development costs as a percentage of revenue 26.5 19.9 21.2 19.6 18.2 26.5 26.5
Solvency ratio 60.2 58.3 58.2 64.4 68.1 60.2 60.2
Capital turnover 89.5 89.1 79.3 78.0 84.6 89.5 89.5
DKK DKK DKK DKK DKK EUR1 USD2
Earnings per share (EPS)3, 4 7.67 8.63 5.24 7.04 7.42 1.03 1.51
Diluted earnings per share (DEPS)3, 4 7.67 8.63 5.23 7.02 7.42 1.03 1.51
Proposed dividend per share3 2.30 2.56 1.57 2.10 2.21 0.31 0.45
Cash flow per share3 14.12 13.18 6.59 9.20 11.62 1.89 2.78
Net asset value per share3 38.71 35.81 32.40 33.99 34.21 5.20 7.32
Market capitalisation (million) 21,657 28,605 33,060 29,630 28,517 2,907 4,098
Average number of employees 5,208 5,134 5,111 5,022 5,155
1) Income statement items are translated using the average EUR exchange rate for the year (745.58). Balance sheet items are translated at the EUR exchange
rate on 31 December 2008 (745.06). 2) Income statement items are translated using the average USD exchange rate for the year (508.38). Balance sheet items are translated at the USD exchange
rate on 31 December 2008 (528.49). 3) The calculation is based on a share denomination of DKK 5. 4) Calculated according to IAS 33 Earnings per share.
Financial highlights 2004 - 2008
H. LU
ND
BECK A
/S AN
NU
AL REPO
RT 2008
Frontpage
Denmark (depression)
Tove is out for a walk in a
park in inner Copenhagen.
Page 7
Mexico (depression)
Javier with his wife
on a cold winter day
in Mexico City.
Page 17
Malaysia (schizophrenia)
Rajesh in his room in
a treatment center in
Kuala Lumpur.
Page 21
Denmark (Alzheimer's
disease)
Ry in a quiet moment
in the day centre, where
he meets with other
patients.
Page 25
Malaysia (schizophrenia)
Seniwati sweeps the floor
in her room in a hospital
in Johor Bahru.
Page 31
Malaysia (depression)
Chia works as a tailor in
a hospital in Johor Bahru.
Page 1
Denmark (Parkinson's
disease)
Just makes gymnastic
exercises in a hot water
basin to relieve his
symptoms.
Page 35
Mexico (depression)
Yolanda looks over
Mexico City from a tall
office building.
Page 36
Mexico (depression)
Javier in a coffee shop
in Mexico City.
Page 40
China (Alzheimer's
disease)
Zhongying enjoys a
cup of coffee in a cafe
in Beijing.
AnnuAlREPORT
08

Depression and anxiety • Depression is a common and partly hereditary
disease with symptoms such as melancholy, loss of energy, difficulty concentrating and sui-cidal thoughts. Patients have trouble holding onto their job, keeping up with their studies and/or maintaining their family life and social contacts.
• The neurotransmitter serotonin transmits nerve impulses from one nerve ending to an-other. Too little serotonin can trigger a depres-sive episode.
• The disorder is categorised as either mild, moderate or severe, which refers to the inten-sity of the symptoms. Depression can strike anyone, but certain social and biological fac-tors make some people more predisposed to this disorder than others.
• There is a close correlation between depres-sion and anxiety disorders such as generalised anxiety, panic disorder and social anxiety symptoms. Nearly all patients suffering from depression also suffer from anxiety, and more than half of those who suffer from anxiety also suffer from another psychiatric disorder, pri-marily depression.
Psychotic disorders • Schizophrenia is the most common psychotic
disorder and may lead to pronounced changes in the patient's way of thinking and perception of the outside world. Affecting about 1% of the population, the disorder often starts in late adolescence. Suicide is a major cause of pre-mature deaths.
• Patients with schizophrenia may suffer acute psychotic episodes of hallucinations and delu-sions. Many patients also have some cognitive dysfunction that makes it difficult to think straight and convert thought into action. Pa-tients often also suffer from isolation and lack of initiative.
• Bipolar disorder (manic depression) is another form of psychotic disorder that is difficult to diagnose. The mood of the patients can cycle between depression and mania.
• People with uncontrolled bipolar disorder of-ten experience an impaired level of function-ing and ruined personal relationships.
Parkinson’s disease • Parkinson’s disease is a chronic and progres-
sive brain disorder that usually affects people over the age of 60.
• Parkinson’s is caused by the lack of dopamine, which is one of several chemical neurotrans-mitters responsible for transmitting signals within the brain. Loss of dopamine causes an imbalance in nerve cell activity, leaving pa-tients unable to direct or control their move-ments in a normal manner.
• Typical symptoms are tremors, stiffness, slow movements and impaired balance. The precise cause of the disease is unknown, but genes, environmental factors and age are believed to be some of the factors involved.
• As the disease progresses, the symptoms grow worse, and the patient will most likely experi-ence motor function problems. Ultimately, Parkinson’s impairs the patient's ability to function in daily life situations.
Alzheimer’s disease • Alzheimer’s disease is a neurological disorder
and is the most common form of dementia. The disease is caused by the destruction of nerve cells, causing a gradual functional de-terioration in the affected areas of the brain.
• The disease primarily affects those in middle and old age, starting with a mild stage of for-getfulness, changes in personality and confu-sion.
• At the moderate stage, patients lose the abil-ity to perform everyday activities; they suffer disorientation, delusion and language prob-lems and fail to recognise their loved ones.
• The severe stage involves a period of time with the patient in an almost vegetative state, gradually losing the ability to communicate, eat and drink. Eventually, the patient dies.
Insomnia • Insomnia is the most common form of sleep
disorder. The term "primary insomnia" refers to the fact that the disorder is not caused by other factors such as depression or pain.
• Melatonin is a naturally occurring hormone produced by the pineal gland, and it has a pivotal role in the regulation of circadian
rhythms and sleep. Endogenous melatonin levels decrease with age and may contribute to the complaint of poor sleep quality seen amongst those of middle and old age.
• Insomnia is more common among women than men. It reduces the ability to perform everyday activities and contributes to an overall deterioration in the patient's health.
• Affecting one-fourth of the population, pri-mary insomnia is characterised by symptoms such as difficulty falling asleep or sleeping without interruption, waking up frequently or very early, and experiencing non-refreshing sleep.
Stroke • Stroke is a primary reason for serious disabil-
ity in the industrialised world and one of the leading causes of death.
• A stroke occurs when the blood supply to a part of the brain is suddenly interrupted (is-chaemic) or when a blood vessel in the brain bursts, bleeding into the spaces surrounding the brain cells (haemorrhagic).
• Some of the damaged brain cells can be saved only if treatment is given within a few hours after the stroke.
• Symptoms of a stroke include sudden numb-ness or weakness, especially on one side of the body, confusion, and loss of balance or coordination skills.
Alcohol abuse • Alcohol is toxic to most body organs, espe-
cially in large amounts. • Excessive consumption of alcohol is a com-
mon problem in many parts of the world and involves huge social consequences, whilst also increasing the risk of developing a number of diseases such as cancer, cardiovascular dis-ease, cerebral atrophy, stomach ulcer and liver cirrhosis.
• The extent of injury depends on how much and for how long a time a person drinks alcohol.
• In the Western world, one in ten deaths is alcohol-related.
Mechanism First Approvedno.Compound ofaction Indication Trademark registration ofcountries Melatonin Regulation of Primary insomnia Circadin® 2007 29 circadian rhythm
Escitalopram ASRI Depression, generalised Cipralex®, Lexapro®, Sipralexa®, 2001 94 anxiety disorder, panic Sipralex® disorder, social anxiety disorder, OCD Citalopram SSRI Depression, panic disorder, Cipramil®, Seropram®, Cipram®, 1989 77 OCD Celexa® Memantine NMDA-antagonist Moderate to severe Ebixa®, Ebix® 2002 66 Alzheimer’s disease
Rasagiline MAO-B inhibitor Parkinson’s disease Azilect® 2005 33
Sertindole Atypical antipsychotic Schizophrenia Serdolect®, Serlect® 1996 45
Flupentixol Typical antipsychotic Mild depression Deanxit® 1971 28+melitracene + TCA Nortriptyline TCA Depression Noritren®, Nortrilen®, Sensaval® 1963 22 Amitriptyline TCA Depression Saroten®, Sarotex®, Redomex® 1961 31 Zuclopenthixol Typical antipsychotic Schizophrenia and other Cisordinol®, Clopixol® 1982 72 psychotic disorders, anxiety, restlessness, insomnia
Zuclopenthixol- Depot antipsychotic Maintenance treatment Cisordinol Depot®, 1976 74 decanoate of chronic psychotic Clopixol Depot®, disorders Ciatyl-Z Depot®
Zuclopenthixol- Typical antipsychotic Acute psychotic episodes, Cisordinol-Acutard®, 1986 73 acetate exacerbation of psychotic Clopixol-Acutard®, disorders Clopixol-Acuphase®, Ciatyl-Z-Acuphase®
Flupentixol Typical antipsychotic Schizophrenia and other Fluanxol®, Fluanxol Mite®, 1965 66 psychotic disorders and Depixol® mild depression
Cis(Z)- Depot antipsychotic Maintenance treatment Fluanxol Depot®, Depixol® 1970 73 flupentixol- of chronic psychoticdecanoate disorders
Chlorprothixene Typical antipsychotic Schizophrenia and other Truxal®, Truxaletten® 1959 23 psychotic disorders, anxiety, restlessness, withdrawal symptoms in drug addicts
Facts about brain disorders Launched pharmaceuticals
Design: Bysted ASPrint: Quickly Tryk A/SMarch 2009
Parent company Denmark
Production DenmarkItalyMexico
Research DenmarkUSA
Sales EuropeAustriaBelgiumBulgariaCroatiaCzech RepublicDenmarkEstoniaFinlandFranceGermanyGreeceHungary
IcelandIrelandItalyLatviaLithuaniaNetherlandsNorwayPoland PortugalRomaniaSerbia and MontenegroSlovakiaSloveniaSpainSwedenSwitzerlandUK
Int. Markets ArgentinaAustraliaBelarusBrazilCanadaChileChina (incl. Hong Kong)
EgyptIndiaIndonesiaIsraelJapanMalaysiaMexicoPakistanPhilippinesRussiaSaudi ArabiaSingaporeSouth AfricaSouth KoreaTurkeyUkraineUnited Arab EmiratesVenezuela
USA
Institutes Lundbeck Institute
Countries are listed in accordance with Lundbeck’s market regions.
Lundbeck at a glanceSpecialtypharmaceuticalcompanyengagedinthedevelopmentofpharma-ceuticalsforthetreatmentofbraindisordersonthebasisofin-houseresearch.
Foundedin1915byHanslundbeck,thecompanywaslistedonthenasdaqOMXCopenhagenstockexchangein1999.
ThelundbeckFoundationisthelargestshareholder,own-ingabout70%oftheshares.In2008,thefoundationpaidoutDKK328millioninfundsforscientificresearch.
5,511employeesin55countries.
Approved for: Depression and anxietyRevenue in 2008: DKK 7,293m (+9%) Partner: Forest Laboratories, Inc. (Lexapro®)
Approved for: Alzheimer’s diseaseRevenue in 2008: DKK 1,879m (+14%)Partner: Merz Pharmaceuticals GmbH
Approved for: Parkinson’s diseaseRevenue in 2008: DKK 263m (+57%)Partner: Teva Pharmaceutical Industries Ltd.
Approved for: SchizophreniaRevenue in 2008: DKK 58m (+68%)
Approved for: InsomniaRevenue in 2008: Not reported Partner: Neurim Pharmaceuticals Ltd.
A total of ten products approved for the treatment of various brain disorders
Other pharmaceuticals
Products
Milestones
2008
Lu AA21004 In cooperation with our partner Takeda Pharmaceutical Company Ltd. the pivotal Phase III programme is expanded for Lu AA21004, which is Lundbecks most advanced compound in the field of depression and anxiety.
Circadin®The sleep agent Circadin® is launched in Germany and subsequently rolled out in a total of 12 markets during 2008.
New President and CEO Ulf Wiinberg is appointed as President and CEO from 1 June, after Claus Bræstrup. Ulf Wiinberg previously had strategic responsi-bility for biopharma activities in the US pharmaceutical company Wyeth and was overall responsible for Wyeth in Europe, Middle East, Africa and Canada.
Azilect®Lundbeck’s partner Teva Pharmaceutical Industries Ltd. announces results from the ADAGIO Phase III trial with Azilect®.
Michael J. Fox FoundationMichael J. Fox Foundation – established by US actor Michael J. Fox, who suffers from Parkinson’s disease – supports two of Lundbeck's early-stage research projects with a total amount of DKK 4.5 million.
Serdolect® in the USALundbeck submits a New Drug Application to the U.S. Food and Drug Administration (FDA) for Serdolect® for the treatment of schizophrenia. A reply from the authorities is expected in May 2009.

02 Towards new goals 04 Management’s review 08 The road ahead 10 Market
14 Products 18 Pipeline 22 Risk management 26 CSR
28 Share 32 Organisation 37 Executive Management
and Supervisory Board
41 Financial statements 103 Management statement
and Auditor’s report
COnTEnTS
PhotosThroughout this report we portray patients with brain disorders. See list of photos including descriptions on the back cover.
Lu AE58054Lundbeck initiates Phase II trials with Lu AE58054, which is being developed against schizophrenia and has shown an ability to improve patient’s cognition in preclinical trials.
DesmoteplaseLundbeck initiates a Phase III clinical trial with desmoteplase, which has the potential to improve treatment of patients with acute ischaemic stroke.
NalmefenePhase III clinical trials initiated with nalmefene, which can limit patient’s intake of alcohol.
Lu AA39959Lundbeck initiates Phase II trials with Lu AA39959, which is expected to demonstrate an effect in patients with bipolar disorder.
p8
p18
PipelineLundbeck is developing new and promising pharmaceuti-cals for the treatment of depression, anxiety and psychotic disorders and for new disease areas such as stroke and alcohol dependence.
The road ahead We have launched the project Decisions now and have defined five areas, where Lundbeck must develop in the years to come.
p2
Towards new goals ”The ambition for Lundbeck is to be the company that makes the biggest difference worldwide in the treatment of patients suffering from brain disorders”, says Ulf Wiinberg, President and CEO.
Udviklin
gssta
die
Registre
rings
Indik
ation
Stof
Virknin
gsmekanism
e
Fase
I
Fase
II
Fase
III
ansøgnin
g
Skizo
freni
Serd
olect
® USA
Dop
amin
/sero
tonin
Filed
Depres
sion/a
ngst
Lu A
A2100
4
Mon
oam
inerg
mod
ulato
r
2010
+
Skizo
freni
Bifep
runo
x
Dopam
in/se
roto
nin
2011
Alkoho
lafhæ
ngigh
ed
nalmefe
n
Spec
ifik opio
idrec
epto
ranta
gonis
t
2011
Slagt
ilfælde
Desm
otep
lase
Plasm
inoge
nakti
vato
r
2011
+
Psyk
ose
Lu 31
-130
Mon
oam
inerg
2011
+
Depres
sion
Lu A
A2453
0
Mult
iple t
arget
s
2011
+
Depres
sion/b
ipolar
lidels
e Lu
AA34
893
Mult
iple t
arget
s
2011
+
Psyk
ose
Lu A
E580
54
Selek
tiv 5-
HT 6 an
tago
nist
2011
+
Psyk
ose/
bipola
r lide
lse
Lu A
A3995
9
Ionka
nalm
odula
tor
2011
+
Slagt
ilfælde
/nerv
eska
de
Lu A
A2449
3
Vævsbe
skyt
tend
e cyt
okin
2011
+
neuro
logisk
e syg
dom
me
Lu A
A3846
6
Ionka
nalm
odula
tor
2011
+
PartnersPeople
ProductsPerformance
Pipeline
Selsk
abs-
Indbet
alt
Overfø
rt
kapita
l
overk
urs
resu
ltat
Egen
kapita
l1
DKK mio.
DKK mio.
DKK mio.
DKK mio.
Egen
kapita
l 01.0
1.2008
1.036,4
223,9
5.924,6
7.184,9
Årets
indre
gned
e indtæ
gter
og o
mko
stnin
ger
-
-
1.446,1
1.446,1
Udlodd
et ud
bytte
, bru
tto
-
-
(530
,6)
(530
,6)
Udlodd
et ud
bytte
, egn
e akti
er
-
-
26,6
26,6
Kapit
alned
sætte
lse og
annu
llerin
g af e
gne a
ktier
(52,0
)
-
52,0
-
Tilba
gekø
b af e
gne a
ktier
-
-
(538
,3)
(538
,3)
Incita
men
tspro
gram
mer
-
-
3,2
3,2
Øvrige
tran
sakt
ioner
(52,0
)
-
(987,1
)
(1.0
39,1)
Egen
kapita
l 31.1
2.2008
984,4
223,9
6.383,6
7.591,9
Egen
kapita
l 01.0
1.2007
1.060,8
121,6
5.582,4
6.764,8
Årets
indre
gned
e indtæ
gter
og o
mko
stnin
ger
-
-
1.808,9
1.808,9
Udlodd
et ud
bytte
, bru
tto
-
-
(333
,8)
(333
,8)
Udlodd
et ud
bytte
, egn
e akti
er
-
-
9,2
9,2
Kapit
alfor
højel
se ve
d udn
ytte
lse af
tegn
ingso
ption
er
5,0
102,3
-
107,3
Kapit
alned
sætte
lse og
annu
llerin
g af e
gne a
ktier
(29,4
)
-
29,4
-
Tilba
gekø
b af e
gne a
ktier
-
-
(1.19
1,3)
(1.19
1,3)
Incita
men
tspro
gram
mer
-
-
16,4
16,4
Skat
af øv
rige t
ransa
ktion
er i e
genk
apita
len
-
-
3,4
3,4
Øvrige
tran
sakt
ioner
(24,4
)
102,3
(1.4
66,7)
(1.3
88,8)
Egen
kapita
l 31.1
2.2007
1.036,4
223,9
5.924,6
7.184,9
Egen
kapita
l 01.0
1.2006
1.136,1
69,5
6.286,1
7.491,7
Årets
indre
gned
e indtæ
gter
og o
mko
stnin
ger
-
-
1.253,5
1.253,5
Udlodd
et ud
bytte
, bru
tto
-
-
(477
,2)
(477
,2)
Udlodd
et ud
bytte
, egn
e akti
er
-
-
32,7
32,7
Kapit
alfor
højel
se ve
d udn
ytte
lse af
tegn
ingso
ption
er
2,6
52,1
-
54,7
Kapit
alned
sætte
lse og
annu
llerin
g af e
gne a
ktier
(77,9
)
-
77,9
-
Tilba
gekø
b af e
gne a
ktier
-
-
(1.59
1,1)
(1.59
1,1)
Skat
af øv
rige t
ransa
ktion
er i e
genk
apita
len
-
-
0,5
0,5
Øvrige
tran
sakt
ioner
(75,3
)
52,1
(1.9
57,2)
(1.9
80,4)
Egen
kapita
l 31.1
2.2006
1.060,8
121,6
5.582,4
6.764,8
1) Eg
enka
pital
er lig
med
egen
kapit
al, H
. Lun
dbec
k A/S
’ akti
onærer
.
p41
Financial statements 2008Lundbeck’s financial
performance in detail.

2
Brain disorders such as depression, schizophre-nia and Alzheimer’s disease, to name but a few, inflict an immense amount of suffering on pa-tients, as well as sorrow and despair on their relatives.
Hundreds of millions of people in the world suffer from brain disorders. In spite of thera-peutic progress, unfortunately, we remain a long way from fully understanding these disor-ders. There are big unmet needs, not only for medication, but also for entire solutions in which therapy and updated information about the disorders are crucial factors.
Unfortunately, public awareness and the re-sources spent on curing and alleviating brain disorders are a long way from matching the severity and consequences of these disorders.
Brain disorders place an enormous economic burden on society, equal to the combined burden of cancer and cardiac disorders, in part because brain disorders reduce or eliminate the patient’s ability to work.
Thanks to the profound dedication and profes-sional capability of Lundbeck staff, the company currently enjoys worldwide respect for its efforts to combat some of these disabling diseases. I am therefore proud to have taken the helm at Lund-beck and to present my first annual report.
Biggest difference for patients The ambition for Lundbeck is to be the com-pany that makes the biggest difference world-wide in the treatment of patients suffering from brain disorders. We wish to be known as a growth company that attracts and retains the best employees.
We have launched the programme ‘Decisions now’ which will be the cornerstone in our
Towards new goals

3
next five years. At the same time, our presence in the USA will provide even greater opportu-nities for in-licensing new products.
With this acquisition and other decisions, the course for Lundbeck’s future is charted. There is still a great deal we need to achieve. But Lundbeck has previously proven its ability to develop some of the world’s best pharmaceu-ticals in our field. And we have the potential to do so again, for the benefit of patients, society, employees and shareholders.
Ulf WiinbergPresident and CEO
development over the next few years. The programme is incorporated throughout the company, while the responsibility for the activ-ities is placed in senior management. I will closely monitor the process to ensure that we accomplish our targeted progress.
Specifically, we aim to generate increased reve-nue through targeted investments in selected markets for instance by conducting new scien-tific investigations that can underline the strengths of our pharmaceuticals.
Concurrently, we will allocate extra resources to key projects in the pivotal development stage to maximise the return on the product launches we are facing.
We will source funding for the new activities partly by improving our organisation’s effi-ciency, including a close review of costs. Some of the changes will not materialise as fi-nancial improvements until after some time has passed. We can allow ourselves such initia-tives because our business is basically healthy and growing. But we have made the most im-portant decisions so that the changes will take full effect when we need them most.
New platform in the USA We have recently acquired Ovation Pharma-ceuticals, Inc. in the largest transaction in Lundbeck’s history. This deal fulfils one of our key strategic goals: to establish a commercial platform in the USA, the world’s largest phar-maceutical market.
This acquisition makes us a truly global player, and it brings us a number of new products and exciting pipeline projects that I look forward to pursuing. We may be able to launch several new products from our pipeline within the
Towards new goals
”The ambition for Lundbeck is to be the company that makes the biggest difference worldwide in the treatment of patients suffering from brain disorders.”

4
Lundbeck’s revenue continued to grow in 2008 to a record high of DKK 11,282 million. The improvement was primarily attributable to sales of Cipralex® and Ebixa® and was achieved in spite of our decision to reduce US inventories of Lexapro®, which decreased our sales income by DKK 256 million.
Profit from operations (EBIT) amounted to DKK 2,833 million, excluding non-recurring items, which translates into a growth of 7%.
The Supervisory Board finds the increase in revenue and profit from operations very satis-factory.
The income translates into an EBIT margin of 25%, excluding non-recurring items. We have been able to maintain the EBIT margin in spite of an increase in research and development costs from 21% of revenue in 2007 to 22% in 2008.
Including a DKK 481 million impairment loss on Flurizan®, profit from operations amounted to DKK 2,352 million in 2008, compared with DKK 2,695 million in 2007.
Group net investments amounted to DKK 439 million in 2008, excluding inlicensing and mile-stone payments, compared to DKK 630 million in 2007.
Cash flows from operating and investment ac-tivities amounted to DKK 2,193 million com-pared with DKK 1,610 million in 2007.
The Group’s financial performance was con-sistent with the guidance presented in the an-nual report for 2007.
The tax charge for 2008 was DKK 613 million, against DKK 792 million in 2007. The effective tax rate fell to 28.9% in 2008 from 30.9% in 2007.
Profit for the year amounted to DKK 1,510 million in 2008, compared with DKK 1,770 million in 2007.
The Supervisory Board will propose to the An-nual General Meeting that a dividend of 30% of net profit be paid for the year, correspond-ing to DKK 2.30 per share.
Pipeline progress Key pipeline projects are proceeding according to plan, and we initiated more Phase II and III clinical studies than ever before in Lundbeck’s history.
However, Phase III data with the in-licensed compound Flurizan®, developed by Myriad Ge-netics, Inc. for the treatment of Alzheimer’s disease, failed to live up to our expectations. The development of this compound was there-fore discontinued.
Lundbeck has submitted an application to the U.S. Food and Drug Administration (FDA) for the approval of Serdolect® for the treatment of schizophrenia, after having confirmed the efficacy, tolerability and safety of the com-pound through daily clinical practice in 40,000 patient years.
Lundbeck’s revenue rose to its highest-ever level in 2008. We have commenced more pivotal clinical trials than ever before, and continue to increase investments in research and development of new pharmaceuticals.
Management’s review
Revenue per product and region
Total Europe USA Int. MarketsDKKm 2008 2007 2008 2007 2008 2007 2008 2007
Total revenue 11,282 10,985 6,213 5,501 2,464 2,599 2,409 2,194 Growth 3% 13% -5% 10%
Cipralex® 4,829 4,094 3,355 2,827 - - 1,474 1,267 Growth 18% 19% - 16%
Lexapro® 2,464 2,594 - - 2,464 2,594 - - Growth -5% - -5% -
Ebixa® 1,879 1,655 1,557 1,359 - - 321 295 Growth 14% 15% - 9%
Azilect® 263 168 241 156 - - 22 11 Growth 57% 54% - 89%
Serdolect® 58 34 36 24 - - 22 11 Growth 68% 50% - 108%
Other pharmaceuticals 1,595 1,750 1,025 1,135 - 6 570 609 Growth -9% -10% - -6%
Other revenue 195 690 - - - - - - Growth -72% - - -
Forecast and profit 2008 (DKK)
Forecast Realised
Revenue 11-11.5 bn 11,282 m
Profit from operations (EBIT), excl non-recurring items 2.8-2.9 bn 2,833 m
Investments, excl. in-licensing and milestone payments Approx. 500 m 439 m
5
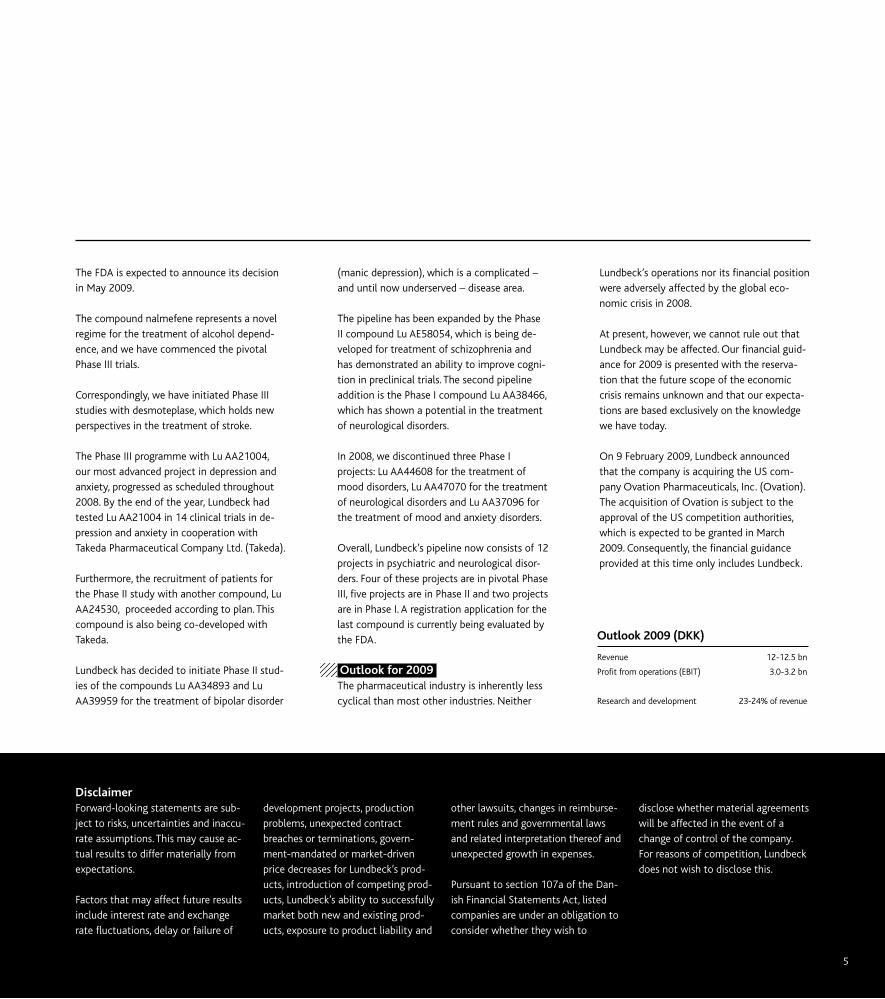
The FDA is expected to announce its decision in May 2009.
The compound nalmefene represents a novel regime for the treatment of alcohol depend-ence, and we have commenced the pivotal Phase III trials.
Correspondingly, we have initiated Phase III studies with desmoteplase, which holds new perspectives in the treatment of stroke.
The Phase III programme with Lu AA21004, our most advanced project in depression and anxiety, progressed as scheduled throughout 2008. By the end of the year, Lundbeck had tested Lu AA21004 in 14 clinical trials in de-pression and anxiety in cooperation with Takeda Pharmaceutical Company Ltd. (Takeda).
Furthermore, the recruitment of patients for the Phase II study with another compound, Lu AA24530, proceeded according to plan. This compound is also being co-developed with Takeda.
Lundbeck has decided to initiate Phase II stud-ies of the compounds Lu AA34893 and Lu AA39959 for the treatment of bipolar disorder
Lundbeck’s operations nor its financial position were adversely affected by the global eco-nomic crisis in 2008.
At present, however, we cannot rule out that Lundbeck may be affected. Our financial guid-ance for 2009 is presented with the reserva-tion that the future scope of the economic crisis remains unknown and that our expecta-tions are based exclusively on the knowledge we have today.
On 9 February 2009, Lundbeck announced that the company is acquiring the US com-pany Ovation Pharmaceuticals, Inc. (Ovation). The acquisition of Ovation is subject to the approval of the US competition authorities, which is expected to be granted in March 2009. Consequently, the financial guidance provided at this time only includes Lundbeck.
(manic depression), which is a complicated – and until now underserved – disease area.
The pipeline has been expanded by the Phase II compound Lu AE58054, which is being de-veloped for treatment of schizophrenia and has demonstrated an ability to improve cogni-tion in preclinical trials. The second pipeline addition is the Phase I compound Lu AA38466, which has shown a potential in the treatment of neurological disorders.
In 2008, we discontinued three Phase I projects: Lu AA44608 for the treatment of mood disorders, Lu AA47070 for the treatment of neurological disorders and Lu AA37096 for the treatment of mood and anxiety disorders.
Overall, Lundbeck’s pipeline now consists of 12 projects in psychiatric and neurological disor-ders. Four of these projects are in pivotal Phase III, five projects are in Phase II and two projects are in Phase I. A registration application for the last compound is currently being evaluated by the FDA.
Outlook for 2009 The pharmaceutical industry is inherently less cyclical than most other industries. neither
Disclaimer Forward-looking statements are sub-ject to risks, uncertainties and inaccu-rate assumptions. This may cause ac-tual results to differ materially from expectations.
Factors that may affect future results include interest rate and exchange rate fluctuations, delay or failure of
development projects, production problems, unexpected contract breaches or terminations, govern-ment-mandated or market-driven price decreases for Lundbeck’s prod-ucts, introduction of competing prod-ucts, Lundbeck’s ability to successfully market both new and existing prod-ucts, exposure to product liability and
other lawsuits, changes in reimburse-ment rules and governmental laws and related interpretation thereof and unexpected growth in expenses.
Pursuant to section 107a of the Dan-ish Financial Statements Act, listed companies are under an obligation to consider whether they wish to
disclose whether material agreements will be affected in the event of a change of control of the company. For reasons of competition, Lundbeck does not wish to disclose this.
Outlook 2009 (DKK)
Revenue 12-12.5 bn
Profit from operations (EBIT) 3.0-3.2 bn
Research and development 23-24% of revenue

6
The financial guidance for 2009 includes an in-come of DKK 124 million concerning the di-vestment of shares in LifeCycle Pharma A/S to LFI a/s (The Lundbeck Foundation) at the be-ginning of 2009.
Lundbeck expects that revenue for 2009 will rise to DKK 12-12.5 billion, and that profit from operations (EBIT) will amount to DKK 3.0-3.2 billion.
Lundbeck will increase spending on research and development, which is expected to ac-count for 23-24% of revenue in 2009.
Events reported after the end of the financial year On 9 February 2009, Lundbeck announced that the company will acquire Ovation for up to USD 900 million, or DKK 5.2 billion, through its wholly owned subsidiary Lundbeck, Inc.
The acquisition of Ovation fulfils Lundbeck’s strategic goal to build a commercial infrastruc-ture in the USA. Ovation is a profitable and fast-growing company, with a broad portfolio of marketed products and an attractive pipe-line of new, innovative products primarily fo-cused on brain disorders.
The pipeline is expected to drive growth signifi-cantly in the coming years through multiple new product launches.
Following the transaction, Lundbeck will have a diverse portfolio of marketed products and a broader pipeline primarily focused on brain disorders.
Pending final approvals and antitrust clear-ances, closing of the transaction is expected totake place in March 2009. A thorough discus-sion of the influence of Ovation on Lundbeckis not included in the annual report for 2008.

7
1. korrektur 9/2-09

8
Based on our long-standing experience and unique focus as a research-based company in the field of brain disorders, our goal is to help patients by being specialists and developing new and innovative pharmaceuticals. We aim to be a healthy and growing business, and an attractive place to work, to partner, and to in-vest in - for employees, for the surrounding community, and for our shareholders, respec-tively.
Focus on brain disorders Lundbeck believes there is a great potential in focusing on brain disorders. Valued at more than DKK 600 billion, the market for pharma-ceuticals to treat brain disorders is the world’s largest pharmaceutical therapy area. With its existing products or clinical development projects, Lundbeck currently has activities in about half the market. In other words, the market for pharmaceuticals for the treatment of brain disorders is huge and offers strong growth and promising potential.
Lundbeck remains open to expanding its focus to include other brain disorders, as opportuni-ties arise from new discoveries in our own re-search laboratories, or from the acquisition of new projects or pharmaceuticals.
With the acquisition of Ovation Pharmaceuti-cals, Inc. (Ovation), Lundbeck diversifies its treatment offers and obtains a commercial platform in the USA, which is the world’s larg-est pharmaceutical market by far. north Ame-rica represents 57% of the global market for pharmaceuticals for brain disorders, and Lund-beck has aimed to establish an independent commercial presence in this market for a number of years. With the acquisition, we be-lieve that the US market will offer good growth potential in the years ahead.
Five priority areas Lundbeck currently has leading pharmaceuti-cals that can continue to provide growth rates in the years ahead. Furthermore, we have inno-vative pharmaceutical candidates in our pipe-line that will represent growth drivers in the medium and long-term. In order to accomplish our ambition to become the company that makes the biggest difference worldwide for pa-tients with brain disorders, we have defined five strategic focus areas, each of which will contribute to Lundbeck’s progress.
The ‘Decisions now’ programme is incorpo-rated throughout the company. Progress in the
Representing 28% of the global market, Eu-rope has been Lundbeck’s domestic market for many years. In this region, Lundbeck has a fully developed sales infrastructure for marketing pharmaceuticals.
Over the past few years, Lundbeck has in-creased its presence in the International Mar-kets region, which accounts for 15% of the global market. We currently have a presence in most relevant countries in the International Markets region. We will continue to expand our presence in all markets in which we expect increasing proliferation of medication for the treatment of brain disorders.
Lundbeck’s road aheadLundbecks long term objective is to become the company that makes the biggest difference worldwide for patients with brain disorders. We have launched the project Decisions now and have defined five areas, where Lundbeck must develop in order to succeed.
Decisions now
People Performance
Partners
Pipeline
ProductsBest company
in the treatment of brain disorders

9
Performance – Increasing efficiency and reducing costs We aim to release resources for investments in other areas in Decisions now by making our organisation more efficient. The objective is to review processes, systems and procurement in the company.
People – Developing a high performance culture and ensuring consistent targets A prerequisite for accomplishing the above-mentioned ambitions, launching value-adding initiatives, and increasing earnings is that our organisation is geared towards these chal-lenges. Our company and employees must be characterised by a high performance mentality in which cooperation, willingness and ability to change, innovative skills and drive are the pro-pelling force.
underlying projects aimed at creating the im-provements will be monitored closely by senior management, who has the ultimate responsibility. Products – Achieving full potential of marketed pharmaceuticals Lundbeck’s existing pharmaceuticals offer a substantial growth potential. Management has identified measures to achieve this potential and increase revenue growth in the years to come. Moreover, the expected growth in Ova-tion sales will provide revenue that will more than offset the expected revenue decrease from Lexapro® following patent expiry in the US in 2012.
Pipeline – Maximising the value of new and innovative pharmaceuticals Lundbeck currently invests more than 20% of its revenue in research and development. Inno-vation and medical improvements represent the cornerstone of our strategy. Our high level of investment will continue to strengthen and broaden our pipeline, with the aim of generat-ing the major part of long-term growth. The latest investment increase target the compa-ny’s late-stage projects in order to accelerate development and maximise the value of the projects. Following the acquisition of Ovation, Lundbeck has the potential to launch several new pharmaceuticals over the next five years.
Partners – Intensifying growth through business development and partnerships In-licensing activities, acquisitions and part-nerships will continue to be a part of Lund-beck’s strategy. We have defined targets for business development, and having established a commercial platform in the USA we will also be seeking products and development projects in the US market. In addition, we will review our existing partnership agreements, seeking to maximise the opportunities.

The market for pharmaceuticals for the treatment of patients with brain disorders is growing, and there is a great need for improving the existing treatment options.
Lundbeck is engaged in a single therapeutic area: brain disorders, which are also referred to as dis-orders of the central nervous system (CNS). Lundbeck is the only company in the world that focuses exclusively on brain disorders and is fully integrated, which means that we cover the entire value chain, from research and develop-ment to production, marketing and sales.
Over the past few years, the market for phar-maceuticals for brain disorders has grown con-siderably, currently representing a value of just over DKK 600 billion. This makes it the world’s largest pharmaceutical therapy area, even larger than cardiovascular diseases. Lundbeck’s reve-nue accounts for about 2% of the total market for pharmaceuticals for brain disorders. This market therefore holds significant growth po-tential.
Depression and psychotic disorders represent the two largest markets within brain disorders. With the pharmaceuticals currently marketed by Lundbeck and the pharmaceutical candi-dates we are developing, Lundbeck is active in about 50% of the market for brain disorders.
The growth recorded in the market for phar-maceuticals for the treatment of brain disor-ders underlines the huge need for more effec-
tive medication with fewer side effects. Although we have come a long way, unmet needs – and thus growth potential – exist in the field of psychiatric disorders such as de-pression and psychotic disorders, as well as in neurological disorders such as Alzheimer’s and Parkinson’s diseases.
The shortcomings of the treatments currently available for patients with brain disorders can cause great suffering for patients and their relatives, resulting in huge costs for society.
The World Health Organization (WHO) has estimated which diseases cause the largest global losses in quality of life. The figures show that, next to cancer, depression/anxiety is the most burdensome illness.
Brain disorders are complex and difficult to understand, and although we can expect sub-stantial progress in treatments, brain disorders will continue to cause a great deal of societal loss and suffering.
Market
10
The world’s most burdensome illnesses
1. Cancer2. Depression and anxiety3. Ischaemic heart disease4. Cerebrovascular disease5. Chronic obstructive pulmonary disease6. Refractive errors in the eye7. Hearing loss8. Congenital anomalies9. Alcohol abuse10. Diabetes mellitus11. Cataracts12. Schizophrenia13. Asthma
14. Osteoarthritis15. Bipolar disorder16. Liver cirrhosis17. Dementia18. Endocrine disorders19. Macular degeneration 20. Nephritis and nephrosis21. Drug abuse22. Hypertensive heart disease23. Epilepsy24. Migraine25. Rheumatic heart disease
Note: DALY (disability adjusted life years), except infectious diseases.Source: Lundbeck and WHO World Health Report 2004.

1. korrektur 9/2-09
11
By 2030, depression, Alzheimer’s disease and alcohol-related disorders are expected to be among the five diseases that constitute the greatest burden on society in the world’s high-income countries.(1)
Depression and anxiety WHO estimates that about 150 million people around the world suffer from depression. The market for pharmaceuticals for the treatment of depression represents approximately DKK 107 billion. Measured in terms of value, the market is declining because a number of branded products have lost their patent pro-tection and cheaper generic versions have been launched. Measured in terms of volume, global usage is growing as more and more pa-tients are diagnosed. It is estimated that about half of the people suffering from depression currently receive treatment. It is also esti-mated that, until 2016, the number of people receiving treatment for depression will grow by 2-3% each year in the USA and Europe.(2)
Although treatments with antidepressants have improved significantly since the first generation of therapeutics was launched in the 1960s, substantial unmet needs persist.
The US market accounts for more than 60% of the global antipsychotics market. The reason is especially that more than 85% of patients in the USA receive the latest antipsychotics (the so-called atypical pharmaceuticals), which cause fewer side effects than older therapeu-tics. In Europe, only about 55% of patients re-ceive the latest generation of drugs; 45% are treated with older and cheaper pharmaceuti-cals developed as long as 50 years ago.
Although treatments for psychotic disorders have improved, a considerable need for better therapies persists. According to WHO, the greatest unmet treatment needs include the fact that only one-third of treated patients be-come symptom-free and capable of function-ing in daily life. This limited effect, combined with adverse effects, result in many patients changing antipsychotics or discontinuing their treatment. Thus, future treatments need to be more efficacious, especially in the treatment of the cognitive dysfunction and so-called nega-tive symptoms, such as isolation and lack of initiative. In addition, new pharmaceuticals should have fewer side effects, and patients would benefit greatly from a faster diagnosis and quicker treatment start.
The priority areas are improved efficacy, faster onset of action and fewer side effects.
Antidepressants represent an effective treat-ment for 50-70% of depressed patients, but it takes time for the effect of the treatment to set in – often up to three or four weeks. The delayed efficacy makes some patients discon-tinue their treatment prematurely. Further-more, it is not unusual for patients to have to try several different treatments before they ex-perience a beneficial effect.
Lundbeck expects to play a decisive role in the future treatment of depression. The launch of new and innovative pharmaceuticals can cre-ate substantial value for the company in the medium and long-term.
Psychotic disorders The market for pharmaceuticals for the treat-ment of patients with psychotic disorders is currently the largest CnS area in terms of value, representing DKK 113 billion. IMS esti-mates, that the value of the market for antip-sychotics will grow by about 2% per annum until 2013. Accordingly, there is a substantial market potential for Lundbeck to develop and launch new antipsychotic pharmaceuticals.
(1) Mathers & Loncar, 2006 (2) COGnOS Study #4 - Major depressive disorder, December 2007
12
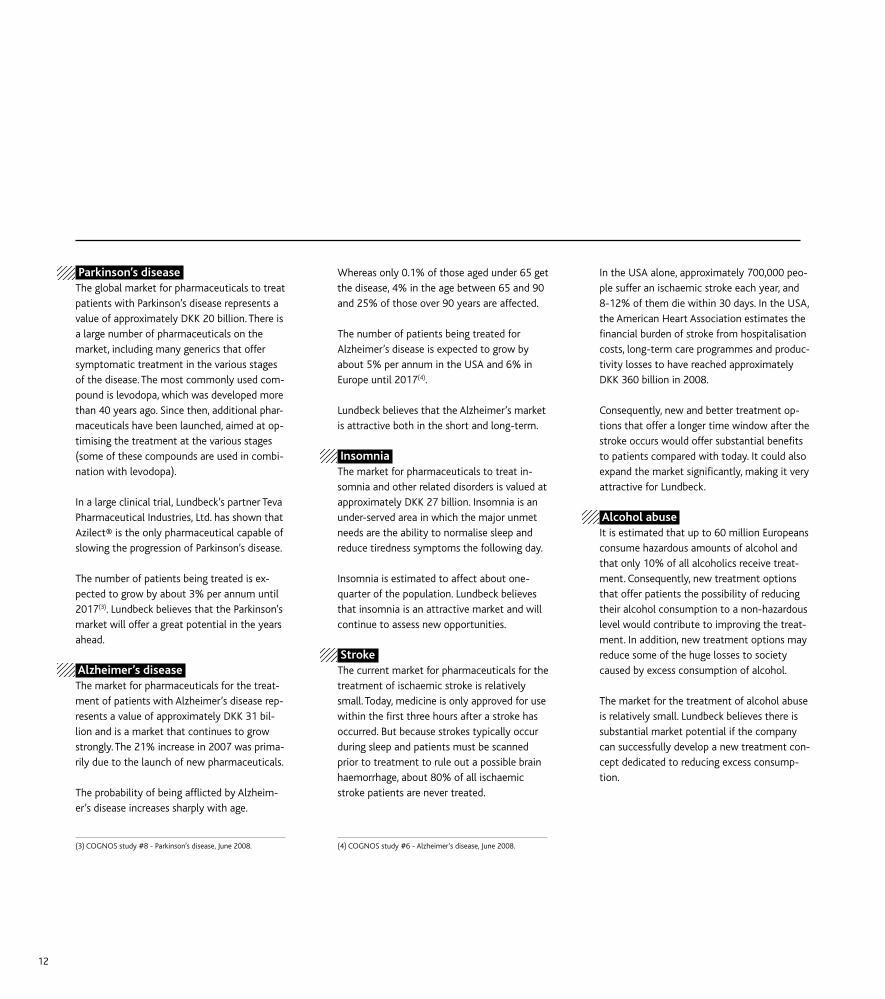
Parkinson’s disease The global market for pharmaceuticals to treat patients with Parkinson’s disease represents a value of approximately DKK 20 billion. There is a large number of pharmaceuticals on the market, including many generics that offer symptomatic treatment in the various stages of the disease. The most commonly used com-pound is levodopa, which was developed more than 40 years ago. Since then, additional phar-maceuticals have been launched, aimed at op-timising the treatment at the various stages (some of these compounds are used in combi-nation with levodopa).
In a large clinical trial, Lundbeck’s partner Teva Pharmaceutical Industries, Ltd. has shown that Azilect® is the only pharmaceutical capable of slowing the progression of Parkinson’s disease.
The number of patients being treated is ex-pected to grow by about 3% per annum until 2017(3). Lundbeck believes that the Parkinson’s market will offer a great potential in the years ahead.
Alzheimer’s disease The market for pharmaceuticals for the treat-ment of patients with Alzheimer’s disease rep-resents a value of approximately DKK 31 bil-lion and is a market that continues to grow strongly. The 21% increase in 2007 was prima-rily due to the launch of new pharmaceuticals.
The probability of being afflicted by Alzheim-er’s disease increases sharply with age.
Whereas only 0.1% of those aged under 65 get the disease, 4% in the age between 65 and 90 and 25% of those over 90 years are affected.
The number of patients being treated for Alzheimer’s disease is expected to grow by about 5% per annum in the USA and 6% in Europe until 2017(4).
Lundbeck believes that the Alzheimer’s market is attractive both in the short and long-term.
Insomnia The market for pharmaceuticals to treat in-somnia and other related disorders is valued at approximately DKK 27 billion. Insomnia is an under-served area in which the major unmet needs are the ability to normalise sleep and reduce tiredness symptoms the following day.
Insomnia is estimated to affect about one-quarter of the population. Lundbeck believes that insomnia is an attractive market and will continue to assess new opportunities.
Stroke The current market for pharmaceuticals for the treatment of ischaemic stroke is relatively small. Today, medicine is only approved for use within the first three hours after a stroke has occurred. But because strokes typically occur during sleep and patients must be scanned prior to treatment to rule out a possible brain haemorrhage, about 80% of all ischaemic stroke patients are never treated.
In the USA alone, approximately 700,000 peo-ple suffer an ischaemic stroke each year, and 8-12% of them die within 30 days. In the USA, the American Heart Association estimates the financial burden of stroke from hospitalisation costs, long-term care programmes and produc-tivity losses to have reached approximately DKK 360 billion in 2008.
Consequently, new and better treatment op-tions that offer a longer time window after the stroke occurs would offer substantial benefits to patients compared with today. It could also expand the market significantly, making it very attractive for Lundbeck.
Alcohol abuse It is estimated that up to 60 million Europeans consume hazardous amounts of alcohol and that only 10% of all alcoholics receive treat-ment. Consequently, new treatment options that offer patients the possibility of reducing their alcohol consumption to a non-hazardous level would contribute to improving the treat-ment. In addition, new treatment options may reduce some of the huge losses to society caused by excess consumption of alcohol.
The market for the treatment of alcohol abuse is relatively small. Lundbeck believes there is substantial market potential if the company can successfully develop a new treatment con-cept dedicated to reducing excess consump-tion.
(3) COGnOS study #8 - Parkinson’s disease, June 2008. (4) COGnOS study #6 - Alzheimer’s disease, June 2008.

13
Disease Total North America Europe Rest of world DKK bn % of total DKK bn % of total DKK bn % of total DKK bn
Depression 2006 111.9 67% 75.3 22% 24.3 11% 12.3
(n6A) 2007 107.4 62% 66.5 25% 26.8 13% 14.2
Growth -4% -12% 10% 15%
Psychotic 2006 99.1 65% 64.4 24% 24.1 11% 10.6
disorders 2007 112.9 64% 71.9 26% 28.8 11% 12.2
(n5A) Growth 14% 12% 20% 15%
Parkinson’s 2006 17.1 35% 5.9 43% 7.3 23% 3.9
disease 2007 20.3 36% 7.3 44% 8.9 21% 4.2
(n4A) Growth 19% 23% 22% 7%
Alzheimer’s 2006 25.3 55% 14.0 30% 7.6 15% 3.8
disease 2007 30.7 54% 16.6 30% 9.3 16% 4.8
(n7D) Growth 21% 18% 23% 27%
Insomnia * 2006 29.6 67% 19.8 18% 5.3 15% 4.5
(n5B) 2007 27.2 61% 16.6 22% 5.9 17% 4.7
Growth -8% -16% 12% 4%
Alcohol abuse 2006 0.8 28% 0.2 55% 0.4 18% 0.1
(n7E) 2007 0.9 36% 0.3 53% 0.5 11% 0.1
Growth 22% 58% 19% -27%
Total CNS 2006 552.7 59% 326.1 27% 147.0 15% 80.1
(n) 2007 608.0 57% 345.3 28% 172.1 15% 90.6
Growth 10% 6% 17% 13%
Stroke 2006 n.a. n.a. n.a. n.a.
(B1D) 2007 4.0 49% 2.0 32% 1.3 19% 0.8
Growth - - - -
* Insomnia and related diseasesSource: IMS World Review 2007, 2008
Market values

14
In 2008, sales of Lundbeck’s pharmaceuticals continued to grow and exceeded DKK 11 billion for the first time.
In the Decisions now programme, we have identified a number of measures aimed at accelerating sales growth. Some of these
measures may have an impact already in 2009, whilst others will emerge over a longer period of time.
Lundbeck divides its markets into: Europe, USA and International Markets.
Cipralex®/Lexapro® (escitalopram) Depression and anxiety Cipralex®/Lexapro® for the treatment of de-pression and anxiety was launched in 2002 and is the most frequently prescribed branded antidepressant in Europe and the USA. Lund-beck is marketing Cipralex® in 93 countries. In the USA, Lexapro® is marketed by Forest Labo-ratories, Inc. (Forest), and Lundbeck receives royalties from the sales. To date, more than 160 million patients worldwide have been treated with escitalopram, the active pharma-ceutical ingredient.
Over the past few years, the Cipralex® profile has gradually been strengthened as additional clinical data have been published. A number of randomised clinical trials have demonstrated that Cipralex® is efficacious both in short-term and long-term treatment of depression, whilst also offering a good safety profile. Further-more, other clinical trials have demonstrated the therapeutic benefits of using Cipralex® in
comparison with other antidepressants in the treatment of both depression and anxiety.
By the end of 2008, Cipralex® commanded 16.8% of the European market for antidepres-sants (15.2% in 2007). Lexapros® market share in the US grew to 22.9% (22.7% in 2007). In the International Markets region, the market share of Cipralex® was 10.8% in Q3 2008, which is the most recent period for which figures are available (9.4% in Q3 2007).
In the years ahead, Lundbeck intends to step up its marketing efforts for Cipralex®, partly based on new knowledge that has come to light since the original launch, but also on the basis of the expected results of a number of new clinical trials. Lundbeck currently supports 16 ongoing trials.
Furthermore, Lundbeck wishes to maximise its combined sales and distribution capabilities. This may be achieved by optimising the size of the sales force relative to the market potential in the individual countries.
In the USA, Forest has filed a registration ap-plication for the use of Lexapro® for adoles-cents and expects to receive approval in the spring of 2009. Forest has indicated that the
Lundbeck continues to sell pharmaceuticals in new markets and to capitalise on the strength of the products to increase market shares in existing markets.
Products
Total revenue
DKKm 2008 2007 Growth Growth*
Europe 6,213 5,501 13% 14%
USA 2,464 2,599 -5% -2%
Int. Markets 2,409 2,194 10% 17%
Other** 195 690 -72% -72%
Total 11,282 10,985 3% 6%
* Local currency ** Other revenue
Revenue Cipralex®/Lexapro®
DKKm 2008 2007 Growth Growth*
Europe 3,355 2,827 19% 21%
USA** 2,464 2,594 -5% -2%
Int. Markets 1,474 1,267 16% 24%
Total 7,293 6,688 9% 13%
* Local currency ** Lundbeck’s income from sales of Lexapro®
“From 2009 onwards, we will dedicate extra resources to sales-promoting projects in the markets where we believe there is room for improvement.”
Stig Løkke Pedersen, Executive Vice President, Commercial Operations

1. korrektur 9/2-09
15
company expects additional sales of approxi-mately DKK 550 million from this new indication.
In Canada, we expect to see a continued posi-tive effect after Cipralex® became eligible for reimbursement in the Province of Ontario, and the product is expected to become eligible for reimbursement in other provinces as well.
Ebixa® (memantine) Alzheimer’s disease Ebixa®, Lundbeck’s second best-selling pharma-ceutical, was in-licensed from Merz Pharmaceu-ticals GmbH in Germany in 2002, and is now marketed by Lundbeck in 57 countries world-wide. Lundbeck is marketing Ebixa® in more or less all parts of the world, excluding the USA and Japan. Memantine, the active pharmaceuti-cal ingredient in Ebixa®, is the second most pre-scribed pharmaceutical in the world for treating patients with Alzheimer’s disease.
In a number of clinical trials, Ebixa® has shown to be efficacious and demonstrated a strong safety profile in patients with moderate to se-vere Alzheimer’s disease. Compared with pla-cebo, treatment with Ebixa® offers patients stabilisation or less marked worsening on three important domains: cognition, daily function-ing and behaviour.
In addition to being effective and easy to ad-minister, Azilect® is well-tolerated by patients and has only few adverse effects.
By the end of 2008, Azilect® represented 6.5% of total European sales of pharmaceuticals to treat patients with Parkinson’s disease (4.6% in 2007). Because Azilect® has only been launched in a single country in the International Markets region, revenue here is very modest.
In August 2008, Lundbeck’s partner Teva announced positive results from the Azilect® ADAGIO Phase IIIb study, one of the largest studies ever conducted for Parkinson’s disease with 1,176 patients. Azilect® met all three endpoints of the primary analysis, as well as the secondary endpoint - all with statistical significance.
The results demonstrate that early treatment with Azilect® slows the progression of Parkin-son’s disease and indicate that early treatment with Azilect® could modify the course of the disease. Delaying disease progression is one of the most important unmet needs in the treat-ment of patients with Parkinson’s disease.
One of Lundbeck’s key priorities is to ensure that the ADAGIO data is presented in all relevant
At the end of 2008, Ebixa® commanded 16.0% of the European market for anti-Alzheimer’s agents (15.9% in 2007). In the International Markets region, the market share of Ebixa® was 10.9% in Q3 2008 (10.8% in Q3 2007).
Lundbeck has also identified a number of measures to boost sales growth of Ebixa®. In a number of countries, the goal is to in-crease awareness among healthcare providers and to exploit Ebixa’s greater efficacy relative to competing products. In addition, Lundbeck is developing a promising dispenser, and our continuing focus on the medication being administered only once daily will promote its use, mainly among patients with moderate Alzheimer’s disease.
Finally, a number of trials due to be completed in 2009 and 2010 may create new market po-tential, depending on the results.
Azilect® (rasagiline) Parkinson’s diseaseAzilect® has been in-licensed from Teva Phar-maceutical Industries Ltd. (Teva), and is used both as monotherapy and in combination treatments of patients with Parkinson’s dis-ease. Azilect® was launched in the first Euro-pean market in 2005. Lundbeck is now market-ing Azilect® in 29 countries.
Revenue Ebixa®
DKKm 2008 2007 Growth Growth*
Europe 1,557 1,359 15% 15%
Int. Markets 321 295 9% 15%
Total 1,879 1,655 14% 15%
* Local currency
Revenue Azilect®
DKKm 2008 2007 Growth Growth*
Europe 241 156 54% 56%
Int. Markets 22 11 89% 103%
Total 263 168 57% 59%
* Local currency

1. korrektur 9/2-09
16
forums and make sure that healthcare provid-ers and other stakeholders become aware of the product’s qualities. The purpose is to pro-vide patients with a possibility of taking Azi-lect® at an earlier stage and increase its use as monotherapy.
Serdolect® (sertindole) Schizophrenia The result of Lundbeck’s in-house research, Serdolect® is an effective antipsychotic drug for the treatment of schizophrenia without sedative effect and with placebo-level extra pyramidal side effects (e.g. slow movements and tremors).
The clinical and pharmacological profile of Serdolect® shows that the pharmaceutical may increase the likelihood of patients re-maining on therapy, which will increase the quality of life for patients and relatives alike.
Lundbeck holds the global rights to Serdolect®, which has been on the market since the begin-ning of 2006. By the end of 2008 we had rolled out Serdolect® in 38 markets.
In 2008, Lundbeck submitted a new Drug Ap-plication to the U.S. Food and Drug Adminis-tration (FDA) for Serdolect® for the treatment
of schizophrenia. In September, the FDA com-pleted its initial check for completeness and accepted the application. Serdolect® may thus potentially become a new treatment option for patients with schizophrenia in the USA. On receiving feedback from the FDA, Lundbeck will decide finally on a launch of Serdolect®.
Circadin® (melatonin) Primary insomniaIn 2007, Lundbeck in-licensed Circadin® for the treatment of primary insomnia from neu-rim Pharmaceuticals Ltd. with rights to about 80% of the European market and to a number of other markets.
Circadin® was approved by the European Medi-cines Agency (EMEA) in June 2007 as mono-therapy for the short-term treatment of primary insomnia in patients aged 55 or over. Circadin® mimics the normal nocturnal profile of the hor-mone melatonin, which has a pivotal role in the regulation of circadian rhythms and sleep.
In 2008, Lundbeck launched Circadin® in 12 markets across Europe.
Lundbeck’s primary focus in respect of Circadin® is to continue the process of launching, market-ing and selling the product in Europe.
Revenue Serdolect®
DKKm 2008 2007 Growth Growth*
Europe 36 24 50% 47%
Int. Markets 22 11 108% 120%
Total 58 34 68% 70%
* Local currency
“In 2009, we will review all parts of our organisation with the aim of identifying areas in which we can release funds for securing long-term growth.”
Lars Bang, Executive Vice President, Supply Operations & Engineering

17
1. korrektur 9/2-09
18
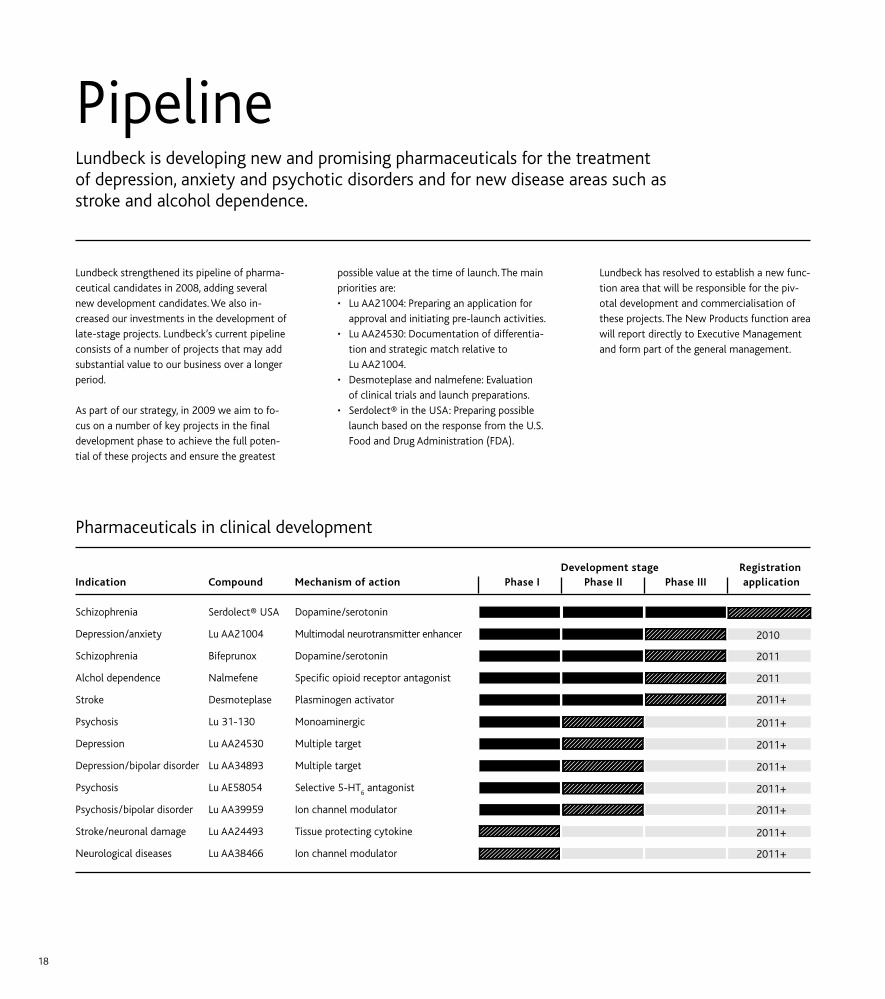
Lundbeck strengthened its pipeline of pharma-ceutical candidates in 2008, adding several new development candidates. We also in-creased our investments in the development of late-stage projects. Lundbeck’s current pipeline consists of a number of projects that may add substantial value to our business over a longer period.
As part of our strategy, in 2009 we aim to fo-cus on a number of key projects in the final development phase to achieve the full poten-tial of these projects and ensure the greatest
possible value at the time of launch. The main priorities are:• Lu AA21004: Preparing an application for
approval and initiating pre-launch activities. • Lu AA24530: Documentation of differentia-
tion and strategic match relative to Lu AA21004.
• Desmoteplase and nalmefene: Evaluation of clinical trials and launch preparations.
• Serdolect® in the USA: Preparing possible launch based on the response from the U.S. Food and Drug Administration (FDA).
Lundbeck has resolved to establish a new func-tion area that will be responsible for the piv-otal development and commercialisation of these projects. The new Products function area will report directly to Executive Management and form part of the general management.
Lundbeck is developing new and promising pharmaceuticals for the treatment of depression, anxiety and psychotic disorders and for new disease areas such as stroke and alcohol dependence.
Pipeline
Pharmaceuticals in clinical development
Development stage RegistrationIndication Compound Mechanism of action Phase I Phase II Phase III application
Schizophrenia Serdolect® USA Dopamine/serotonin
Depression/anxiety Lu AA21004 Multimodal neurotransmitter enhancer 2010
Schizophrenia Bifeprunox Dopamine/serotonin 2011
Alchol dependence nalmefene Specific opioid receptor antagonist 2011
Stroke Desmoteplase Plasminogen activator 2011+
Psychosis Lu 31-130 Monoaminergic 2011+
Depression Lu AA24530 Multiple target 2011+
Depression/bipolar disorder Lu AA34893 Multiple target 2011+
Psychosis Lu AE58054 Selective 5-HT6 antagonist 2011+
Psychosis/bipolar disorder Lu AA39959 Ion channel modulator 2011+
Stroke/neuronal damage Lu AA24493 Tissue protecting cytokine 2011+
neurological diseases Lu AA38466 Ion channel modulator 2011+

19
Depression and anxiety Lundbeck has been one of the world’s trend-setting companies in the field of depression and anxiety for more than 40 years and cur-rently has three new compounds in Phase II and Phase III development.
We aim to develop pharmaceuticals that ad-dress the medical needs – first and foremost better efficacy and faster onset of action – without causing more side effects. If our devel-opment programmes are successfully com-pleted, all three compounds could be approved and launched during 2011-2014.
Lu AE58054 improves the efficacy of other anti-psychotics. Consequently, Lundbeck ex-pects that Lu AE58054 will improve the daily functioning of patients with schizophrenia and, for example, will improve their ability to solve practical problems in their daily lives. The trial consists of 120 patients, and preliminary re-sults are expected by the end of 2009.
In an ongoing Phase IIa trial with Lu 31-130, preliminary clinical results are positive. Lu 31-130 is expected to show efficacy in both positive and negative symptoms in schizophre-nia combined with a low risk of extrapyramidal side effects (motor disturbances). In 2008, Lundbeck initiated a Phase IIb trial in which Lu 31-130 is compared with the compound olan-zapine. Lundbeck expects to report results from this trial in the second half of 2009.
Psychotic disorders/bipolar disorder Lundbeck has initiated Phase II clinical trials with the compound Lu AA39959, which is a first-in-class compound. Preclinical studies have shown anti-psychotic and anti-depres-sant-like effects. Lundbeck expects that Lu AA39959 will show clear and convincing effects in patients with bipolar disorder (manic depression) and is likely to have additional positive features such as a low switch rate to mania. The Phase II study is placebo-controlled and includes 180 patients with bipolar I or II disorder.
Lu AA34893 is being investigated in Phase II trials as a treatment for both bipolar disorder and depression.
Lu AA21004 is the most advanced compound in the development of a new class of pharma-ceutical candidates for the treatment of pa-tients with depression and anxiety. By the end of 2008, the Phase III programme included 14 trials. nine of these trials focus on the treat-ment of depression, while five focus on the treatment of generalised anxiety. Lundbeck ex-pects that the combined Phase III programme will include more than 5,000 patients.
Lu AA24530 also belongs to a new class of antidepressants. Development is progressing as planned, and the ongoing Phase II studies are expected to be completed during the first half of 2009.
The above two projects, which are being co-developed with Japanese Takeda Pharmaceuti-cal Company Ltd., and Lu AA34893 cover the entire differentiated range of mood disorders.
Psychotic disorders/schizophrenia Lundbeck and Solvay Pharmaceuticals, B.V. have initiated two Phase III clinical trials with bifeprunox for maintenance treatment of schizophrenia. Recruitment of patients for the two trials is progressing as planned. Each trial will enrol about 450 patients, who will be treated for 12 months. Results from the trials are expected to be announced in the second half of 2010.
In 2008, Lundbeck initiated Phase II trials with Lu AE58054, which was acquired through the acquisition of US biotech company Saegis Pharmaceuticals, Inc. in 2006. In preclinical trials, the compound has documented its abil-ity to improve cognition. Lu AE58054 affects other areas of the brain than other anti- psychotics. Animal trials have shown that
“We have never before initiated as many large clinical trials as we did in 2008. In 2009, our key challenge is to prepare the upcoming product launches.”
Anders Gersel Pedersen, Executive Vice President, Drug Development

20
Acute ischaemic stroke Lundbeck has initiated a Phase III trial with desmoteplase for the treatment of acute is-chaemic stroke, in which the blood supply to part of the brain is interrupted.
Desmoteplase is a modified version of a clot-dissolving protein used by the vampire bat Desmodus rotundus to prevent the blood of its prey from clotting. The compound has received fast-track designation from the U.S. Food and Drug Administration (FDA) for the indication of acute ischaemic stroke.
Today, approved medical treatment must be applied within a maximum of three hours after the stroke occurs. However, 80% of the pa-tients never make it to the hospital in time to be diagnosed within the treatment window.
The Phase III programme consists of two pla-cebo-controlled trials, each enrolling approxi-mately 320 patients. Lundbeck is recruiting pa-tients for the studies at sites in Europe, the USA, Canada, South America and Asia. Follow-ing consultations with health authorities, the trials have been designed with the aim of measuring efficacy of one dosage of desmoteplase administered in a window of be-tween three and nine hours after the stroke occurred. The efficacy of the treatment is as-sessed after 90 days.
The rights to desmoteplase are in-licensed from German PAIOn AG.
Alcohol dependence Nalmefene builds on a novel principle of treating alcohol dependence. Treatment with nalmefene is not aimed at keeping patients from drinking. Instead, the compound blocks
the mechanism in the brain that produces the desire to drink more, thereby controlling and limiting the patient’s intake of alcohol. In addi-tion, nalmefene is available as a tablet formu-lation to be taken only according to need, whereas existing pharmaceuticals must be taken continuously over a longer period of time.
A previous study documented nalmefene’s ability to significantly limit both the average alcohol intake and the number of days with an intake above five units of alcohol. This means a sharp reduction in the risk of developing dis-eases such as cardiovascular diseases, liver cir-rhosis and a number of cancers. Previous clini-cal trials have proven nalmefene to be safe and well-tolerated.
Lundbeck has launched three Phase III trials enrolling more than 1,800 patients receiving nalmefene or placebo. In the first two trials, the patients are treated over a period of six months, primarily to demonstrate efficacy, whilst patients in the third trial are treated for 12 months to confirm that the compound is well tolerated. The first data are expected in the first half of 2011. nalmefene was originally developed by BioTie of Finland. Lundbeck holds the global rights to the compound, with the exception of north America, Mexico, Turkey and South Korea.
“We consistently seek to improve our understanding of brain disorders and have promising projects in our pipeline, for example for the treatment of bipolar disorder, which is an area that is difficult to treat.”
Peter Høngaard Andersen, Executive Vice President, Research

21
1. korrektur 9/2-09

Lundbeck’s risk management systems are con-sistently updated and adapted to match exter-nal and intra-Group requirements and needs.Such revisions provide Group management with a solid basis for decisions regarding the company’s overall risk exposure and give them an overview of the activities and resources available.
Lundbeck pursues decentralised management of specific risks in those parts of the organisa-tion that have the most extensive knowledge of such risks and the best possibility of mini-mising such exposure. The individual business units take a systematic approach to monitor-ing, identifying, quantifying and responding to risks. Furthermore, we have defined reporting, decision-making and follow-up procedures and routines.
Based on reports received from its business entities every six months, Lundbeck manage-ment identifies the risks that are particularly critical for business targets. These risks are monitored in an ongoing process and, where possible, risk-reducing initiatives are taken.
The figure shows risks in the pharmaceutical value chain with accentuation of risks that Lundbeck considers particularly critical.
Research and development risks Lundbeck relies on its ability to protect its intellectual property rights in connection with new pharmaceuticals and to operate its business without infringing the rights of others. Patenting and the patent application process in pharmaceutical companies are legally and scientifically complicated processes and thus subject to a certain degree of uncertainty.
Lundbeck is taking major steps to develop and maintain competences in this area, and we consistently defend our intellectual property rights.
Throughout the research and development process, there is a risk that new pharmaceuti-cals will be delayed or have to be abandoned altogether. In 2008, Lundbeck avoided signifi-cant setbacks in late-stage projects in our own pipeline, although we did have to discontinue the development of the in-licensed anti-Alzhe-imer’s compound Flurizan® in Phase III.
In each of our late-stage projects, we thor-oughly assess whether factors such as the ini-tiation of new clinical trials or additional sup-port for patient recruitment for ongoing studies could increase the chances of a suc-cessful completion of the projects.
Lundbeck attempts to secure a reasonable balance between overall risk exposure and value-generation in a rapidly changing market.
Risk management
22
“As a pharmaceutical company, we auto-matically operate in a high-risk industry and for this reason take a systematic approach to balancing our combined business risks.”
Anders Götzsche, Executive Vice President, Finance, IT & Communication/IR
Risks in the pharmaceutical value chain
Sales and marketing risks• Price pressure and market access • Generic competition • Confidence in pharmaceuticals
• Marketing • Product liability
Research and development risks• Intellectual property rights• R&D process
• Trials and product approvals• In-licensing• Out-licensing • Tecnology
Production risks• Reliability of supply• Product recall
• Regulatory risk• Suppliers• Distribution• Intellectual property rights
Risks across the value chain • Finance • Partnerships, in-licensing and acquisitions
• Corporate governance, business ethics and public reputation• Employees and organisation

1. korrektur 9/2-09
Production risks Managing reliability of supply is crucial in en-suring that patients constantly have access to the pharmaceuticals they need. For this reason, Lundbeck carefully monitors the supply situa-tion and as a rule maintains an inventory level that will help it overcome a production break-down. In addition, Lundbeck has prepared plans for accessing alternative production facilities.
In rare cases, pharmaceutical companies are forced to recall a product from the market due to a problem with the safety or quality of the medicine. Lundbeck has systems and pro-cedures in place to ensure a swift and effective response if the need should arise.
Sales and marketing risks The pharmaceutical market is characterised by the aim of the authorities to reduce prices and regulate access to the market in order to cap increases in healthcare costs. Market changes such as price reductions may have a considerable impact on the earnings potential of pharmaceuticals.
We expect that additional healthcare reforms will be initiated in several markets and that such reforms will reduce prices and restrict ac-cess for pharmaceuticals.
The sale of counterfeit medicine in the phar-maceuticals market, also online, has become a growing problem in recent years. However, only a few cases of counterfeit Lundbeck medi-cations have been seen, with 14 cases in 2008 versus 11 in 2007. Lundbeck pursues all cases through its Anti-Counterfeit Task Force and is a member of the World Health Organisation’s (WHO) anti-counterfeit organisation IMPACT.
Risks across the value chain Lundbeck has a number of financial risks, such as currency, interest rate and credits risks.
The bulk of the Group’s commercial transac-tions are settled in foreign currency. Foreign currency exposure is reduced by hedging posi-tions in the most important foreign currencies through forward and option contracts and, to a minor extent, by raising foreign currency loans.
At the present time, the currency risk is prima-rily associated with movements in the US dol-lar and in a number of other currencies, includ-ing the UK pound.
By the end of 2008, Lundbeck had hedged in-come in these currencies for the majority of 2009. Accordingly, if the exchange rates
We are continuously working with the health authorities to document the value of our phar-maceuticals. Also, Lundbeck continuously seeks to adjust its organisation to accommo-date changes in market conditions.
Lundbeck monitors and analyses the Group’s intellectual property rights and the risks of generic competition in depth. We believe that the Group’s intellectual property rights are valid and enforceable, and it is our policy to defend intellectual property rights energeti-cally, wherever they may be infringed.
Lundbeck is involved in pending patent trials in Australia, Austria, Belgium, Canada, Denmark, France, Germany, the netherlands, norway, Portugal, the UK and the USA in respect of in-tellectual property rights concerning escitalo-pram.
new clinical trials, publications and letters to the editor may change the perception of the position of our pharmaceuticals relative to competing products. Lundbeck invests consid-erable resources in establishing a factual and scientific foundation that allows doctors and patients to maintain confidence in our pharmaceuticals.
Australia In April 2008, the court of first in-
stance ruled that the patent under-
lying escitalopram in Australia is
valid and therefore secured until
2009. The judge also decided not to
sustain a five-year patent extension
until 2014. Both parties have ap-
pealed parts of the decision.
United KingdomIn April 2008, the English Court of
Appeals In the Supreme Court ruled
that escitalopram is new and inno-
vative. The court also found in fa-
vour of Lundbeck with respect to
the patent underlying escitalopram
being valid. The court of first in-
stance had partially found against
Lundbeck with reference to specific
English case law, which was over-
ruled with this decision. The case
has been won in House of Lords
after an appeal from the opponent.
GermanyIn 2007, the German health authori-
ties issued a marketing authorisa-
tion for a generic version of escita-
lopram. The authorisation was
subsequently suspended.
In Q3 2008, Lundbeck won a case
before the German appeals court
Oberverwaltungsgericht für das
Land nordrhein-Westfalen, which
upheld the ruling from the court of
first instance. This court established
that the suspension of the market-
ing authorisation for generic escita-
lopram in Germany cannot be re-
pealed.
At the same time, Lundbeck is in-
volved in a pending lawsuit con-
cerning the intellectual property
rights behind escitalopram. The case
has been appealed, and Lundbeck
expects a decision by the German
appeals court within the next
couple of years.
Decisions in key patent cases
23
Sales and marketing risks• Price pressure and market access • Generic competition • Confidence in pharmaceuticals
• Marketing • Product liability

1. korrektur 9/2-09
24
Partnerships mean that Lundbeck does not retain full control of the individual projects and products. To ensure that we reach our tar-gets, we pursue a close and open dialogue with our partners to share ideas and best practices in sales, marketing, production and develop-ment.
The in-licensing of pharmaceuticals is charac-terised by sharp competition. This involves the risk that prices of attractive projects are pushed up to a level that would render them unprofitable, considering the risk involved.
change during 2009, this will only have little impact on Lundbeck’s financial results for the present year, but it may affect financial per-formance from 2010 onwards.
The interest rate risk related to the Group’s bond portfolio, debt portfolio and cash hold-ings is reduced by seeking short duration on both the asset side and the liabilities side.
The credit risk that arises in connection with the sale of goods, the Group’s bond portfolio and cash holdings is reduced by avoiding credit risk concentration and by diversifying receiva-bles on a large number of creditworthy trading partners. In addition, the Group exclusively deals with banks that have a high credit rating.
Key partnerships
Company Compound Indication
BioTie Therapies Corp. nalmefene Alcohol dependenceForest Laboratories, Inc. Escitalopram Depression, anxietyMerz Pharmaceuticals GmbH Memantine Alzheimer’s diseaseMochida Pharmaceutical Co. Escitalopram Depression, anxietyneurim Pharmaceuticals Ltd. Melatonin Primary insomniaPAIOn AG Desmoteplase StrokeSolvay Pharmaceuticals B.V. Bifeprunox SchizophreniaTakeda Pharmaceutical Company Ltd. Lu AA21004/Lu AA24530 Depression, mood disorders, anxietyTeva Pharmaceutical Industries Ltd. Rasagiline Parkinson’s diseaseXian-Janssen Pharmaceutical Ltd. Escitalopram/Citalopram Depression, anxiety

25
1. korrektur 9/2-09

26
In recent years, CSR has become a topic of in-creased awareness among the authorities, trade organisations, the media, investors and employees. Companies are expected to place more focus on business ethics and social re-sponsibility. The Danish parliament recently passed a new law under which all Danish com-panies above a certain size must formally take a position on their social responsibility.
Because the pharmaceutical market is charac-terised by strict regulation, it is only natural for Lundbeck to be governed by special CSR rules. Patients must continue to feel safe using our pharmaceuticals, and we must run our busi-ness in an ethically responsible manner throughout the value chain.
Lundbeck’s management believes it is pivotal for the company to comply with all relevant national and international legislation, including the rules and guidelines issued by public insti-tutions such as the U.S. Food and Drug Admin-istration (FDA) and the European Medicines Agency (EMEA). In addition, Lundbeck has es-tablished policies and procedures to ensure re-sponsible business ethics in specific areas in which it is important to maintain higher eth-ical standards than those required by local
legislation. For example, Lundbeck has special policies and guidelines for areas such as cor-ruption, animal ethics, health and safety, and the environment.
Systematic initiatives Lundbeck’s corporate values are the company’s general management tool for ensuring that Lundbeck achieves its business goals in an eth-ically responsible manner. Furthermore, it is important that topics relating to ethics and CSR are integrated into Lundbeck’s activities and anchored in the business areas in which they are relevant.
In 2008, Lundbeck’s management resolved to systematise and further improve the compa-ny’s CSR initiatives. Our goal is to build a com-mon framework for the company’s CSR activi-ties, and to achieve this we have set up a CSR committee reporting to Executive Manage-ment and a corporate unit responsible for these activities. From now on, the CSR organi-sation will monitor trends, analyse them and communicate their relevance, ensuring that Lundbeck’s activities are reported.
Our goal for 2009 is to develop a simple and effective strategy to coordinate CSR initiatives
with measurable actions in the years ahead. Built on Lundbeck’s values and long-standing experience with topics on the CSR agenda, the strategy is intended to integrate Lundbeck’s social responsibility with its business proce-dures to make a positive contribution to the long-term development of our operations.
Our efforts will be rooted in a review of Lund-beck’s policies and guidelines and the topics on the CSR agenda that are of particular im-portance to Lundbeck. The first specific results will be an overall description of Lundbeck’s business ethics and a concise set of rules for decisions and conduct of Lundbeck staff (Code of Conduct).
In 2008, Lundbeck resolved to strengthen initiatives within corporate social responsibility (CSR). We have set up a dedicated CSR unit that pursues a business-oriented strategy in consultation with Lundbeck’s stakeholders.
Corporate social responsibility
The Lundbeck Institute The objective of the Lundbeck Institute is to improve through education and information the treatment of patients suffering from psy-chiatric and neurological disorders.
In 2008, the Institute held 12 seminars at-tended by 281 people from 28 countries. Since its foundation in 1997 more than 100,000 doctors and other healthcare professionals have attended follow-up seminars in their
home countries via the educational cascade, which helps to make the Institute unique.
A faculty of 86 international specialists collab-orate with the Institute. In 2008, the Lundbeck Institute set up a local organisation in China with a view to training psychiatrists and neu-rologists and alter the perception of brain dis-orders in China.
CSR examples in 2008

1. korrektur 9/2-09
27
1954: Lundbeck Foundation is founded The Lundbeck Foundation was established as a commercial foundation whose objectives are to support and expand the activities of the Lundbeck Group and provide financial backing for high-quality scientific research. 70% of Lundbeck’s dividend payments are received by the Lundbeck Foundation, who paid out DKK 328 million to research in 2008.
1978: New environmental department Lundbeck sets up its first environmental department to comply with environmental requirements and minimise the company’s environmental impact.
1997: Lundbeck Institute The objective of the Institute is, through edu-cation and information, to improve the treat-ment of patients suffering from psychiatric and neurological disorders.
2001: Animal ethics committee Lundbeck sets up an animal ethics committee to provide an independent evaluation of the company’s use of laboratory animals and to make recommendations on how to promote animal ethics and welfare.
2004: Drugs and environment Lundbeck resolves to test the environmental impact of all of its new pharmaceuticals.
2005: FTSE4Good Lundbeck is admitted to the FTSE4Good share index, whose sustainability criteria include en-vironmental aspects, human rights, supply chain labour standards, anti-corruption and stakeholder collaboration.
2005: Global HS&E strategy Lundbeck implements a new HS&E strategy with a view to coordinating its HS&E initia-tives and among other things ensuring global ISO 14001 and OHSAS 18001 certification of sites engaged in research, development and production.
2006: Responsible supply chain Lundbeck implements a new system to ensure suppliers meet its requirements with respect to environmental protection and staff working environment and conditions.
CSR milestones
2007: CO strategy Lundbeck adopts a CO
2 strategy aimed at minimis-
ing energy consumption and capping CO2 emissions
on 2006 level towards 2016.
2007: Corporate ombudsman Lundbeck sets up an independent corporate om-budsman function to ensure fair treatment of em-ployees in accordance with Lundbeck’s policies and corporate values.
2008: Occupational Health and Safety Lundbeck is nominated to receive Denmark’s Occu-pational Health and Safety Award for its efforts to prevent work-related stress.
2008: New CSR unit Lundbeck starts to set up an organisation with the aim of developing a simple and effective CSR strategy with measurable activities.
Health, safety and environment The field of health, safety and environment (HS&E) represents a key asset in Lundbeck’s CSR initiatives. With the support of manage-ment and employees alike, the HS&E strategy has helped to ensure significant progress in ac-cordance with the company’s policy.
In 2008, Lundbeck completed the roll-out of its HS&E system at all physical sites engaged in research, development and production. The
system helps to ensure compliance with legal requirements and Lundbeck’s in-house policy as well as ongoing improvements based on an-nual targets. With the inclusion of headquar-ters in 2008 all European sites have now re-ceived external recognition of their efforts through international ISO 14001 and OHSAS 18001 certification.
At www.lundbeck.com/sustainability we will re-lease a report containing data and a number of
cases about the HS&E initiatives at Lundbeck’s manufacturing facilities and research sites in 2008.
Animal welfare Each year, Lundbeck’s animal ethics commit-tee grants an award to employees who make a special effort to improve the welfare of labora-tory animals. The 2008 award was granted for an initiative that significantly improved condi-tions for dogs at Lundbeck’s Vestermarksgaard facilities in Denmark.
2

28
Share
In 2008, Lundbeck was once again among the most traded Danish shares on the nasdaq OMX Copenhagen exchange, and Lundbeck’s shares are a component of the leading Danish OMXC20 index. The share price closed the year at DKK 110 after a year-high closing price of DKK 138.75 on 14 January 2008. The lowest closing price was DKK 90.50 on 10 October 2008.
The OMXC20 index dropped 46.6% in 2008. In comparison, Lundbeck shares fell 20.3%. The latter part of the year was characterised by the global financial crisis, during which Lundbeck and the rest of the pharmaceutical industry outperformed the total market. The MSCI Europe Pharmaceuticals Index lost 13.7% in 2008.
Turnover Total trading in Lundbeck shares amounted to DKK 10 billion in 2008. The average daily turn-over was 344,288 shares in 2008.
Trading in Lundbeck shares and other shares in the OMXC20 index was substantially lower than in 2007.
Lundbeck is one of the most frequently traded Danish companies and is a component of the leading OMXC20 share index. The share price performance in 2008 ranked among the best of the OMXC20 companies.
Historical stock performance 1 year 3 years 5 years
Lundbeck -20.3% -15.7% 12.2%
OMXC20 -46.6% -37.1% 1.4%
MSCI Europe Pharmaceuticals -13.7% -20.4% 1.9%

1. korrektur 9/2-09
29
Dividend It is the intention of Lundbeck’s Supervisory Board to pay a dividend of 25-35% of the profit for the year after tax, with due consider-ation to the company’s growth plans, possible acquisitions and other liquidity requirements.
For the year 2008, Lundbeck’s Supervisory Board proposes a dividend of 30% of the net profit for the year after tax, corresponding to DKK 2.30 per share.
Lundbeck shares are traded ex-dividend the day after the Annual General Meeting, which will be held on 21 April 2009. The dividend will be paid automatically via the Danish Securities Centre on 27 April 2009.
Share buyback programme On 22 May 2008, Lundbeck resolved to ter- minate its share buyback programme, which entitled the company to acquire treasury shares
who has notified the company that it holds more than 5% of the share capital.
Institutional investors in north America contin-ued to increase their holdings of Lundbeck shares to hold approximately 32% of the free float at 31 December 2008. This is an increase of 11% relative to 2007 and of 233% relative to 2006. Throughout 2008, European investors re-duced their holdings from 20% to 18%, whilst Danish investors at the end of 2008 held 22%, down from 24% at the end of 2007.
The share of the free float held by private, Dan-ish investors declined to 14% at the end of 2008 from 15% at 31 December 2007.
At the end of 2008, H. Lundbeck A/S held 769,648 treasury shares equivalent to 0.4% of the total number of shares.
At the end of 2008, members of Lundbeck’s Su-pervisory Board and Executive Management held a total of 82,270 Lundbeck shares.
The company’s shares are registered by name and are entered in the register of shareholders. At the end of 2008, 25,536 registered sharehold-ers held 96.4% of the share capital.
for up to DKK 6 billion during the period from 2005 to 2008.
During that period, Lundbeck bought back treasury shares for a total of DKK 4,047,608,042, corresponding to 30,319,784 shares. In 2008, Lundbeck bought back 4,510,084 treasury shares for an amount of DKK 538,292,592.
Through its wholly owned subsidiary LFI a/s, the Lundbeck Foundation has participated in the buyback on a pro-rata basis in order to maintain a free float in the company’s shares of approximately 30%.
Shareholders Through LFI a/s, the Lundbeck Foundation, which is the company’s largest shareholder, held 137,351,918 shares at the end of 2008, corre-sponding to 69.76% of the shares and votes in H. Lundbeck A/S. LFI a/s is the only shareholder
Free float ownership 2004-2008 2008 2007 2006 2005 2004Institutional, Denmark 22% 24% 33% 43% 38%Institutional, rest of Europe 18% 20% 24% 13% 10%Institutional, north America 32% 28% 9% 15% 28%Private, Denmark 14% 15% 21% 22% 20%Others incl. non-identified 14% 13% 13% 7% 5%

30
1. korrektur 9/2-09
Investor Relations Through ongoing communication with the company’s potential and existing shareholders and equity analysts, Lundbeck aims to give a true and fair view of the company’s activities. We seek to provide the optimum insight to the equity market by conveying relevant and con-sistent information about Lundbeck’s visions and goals, business areas and financial devel-opments.
This is done through ongoing dialogue with equity market stakeholders, including frequent meetings with investors and analysts. In 2008, Lundbeck held nearly 300 investor meetings, primarily with stakeholders in Europe and the USA.
At the presentation of Lundbeck’s interim fi-nancial statements, we hold roadshows at which our Investor Relations department and senior management inform investors and ana-lysts about the latest company developments.
Investor Relations contacts
Jacob TolstrupDirector, IR & CommunicationTel. + 45 36 43 30 [email protected]
Palle Holm OlesenHead of Investor RelationsTel. +45 36 43 24 [email protected]
30
Financial calendar
21 April 2009 Annual General Meeting
27 April 2009 Dividend pay out
13 May 2009 Interim report for the first quarter of 2009
13 August 2009 Interim report for the second quarter of 2009
3 november 2009 Interim report for the third quarter of 2009
Analyst coverage
Company Name Website
ABG Sundal Collier Peter Hugreffe Ankersen www.abgsc.com
Alm. Brand Markets Michael Friis Jørgensen www.markets.almbrand.dk
Carnegie Bank Carsten Lønborg Madsen www.carnegie.dk
Credit Suisse Ravi Mehrotra / Yasir Al-Wakeel www.credit-suisse.com
Danske Equities Martin Parkhøi www.danskeequities.com
Exane BnP Paribas Sébastien Berthon www.exane.com
Goldman Sachs Dani Saurymper www.gs.com
Handelsbanken Michael novod www.handelsbanken.com
Jyske Bank Frank Hørning Andersen www.jyskemarkets.com
Bank of America- Merrill Lynch Brigitte de Lima www.ml.com
Morgan Stanley Andrew Baum www.morganstanley.com
nordea Lars Hatholt www.nordea.com
Oppenheim Peter A. Düllmann www.oppenheim.com
Redburn Partners Paul Major / Anita Vasu www.redburn.com
SEB Enskilda Henrik D. Simonsen www.enskilda.com
Standard & Poors John Reeve www.standardandpoors.com
Sydbank Rune Majlund Dahl www.sydbank.dk
UBS Tim Race www.ubs.com
Share ratios
2008 2007 2006
Earnings per share (EPS) (DKK) 7.67 8.63 5.24
Diluted earnings per share (DEPS) (DKK) 7.67 8.63 5.23
Operating cash flow per share (DKK) 14.12 13.18 6.59
net asset value per share (DKK) 38.71 35.81 32.40
Dividend (DKK) 2.30 2.56 1.57
Dividend pay-out ratio 30% 30% 30%
Dividend yield 2.1% 1.9% 1.0%
Market price, year-end 110.00 138.00 155.75
High market price 138.75 170.25 155.75
Low market price 90.50 125.50 122.25
Price/Earnings 14.34 16.00 29.80
Price/Cash flow 7.79 10.47 23.66
Price/net asset value 2.84 3.85 4.81
Market capitalisation, year-end (DKKbn) 21.7 28.6 33.1
Annual trading, million of shares 86.1 164.3 168.3
Average trading per trading day, thousands of shares 344.3 665.1 659.8
Share facts, end 2008
number of shares ................................................. 196,886,282
Share capital ................................................. DKK 984,431,410
nominal value .................................................................... DKK 5
Holding of treasury shares ......................................... 769,648
Free float ............................................................................... 29.8%
IPO ............................................................................. 18 June 1999
Stock exchange ........................... nasdaq OMX Copenhagen
ISIn number ..................................................... DK0010287234
Ticker:
............................................................................. LUn.CO (Reuters)
..................................................................... LUn DC (Bloomberg)
ADR programme .................................................. Unsponsored
ADR trading code ............................................................. HLUKY
CUSIP number ........................................................ 40422M107
Larger indices:
............................................................................................. OMXC20
.................................................................. Dow Jones STOXX 600
......................................................................... FTSE4Good Europe

31
1. korrektur 9/2-09

32
1. korrektur 9/2-09
Headquartered in Denmark, Lundbeck is an in-ternational company with employees in 55 countries. More than 60% of our staff are em-ployed outside Denmark, a percentage that has increased over the past few years.
High performance culture Lundbeck aims to build a high performance culture in which all employees are aware of what is expected of them and in which they are encouraged to make a difference in the company’s endeavours to accomplish its ambi-tion of becoming the leading pharmaceutical company in the field of brain disorders.
Competent and committed employees are crucial if Lundbeck is to achieve its goals and tackle future challenges. Equally important, however, are ensuring the optimum conditions for employees to apply their skills.
Management has defined a high performance culture as the fifth priority area aimed at de-veloping the company.
The process is rooted in the values that are presently the cornerstones of the Lundbeck culture: imagination, passion and responsibility. These values build on a number of basic as-
sumptions that represent the foundation for safeguarding Lundbeck’s continued success.
The corporate culture that Lundbeck’s man-agement wishes to encourage must provide room for dedicated employees who generate new ideas, who can foresee barriers, and who act responsibly towards the stakeholders of the company.
The road to changeManagement is confident that the transition to a new corporate culture will be gradual and based on our current culture.
In 2009, Lundbeck intends to work far more systematically than previously in rolling out its targets. All employees must be aware of and understand Lundbeck’s general strategy as well as the targets and their importance for the business unit in which they work. Moreover, each target must be clearly connected with our business.
It should be worthwhile to make an extra ef-fort and we will ensure that transparent mech-anisms are in place to link performance, reward and recognition. In this way, we will make sure that each individual employee knows when
they have performed well and what could have been done better. At the same time, this pro-vides us with valuable knowledge that allows Lundbeck to target its improvement initiatives and reward extraordinary results.
A special effort will be aimed at developing Lundbeck’s managers and at ensuring that every-one knows exactly how they are expected to contribute and how their performance is eval-uated.
We are aware of the importance of giving spe-cial attention to employees with core compe-tencies. We will also update our organisational review process in 2009, in order to identify employees who have the potential to assume leadership positions and to follow up with pro-grammes dedicated to developing and retain-ing such individuals.
Corporate governance All links in the pharmaceutical value chain are represented in our six-member Executive Management. In addition, Lundbeck’s general management also includes the function areas Business Development, HR, Legal and new Products (projects in late development).
High performance culture is the fifth and last priority area, aimed at making Lundbeck the company that makes the biggest difference worldwide in the treatment of patients with brain disorders.
Organisation
32
”Imaginative” underlines a need for daring to be different. Behind this value lies the assumption that
it is necessary to be open to new knowledge and alternative solutions. This assumption is the corner-
stone of Lundbeck’s value chain, from research and development to production, marketing and sales.
”Passionate” refers to a long-standing tradition of never giving up. Historically, Lundbeck has
met with setbacks – and will most likely meet them again – in the effort to find new treatments of
brain disorders.
”Responsible” means that Lundbeck employees are expected to do the right thing and act
responsibly towards colleagues, the environment and the external community.
Lundbeck’s corporate values

33
1. korrektur 9/2-09
Lundbeck has implemented the corporate gov-ernance recommendations set out by the nas-daq OMX Copenhagen exchange. The Supervi-sory Board believes that the Group meets all of these corporate governance recommendations, except for disclosure about the amount of the remuneration paid to individual members of the Supervisory Board and Executive Manage-ment. Furthermore, Lundbeck does not disclose the number of shares held by each individual member of the Supervisory Board nor any changes to the number of shares held, as we do not believe that this would provide relevant information.
A detailed description of the Supervisory Board’s considerations in respect of the nas-daq OMX Copenhagen recommendations is available on www.lundbeck.com/aboutus.
Supervisory Board Lundbeck’s Supervisory Board is responsible for defining the company’s general strategy, setting goals for Executive Management and ensuring that members of the Executive Management and other managers have the right qualifica-tions. The Board also evaluates management and the remuneration to the management.
concerning the appointment of external audi-tors.
Based on feedback from the Audit Committee, the Supervisory Board has full confidence in the Lundbeck Group’s financial reports and relevant procedures.
Remuneration CommitteeThe purpose of the Remuneration Committee is to provide the Supervisory Board with the best possible basis for making decisions on the total remuneration provided to the members of the Executive Management. The Committee also handles assignments related to recruitment and appointments to Lundbeck’s senior manage-ment.
Remuneration – Supervisory Board Members of the Supervisory Board receive a fixed remuneration and are not included in the Group’s bonus and incentive programmes. In addition, the members of the audit and remu-neration committees receive a separate fee.
The basic remuneration of the Supervisory Board will remain unchanged in 2009. An ordi-nary board member receives DKK 300,000,
In 2008, the Supervisory Board undertook the important tasks of evaluating strategic initia-tives, ensuring consistently strong financial re-sults and implementing a new remuneration policy. The Board chairman also put in a great deal of work in the spring of 2008 in the run-up to the appointment of Ulf Wiinberg as Lund-beck’s new President and CEO.
Board competenciesEgil Bodd was elected to Lundbeck’s Supervisory Board in 2008. The current Board members are believed to possess the financial, strategic and business competencies required to serve on the board of an international pharmaceutical group.
The Supervisory Board has evaluated its work in the beginning of 2009.
Audit CommitteeThe Audit Committee provides advice to the Su-pervisory Board and evaluates financial report-ing, reporting procedures and other financial in-formation. To this can be added internal controls in relation to financial reporting to en-sure consistency and transparency, review of re-ports submitted by the auditors and recom-mendations to the Supervisory Board
33
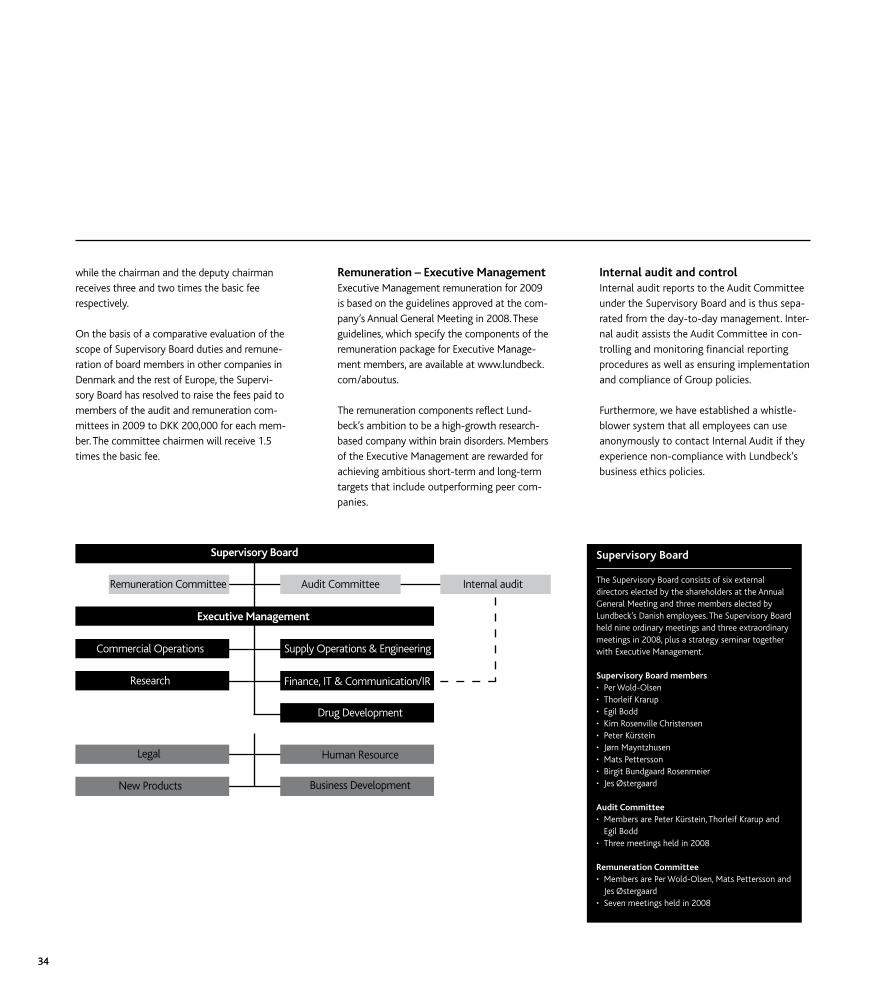
3434
Internal audit and control Internal audit reports to the Audit Committee under the Supervisory Board and is thus sepa-rated from the day-to-day management. Inter-nal audit assists the Audit Committee in con-trolling and monitoring financial reporting procedures as well as ensuring implementation and compliance of Group policies.
Furthermore, we have established a whistle-blower system that all employees can use anonymously to contact Internal Audit if they experience non-compliance with Lundbeck’s business ethics policies.
Remuneration – Executive ManagementExecutive Management remuneration for 2009 is based on the guidelines approved at the com-pany’s Annual General Meeting in 2008. These guidelines, which specify the components of the remuneration package for Executive Manage-ment members, are available at www.lundbeck.com/aboutus.
The remuneration components reflect Lund-beck’s ambition to be a high-growth research-based company within brain disorders. Members of the Executive Management are rewarded for achieving ambitious short-term and long-term targets that include outperforming peer com-panies.
while the chairman and the deputy chairman receives three and two times the basic fee respectively.
On the basis of a comparative evaluation of the scope of Supervisory Board duties and remune-ration of board members in other companies in Denmark and the rest of Europe, the Supervi-sory Board has resolved to raise the fees paid to members of the audit and remuneration com-mittees in 2009 to DKK 200,000 for each mem-ber. The committee chairmen will receive 1.5 times the basic fee.
Supervisory Board
The Supervisory Board consists of six external directors elected by the shareholders at the Annual General Meeting and three members elected by Lundbeck’s Danish employees. The Supervisory Board held nine ordinary meetings and three extraordinary meetings in 2008, plus a strategy seminar together with Executive Management.
Supervisory Board members• Per Wold-Olsen• Thorleif Krarup• Egil Bodd• Kim Rosenville Christensen• Peter Kürstein• Jørn Mayntzhusen• Mats Pettersson• Birgit Bundgaard Rosenmeier• Jes Østergaard
Audit Committee• Members are Peter Kürstein, Thorleif Krarup and Egil Bodd• Three meetings held in 2008
Remuneration Committee• Members are Per Wold-Olsen, Mats Pettersson and Jes Østergaard• Seven meetings held in 2008

35
1. korrektur 9/2-09

36
1. korrektur 9/2-09

3737
Ulf Wiinberg
President and CEO
Born 29 november 1958
Anders Götzsche
Executive Vice President, Finance, IT & Communication/IR
Born 31 December 1967
DirectorshipsLifeCycle Pharma A/S
Stig Løkke Pedersen
Executive Vice President, Commercial Operations
Born 17 July 1961
Directorshipsnuevolution A/S (chairman)Vernal A/S (chairman)
Anders Gersel Pedersen
Executive Vice President, Drug Development
Born 12 September 1951
DirectorshipsALK-Abelló A/SGenmab A/S (deputy chairman)TopoTarget A/S
Peter Høngaard Andersen
Executive Vice President, Research
Born 3 October 1956
DirectorshipsEpitherapeutics ApSSerendex Aps
Lars Bang
Executive Vice President, Supply Oper-ations & Engineering
Born 31 July 1962
DirectorshipsDentoFit A/S Fertin Pharma A/S
At 31 December 2008
Executive Management

38
At 31 December 2008
Supervisory Board
Per Wold-OlsenChairman
Chairman, Remuneration Committee
Elected at the 2007 General Meeting
Born 6 november 1947
DirectorshipsBankInvest Biomedical Venture Advisory Board Exiqon A/S Gilead Global Advisory Board (chairman)Gn Store nord (chairman)Medicines for MalariaVenturePharmanet
Thorleif KrarupDeputy chairman
Member, Audit Committee
Elected at the 2004 General Meeting
Born 28 August 1952
DirectorshipsALK-Abelló A/S (deputy chairman)Bang & Olufsen A/SBrightpoint, Inc.Exiqon A/S (chairman)Group 4 Securicor plcLFI a/s (deputy chairman)Lundbeckfonden Sport One Danmark A/S (chairman)
Peter Kürstein
Chairman, Audit Committee
Elected at the 2001 General Meeting
Born 28 January 1956
President and CEO, Radiometer A/S
DirectorshipsFoss A/S (chairman)Radiometer Medical ApS
Egil Bodd
Member, Audit Committee
Elected at the 2008 General Meeting
Born 15 March 1955
Managing partner, Lindsay Goldberg nordic
DirectorshipsLindsay Goldberg nordic AS (chairman)Mininaste AS (chairman)Scandza Holdings (chairman)Sørlandschips AS (chairman)
Kim Rosenville Christensen
Elected by the employees in 2006
Born 17 April 1959
Synthesis Operator
39
Mats Pettersson
Member, Remuneration Committee
Elected at the 2003 General Meeting
Born 7 november 1945
DirectorshipsAblynx nVMetacure IncnsGene AS (chairman)Photocure ASSwedenBio AB to-BBB Holding B.V.
Jes Østergaard
Member, Remuneration Committee
Elected at the 2003 General Meeting
Born 5 March 1948 DirectorshipsaCROnordic A/S Aresa A/Silochip A/SLFI a/s LundbeckfondenScion-DTU a/s
Birgit Bundgaard Rosenmeier
Elected by the employees in 1993
Born 12 August 1952
Qualified Person 1st Deputy
Jørn Mayntzhusen
Elected by the employees in 2008
Born 4 April 1966
Head of Department, Customer Centre Supply

1. korrektur 9/2-09

41
Consolidated financial statements for 2008
Summary for the Group 42
Financial review 44
Income statement 47
Balance sheet 48
Statement of changes in equity 50
Cash flow statement 51
Notes
1. Accounting policies 52
2. Segment information 60
3. Staff costs 61
4. Amortisation and depreciation 66
5. Audit fees 66
6. Net financials 67
7. Tax on profit for the year 67
8. Intangible assets and property,
plant and equipment 68
9. Investments in associates 71
10. Other investments and other receivables 71
11. Inventories 72
12. Trade receivables and other receivables 72
13. Share capital 74
14. Pension obligations and similar obligations 75
15. Deferred tax liabilities 77
16. Provisions 78
17. Mortgage and bank debt 78
18. Contractual obligations 80
19. Contingent liabilities 80
20. Financial instruments 81
21. Related parties 86
22. Earnings per share 87
23. Adjustments 87
24. Working capital changes 87
25. Cash resources 87
26. Releases from H. Lundbeck A/S in 2008 88
27. Events after the balance sheet date 89

42
2008 2007 2006 2005 2004
Income statement (DKKm)
Revenue 11,282 10,985 9,221 9,070 9,733
Profit before research and development costs 5,334 4,865 3,738 3,943 4,342
Research and development costs 2,992 2,187 1,958 1,782 1,776
Profit from operations 2,352 2,695 1,784 2,170 2,554
Net financials (185) (50) (64) 108 16
Profit before tax 2,123 2,562 1,633 2,242 2,521
Profit for the year 1,510 1,770 1,107 1,574 1,689
Profit for the year, shareholders in the parent company 1,510 1,770 1,107 1,584 1,709
Assets (DKKm)
Non-current assets 5,467 5,726 6,104 5,754 5,555
Inventories 837 924 1,155 1,267 1,282
Receivables 2,223 2,368 1,994 1,938 1,770
Cash and securities 3,875 3,308 2,378 2,669 2,902
Assets held for sale 205 - - - -
Total assets 12,607 12,326 11,631 11,628 11,509
Equity and liabilities (DKKm)
Equity 7,592 7,185 6,765 7,492 7,839
Non-current liabilities 2,594 2,502 2,171 900 867
Current liabilities 2,421 2,639 2,695 3,236 2,803
Total equity and liabilities 12,607 12,326 11,631 11,628 11,509
Cash flow statement (DKKm)
Cash flows from operating activities 2,780 2,705 1,394 2,074 2,678
Cash flows from investing activities (587) (1,095) 239 (487) (1,794)
Cash flows from operating and investing activities 2,193 1,610 1,633 1,587 884
Cash flows from financing activities (1,016) (1,012) (901) (1,682) (863)
Interest-bearing net cash at year-end 1,949 1,405 876 2,240 2,391
Key figures
EBIT margin (%) 20.8 24.5 19.3 23.9 26.2
Return on capital employed (%) 29.8 34.9 25.2 32.0 37.0
Return on equity (%) 20.4 25.3 15.6 20.7 23.2
Research and development costs as a percentage of revenue 26.5 19.9 21.2 19.6 18.2
Solvency ratio (%) 60.2 58.3 58.2 64.4 68.1
Capital employed (DKKm) 9,519 9,088 8,267 7,920 8,351
Capital turnover (%) 89.5 89.1 79.3 78.0 84.6
Intangible assets investments, gross (DKKm) 817 274 190 159 8
Property, plant and equipment investments, gross (DKKm) 229 474 567 447 305
Financial investments, gross (DKKm) 1,033 844 3,556 4,059 5,211
Average number of employees 5,208 5,134 5,111 5,022 5,155
Summary for the Group 2004-2008
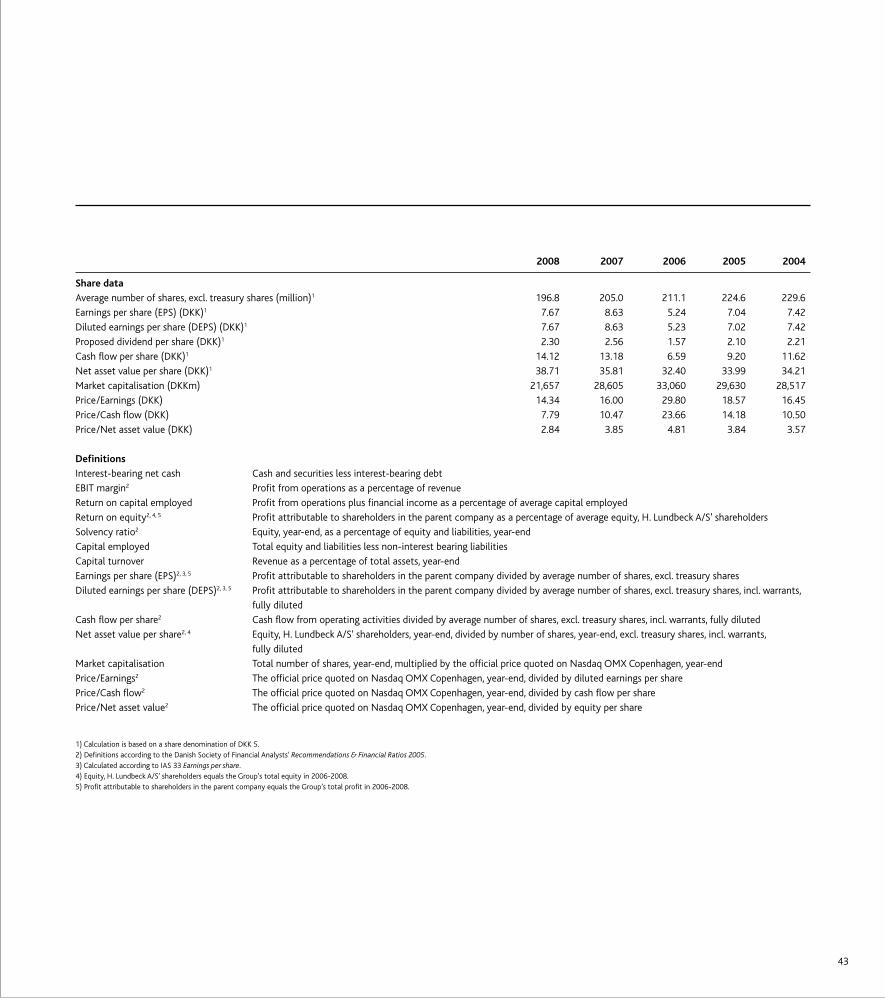
43
2008 2007 2006 2005 2004
Share data
Average number of shares, excl. treasury shares (million)1 196.8 205.0 211.1 224.6 229.6
Earnings per share (EPS) (DKK)1 7.67 8.63 5.24 7.04 7.42
Diluted earnings per share (DEPS) (DKK)1 7.67 8.63 5.23 7.02 7.42
Proposed dividend per share (DKK)1 2.30 2.56 1.57 2.10 2.21
Cash flow per share (DKK)1 14.12 13.18 6.59 9.20 11.62
Net asset value per share (DKK)1 38.71 35.81 32.40 33.99 34.21
Market capitalisation (DKKm) 21,657 28,605 33,060 29,630 28,517
Price/Earnings (DKK) 14.34 16.00 29.80 18.57 16.45
Price/Cash flow (DKK) 7.79 10.47 23.66 14.18 10.50
Price/Net asset value (DKK) 2.84 3.85 4.81 3.84 3.57
Definitions
Interest-bearing net cash Cash and securities less interest-bearing debt
EBIT margin2 Profit from operations as a percentage of revenue
Return on capital employed Profit from operations plus financial income as a percentage of average capital employed
Return on equity2, 4, 5 Profit attributable to shareholders in the parent company as a percentage of average equity, H. Lundbeck A/S’ shareholders
Solvency ratio2 Equity, year-end, as a percentage of equity and liabilities, year-end
Capital employed Total equity and liabilities less non-interest bearing liabilities
Capital turnover Revenue as a percentage of total assets, year-end
Earnings per share (EPS)2, 3, 5 Profit attributable to shareholders in the parent company divided by average number of shares, excl. treasury shares
Diluted earnings per share (DEPS)2, 3, 5 Profit attributable to shareholders in the parent company divided by average number of shares, excl. treasury shares, incl. warrants,
fully diluted
Cash flow per share2 Cash flow from operating activities divided by average number of shares, excl. treasury shares, incl. warrants, fully diluted
Net asset value per share2, 4 Equity, H. Lundbeck A/S’ shareholders, year-end, divided by number of shares, year-end, excl. treasury shares, incl. warrants,
fully diluted
Market capitalisation Total number of shares, year-end, multiplied by the official price quoted on Nasdaq OMX Copenhagen, year-end
Price/Earnings2 The official price quoted on Nasdaq OMX Copenhagen, year-end, divided by diluted earnings per share
Price/Cash flow2 The official price quoted on Nasdaq OMX Copenhagen, year-end, divided by cash flow per share
Price/Net asset value2 The official price quoted on Nasdaq OMX Copenhagen, year-end, divided by equity per share
1) Calculation is based on a share denomination of DKK 5.2) Definitions according to the Danish Society of Financial Analysts’ Recommendations & Financial Ratios 2005.3) Calculated according to IAS 33 Earnings per share.4) Equity, H. Lundbeck A/S’ shareholders equals the Group’s total equity in 2006-2008.5) Profit attributable to shareholders in the parent company equals the Group’s total profit in 2006-2008.
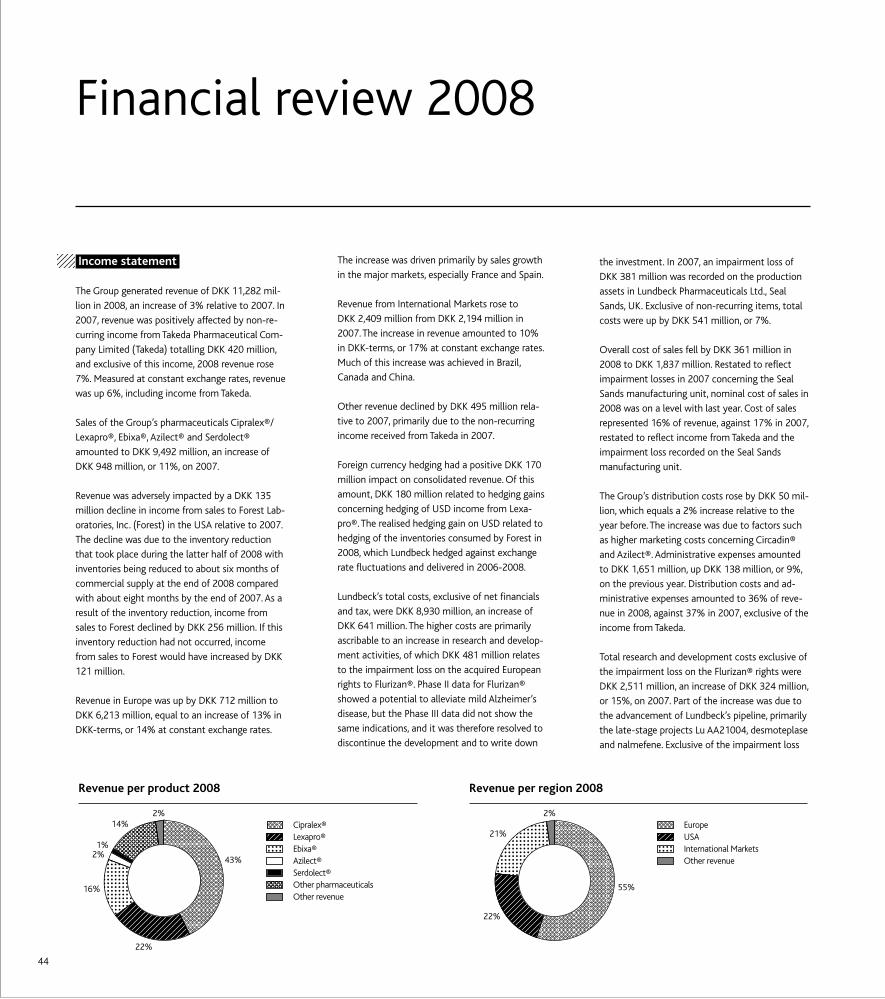
44
Income statement
The Group generated revenue of DKK 11,282 mil-
lion in 2008, an increase of 3% relative to 2007. In
2007, revenue was positively affected by non-re-
curring income from Takeda Pharmaceutical Com-
pany Limited (Takeda) totalling DKK 420 million,
and exclusive of this income, 2008 revenue rose
7%. Measured at constant exchange rates, revenue
was up 6%, including income from Takeda.
Sales of the Group’s pharmaceuticals Cipralex®/
Lexapro®, Ebixa®, Azilect® and Serdolect®
amounted to DKK 9,492 million, an increase of
DKK 948 million, or 11%, on 2007.
Revenue was adversely impacted by a DKK 135
million decline in income from sales to Forest Lab-
oratories, Inc. (Forest) in the USA relative to 2007.
The decline was due to the inventory reduction
that took place during the latter half of 2008 with
inventories being reduced to about six months of
commercial supply at the end of 2008 compared
with about eight months by the end of 2007. As a
result of the inventory reduction, income from
sales to Forest declined by DKK 256 million. If this
inventory reduction had not occurred, income
from sales to Forest would have increased by DKK
121 million.
Revenue in Europe was up by DKK 712 million to
DKK 6,213 million, equal to an increase of 13% in
DKK-terms, or 14% at constant exchange rates.
The increase was driven primarily by sales growth
in the major markets, especially France and Spain.
Revenue from International Markets rose to
DKK 2,409 million from DKK 2,194 million in
2007. The increase in revenue amounted to 10%
in DKK-terms, or 17% at constant exchange rates.
Much of this increase was achieved in Brazil,
Canada and China.
Other revenue declined by DKK 495 million rela-
tive to 2007, primarily due to the non-recurring
income received from Takeda in 2007.
Foreign currency hedging had a positive DKK 170
million impact on consolidated revenue. Of this
amount, DKK 180 million related to hedging gains
concerning hedging of USD income from Lexa-
pro®. The realised hedging gain on USD related to
hedging of the inventories consumed by Forest in
2008, which Lundbeck hedged against exchange
rate fluctuations and delivered in 2006-2008.
Lundbeck’s total costs, exclusive of net financials
and tax, were DKK 8,930 million, an increase of
DKK 641 million. The higher costs are primarily
ascribable to an increase in research and develop-
ment activities, of which DKK 481 million relates
to the impairment loss on the acquired European
rights to Flurizan®. Phase II data for Flurizan®
showed a potential to alleviate mild Alzheimer’s
disease, but the Phase III data did not show the
same indications, and it was therefore resolved to
discontinue the development and to write down
the investment. In 2007, an impairment loss of
DKK 381 million was recorded on the production
assets in Lundbeck Pharmaceuticals Ltd., Seal
Sands, UK. Exclusive of non-recurring items, total
costs were up by DKK 541 million, or 7%.
Overall cost of sales fell by DKK 361 million in
2008 to DKK 1,837 million. Restated to reflect
impairment losses in 2007 concerning the Seal
Sands manufacturing unit, nominal cost of sales in
2008 was on a level with last year. Cost of sales
represented 16% of revenue, against 17% in 2007,
restated to reflect income from Takeda and the
impairment loss recorded on the Seal Sands
manufacturing unit.
The Group’s distribution costs rose by DKK 50 mil-
lion, which equals a 2% increase relative to the
year before. The increase was due to factors such
as higher marketing costs concerning Circadin®
and Azilect®. Administrative expenses amounted
to DKK 1,651 million, up DKK 138 million, or 9%,
on the previous year. Distribution costs and ad-
ministrative expenses amounted to 36% of reve-
nue in 2008, against 37% in 2007, exclusive of the
income from Takeda.
Total research and development costs exclusive of
the impairment loss on the Flurizan® rights were
DKK 2,511 million, an increase of DKK 324 million,
or 15%, on 2007. Part of the increase was due to
the advancement of Lundbeck’s pipeline, primarily
the late-stage projects Lu AA21004, desmoteplase
and nalmefene. Exclusive of the impairment loss
Financial review 2008
Cipralex®Lexapro®Ebixa®Azilect®Serdolect®Other pharmaceuticalsOther revenue
43%
22%
2%1%
16%
14%2%
Revenue per product 2008
EuropeUSAInternational MarketsOther revenue
55%
22%
21%
2%
Revenue per region 2008

45
on the Flurizan® rights, research and development
costs accounted for 22% of consolidated revenue
for 2008, against 21% in 2007 exclusive of the
income from Takeda.
Profit from operations was DKK 2,352 million,
corresponding to an EBIT margin of 21%. Exclu-
sive of the non-recurring impairment loss on the
Flurizan® rights, profit from operations was
DKK 2,833 million, equal to an EBIT margin of
25%.
Net financials amounted to an expense of
DKK 185 million, up from DKK 50 million in 2007.
Net interest income including realised and un-
realised capital gains on the bond portfolio
amounted to DKK 45 million, up from DKK 10
million in 2007, and was positively affected by a
larger holding of cash and bonds in 2008 than in
2007.
Net exchange losses amounted to DKK 132 mil-
lion, against DKK 74 million in 2007, and were
affected by falling exchange rates, primarily on
USD and GBP. The item includes net exchange
gains on contracts reclassified from hedging to
trading in the amount of DKK 16 million, against
DKK 0 million in 2007.
In January 2009, the Lundbeck Foundation’s in-
vestment and holding company LFI a/s bought the
Group’s investments in four small private equity
funds. The expected loss on the sale of the invest-
ments, which had previously been measured at fair
value in equity, amounted to DKK 96 million. The
loss is recognised in the income statement for
2008 and has affected the financial expenses.
Tax on profit for the year amounted to DKK 613
million, corresponding to an effective tax rate of
28.9%, against 30.9% in 2007. The effective tax
rate is affected primarily by lower permanent
deviations.
Profit for the year amounted to DKK 1,510 million,
down 15% compared with 2007. Earnings per
share amounted to DKK 7.67, against DKK 8.63 in
2007. Proposed dividend for 2008 amounts to
30% of the profit for the year, and the total
amount of the proposed dividend is thus DKK 453
million, or DKK 2.30 per share.
Incentive programmes in 2008In 2008, the Group established incentive pro-
grammes for the Executive Management and key
employees in Denmark and abroad. The pro-
grammes consist of warrants and shares and share
price-based schemes for persons employed with
the Group’s subsidiaries in the USA. The vesting
period is 3 years, and for the Executive Manage-
ment vesting depends on Lundbeck’s ranking in a
peer group of companies. The total cost recognised
in the consolidated income statement for 2008
amounted to DKK 3 million.
Currency hedgingLundbeck hedges income from e.g. Lexapro® using
currency hedging. As a result of Lundbeck’s cur-
rency hedging policy, foreign exchange losses and
gains on hedging transactions are allocated
directly to the hedged transaction. The hedging of
the company’s foreign exchange income means
that this income is in reality recognised at the for-
ward rates. The profit impact was an income of
DKK 170 million in 2008 against an expense of
DKK 53 million in 2007 compared to a situation
where the income is included at the current rates
of exchange during the period. Of the total effect,
an income of DKK 180 million compared with an
expense of DKK 48 million in 2007 stems from the
hedging of USD. The gain from the USD hedging is
included in the income from sales of Lexapro®.
At 31 December 2008, forward exchange and op-
tion contracts had been entered into to hedge
foreign currency cash flows, primarily in USD,
equivalent to a value of approximately DKK 3.2
billion. All contracts are classified as hedging con-
tracts. Deferred recognition of net currency losses
and gains amounted to a gain of DKK 16 million at
31 December 2008 against a gain of DKK 93 mil-
lion at 31 December 2007.
The average forward rate for USD at 31 December
2008 was approximately USD/DKK 532 for the
hedging contracts concluded. The effect of the
hedging of USD cash flows will materialise in profits
at the time in 2009-2010 when Forest uses the
bulk deliveries to which the hedging relates. For the
2008 financial year, the average hedged exchange
rate for USD was approximately USD/DKK 531.
22%
22%
15%
25%
16% ProductionDistributionAdministrationResearch and developmentEBIT
* Excl. of non-recurring items.
Costs and profit from operations as share of revenue 2008*
EURUSDCADGBPTRYOther currencies
46%
24%
4%
4%
4%
18%
Revenue per currency 2008
46
Balance sheet
At 31 December 2008, the Group’s total assets
amounted to DKK 12,607 million, which was on
the same level as at year-end 2007, when total
assets were DKK 12,326 million.
Intangible assets rose DKK 184 million to DKK
2,079 million. The increase is partly due to capital-
ised payments on the product rights to desmote-
plase, as Lundbeck has extended the agreement
with PAION AG under which the Group acquired
the global exclusive rights to the product. More-
over, the increase is attributable to capitalised IT
projects concerning the Group’s ongoing infor -
mation technology infrastructure expansion.
In the second quarter of 2008, the Group acquired
the European rights to Flurizan® for DKK 481 mil-
lion, which were subsequently written down.
Property, plant and equipment amounted to
DKK 3,154 million at 31 December 2008, against
DKK 3,375 million in 2007. The decline was due
to the fact that investments for the year were
DKK 221 million lower than the depreciation
charges for the year. The investments related pri-
marily to the expansion of the manufacturing
facilities in Denmark. Depreciation for the year
amounted to DKK 373 million, a decline of 10%
after adjustments to reflect the impairment loss
recorded on the Seal Sands manufacturing unit in
2007.
Financial assets fell from DKK 457 million in 2007
to DKK 234 million at the end of 2008. The decline
in financial assets was due to the divestment of
the associate LifeCycle Pharma A/S and sale of in-
vestments in four small private equity funds. As
the sale is carried out after the end of the financial
year, the investments have been reclassified to as-
sets held for sale in the balance sheet.
The Group’s combined inventories amounted to
DKK 837 million, down from DKK 924 million in
2007. The fall was primarily due to a decline in
work in progress. Inventories were impacted by
last year’s closure of the manufacturing unit at
Seal Sands, UK, when part of the production was
relocated to Lundbeck’s manufacturing facilities in
Italy and Denmark.
The Group’s receivables were down 6% to
DKK 2,223 million, against DKK 2,368 million in
2007. The decline was due primarily to a fall in
other receivables, which in 2007 included mile-
stone payments due from the collaboration
partner Takeda.
Equity amounted to DKK 7,592 million, against
DKK 7,185 million in 2007, equalling an increase
of 6%, or DKK 407 million. The solvency ratio was
60%. Acquisition of treasury shares and dividend
paid reduced equity by DKK 1,042 million.
Non-current liabilities amounted to DKK 2,594
million compared with DKK 2,502 million in 2007.
The increase was attributable primarily to an in-
crease in deferred tax liabilities.
Current liabilities at the end of the year amounted
to DKK 2,421 million, against DKK 2,639 million in
2007. The fall primarily reflects a reduction in pre-
payments from Forest of DKK 242 million due to
the inventory reduction in 2008.
Cash flow statement
The Group’s total cash flows amounted to
DKK 1,177 million, up from DKK 597 million in
2007.
Operating activities generated a cash inflow of
DKK 2,780 million in 2008, against DKK 2,705 mil-
lion in 2007. The DKK 344 million decline in profit
from operations in 2008 was offset by lower tax
payments, and cash flows from operating activities
were thus on level with 2007. Tax payments were
lower because of the lower profit and a reduction
of prepayments from Forest and provisions.
Investing activities generated a cash outflow of
DKK 587 million in 2008, against DKK 1,095 mil-
lion in 2007. Of this amount, investments in intan-
gible assets totalled DKK 817 million, of which
DKK 481 million related to the product rights to
Flurizan®. Investments in property, plant and
equipment in 2008 were DKK 229 million. Invest-
ments in and sale of financial assets primarily
involved the buying and selling of listed Danish
bonds. This was the primary reason for the im-
provement in cash flows from investing activities
relative to last year. Cash flows from investing ac-
tivities were affected by the Group’s participation
in the capital increase in the associate LifeCycle
Pharma A/S in the amount of DKK 112 million in
the second quarter of 2008.
Cash flows from financing activities were an out-
flow of DKK 1,016 million, which was at the same
level as in 2007. Cash flows from dividend and the
share buyback programme were an outflow of
DKK 1,042 million in 2008, against DKK 1,516
million in 2007. The Group did not raise any
mortgage loans in 2008, so the loan proceeds
of DKK 431 million in 2007 offset the overall
DKK 474 million decline in dividend and share
buybacks.
Events after the balance sheet date
On 9 February 2009, Lundbeck announced that it
had acquired Ovation Pharmaceuticals, Inc. for up
to USD 900 million, or DKK 5.2 billion. The acquisi-
tion of Ovation delivers on Lundbeck’s strategic
goal to build a commercial infrastructure in the
USA. The transaction will be financed through a
combination of existing cash resources and new
DKK 2.5 billion acquisition debt. Subject to final
approval, the transaction is expected to be com-
pleted in March 2009.

47
Group
2008 2007 2006 Notes DKKm DKKm DKKm
Revenue 2 11,281.8 10,984.9 9,221.0
Cost of sales 3, 4 1,837.1 2,197.8 1,645.8
Gross profit 9,444.7 8,787.1 7,575.2
Distribution costs 3, 4 2,459.0 2,408.7 2,418.7
Administrative expenses 3-5 1,651.4 1,513.9 1,418.9
Profit before research and development costs 5,334.3 4,864.5 3,737.6
Research and development costs 3, 4 2,992.0 2,187.2 1,957.7
Profit before other operating items 2,342.3 2,677.3 1,779.9
Other operating income 25.7 38.5 26.1
Other operating expenses 16.4 20.4 22.0
Profit from operations 2,351.6 2,695.4 1,784.0
Income from investments in associates 9 (43.3) (84.0) (87.4)
Financial income 6 419.4 337.1 250.1
Financial expenses 6 604.8 387.0 313.9
Profit before tax 2,122.9 2,561.5 1,632.8
Tax on profit for the year 7 613.3 792.0 525.9
Profit for the year 1,509.6 1,769.5 1,106.9
Proposed distribution
Proposed dividend for the year 13 452.8 530.6 333.1
Transferred to distributable reserves 1,056.8 1,238.9 773.8
1,509.6 1,769.5 1,106.9
Earnings per share (EPS) (DKK) 22 7.67 8.63 5.24
Diluted earnings per share (DEPS) (DKK) 22 7.67 8.63 5.23
Proposed dividend per share (DKK) 13 2.30 2.56 1.57
Statement of recognised income and expenses
Profit for the year 1,509.6 1,769.5 1,106.9
Adjustment, deferred gains/losses, hedging 42.6 157.9 173.5
Realised gains/losses, hedging (104.2) (122.0) 41.3
Realised gains/losses, trading (transferred from hedging) (15.5) (0.4) 33.2
Other equity entries concerning associates 9 0.8 - (0.5)
Fair value adjustment of available-for-sale financial assets 10 (6.5) 12.8 (31.5)
Tax on income and expenses recognised in equity 7 19.3 (8.9) (69.4)
Income and expenses recognised directly in equity (63.5) 39.4 146.6
Recognised income and expenses for the year 1,446.1 1,808.9 1,253.5
Income statement for the year ended 31 December 2008

48
Group
2008 2007 2006 Notes DKKm DKKm DKKm
Goodwill 882.2 882.2 882.2
Patent rights 232.5 312.8 342.7
Product rights 606.2 467.9 352.5
Other rights 1.4 7.7 5.6
IT and process projects 229.5 129.7 89.2
Projects in progress 127.2 94.5 108.5
Intangible assets 8 2,079.0 1,894.8 1,780.7
Land and buildings 2,201.4 2,047.6 2,126.6
Plant and machinery 427.7 393.2 592.3
Other fixtures and fittings, tools and equipment 320.7 334.4 364.0
Prepayments and plant and equipment in progress 203.7 599.5 583.8
Property, plant and equipment 8 3,153.5 3,374.7 3,666.7
Investments in associates 9 - 82.9 166.9
Receivables from associates 10 - - 19.2
Available-for-sale financial assets 10 31.4 150.7 127.6
Other receivables 10 55.5 60.6 63.6
Value of deferred tax assets 15 147.1 162.7 279.1
Financial assets 234.0 456.9 656.4
Non-current assets 5,466.5 5,726.4 6,103.8
Inventories 11 837.3 924.3 1,155.0
Trade receivables 12 1,527.0 1,560.1 1,463.2
Income taxes receivable 56.8 36.8 56.8
Other receivables 12 406.2 582.2 359.4
Prepayments 232.8 188.5 114.6
Receivables 2,222.8 2,367.6 1,994.0
Securities 25 954.9 1,535.7 1,201.6
Cash 25 2,920.6 1,772.0 1,176.6
Assets held for sale 9, 10 204.6 - -
Current assets 7,140.2 6,599.6 5,527.2
Assets 12,606.7 12,326.0 11,631.0
Balance sheet – Assetsat 31 December 2008

49
Group
2008 2007 2006 Notes DKKm DKKm DKKm
Share capital 13 984.4 1,036.4 1,060.8
Share premium 13 223.9 223.9 121.6
Retained earnings 6,383.6 5,924.6 5,582.4
Equity 7,591.9 7,184.9 6,764.8
Pension obligations and similar obligations 14 180.1 188.7 204.5
Deferred tax liabilities 15 425.6 327.3 431.5
Provisions 16 83.6 92.4 92.7
Mortgage debt 17 1,853.4 1,858.6 1,427.8
Employee bonds and other debt 50.8 35.0 14.4
Non-current liabilities 2,593.5 2,502.0 2,170.9
Provisions 3, 16 18.1 15.4 2.4
Bank debt 17 22.5 4.4 55.0
Mortgage debt 17 - 5.1 5.1
Trade payables 867.2 773.9 743.2
Income taxes 31.5 72.2 130.0
VAT, taxes and holiday pay commitments 310.8 268.0 251.8
Other payables 574.1 660.6 653.1
Prepayments from Forest 597.1 839.5 854.7
Current liabilities 2,421.3 2,639.1 2,695.3
Liabilities 5,014.8 5,141.1 4,866.2
Equity and liabilities 12,606.7 12,326.0 11,631.0
Balance sheet – Equity and liabilitiesat 31 December 2008

50
Group
Share Share Retained capital premium earnings Equity1
DKKm DKKm DKKm DKKm
Equity at 01.01.2008 1,036.4 223.9 5,924.6 7,184.9
Recognised income and expenses for the year - - 1,446.1 1,446.1
Distribution of dividend, gross - - (530.6) (530.6)
Distribution of dividend, treasury shares - - 26.6 26.6
Capital reduction and cancellation of treasury shares (52.0) - 52.0 -
Buyback of treasury shares - - (538.3) (538.3)
Incentive programmes - - 3.2 3.2
Other transactions (52.0) - (987.1) (1,039.1)
Equity at 31.12.2008 984.4 223.9 6,383.6 7,591.9
Equity at 01.01.2007 1,060.8 121.6 5,582.4 6,764.8
Recognised income and expenses for the year - - 1,808.9 1,808.9
Distribution of dividend, gross - - (333.8) (333.8)
Distribution of dividend, treasury shares - - 9.2 9.2
Capital increase through exercise of warrants 5.0 102.3 - 107.3
Capital reduction and cancellation of treasury shares (29.4) - 29.4 -
Buyback of treasury shares - - (1,191.3) (1,191.3)
Incentive programmes - - 16.4 16.4
Tax on other equity transactions - - 3.4 3.4
Other transactions (24.4) 102.3 (1,466.7) (1,388.8)
Equity at 31.12.2007 1,036.4 223.9 5,924.6 7,184.9
Equity at 01.01.2006 1,136.1 69.5 6,286.1 7,491.7
Recognised income and expenses for the year - - 1,253.5 1,253.5
Distribution of dividend, gross - - (477.2) (477.2)
Distribution of dividend, treasury shares - - 32.7 32.7
Capital increase through exercise of warrants 2.6 52.1 - 54.7
Capital reduction and cancellation of treasury shares (77.9) - 77.9 -
Buyback of treasury shares - - (1,591.1) (1,591.1)
Tax on other equity transactions - - 0.5 0.5
Other transactions (75.3) 52.1 (1,957.2) (1,980.4)
Equity at 31.12.2006 1,060.8 121.6 5,582.4 6,764.8
1) Equity equals equity, H. Lundbeck A/S’ shareholders.
Statement of changes in equityat 31 December 2008

51
Group
2008 2007 2006 Notes DKKm DKKm DKKm
Profit from operations 2,351.6 2,695.4 1,784.0
Adjustments 23 1,054.1 929.1 377.8
Working capital changes 24 (109.7) (100.8) (352.2)
Cash flows from operations before financial receipts and payments 3,296.0 3,523.7 1,809.6
Financial receipts 208.9 165.8 137.6
Financial payments (197.6) (150.2) (178.4)
Cash flows from ordinary activities 3,307.3 3,539.3 1,768.8
Income tax paid for the year (501.6) (784.4) (382.0)
Income tax paid for previous years (25.5) (50.1) 7.2
Cash flows from operating activities 2,780.2 2,704.8 1,394.0
Acquisition of company - - 3.1
Change in payables to/receivables from associates 10 (7.5) (12.0) (19.2)
Investments in intangible assets (817.0) (273.9) (190.5)
Sale of intangible assets - 1.1 -
Investments in property, plant and equipment (229.3) (474.2) (567.1)
Sale of property, plant and equipment 3.3 8.5 5.6
Investments in financial assets (1,033.3) (843.7) (3,556.0)
Sale of financial assets 1,496.7 499.0 4,562.6
Cash flows from investing activities (587.1) (1,095.2) 238.5
Cash flows from operating and investing activities 2,193.1 1,609.6 1,632.5
Loan proceeds 20.4 431.1 1,073.6
Repayments of loans (12.6) (53.7) (6.1)
Buyback of treasury shares (538.3) (1,191.3) (1,591.1)
Employee bonds 18.1 18.9 12.6
Capital contributions - 107.3 54.7
Dividend paid in the financial year (504.0) (324.6) (444.5)
Cash flows from financing activities (1,016.4) (1,012.3) (900.8)
Change in cash 1,176.7 597.3 731.7
Cash at 01.01. 1,772.0 1,176.6 458.1
Unrealised exchange differences for the year (28.1) (1.9) (13.2)
Change for the year 1,176.7 597.3 731.7
Cash at 31.12. 25 2,920.6 1,772.0 1,176.6
Interest-bearing net cash and cash equivalents is composed as follows
Cash 2,920.6 1,772.0 1,176.6
Securities 954.9 1,535.7 1,201.6
Interest-bearing debt (1,926.7) (1,903.1) (1,502.3)
Interest-bearing net cash and cash equivalents at 31.12. 1,948.8 1,404.6 875.9
Cash flow statement1 January-31 December 2008

52
GroupNotes 1
• The difference between the invoiced price and the minimum price of Forest’s inven-tories is recorded in the balance sheet as prepayments.
• After the end of each quarter, the final settlement price is calculated. The difference between the final calculated settlement price and the invoiced price is recognised as income and settled with Forest, and the difference between the invoiced price and the minimum price recorded in the balance sheet as prepayments at the time of deliv-ery is recognised as income.
In connection with a potential launch of generic escitalopram, the agreement allows Forest to convert escitalopram inventories into generic escitalopram. In connection with a conversion of escitalopram inventories, the minimum price will be adjusted by any repay-ment to Forest of part of the recognised mini-mum payment. This adjustment will be ex-pensed in the financial statements.
License income and income from research collaborationsRevenue includes license income and royalties from outlicensed products as well as non- refundable downpayments and milestone payments relating to research collaborations, which are recognised as income in the income statement when the rights are obtained, subject to the following criteria being met:• The payment relates to research results
already obtained. • The most significant risks and benefits asso-
ciated with the asset sold are transferred to the buyer.
• Lundbeck does not retain management con-trol of the asset sold.
• Revenue from the individual payments in an overall agreement can be clearly separated and calculated reliably at fair value.
• It is probable that Lundbeck will receive payment for the asset sold.
• There are no further delivery obligations for Lundbeck concerning the asset sold.
1. Accounting policiesThe annual report of the H. Lundbeck A/S Group is presented in accordance with Inter-national Financial Reporting Standards as adopted by the EU and additional Danish disclosure requirements for annual reports of listed companies, including the disclosure requirements imposed by Nasdaq OMX Copenhagen on annual reports of listed com-panies and the Danish Statutory Order on Adoption of IFRS. The annual report also com-plies with the International Financial Reporting Standards issued by the International Account-ing Stan dards Board (IASB).
The annual report is presented in Danish kroner (DKK), which also is the functional currency of the Group.
The annual report for 2008 is presented in ac-cordance with the new and revised standards (IFRS/IAS) and interpretations (IFRIC) which apply for the financial year. This has not re-sulted in any changes in accounting policies.
Implementation of new and revised standards and interpretationsIFRS 8 Operating Segments, which is based on internal management reporting, has been adopted early. The implementation has only resulted in additional disclosures as the inter-nal management reporting is based on the Group’s accounting policies.
Furthermore, the revised IAS 1 Presentation of
financial statements has been adopted early in the annual report. As a result, the financial statements include a statement of recognised income and expenses.
The implementation of IFRIC 14 The Limit on
a Defined Benefit Asset, Minimum Funding
Requirements and their interaction has not resulted in any changes to the calculation of pension obligations and related pension assets.
The implementation of the new and revised standards and interpretations in the annual re-port for 2008 has not resulted in changes to accounting policies.
Future IFRS changesAt the date of the publication of this annual report, a number of new and amended stan-dards and interpretations have not yet entered into force or been adopted by the EU, and are therefore not included in this annual report.
Some of these future IFRS changes may affect future annual reports with respect to recogni-tion and measurement, for example the re-vised IFRS 3 Business Combinations.
Other future IFRS changes are not expected to materially affect the annual report.
Accounting policies critical to financial reporting
Management believes that the following ac-counting policies are most important to the Group’s financial reporting.
Income from ForestThe invoiced price is agreed between Forest and Lundbeck at the beginning of each calen-dar year. The price is calculated on the basis of expectations for the coming year’s develop-ment in the elements included in the royalty calculation. These elements are: Forest’s net selling prices, quantities used in sold products, quantities used in samples, quantities wasted during processing, and the various dosage lev-els of the finished goods. Income from sales of citalopram and escitalopram to Forest is rec-ognised as follows:• Sales of both citalopram and escitalopram
are invoiced at the agreed price but only a proportion (the minimum price) of the in-voiced price is recognised as income at the time of delivery.

53
Group
Income is recognised in the income statement as earned and includes value adjustments of fi-nancial assets and liabilities measured at fair value or amortised cost. In addition, expenses incurred to generate the income for the year are recognised, including amortisation, depre-ciation, impairment losses and provisions as well as reversals of amounts previously recog-nised in the income statement as a result of changed accounting estimates.
Consolidated financial statements The consolidated financial statements com-prise the parent company H. Lundbeck A/S and subsidiaries controlled by the parent company. Control is achieved where the parent company directly or indirectly holds more than 50% of the voting rights or is otherwise able to exer-cise or actually exercises control.
Companies in which the Group holds between 20% and 50% of the voting rights and exer-cises significant influence but not control are regarded as associates.
Basis of consolidationThe consolidated financial statements are pre-pared on the basis of the financial statements of the parent company and the subsidiaries, which are all prepared in accordance with the Group’s accounting policies.
The consolidated financial statements are pre-pared by adding together uniform items and eliminating intra-group income and expenses, investments, balances and dividend as well as realised and unrealised gains and losses on transactions between the consolidated com-panies. Account is taken of the tax effect of these eliminations.
Business combinationsNewly acquired or newly formed companies are recognised in the consolidated financial statements from the date of acquisition. Com-panies sold or discontinued are recognised in the consolidated income statement up to the
time of sale or discontinuance. Expected di-vestment costs are included in the calculation of gains or losses.
Newly acquired subsidiaries are accounted for using the purchase method of accounting, ac-cording to which the identifiable assets, liabili-ties and contingent liabilities of the newly ac-quired companies are measured at fair value at the time of acquisition. Account is taken of the tax effect of the revaluations made.
The cost of a company is the fair value of the consideration paid plus costs directly attri-butable to the business combination.
Positive differences (goodwill) between the cost of the acquisition and the fair value of the acquired identifiable assets, liabilities and con-tingent liabilities are recognised under intan-gible assets. Negative differences (negative goodwill) between the cost of the acquisition and the fair value of the acquired identifiable assets, liabilities and contingent liabilities are recognised in the income statement at the time of acquisition.
Minority interests are recognised at the time of acquisition at the proportionate share of the fair value of the acquired identifiable assets, liabilities and contingent liabilities.
Goodwill arising from acquired companies is adjusted until the end of the year following acquisition if additional information about the fair value at the time of acquisition of assets, lia-bilities and contingent liabilities acquired is ob-tained after acquisition. However, goodwill will not be recognised by an amount exceeding the expectations of future income from the acquiree.
Goodwill and adjustments to fair value in con-nection with the acquisition of independent foreign entities (subsidiaries or associates) are accounted for as assets and liabilities in the acquiree and translated at the exchange rates at the balance sheet date.
Development costsDevelopment costs are capitalised if the crite-ria for such capitalisation are deemed to have been met and it is found to be probable that future earnings will cover the development costs. Due to a very long development period and significant uncertainty in relation to the development of new products, in the opinion of the Group, development costs should not normally be capitalised in the balance sheet until the development of the product has been completed and all the necessary public regis-tration and marketing approvals have been ob-tained. Otherwise, development costs will be recognised in the income statement as they are incurred.
Recognition and measurement
Assets are recognised in the balance sheet if it is probable that future economic benefits will flow to the Group and the value of the asset can be measured reliably.
Liabilities are recognised in the balance sheet if they are probable and can be measured reli-ably.
On initial recognition assets and liabilities are measured at cost or fair value. Subsequently assets and liabilities are measured as described for each item below.
Certain financial assets and liabilities are measured at amortised cost, implying the rec-ognition of a constant effective rate of interest to maturity. Amortised cost is calculated as original cost less any repayments and plus/less the cumulative amortisation of the difference between cost and the nominal amount.
Recognition and measurement take into con-sideration gains, losses and risks that arise be-fore the time of presentation of the annual re-port and that confirm or invalidate matters existing at the balance sheet date.
Notes 1

54
Group
alisation of the hedged item and included in the same item as the hedged item.
Changes in the fair value of derivative financial instruments classified as hedging instruments and meeting the criteria for hedging the fair value of a recognised asset or liability are rec-ognised in the income statement together with changes in the value of the hedged asset or liability.
For derivative financial instruments which do not quality for hedge accounting, changes in fair value are recognised in the income state-ment under net financials as they arise.
Changes in the fair value of derivative financial instruments used to hedge net investments in independent foreign subsidiaries or associates and which otherwise meet the relevant criteria are recognised directly in equity.
Income statement
RevenueRevenue comprises invoiced sales for the year less returned goods and revenue-based taxes consisting mainly of value added taxes and foreign revenue-based drug taxes.
Sales subject to a price adjustment clause are included in revenue at the time of delivery at the minimum price. The balance of the in-voiced price is recognised in the balance sheet as a prepayment and is subsequently included in revenue when the price has been finally de-termined. The price is finally determined as the product is resold by the customer.
Moreover, revenue includes license income and royalties from outlicensed products as well as non-refundable downpayments and milestone payments relating to research collaborations.
In addition, income from the reduction of in-vestments in research enterprises, considered
Notes 1
subsidiaries, monetary items are translated at the exchange rates at the balance sheet date. Non-monetary items, including goodwill in in-tegrated entities, are translated at the ex-change rates at the time of acquisition or at the time of any subsequent revaluation or writedown of the asset. Income statement items are translated at average exchange rates for the year which approximate the actual ex-change rates at the transaction date. However, items derived from non-monetary items are translated at the historical exchange rates that apply to the non-monetary item.
Exchange differences arising from the transla-tion of both the balance sheets and the in-come statements of the foreign subsidiaries are recognised in the Group’s income state-ment as net financials.
When recognising foreign associates that use a reporting currency different from that used by the parent company, assets and liabilities are translated at the exchange rates at the balance sheet date, while the income state-ment is translated at average exchange rates for the year.
Exchange differences arising from the transla-tion of foreign associates are recognised in the Group directly in equity.
Derivative financial instrumentsForward exchange contracts and other deriva-tive financial instruments are initially recog-nised in the balance sheet at fair value on the value date and are subsequently remeasured at fair value at the balance sheet date. Positive and negative fair values are included in other receivables and other payables respectively.
Changes in the fair value of derivative financial instruments classified as hedging instruments and meeting the criteria for hedging future cash flows are recognised directly in equity. In-come and expenses related to such hedging transactions are transferred from equity on re-
Gains or losses on disposal or discontinuance of subsidiaries and associatesGains or losses on the disposal or discontinu-ance of subsidiaries and associates are calcu-lated as the difference between the selling price or the discontinuance amount and the carrying amount of net assets at the time of sale as well as anticipated expenses relating to sale or discontinuance.
Minority interestsThe subsidiaries’ items are fully consolidated in the consolidated financial statements. Minor-ity interests’ proportionate share of the subsid-iaries’ results and equity is shown as separate items in the income statement and in equity.
Translation of foreign currencyOn initial recognition, transactions denomi-nated in foreign currencies are translated at standard rates which equal the actual ex-change rates at the transaction date. Exchange differences arising between the rate at the transaction date and the rate at the date of payment are recognised in the income state-ment as net financials.
Receivables, payables and other monetary items denominated in foreign currencies that have not been settled at the balance sheet date are translated at the exchange rates at the balance sheet date. The difference between the exchange rates at the balance sheet date and the rates at the time the receivable or payable is created or recognised in the latest annual report is recognised in the income statement under net financials.
Non-monetary assets acquired in foreign cur-rencies are translated at the exchange rates at the time of acquisition.
Where foreign subsidiaries are regarded as an integral part of the parent company’s activi-ties, the transactions in the subsidiaries will be accounted for as if they had been executed in the parent company. On recognition of foreign

55
Group
provisional tax scheme. The current Danish in-come tax liability is allocated among the com-panies of the Danish tax pool in proportion to their taxable income with due consideration to foreign taxes paid.
Tax for the year, which consists of the year’s current tax and the change in deferred tax, is recognised in the income statement as regards the amount that can be attributed to the profit or loss for the year and directly in equity as regards the amount that can be attributed to equity items. Exchange rate adjustments of deferred tax are recognised as part of the changes in deferred tax.
Balance sheet
Intangible assetsGoodwillOn initial recognition, goodwill is measured and recognised as the excess of the cost of the acquired enterprise over the fair value of the acquired assets, liabilities and contingent lia-bilities. On recognition of goodwill, the good-will amount is allocated to those of the Group’s activities that generate separate cash flows (cash-generating units). The determina-tion of cash-generating units is based on the Group’s management structure and internal fi-nancial management and reporting.
Goodwill is not amortised, but is tested for im-pairment at least once a year.
Development projectsClearly defined and identifiable development projects are recognised as intangible assets where the technical rate of utilisation of the project, the availability of adequate resources and a potential future market or development opportunity in the company can be demon-strated and where the intention is to manufac-ture, market or use the project if the cost can be measured reliably and it is probable that the future earnings can cover production and
tisation/depreciation and other indirect costs as well as costs relating to research and devel-opment collaborations on in-licensed products.
Research costs are always recognised in the in-come statement as they are incurred.
Development costs are capitalised if a number of specific criteria for capitalising these costs are deemed to have been met. Otherwise, de-velopment costs will be recognised in the in-come statement as they are incurred.
See Accounting policies critical to financial re-
porting on page 52 for a description of condi-tions for capitalising development costs.
Other operating income and expensesOther operating income and expenses com-prise items of a secondary nature in relation to the Group’s activities.
Results of investments in associatesThe proportionate share of the results of asso-ciates is recognised in the consolidated in-come statement after tax and elimination of the proportionate share of any intra-group gains and losses and after deduction of any writedowns of the equity investments.
Net financialsNet financials include interest income and ex-penses which are recognised in the income statement at the amounts relating to the fi-nancial year. Value adjustments of financial as-sets and realised and unrealised gains and losses on investments, items denominated in foreign currencies as well as forward contracts and other derivative financial instruments not used for hedging purposes according to the hedge accounting principle are also included in net financials.
TaxAs from 2005, the Danish companies of the Group are jointly taxed with the parent com-pany LFI a/s and are included in the Danish
to represent the sale of research results, is recognised as revenue.
See Accounting policies critical to financial re-
porting on page 52 for a description of the ac-counting treatment of income from Forest and of license income and income from research collaborations.
Cost of salesCost of sales comprises the cost of goods sold. Cost includes the cost of raw materials, con-sumables and goods for resale, direct labour and indirect costs of production, including op-erating costs, amortisation/depreciation and impairment losses relating to manufacturing facilities. Cost of sales moreover includes ex-penses in connection with quality certification of sold products and any writedown to net re-alisable value of unsaleable and slow moving items.
Distribution costsDistribution costs comprise expenses incurred in connection with the distribution of the Group’s products sold during the year and in connection with sales campaigns, etc. launched during the year, including direct dis-tribution and marketing costs, salaries etc. for the sales and marketing functions, as well as amortisation/depreciation and other indirect costs.
Administrative expensesAdministrative expenses comprise expenses incurred during the year for the management and administration of the Group, including ex-penses in connection with the administrative functions, management, office premises and office expenses, as well as amortisation/depre-ciation and other indirect costs.
Research and development costsResearch and development costs comprise ex-penses incurred during the year in connection with the Group’s research and development functions, including wages and salaries, amor-
Notes 1

56
Group
Gains or losses on the disposal or retirement of items of property, plant and equipment are calculated as the difference between the car-rying amount and the selling price reduced by dismantling expenses and cost to sell. Gains and losses are recognised in the income state-ment under the same items as the associated depreciation.
Impairment lossesThe carrying amount of intangible assets and property, plant and equipment is analysed in connection with the preparation of the annual report if there is an indication that the carry-ing amount of an asset may exceed the expec-tations of future income from the asset (re-coverable amount). If this analysis concludes that the future expected net income from the asset will be lower than the carrying amount, the carrying amount will be reduced to the higher of fair value less cost to sell and value in use. Impairment losses are recognised in the income statement under the same items as the associated amortisation or depreciation.
If the asset does not generate any cash flows independently of other assets, the recoverable amount is calculated for the smallest cash-generating unit that includes the asset.
Goodwill is amortised through the income statement in those cases where the carrying amount exceeds the future net income ex-pected from the cash-generating unit to which the goodwill relates (recoverable amount).
Investments in associatesInvestments in associates are recognised and measured in the consolidated financial state-ments according to the equity method, which entails that the investments are measured in the balance sheet at the proportionate share of the associate’s net asset value calculated in ac-cordance with the Group’s accounting policies less or plus unrealised intra-group gains and losses and plus the carrying amount of goodwill.
assets manufactured by the company, cost in-cludes expenses directly attributable to the manufacture of the asset, including materials, components, third-party suppliers and labour.
Interest relating to property, plant and equip-ment during the period of building and erec-tion is not capitalised. Property, plant and equipment are depreciated on a straight-line basis over the expected use-ful lives of the assets, which are expected to be as follows:
Buildings 30 yearsInstallations 10 yearsPlant and machinery 3-10 yearsOther fixtures and fittings, tools and equipment 3-10 yearsLeasehold improvements max. 10 years
The depreciation base is cost less the esti-mated residual value at the end of the ex-pected useful life. The cost of a total asset is divided into smaller components that are de-preciated separately if such components have different useful lives. Depreciation methods, useful lives and residual values are reassessed annually.
Depreciation is recognised in the income statement under cost of sales, distribution costs, administrative expenses and research and development costs, respectively.
The costs of maintaining property, plant and equipment are recognised in the income state-ment as they are incurred, either directly in the income statement or as part of indirect costs of production.
Costs incurred that increase the recoverable amount of the asset concerned are added to the asset’s cost as an improvement and are depreciated over the expected useful life of the improvement.
selling expenses, administrative expenses as well as the development costs. Other develop-ment costs are recognised in the income state-ment as the costs are incurred.
After completion of the development work, development costs are amortised on a straight-line basis over the expected useful life, however with a maximum period of 20 years. For development projects protected by intel-lectual property rights, the maximum amorti-sation period is the remaining term of the rights concerned, however with a maximum period of 20 years.
Other intangible assetsAcquired intellectual property rights in the form of product rights, patents, licenses and software are measured at cost less accumu-lated amortisation. The cost of software com-prises the cost of planning, including direct labour and costs directly attributable to the project. Product rights are amortised on a straight-line basis over the economic lives of the underlying products. Patents are amortised over the remaining patent period, and licenses are amortised over the period of agreement, however with a maximum period of 20 years. Amortisation commences when the asset is ready to be brought into use, which means at the time of commercialisation.
Gains and losses on the disposal of develop-ment projects, patents and licenses are mea-sured as the difference between the selling price less cost to sell and the carrying amount at the time of sale.
Property, plant and equipmentProperty, plant and equipment are measured at cost less accumulated depreciation and accumulated impairment losses. Land is not depreciated.
Cost includes the costs of purchase and ex-penses directly attributable to the purchase until the asset is ready for use. In the case of
Notes 1

57
Group
investment strategy and recognised under cur-rent assets are recognised on the basis of the value date and are measured at the market price at the balance sheet date. Both realised and unrealised gains and losses are recognised in the income statement under net financials.
On initial recognition, other securities outside the scope of the documented investment strategy are measured at fair value with the addition of directly attributable costs. They are subsequently measured at fair value at the bal-ance sheet date, and changes to the fair value are recognised in equity, and dividend is recog-nised in the income statement. When securi-ties are sold or settled, the accumulated fair value adjustments are recognised in the in-come statement.
The fair value is calculated according to official stock exchange listings/OTC listings or esti-mated fair value at the most recent round of capital contributions.
EquityDividendProposed dividend is recognised as a liability at the time of adoption of the dividend resolu-tion at the annual general meeting (the time of declaration). Dividend expected to be paid in respect of the year is recognised in the line item Recognised income and expenses for the
year under equity.
Treasury sharesCost and selling prices of treasury shares as well as dividend are recognised directly in re-tained earnings under equity. Gains and losses on sales are therefore not recognised in the in-come statement.
Other equity instrumentsCost and selling prices of other equity instru-ments, including option premiums in connec-tion with option contracts for the purchase of treasury shares, are recognised directly in re-tained earnings under equity.
Other receivables with a fixed maturity are measured at amortised cost less impairment losses as a result of diminution in value. Other receivables without a fixed maturity are recog-nised at cost.
InventoriesRaw materials, packaging and goods for resale are measured at the latest known cost at the balance sheet date, which equals cost com-puted according to the FIFO method. The cost of raw materials, packaging and goods for re-sale includes the costs of purchase plus costs incurred in bringing the inventories to their present location and condition.
Work in progress and finished goods manufac-tured by the company are measured at cost, i.e. the cost of raw materials, consumables, di-rect labour and indirect costs of production. Indirect costs of production include materials and labour as well as maintenance of and de-preciation on the machines, factory buildings and equipment used in the manufacturing process as well as the cost of factory manage-ment and administration. Indirect production overheads are allocated based on the normal capacity of the production plant.
Writedown to net realisable value is made if it is lower than cost. The net realisable value of inventories is calculated as the selling price less costs of conversion and costs incurred to execute the sale and it is determined having regard to marketability, obsolescence and ex-pected selling price movements.
ReceivablesShort-duration receivables arising in the Group’s normal course of business are mea-sured at nominal value less impairment losses to counter the risk of loss calculated on the basis of an individual evaluation.
Other securitiesOther securities, including the bond portfolio, that are included in the Group’s documented
The proportionate share of the results of the associate is recognised in the income state-ment after tax and elimination of the propor-tionate share of any intra-group gains and losses and after deduction of any writedowns of the investments. Consolidated equity in-cludes the proportionate share of all trans-actions and events recognised directly in the equity of the associate.
Investments in associates with a negative carrying amount are recognised at DKK 0. Re-ceivables and other long-term financial assets considered to form part of the overall invest-ment in the associate are written down by any remaining negative net asset value. Trade receiv ables and other receivables are written down to the extent they are deemed to be irre-coverable. A provision to cover the remaining negative net asset value will only be made if the Group has a legal or constructive obligation to cover the liabilities of the relevant associate.
Other financial assetsOther equity investments that are included in the Group’s documented investment strategy in accordance with the fair value option of IAS 39 Financial instruments: Recognition and
measurement are recognised on the basis of the value date and are measured at market price or estimated fair value at the balance sheet date. Both realised and unrealised gains and losses are recognised in the income state-ment under net financials.
On initial recognition, other investments out-side the scope of the documented investment strategy are available for sale and measured at fair value with the addition of directly attribu-table costs. Other investments are subsequently measured at fair value at the balance sheet date, and changes to the fair value are recog-nised in equity with the exception of impair-ment losses and dividends, which are taken to the income statement. When securities are sold or settled, the accumulated fair value adjust-ments are recognised in the income statement.
Notes 1

58
Group
Deferred tax is measured by using the tax rates and tax rules that, based on legislation in force or in reality in force at the balance sheet date, are expected to apply in the respective coun-tries when the deferred tax is expected to crystallise as current tax. Changes in deferred tax as a result of changed tax rates or tax rules are recognised in the income statement.
Deferred tax assets, including the tax value of tax loss carry-forwards, are recognised in the balance sheet at the value at which the asset is expected to be realised, either through a set-off against deferred tax liabilities or as net assets to be offset against future positive taxable income.
Deferred tax concerning recaptured losses in jointly taxed foreign subsidiaries in previous years is recognised to the extent a tax liability is expected to arise in connection with future profits or on the disposal of the asset.
Tax on equity items relating to deferred in-come and expenses in connection with finan-cial instruments, treasury shares and options to purchase treasury shares as well as pay-ments concerning share option plans and other share price based plans is recognised in equity. However, changes in deferred tax con-cerning the cost of share-based payments are generally recognised in the income statement.
ProvisionsProvisions are recognised when the Group has a legal or constructive obligation that arises from past events and it is probable that an outflow of financial resources will be required to settle the obligation.
Return obligations imposed on the industry are recognised in the balance sheet under provisions.
DebtMortgage debt and debt to credit institutions are recognised at the time of the raising of the loan at proceeds received less transaction
other factors. Actuarial gains and losses are recognised in the income statement as they are calculated.
The present value of the liability according to defined benefit plans is measured less the fair value of the plan assets, and any net obligation is recognised in the balance sheet under non-current liabilities. Any net asset is recognised in the balance sheet as a financial asset.
The year’s changes in the provisions relating to defined benefit plans are recognised in the in-come statement.
Income tax and deferred tax Current tax liabilities and current tax receiv-ables are recognised in the balance sheet, computed as tax calculated on the taxable income for the year, adjusted for provisional taxes paid. Tax payments for the jointly taxed companies of the Group are settled with the parent company LFI a/s.
Deferred tax is recognised according to the balance sheet liability method on all tempo-rary differences between the carrying amounts of assets and liabilities and their tax base, ex-cept for temporary differences arising either on initial recognition of goodwill or initial rec-ognition of a transaction that is not a business combination and with the temporary diffe-rence ascertained at the time of the initial recognition affecting neither the financial results nor the taxable income.
Deferred income tax is provided on temporary differences arising on investments in subsidiaries and associates, unless the parent company has a possibility of controlling when the deferred tax is to be realised and it is likely that the deferred tax will not crystallise as current tax.
Deferred tax is calculated based on the planned use of each asset and settlement of each liability, respectively.
Share-based paymentShare-based incentive programmes, in which employees may opt only to buy shares in the parent company, and shares granted to em-ployees (equity schemes) are measured at the equity instruments’ fair value at the date of grant and recognised in the income statement under staff costs when the employee obtains the right to buy the shares. The balancing item is recognised directly in equity.
Share-based incentive programmes, in which employees have the difference between the agreed price and the actual share price settled in cash, are measured at fair value at the date of grant and recognised in the income state-ment under staff costs when the final right of cash-settlement is obtained. The incentive pro-grammes are subsequently remeasured on each balance sheet date and upon final settle-ment, and any changes in the fair value of the programmes are recognised in the income statement under staff costs. The balancing item is recognised under liabilities.
Pension obligationsThe Group has entered into pension agree-ments and similar agreements with most of the Group’s employees.
Periodical payments to defined contribution plans are recognised in the income statement at the due date and any contributions payable are recognised in the balance sheet under liabilities.
The present value of the Group’s liabilities re-lating to future pension payments according to defined benefit plans is measured on an actu-arial basis at intervals of not more than three years on the basis of the pensionable period of employment up to the time of the actuarial valuation. The Projected Unit Credit Method is applied to determine the present value. The present value is calculated based on assump-tions of the future developments of salary, in-terest, inflation, mortality rates, disability and
Notes 1

59
Group
Key figures
Financial key figures are calculated according to Recommendations and Financial Ratios 2005 issued by the Danish Society of Financial Ana-lysts.
For definitions of key figures see Summary for
the Group 2004 -2008, pages 42-43.
Cash flows from financing activities include payments to and from shareholders and re-lated expenses as well as the raising of and re-payments on mortgage debt and other non-current liabilities.
Cash comprises cash less short-term bank debt falling due on demand.
Cash flows denominated in foreign currencies, including cash flows in foreign subsidiaries, are translated at the average exchange rates dur-ing the year because they approximate the actual rates at the date of payment. Cash at year-end is translated at the rates at the bal-ance sheet date, and the effect of exchange rate changes on cash is shown as a separate item in the cash flow statement.
Segment reporting
The Group is engaged in research, develop-ment, production and marketing of pharma-ceuticals for the treatment of illnesses in the field of CNS.
In accordance with IFRS 8 Operating Segments, segments must be identified based on internal management reporting. In Lundbeck the inter-nal reporting follows the Group’s accounting policies. In accordance with the internal man-agement reporting, on the basis of which management evaluates and allocates re-sources, the Group’s activities are exclusively in the business segment of ‘Pharmaceuticals for the treatment of illnesses in the field of CNS’.
The geographic distribution is shown for reve-nue and non-current assets excluding deferred tax assets. The revenue distribution is based on the external customers’ geographical location.
costs paid. In subsequent periods the financial liabilities are measured at amortised cost, equivalent to the capitalised value when the effective rate of interest is used, so that the difference between the proceeds and the nom-inal value is recognised in the income state-ment over the loan period.
Debt included in the short-term financial li-quidity is also measured at amortised cost in subsequent periods.
Other payables, which include trade payables, payables to subsidiaries and associates as well as other debt, are measured at amortised cost.
Cash flow statement
The consolidated cash flow statement is pres-ented according to the indirect method and shows the composition of cash flows, divided into operating, investing and financing activities respectively, and cash at the beginning and the end of the year.
Cash flows from acquisitions and divestments of companies are shown separately under cash flows from investing activities. The cash flow statement includes cash flows from acquired companies from the date of acquisition and cash flows from divested companies until the time of divestment.
Cash flows from operating activities are calcu-lated as the Group’s results before net finan-cials, adjusted for non-cash operating items, working capital changes, financials paid and received and income taxes paid.
Cash flows from investing activities include payments in connection with purchases and sales of intangible assets, property, plant and equipment and financial assets, including equity investments in companies. Also in-cluded are securities classified as current assets.
Notes 1
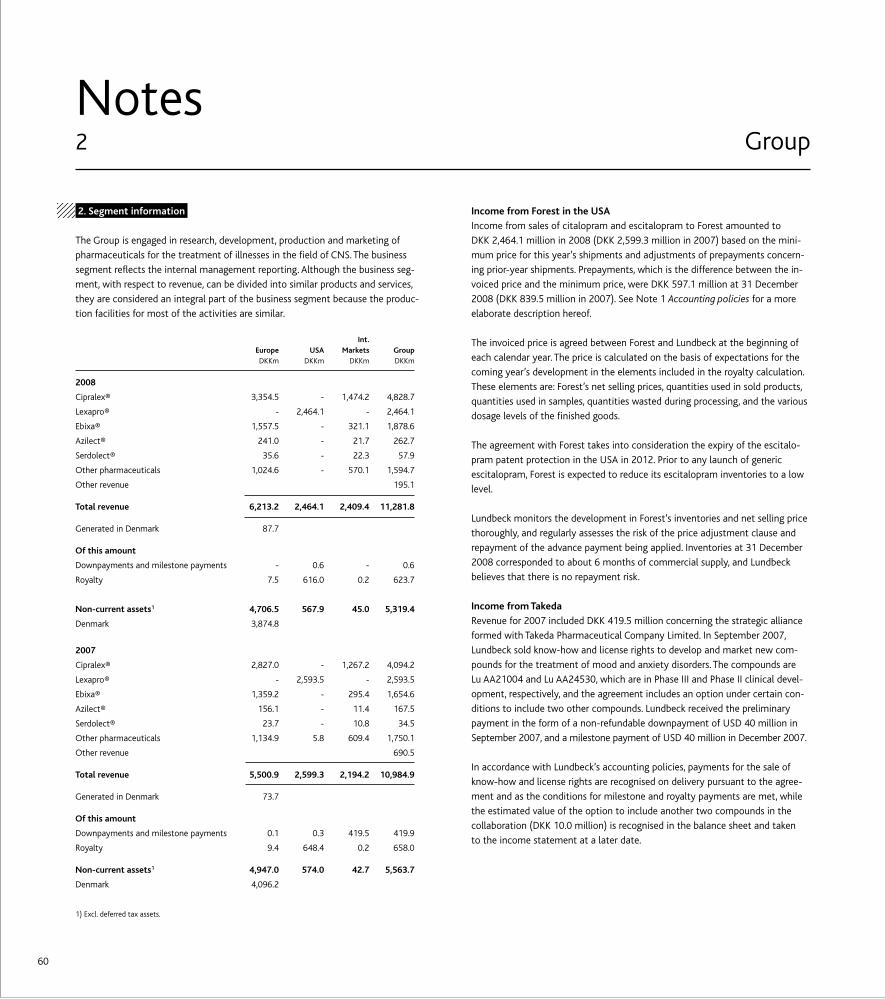
60
GroupNotes 2
2. Segment information
The Group is engaged in research, development, production and marketing of
pharmaceuticals for the treatment of illnesses in the field of CNS. The business
segment reflects the internal management reporting. Although the business seg-
ment, with respect to revenue, can be divided into similar products and services,
they are considered an integral part of the business segment because the produc-
tion facilities for most of the activities are similar.
Int. Europe USA Markets Group DKKm DKKm DKKm DKKm
2008
Cipralex® 3,354.5 - 1,474.2 4,828.7
Lexapro® - 2,464.1 - 2,464.1
Ebixa® 1,557.5 - 321.1 1,878.6
Azilect® 241.0 - 21.7 262.7
Serdolect® 35.6 - 22.3 57.9
Other pharmaceuticals 1,024.6 - 570.1 1,594.7
Other revenue 195.1
Total revenue 6,213.2 2,464.1 2,409.4 11,281.8
Generated in Denmark 87.7
Of this amount
Downpayments and milestone payments - 0.6 - 0.6
Royalty 7.5 616.0 0.2 623.7
Non-current assets1 4,706.5 567.9 45.0 5,319.4
Denmark 3,874.8
2007
Cipralex® 2,827.0 - 1,267.2 4,094.2
Lexapro® - 2,593.5 - 2,593.5
Ebixa® 1,359.2 - 295.4 1,654.6
Azilect® 156.1 - 11.4 167.5
Serdolect® 23.7 - 10.8 34.5
Other pharmaceuticals 1,134.9 5.8 609.4 1,750.1
Other revenue 690.5
Total revenue 5,500.9 2,599.3 2,194.2 10,984.9
Generated in Denmark 73.7
Of this amount
Downpayments and milestone payments 0.1 0.3 419.5 419.9
Royalty 9.4 648.4 0.2 658.0
Non-current assets1 4,947.0 574.0 42.7 5,563.7
Denmark 4,096.2
1) Excl. deferred tax assets.
Income from Forest in the USA
Income from sales of citalopram and escitalopram to Forest amounted to
DKK 2,464.1 million in 2008 (DKK 2,599.3 million in 2007) based on the mini-
mum price for this year’s shipments and adjustments of prepayments concern-
ing prior-year shipments. Prepayments, which is the difference between the in-
voiced price and the minimum price, were DKK 597.1 million at 31 December
2008 (DKK 839.5 million in 2007). See Note 1 Accounting policies for a more
elaborate description hereof.
The invoiced price is agreed between Forest and Lundbeck at the beginning of
each calendar year. The price is calculated on the basis of expectations for the
coming year’s development in the elements included in the royalty calculation.
These elements are: Forest’s net selling prices, quantities used in sold products,
quantities used in samples, quantities wasted during processing, and the various
dosage levels of the finished goods.
The agreement with Forest takes into consideration the expiry of the escitalo-
pram patent protection in the USA in 2012. Prior to any launch of generic
escitalopram, Forest is expected to reduce its escitalopram inventories to a low
level.
Lundbeck monitors the development in Forest’s inventories and net selling price
thoroughly, and regularly assesses the risk of the price adjustment clause and
repayment of the advance payment being applied. Inventories at 31 December
2008 corresponded to about 6 months of commercial supply, and Lundbeck
believes that there is no repayment risk.
Income from Takeda
Revenue for 2007 included DKK 419.5 million concerning the strategic alliance
formed with Takeda Pharmaceutical Company Limited. In September 2007,
Lundbeck sold know-how and license rights to develop and market new com-
pounds for the treatment of mood and anxiety disorders. The compounds are
Lu AA21004 and Lu AA24530, which are in Phase III and Phase II clinical devel-
opment, respectively, and the agreement includes an option under certain con-
ditions to include two other compounds. Lundbeck received the preliminary
payment in the form of a non-refundable downpayment of USD 40 million in
September 2007, and a milestone payment of USD 40 million in December 2007.
In accordance with Lundbeck’s accounting policies, payments for the sale of
know-how and license rights are recognised on delivery pursuant to the agree-
ment and as the conditions for milestone and royalty payments are met, while
the estimated value of the option to include another two compounds in the
collaboration (DKK 10.0 million) is recognised in the balance sheet and taken
to the income statement at a later date.

61
GroupNotes 3
The value of the warrant and share schemes for the Executive Management,
vested and calculated according to the Black-Scholes formula, was DKK 2.4 mil-
lion at 31 December 2008 (DKK 3.6 million in 2007).
The members of the Executive Management participate in a short-term incentive
programme that provides an annual bonus for the achievement of pre-determined
targets of the preceding financial year. The CEO may receive up to nine months’
base salary as a bonus on condition of achievement of exceptional results. Other
members of the Executive Management may receive up to six months’ base salary
as a bonus on condition of achievement of exceptional results.
The total remuneration for 2008 for the retired CEO was DKK 9.1 million. Of this
amount, a special severance payment, which includes salary during the notice
period, amounted to DKK 7.4 million.
Supervisory Board
Remuneration of members of the Supervisory Board for 2008 amounted to DKK
4.6 million (DKK 3.7 million in 2007). To this amount should be added remunera-
tion for participation in the Audit Committee of DKK 0.4 million (DKK 0.4 million
in 2007), and for participation in the Remuneration Committee of DKK 0.2 mil-
lion (DKK 0.2 million in 2007). The members of the Supervisory Board held a
total of 39,212 Lundbeck shares at 31 December 2008 (29,332 shares in 2007).
The total remuneration for 2008 of the chairman of the Supervisory Board
amounted to DKK 2.0 million (DKK 1.3 million in 2007). The amount includes
remuneration for extraordinary duties during the period March to June 2008 until
the new CEO was appointed and remuneration for participation in the Audit
Committee and Remuneration Committee. The total remuneration of the deputy
chairman of the Supervisory Board for 2008 amounted to DKK 0.7 million (DKK
0.7 million in 2007), including remuneration for participation in the Audit Com-
mittee.
Employees 2008 2007
Average number of full-time employees in the financial year 5,208 5,134
Number of full-time employees at 31.12.
In Denmark 2,114 1,989
Abroad 3,204 3,108
Total 5,318 5,097
3. Staff costs
Wages and salaries, etc. 2008 2007 DKKm DKKm
Short-term staff benefits 2,344.7 2,255.0
Pension benefits 153.4 124.3
Other social security costs 292.5 303.6
Total 2,790.6 2,682.9
The year’s staff costs are analysed as follows
Cost of sales 402.7 384.5
Distribution costs 855.8 929.0
Administrative expenses 772.8 679.2
Research and development costs 759.3 690.2
Total 2,790.6 2,682.9
Executives
Short-term staff benefits 52.5 47.0
Pension benefits 8.3 6.4
Other social security costs 0.4 1.3
Share-based payment 1.2 7.2
Total 62.4 61.9
Executive Management
Short-term staff benefits 35.6 18.7
Severance payment 7.4 7.0
Pension benefits 4.6 1.3
Share-based payments 0.4 3.3
Total 48.0 30.3
The Executive Management was increased from four to six members in 2008.
The total remuneration of the existing CEO, including bonus, which is a combina-
tion of company strategic and individual targets as well as share-based payment,
amounted to DKK 13.9 million for the 2008 financial year. Of this amount, a one-
off consideration on appointment accounted for DKK 6.5 million. In 2007, the to-
tal remuneration of the CEO, including bonus, which is a combination of company
strategic and individual targets, and share-based payment, amounted to DKK 8.6
million.

62
GroupNotes 3
3. Staff costs – continued
Incentive programmes
Warrant scheme for the Executive Management and key employees
(2004 plan)
In 2004, the company established a warrant scheme for the Executive Manage-
ment and a number of key employees in Denmark and abroad. Approximately
1,100 employees were granted a total of 2,554,092 warrants, including 160,000
granted to the Executive Management at the time. The warrants had vested fully
from the commencement of the scheme and could be exercised during the period
9 December 2004 to 30 August 2007. The exercise price was DKK 108.11 through-
out the exercise period.
The scheme expired in 2007 and unexercised warrants were cancelled at 1 Sep-
tember 2007. In 2007, 992,121 warrants were exercised under this scheme.
Executive Total market Management Executives Other Total valueWarrant scheme 2004 Number Number Number Number DKKm
Outstanding at 01.01.2007 115,500 93,400 1,133,795 1,342,695 65.1
Exercised (75,500) (77,400) (839,221) (992,121)
Cancelled (40,000) (16,000) (294,574) (350,574)
Outstanding at 31.12.2007 - - - -
Warrant scheme for the Executive Management and Danish and foreign
executives (2005 plan)
In 2005, the company established a warrant scheme for the Executive Manage-
ment and Danish and foreign executives. 76 employees were granted a total of
647,000 warrants, 160,000 of which were allocated to the Executive Management
at the time. The warrants had vested fully from the commencement of the
scheme and may be exercised during the period 2 October 2006 to 31 March
2009. The exercise price is DKK 179.00 throughout the exercise period.
No warrants have been exercised under this scheme.
Executive Total market Management Executives Other Total valueWarrant scheme 2005 Number Number Number Number DKKm
Outstanding at 01.01.2007 160,000 343,000 144,000 647,000 7.4
Recategorised (60,000) (105,000) 165,000 -
Outstanding at 31.12.2007 100,000 238,000 309,000 647,000 2.1
Recategorised 5,000 (61,000) 56,000 -
Outstanding at 31.12.2008 105,000 177,000 365,000 647,000 0.4
At 31 December 2008, the calculated market value per warrant was DKK 0.55
(DKK 3.24 in 2007) based on the Black-Scholes formula for valuation of options.
The calculation is based on an exercise price of DKK 179.00, a quoted price of
DKK 110.00 (DKK 138.00 in 2007), a volatility of 62.37% (32.13% in 2007), a
dividend payout ratio of 1.50% (1.18% in 2007) and a risk-free interest rate of
4.91% (4.35% in 2007).
Warrant scheme for the Executive Management and Danish and foreign
executives (2007 plan)
In 2007, the company established a warrant scheme for the Executive Manage-
ment and Danish and foreign executives. 80 employees were granted a total of
844,500 warrants, 173,000 of which were allocated to the Executive Manage-
ment at the time. The warrants had vested fully from the commencement of the
scheme and may be exercised during the period 1 August 2008 to 31 March
2011. The exercise price is DKK 156.00 throughout the exercise period.
The warrants granted are recognised in the income statement for 2008 at an ex-
pense of DKK 0 (DKK 16.4 million in 2007, which corresponded to the market
value at the time of grant calculated according to the Black-Scholes formula).
No warrants have been exercised under this scheme.
Executive Total market Management Executives Other Total valueWarrant scheme 2007 Number Number Number Number DKKm
Granted 173,000 366,800 304,700 844,500
Outstanding at 31.12.2007 173,000 366,800 304,700 844,500 16.3
Recategorised 7,000 (63,700) 56,700 -
Outstanding at 31.12.2008 180,000 303,100 361,400 844,500 9.1
At 31 December 2008, the calculated market value per warrant was DKK 10.76
(DKK 19.31 in 2007) based on the Black-Scholes formula for valuation of op-
tions. The calculation is based on an exercise price of DKK 156.00, a quoted
price of DKK 110.00 (DKK 138.00 in 2007), a volatility of 41.29% (30.23% in
2007), a dividend payout ratio of 1.50% (1.18% in 2007) and a risk-free interest
rate of 2.59% (4.25% in 2007).
Warrant scheme for the Executive Management and key employees
(2008 plan)
In May 2008, the company established a warrant scheme for the Executive
Management and a number of key employees in Denmark and abroad. 87 em-
ployees were granted a total of 405,234 warrants, 219,618 of which were allo-
cated to the Executive Management (excl. the CEO). The warrants for key em-
ployees will vest at 6 May 2011 subject to the employee still being employed
with Lundbeck.

63
GroupNotes 3
Executive Total market Management Executives Other Total valueWarrant scheme 2008 Number Number Number Number DKKm
Granted 353,928 59,605 126,011 539,544
Recategorised - 17,126 (17,126) -
Cancelled - - (3,027) (3,027)
Outstanding at 31.12.2008 353,928 76,731 105,858 536,517 12.9
At 31 December 2008, the calculated market values per option are based on the
Black-Scholes formula for valuation of options. For the Executive Management
(excl. the CEO), the market value per option is DKK 18.80. The calculation is
based on an exercise price of DKK 115.00, a quoted price of DKK 110.00, a vola-
tility of 33.50%, a dividend payout ratio of 1.50% and a risk-free interest rate of
3.09%. For the CEO, the market value per option is DKK 18.90. The calculation is
based on an exercise price of DKK 115.00, a quoted price of DKK 110.00, a vola-
tility of 33.50%, a dividend payout ratio of 1.50% and a risk-free interest rate of
3.09%. For key employees, the market value per option is DKK 33.90. The calcu-
lation is based on an exercise price of DKK 115.00, a quoted price of DKK 110.00,
a volatility of 33.50%, a dividend payout ratio of 1.50% and a risk-free interest
rate of 3.09%. The calculation of the market value per warrant for warrants
granted to the Executive Management takes into consideration Lundbeck’s rank-
ing in a peer group of companies.
Share scheme for the Executive Management and key employees (2008 plan)
In May 2008, the company established a share scheme for the Executive Man-
agement and a number of key employees in Denmark and abroad. 87 employees
were granted a total of 71,870 shares, 12,429 of which were allocated to the
Executive Management (excl. the CEO). The shares for key employees will vest at
6 May 2011 subject to the employee still being employed with Lundbeck. The
shares for the Executive Management (excl. the CEO) will vest at 6 May 2011
subject to the Executive Management member being employed with Lundbeck
throughout the period. For the Executive Management member, award of the
shares is subject to H. Lundbeck A/S’ ranking in a peer group of companies. The
market value at the time of grant was DKK 120.25 per share.
In June 2008, the new CEO was granted 2,739 shares. The shares will vest at
2 June 2011 subject to the CEO being employed with Lundbeck throughout the
period. For the CEO, award of the shares is subject to H. Lundbeck A/S’ ranking
in a peer group of companies. The market value at the time of grant was DKK
117.75 per share.
The shares granted are recognised in the income statement for 2008 at an ex-
pense of DKK 1.9 million corresponding to the market value at the time of grant
for the vesting period to date.
3. Staff costs – continued
The warrants for the Executive Management (excl. the CEO) will vest at 6 May
2011 subject to the Executive Management member being employed with
Lundbeck throughout the period. For the Executive Management member, award
of the warrants or parts thereof is subject to H. Lundbeck A/S’ ranking in a peer
group of companies. The warrants may be exercised during the period 6 May 2011
to 5 May 2016. The exercise price is DKK 115.00 throughout the exercise period.
In June 2008, the new CEO was granted 134,310 warrants. The warrants will vest
at 2 June 2011 subject to the CEO being employed with Lundbeck throughout the
period. For the CEO, award of the warrants or parts thereof is subject to H. Lund-
beck A/S’ ranking in a peer group of companies. The warrants may be exercised
during the period 2 June 2011 to 1 June 2016. The exercise price is DKK 115.00
throughout the exercise period.
The market value per warrant at the time of grant for warrants to key employees
is calculated using the Black-Scholes formula and is based on a volatility of
30.02%, a dividend payout ratio of 2.11%, a risk-free interest rate of 4.24%, an
average maturity of approximately 64 months and a share price of DKK 120.25.
This translates into a market value of DKK 35.55 per warrant.
The market value per warrant at the time of grant for warrants to the Executive
Management (excl. the CEO) is calculated using the Black-Scholes formula and
is based on a volatility of 30.02%, a dividend payout ratio of 2.11%, a risk-free
interest rate of 4.28%, an average maturity of approximately 79 months and a
share price of DKK 120.25. This translates into a market value of DKK 38.50 per
warrant.
The market value per warrant at the time of grant for warrants to the CEO is cal-
culated using the Black-Scholes formula and is based on a volatility of 30.45%, a
dividend payout ratio of 2.17%, a risk-free interest rate of 4.57%, an average ma-
turity of approximately 79 months and a share price of DKK 117.75. This trans-
lates into a market value of DKK 37.71 per warrant.
The warrants granted are recognised in the income statement for 2008 at an
expense of DKK 1.3 million corresponding to the market value at the time of
grant calculated according to the Black-Scholes formula for the vesting period
to date. No expense has been recognised for the warrants that depend on the
Lundbeck share’s ranking in the peer group, as the vesting conditions were not
met at 31 December 2008.

64
Group
3. Staff costs – continued
Executive Total market Management Executives Other Total valueShare scheme 2008 Number Number Number Number DKKm
Granted 15,168 19,391 40,050 74,609
Recategorised - 5,298 (5,298) -
Cancelled - - (978) (978)
Outstanding at 31.12.2008 15,168 24,689 33,774 73,631 7.6
At 31 December 2008, the calculated market values per share are based on the
Black-Scholes formula for valuation of options. For the Executive Management
(incl. the CEO), the market value per share is DKK 98.50. The calculation is based
on a quoted price of DKK 110.00, a volatility of 33.50%, a dividend payout ratio of
1.50% and a risk-free interest rate of 3.09%. For key employees, the market value
per share is DKK 104.90. The calculation is based on a quoted price of DKK 110.00,
a volatility of 33.50%, a dividend payout ratio of 1.50% and a risk-free interest rate
of 3.09%. The calculation of the market value per share for shares granted to the
Executive Management takes into consideration Lundbeck’s ranking in a peer
group of companies.
Share price based plan for employees in foreign subsidiaries (2002 plan)
In 2002, the employees of foreign subsidiaries received a share price based plan,
according to which employees employed by the Group throughout the period
1 June 2002 to 2 January 2006 received a cash amount equal to 50% of the value
of the plan. The remaining 50% of the value of the plan was paid if the employees
was employed by the Group throughout the period 1 June 2002 to 2 January
2008. The size of the amount depended on how much the price of the Lundbeck
share at 2 January 2006 and 2 January 2008 respectively exceeded DKK 81.00 per
share (equal to the special price of the Danish employee share plan). The share
price based plan could not be converted into shares because the value of the plan
was distributed as a cash amount.
The year’s adjustment of the calculation basis of the share price based plan for
employees employed by the Group amounted to 112,380 shares (10,212 shares in
2007) and was due to expiry of 50% of the plan.
The value adjustment for the year is recognised in the income statement for 2008
at an income of DKK 0.3 million (DKK 0.7 million in 2007). The plan expired in
2008, and the obligation at 31 December 2008 amounted to DKK 0 (DKK 7.9
million in 2007).
Executive Total Management Executives Other Total obligationShare price based plan 2002 Number Number Number Number DKKm
Obligation at 01.01.2007 600 5,270 116,722 122,592 8.6
Cancelled and recategorised (600) (3,180) (6,432) (10,212)
Obligation at 31.12.2007 - 2,090 110,290 112,380 7.9
Paid out - (2,090) (110,290) (112,380)
Obligation at 31.12.2008 - - - -
In 2007, the calculated market value per option was DKK 57.01 based on an exer-
cise price of DKK 81.00, a quoted price of DKK 138.00, a volatility of 21.91%, a
dividend payout ratio of 1.18% and a risk-free interest rate of 4.25%.
Stock Appreciation Rights for employees of US subsidiaries (2004 plan)
In 2004, key employees of US subsidiaries were granted Stock Appreciation
Rights (SARs), a share price based plan with conditions similar to those of the
warrant scheme granted in 2004 to the company’s Executive Management
and a number of key employees. The granted SARs were exercisable during the
period 9 December 2004 to 30 August 2007. The size of the amount depended
on how much the price of the Lundbeck share at the exercise date exceeded
DKK 108.11 per share (equal to the exercise price of the warrant scheme). The
share price based plan for employees of the Group’s US subsidiaries could not be
converted into shares because the value of the plan was distributed as a cash
amount.
The scheme expired in 2007 and unexercised SARs were cancelled at 1 Septem-
ber 2007. A total of 46,092 SARs were exercised in 2007.
The plan was recognised in the income statement for 2007 at an income of
DKK 0.8 million.
Total Executives Other Total obligationStock Appreciation Rights 2004 Number Number Number DKKm
Obligation at 01.01.2007 4,400 42,192 46,592 2.4
Exercised (4,400) (41,692) (46,092)
Cancelled - (500) (500)
Obligation at 31.12.2007 - - -
Notes 3

65
Group
3. Staff costs – continued
Stock Appreciation Rights for employees of US subsidiaries (2008 plan)
In 2008, key employees of US subsidiaries were granted Stock Appreciation Rights
(SARs), a share-based plan with conditions similar to those of the warrant scheme
granted in 2008 to a number of key employees in the company and its non-US
subsidiaries. The allocated SARs will vest at 11 August 2011 subject to the em-
ployee still being employed with Lundbeck. The granted SARs are exercisable dur-
ing the period 11 August 2011 to 10 August 2016. The size of the amount de-
pends on how much the price of the Lundbeck share at the exercise date exceeds
DKK 119.76 per share. The share price based plan for employees of the Group’s
US subsidiaries cannot be converted into shares because the value of the plan is
distributed as a cash amount.
The market value per SAR at the time of grant is calculated using the Black-
Scholes formula and is based on a volatility of 33.50%, a dividend payout ratio of
1.50%, a risk-free interest rate of 4.42%, an average maturity of approximately 68
months and a share price of DKK 119.76. This translates into a market value of
DKK 41.26 per SAR.
The value adjustment for the year based on the Black-Scholes formula is recog-
nised in the income statement at an expense of DKK 0 million. The obligation in
respect of vested SARs amounted to DKK 0 million at 31 December 2008.
Total Executives Other Total obligationStock Appreciation Rights 2008 Number Number Number DKKm
Granted 2,258 - 2,258
Obligation at 31.12.2008 2,258 - 2,258 0.1
At 31 December 2008, the calculated market value per SAR was DKK 30.46 based
on the Black-Scholes formula for valuation of options. The calculation is based on
an exercise price of DKK 119.76, a quoted price of DKK 110.00, a volatility of
33.50%, a dividend payout ratio of 1.50% and a risk-free interest rate of 3.00%.
Restricted Cash Units for employees of US subsidiaries (2008 plan)
In 2008, key employees of US subsidiaries were granted Restricted Cash Units
(RCUs), a share price based plan with conditions similar to those of the share
scheme granted in 2008 to a number of key employees in the company and its
non-US subsidiaries. The allocated RCUs will vest at 11 August 2011 subject to
the employee still being employed with Lundbeck, after which time they are
settled. The size of the amount depends on the value of the Lundbeck share at
the vesting date. The share price based plan for employees of the Group’s US
subsidiaries cannot be converted into shares because the value of the plan is
distributed as a cash amount.
The market value per RCU at the time of grant has been calculated at
DKK 114.50.
The value adjustment for the year based on development in the Lundbeck share
is recognised in the income statement at an expense of DKK 0 million. The obli-
gation in respect of vested RCUs amounted to DKK 0 million at 31 December
2008.
Total Executives Other Total obligationRestricted Cash Units 2008 Number Number Number DKKm
Granted 814 - 814
Obligation at 31.12.2008 814 - 814 0.1
At 31 December 2008, the calculated market value per RCU was DKK 105.10
based on a Monte Carlo simulation for valuation of options. The calculation is
based on a quoted price of DKK 110.00, a volatility of 33.50%, a dividend payout
ratio of 1.50% and a risk-free interest rate of 3.00%.
General information applying to all incentive programmes
The total number of warrants which were exercisable and in-the-money at
31 December 2008 was 0 (0 in 2007).
The total expense recognised in the income statement concerning all incentive
programmes was DKK 3.0 million in 2008 (DKK 14.9 million in 2007), and the
total obligation concerning the debt plans at 31 December 2008 was DKK 0
million (DKK 7.9 million in 2007).
The performance of the Lundbeck share in 2008 is illustrated in the chart on
page 28 in the section Share.
Notes 3

66
GroupNotes 4-5
4. Amortisation and depreciation
Property, Intangible plant and assets equipment Total2008 DKKm DKKm DKKm
Amortisation, depreciation and impairment for the year are analysed as follows
Cost of sales 53.8 155.0 208.8
Distribution costs 12.4 14.6 27.0
Administrative expenses 16.0 55.1 71.1
Research and development costs 610.0 148.7 758.7
Total 692.2 373.4 1,065.6
Impairment losses on intangible assets are recognised under research and devel-
opment costs.
Research and development costs include a DKK 481.0 million impairment loss
concerning commercial product rights to Flurizan®. Because the clinical Phase III
data did not correspond to the indications observed in Phase II, it was decided
to discontinue the development of the compound and write down the product
rights.
Losses and gains on the sale of intangible assets and property, plant and equip-
ment are recognised at a net loss of DKK 12.9 million.
Property, Intangible plant and assets equipment Total2007 DKKm DKKm DKKm
Amortisation, depreciation and impairment for the year are analysed as follows
Cost of sales 68.1 571.6 639.7
Distribution costs 5.3 10.8 16.1
Administrative expenses 8.8 59.7 68.5
Research and development costs 77.2 114.3 191.5
Total 159.4 756.4 915.8
Impairment losses on intangible assets are recognised under research and devel-
opment costs.
In 2007, cost of sales included a DKK 342.8 million impairment writedown to
estimated market value of property, plant and equipment in the manufacturing
unit Lundbeck Pharmaceuticals Ltd. in Seal Sands, UK, following a reassessment
of production capacity.
Losses and gains on the sale of intangible assets and property, plant and equip-
ment are recognised at a net loss of DKK 25.7 million.
5. Audit fees
2008 2007 DKKm DKKm
Deloitte
Statutory audit 5.3 5.3
Other assurance engagements 0.2 0.1
Tax consulting 1.0 1.0
Other services 3.2 2.3
Total 9.7 8.7
Grant Thornton
Statutory audit - 0.6
Other services - 1.0
Total - 1.6
A few small foreign subsidiaries are not audited by the parent company’s audi-
tor, a foreign business partner of the auditor, or by an internationally recognised
accountancy firm.
At the Annual General Meeting held on 22 April 2008, it was resolved to retain
Deloitte as the auditor appointed by the shareholders in general meeting.

67
GroupNotes 6-7
Explanation of the Group’s effective tax rate relative to the Danish tax rate DKKm Pct.
2008
Profit before tax 2,122.9
Calculated tax, 25% 530.7 25.0%
Tax effect of
Differences in the tax rates of foreign subsidiaries fromthe Danish rate of 25% 27.7 1.3%
Non-deductible expenses/non-taxable income and other permanent differences 34.0 1.6%
Change of deferred tax as a result of changed income tax rates 0.1 0.0%
Prior year tax adjustments, etc., total effect on operations (13.5) -0.6%
Effective tax for the year before market value adjustmentof other investments 579.0 27.3%
Non-deductible losses/non-taxable gains on shares and other equity investments 23.5 1.1%
Tax effect of result in associates 10.8 0.5%
Effective tax for the year 613.3 28.9%
2007
Profit before tax 2,561.5
Calculated tax, 25% 640.3 25.0%
Tax effect of
Differences in the tax rates of foreign subsidiaries fromthe Danish rate of 25% 43.5 1.7%
Non-deductible expenses/non-taxable income and other permanent differences 124.6 4.8%
Change of deferred tax as a result of changed income tax rates (24.2) -0.9%
Prior year tax adjustments, etc., total effect on operations (3.7) -0.1%
Effective tax for the year before market value adjustmentof other investments 780.5 30.5%
Non-deductible losses/non-taxable gains on shares and other equity investments (9.5) -0.4%
Tax effect of result in associates 21.0 0.8%
Effective tax for the year 792.0 30.9%
6. Net financials
2008 2007 DKKm DKKm
Interest, cash and securities, etc. 150.7 124.5
Exchange gains 210.5 163.0
Dividend received 5.0 45.8
Realised and unrealised gains:
- Bonds 35.8 0.9
- Derivative financial instruments, trading 17.4 2.9
Total financial income 419.4 337.1
Interest, bank and mortgage debt, etc. 115.0 101.9
Other financial expenses 2.9 2.7
Writedown of receivables from associates 7.5 31.2
Exchange losses 311.2 239.3
Realised and unrealised losses:
- Bonds 23.5 11.1
- Equity investments 96.2 -
- Derivative financial instruments, trading 48.3 0.8
- Mortgage debt 0.2 -
Total financial expenses 604.8 387.0
Net financials (185.4) (49.9)
7. Tax on profit for the year
2008 2007 DKKm DKKm
Current tax 481.0 796.7
Prior year adjustment, current tax (7.4) 1.5
Prior year adjustment, deferred tax (6.1) (5.2)
Change of deferred tax for the year 126.4 28.7
Change of deferred tax as a result of changed income tax rates 0.1 (24.2)
Total tax for the year 594.0 797.5
Tax for the year is composed of
Tax on profit for the year 613.3 792.0
Tax on income and expenses recognised in equity (19.3) 8.9
Tax on other equity transactions - (3.4)
Total tax for the year 594.0 797.5

68
GroupNotes 8
8. Intangible assets and property, plant and equipment
Patent Product Other IT and process Projects Intangible Goodwill rights rights rights projects1 in progress1 assets DKKm DKKm DKKm DKKm DKKm DKKm DKKm
2008
Cost at 01.01.2008 882.2 506.3 726.5 153.0 400.6 94.5 2,763.1
Exchange differences - - (0.1) (1.4) (0.8) (0.4) (2.7)
Reclassification - - - (148.3) 302.7 31.6 186.0
Additions - 0.1 671.9 1.5 141.7 85.9 901.1
Disposals - - (481.0) - (19.6) (84.1) (584.7)
Cost at 31.12.2008 882.2 506.4 917.3 4.8 824.6 127.5 3,262.8
Amortisation at 01.01.2008 - 193.5 258.6 145.3 270.9 - 868.3
Exchange differences - - - (0.9) (0.4) - (1.3)
Reclassification - - - (141.8) 266.8 0.2 125.2
Amortisation during the year - 45.5 52.5 0.8 76.7 0.1 175.6
Impairment during the year - 34.9 481.0 - - - 515.9
Disposals - - (481.0) - (18.9) - (499.9)
Amortisation at 31.12.2008 - 273.9 311.1 3.4 595.1 0.3 1,183.8
Carrying amount at 31.12.2008 882.2 232.5 606.2 1.4 229.5 127.2 2,079.0
2007
Cost at 01.01.2007 882.2 489.5 574.6 154.5 286.9 108.5 2,496.2
Exchange differences - - - (0.7) 0.1 - (0.6)
Reclassification - - - - 8.1 - 8.1
Additions - 16.8 151.9 6.2 113.0 36.6 324.5
Disposals - - - (7.0) (7.5) (50.6) (65.1)
Cost at 31.12.2007 882.2 506.3 726.5 153.0 400.6 94.5 2,763.1
Amortisation at 01.01.2007 - 146.8 222.1 148.9 197.7 - 715.5
Exchange differences - - - (0.7) 0.1 - (0.6)
Reclassification - - - - 7.4 - 7.4
Amortisation during the year - 34.7 36.5 4.1 67.1 - 142.4
Impairment during the year - 12.0 - - - - 12.0
Disposals - - - (7.0) (1.4) - (8.4)
Amortisation at 31.12.2007 - 193.5 258.6 145.3 270.9 - 868.3
Carrying amount at 31.12.2007 882.2 312.8 467.9 7.7 129.7 94.5 1,894.8
1) IT and process projects as well as projects in progress primarily comprise SAP. The amounts include capitalised internal expenses.

69
GroupNotes 8
8. Intangible assets and property, plant and equipment – continued
Goodwill impairment test
The carrying amount of goodwill of DKK 882.2 million (DKK 882.2 million in
2007) relates to the acquisition of Lundbeck Research USA, Inc., USA (DKK
257.5 million), Lundbeck Pharmaceuticals, Italia S.p.A., Italy (DKK 163.0 million)
and 50% of Lundbeck GmbH, Germany (DKK 461.7 million). The annual impair-
ment test is submitted to the Audit Committee for subsequent approval by the
Supervisory Board. Based on the impairment test performed in 2008, it was con-
cluded that there is no need for writing down the goodwill amount. Lundbeck
Pharmaceuticals, Italia S.p.A. and Lundbeck GmbH are defined as independent
cash-generating units (CGU). In the impairment test, the discounted expected
future cash flows (value in use) for each CGU are compared to the carrying
amounts. The future cash flows are based on the companies’ business plans for
2009 to 2013. The key parameters in the calculation of the value in use are
sales, EBITDA, working capital and capital investments. The business plans are
based on management’s specific assessment of the business units’ expected de-
velopment during the period 2009 to 2013. For Lundbeck GmbH, the terminal
value for the period after 2013 has been fixed with due consideration to the
patent expiry for Cipralex®. For Lundbeck Pharmaceuticals, Italia S.p.A., the ter-
minal value for the period after 2013 has been fixed on the assumption of fu-
ture growth of 2% p.a. The calculation of the value in use is based on a WACC of
9% before tax (8% in 2007). The WACC applied has been calculated on the basis
of an analysis performed by Lundbeck in-house and compared with external
assessments. Lundbeck Research USA, Inc. is not defined as an independent CGU
due to its capacity as a research unit. Goodwill related to the acquisition of the
company has therefore been allocated to the uppermost group level along with
the other research and development units. The impairment test of goodwill allo-
cated to the uppermost group level is not carried out as a calculation of the
value in use but as an assessment of the ratio between the carrying amount of
goodwill and the Group’s current market value.
Impairment of product rights
In 2008, Lundbeck acquired the commercial product rights to Flurizan® at a
total value of DKK 481.0 million. Because the clinical Phase III data did not cor-
respond to the indications observed in Phase II, it was decided to discontinue
the development of the compound and write down the product rights. In the in-
come statement the impairment loss is recognised under research and develop-
ment costs.
Impairment of patents
In 2008, an impairment loss of DKK 34.9 million (DKK 12.0 million in 2007) was
recognised concerning patents. In the income statement the impairment loss is
recognised under research and development costs.

70
GroupNotes 8
8. Intangible assets and property, plant and equipment – continued
Prepayments Other fixtures and and plant and Property, plant Land and Plant and fittings, tools equipment in and equipment buildings machinery and equipment progress total DKKm DKKm DKKm DKKm DKKm
2008
Cost at 01.01.2008 3,163.8 1,597.2 1,125.0 600.8 6,486.8
Exchange differences (76.3) (202.2) (14.8) (2.1) (295.4)
Reclassification (27.2) 0.1 (127.3) (31.6) (186.0)
Additions 331.3 141.0 119.5 169.4 761.2
Disposals (17.0) (18.3) (50.0) (531.9) (617.2)
Cost at 31.12.2008 3,374.6 1,517.8 1,052.4 204.6 6,149.4
Depreciation at 01.01.2008 1,116.2 1,204.0 790.6 1.3 3,112.1
Exchange differences (69.7) (200.7) (11.6) (0.4) (282.4)
Reclassification (9.0) 0.1 (116.3) - (125.2)
Depreciation during the year 145.3 101.7 114.2 - 361.2
Disposals (9.6) (15.0) (45.2) - (69.8)
Depreciation at 31.12.2008 1,173.2 1,090.1 731.7 0.9 2,995.9
Carrying amount at 31.12.2008 2,201.4 427.7 320.7 203.7 3,153.5
2007
Cost at 01.01.2007 2,967.3 1,531.0 1,075.6 583.8 6,157.7
Exchange differences 13.8 (6.4) (0.8) (14.4) (7.8)
Reclassification - 0.3 (8.4) - (8.1)
Additions 190.1 146.7 106.0 398.9 841.7
Disposals (7.4) (74.4) (47.4) (367.5) (496.7)
Cost at 31.12.2007 3,163.8 1,597.2 1,125.0 600.8 6,486.8
Depreciation at 01.01.2007 840.7 938.7 711.6 - 2,491.0
Exchange differences (0.4) (3.6) (3.2) - (7.2)
Reclassification - 0.1 (7.5) - (7.4)
Depreciation during the year 143.4 121.4 128.1 - 392.9
Impairment during the year 137.3 204.1 0.1 1.3 342.8
Disposals (4.8) (56.7) (38.5) - (100.0)
Depreciation at 31.12.2007 1,116.2 1,204.0 790.6 1.3 3,112.1
Carrying amount at 31.12.2007 2,047.6 393.2 334.4 599.5 3,374.7
Impairment of property, plant and equipment
In 2007, a DKK 342.8 million writedown for impairment to estimated market value was recognised on property, plant and equipment in the manufacturing unit Lundbeck
Pharmaceuticals Ltd., Seal Sands, UK, following a reassessment of production capacity.

71
Group
9. Investments in associates Accumulated revaluation/ impairment Cost losses Total2008 DKKm DKKm DKKm
Carrying amount at 01.01.2008 181.1 (98.2) 82.9
Additions 111.5 - 111.5
Losses in associates - (43.3) (43.3)
Equity entries in associates - 0.8 0.8
Reclassified to assets held for sale (208.9) 57.0 (151.9)
Carrying amount at 31.12.2008 83.7 (83.7) -
Based on an impairment test performed in 2007, the value of the investment in
CF Pharma Gyógyszergyártó Kft. has been written down to DKK 0. A reassess-
ment of the company’s expected future development did not give rise to any
change in the valuation, and the impairment loss has therefore been retained.
It has been resolved to divest the non-strategic investment in LifeCycle Pharma A/S.
As a result, the investment, which had a carrying amount at 31 December 2008 of
DKK 151.9 million, has been reclassified to assets held for sale. The shares were sold
on 27 January 2009 at DKK 18.00 per share, corresponding to a total selling price of
DKK 275.6 million. The profit from the divestment totalled DKK 123.7 million,
which will be recognised as revenue in the first quarter of 2009. There was no in-
dication of impairment at 31 December 2008. The fair value of the investment in
Life Cycle Pharma A/S at 31 December 2008 amounted to DKK 170.0 million.
Share of voting rights and ownership
CF Pharma Gyógyszergyártó Kft., Hungary 47.1%
LifeCycle Pharma A/S, Denmark 27.2%
Accumulated revaluation/ impairment Cost losses Total2007 DKKm DKKm DKKm
Carrying amount at 01.01.2007 181.1 (14.2) 166.9
Losses in associates - (53.3) (53.3)
Impairment on investment - (30.7) (30.7)
Carrying amount at 31.12.2007 181.1 (98.2) 82.9
Based on an impairment test, the value of the investment in CF Pharma
Gyógyszergyártó Kft. has been written down to DKK 0. The fair value of the in-
vestment in LifeCycle Pharma A/S at 31 December 2007 was DKK 312.4 million.
Share of voting rights and ownership
CF Pharma Gyógyszergyártó Kft., Hungary 47.1%
LifeCycle Pharma A/S, Denmark 27.5%
2008 2007Financial highlights of associates DKKm DKKm
Assets 866.4 678.7
Liabilities 231.4 275.7
Net assets 635.0 403.0
Share of net assets 188.1 134.9
Revenue 254.1 100.8
Profit/(loss) for the year (177.6) (174.3)
Group’s share of profit/(loss) for the year (52.1) (53.3)
10. Other investments and other receivables
Available- Receivables for-sale from financial Other associates assets receivables1
2008 DKKm DKKm DKKm
Carrying amount at 01.01.2008 - 150.7 60.6
Additions 7.5 36.5 13.5
Disposals - - (18.0)
Value adjustment - (102.7) (0.3)
Writedown of receivables (7.5) - -
Exchange differences - (0.4) (0.3)
Reclassified to assets held for sale - (52.7) -
Carrying amount at 31.12.2008 - 31.4 55.5
It has been resolved to divest the non-strategic investments in four small private
equity funds recognised under available-for-sale financial assets. As a result, the in-
vestments have been reclassified to assets held for sale. As a decision about the di-
vestment had been made at 31 December 2008, the investments have been written
down to the expected selling price of DKK 52.7 million. The expected loss on the
sale of the investments, which had previously been measured at fair value in equity,
amounted to DKK 96.2 million. The loss is recognised under net financials in the
income statement.
Available- Receivables for-sale from financial Other associates assets receivables2007 DKKm DKKm DKKm
Carrying amount at 01.01.2007 19.2 127.6 63.6
Additions 12.0 10.6 11.2
Disposals - - (13.3)
Value adjustment - 12.8 (0.1)
Writedown of receivables (31.2) - -
Exchange differences - (0.3) (0.8)
Carrying amount at 31.12.2007 - 150.7 60.6
1) At 31 December 2008, other receivables are not believed to involve any credit risk.
Notes9-10

72
GroupNotes 10-12
10. Other investments and other receivables – continued
2008 2007Fair value adjustment of available-for-sale financial assets DKKm DKKm
Fair value adjustment at 01.01. (168.6) (181.4)
Adjustment due to prolonged impairment losses before 01.01.2005 154.0 -
Revaluation during the year 8.7 21.6
Impairment losses during the year (111.4) (8.8)
Fair value adjustment of assets held for sale 96.2 -
Fair value adjustment at 31.12. (21.1) (168.6)
11. Inventories
2008 2007 DKKm DKKm
Inventories
Raw materials and consumables 73.9 76.3
Work in progress 531.5 676.4
Finished goods and goods for resale 231.9 171.6
Total 837.3 924.3
Indirect costs of production 352.1 364.5
Impairment loss for the year 22.6 97.9
Inventories calculated at net realisable value 5.2 11.5
The total cost of goods sold included in cost of sales for 2008 amounted to
DKK 966.8 million (DKK 1,124.4 million in 2007).
12. Trade receivables and other receivables
2008 2007 DKKm DKKm
Trade receivables
Receivables 1,530.6 1,567.9
Impairment of trade receivables (3.6) (7.8)
Total 1,527.0 1,560.1
Specification of trade receivables by due date
Receivables not due 1,193.6 1,359.5
Receivables falling due within 3 months 270.2 157.0
Receivables falling due after more than 3 months and up to 6 months 29.1 15.3
Receivables falling due after more than 6 months and up to 12 months 8.1 15.7
Receivables falling due after more than 12 months 29.6 20.4
Total 1,530.6 1,567.9
Development in impairment of trade receivables
Impairment of trade receivables at 01.01. 7.8 6.8
Exchange differences (0.1) 0.1
Realised impairment of receivables during the year (3.8) (0.1)
Reversed, unrealised impairment of receivables (1.0) -
Change in impairment of receivables 0.7 1.0
Impairment of trade receivables at 31.12. 3.6 7.8
Specification of other receivables by due date
Receivables not due 402.8 575.5
Receivables falling due within 3 months 1.9 5.3
Receivables falling due after more than 3 months and up to 6 months 0.6 0.3
Receivables falling due after more than 6 months and up to 12 months 0.4 0.1
Receivables falling due after more than 12 months 0.5 1.0
Total 406.2 582.2
As no losses are expected to be incurred on other receivables, no impairment write-
downs have been made.

73
Group
Credit risks
The primary financial instruments shown in the balance sheet are trade receiv-
ables, securities and cash. The amounts of these balance sheet items are identical
to the maximum credit risk. The Group has no major concentration of credit risk,
as the risk is spread over a large number of creditworthy trading partners. When
deemed necessary, the Group hedges credit risk on receivables.
The securities portfolio consists exclusively of Danish government and mortgage
credit bonds with a limited credit risk.
The credit risk of cash and derivative financial instruments (forward exchange con-
tracts and options) is limited because the Group deals only with banks with a high
credit rating. Due to the problems in the global banking sector, the Group seeks to
the greatest extent possible to place cash and deposits in banks covered by a state
guarantee. Lundbeck’s in-house management and credit exposure to banks are
based on internal credit limits for each counterparty. The credit limits are moni-
tored and reported to the Executive Management and the Supervisory Board
pursuant to the company’s treasury policy.
Notes 12
12. Trade receivables and other receivables – continued
Lundbeck’s products are sold mainly to distributors of pharmaceuticals and hospi-
tals. Historically, the losses sustained have been insignificant. This was also the
case in 2008.
The specific payment conditions for each individual customer, including credit pe-
riods and any payment of interest in case of non-payment, vary from one subsidi-
ary to the next but are always based on industry practice in the relevant market.
As a result of special trading conditions in specific markets, the credit period for
public hospitals may be up to approximately 200 days.
Changes to the Group’s customer portfolio are limited. When collaboration is es-
tablished with new customers, a credit assessment is performed, when deemed
necessary. This credit assessment is made either by Lundbeck or through an exter-
nal credit rating agency.
Undue and due receivables are analysed in an ongoing process. Based on such
analyses, historical experience and industry experience, it is estimated whether
the receivables are recoverable. A large part of the due trade receivables relates to
public hospitals, for which the risk of losses is considered minimal. In 2008 and
2007, no receivable from one single debtor accounted for more than 5% of total
trade receivables. In 2008, receivables from Takeda Pharmaceutical Company
Limited, Forest Laboratories Inc., Teva Pharmaceutical Industries Ltd. and Solvay
Pharmaceuticals B.V. accounted for more than 5% of total other receivables. In
2007, receivables from Takeda Pharmaceutical Company Limited accounted for
more than 5% of total other receivables.
A few of the Group’s receivables are secured through bank guarantees or similar
arrangements, but as most of the Group’s customers are distributors of pharma-
ceuticals and hospitals, the risk of non-payment is considered minimal.

74
GroupNotes 13
13. Share capital
The share capital of DKK 984.4 million at 31 December 2008 is divided into 196,886,282 shares of a nominal value of DKK 5 each.
2008 2007 2006 2005 2004 Share capital DKKm DKKm DKKm DKKm DKKm
Share capital at 01.01. 1,036.4 1,060.8 1,136.1 1,168.7 1,168.7
Exercise of warrants - 5.0 2.6 3.4 -
Cancellation of treasury shares (52.0) (29.4) (77.9) (36.0) -
Share capital at 31.12. 984.4 1,036.4 1,060.8 1,136.1 1,168.7
Share Increase of Cancellation ofShares 01.01. buyback share capital shares bought back 31.12.
2008
Issued shares 207,279,631 - (10,393,349) 196,886,282
Portfolio of treasury shares 6,652,913 4,510,084 - (10,393,349) 769,648
Proportion of share capital 3.21% 0.39%
2007
Issued shares 212,155,154 992,121 (5,867,644) 207,279,631
Portfolio of treasury shares 3,963,353 8,557,204 - (5,867,644) 6,652,913
Proportion of share capital 1.87% 3.21%
There is only one class of shares, and all shares rank equally. The shares are
negotiable instruments with no restrictions on their transferability.
The Supervisory Board is authorised to issue new shares and raise the share
capital, as set out in article 4 of the company’s Articles of Association.
The Supervisory Board recommends distribution of dividend for 2008 of 30%
(30% in 2007) of the profit for the year allocated to the shareholders of the par-
ent company, equivalent to DKK 452.8 million (DKK 530.6 million in 2007) inclu-
sive of dividend on treasury shares, or DKK 2.30 per share (DKK 2.56 in 2007).
The total share premium of DKK 223.9 million, which relates to the exercise of
warrants (see note 3 Staff costs), is unchanged compared with 31 December
2007.
The share capital is in compliance with the capital requirements of the Danish
Public Companies Act and the rules of Nasdaq OMX Copenhagen.
In May 2008, Lundbeck resolved to terminate its share buyback programme,
which entitled the company to acquire treasury shares for up to DKK 6.0 billion
during the period 2005 to 2008. During that period, Lundbeck bought back
treasury shares for a total amount of DKK 4.0 billion, corresponding to
30,319,784 shares.

75
GroupNotes14
14. Pension obligations and similar obligations
The majority of the employees of the Group are covered by pension plans paid for
by the companies of the Group. The types of plan vary according to regulatory re-
quirements, tax rules and economic conditions in the countries in which the em-
ployees are employed. A summary of the most important plans is given below.
Defined contribution plans
For defined contribution plans, the employer undertakes to pay a defined contri-
bution (e.g. a fixed amount or a fixed percentage of the pay). Under a defined
contribution plan, the employees will usually bear the risk related to future de-
velopments in interest and inflation rates etc.
The major defined contribution plans cover employees in Australia, Belgium,
Denmark, the UK, Finland, Ireland and Sweden. The cost of defined contribution
plans, representing contributions to the plans, totalled DKK 150.9 million in
2008 (DKK 128.4 million in 2007).
2008 2007 DKKm DKKm
Expenses for the financial year 150.9 128.4
Defined benefit plans
For defined benefit plans, the employer undertakes to pay a defined benefit (e.g.
a retirement pension at a fixed amount or a fixed percentage of the employee’s
final salary). Under a defined benefit plan, the company usually bears the risk re-
lating to future developments in interest and inflation rates etc.
For defined benefit plans, the present value of future benefits, which the com-
pany is liable to pay under the plan, is computed using actuarial principles. The
computation of present value is based on assumptions about discount rates, in-
creases in pay rates and pensions, investment yield, staff resignation rates, mor-
tality and disability. Present value is computed exclusively for the benefits to
which the employees have earned entitlement through their employment with
the company up till now. Actuarial gains and losses are recognised in the income
statement as they are calculated.
Pension obligations and 2008 2007 2006 2005 similar obligations DKKm DKKm DKKm DKKm
Present value of funded pension obligations 165.4 190.7 216.9 195.1
Fair value of plan assets (134.9) (155.4) (161.2) (142.6)
Funded pension obligations, net 30.5 35.3 55.7 52.5
Present value of unfunded pension obligations 82.9 95.5 94.7 108.2
Pension obligations at 31.12. 113.4 130.8 150.4 160.7
Other pension-like obligations 66.7 57.9 54.1 30.5
Pension obligations and similar obligations at 31.12. 180.1 188.7 204.5 191.2
Experience adjustments to pension obligations 44.5 32.8 6.6 (34.2)
Experience adjustments to plan assets (27.2) (12.8) 2.4 16.2
The Group’s most important defined benefit plans cover employees in the UK,
Germany, Norway and France.
The UK defined benefit plan is funded by means of an independent pension fund.
The actuarial calculation of the liability as at 31 December 2008 is stated in the
Group’s balance sheet at an amount of DKK 13.1 million (DKK 22.9 million in
2007). The liability is calculated as the present value of the future payments of
DKK 108.0 million (DKK 162.9 million in 2007) less the market value of the pen-
sion fund’s assets of DKK 94.9 million (DKK 140.0 million in 2007). The actuarial
calculation was based on a discount rate of 6.70% p.a., a pay rate increase of
4.20% p.a. and a pension increase of 2.36% p.a. The calculation does not include
an age-weighted staff resignation rate. The consolidated income statement for
2008 includes a net expense of DKK 3.0 million in respect of the plan (a net in-
come of DKK 12.5 million in 2007).
The German defined benefit plan is not funded. The actuarial calculation of the lia-
bility derived from the plan as at 31 December 2008 is stated in the Group’s bal-
ance sheet at an amount of DKK 66.6 million (DKK 75.1 million in 2007). The actu-
arial calculation was based on a discount rate of 6.60% p.a., a pay rate increase of
2.75% p.a., a pension increase of 2.00% and an age-weighted staff resignation rate
of 0-10% p.a. The consolidated income statement for 2008 includes a net income
of DKK 6.1 million in respect of the plan (DKK 1.0 million in 2007).
The majority of the Group’s defined benefit plan in Norway is funded. The actuarial
calculation of the liability as at 31 December 2008 is stated in the Group’s balance
sheet at an amount of DKK 9.1 million (DKK 9.5 million in 2007). The liability is cal-
culated as the present value of the future payments of DKK 19.3 million (DKK 24.9
million in 2007) less the market value of the pension fund’s assets of DKK 10.6 mil-
lion (DKK 15.4 million in 2007). The consolidated income statement includes a net
expense of DKK 3.4 million in respect of the plan (DKK 4.5 million in 2007).

76
GroupNotes 14
14. Pension obligations and similar obligations – continued
The French defined benefit plan is not funded. The obligation is recognised in the
consolidated balance sheet at 31 December 2008 at an amount of DKK 14.5 mil-
lion (DKK 18.7 million in 2007). The consolidated income statement for 2008 in-
cludes a net income of DKK 3.8 million in respect of the plan (a net expense of
DKK 3.6 million in 2007).
The pension plan in the USA is funded through an insurance/investment asset,
which is recognised in the consolidated balance sheet. At 31 December 2008, the
total liability amounted to DKK 2.5 million (DKK 3.2 million in 2007). At 31 De-
cember 2008, the value of the insurance/investment asset was DKK 12.0 million
(DKK 11.5 million in 2007). Lundbeck is obliged, under specific terms and condi-
tions, to make payments and pension disbursements to the employees. The con-
solidated income statement for 2008 includes a net income of DKK 0.4 million in
respect of the plan (a net expense of DKK 1.0 million in 2007).
The Group operates a defined benefit plan in Switzerland, which is funded. In the
consolidated balance sheet, the plan is recognised as an obligation of DKK 6.2
million. The liability is calculated as the present value of the future payments of
DKK 35.6 million less the market value of the pension fund’s assets of DKK 29.4
million. The consolidated income statement includes a net expense of DKK 6.2
million in respect of the plan.
Furthermore, the Group operates a defined benefit plan in Pakistan, which is un-
funded. The obligation under this plan is recognised in the consolidated balance
sheet at 31 December 2008 at an amount of DKK 1.4 million (DKK 1.4 million in
2007). The consolidated income statement for 2008 includes a net expense of
DKK 0.2 million in respect of the plan (DKK 0.3 million in 2007).
2008 2007 Pct. distribution Pct. distribution
The fair value of the plan assets breaks down as follows
Shares 45% 50%
Bonds 33% 28%
Property 15% 15%
Other assets 7% 7%
Total 100% 100%
The expected return is calculated on the basis of investment reports prepared by
an internationally, recognised pension and insurance company.
2008 2007 DKKm DKKm
Change in present value of funded pension obligations
Present value of funded pension obligations at 01.01. 190.7 216.9
Exchange differences (41.4) (15.6)
Pension expenses 3.9 5.3
Interest expenses relating to the obligations 9.5 10.8
Actuarial (gains)/losses (25.7) (26.3)
Disbursements (7.9) (1.1)
Employee contributions 0.7 0.7
New plan 35.6 -
Present value of funded pension obligations at 31.12. 165.4 190.7
2008 2007 DKKm DKKm
Change in fair value of plan assets
Fair value of plan assets at 01.01. 155.4 161.2
Exchange differences (34.8) (12.1)
Expected return on plan assets 9.0 9.7
Actuarial gains/(losses) (27.2) (12.8)
Contributions 9.9 9.7
Disbursements (6.9) (0.4)
Employee contributions 0.1 0.1
New plan 29.4 -
Fair value of plan assets at 31.12. 134.9 155.4
Change in present value of unfunded pension obligations
Present value of unfunded pension obligations at 01.01. 95.5 94.7
Exchange differences (0.3) 0.1
Pension expenses 4.3 6.2
Interest expenses relating to the obligations 4.9 3.3
Actuarial (gains)/losses (18.8) (6.5)
Disbursements (2.7) (2.3)
Present value of unfunded pension obligations at 31.12. 82.9 95.5
Change in obligations for defined benefit plans
Pension obligations at 01.01. 130.8 150.4
Exchange differences (6.9) (3.4)
Recognised as expense (change recognised in income statement) 2.5 (4.1)
Contributions (9.9) (9.7)
Disbursements (3.7) (3.0)
Employee contributions 0.6 0.6
Pension obligations at 31.12. 113.4 130.8
Specification of change recognised in the income statement
Pension expenses 8.2 11.5
Interest expenses relating to the obligations 14.4 14.1
Expected return on plan assets (9.0) (9.7)
Actuarial (gains)/losses (17.3) (20.0)
New plan 6.2 -
Total expenses recognised 2.5 (4.1)
Realised return on plan assets (14.2) (4.0)
The expected contribution for 2009 for the defined benefit plans is DKK 14.2
million (DKK 14.4 million for 2008).
Other pension-like obligations
An obligation of DKK 66.7 million (DKK 57.9 million in 2007) is recognised in the
Group to cover other pension-like obligations, including primarily termination
benefits in a number of subsidiaries. The benefit payments are conditional upon
specified requirements being met. Total net expenses for the year were DKK 8.8
million (DKK 3.8 million in 2007).

77
GroupNotes 15
15. Deferred tax liabilities
Adjustment of Balance at deferred tax at Exchange Movement Balance at 01.01. beginning of year differences during the year 31.12. DKKm DKKm DKKm DKKm DKKm
2008
Intangible assets 835.4 - 0.1 215.2 1,050.7
Property, plant and equipment 1,077.5 (7.3) (27.0) (115.1) 928.1
Inventories (138.2) (1.8) 15.1 87.2 (37.7)
Prepayments from Forest (839.5) - - 242.4 (597.1)
Other items (78.0) (11.9) 1.3 193.3 104.7
Tax reserves in subsidiaries 3.8 - (3.3) (13.3) (12.8)
Tax loss carry-forwards (146.2) - (4.8) 2.4 (148.6)
Total temporary differences 714.8 (21.0) (18.6) 612.1 1,287.3
(Deferred tax assets)/deferred tax liabilities 164.6 (6.1) (6.5) 126.5 278.5
2007
Intangible assets 750.5 (23.4) 1.3 107.0 835.4
Property, plant and equipment 1,050.7 17.8 (18.9) 27.9 1,077.5
Inventories (150.6) - 0.2 12.2 (138.2)
Prepayments from Forest (854.7) - - 15.2 (839.5)
Other items 107.4 1.1 28.3 (214.8) (78.0)
Tax reserves in subsidiaries 27.3 (8.4) (2.2) (12.9) 3.8
Tax loss carry-forwards (295.5) 6.6 28.1 114.6 (146.2)
Total temporary differences 635.1 (6.3) 36.8 49.2 714.8
(Deferred tax assets)/deferred tax liabilities 152.4 (5.2) 12.9 4.5 164.6
2008 2008 2008 2007 2007 2007 Deferred tax Deferred tax Deferred tax Deferred tax assets liabilities Net assets liabilities NetDeferred tax assets/deferred tax liabilities DKKm DKKm DKKm DKKm DKKm DKKm
Intangible assets (4.8) 242.9 238.1 (21.7) 233.0 211.3
Property, plant and equipment (7.1) 245.6 238.5 (8.0) 287.4 279.4
Inventories (86.8) 70.2 (16.6) (92.8) 48.8 (44.0)
Prepayments from Forest (149.3) - (149.3) (209.9) - (209.9)
Other items (127.0) 155.3 28.3 (167.7) 149.9 (17.8)
Tax reserves in subsidiaries (10.1) 7.9 (2.2) (9.4) 11.6 2.2
Tax loss carry-forwards (58.3) - (58.3) (56.6) - (56.6)
Tax (assets)/liabilities (443.4) 721.9 278.5 (566.1) 730.7 164.6
Set-off within legal tax entities and jurisdictions 296.3 (296.3) - 403.4 (403.4) -
Total net tax (assets)/liabilities (147.1) 425.6 278.5 (162.7) 327.3 164.6
In 2008, the tax value of non-capitalised tax losses carried forward in the Group which are not expected to be utilised within five years amounted to DKK 15.0 million
(DKK 19.8 million in 2007).
Temporary differences between assets and liabilities as stated in the financial statements and as stated in the tax base

78
Group
16. Provisions
2008 2007 DKKm DKKm
Provisions at 01.01. 107.8 95.1
Exchange differences (1.1) -
Provisions charged during the year 16.8 19.5
Provisions used during the year (17.2) (5.3)
Unused provisions reversed during the year (4.6) (1.5)
Provisions at 31.12. 101.7 107.8
Specification of provisions
Long-term provisions 83.6 92.4
Short-term provisions 18.1 15.4
Provisions at 31.12. 101.7 107.8
The provisions primarily cover expenses for the defence of the company’s intellec-
tual property rights, closing down decentralised warehouses and returns.
Of the total provisions at 31 December 2008, DKK 0 million (DKK 7.9 million in
2007) relates to incentive programmes. Further details about the incentive pro-
grammes are provided in note 3 Staff costs.
17. Mortgage and bank debt
Mortgage debt 2008 2007 DKKm DKKm
Mortgage debt by maturity
Within 1 year from the balance sheet date - 5.1
Between 1 and 2 years from the balance sheet date - 2.1
Between 2 and 3 years from the balance sheet date - 2.1
Between 3 and 4 years from the balance sheet date - 2.1
Between 4 and 5 years from the balance sheet date - 1.1
After more than 5 years from the balance sheet date 1,853.4 1,851.2
Mortgage debt at 31.12. 1,853.4 1,863.7
Specification of mortgage debt
Long-term liabilities 1,853.4 1,858.6
Short-term liabilities - 5.1
Mortgage debt at 31.12. 1,853.4 1,863.7
Notes 16-17

79
GroupNotes 17
17. Mortgage and bank debt – continued
Mortgage debt Weighted average Amortised Nominal effective cost value Fair value Currency Expiry Fixed/floating interest rate DKKm DKKm DKKm
2008
Mortgage debt, bond loan DKK 2035 floating 4.23% 1,406.0 1,620.9 1,472.1
Mortgage debt, bond loan DKK 2037 floating 5.74% 435.0 440.0 418.4
Mortgage debt, bond loan DKK 2034 floating 5.35% 10.2 10.2 10.2
Mortgage debt, bond loan DKK 2034 floating 5.35% 2.2 2.2 2.2
Total 1,853.4 2,073.3 1,902.9
2007
Mortgage debt DKK 2012 fixed 5.82% 9.6 9.6 9.8
Mortgage debt, bond loan DKK 2035 floating 4.49% 1,404.3 1,646.9 1,428.2
Mortgage debt, bond loan DKK 2037 floating 5.16% 434.4 440.0 440.9
Mortgage debt, bond loan DKK 2034 floating 5.23% 10.2 10.2 10.3
Mortgage debt, bond loan DKK 2034 floating 5.23% 2.2 2.2 2.2
Mortgage debt EUR 2008 fixed 5.82% 3.0 3.0 3.0
Total 1,863.7 2,111.9 1,894.4
Amortised cost is calculated as the proceeds received less instalments paid plus or minus amortisation of capital losses. Fair value is calculated as the market value at 31 December.
Bank debt
2008 2007 DKKm DKKm
Bank debt by maturity
Within 1 year from the balance sheet date 22.5 4.4
Bank debt at 31.12. 22.5 4.4
Specification of bank debt
Long-term liabilities - -
Short-term liabilities 22.5 4.4
Bank debt at 31.12. 22.5 4.4
Weighted average Nominal effective value Currency Expiry Fixed/floating interest rate DKKm
2008
Loan TRY 2009 fixed 26.78% 22.5
Total 22.5
2007
Loan TRY 2008 fixed 17.90% 4.4
Total 4.4

80
GroupNotes18 -19
18. Contractual obligations
Rental and lease obligations
The Group has obligations amounting to DKK 426.1 million (DKK 511.1 million in
2007) in the form of rentals and leasing of operating equipment.
The future rental and lease payments can be analysed as follows:
Land and Operating buildings equipment Total DKKm DKKm DKKm
2008
Less than 1 year 86.6 55.9 142.5
Between 1 and 5 years 193.1 73.3 266.4
More than 5 years 17.2 - 17.2
Total 296.9 129.2 426.1
2007
Less than 1 year 103.4 56.7 160.1
Between 1 and 5 years 236.4 84.6 321.0
More than 5 years 30.0 - 30.0
Total 369.8 141.3 511.1
Rental and lease payments recognised in the income statement amounted to
DKK 151.3 million (DKK 193.0 million in 2007).
Other purchase obligations
The Group has undertaken to purchase property, plant and equipment in the
amount of DKK 184.1 million (DKK 173.8 million in 2007).
Research collaborations
The Group is part of multi-year research collaboration projects comprising mini-
mum research and contractual obligations in the order of DKK 19 million (DKK
32 million in 2007). The total amount of the obligations may increase substan-
tially in line with the favourable development of the projects.
Other contractual obligations
At 31 December 2008, the Group had capital contribution obligations amount-
ing to DKK 40.8 million (DKK 33.2 million in 2007). In connection with the di-
vestment of non-strategic investments in four small private equity funds com-
pleted on 27 January 2009, the capital contribution obligation was reduced by
DKK 39.6 million to DKK 1.2 million.
The Group has entered into various service agreements amounting to DKK 31.4
million (DKK 33.2 million in 2007).
19. Contingent liabilities
Forest
See note 2 Segment information in respect of the consequences of any launch of
generic escitalopram in the USA.
The prepayment from Forest has been translated at the exchange rate at the
transaction date or at the forward rate and recognised in the balance sheet in the
amount of DKK 597.1 million (DKK 839.5 million in 2007). If the translation had
been made at the exchange rate at the balance sheet date, the prepayment would
have amounted to DKK 652.6 million (DKK 737.7 million in 2007).
Letters of intent and bank guarantees
The Group’s bankers have issued bank guarantees to third parties in the amount of
DKK 40.8 million (DKK 55.3 million in 2007). The Group has evaluated that the fair
value of guarantees is DKK 0 (DKK 0 in 2007).
Pending legal proceedings
The Group is involved in legal proceedings, including cases with generic competi-
tors. In the opinion of management, the outcome of these proceedings will not
have a material impact on the Group’s financial position beyond the amount pro-
vided for in the financial statements. Due to uncertainty about the outcome of
the legal proceedings, the final amount of the provision is still unknown. Moreover,
as described in the section Risk management on page 22, the Group is party to
legal proceedings in a number of countries against a number of businesses. The
Group does not expect that this will materially affect its financial position, results
of operations or cash flows.
Industry obligations
The Group has return obligations normal for the industry. Management expects no
major loss on these obligations.

81
GroupNotes20
20. Financial instruments
Capital structure
Lundbeck operates in an industry characterised by frequent shifts in market situa-
tion that involve a need for in-licensing and acquisition activities. To date, the
company has largely been self-financing in respect of these activities.
Despite a strong cash flow, the company intends to maintain financial resources
in the form of cash and binding loan commitments to allow for flexible operations
in case of a rapid shift in the market situation. At 31 December 2008, the com-
pany had binding loan commitments for DKK 2.2 billion from three financial insti-
tutions. In addition, the company has a large number of non-binding credit facili-
ties for use in its day-to-day operations. At 31 December 2008, these amounted
to DKK 0.3 billion. In connection with the acquisition of Ovation Pharmaceuticals,
Inc. in 2009, new bank loans of DKK 2.5 billion will be raised. In this connection,
the unused guaranteed credit facilities of DKK 2.2 billion at 31 December 2008
will be reduced to an amount of approximately DKK 1 billion.
Furthermore, Lundbeck manages its capital structure based on a wish to carry an
investment-grade rating. The company does not presently hold an actual rating
from a recognised rating agency, but several financial institutions believe that, on
the basis of a calculated implied rating at 31 December 2008, Lundbeck would be
assigned a rating in the A- to BBB+ range using Standard & Poors rating scale. The
lowest investment-grade rating is BBB-.
The company’s treasury policy, which deals with financial resources, foreign cur-
rency exposure, securities portfolio and loan portfolio, is reviewed at least once
every year by the Supervisory Board. In addition, rules are defined concerning se-
lecting financial collaboration partners, commitment limits and types of business.
Liquidity exceeding the requirement for business development and general busi-
ness purposes is primarily distributed as dividend or, until 2008, was used for share
buyback purposes. The company pursues a policy of distributing between 25%
and 35% of the profit for the year as dividends.
Other than small operational changes, no changes were made to the company’s
treasury policy compared with 2007.
Foreign currency risks
Foreign currency management is handled centrally by the parent company.
The parent company hedges a significant part of the Group’s anticipated cash
flows for a period of approximately 12 months, depending on the currency in
question.
Currency management focuses on risk minimisation and is carried out in con-
formity with the foreign currency policy approved by the Supervisory Board. The
hedging consists partly of a fixed minimum hedge and partly of a variable part.
The fixed part is hedged by forward contracts classified as hedging instruments
and meeting the accounting criteria for hedging future cash flows. Changes in
the fair value of these contracts are taken to equity as they arise and - on reali-
sation of the hedged cash flow - transferred from equity for inclusion in the
same item as the hedged cash flow.
Hedging contracts that do not meet the hedge criteria are classified as trading
contracts, and changes in the fair value are recognised as financials as they arise.
Trading contracts arise only when an underlying cash flow no longer exists.
Due to the company’s continuous hedging of net currency flows, a falling ex-
change rate will not affect the company in the short term. Conversely, the com-
pany will not benefit fully from a rising exchange rate in the short term, either.

82
Group
20. Financial instruments – continued
Net forward exchange contracts and FX swaps outstanding Exchange gain/loss Exchange recognised in Average Hedge value Market value gain/loss the income hedge prices of according to the (forward exchange recognised statement/ forward exchange hedge principle contracts) in equity balance sheet contracts Maturity periodHedging part DKKm DKKm DKKm DKKm DKK
2008
AUD 70.3 65.9 4.4 6.1 390.56 Sep 2009
CAD 194.4 178.7 15.7 8.3 474.17 Oct 2009
CHF 59.5 62.9 (3.4) (0.6) 476.29 Aug 2009
CZK 29.5 27.8 1.7 (2.2) 29.52 Sep 2009
EUR 523.5 523.6 (0.1) 0.1 747.77 Dec 2009
GBP 15.8 15.4 0.4 (14.9) 794.10 Oct 2009
ILS 25.8 25.4 0.4 (1.6) 143.07 Sep 2009
JPY 34.5 29.5 5.0 (0.7) 4.90 Jul 2009
MXN 19.2 15.3 3.9 0.2 47.88 Apr 2009
NOK 17.2 16.7 0.5 0.6 77.92 Oct 2009
PLN 21.7 21.5 0.2 - 181.24 Oct 2009
SEK 17.1 17.1 - - 68.33 Oct 2009
SGD 32.8 33.1 (0.3) 0.9 371.07 Nov 2009
SKK - - - (2.1) -
TRY 84.2 81.5 2.7 (8.1) 350.58 May 2009
USD 1,996.5 2,012.0 (15.5) 114.0 532.42 Nov 2009
ZAR 18.7 18.8 (0.1) 4.2 55.07 May 2009
Forward contracts 3,160.7 3,145.2 15.5 104.2
2007
AUD 88.4 86.0 2.4 (2.7) 454.32 Dec 2008
CAD 158.6 160.9 (2.3) 2.9 519.66 Dec 2008
CHF 57.4 56.5 0.9 2.8 455.62 Dec 2008
CZK 27.5 28.1 (0.6) (0.3) 27.56 Dec 2008
EUR 82.1 82.1 - 0.5 746.45 Dec 2008
GBP 80.0 85.9 (5.9) 1.3 1,061.15 Dec 2008
HUF - - - (0.5) -
ILS 21.3 21.0 0.3 0.5 133.35 Dec 2008
JPY 26.2 27.4 (1.2) (3.6) 4.74 Dec 2008
MXN 73.5 72.7 0.8 0.7 47.66 Dec 2008
NOK 23.1 23.3 (0.2) (0.4) 92.84 Dec 2008
SKK 42.3 42.4 (0.1) (0.4) 22.29 Dec 2008
TRY 87.8 93.7 (5.9) (8.1) 417.91 Mar 2008
USD 2,442.1 2,337.9 104.2 126.9 530.86 Dec 2008
ZAR 40.0 39.8 0.2 2.4 72.97 Sep 2008
Forward contracts 3,250.3 3,157.7 92.6 122.0
The exchange difference between the contract value and the market value of the concluded forward exchange contracts at 31 December 2008 represented a gain of DKK 15.5
million (DKK 99.0 million in 2007). There were no currency options or FX swaps under the hedging part at 31 December 2008 and 31 December 2007.
The company’s inefficiency on hedging, cf. IAS 39 Financial Instruments: Recognition and measurement, relates to few contracts reclassified to trading contracts. The profit
impact at the date of reclassification was a gain of DKK 15.5 million (DKK 0.4 million in 2007).
Notes 20

83
Group
20. Financial instruments – continued
Average Market value Exchange hedge prices of (forward exchange gain/loss forward exchange contracts and recognised in the contracts and FX swaps) income statement FX swaps Maturity periodTrading part DKKm DKKm DKK
2008
CAD - 1.2 -
USD - (32.1) -
Forward contracts - (30.9)
2007
CAD 10.4 (0.1) 517.54 Apr 2008
CHF - 0.5 -
GBP - 0.1 -
TRY - 0.2 -
USD - 1.4 -
Forward contracts 10.4 2.1
EUR 186.4 - 745.56 Jan 2008
FX swaps 186.4 -
Total trading 196.8 2.1
There were no forward contracts, currency options or FX swaps under the trading part at 31 December 2008. There were no currency options under the trading part at
31 December 2007.
2008 2007Deferred recognition of currency gains/losses recognised in the statement of recognised income and expenses DKKm DKKm
Deferred exchange gains/losses at 01.01. 92.6 57.1
Exchange adjustments for the year, hedging, recognised in the statement of recognised income and expenses 42.6 157.9
Realised exchange gains/losses, hedging, transferred to revenue 9.8 4.9
Realised exchange gains/losses, hedging, transferred to prepayments from Forest (balance sheet) (114.0) (126.9)
Realised exchange gains/losses, trading, transferred to net financials (transferred from hedging) (15.5) (0.4)
Deferred exchange gains/losses at 31.12. 15.5 92.6
Notes20

84
Group
20. Financial instruments – continued
Monetary assets and liabilities for the most important
currencies at 31 December 2008 2007 DKKm DKKm
Monetary assets
AUD 27.7 34.2
CAD 88.3 114.1
CHF 67.8 27.6
GBP 183.0 72.4
TRY 71.8 74.6
USD 552.1 343.8
Monetary liabilities
AUD 12.4 13.8
CAD 30.3 36.0
CHF 8.3 23.7
GBP 58.2 81.5
TRY 35.6 29.9
USD 57.8 96.0
Due to the long-standing fixed exchange rate policy in Denmark, the foreign cur-
rency risk for EUR is considered immaterial, and EUR is therefore not included in
the list above.
At the end of 2008, 97% of the company’s anticipated cash flows for 2009 in
USD were hedged.
Estimated impact on profit and equity from a 5% fluctuation in year-end
exchange rates of the most important currencies
AUD CAD CHF GBP TRY USD DKKm DKKm DKKm DKKm DKKm DKKm
2008
Profit 2.2 1.6 2.9 27.3 - 53.5
Equity (1.1) (7.4) 12.8 26.5 (4.0) (78.1)
2007
Profit 2.2 1.0 1.0 24.4 - 39.2
Equity (1.8) (6.4) (1.6) 30.0 (3.5) (77.6)
The profit impact is included in the impact on equity.
Notes 20
The company’s USD income derives primarily from sales to Forest. According to
the Group’s accounting policies, the minimum price is recognised as income at
the time of invoicing, and the excess amount is recognised in the balance sheet
as a prepayment. Prepayments and any remaining settlement will be recognised
as Forest subsequently resells the products. Income and expenses relating to
hedging contracts covering this part of the hedged cash flows are recognised in
the balance sheet together with the prepayments and subsequently recognised
in the income statement as Forest resells the products. At 31 December 2008,
a gain of DKK 39.8 million (DKK 105.7 million in 2007) was recognised in the
balance sheet together with the prepayments.
Exchange adjustment of associates according to the equity method 2008 2007 DKKm DKKm
Exchange adjustment at 01.01. (1.9) (1.9)
Exchange adjustment for the year - -
Exchange adjustment at 31.12. (1.9) (1.9)
Interest rate risks
Interest rate risk management is handled centrally by the parent company.
Through the parent company’s treasury policy, the Supervisory Board has ap-
proved the limits for borrowing and investment. Loans secured by real property
must be approved by the company’s Supervisory Board. To hedge the interest rate
risk on loans, the Supervisory Board has approved the use of interest rate swaps
and Forward Rate Agreements (FRAs).
Bond investments may only be made in Danish government and mortgage bonds.
For managing the interest rate risk on the securities portfolio (the securities port-
folio includes bonds and money market deposits), the company applies a duration
target capped at five years for the entire portfolio. The return on the bond portfo-
lio and the money market deposits in 2008 was DKK 142.7 million (DKK 74.5
million in 2007), corresponding to a return of 5.50% p.a. (3.63% p.a. in 2007).
Lundbeck’s benchmark at the end of 2008 was a bond portfolio with a duration
of six months. The return on the benchmark portfolio was 5.11% p.a. in 2008
(3.47% p.a. in 2007). At 31 December 2008, the securities portfolio had a dura-
tion of 0.66 years, which translates into a gain/loss of DKK 22.3 million if interest
rates should fall/rise by 1 percentage point.

85
GroupNotes20
20. Financial instruments – continued
Maturity dates for assets and liabilities of the Group
Between More Effective Less than 1 and 5 than interest 1 year years 5 years Total rates DKKm DKKm DKKm DKKm
2008
Assets
Receivables1 2,222.8 55.5 - 2,278.3 0%
Deferred tax assets 147.1 - - 147.1 0%
Securities2 653.8 107.8 193.3 954.9 2-6%
Available-for-sale financial assets - 31.4 - 31.4 0%
Fixed-term deposits 2,453.3 - - 2,453.3 0-15%
Other cash resources 467.3 - - 467.3 0-14%
Assets held for sale3 204.6 - - 204.6 0%
Total financial assets 6,148.9 194.7 193.3 6,536.9
Liabilities
Mortgage debt - - 1,853.4 1,853.4 4-6%
Employee bonds - 31.5 18.1 49.6 4-6%
Other payables 2,380.7 1.2 - 2,381.9 0%
Bank debt 22.5 - - 22.5 27%
Total financial liabilities 2,403.2 32.7 1,871.5 4,307.4
Between More Effective Less than 1 and 5 than interest 1 year years 5 years Total rates DKKm DKKm DKKm DKKm
2007
Assets
Receivables1 2,367.6 60.6 - 2,428.2 0%
Deferred tax assets 162.7 - - 162.7 0%
Securities2 902.9 400.7 232.1 1,535.7 4-6%
Associates - - 82.9 82.9 0%
Available-for-sale financial assets - 150.7 - 150.7 0%
Fixed-term deposits 1,271.7 - - 1,271.7 3-11%
Other cash resources 500.3 - - 500.3 0-16%
Total financial assets 5,205.2 612.0 315.0 6,132.2
Liabilities
Mortgage debt 5.1 7.4 1,851.2 1,863.7 4-6%
Employee bonds - 12.6 18.9 31.5 4-6%
Other payables 2,614.2 3.5 - 2,617.7 0%
Bank debt 4.4 - - 4.4 18%
Total financial liabilities 2,623.7 23.5 1,870.1 4,517.3
1) Including other receivables and receivables from associates.2) Securities are classified as financial assets measured at fair value with value adjustment through the income statement. 3) Assets held for sale consist of the investments in Burrill Biotechnology Capital Fund, L.P., Nordic Biotech K/S, Nordic II and Nordic Biotech Opportunity Fund, which have been reclassified from available-for-sale financial assets, and
the investment in the associate LifeCycle Pharma A/S.

86
Group
21. Related parties
Lundbeck’s related parties are
- The company’s principal shareholder, LFI a/s, Vestagervej 17, DK-2900 Hellerup,
which is wholly owned by the Lundbeck Foundation, and the Lundbeck
Foundation.
- Companies in which the principal shareholder exercises controlling influence,
i.e. ALK-Abelló A/S.
- The company’s associates.
- Members of the company’s Executive Management and Supervisory Board as
well as close relatives of these persons.
- Companies in which members of the company’s Executive Management and
Supervisory Board as well as close relatives of these persons exercise signifi-
cant influence.
Transactions and balances with the company’s principal shareholder
Through its wholly owned subsidiary LFI a/s, the Lundbeck Foundation, which
is the parent company’s largest shareholder, held 137,351,918 shares at
31 December 2008, corresponding to approximately 70% of the shares and
votes in H. Lundbeck A/S. LFI a/s is the only shareholder who has notified the
company that it holds more than 5% of the share capital.
There have been the following transactions and balances with the company’s
principal shareholder:
- Dividends.
- The share buyback programme. See the section Share on page 28.
- Payment of on-account tax and residual tax of DKK 343.7 million in 2008
(DKK 664.2 million in 2007) concerning the parent company and Danish sub-
sidiaries.
- Sale of investments in the associate LifeCycle Pharma A/S and sale of invest-
ments in four small private equity funds, cf. note 9 Investments in associates
and note 10 Other investments and other receivables.
LFI a/s / the Lundbeck Foundation have a controlling influence in H. Lundbeck A/S.
Transactions and balances with ALK-Abelló A/S
There have been no transactions or balances with ALK-Abelló A/S.
Transactions and balances with associates
2008 2007 DKKm DKKm
Sale of administrative services 0.6 0.7
Financial income - 0.8
Associates comprise CF Pharma Gyógyszergyártó Kft., Hungary, and LifeCycle
Pharma A/S, Denmark.
Transactions and balances with the company’s Executive Management and
Supervisory Board
In addition to the transactions with members of the company’s Executive
Management and Supervisory Board outlined in note 3 Staff costs, the company
has paid dividend on shares in H. Lundbeck A/S held by members of the Executive
Management and Supervisory Board. At 31 December 2008, there were no
balances with the company’s Executive Management and Supervisory Board.
Transactions and balances with other related parties
Lundbeck has granted contributions of DKK 4.0 million (DKK 4.0 million in 2007)
to Lundbeck International Neuroscience Foundation. Other than this, there have
been no material transactions and balances with other related parties.
Notes 21

87
GroupNotes 22-25
22. Earnings per share
2008 2007
Profit for the year (DKKm) 1,509.6 1,769.5
Average number of outstanding shares (‘000 shares) 203,702 210,402
Average number of treasury shares (‘000 shares) (6,858) (5,412)
Average number of shares exclusive of treasury shares (‘000 shares) 196,844 204,990
Average number of warrants, fully diluted, (‘000 warrants) - 163
Average number of shares, fully diluted (‘000 shares) 196,844 205,153
Earnings per share (EPS) (DKK) 7.67 8.63
Diluted earnings per share (DEPS) (DKK) 7.67 8.63
The profit for the year equals the profit allocated to shareholders of the parent
company.
Warrants comprised by the warrant scheme established in 2005 and 2007 for the
Executive Management and Danish and foreign executives, a total of 1,491,500
warrants, were not in-the-money in 2008 and were therefore not exercised. War-
rants covered by the warrant scheme established in 2008 for the Executive Man-
agement and Danish and foreign key employees, a total of 536,517 warrants, vest
at 6 May 2011 for the Executive Management (excl. the CEO) and key employees
and at 2 June 2011 for the CEO. The warrants are not included in the calculation
of earnings per share (EPS) and diluted earnings per share (DEPS). The warrants
may have a longer term dilutive effect on earnings per share and diluted earnings
per share.
Warrants comprised by the warrant schemes established in 2005 and 2007,
respectively, may be exercised within the given subscription periods if the price of
the Lundbeck share exceeds the fixed exercise price of DKK 179.00 for the 2005
scheme and DKK 156.00 for the 2007 scheme. At 31 December 2008, 647,000
warrants from the 2005 scheme and 844,500 warrants from the 2007 scheme
remained outstanding.
See note 3 Staff costs for additional information on incentive programmes.
23. Adjustments
2008 2007 DKKm DKKm
Amortisation and depreciation 1,065.6 915.8
Incentive programmes 3.2 16.4
Change in pension obligations (8.6) (15.8)
Change in provisions (6.1) 12.7
Adjustments 1,054.1 929.1
24. Working capital changes
2008 2007 DKKm DKKm
Change in inventories 59.1 219.3
Change in receivables 86.6 (397.3)
Change in short-term debt (255.4) 77.2
Change in working capital (109.7) (100.8)
25. Cash resources
2008 2007 DKKm DKKm
Fixed-term deposits 2,453.3 1,271.7
Other cash resources 467.3 500.3
Cash at 31.12. 2,920.6 1,772.0
Securities with a maturity of less than 3 months1 3.4 641.3
Securities with a maturity of more than 3 months1 951.5 894.4
Cash and securities at 31.12. 3,875.5 3,307.7
Unused guaranteed credit facilities at 31.12.2 2,200.0 1,750.0
Unused credit facilities at 31.12. 315.9 419.3
Cash resources at 31.12. 6,391.4 5,477.0
1) The securities holding consists exclusively of Danish government and mortgage bonds, which are classified as financial assets measured at fair value with value adjustments through the income statement.
2) The unused guaranteed credit facilities consist of three 364-day credit facilities totalling DKK 2.2 billion. The three facilities are guaranteed by Danish banks. In connection with the acquisition of Ovation Pharmaceuticals, Inc. in 2009, new bank loans of DKK 2.5 billion will be raised. In this connection, the unused guaranteed credit facilities of DKK 2.2 billion at 31 December 2008 will be reduced to an amount of approximately DKK 1 billion.

88
Group
26. Releases from H. Lundbeck A/S in 2008
No. Date Subject
363 19.12.2008 Lundbeck moves Lu AA39959 into clinical phase II for the treatment
of patients with bipolar disorder
362 18.12.2008 A new pharmaceutical candidate Lu AA38466 enters Lundbeck’s
development pipeline
361 17.12.2008 Lundbeck initiates clinical phase III trials with desmoteplase in
ischemic stroke
360 15.12.2008 Lundbeck initiates phase III clinical trials with nalmefene as a new
method of treatment of alcohol dependence
359 08.12.2008 Financial calendar 2009
358 02.12.2008 Announcement of transactions with shares and linked securities in
H. Lundbeck A/S made by executives and their closely associated
persons and legal entities
357 25.11.2008 Lundbeck expands its pipeline – initiating phase II clinical trials with
a new compound for the treatment of schizophrenia
356 12.11.2008 Lundbeck increases its research and development investments and
expects to meet its financial guidance for 2008
355 15.09.2008 Lundbeck submits New Drug Application (NDA) for Serdolect® in the
US for the treatment of schizophrenia
354 26.08.2008 ADAGIO trial results show Azilect® slows progression of Parkinson’s
disease
353 18.08.2008 Announcement of transactions with shares and linked securities in
H. Lundbeck A/S made by executives and their closely associated
persons and legal entities
352 13.08.2008 Interim report for the second quarter of 2008 – continuing strong
revenue growth
351 31.07.2008 Announcement regarding principal shareholder’s ownership of Lundbeck
350 31.07.2008 Total number of voting rights and size of share capital as of 31 July
2008 after reduction of the share capital of H. Lundbeck A/S
349 30.06.2008 Headline results of Flurizan® in clinical phase III trial
348 16.06.2008 Azilect® slows the progression of Parkinson’s disease in clinical trial
347 30.05.2008 Announcement of transactions with shares and linked securities in
H. Lundbeck A/S made by executives and their closely associated
persons and legal entities
346 26.05.2008 Announcement of transactions with shares and linked securities in
H. Lundbeck A/S made by executives and their closely associated
persons and legal entities
345 23.05.2008 Update on share buyback program in H. Lundbeck A/S
344 23.05.2008 Announcement of transactions with shares and linked securities in
H. Lundbeck A/S made by executives and their closely associated
persons and legal entities
No. Date Subject
343 22.05.2008 Lundbeck acquires European commercialization rights for Flurizan®
from Myriad, USA – a new drug in final phase III development for the
treatment of Alzheimer’s disease
342 15.05.2008 Share buyback in H. Lundbeck A/S
341 13.05.2008 Circadin® launch rollout starts with the launch of the product in the
important German market
340 07.05.2008 Interim report for the first quarter of 2008 – strong growth in sales
and profits
339 02.05.2008 Share buyback in H. Lundbeck A/S
338 30.04.2008 Lundbeck expands geographical rights for Circadin®
337 29.04.2008 Ulf Wiinberg appointed new CEO of Lundbeck
336 23.04.2008 New incentive plan in the Lundbeck Group
335 22.04.2008 H. Lundbeck A/S held its Annual General Meeting on 22 April 2008 at
the company’s registered office
334 09.04.2008 Share buyback in H. Lundbeck A/S
333 03.04.2008 Notice of the Annual General Meeting
332 31.03.2008 Share buyback in H. Lundbeck A/S
331 31.03.2008 Announcement regarding principal shareholder’s ownership of Lundbeck
330 17.03.2008 Share buyback in H. Lundbeck A/S
329 07.03.2008 Announcement of transactions with shares and linked securities in
H. Lundbeck A/S made by executives and their closely associated
persons and legal entities
328 06.03.2008 Share buyback in H. Lundbeck A/S
327 05.03.2008 Claus Bræstrup resigns as President and CEO of Lundbeck
326 04.03.2008 Annual report 2007 – Lundbeck reports best ever financial results
325 26.02.2008 Share buyback in H. Lundbeck A/S
324 18.02.2008 Lundbeck further strengthens pipeline by moving Lu AA34893 into
clinical phase II
323 14.02.2008 Share buyback in H. Lundbeck A/S
322 05.02.2008 Share buyback in H. Lundbeck A/S
321 23.01.2008 Share buyback in H. Lundbeck A/S
320 14.01.2008 Share buyback in H. Lundbeck A/S
319 03.01.2008 Share buyback in H. Lundbeck A/S
318 03.01.2008 Update on pipeline – new pharmaceutical candidate Lu AA37096
enters Lundbeck’s development pipeline
Notes 26

89
GroupNotes 27
27. Events after the balance sheet date
Sale of investments in LifeCycle Pharma A/S and investments in private
equity funds
In January 2009, it was announced that Lundbeck sold its shares in the listed com-
pany LifeCycle Pharma A/S and ownership interests in four small private equity
funds to the Lundbeck Foundation’s investment and holding company LFI a/s.
The transaction was the result of Lundbeck’s decision to dispose of investments
that are not of strategic importance to the company.
The shares in LifeCycle Pharma A/S traded at DKK 18.00 per share, corresponding
to a selling price of DKK 275.6 million. The profit from the divestment of
DKK 123.7 million will be recognised as revenue in the first quarter of 2009.
The investments in four small private equity funds traded at a price close to the
net asset value. The expected loss on the sale of the investments, which had previ-
ously been measured at fair value in equity, amounted to DKK 96.2 million.
The loss is recognised under net financials in the income statement for 2008.
Acquisition of Ovation Pharmaceuticals, Inc.
On 9 February 2009, Lundbeck announced that the company, through its wholly
owned subsidiary Lundbeck Inc., USA, will acquire 100% of shares and voting
rights in Ovation Pharmaceuticals, Inc., Illinois, USA (Ovation) for a total consider-
ation of up to USD 900 million, or DKK 5.2 billion.
Under the terms of the transaction, Lundbeck will make an upfront payment of
USD 600 million (or approximately DKK 3.5 billion) upon closing of the transac-
tion. Additional payments of up to USD 300 million (or approximately DKK 1.7
billion) within one year of closing are contingent upon the achievement of certain
product regulatory milestones relating to the approval of Sabril® by the FDA.
The transaction is financed through a combination of existing cash resources and
DKK 2.5 billion in acquisition debt.
The Supervisory Board of Lundbeck and the majority shareholder and Board of
Directors of Ovation have unanimously approved the transaction.
The transaction is only subject to notification and clearance under certain anti-
trust statutes.
Transaction timing
Pending final approvals and antitrust clearances, closing is expected to take place
in March 2009, after which Ovation will become a fully-integrated subsidiary of
Lundbeck.
As the final acquisition date is after the publication of the annual report for 2008,
it is not possible to provide details about the pre-acquisition balance sheet and
the total transaction costs.
Strategic rationale
The acquisition of Ovation delivers on Lundbeck’s strategic goal to build a com-
mercial infrastructure in the USA. Ovation is a private, US-based, profitable and
fast growing company, with a broad portfolio of marketed products and an attrac-
tive pipeline of new, innovative products primarily focused on CNS.
The pipeline is expected to significantly drive growth in the coming years through
multiple new product launches.
Following the transaction Lundbeck will have a diverse portfolio of marketed
products and a broader pipeline primarily focused on CNS.
In 2010, Ovation is expected to be accretive to Lundbeck’s profit net of transac-
tion costs and amortisation related to the acquisition.

90
Financial statements 2008 Parent company
Income statement 91
Balance sheet 92
Statement of changes in equity 94
Notes
1. Accounting policies 95
2. Staff costs 96
3. Audit fees 96
4. Tax on profit for the year 96
5. Intangible assets and property,
plant and equipment 97
6. Investments in subsidiaries 98
7. Investments in associates 99
8. Inventories 99
9. Prepayments 99
10. Deferred tax liabilities 100
11. Other provisions 101
12. Mortgage debt, bank debt and other
long-term debt 101
13. Treasury shares 101
14. Contractual obligations 102
15. Contingent liabilities 102
16. Financial instruments 102
17. Related parties 102

91
Parent companyIncome statement for the year ended 31 December 2008
2008 2007 Notes DKKm DKKm
Revenue 8,121.7 7,741.7
Cost of sales 2 2,064.3 2,239.2
Gross profit 6,057.4 5,502.5
Distribution costs 2 266.2 262.3
Administrative expenses 2, 3 836.6 798.7
Profit before research and development costs 4,954.6 4,441.5
Research and development costs 2 3,054.2 2,232.9
Profit before other operating items 1,900.4 2,208.6
Other operating income 13.5 7.2
Other operating expenses 9.7 9.1
Profit from operations 1,904.2 2,206.7
Income from investments in subsidiaries 6 589.2 120.2
Income from investments in associates 7 - (57.0)
Financial income 418.5 246.5
Financial expenses 510.8 222.1
Profit before tax 2,401.1 2,294.3
Tax on profit for the year 4 483.1 530.8
Profit for the year 1,918.0 1,763.5
Proposed distribution
Proposed dividend for the year 452.8 530.6
Transferred to distributable reserves 1,465.2 1,232.9
1,918.0 1,763.5
Proposed dividend per share (DKK) 2.30 2.56
Statement of recognised income and expenses
Profit for the year 1,918.0 1,763.5
Adjustment, deferred gains/losses, hedging 42.6 157.9
Realised gains/losses, hedging (104.2) (122.0)
Realised gains/losses, trading (transferred from hedging) (15.5) (0.4)
Tax on income and expenses recognised in equity 4 19.3 (8.9)
Income and expenses recognised directly in equity (57.8) 26.6
Recognised income and expenses for the year 1,860.2 1,790.1

92
Parent company
2008 2007 Notes DKKm DKKm
Patent rights 241.8 363.8
Product rights 519.0 405.4
IT and process projects 214.9 118.9
Projects in progress 113.2 84.8
Intangible assets 5 1,088.9 972.9
Land and buildings 1,926.3 1,804.7
Plant and machinery 313.1 256.3
Other fixtures and fittings, tools and equipment 238.0 246.6
Prepayments and plant and equipment in progress 184.4 541.0
Property, plant and equipment 5 2,661.8 2,848.6
Investments in subsidiaries 6 2,735.5 2,735.1
Investments in associates 7 208.9 97.4
Receivables from subsidiaries 685.5 609.0
Other investments 82.9 149.1
Other receivables 16.2 31.5
Financial assets 3,729.0 3,622.1
Non-current assets 7,479.7 7,443.6
Inventories 8 760.4 864.5
Trade receivables 130.9 179.9
Receivables from subsidiaries 558.0 485.9
Other receivables 275.3 486.9
Prepayments 9 188.4 133.2
Receivables 1,152.6 1,285.9
Securities 937.9 1,517.3
Cash 2,551.1 1,389.2
Current assets 5,402.0 5,056.9
Assets 12,881.7 12,500.5
Balance sheet – Assetsat 31 December 2008

93
Parent company
2008 2007 Notes DKKm DKKm
Share capital 984.4 1,036.4
Share premium 223.9 223.9
Retained earnings 6,621.8 5,750.1
Equity 7,830.1 7,010.4
Deferred tax liabilities 10 280.3 176.9
Other provisions 11 290.5 391.6
Provisions 570.8 568.5
Mortgage debt 12 1,853.4 1,858.6
Employee bonds and other debt 12 50.8 32.7
Payables to subsidiaries 827.2 1,067.3
Non-current liabilities 2,731.4 2,958.6
Mortgage debt - 2.1
Trade payables 683.2 579.6
Payables to subsidiaries 264.3 296.4
Income taxes 2.0 6.2
VAT, taxes and holiday pay commitments 163.2 126.8
Other payables 39.6 112.4
Prepayments from Forest 597.1 839.5
Current liabilities 1,749.4 1,963.0
Liabilities 4,480.8 4,921.6
Equity and liabilities 12,881.7 12,500.5
Balance sheet – Equity and liabilities at 31 December 2008

94
Parent company
Share Share Retained capital premium earnings Equity DKKm DKKm DKKm DKKm
Equity at 01.01.2008 1,036.4 223.9 5,750.1 7,010.4
Recognised income and expenses for the year1 - - 1,860.2 1,860.2
Distribution of dividend, gross - - (530.6) (530.6)
Distribution of dividend, treasury shares - - 26.6 26.6
Capital reduction and cancellation of treasury shares (52.0) - 52.0 -
Buyback of treasury shares - - (538.3) (538.3)
Incentive programmes - - 1.8 1.8
Other transactions (52.0) - (988.5) (1,040.5)
Equity at 31.12.2008 984.4 223.9 6,621.8 7,830.1
1) Movements are specified in Statement of recognised income and expenses on page 91.
For further details, see note 13 Share capital in the consolidated financial statements.
Statement of changes in equityat 31 December 2008

95
Parent companyNotes 1
1. Accounting policies
The annual report of the parent company
H. Lundbeck A/S has been prepared in accordance
with the provisions of the Danish Financial State-
ments Act for large reporting class D enterprises.
The annual report is presented in Danish kroner
(DKK), which also is the functional currency of
the company.
Transition to the Danish Financial Statements ActThe annual report for 2008 has been prepared in
accordance with the Danish Financial Statements
Act, which has given rise to a change in account-
ing policies for financial assets and minor changes
and a reduction in disclosure requirements com-
pared with IFRS.
The policy change in respect of financial assets
has affected the parent company’s comparative
figures for 2007 for net financials and profit for
the year by DKK 12.8 million. Equity and total
assets were not affected.
Other than that, the accounting policies are un-
changed from previous year.
Differences relative to the Group’s accounting policiesThe parent company’s accounting policies for
recognition and measurement are in accordance
with the Group’s accounting policies with the
following exceptions.
Cash flow statement
As allowed under section 86 (4) of the Danish
Financial Statements Act, no cash flow statement
has been prepared, as this is included in the con-
solidated cash flow statement.
Income statement
Results of investments in subsidiaries and associates Dividends from subsidiaries and associates are
recognised in the parent company’s income
statement when the shareholders’ rights to
receive dividend have been approved, less any
writedowns of the equity investments.
Balance sheet
Investments in subsidiaries and associatesInvestments in subsidiaries and associates are
measured at cost in the parent company’s finan-
cial statements. Where the recoverable amount of
the investments is lower than cost, the invest-
ments are written down to this lower value. In
addition, cost is written down to the extent that
dividend distributed exceeds the accumulated
earnings in the company since the acquisition
date.
Other financial assetsOn initial recognition, securities and investments
are measured at cost, corresponding to fair value
plus directly attributable costs. They are subse-
quently measured at fair value at the balance
sheet date, and changes to the fair value are rec-
ognised under net financials in the income state-
ment.

96
Parent company
2. Staff costs
Wages and salaries, etc. 2008 2007 DKKm DKKm
Short-term staff benefits 1,063.6 947.6
Pension benefits 102.5 89.4
Other social security costs 21.8 18.2
Total 1,187.9 1,055.2
The year’s staff costs are analysed as follows
Cost of sales 323.1 312.2
Distribution costs 9.1 8.0
Administrative expenses 320.9 266.9
Research and development costs 534.8 468.1
Total 1,187.9 1,055.2
Executives
Short-term staff benefits 39.2 37.0
Pension benefits 7.3 5.6
Other social security costs 0.3 0.3
Share-based payment 0.9 6.3
Total 47.7 49.2
Executive Management
See note 3 Staff costs in the consolidated financial statements.
Supervisory Board
See note 3 Staff costs in the consolidated financial statements.
Employees
2008 2007
Average number of full-time employees in the
financial year 2,027 1,935
Number of full-time employees at 31.12. 2,090 1,963
Incentive programmes
See note 3 Staff costs in the consolidated financial statements.
3. Audit fees
2008 2007 DKKm DKKm
Deloitte
Statutory audit 1.4 1.0
Other assurance engagements 0.1 -
Tax consulting 0.2 0.1
Other services 2.2 1.7
Total 3.9 2.8
Grant Thornton
Statutory audit - 0.6
Other services - 0.9
Total - 1.5
A few small foreign subsidiaries are not audited by the parent company’s auditor,
a foreign business partner of the auditor, or by an internationally recognised ac-
countancy firm.
At the Annual General Meeting held on 22 April 2008, it was resolved to retain
Deloitte as the auditor appointed by the shareholders in general meeting.
4. Tax on profit for the year
2008 2007 DKKm DKKm
Current tax 363.5 625.6
Prior year adjustment, current tax (3.1) (11.1)
Prior year adjustment, deferred tax (1.4) 9.5
Change of deferred tax for the year 104.8 (62.9)
Change of deferred tax as a result of changed income tax rate - (21.4)
Total tax for the year 463.8 539.7
Tax for the year is composed of
Tax on profit for the year 483.1 530.8
Tax on income and expenses recognised in equity (19.3) 8.9
Total tax for the year 463.8 539.7
Notes 2-4

97
Parent companyNotes 5
5. Intangible assets and property, plant and equipment
Patent Product IT and process Projects Intangible rights rights projects1 in progress1 assets Intangible assets DKKm DKKm DKKm DKKm DKKm
Cost at 01.01.2008 645.1 598.6 368.8 84.8 1,697.3
Reclassification - - 152.1 31.5 183.6
Additions - 642.7 134.3 79.0 856.0
Disposals - (481.0) (5.2) (82.1) (568.3)
Cost at 31.12.2008 645.1 760.3 650.0 113.2 2,168.6
Amortisation at 01.01.2008 281.3 193.2 249.9 - 724.4
Reclassification - - 120.5 - 120.5
Amortisation during the year 40.2 48.1 69.9 - 158.2
Impairment during the year 81.8 481.0 - - 562.8
Disposals - (481.0) (5.2) - (486.2)
Amortisation at 31.12.2008 403.3 241.3 435.1 - 1,079.7
Carrying amount at 31.12.2008 241.8 519.0 214.9 113.2 1,088.9
Prepayments Other fixtures and and plant and Property, Land and Plant and fittings, tools equipment in plant and buildings machinery and equipment2 progress equipment Property, plant and equipment DKKm DKKm DKKm DKKm DKKm
Cost at 01.01.2008 2,705.7 699.6 861.6 541.0 4,807.9
Reclassification (27.2) - (124.9) (31.5) (183.6)
Additions 281.7 120.9 80.0 144.4 627.0
Disposals (16.9) (12.0) (16.2) (469.5) (514.6)
Cost at 31.12.2008 2,943.3 808.5 800.5 184.4 4,736.7
Depreciation at 01.01.2008 901.0 443.3 615.0 - 1,959.3
Reclassification (9.0) - (111.5) - (120.5)
Depreciation during the year 134.5 63.4 73.2 - 271.1
Disposals (9.5) (11.3) (14.2) - (35.0)
Depreciation at 31.12.2008 1,017.0 495.4 562.5 - 2,074.9
Carrying amount at 31.12.2008 1,926.3 313.1 238.0 184.4 2,661.8
1) IT and process projects as well as projects in progress primarily comprise SAP. The amounts include capitalised internal expenses.2) Including leasehold improvements.
98
Parent companyNotes 5-6
5. Intangible assets and property, plant and equipment – continued
Impairment of patents
In 2008, an impairment loss of DKK 81.8 million (DKK 21.7 million in 2007) was
recognised concerning patents. In the income statement the impairment loss is
recognised under research and development costs. The impairment charge is
higher in the parent company than in the Group as the patents acquired in con-
nection with the acquisition of Lundbeck Research USA, Inc. in 2003 were sub-
sequently transferred to the parent company at a value higher than the cost.
Impairment of product rights
In 2008, Lundbeck acquired the commercial product rights to Flurizan® at a total
value of DKK 481.0 million. Because the clinical Phase III data did not correspond to
the indications observed in Phase II, it was decided to discontinue the development
of the compound and write down the product rights. In the income statement the
impairment loss is recognised under research and development costs.
Pledged assets
The carrying amount of pledged land and buildings at 31 December 2008 was
DKK 1,897.7 million (DKK 1,790.7 million in 2007). No other assets have been
pledged.
Property value
The property value at 1 January 2008 or later for Danish properties amounted
to DKK 2,126.8 million (DKK 1,772.6 million in 2007).
6. Investments in subsidiaries
2008 DKKm
Cost at 01.01. 2,735.1
Capital contribution 0.4
Cost at 31.12. 2,735.5
Income from investments in subsidiaries is dividends and amounted to DKK
589.2 million (DKK 120.2 million in 2007).
Share of voting rights and ownership
Lundbeck Argentina S.A., Argentina 100%
Lundbeck Australia Pty Ltd, Australia, including 100%
- CNS Pharma Pty Ltd, Australia 100%
Lundbeck S.A., Belgium 100%
Lundbeck Brasil Ltda., Brazil 100%
Lundbeck Canada Inc., Canada 100%
Lundbeck Chile Farmaceútica Ltda., Chile 100%
Lundbeck Cognitive Therapeutics A/S, Denmark 100%
Share of voting rights and ownership
Lundbeck Export A/S, Denmark 100%
Lundbeck Insurance A/S, Denmark 100%
Lundbeck Pharma A/S, Denmark 100%
Lundbeck Group Limited, UK, including 100%
- Lundbeck Limited, UK 100%
- Lundbeck Pharmaceuticals Ltd., UK 100%
Lundbeck Eesti A/S, Estonia 100%
OY H. Lundbeck AB, Finland 100%
Lundbeck SA, France 100%
Lundbeck Hellas S.A., Greece 100%
Lundbeck B.V., The Netherlands 100%
Lundbeck (Hong Kong) Limited, Hong Kong 100%
Lundbeck India Private Limited, India 100%
Lundbeck (Ireland) Limited, Ireland 100%
Lundbeck Israel Ltd., Israel 100%
Lundbeck Italia S.p.A., Italy 100%
Lundbeck Pharmaceuticals, Italia S.p.A., Italy, including 100%
- Archid S.a., Luxembourg 100%
Lundbeck Japan Kabushiki Kaisha, Japan 100%
Lundbeck (Beijing) Pharmaceuticals Consulting Co., Ltd., China 100%
Lundbeck Korea Co., Ltd., Korea 100%
Lundbeck Croatia d.o.o., Croatia 100%
SIA Lundbeck Latvia, Latvia 100%
UAB Lundbeck Lietuva, Lithuania 100%
Lundbeck México, SA de CV, Mexico 100%
Lundbeck New Zealand Limited, New Zealand 100%
H. Lundbeck AS, Norway, including 100%
- CNS Pharma AS, Norway 100%
Lundbeck Pakistan (Private) Limited, Pakistan 100%
Lundbeck Poland Sp.z.o.o., Poland 100%
Lundbeck Portugal - Produtos Farmacêuticos Lda, Portugal 100%
Lundbeck RUS OOO, Russia 100%
Lundbeck (Schweiz) AG, Switzerland 100%
Lundbeck Pharmaceutical GmbH, Switzerland 100%
Lundbeck Slovensko s.r.o., Slovakia 100%
Lundbeck Pharma d.o.o., Slovenia 100%
Axofarma Lab, S.A., Spain 100%
Farmaglia S.A., Spain 100%
Lundbeck España S.A., Spain 100%
H. Lundbeck AB, Sweden, including 100%
- CNS Pharma AB, Sweden 100%
Lundbeck South Africa (Pty) Limited, South Africa 100%
Lundbeck CZ s.r.o., Czech Republic 100%
Lundbeck Ìlac Ticaret Limited Sirketi, Turkey 100%
Lundbeck GmbH, Germany 100%
Lundbeck Hungária KFT, Hungary 100%
Lundbeck Inc., USA 100%
Lundbeck Research USA, Inc., USA 100%
Lundbeck de Venezuela, C.A., Venezuela 100%
Lundbeck Austria GmbH, Austria 100%

99
Parent company
7. Investments in associates
Accumulated revaluation/ impairment Cost losses Total2008 DKKm DKKm DKKm
Carrying amount at 01.01.2008 181.1 (83.7) 97.4
Additions 111.5 - 111.5
Carrying amount at 31.12.2008 292.6 (83.7) 208.9
Based on an impairment test performed in 2007, the value of the investment in
CF Pharma Gyógyszergyártó Kft. was written down to DKK 0 in 2007.
It has been resolved to divest the non-strategic investment in LifeCycle Pharma
A/S. The sale was completed on 27 January 2009, and the profit of DKK 66.7
million will be recognised as revenue in the first quarter of 2009.
Share of voting rights and ownership
CF Pharma Gyógyszergyártó Kft., Hungary 47.1%
LifeCycle Pharma A/S, Denmark 27.2%
8. Inventories
2008 2007 DKKm DKKm
Inventories
Raw materials and consumables 161.2 364.3
Work in progress 424.5 346.0
Finished goods and goods for resale 174.7 154.2
Total 760.4 864.5
Indirect costs of production 281.0 220.2
Impairment loss for the year 16.0 42.0
9. Prepayments
2008 2007 DKKm DKKm
Prepayments are specified as follows
Prepaid cost of goods sold 95.2 61.4
Prepaid IT expenses 27.7 22.8
Prepaid insurance 23.9 30.4
Prepaid marketing activities 15.4 3.8
Other 26.2 14.8
Total 188.4 133.2
Notes 7-9

100
Parent company
10. Deferred tax liabilities
Adjustment of Movement Balance at deferred tax at during Balance at 01.01. beginning of year the year 31.12. DKKm DKKm DKKm DKKm
2008
Intangible assets 659.3 - (70.6) 588.7
Property, plant and equipment 889.6 - (2.5) 887.1
Inventories 195.3 - 85.7 281.0
Prepayments from Forest (839.5) - 242.4 (597.1)
Other items (197.2) (5.4) 164.1 (38.5)
Total temporary differences 707.5 (5.4) 419.1 1,121.2
(Deferred tax assets)/deferred tax liabilities 176.9 (1.4) 104.8 280.3
2008 2008 2008 2007 2007 2007 Deferred tax Deferred tax Deferred tax Deferred tax assets liabilities Net assets liabilities NetDeferred tax assets/deferred tax liabilities DKKm DKKm DKKm DKKm DKKm DKKm
Intangible assets - 147.2 147.2 - 164.9 164.9
Property, plant and equipment - 221.8 221.8 - 222.4 222.4
Inventories - 70.2 70.2 - 48.8 48.8
Prepayments from Forest (149.3) - (149.3) (209.9) - (209.9)
Other items (9.6) - (9.6) (49.3) - (49.3)
Tax (assets)/liabilities (158.9) 439.2 280.3 (259.2) 436.1 176.9
Set off 158.9 (158.9) - 259.2 (259.2) -
Total net tax (assets)/liabilities - 280.3 280.3 - 176.9 176.9
The figures stated above show gross deferred tax assets and deferred tax liabilities, respectively, at an income tax rate of 25% (25% in 2007).
Notes 10
Temporary differences between assets and liabilities as stated in the financial statements and as stated in the tax base

101
Parent company
11. Other provisions
2008 2007 DKKm DKKm
Provisions at 01.01. 391.6 84.2
Exchange differences (72.2) -
Provisions charged during the year - 311.1
Provisions used during the year (28.9) (3.7)
Provisions at 31.12. 290.5 391.6
Specification of provisions
Long-term provisions 290.5 80.4
Short-term provisions - 311.2
Provisions at 31.12. 290.5 391.6
The provisions cover the defence of the company’s intellectual property rights and
expected losses and obligations as a result of an impairment loss on production
assets in the manufacturing unit Lundbeck Pharmaceuticals Ltd., Seal Sands, UK,
pursuant to a manufacturing agreement.
12. Mortgage debt, bank debt and other long-term debt
2008 2007 DKKm DKKm
Mortgage debt 1,853.4 1,851.2
Employee bonds 18.1 18.9
Total debt falling due after more than 5 years 1,871.5 1,870.1
13. Treasury shares
Shares of Nominal Share of DKK 5 nom. value share capital Cost Number DKKm % DKKm
2008
Holding at 01.01. 6,652,913 33.2 3.21% 910.3
Additions 4,510,084 22.6 2.29% 538.3
Shares cancelled (10,393,349) (52.0) -5.28% (1,354.5)
Holding at 31.12. 769,648 3.8 0.39% 94.1
Additions of treasury shares consist of shares acquired pursuant to the authority
granted by the shareholders in general meeting to purchase treasury shares of up
to 10% of the share capital. The shares were purchased in the open market, and
the buyback programme has been implemented with due consideration to market
conditions and current legislation and provisions on share buybacks. Through its
wholly owned subsidiary LFI a/s, the Lundbeck Foundation has participated in the
buyback on a pro rata basis in order to maintain a free float in the company’s
shares of approximately 30%.
In May 2008, Lundbeck resolved to terminate its share buyback programme,
which entitled the company to acquire treasury shares for up to DKK 6.0 billion
during the period from 2005 to 2008. During that period, Lundbeck bought back
treasury shares for a total amount of DKK 4.0 billion, corresponding to 30,319,784
shares.
At the annual general meeting held on 22 April 2008, it was resolved to lower the
company’s share capital by DKK 51,966,745 nominal value of the company’s
portfolio of treasury shares, corresponding to 10,393,349 shares.
The market value of the entire holding of treasury shares at 31 December 2008
was DKK 84.6 million (DKK 918.1 million in 2007). Deferred tax on shares held for
less than three years was DKK 3.4 million (DKK 6.4 million in 2007).
Notes 11-13

102
Parent company
14. Contractual obligations
Rental and lease obligations
The parent company has obligations amounting to DKK 51.8 million (DKK 46.6
million in 2007) in the form of rentals and leasing of operating equipment.
The future rental and lease payments can be analysed as follows:
Land and Operating buildings equipment Total DKKm DKKm DKKm
2008
Less than 1 year 13.0 8.7 21.7
Between 1 and 5 years 18.7 11.4 30.1
Total 31.7 20.1 51.8
2007
Less than 1 year 12.7 6.7 19.4
Between 1 and 5 years 18.4 8.8 27.2
Total 31.1 15.5 46.6
Rental and lease payments recognised in the income statement amounted to
DKK 29.1 million (DKK 27.8 million in 2007).
Other purchase obligations
The parent company has undertaken to purchase property, plant and equipment
in the amount of DKK 167.3 million (DKK 173.8 million in 2007).
Research collaborations
The parent company is part of multi-year research collaboration projects com-
prising minimum research and contractual obligations in the order of DKK 19
million (DKK 32 million in 2007). The total amount of the obligations may in-
crease substantially in line with the favourable development of the projects.
Other contractual obligations
At 31 December 2008, the parent company had capital contribution obligations
amounting to DKK 40.8 million (DKK 33.2 million in 2007). In connection with
the divestment of non-strategic investments in four small private equity funds
completed on 27 January 2009, the capital contribution obligation was reduced
by DKK 39.6 million to DKK 1.2 million.
The parent company has entered into various service agreements amounting to
DKK 31.4 million (DKK 33.2 million in 2007).
Notes 14-17
15. Contingent liabilities
Letters of intent and bank guarantees
The parent company has entered into agreements to hedge operating losses in
certain subsidiaries. The parent company has issued letters of intent to subsidi-
aries in a total amount of DKK 5.3 million (DKK 7.8 million in 2007). Further-
more, the parent company’s bankers have issued bank guarantees to third par-
ties in the amount of DKK 0.1 million (DKK 10.1 million in 2007).
Joint taxation
The parent company is liable jointly and severally with the other jointly taxed
companies for the total income taxes under the joint taxation for the income
year 2004 and earlier. As from 2005, H. Lundbeck A/S and Danish subsidiaries
are subject to national joint taxation with LFI a/s and other Danish affiliated
companies. The companies under this joint taxation scheme are separately liable
for the payment of own taxes until these have been settled with the administra-
tion company (LFI a/s). After such time, LFI a/s is liable for the combined taxes
under the joint taxation scheme.
Except for the above, the Group’s and the parent company’s contingent liabili-
ties are identical, and reference is therefore made to note 19 Contingent liabili-
ties in the consolidated financial statements.
16. Financial instruments
See note 20 Financial instruments in the consolidated financial statements.
17. Related parties
See note 21 Related parties in the consolidated financial statements.

103
We have today presented the annual report of H. Lundbeck A/S for the financial year 1 January to 31 December 2008.
The consolidated financial statements have been prepared in accordance with Interna-tional Financial Reporting Standards (IFRS) as issued by the IASB as well as IFRS as adopted by the EU and the parent company’s financial statements have been prepared in accordance with the Danish Financial Statements Act. Fur-ther, the annual report has been prepared in
accordance with additional Danish disclosure requirements for annual reports of listed com-panies.
In our opinion, the accounting policies used are appropriate and the annual report gives a true and fair view of the Group’s and the parent company’s assets, liabilities and finan-cial position at 31 December 2008, and of the Group’s and parent company’s financial per-formance and the Group’s cash flow for the fi-nancial year 1 January to 31 December 2008.
We believe that the Management’s review gives a fair presentation of developments in the Group’s and the parent company’s activi-ties and finances, results for the year and of the Group’s and parent company’s financial position in general as well as a fair description of the most significant risks and uncertainties to which the Group and parent company are exposed.
We present the annual report for approval at the Annual General Meeting.
Management statement
Copenhagen, 4 March 2009
Executive Management
Ulf Wiinberg Peter Høngaard Andersen Lars Bang President and CEO Executive Vice President Executive Vice President Anders Götzsche Anders Gersel Pedersen Stig Løkke Pedersen Executive Vice President, CFO Executive Vice President Executive Vice President
Supervisory Board Per Wold-Olsen Thorleif Krarup Egil Bodd Chairman Deputy Chairman
Kim Rosenville Christensen Peter Kürstein Jørn Mayntzhusen Mats Pettersson Birgit Bundgaard Rosenmeier Jes Østergaard

104
To the shareholders of H. Lundbeck A/SWe have audited the annual report of H. Lundbeck A/S for the financial year 1 January to 31 December 2008, which com-prises the statement by Management on the annual report, Management’s review, income statement, balance sheet, statement of changes in equity and notes, including the ac-counting policies for the Group as well as the parent company, and the consolidated cash flow statement for the Group. The consoli-dated financial statements have been prepared in accordance with International Financial Re-porting Standards (IFRS) as issued by the IASB as well as IFRS as adopted by the EU, and the parent company’s financial statements have been prepared in accordance with the Danish Financial Statements Act. Further, the annual report has been prepared in accordance with additional Danish disclosure requirements for annual reports of listed companies.
Management’s responsibility for the annual reportManagement is responsible for the preparation and fair presentation of an annual report in ac-cordance with International Financial Report-ing Standards (IFRS) as issued by the IASB as well as IFRS as adopted by the EU and addi-tional Danish disclosure requirements for listed companies. This responsibility includes: design-ing, implementing and maintaining internal
control relevant to the preparation and fair presentation of an annual report that is free from material misstatement, whether due to fraud or error; selecting and applying appropri-ate accounting policies; and making account-ing estimates that are reasonable in the cir-cumstances.
Auditor’s responsibility and basis of opinionOur responsibility is to express an opinion on the annual report based on our audit. We con-ducted our audit in accordance with Danish and International Standards on auditing. Those standards require that we comply with ethical requirements and plan and perform the audit to obtain reasonable assurance that the annual report is free from material misstatement.
An audit involves performing procedures to obtain audit evidence about the amounts and disclosures in the annual report. The proce-dures selected depend on the auditor’s judg-ment, including the assessment of the risks of material misstatement of the annual report, whether due to fraud or error. In making those risk assessments, the auditor considers internal control relevant to the entity’s preparation and fair presentation of an annual report in order to design audit procedures that are appropri-ate in the circumstances, but not for the pur-pose of expressing an opinion on the effective-ness of the entity’s internal control. An audit
also includes evaluating the appropriateness of accounting policies used and the reason-ableness of accounting estimates made by Management, as well as evaluating the overall presentation of the annual report.
We believe that the audit evidence we have obtained is sufficient and appropriate to pro-vide a basis for our audit opinion.
Our audit has not resulted in any qualification.
OpinionIn our opinion, the annual report gives a true and fair view of the Group’s financial position at 31 December 2008, and of its financial per-formance and its cash flows for the financial year 1 January to 31 December 2008 in ac-cordance with International Financial Report-ing Standards (IFRS) as issued by the IASB as well as IFRS as adopted by the EU and addi-tional Danish disclosure requirements for an-nual reports of listed companies.
Further, in our opinion, the annual report gives a true and fair view of the parent company’s financial position at 31 December 2008 and of its financial performance for the financial year 1 January to 31 December 2008 in accordance with the Danish Financial Statements Act and additional Danish disclosure requirements for annual reports of listed companies.
Independent auditors’ report
Copenhagen, 4 March 2009
Deloitte Statsautoriseret Revisionsaktieselskab
Stig Enevoldsen Anders DonsState Authorised Public Accountant State Authorised Public Accountant

Depression and anxiety • Depression is a common and partly hereditary
disease with symptoms such as melancholy, loss of energy, difficulty concentrating and sui-cidal thoughts. Patients have trouble holding onto their job, keeping up with their studies and/or maintaining their family life and social contacts.
• The neurotransmitter serotonin transmits nerve impulses from one nerve ending to an-other. Too little serotonin can trigger a depres-sive episode.
• The disorder is categorised as either mild, moderate or severe, which refers to the inten-sity of the symptoms. Depression can strike anyone, but certain social and biological fac-tors make some people more predisposed to this disorder than others.
• There is a close correlation between depres-sion and anxiety disorders such as generalised anxiety, panic disorder and social anxiety symptoms. Nearly all patients suffering from depression also suffer from anxiety, and more than half of those who suffer from anxiety also suffer from another psychiatric disorder, pri-marily depression.
Psychotic disorders • Schizophrenia is the most common psychotic
disorder and may lead to pronounced changes in the patient's way of thinking and perception of the outside world. Affecting about 1% of the population, the disorder often starts in late adolescence. Suicide is a major cause of pre-mature deaths.
• Patients with schizophrenia may suffer acute psychotic episodes of hallucinations and delu-sions. Many patients also have some cognitive dysfunction that makes it difficult to think straight and convert thought into action. Pa-tients often also suffer from isolation and lack of initiative.
• Bipolar disorder (manic depression) is another form of psychotic disorder that is difficult to diagnose. The mood of the patients can cycle between depression and mania.
• People with uncontrolled bipolar disorder of-ten experience an impaired level of function-ing and ruined personal relationships.
Parkinson’s disease • Parkinson’s disease is a chronic and progres-
sive brain disorder that usually affects people over the age of 60.
• Parkinson’s is caused by the lack of dopamine, which is one of several chemical neurotrans-mitters responsible for transmitting signals within the brain. Loss of dopamine causes an imbalance in nerve cell activity, leaving pa-tients unable to direct or control their move-ments in a normal manner.
• Typical symptoms are tremors, stiffness, slow movements and impaired balance. The precise cause of the disease is unknown, but genes, environmental factors and age are believed to be some of the factors involved.
• As the disease progresses, the symptoms grow worse, and the patient will most likely experi-ence motor function problems. Ultimately, Parkinson’s impairs the patient's ability to function in daily life situations.
Alzheimer’s disease • Alzheimer’s disease is a neurological disorder
and is the most common form of dementia. The disease is caused by the destruction of nerve cells, causing a gradual functional de-terioration in the affected areas of the brain.
• The disease primarily affects those in middle and old age, starting with a mild stage of for-getfulness, changes in personality and confu-sion.
• At the moderate stage, patients lose the abil-ity to perform everyday activities; they suffer disorientation, delusion and language prob-lems and fail to recognise their loved ones.
• The severe stage involves a period of time with the patient in an almost vegetative state, gradually losing the ability to communicate, eat and drink. Eventually, the patient dies.
Insomnia • Insomnia is the most common form of sleep
disorder. The term "primary insomnia" refers to the fact that the disorder is not caused by other factors such as depression or pain.
• Melatonin is a naturally occurring hormone produced by the pineal gland, and it has a pivotal role in the regulation of circadian
rhythms and sleep. Endogenous melatonin levels decrease with age and may contribute to the complaint of poor sleep quality seen amongst those of middle and old age.
• Insomnia is more common among women than men. It reduces the ability to perform everyday activities and contributes to an overall deterioration in the patient's health.
• Affecting one-fourth of the population, pri-mary insomnia is characterised by symptoms such as difficulty falling asleep or sleeping without interruption, waking up frequently or very early, and experiencing non-refreshing sleep.
Stroke • Stroke is a primary reason for serious disabil-
ity in the industrialised world and one of the leading causes of death.
• A stroke occurs when the blood supply to a part of the brain is suddenly interrupted (is-chaemic) or when a blood vessel in the brain bursts, bleeding into the spaces surrounding the brain cells (haemorrhagic).
• Some of the damaged brain cells can be saved only if treatment is given within a few hours after the stroke.
• Symptoms of a stroke include sudden numb-ness or weakness, especially on one side of the body, confusion, and loss of balance or coordination skills.
Alcohol abuse • Alcohol is toxic to most body organs, espe-
cially in large amounts. • Excessive consumption of alcohol is a com-
mon problem in many parts of the world and involves huge social consequences, whilst also increasing the risk of developing a number of diseases such as cancer, cardiovascular dis-ease, cerebral atrophy, stomach ulcer and liver cirrhosis.
• The extent of injury depends on how much and for how long a time a person drinks alcohol.
• In the Western world, one in ten deaths is alcohol-related.
Mechanism First Approvedno.Compound ofaction Indication Trademark registration ofcountries Melatonin Regulation of Primary insomnia Circadin® 2007 29 circadian rhythm
Escitalopram ASRI Depression, generalised Cipralex®, Lexapro®, Sipralexa®, 2001 94 anxiety disorder, panic Sipralex® disorder, social anxiety disorder, OCD Citalopram SSRI Depression, panic disorder, Cipramil®, Seropram®, Cipram®, 1989 77 OCD Celexa® Memantine NMDA-antagonist Moderate to severe Ebixa®, Ebix® 2002 66 Alzheimer’s disease
Rasagiline MAO-B inhibitor Parkinson’s disease Azilect® 2005 33
Sertindole Atypical antipsychotic Schizophrenia Serdolect®, Serlect® 1996 45
Flupentixol Typical antipsychotic Mild depression Deanxit® 1971 28+melitracene + TCA Nortriptyline TCA Depression Noritren®, Nortrilen®, Sensaval® 1963 22 Amitriptyline TCA Depression Saroten®, Sarotex®, Redomex® 1961 31 Zuclopenthixol Typical antipsychotic Schizophrenia and other Cisordinol®, Clopixol® 1982 72 psychotic disorders, anxiety, restlessness, insomnia
Zuclopenthixol- Depot antipsychotic Maintenance treatment Cisordinol Depot®, 1976 74 decanoate of chronic psychotic Clopixol Depot®, disorders Ciatyl-Z Depot®
Zuclopenthixol- Typical antipsychotic Acute psychotic episodes, Cisordinol-Acutard®, 1986 73 acetate exacerbation of psychotic Clopixol-Acutard®, disorders Clopixol-Acuphase®, Ciatyl-Z-Acuphase®
Flupentixol Typical antipsychotic Schizophrenia and other Fluanxol®, Fluanxol Mite®, 1965 66 psychotic disorders and Depixol® mild depression
Cis(Z)- Depot antipsychotic Maintenance treatment Fluanxol Depot®, Depixol® 1970 73 flupentixol- of chronic psychoticdecanoate disorders
Chlorprothixene Typical antipsychotic Schizophrenia and other Truxal®, Truxaletten® 1959 23 psychotic disorders, anxiety, restlessness, withdrawal symptoms in drug addicts
Facts about brain disorders Launched pharmaceuticals
Design: Bysted ASPrint: Quickly Tryk A/SMarch 2009
Parent company Denmark
Production DenmarkItalyMexico
Research DenmarkUSA
Sales EuropeAustriaBelgiumBulgariaCroatiaCzech RepublicDenmarkEstoniaFinlandFranceGermanyGreeceHungary
IcelandIrelandItalyLatviaLithuaniaNetherlandsNorwayPoland PortugalRomaniaSerbia and MontenegroSlovakiaSloveniaSpainSwedenSwitzerlandUK
Int. Markets ArgentinaAustraliaBelarusBrazilCanadaChileChina (incl. Hong Kong)
EgyptIndiaIndonesiaIsraelJapanMalaysiaMexicoPakistanPhilippinesRussiaSaudi ArabiaSingaporeSouth AfricaSouth KoreaTurkeyUkraineUnited Arab EmiratesVenezuela
USA
Institutes Lundbeck Institute
Countries are listed in accordance with Lundbeck’s market regions.
Lundbeck at a glanceSpecialtypharmaceuticalcompanyengagedinthedevelopmentofpharma-ceuticalsforthetreatmentofbraindisordersonthebasisofin-houseresearch.
Foundedin1915byHanslundbeck,thecompanywaslistedonthenasdaqOMXCopenhagenstockexchangein1999.
ThelundbeckFoundationisthelargestshareholder,own-ingabout70%oftheshares.In2008,thefoundationpaidoutDKK328millioninfundsforscientificresearch.
5,511employeesin55countries.
Approved for: Depression and anxietyRevenue in 2008: DKK 7,293m (+9%) Partner: Forest Laboratories, Inc. (Lexapro®)
Approved for: Alzheimer’s diseaseRevenue in 2008: DKK 1,879m (+14%)Partner: Merz Pharmaceuticals GmbH
Approved for: Parkinson’s diseaseRevenue in 2008: DKK 263m (+57%)Partner: Teva Pharmaceutical Industries Ltd.
Approved for: SchizophreniaRevenue in 2008: DKK 58m (+68%)
Approved for: InsomniaRevenue in 2008: Not reported Partner: Neurim Pharmaceuticals Ltd.
A total of ten products approved for the treatment of various brain disorders
Other pharmaceuticals
Products
Milestones
2008
Lu AA21004 In cooperation with our partner Takeda Pharmaceutical Company Ltd. the pivotal Phase III programme is expanded for Lu AA21004, which is Lundbecks most advanced compound in the field of depression and anxiety.
Circadin®The sleep agent Circadin® is launched in Germany and subsequently rolled out in a total of 12 markets during 2008.
New President and CEO Ulf Wiinberg is appointed as President and CEO from 1 June, after Claus Bræstrup. Ulf Wiinberg previously had strategic responsi-bility for biopharma activities in the US pharmaceutical company Wyeth and was overall responsible for Wyeth in Europe, Middle East, Africa and Canada.
Azilect®Lundbeck’s partner Teva Pharmaceutical Industries Ltd. announces results from the ADAGIO Phase III trial with Azilect®.
Michael J. Fox FoundationMichael J. Fox Foundation – established by US actor Michael J. Fox, who suffers from Parkinson’s disease – supports two of Lundbeck's early-stage research projects with a total amount of DKK 4.5 million.
Serdolect® in the USALundbeck submits a New Drug Application to the U.S. Food and Drug Administration (FDA) for Serdolect® for the treatment of schizophrenia. A reply from the authorities is expected in May 2009.

AnnuAlREPORT
08
The specialist in psychiatryand pioneer in neurology
Photos
Patient photos: Joachim Ladefoged and Simon Ladefoged.All patients have had their photos taken after preceding agreement. The patients have no connection to Lundbeckor to pharmaceuticals marketed by Lundbeck. Other photos: Joachim Ladefoged, Simon Ladefoged and Ricky John Molloy.
H. Lundbeck A/S
Ottiliavej 9
2500 Copenhagen - Valby
Denmark
Corporate Reporting
Tel. +45 36 30 13 11
Fax +45 36 30 19 40
www.lundbeck.com
CVR nr. 56759913
2008 2007 2006 2005 2004 2008 2008 DKKm DKKm DKKm DKKm DKKm EURm1 USDm2
Revenue 11,282 10,985 9,221 9,070 9,733 1,513 2,219
Research and development costs 2,992 2,187 1,958 1,782 1,776 401 589
Profit from operations 2,352 2,695 1,784 2,170 2,554 315 463
Net financials (185) (50) (64) 108 16 (25) (36)
Profit for the year 1,510 1,770 1,107 1,574 1,689 202 297
Total assets 12,607 12,326 11,631 11,628 11,509 1,692 2,385
Equity 7,592 7,185 6,765 7,492 7,839 1,019 1,437
Cash flows from operating and investing activities 2,193 1,610 1,633 1,587 884 294 431
Property, plant and equipment investments, gross 229 474 567 447 305 31 43
% % % % % % %
EBIT margin 20.8 24.5 19.3 23.9 26.2 20.8 20.8
Return on capital employed 29.8 34.9 25.2 32.0 37.0 29.8 29.8
Return on equity 20.4 25.3 15.6 20.7 23.2 20.4 20.4
Research and development costs as a percentage of revenue 26.5 19.9 21.2 19.6 18.2 26.5 26.5
Solvency ratio 60.2 58.3 58.2 64.4 68.1 60.2 60.2
Capital turnover 89.5 89.1 79.3 78.0 84.6 89.5 89.5
DKK DKK DKK DKK DKK EUR 1 USD 2
Earnings per share (EPS)3, 4 7.67 8.63 5.24 7.04 7.42 1.03 1.51
Diluted earnings per share (DEPS)3, 4 7.67 8.63 5.23 7.02 7.42 1.03 1.51
Proposed dividend per share3 2.30 2.56 1.57 2.10 2.21 0.31 0.45
Cash flow per share3 14.12 13.18 6.59 9.20 11.62 1.89 2.78
Net asset value per share3 38.71 35.81 32.40 33.99 34.21 5.20 7.32
Market capitalisation (million) 21,657 28,605 33,060 29,630 28,517 2,907 4,098
Average number of employees 5,208 5,134 5,111 5,022 5,155
1) Income statement items are translated using the average EUR exchange rate for the year (745.58). Balance sheet items are translated at the EUR exchange
rate on 31 December 2008 (745.06). 2) Income statement items are translated using the average USD exchange rate for the year (508.38). Balance sheet items are translated at the USD exchange
rate on 31 December 2008 (528.49). 3) The calculation is based on a share denomination of DKK 5. 4) Calculated according to IAS 33 Earnings per share.
Financial highlights 2004 - 2008
H. LU
ND
BECK A
/S AN
NU
AL REPO
RT 2008
Frontpage
Denmark (depression)
Tove is out for a walk in a
park in inner Copenhagen.
Page 7
Mexico (depression)
Javier with his wife
on a cold winter day
in Mexico City.
Page 17
Malaysia (schizophrenia)
Rajesh in his room in
a treatment center in
Kuala Lumpur.
Page 21
Denmark (Alzheimer's
disease)
Ry in a quiet moment
in the day centre, where
he meets with other
patients.
Page 25
Malaysia (schizophrenia)
Seniwati sweeps the floor
in her room in a hospital
in Johor Bahru.
Page 31
Malaysia (depression)
Chia works as a tailor in
a hospital in Johor Bahru.
Page 1
Denmark (Parkinson's
disease)
Just makes gymnastic
exercises in a hot water
basin to relieve his
symptoms.
Page 35
Mexico (depression)
Yolanda looks over
Mexico City from a tall
office building.
Page 36
Mexico (depression)
Javier in a coffee shop
in Mexico City.
Page 40
China (Alzheimer's
disease)
Zhongying enjoys a
cup of coffee in a cafe
in Beijing.
AnnuAlREPORT
08