h˜ .taka˚a˛ ma-taurang˝, h˜ wha-na˛ huarew˝
TRANSCRIPT

te PŪrongoAnnual Report 2014
He takapau ma-tauranga, he wha-nau huarewa.

Published in 2015 by Te Wānanga o Aotearoa, 320 Factory Road, PO Box 151, Te Awamutu 3800.
0800 355 553 | www.twoa.ac.nz
Presented to the House of Representatives pursuant to the Crown Entities Act 2004.

mihiHe
Rukutia atu hoki te tohu whakamānawa e rere atu nei ki ngā tāpuhipuhi mana nui o tēnā rohe, o tēnā takiwā, nei rā te waha o te whakamihi e whakapaoho nei i te waioha, tatū atu hoki ki a Kīngi Tuheitia e noho mai rā. Tēnā hoki rā tātou i ngā mate tārūrū o te wā – purutia atu e koutou te akaaka o te rangi, ki reira rā koutou okioki mai ai. Homai kia purutia te akaaka o te whenua, kei ngā mangainga o ngā mātā waka, tēnā koutou.
He tau anō, he mahi anō, he tāngata anō – engari ko te kaupapa ka mau tonu. Kitea ana hoki te whakatōrōpukutanga o taua kaupapa i ngā tauira e puta ana ki te ao me ā rātou tohu hei rākau mā rātou e whai nei i ngā tini huarahi hei oranga mō rātou. Koinā te whakakanohitanga nui o tā Te Wānanga o Aotearoa e hāpai nei, heoi anō kei konei kei Te Pūrongo te taunakitanga o ngā whakahaere hei pānui, hei wherawhera mā te ao me kore noa e tau tētehi pūahoaho kē atu i tēnā o te kite i ngā tini mahi whai hua e puta ana i te whare.
Kāti ake i konei, me ngā mihi nui ki te makui e kaha tautoko nei i te wānanga – tēnā koutou katoa.
Rukutia te toi nuku
Rukutia te toi rangi
Rukutia te toi o nga- ko-rero o te wa-nanga
Kia mau whiwhia, kia mau rawea
Whakamaua kia tı-na
Haumi e, hui e, taiki e.

E te iwi nui tonu tēnei ka tangi mō koutou kua ngaro
ki te Hono-i-wairua.
Mahue mai ko mātou te hunga ora ki muri nei auē
atu ai, mōteatea atu ai, mapu atu ai.
Nō reira moe mai rā kei aku rau kahurangi kei aku kuru
tongarerewa.
Waiho mai ko mātou hei pīkau ī ā koutou
ōhākī hei oranga mō ngā whakatupuranga.
E moe, okioki atu.
To the multitudes who have departed this world, we mourn for you as you now take your place where the spirits gather.
In the world of the living – those of us who have been left behind – we wail in sorrow, we weep as we think of you, we heave a sigh of grief.
But, sleep my cherished one, my treasured ones.
Leave for us your works that we may continue to fulfil your aspiration to help our future generations.
Forever be at rest.
whakamaumaharatanga Hei
Remembrance
2
TE
PŪ
RO
NG
O 2
01
4

upokoTable of contents
Rārangi
Hei whakamaumaharatanga / Remembrance 2
Ngā mātāpono / Guiding principles 5
Ngā whakahirahiratanga / Highlights 6
Tā Te Heamana / Chairperson’s report 8
Tā Te Taiurungi / Chief Executive’s report 10
A brief history / celebrating 30 years of whānau transformation through education 12
Whānau transformation whakataura / student profiles 14
Our future 20
Our qualifications 21
Ngā mahi whakahaere / Governance 22
Ngā Tumu / Executive Directors 24
Ngā rohe me ngā whare / Regions and sites 26
Ngā Tauira / Our students 28
Ngā Kaimahi / Our staff members 31
Te ine whakaritenga / Measuring our performance 33
Te huanganui / Outcomes framework 34
Ngā Hua: Ahurea / Outcome: Mātauranga Māori is advanced 35
Ngā Hua: Hāpori / Outcome: Social well-being for all New Zealanders 36
Ngā Hua: Arumoni / Outcome: Economic Well-being for all New Zealanders 37
Ngā kī taurangi / Statement of Service Performance 38
Output class: Ahurea Cultural 38
Output class: Hāpori Community 39
Output class: Arumoni Commercial 40
Investment Plan Commitments 41
Attracting and engaging priority learners 41
Supporting learners to succeed 42
Successful qualification completion 43
Supporting quality research to help drive innovation 44
Statement of Responsibility 45
Te Tahua / Financial report 47

4
TE
PŪ
RO
NG
O 2
01
4

Te Ūnga Matua
Whānau transformation through education
The values of Te Aroha, Ngā Ture, Whakapono and Kotahitanga are embedded in and woven through the actions we take to achieve successful outcomes for our tauira. By achieving success for tauira we achieve success as an organisation.
Our values also provide an on-going cycle of evaluation and improvement that contributes to the achievement of our Kaupapa and our goals.
Te Wānanga o Aotearoa defines its values as follows:
Ko Ngā UaraThe valuesStrategic destination
Our purpose is to provide unique, high quality educational opportunities for Māori, and all others, which contributes to positive transformational changes for our tauira through achievement of their aspirations and goals.
mātāponoNgā
Guiding principles
Te ArohaHaving regard for one another and those for whom we are responsible and to whom we are accountable to
Te WhakaponoThe basis of our beliefs and the confidence that what we are doing is right
Ngā TureThe knowledge that our actions are morally and ethically right and that we are acting in an honourable manner
KotahitangaUnity amongst iwi and other ethnicities; standing as one
Gu
idin
g P
rin
cip
les
5

whakahirahiratangaNga-
Highlights
Te Wa-nanga o Aotearoa celebrated a broad range of achievements during 2014 in our quest to achieve wha-nau transformation through education. Here are some of our highlights.
71%
Supporting tauira to achieve success
Taking education to the people
Qualification completion
120DELIVERY TOWNS AND CITIES
20,70132,235Number of tauira: head count
Number of tauira: EFTS
80%Course completion
76%retention
Working with priority learners
3,4323,434
17,414Number of tauira Māori
Number of under 25-year-old tauira
Number of Pasifika tauira
Certificate level qualifications – levels 1,2,3 and 4
Diploma and graduate certificate level qualifications – levels 5 and 6 12
Degree and post-graduate diploma level qualifications – level 7 and above 11
50Supporting engagement with pathways of learning
6
TE
PŪ
RO
NG
O 2
01
4

7
Hig
hlig
hts
Satisfying our tauira
Tauira who are very satisfied or satisfied with their experience
Tauira who said their understanding of mātauranga Māori increased 77%
Tauira who said their qualification had improved their ability to do their job 82%
92%
Surplus Total Income
Net Assets
million
$5.08
million
$155million
$148
Ensuring sustainability
Working to fulfil Te Kaupapa
Kaimahi who believe their work is of significance 91%
Kaimahi who are proud to work for Te Wānanga o Aotearoa 91%
Certificate level qualifications – NQF 1 to 4
Diploma and graduate certificate level qualifications – NQF 5 &6 1,473
349
18,463
Degree level qualifications – NQF 7 and above
Number of qualifications
AWARDED
7

E wehi ana ki te atua, whakahōnoretia a Kīngi Tuheitia e noho ana i te ahurewa tapu o ōna mātua tūpuna me tōna whaea, paimārire. Tangihia ō tātou mate huhua kua ngaro i te tirohanga kanohi, moe mai rā koutou i te urunga tē te taka, te moenga tē whakaarahia e moe, e moe. Āpiti hono tātai hono, te hunga mate ki te hunga mate, te hunga ora ki te hunga ora, tēnā tātou katoa.
Nōku te māringanui ki te whakarewa i Te Pūrongo ā-tau nei me ōna tini kōrero i roto. Kei roto ka kitea ngā hua, ā, nā te kaha o ngā kaimahi ki te whakatinana i te kaupapa i pēnei ai te ekenga o Te Wānanga o Aotearoa ki te taumata o angitu.
Heoi anō, me mihi hoki au ki ngā mema kua whakawāteahia ō rātou tūru, tēnā rā koutou katoa i whakapau kaha i roto i ngā tau, ka mutu, e mihi ana ki ngā ringa katoa nā rātou nei te kaupapa i hāpai, katoa ka whakanuia i tēnei te tau 30 mai i te tīmatanga, ā, kia kaha tonu tātou ki te whakakōkiri i ō tātou tūmanako kia ora tonu ai, kia pakari tonu ai Te Wānanga o Aotearoa mō te ake ake.
Tā Te HeamanaChairperson’s report
Richard Batley
Tuia i rungaTuia i raro
Ka rongo te po-, ka rongo te aoTihe- mauri ora
SurplusTotal Income
Net Assets
$5.08MILLION $155
MILLION$148MILLION

It is a pleasure to present the 2014 Te Pūrongo following a year of sustained achievement for Te Wānanga o Aotearoa.
I would like to acknowledge the efforts of our kaimahi who continued to drive for educational excellence and solid financial results in a year that saw considerable change within our organisation. These results continue to make a significant difference to the lives of our tauira and the communities in which we operate. The organisational realignment – Te Raumairanga was initiated during 2014 to ensure that we maintain and build on our strong educational performance and reflect the needs of our stakeholders.
This year also marked the eighth straight year of financial surplus for Te Wānanga o Aotearoa. The surplus of $5.08 million is within expectations and has been achieved despite capped funding and escalating costs in a challenging operating environment. Te Raumairanga along with a continued focus on efficiencies, innovation and fiscal control will ensure that our organisation is well-placed for the future.
During 2014, Te Mana Whakahaere continued to review and refine the governance model in preparation for the Government-led changes for both the university and wānanga sectors. We expect to implement our new governance model in early 2015. The new model consists of 9 members who will be appointed using the Te Mana
Whakahaere Skill Matrix. The Skill Matrix consists of four pou (kaupapa, holding to account, compliance, governance experience) and will ensure that Te Mana Whakahaere members have a rich and broad range of skills to contribute to the organisation.
There were a number of changes in the composition of Te Mana Whakahaere during 2014 and I would like to thank those who concluded their terms and welcome our new members. We welcomed Dr Kathie Irwin and Fred Potini; I appreciate their commitment and look forward to their contribution.
Thank you to Reverend Napi Waka and Tania Hodges who completed their terms. Both Napi and Tania concluded 10 and 13 years respectively of service this year. The knowledge, experience and commitment these members brought to our wānanga and its kaupapa is greatly appreciated and valued. They are both passionate advocates for our organisation and the well-being of Māori, and I wish them well in their future endeavours.
Angelina Matekohi and Sarah Rapira (tauira elected members) and Tony Iwikau (academic elected member) also completed their one-year-terms. I thank them for their contribution and providing a perspective from their respective constituents.
The new governance model will continue to include the perspective of tauira and kaimahi in our decision-making.
In 2015, we celebrate and reflect on 30 years of delivering education to thousands of tauira. These years have been filled with challenges and successes, but we have not lost sight of our kaupapa and our goal of whānau transformation through education.
I would like to take this time to acknowledge the performance of Jim Mather who completed his first full year in the role of Te Taiurungi (Chief Executive). Jim has developed a thorough understanding of the organisation and set it on a path to become the leading indigenous development organisation in Aotearoa New Zealand and the world. Jim has produced strong financial and educational results and I look forward to his continued leadership of Te Wānanga o Aotearoa. In addition, I congratulate Jim on completing the requirements for his doctorate and wish him well for his graduation.
Richard Batley BMS CA
Te Heamana
Ngāti Tama, Ngāti Maniapoto, Waikato, Raukawa
9
Tā
Te
He
am
an
a

Tā Te TaiurungiChief Executive’s report
Jim Mather
Te-nei au ko te ho-kai nei o taku tapuaeKo te ho-kai nuku, ko te ho-kai rangi
Ko te ho-kai a Ta-ne-nui-a--rangiI pikitia ai te rangitu-ha-ha-
Ka riro mai ko nga- kete o te wa-nangaKoia te tuauri, te tua-tea, te aronui
Ka tiritiria, ka poupouaKa puta te tangata ki te whai ao ki te ao ma-rama
Kei ngā ihoiho o ngā maunga, kei ngā wai whakatere taniwha, tēnā koutau katoa. Tēnā rā tātau i ā tātau tangi mō ō tātau tini aituā kua ngaro ki tua o pae huakau, heoi anō, tukuna atu rātau kia okioki, ā, mā tātau ngā mahuetanga iho, ngā mahi me ngā kaupapa e pīkau, tēnā rā tātau katoa.
E ngā iwi, nei rā taku taunaki i tēnei putanga o Te Pūrongo hei Taiurungi mō Te Wānanga o Aotearoa – nei tonu te waka e rere nei i ngā tai o te ināianei, ko ōna ehuehu te āpōpō, ko te pītau kei te āpōpō e haere ana.
Kāore hoki i te rerekē te ahunga o te waka, mai i te whakataunga o tōna ihu ki te pae tawhiti, taka mai ki tēnei wā, e hoea tonutia ana e ngā kaihoe te moana o Tūmanako, o Moemoeā, ā, kei reira ka tuarangaranga i ōna wā, ka marino, engari kei te mārō tonu te rere. Waihoki, he ringa ka hāpai i te hoe, he ringa anō ka tuku i te hoe mā tētahi atu. Nō konei ka whakaaro ki Te Raumairanga i whāia ai i roto i ngā marama nei hei whakapakari i te kaupapa mō ngā tau kei mua i te aroaro.
Kei ngā whānau, hapū, iwi, tae noa ki ngā hapori nā koutau nei Te Wānanga o Aotearoa i tautoko, tēnei ka whakamānawa, me kore ake hoki tā koutau tautoko nui i pakari ai ngā kaimahi ki te āwhina me te arataki i ngā tauira.
Heoi anō, kei te rere taku whakamihi nui ki ngā tauira; mō koutau kē te kaupapa, tēnā rā koutau katoa e whai nei i te mātauranga mā roto i Te Wānanga o Aotearoa.
Course completion
Qualification completion
66%
2010
76%
2010
71%
2011
79%
2011
70%
2012
81%
2012
79%
2013
81%
2013
71%
2014
80%
2014

Jim Mather Te Taiurungi
Ngāti Awa, Ngāi Tūhoe
Our organisational realignment project – Te Raumairanga was initiated during 2014 and sets the foundation for achieving our strategic focus areas of educational excellence, effective leadership, innovation, communication and strengthening our brand. To achieve those objectives we designed eight uepū to be led by Ngā Tumu (Executive Directors) and the position of Te Taituarā (Deputy Chief Executive). After a comprehensive recruitment process, I was pleased to appoint extremely capable and committed people to the executive positions (refer pages 22-23 for appointments).
Following the appointment of Ngā Tumu, Te Raumairanga focused on realignment of functions at Te Puna Mātauranga (head office) which was scheduled to be completed in March 2015. The realignment included consolidating Open Wānanga Limited into Te Wānanga o Aotearoa to create ‘One Wānanga’ to improve efficiency and replicate successes. Following the first phase, Te Raumairanga will review functions at rohe (regions) to prepare the organisation for the future.
In 2014, our kaimahi supported 32,235 tauira to achieve their educational aspirations and in doing so
I am honoured to present my second annual report after my first full year in the role of Te Taiurungi (Chief Executive) of Te Wānanga o Aotearoa. It has been a privilege to contribute to our collective goal of whānau transformation through education.
we achieved a strong course completion rate of 80% and a qualification completion rate of 71%. These results compare favourably with the sector and were expected given the challenges our tauira demographic face. I am pleased to report that our retention (75%) and progression at levels 1 to 3 (45%) rates have continued to remain strong.
Our strategic destination of Whānau transformation through education was the foundation for our continued focus on engaging youth and those with no prior qualifications. During 2014 the proportion of under 25 year olds (both SAC and non-SAC funded) was 17% (3,424) and the number of tauira enrolling without a secondary school qualification was 40% (12,837).
We also celebrated the inaugural cohort of tauira who graduated in He Waka Hiringa (Master of Applied Indigenous Knowledge). Our graduates possess advanced knowledge in a specialist area of indigenous knowledge, and through their research have made a substantial contribution to mātauranga Māori.
It is also encouraging to note that Te Wānanga o Aotearoa continued to strengthen its financial sustainability with a surplus of $5.08
million in 2014. This result is particularly satisfying given that it incorporated significant non-recurring costs associated with Te Raumairanga.
I would like to acknowledge the efforts of those who led Te Wānanga o Aotearoa before me. They built an organisation that has transformed the lives of thousands of people and I look forward to making my contribution towards the lives of people who choose to include Te Wānanga o Aotearoa in their educational journey. I would also like to acknowledge our Chairman, Richard Batley, and Te Mana Whakahaere (Council), as well as Te Taituarā (Deputy CEO), John Whaanga and our Tumu colleagues for their relentless commitment to our kaupapa. I also commend our kaimahi for their passion and constant focus on excellence in the delivery of our educational services to our tauira. Finally, I thank our tauira for choosing Te Wānanga o Aotearoa in their pursuit of knowledge.
11

A brief
historycelebrating years of Whānau transformation through education
1985 - 1995 1995 - 2005
Early in this decade, Te Wānanga o Aotearoa continued to take education to the people and opened campuses in Tokoroa, Gisborne, Palmerston North and Huntly. As always our goal was to reengage people in education to improve the lives of our tauira and their whānau.
In 1999, a Waitangi Tribunal Claim Wai718 was lodged on behalf of Te Tauihu o Ngā Wānanga. The Tribunal agreed that the Crown’s failure to provide capital funding to the three wānanga had constrained the three wānanga from providing education in a Māori context.
Rapid expansion followed which caused a period of explosive growth as tauira rushed to join our hugely popular programmes. Key among these were programmes that provided stepping stones into tertiary education, established foundation education skills, relinked tauira with
The Waipā Kōkiri Arts Centre quickly became popular with young people who recognised an opportunity to gain the skills they needed while learning in a nurturing and supportive environment.
In 1989, we changed our name to Aotearoa Institute and became the first NZQA registered private training establishment in the country. We began applying
for tertiary status as a wānanga and received this recognition in 1993 (after an amendment was made to the Education Act 1989) and changed our name to Te Wānanga o Aotearoa in 1994
Throughout this decade, our organisation significantly increased Māori participation at tertiary level by taking education to the people, opening educational facilities in Te Kuiti, Hamilton, Manukau and Rotorua.
O-Tāwhao Marae was opened on 27 April 1985. The concept of O-Tāwhao Marae grew out of the recognition of the large number of Māori students being expelled or disengaging from education in Te Awamutu. The success at O-Tāwhao Marae led the founders to identify a significant need for a more long-term solution – one that would provide tauira with the skills they needed to survive and flourish. As a result the Waipa Kōkiri Arts Centre was created.
12
TE
PŪ
RO
NG
O 2
01
4

celebrating years of Whānau transformation through education
2005 - 2015
For the period 2008 to 2013 we continued to reinforce our position by introducing new qualifications from certificate to masterate level, increasing tauira success and implementing quality systems that reflected tikanga Māori and āhuatanga Māori.
In 2014, Te Wānanga o Aotearoa embarked on an organisational realignment project called Te Raumairanga which aims to equip the organisation to respond to the rapidly changing environment and to future proof our organisation. Te Raumairanga aims to support the strategic focus areas of educational excellence, leadership, brand, communication and innovation to ensure we are on the pathway to achieving our 2030 Strategic Attributes.
their culture and motivated them towards employment. Te Wānanga o Aotearoa quickly became the largest tertiary institution in the country, growing from 1,008 tauira in 1999 to 66,756 in 2004.
This growth tested our systems and in 2005 the government appointed a Crown Manager to work with kaimahi to consolidate the organisation. At the same time a Waitangi Tribunal claim (Wai1298) was lodged challenging the government’s demands that Te Wānanga o Aotearoa limit access to its qualifications by non-Māori.
The organisation’s consolidation was completed in 2008 and Te Wānanga o Aotearoa turned its focus to increasing tauira success and implementing quality systems that were fit for the future and founded on mātauranga Māori.
13
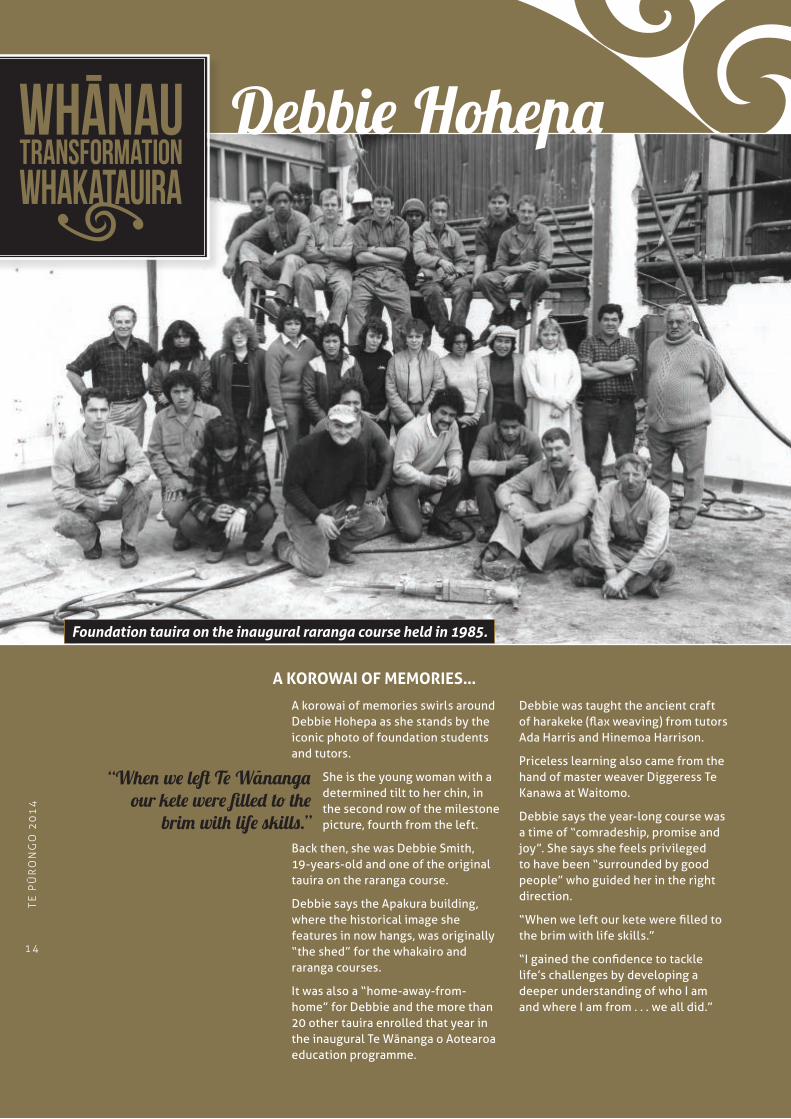
A korowai of memories swirls around Debbie Hohepa as she stands by the iconic photo of foundation students and tutors.
She is the young woman with a determined tilt to her chin, in the second row of the milestone picture, fourth from the left.
Back then, she was Debbie Smith, 19-years-old and one of the original tauira on the raranga course.
Debbie says the Apakura building, where the historical image she features in now hangs, was originally “the shed” for the whakairo and raranga courses.
It was also a “home-away-from-home” for Debbie and the more than 20 other tauira enrolled that year in the inaugural Te Wānanga o Aotearoa education programme.
“When we left Te Wa-nanga our kete were filled to the
brim with life skills.”
Foundation tauira on the inaugural raranga course held in 1985.
Debbie was taught the ancient craft of harakeke (flax weaving) from tutors Ada Harris and Hinemoa Harrison.
Priceless learning also came from the hand of master weaver Diggeress Te Kanawa at Waitomo.
Debbie says the year-long course was a time of “comradeship, promise and joy”. She says she feels privileged to have been “surrounded by good people” who guided her in the right direction.
“When we left our kete were filled to the brim with life skills.”
“I gained the confidence to tackle life’s challenges by developing a deeper understanding of who I am and where I am from . . . we all did.”
A KOROWAI OF MEMORIES…
Debbie Hohepa
14
TE
PŪ
RO
NG
O 2
01
4

Ko Kokatea te maunga > Ko Wairoa te awa > Ko Nga-ti Kahungunu te iwi
“I gained the confidence to tackle life’s challenges by developing a deeper understanding of who I am and where I am from . . . we all did.”
“I was privileged to be surrounded by good people in the class of 1985”
Those pioneering years at Te Wānanga o Aotearoa not only made a difference to her but to her family as they make their mark with their gifts.
Debbie herself was a formidable sportswoman who played NPC rugby for Waikato while husband, Selwyn, was a Waikato and New Zealand Maori rugby representative in 1989.
Now her two elder daughters, Carla (29) and Chyna (24), are New Zealand women’s rugby sevens representatives and former Black Ferns. Her son, Herewini (17), is a Waikato touch representative. And her youngest, Ngawaina (11) is already showing that she is set to follow in her siblings’ successful footsteps.
WHĀNAU TRANSFORMATION…A FAMILY OF CHAMPIONS
“They are my life’s legacy,” says Debbie. “I acknowledge my time at the wānanga and the values I gained there which are now my childrens’ values.
“My tutors taught me a lot about my culture but what I really appreciate is the fact it taught me through my culture.”
Ce
leb
rati
ng
30
ye
ars
of
wh
an
au
tra
nsf
orm
ati
on
th
rou
gh
e
du
cati
on
15

Sharon HoltSharon is non-Māori – but her love and knowledge of the language gained at Te Wānanga o Aotearoa has led her to develop her “Singalong” books designed to encourage a new generation to learn te reo.
Sharon Holt writes fiction, non-fiction, plays and poems for young children. Two of her picture books, Uncle Hone’s Cloak, and Off you Go, Auntie Ma!, were long-listed for the Esther Glen Award - the longest running and most renowned literary prize for New Zealand children’s literature.
Since 2011, Sharon has been working full time on her Te Reo Singalong series of children’s picture books and CDs. The books aim to make it easy for parents and teachers of early childhood and lower primary school aged children to use te reo – even if they have no former knowledge of the language.
As well as improving te reo Māori pronunciation, the books extend the knowledge and use of basic sentence structure in te reo. The first three books – Maranga Mai, Kei te Peke Ahau and Anei Kē – were published in 2011-2012 and Me Haere was published in June 2013. She originally wrote the series to make it easier for non-Māori to pronounce te reo, but has found the books are just as popular with kohanga reo and kura kaupapa Māori teachers, parents and children. The series was a finalist in the 2012 Māori Language Awards.
“I felt really welcome like I was part of the family – I felt so much like I had found my home.”
TE ARA REO COURSE INSPIRES TE REO SINGALONG BOOKS
As you watch Sharon Holt wave her hands furiously about one thing becomes clear – she’s a passionate advocate for Te Reo Māori.
And for a middle-aged Pākeha woman who admitted to “not even knowing how to pronounce the word Māori” but now publishes award-winning children’s books in te reo Māori, that’s a big deal.
Mrs Holt, who these days pens her Te Reo Singalong books for children from her Hamilton home, credits a Te Ara Reo Māori class she took at Te Wānanga o Aotearoa in 2002 for changing her life’s direction.
Then a housewife and a part-time kindergarten teacher in Kihikihi, Mrs Holt went along to the programme after a neighbour encouraged her to do so.
“I’ve always been interested in other languages but te reo Māori is a New Zealand language that I didn’t know anything about.
“I felt really welcome like I was part of the family – I felt so much like I had found my home.”
After topping her Te Ara Reo Māori level one class she studied for the advanced certificate.
“I was pulled to learn te reo Māori. I completely credit te wānanga with where I am at now.”
At the end of 2012, Mrs Holt left her job as a librarian as the demands of writing, publishing and marketing her books became a full time job.
2002 Te Ara Reo Māori class of 2002
2003 Te Ara Reo Advanced Certificate
qualifications
Sharon Holt’s passion for Te Reo Māori turns to award-winning children’s author.
16
TE
PŪ
RO
NG
O 2
01
4

“I know I’m on my path now – somehow I was pulled to learn Te Reo Ma-ori. I do completely credit the Wa-nanga with where I am at now.”
17

A PASSION FOR TE REO LEADS TO A NEW CAREER
Teaching Te Reo at Palmerston North Girls’ High School is a far cry from the daily grind of loading and emptying trucks as a forklift driver.
But that is the journey Kevin Waho embarked on when he enrolled at Te Wānanga o Aotearoa’s Te Ara Reo Māori course in 2002.
He was in his late thirties and was ready for a new direction.
As he studied at Te Wānanga his passion for the language grew. He realised that, if he wanted to fulfil his dream, he’d have to give up his job to study fulltime. And, with the support and sacrifice of his whānau, that’s exactly what he did.
After two years study at Te Wānanga o Aotearoa Kevin graduated with Te Tohu Mātauranga – a diploma in Te Ara Reo Māori.
It was that which prepared him for the next step in his journey. He was advised to pursue his passion for the language at Te Kupenga o Te Mātauranga – Massey University’s teachers’ college.
Four years later Kevin graduated from teachers college. He was soon recruited by Palmerston North Girls’ High School who were impressed by his life experience and work ethic.
Through his major change in life direction Kevin now feels he is making a difference with young Māori, their learning and their future – and aims to instil his passion for Te Reo in his students.
From Ngāti Tuwharetoa on his mother’s side and Ngāti Rangi (Whanganui) on his dad’s, Kevin had a yearning to learn Te Reo Māori. He credits his time at Te Wānanga o Aotearoa as the catalyst for major change for both himself and his whānau.
Kevin Waho
2004
Graduate Te Tohu Mātauranga, TWOA
2014
Head of Department Māori Studies and Dean of Y11 at Palmerston North Girls’ High School.
2002 Certificate in Te Ara Reo Māori: Te Wānanga o Aotearoa
2003 Advanced Certificate in Te Ara Reo Māori: Te Wānanga o Aotearoa
2004 Te Tohu Mātauranga: Diploma in Te Ara Reo Māori
2007 Mauri Ora – Diploma in Teaching: Massey University Te Kupenga o Te Mātauranga
qualifications
18
TE
PŪ
RO
NG
O 2
01
4

Kevin Waho’s passion for Te Reo Māori turns to passing on his knowledge of the language.
19

Our brand and communication activities will clarify what we have to offer as a leading Māori development organisation and what we stand for – WHĀNAU TRANSFORMATION THROUGH EDUCATION. Innovation is crucial to achieving autonomy and we will identify innovative revenue streams that will enable Te Wānanga o Aotearoa to achieve a higher level of independence and continue to respond to the needs of our people.
futureTE WĀNANGA O AOTEAROA CONTINUES
TO EXPLORE WHAT IT MEANS TO BE A
THAT IS AT THE FOREFRONT OF INDIGENOUS DEVELOPMENT.
Twenty-first Century, values-driven,
Māori organisation
Our
20
TE
PŪ
RO
NG
O 2
01
4

Our
qualificationsAS IN PREVIOUS YEARS, TE WĀNANGA O AOTEAROA HAS CONTINUED TO OFFER A BROAD RANGE OF QUALIFICATIONS THAT ASSIST TAUIRA AND THEIR FAMILIES TO BEGIN THEIR TRANSFORMATIVE JOURNEY. WE DELIVER MORE THAN FIFTY QUALIFICATIONS ACROSS EIGHT AREAS, OR MARAU. THE EIGHT MARAU ARE:
Tūāpapa Foundation
Te Reo Rangatira
Māori Language
Angitū
Māori and Indigenous People’s Development
Te Arawhānui
Business, Computing and Innovation
Hauora
Health and Fitness
Toi
Māori and Indigenous Art
Te Hiringa
Education and Social Services
Umanga
Professional Skills, Trades and Vocations
21

The members of Te Mana
Whakahaere are dedicated to
governing Te Wānanga o Aotearoa
to achieve the objectives of the
organisation in accordance with
the statutory and regulatory
obligations applicable to tertiary
institutions and Crown entities.
The membership of Te Mana
Whakahaere is determined by the
Constitution and the Education
Act 1989 section 171. The
members of Te Mana Whakahaere
come from a broad range of
backgrounds and are selected for
the knowledge and value they can
bring to the strategic direction
and governance of Te Wānanga
o Aotearoa.
Mahi WhakahaereNgā
Governance
Manaoterangi ForbesDip in Te Arataki Manu Kōrero, DipTchg
Ngāti Maniapoto, Tainui
Co-opted member
Sir Dr Toby CurtisDip Tchg, BA, MA, PhD
Deputy ChairNgāti Rongomai, Te Arawa
Co-opted member
Dr Kathie IrwinPoupou Karanga Certificate, DipTchg, DipTchEd, BEd
(Massey), BEd (Hons) 1st class, MEd (Massey), PhD,
Rakaipaaka, Ngāti Kahungunu, Ngāti Porou
Ministerial appointment
Associate Professor Dr Manuka HenareBA (Hons) (VUW), PhD,
Te Rawara, Te Aupōuri, Ngāti Kuri
Ministerial appointment
Richard BatleyBMS, CA,
ChairNgāti Tama, Ngāti Maniapoto, Waikato, Raukawa
Co-opted member
Peter JosephTe Arawa, Tūhourangi, Ngāti Pikiao
Co-opted member – NZCTU nominated22
TE
PŪ
RO
NG
O 2
01
4

Marie Panapa, JPBEd (Massey)
Te Ātiawa, Taranaki
General staff elected member
Karu Fred PotiniBEd, PGDip Indigenous Studies
Ngāti Porou, Te Aitanga a Hauiti, Ngāti Apa ki te Rā Tō
Academic staff elected member
Colleen TuutaNgāti Mahuta, Ngāti Mutunga, Te Ātiawa, Taranaki
Co-opted member
Jim MatherBBus, MBA, ACA
Te Taiurungi / Chief ExecutiveNgāti Awa, Ngāi Tūhoe
Ex-officio member
Tukoroirangi MorganWaikato, Ngāti Mahuta, Ngāti Makirangi, Ngāti Te Ata
Co-opted member – Kīngitanga nominated
Rea Wikaira
ONZM JP, Ngāpuhi Dip. BMS,
Tainui, Maniapoto, Ngāpuhi
Ministerial appointment
Karl WixonDipID, PDINZ
Ngāi Tahu, Kāti Māmoe, Waitaha, Ngāti Toa Rangatira, Moriori
Ministerial appointment
During 2014, the following members completed
their tenure with Te Mana Whakahaere
Tania HodgesMinisterial appointment
Angelina MatekohiTauira elected member
Sarah RapiraTauira elected member
Toni IwikauAcademic staff elected member
Reverend Te Napi WaakaCo-opted member
23
Me
mb
ers
of
Te M
an
a W
ha
ka
ha
ere
Ngā TumuExecutive Directors
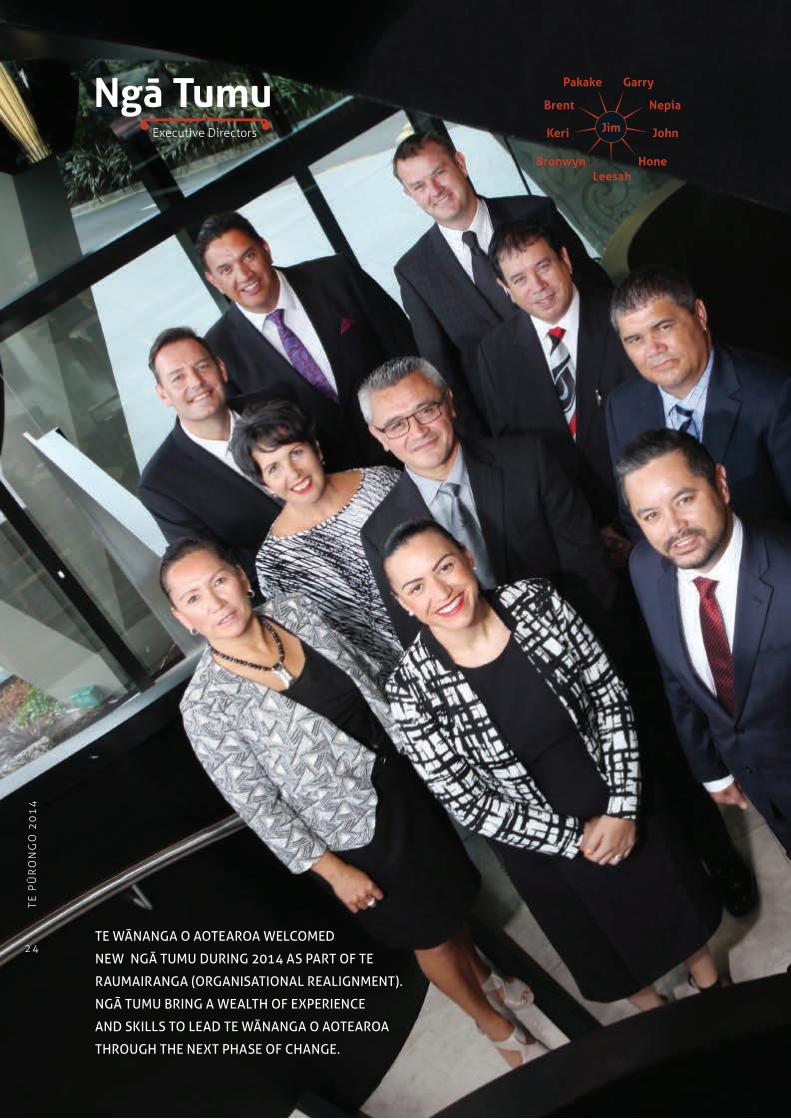
TE WĀNANGA O AOTEAROA WELCOMED
NEW NGĀ TUMU DURING 2014 AS PART OF TE
RAUMAIRANGA (ORGANISATIONAL REALIGNMENT).
NGĀ TUMU BRING A WEALTH OF EXPERIENCE
AND SKILLS TO LEAD TE WĀNANGA O AOTEAROA
THROUGH THE NEXT PHASE OF CHANGE.
LeesahHoneBronwyn
Keri
Brent Nepia
John
Pakake Garry
Jim
24
TE
PŪ
RO
NG
O 2
01
4
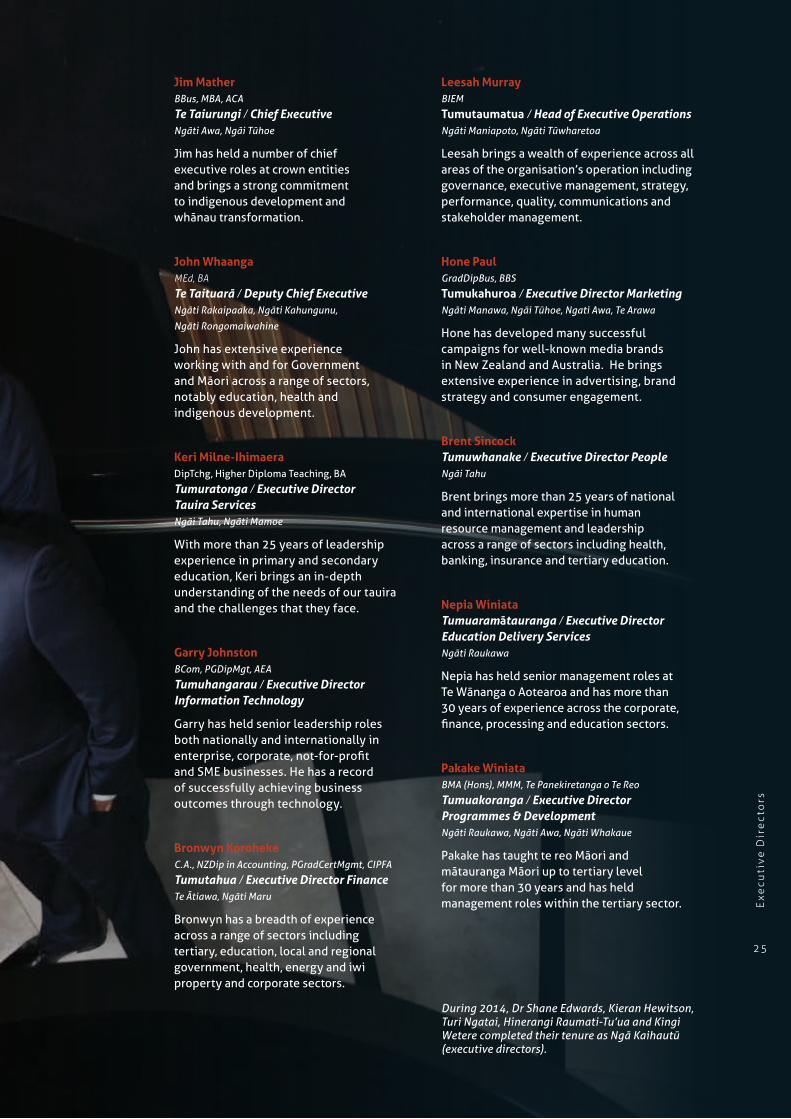
Jim MatherBBus, MBA, ACA
Te Taiurungi / Chief ExecutiveNgāti Awa, Ngāi Tūhoe
Jim has held a number of chief executive roles at crown entities and brings a strong commitment to indigenous development and whānau transformation.
John WhaangaMEd, BA
Te Taituarā / Deputy Chief ExecutiveNgāti Rakaipaaka, Ngāti Kahungunu,
Ngāti Rongomaiwahine
John has extensive experience working with and for Government and Māori across a range of sectors, notably education, health and indigenous development.
Keri Milne-IhimaeraDipTchg, Higher Diploma Teaching, BA
Tumuratonga / Executive Director Tauira ServicesNgāi Tahu, Ngāti Mamoe
With more than 25 years of leadership experience in primary and secondary education, Keri brings an in-depth understanding of the needs of our tauira and the challenges that they face.
Garry JohnstonBCom, PGDipMgt, AEA
Tumuhangarau / Executive Director Information Technology
Garry has held senior leadership roles both nationally and internationally in enterprise, corporate, not-for-profit and SME businesses. He has a record of successfully achieving business outcomes through technology.
Bronwyn KorohekeC.A., NZDip in Accounting, PGradCertMgmt, CIPFA
Tumutahua / Executive Director FinanceTe Ātiawa, Ngāti Maru
Bronwyn has a breadth of experience across a range of sectors including tertiary, education, local and regional government, health, energy and iwi property and corporate sectors.
During 2014, Dr Shane Edwards, Kieran Hewitson, Turi Ngatai, Hinerangi Raumati-Tu’ua and Kingi Wetere completed their tenure as Ngā Kaihautū (executive directors).
Leesah MurrayBIEM
Tumutaumatua / Head of Executive OperationsNgāti Maniapoto, Ngāti Tūwharetoa
Leesah brings a wealth of experience across all areas of the organisation’s operation including governance, executive management, strategy, performance, quality, communications and stakeholder management.
Hone PaulGradDipBus, BBS
Tumukahuroa / Executive Director MarketingNgāti Manawa, Ngāi Tūhoe, Ngati Awa, Te Arawa
Hone has developed many successful campaigns for well-known media brands in New Zealand and Australia. He brings extensive experience in advertising, brand strategy and consumer engagement.
Brent SincockTumuwhanake / Executive Director PeopleNgāi Tahu
Brent brings more than 25 years of national and international expertise in human resource management and leadership across a range of sectors including health, banking, insurance and tertiary education.
Nepia WiniataTumuaramātauranga / Executive Director Education Delivery ServicesNgāti Raukawa
Nepia has held senior management roles at Te Wānanga o Aotearoa and has more than 30 years of experience across the corporate, finance, processing and education sectors.
Pakake WiniataBMA (Hons), MMM, Te Panekiretanga o Te Reo
Tumuakoranga / Executive Director Programmes & DevelopmentNgāti Raukawa, Ngāti Awa, Ngāti Whakaue
Pakake has taught te reo Māori and mātauranga Māori up to tertiary level for more than 30 years and has held management roles within the tertiary sector. E
xecu
tiv
e D
ire
cto
rs
25

6,237EFTS
1,900EFTS
2,542EFTS
Ngā rohe me ngā whareRegions and sites
Tāmaki Makaurau/Te Tai Tokerau
Tainui
Waiariki
Te Tai Tonga
Papaiōea
Whirikoka
Educational delivery is managed within
(regions) that extend across the length and breadth of Aotearoa New Zealand. Face-to-face delivery at rohe is supported by Open Wa-nanga, which delivers home-based learning for those who cannot attend a local delivery site. Each rohe has its own essence that reflects the needs of the iwi and tauira who reside there.
1,082EFTS
1,888EFTS
2,885EFTS
six rohe
4,165 EFTS
Open Wānanga
26
TE
PŪ
RO
NG
O 2
01
4
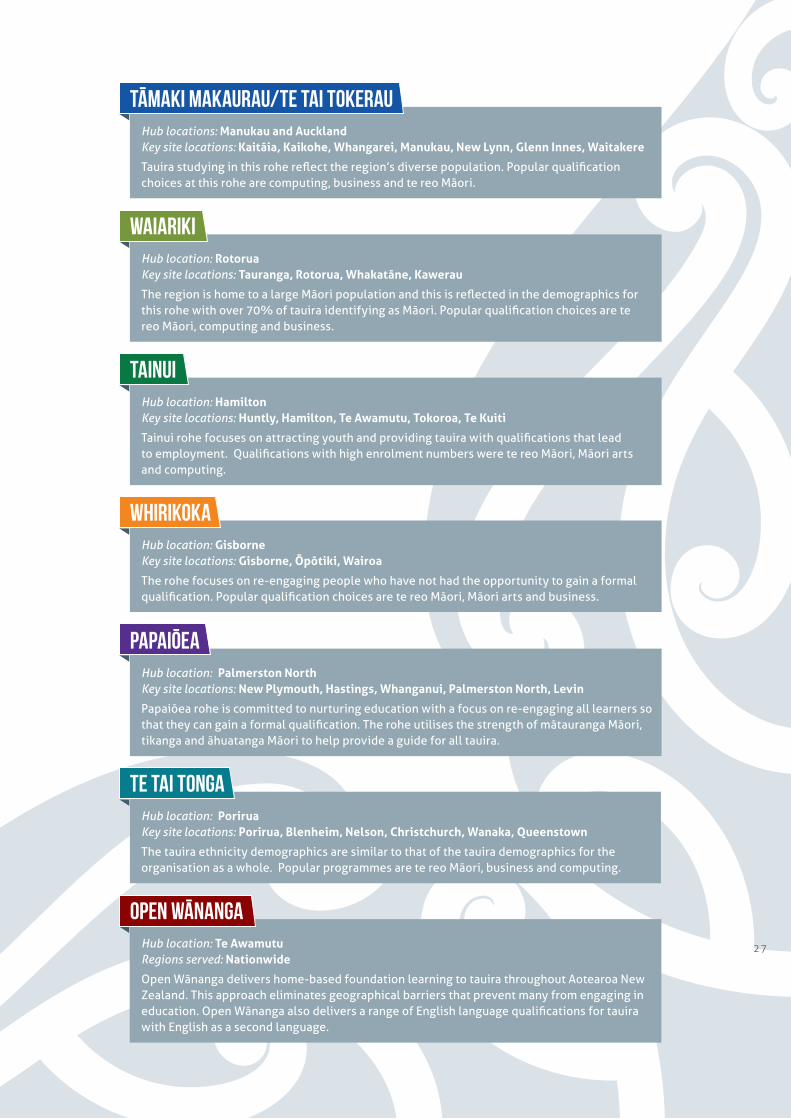
Open WānangaHub location: Te Awamutu Regions served: Nationwide
Open Wānanga delivers home-based foundation learning to tauira throughout Aotearoa New Zealand. This approach eliminates geographical barriers that prevent many from engaging in education. Open Wānanga also delivers a range of English language qualifications for tauira with English as a second language.
Tāmaki Makaurau/Te Tai TokerauHub locations: Manukau and Auckland Key site locations: Kaitāia, Kaikohe, Whangarei, Manukau, New Lynn, Glenn Innes, Waitakere
Tauira studying in this rohe reflect the region’s diverse population. Popular qualification choices at this rohe are computing, business and te reo Māori.
WhirikokaHub location: Gisborne Key site locations: Gisborne, Ōpōtiki, Wairoa
The rohe focuses on re-engaging people who have not had the opportunity to gain a formal qualification. Popular qualification choices are te reo Māori, Māori arts and business.
TainuiHub location: Hamilton Key site locations: Huntly, Hamilton, Te Awamutu, Tokoroa, Te Kuiti
Tainui rohe focuses on attracting youth and providing tauira with qualifications that lead to employment. Qualifications with high enrolment numbers were te reo Māori, Māori arts and computing.
PapaiōeaHub location: Palmerston North Key site locations: New Plymouth, Hastings, Whanganui, Palmerston North, Levin
Papaiōea rohe is committed to nurturing education with a focus on re-engaging all learners so that they can gain a formal qualification. The rohe utilises the strength of mātauranga Māori, tikanga and āhuatanga Māori to help provide a guide for all tauira.
Te Tai TongaHub location: Porirua Key site locations: Porirua, Blenheim, Nelson, Christchurch, Wanaka, Queenstown
The tauira ethnicity demographics are similar to that of the tauira demographics for the organisation as a whole. Popular programmes are te reo Māori, business and computing.
WaiarikiHub location: RotoruaKey site locations: Tauranga, Rotorua, Whakatāne, Kawerau
The region is home to a large Māori population and this is reflected in the demographics for this rohe with over 70% of tauira identifying as Māori. Popular qualification choices are te reo Māori, computing and business.
27

tauiraNgā
Our students
Our strategic destination – Whānau transformation through education articulates our desire to support our tauira to make positive changes to their lives and those of their whānau.
To achieve this we are dedicated to promoting, providing and ensuring access to education. As part of this commitment, we encourage access by priority groups (Māori, Pasifika and under-25 year olds) and those who have not had the opportunity to successfully engage in education in their past. This means that our tauira demographic is diverse with many tauira having no previous qualifications and coming from all age groups. This diversity brings rich learning experiences for all tauira and challenges our organisation to provide appropriate pastoral care and academic support to ensure that tauira can succeed.
We are humbled by the transformational changes our tauira achieve and are grateful for the role that we are able to play in their educational journey.
Data for the period 2010 to 2013 includes Student Achievement Component (SAC) funded only tauira. wIn 2014 tauira data from all funding sources has been included. Data for disabilities and prior qualification attainment is based on head count whilst the other data is based on Equivalent Full Time Students (EFTS).
28
TE
PŪ
RO
NG
O 2
01
4

In 2014, the proportion of tauira aged under 25 years increased by 1% percentage point compared with 2013. The increase reflects a focus on engaging more youth in education.
Tauira engagement is measured by the number of tauira enrolling at Te Wānanga o Aotearoa and the number of EFTS consumed each year. During 2014, the number of tauira and consumed EFTS remained relatively static. The following charts show the five year trend for tauira head count and EFTS.
20102011201220132014
35,99132,50032,372
31,80832,235
Number of Tauira
Our ability to attract a high proportion of females continued in 2014 with 69% of the tauira population being female. The following chart shows the five year trend for gender profile of tauira.
Under 25 years
40 Years +25 to 39 years
ENGAGEMENT
gender
AGE
31% 69%
2014
31% 69%
2013
32% 68%
2010
31% 69%
2011
29% 71%
2012
2013
16%
52%32%
15%
53%32%2011
2014
17%
51%32%
14%
53%33% 2012
14%
52%34% 2010
Consumed EFTS
2010 21,6602011 20,4172012 20,49420132014
20,68020,701
29

Te Wānanga o Aotearoa is the largest single provider of tertiary education to Māori in Aotearoa New Zealand with 17,414 (54%) indicating they had Māori ancestry. Tauira ethnicity has remained relatively constant over the period 2010 to 2014.
The proportion of tauira who indicated they had a disability increased by 2 percentage points compared with 2013. To reduce barriers and provide equitable access we ensure that these tauira have access to facilities, resources and support systems.
NB: These figures do not add up to 100% as a person can select more than one ethnicity.
12%
2010
15%
2011
17%
2012
16%
2013
18%
2014
PasifikaEuropean
AsianOther
MāORI
Ethnicity
Disabilities
Prior activity of tauira has remained relatively static since 2010 with 51% (29% non-workforce, 19% tertiary student and 3% secondary) of tauira indicating they were not in the workforce prior to enrolling with Te Wānanga o Aotearoa.
WorkforceTertiary student
secondaryoverseas
NON-workforce
other
30% 49% 16% 2% 2% 1%2010
201133% 45% 17% 2% 2% 1%
201327% 50% 20% 2% 1%
201230% 51% 16% 2% 1%
201429% 47% 19% 3% 1% 1%
Prior activity10%50%
14%33%
10%
2011
11%51%
14%32%
10%
10%48%
15%41%
4%
2012
10%48%
14%37%
3%
2013
2014
11%
12%36%
3%
54%
2010
Te Wānanga o Aotearoa continued to attract tauira who had not had the opportunity to obtain a qualification at secondary school or tertiary level. These tauira have and will continue to be our key focus as we seek to bring about whānau transformation through education.
35% 31% 33% 35% 40%
2010 2011 2012 2013 2014The proportion of tauira who had not achieved secondary or tertiary qualification.
Prior qualification attainment
30
TE
PŪ
RO
NG
O 2
01
4

kaimahiNgā
Our staff members
Our commitment to ensuring equal opportunities for our tauira extends to ensuring equal opportunities for our kaimahi. Some of our initiatives include family-friendly working environments and support for kaimahi to undertake further studies or professional development.
Each year, Te Wānanga o Aotearoa completes an organisational climate survey called Wānanga Ora. The survey helps us gather information on kaimahi understanding of the organisation’s strategic direction, values, goals, performance and satisfaction levels.
Job satisfaction measures remained similar to previous years with 91% of kaimahi saying that they were proud to work for Te Wānanga o Aotearoa and 91% of kaimahi saying that their work was significant to them.
kaimahi saying they were proud to work for Te Wānanga o Aotearoa
91%
91%kaimahi saying that their work was significant to them
Wānanga Ora
31
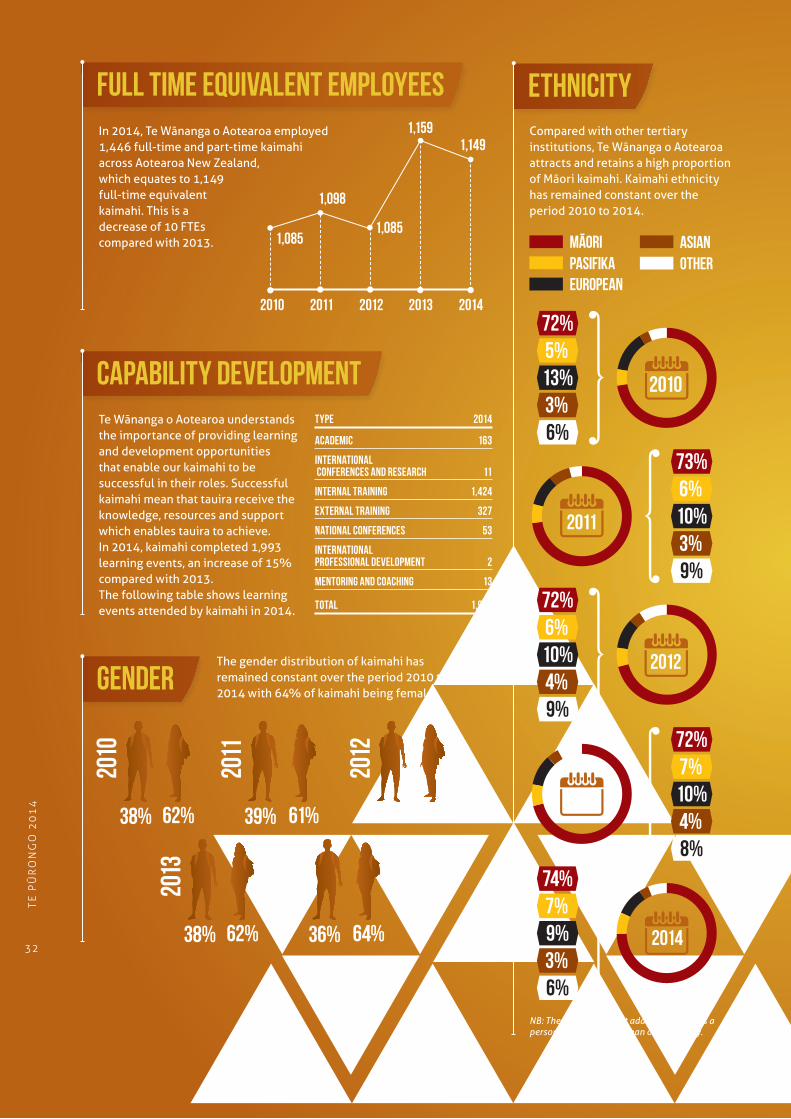
Compared with other tertiary institutions, Te Wānanga o Aotearoa attracts and retains a high proportion of Māori kaimahi. Kaimahi ethnicity has remained constant over the period 2010 to 2014.
NB: These figures do not add up to 100% as a person can select more than one ethnicity.
PasifikaEuropean
AsianOther
MāORI
In 2014, Te Wānanga o Aotearoa employed 1,446 full-time and part-time kaimahi across Aotearoa New Zealand, which equates to 1,149 full-time equivalent kaimahi. This is a decrease of 10 FTEs compared with 2013.
2010 2011 2012 2013 2014
1,0851,085
1,1591,149
1,098
Full time equivalent employees
The gender distribution of kaimahi has remained constant over the period 2010 to 2014 with 64% of kaimahi being female.
36% 64%
2014
38% 62%
2013
38% 62%
2010
39% 61%
2011
37% 63%
2012
gender
Ethnicity
5%72%
3%13%
6%
2011
6%73%
3%10%
9%
6%72%
4%10%
9%
7%72%
4%10%
8%
7%
3%9%
6%
74%
2010
2012
2013
2014
Capability developmentTe Wānanga o Aotearoa understands the importance of providing learning and development opportunities that enable our kaimahi to be successful in their roles. Successful kaimahi mean that tauira receive the knowledge, resources and support which enables tauira to achieve. In 2014, kaimahi completed 1,993 learning events, an increase of 15% compared with 2013.The following table shows learning events attended by kaimahi in 2014.
TYPE 2014
Academic 163
International conferences and research 11
internal training 1,424
external training 327
national conferences 53
international professional development 2
mentoring and coaching 13
total 1,993
32
TE
PŪ
RO
NG
O 2
01
4

ine whakaritengaMeasuring our performance
Te
Our frameworks for measuring our
performance as an organisation include
Te Huanganui (Outcomes Framework),
Statements of Service Performance
and Investment Plan Commitments.
Te Huanganui measures the progress
against the outcomes we are seeking to
achieve, whilst the Statement of Service
Performance monitor progress against
the output indicators the financial cost
of achieving them. Investment Plan
Commitments are the organisation’s key
performance indicators negotiated as part
of the Investment Plan process.
33

Te Huanganui describes our organisation’s achievements within a societal context. That is, the contributions Te Wānanga o Aotearoa make interacting with the communities within which we operate. The name Te Huanganui refers to the wider benefits or advantages that result from our work, but more literally, the fruits of our labours.
Te Huanganui describes what we deliver as a tertiary education provider through our output and impact indicators. Our outcome statements and indicators express the long-term effects we are seeking to contribute to society. Outcomes are aligned with the strategic attributes detailed in our Te Rautakinga (our strategic plan). The following diagram shows the structure of Te Huanganaui and the relationships between outputs, impacts and outcomes.
huanganuiOutcomes framework
Te
Ngā putangaOur OutcomesWhat we seek to influence or contribute to
Ahurea CulturalMātauranga Māori is advanced
Hāpori CommunitySocial well-being for all New Zealanders
Arumoni CommercialEconomic well-being for all New Zealanders
Ngā pāngaOur ImpactsThe difference we want to make
• All New Zealanders are motivated to engage with Mātauranga Māori
• Graduates are secure and confident in mātauranga Māori
• Rangahau advances mātauranga Māori
• Graduates have highly-valued relevant skills
• Graduates make positive contributions to their iwi, hapū or community
• Graduates are sought after by industry
• Graduates have opportunities for economic advancement
• Te Wānanga o Aotearoa is operated in a sustainable manner
Ngā huaOur OutputsWhat we will deliver
• Te Wānanga o Aotearoa delivers high quality and relevant mātauranga Māori qualifications
• Te Wānanga o Aotearoa rangahau contributes to the store of knowledge
• Te Wānanga o Aotearoa delivers educational excellence
• Te Wānanga o Aotearoa serves our diverse communities
• Te Wānanga o Aotearoa provides clear vocational pathways
• Te Wānanga o Aotearoa meets agreed financial ratios
Ngā mahiOur InputsWhat we will input
Enriched tauira experiencesHigh quality Ako Wānanga teaching capability and support
High quality mix of provision and educational pathways
Effective leadershipStrong reputation and brand
Effective communication
Innovation and alternative revenue streams
Whānau transformation through educationAchieved by providing effective leadership to develop, communicate and implement agreed strategic plans with interconnected commercial, cultural and community objectives and milestones.
Cultural social and economic prosperity approaches the well-being of people in a holistic manner recognising that focusing on one area at the expense of others will not create an equitable society.
34
TE
PŪ
RO
NG
O 2
01
4

Ngā Hua: Ahurea Outcome: Mātauranga Māori is advanced
Ahurea represents the ideal of advancing mātauranga Māori to provide the foundation for Māori to succeed as Māori in Aotearoa New Zealand and as global citizens of the twenty-first century. For Te Wānanga o Aotearoa, advancing mātauranga Māori includes both the dissemination of knowledge and the generation of contemporary knowledge of our language, culture and heritage within a te ao Māori worldview. Mātauranga Māori provides the lens to realise the potential inherent in traditional and contemporary knowledge bases to transform the lives of Māori and all New Zealanders.
The focus of the outcome and impact indicators is to strengthen and advance mātauranga Māori for the
benefit of all people. Although the impact targets for this output class were not achieved in 2014, the proportion of tauira indicating an increased understanding of mātauranga Māori was maintained. The qualification completion rate for mātauranga Māori qualifications came within 5% of the target. The decrease in the completion rate is in part caused by a change in government policy which had the effect of changing our tauira demographic. The number of rangahau outputs produced by graduates was 23 and is within acceptable tolerances.
The following outcome and impact indicators show how we measure progress towards achieving this outcome.
Ngā Hua (Outcome)
Performance indicators Trend to date
Current Target 2030
Mātauranga Māori is advanced
1.1 The proportion of Māori who can speak some te reo Māori1 k 21% 40%
1.2 The proportion of the population in Aotearoa New Zealand who can hold a conversation in te reo Māori1
k 3% 6%
Ngā Pānga (Impacts)
Performance indicators Actual Targets
2013 2014 2014 2015 2016
All New Zealanders are motivated to engage with mātauranga Māori
1.3 Successful qualification completion rate for mātauranga Māori qualifications
80% 69% 80% 80% 80%
Graduates are secure and confident in mātauranga Māori
1.4 Proportion of tauira who confirm an increased understanding of mātauranga Māori
77% 77% 80% 83% 86%
Rangahau advances mātauranga Māori
1.5 Number of rangahau outputs produced for iwi, hapū or communities by graduates enrolled in the He Waka Hiringa qualification
New measure
23 30 30 30
1 2013 Census Data
35
Ma
na
gin
g o
ur
pe
rfo
rma
nce

Ngā Hua (Outcome)
Performance indicators Trend to date
Current Target 2030
Social well-being for all New Zealanders
2.1 The proportion of Māori satisfied with life overall2 k 80% 88%
2.2 The proportion of all New Zealanders satisfied with life overall2
k 86% 88%
Ngā Pānga (Impacts)
Performance indicators Actual Targets
2013 2014 2014 2015 2016
Graduates have highly-valued relevant skills
2.3 Qualification completion rate 79% 71% 80% 82% 82%
2.4 Progression rate for tauira at NQF levels 1 to 2
42% 50% 42% 42% 43%
2.5 Proportion of tauira retained in study
75% 76% 75% 76% 77%
Graduates make positive contributions to their iwi, hapū or community
2.6 The proportion of tauira who confirm that they are using their knowledge and skills within their whānau, hapū, iwi or community
N/A 79% 75% 80% 80%
Relationships with stakeholders return benefits for all parties
2.7 Stakeholders express satisfaction with Te Wānanga o Aotearoa.
81% Not measured
85% 85% 90%
Ngā Hua: Hapori Outcome: Social well-being for all New Zealanders
Hāpori reflects our desire to improve social well-being resulting in more equitable societies in which all New Zealanders have access to opportunities and are supported to succeed. We believe that we can achieve this by serving diverse communities which often experience inequity across all areas of their lives and ensuring that barriers to education are reduced. Social well-being can also be realised by ensuring our tauira have skills that are relevant to them and for the communities in which they live.
In 2014, Te Wānanga o Aotearoa achieved 3 of the 5 impact indicators. Encouragingly the proportion of tauira who were using their knowledge and skills exceeded the target by 4%. In addition, the target for the proportion of tauira progressing from level
1 and 2 qualifications to higher levels increased by 8% and the proportion of tauira retained in study at 76% was maintained.
Qualification completion was under target. In the main this was caused by a change in government policy at level 1 and 2 which in turn changed the demographics of tauira resulting in an increase in the number of tauira with no qualifications . Due to organisational change, stakeholder satisfaction was not measured in 2014 and therefore indicator 2.7 was not measured.
The following outcome and impact indicators show how we measure progress towards achieving this outcome.
2 2012 NZ social indicators He kete tatauranga
36
TE
PŪ
RO
NG
O 2
01
4

Ngā Hua: Arumoni Outcome: Economic well-being for all New Zealanders
Arumoni recognises the interconnectedness between mātauranga Māori, the strength of communities and economic well-being. It is this holistic approach that ensures that we move past a pure economistic view to a Māori development approach that enables transformation within a mātauranga Māori context. Arumoni focuses on both tauira and Te Wānanga o Aotearoa as an organisation to ensure that Ahurea and Hāpori outcomes can be achieved.
Te Wānanga o Aotearoa has achieved 4 of the impact indicators. The indicators that were achieved
relate to quality education, financial stability and tauira retention.
As discussed above, the qualification completion rate was not achieved. The proportion of graduates who gained employment or additional responsibility was 5% less than the target but is still a reasonable achievement at 60%.
The following indicators show how we measure progress towards achieving our goals for this outcome.
Ngā Hua (Outcome)
Performance indicators Trend to date
Current Target 2030
Economic well-being for all New Zealanders
3.1 The difference between the weekly income for Māori and non-Māori3
k ($151) ($50)
3.2 The Gini Coefficient for Aotearoa New Zealand improves4 k .32 Improvement
Ngā Pānga (Impacts)
Performance indicators Actual Targets
2013 2014 2014 2015 2016
Graduates are sought after by industry
3.3 Proportion of graduates who gain employment or additional responsibility in employment
64% 60% 65% 65% 65%
2.3 Qualification completion rate 79% 71% 80% 82% 82%
2.5 Proportion of tauira retained in study
76% 76% 75% 76% 77%
Te Wānanga o Aotearoa is operated in a sustainable manner
3.4 Risk rating under the Financial Monitoring Framework
Low Low Low Low Low
1.7 External Evaluation and Review (EER) finding for capability in self-assessment
Confident Confident Confident Confident Confident
1.8 External Evaluation and Review (EER) finding for capability in educational performance
Highly confident
Highly confident
Confident Confident Confident
3 NZ Income Survey: June 2014 quarter – Statistics NZ4 OECD statistics 2011 - http://www.oecd.org/statistics/compare-your-country.htm
37
Ma
na
gin
g o
ur
pe
rfo
rma
nce

Ngā Putanga (Outputs)
Performance indicatorsActual Targets
2013 2014 2014 2015 2016
Te Wānanga o Aotearoa delivers high quality and relevant mātauranga Māori qualifications
1.6 External Evaluation and Review (EER) finding for capability in self-assessment
Confident Confident Confident Confident Confident
1.7 External Evaluation and Review (EER) finding for capability in educational performance
Highly confident
Highly confident
Confident Confident Confident
1.8 Proportion of tauira who are satisfied or highly satisfied with their experience at Te Wānanga o Aotearoa
93% 92% 95% 95% 95%
Te Wānanga o Aotearoa rangahau contributes to the store of knowledge
1.9 Number of rangahau outputs 185 363 200 220 220
1.10 Number of EFTS enrolled in He Waka Hiringa qualification
38 28 30 40 35
Output class: Ahurea Cultural
This output class relates to the delivery of high-quality mātauranga Māori based qualifications and rangahau activity. Initiatives and activities related to this output class included:
• Strengthening mātauranga Māori through building rangahau capability and sharing this knowledge through publication and presentation.
• Delivering high-quality mātauranga Māori qualifications that provide cultural capital and expand the knowledge of both Māori and non-Māori in Aotearoa New Zealand.
• Continuing to deliver He Waka Hiringa to the first cohort of tauira whom graduated in 2014.
• Developing the Ako Wānanga Framework as a
benchmark for teaching and learning within a wānanga environment.
Three of the indicators in this output class were achieved. In 2013, the New Zealand Qualifications Authority (NZQA) awarded Te Wānanga o Aotearoa ratings of confident and highly confident in the External Evaluation and Review. These ratings reflect the organisation’s focus on delivering quality education.
The indicators that were not achieved are within acceptable tolerances are tauira satisfaction (indicator 1.8) and number of EFTS enrolled in He Waka Hiringa. The tauira satisfaction level was less than the target but still within acceptable levels at 92%.
taurangiStatement of Service Performance
Ngā kī
Cost of Service statement for Ahurea (Cultural)For the year ended 31 December 2014
Group 2014 $000
Group 2013 $000
Parent 2014 $000
Parent 2013 $000
Revenue 49,634 47,169 68,311 64,974
Expenditure 47,385 44,557 60,441 59,365
Operating net cost of service 2,249 2,612 7,870 5,60938
TE
PŪ
RO
NG
O 2
01
4

Output class: Hapori Community
This output class relates to the delivery of qualifications outside the mātauranga Māori curriculum and includes foundation and computing qualifications. Strategies to support this output class include:
• Utilising the Ako Wānanga framework to ensure tauira have a positive and successful educational experience.
• Focusing all kaimahi on how they can contribute to educational excellence.
• Delivering qualifications to attract and retain priority learners that provide pathways to employment or further study.
Te Wānanga o Aotearoa met or exceeded the targets for 4 of the indicators. Priority learners are a focus for Te Wānanga o Aotearoa. We were encouraged by the increase in the proportion of Māori (+4%) and Pasifika (+1%) tauira choosing to study at Te Wānanga o Aotearoa. As discussed above, the organisation was awarded ratings of confident and highly confident in the last EER completed by the NZQA as a reflection of the quality educational delivery.
Although, the tauira satisfaction under the target, the result is at an acceptable level and compares favourably with other tertiary education providers.
Ngā Putanga (Outputs)
Performance indicatorsActual Targets
2013 2014 2014 2015 2016
Te Wānanga o Aotearoa delivers educational excellence
1.6 External Evaluation and Review (EER) finding for capability in self-assessment
Confident Confident Confident Confident Confident
1.7 External Evaluation and Review (EER) finding for capability in educational performance
Highly confident
Highly confident
Confident Confident Confident
1.8 Proportion of tauira who are satisfied or highly satisfied with their experience at Te Wānanga o Aotearoa
93% 92% 95% 95% 95%
Te Wānanga o Aotearoa serves our diverse communities
2.8 Proportion of tauira who are Māori
50% 54% 50% 50% 50%
2.9 Proportion of tauira who are Pasifika
10% 11% 10% 10% 10%
Cost of Service Statement for Hapori (Community)For the year ended 31 December 2014
Group 2014 $000
Group 2013 $000
Parent 2014 $000
Parent 2013 $000
Revenue 67,716 67,066 44,990 42,883
Expenditure 61,455 62,932 39,648 40,428
Operating net cost of service 6,261 4,135 5,342 2,455 39
Ma
na
gin
g o
ur
pe
rfo
rma
nce

Output class: Arumoni Commercial
This output class relates to the delivery of industry, vocational teaching and social services qualifications and maintaining financial stability. Initiatives for this output class included the delivery of vocationally based qualifications which would have a direct employment outcome and a continued focus on increased efficiencies and fiscal control.
In 2014, Te Wānanga o Aotearoa achieved both indicators for this output class. The operating surplus exceeded the target by 1.7%. The mix of provision indicator for delivery of vocational qualifications was within the target range and resulted in the organisation delivering 4% more EFTS in vocational qualifications than forecast.
Ngā Putanga (Outputs)
Performance indicatorsActual Targets
2013 2014 2014 2015 2016
Te Wānanga o Aotearoa provides clear vocational pathways
3.5 Mix of provision for vocational qualifications matches the Investment Plan agreement
N/A 104% 95-107% 95-107% 95-107%
Te Wānanga o Aotearoa meets agreed financial ratios
3.6 Operating surplus/deficit 2.6% 3.1% 1.4% 1-2% 1-3%
Group 2014 $000
Group 2013 $000
Parent 2014 $000
Parent 2013 $000
Revenue 37,675 37,500 54,641 51,207
Expenditure 41,109 40,217 52,907 51,486
Operating net cost of service (3,434) (2,717) 1,734 (279)
Group 2014 $000
Group 2013 $000
Parent 2014 $000
Parent 2013 $000
Revenue
Ahurea Cultural 49,634 47,169 68,311 64,974
Hapori Community 67,716 67,066 44,990 42,883
Arumoni Commercial 37,675 37,500 54,641 51,207
Total revenue 155,025 151,735 167,942 159,064
Expenditure
Ahurea Cultural 47,385 44,557 60,441 59,365
Hapori Community 61,455 62,932 39,648 40,428
Arumoni Commercial 41,109 40,217 52,907 51,486
Total expenditure 149,949 147,706 152,996 151,278
Operating surplus/deficit 5,076 4,029 14,946 7,786
Cost of Service Statement for Arumoni (Commercial)For the year ended 31 December 2014
Cost of service statement – all outputsFor the year ended 31 December 2014
4 0
TE
PŪ
RO
NG
O 2
01
4

Investment plan commitmentsOur Investment Plan which is negotiated with the Tertiary Education Commission includes our performance commitments. These are the targets we strive to achieve as we work towards achieving our goal of whānau transformation through education and the Government’s goals set out in the Tertiary Education Strategy.
The 2014 data are interim results, as they are subject to validation by the Tertiary Education Commission following submission of the final single data return in April 2015. Data for 2013 show in this report are drawn from the final April 2014 single data return and may vary from the interim results reported in Te Pūrongo 2013 (which was produced prior to the single data return).
Our targets are grouped under the themes of attracting and engaging priority learners, supporting learners to succeed and supporting quality research to help drive innovation. These themes also reflect the high-level strategies articulated in the 2013 Investment Plan Guidance.
Future targets for the 2015 onwards are not presented this year as different indicators have been negotiated in the Investment Plan 2015 to 2017. Although the indicators will change, the focus on priority learners and educational excellence remains.
Attracting and engaging priority learnersSince inception, Te Wānanga o Aotearoa has welcomed those who seek to experience an inclusive education founded on tikanga Māori and āhuatanga Māori. It is this foundation that enables us to attract comparatively large numbers of priority learners.
As in previous years our strategies to attract and engage priority group learners include:
• development of qualifications that map to the Vocational Pathways framework
• low or no fees across all NQF levels
• provision of educational pathway from foundation to masters level
• pastoral and academic support that meets the needs of priority group learners
Te Wānanga o Aotearoa performed well against its targets for 2014 and achieved 4 of the targets. The targets we met or exceeded related to engagement of Māori at all NQF levels and engagement of Pasifika at NQF level 4 and above. The engagement targets for under 25 year olds were not achieved at level 1 to 3 and level 4 and above. These targets were developed in 2012 and where considered ‘stretch targets’ at that time.
The following table shows the EFTS consumed by Māori Pasifika and under-25 year old learners as a proportion of total EFTS consumed in 2014.
Indicator NQF level Achieved 2010
Achieved 2011
Achieved 2012
Achieved 2013
Achieved 2014
Target 2014
Proportion of SAC eligible EFTS enrolled at the TEO who are Māori
All levels 52% 53% 49% 51% 55% 53%
Level 1 to 3 27% 26% 22% 24% 24% 23%
Level 4 and above 25% 27% 27% 28% 31% 30%
Proportion of SAC eligible EFTS enrolled at the TEO who are Pacific peoples
All levels 10% 11% 10% 11% 10% 11%
Level 1 to 3 6% 6% 5% 6% 5% 6%
Level 4 and above 4% 5% 5% 5% 5% 5%
Proportion of SAC eligible EFTS enrolled at the TEO who are aged under 25
All levels 14% 14% 13% 15% 14% 20%
Level 1 to 3 8% 8% 7% 9% 7% 11%
Level 4 and above 6% 6% 6% 7% 7% 9%
41
Ma
na
gin
g o
ur
pe
rfo
rma
nce

Indicator NQF level Achieved 2010
Achieved 2011
Achieved 2012
Achieved 2013
Interim 2014
Target 2014
Successful course completion rate for all tauira (SAC eligible EFTS)
All levels 76% 79% 81% 81% 80% 83%
Level 1 to 3 77% 80% 81% 81% 77% 82%
Level 4 and above 76% 79% 81% 82% 83% 83%
Successful course completion rate for tauira Māori (SAC eligible EFTS)
Level 1 to 3 71% 74% 76% 76% 72% 80%
Level 4 and above 76% 76% 78% 79% 80% 81%
Successful course completion rate for Pasifika tauira (SAC eligible EFTS)
Level 1 to 3 78% 78% 76% 79% 74% 82%
Level 4 and above 75% 82% 81% 81% 83% 83%
Successful course completion rate for tauira aged under 25 (SAC eligible EFTS)
Level 1 to 3 68% 70% 72% 73% 68% 74%
Level 4 and above 70% 75% 77% 77% 78% 79%
Supporting learners to succeed
Historically Te Wānanga o Aotearoa has attracted large proportions of learners who have no qualifications and those of Māori and Pasifika descent. These learners seek a different, inclusive approach to education immersed in a mātauranga Māori environment. Initiatives to support learners to succeed include:
• identifying tauira needs at enrolment and putting in place support structures that enable tauira to be successful
• offering flexible learning options such as noho marae, home-based learning and face-to-face for educational delivery
• utilising culturally appropriate frameworks (e.g., Ako Wānanga) for supporting tauira to learn
Successful course completion
A course is a component of study that makes up a qualification and provides an interim indicative view of tauira achievement and the effectiveness of teaching and learning.
In 2014, 2 of the targets were achieved or exceeded. The successful course completion rate for all tauira and Pasifika at level 4 and above met the 83% target.
The targets at level 1 to 3 were not achieved. In part this was due to a change in government policy which resulted in a change in tauira demographic where tauira with prior qualifications were no longer eligible to enrol in some of our qualifications.
42
TE
PŪ
RO
NG
O 2
01
4

Indicator NQF level Achieved 2010
Achieved 2011
Achieved 2012
Achieved 2013
Interim 2014
Target 2014
Qualification completion rate for all tauira (SAC eligible EFTS)
All levels 66% 71% 70% 79% 71% 75%
Level 1 to 3 70% 75% 73% 78% 68% 77%
Level 4 and above 60% 67% 66% 81% 74% 75%
Qualification completion rate for tauira Māori (SAC eligible EFTS)
Level 1 to 3 63% 69% 68% 73% 63% 74%
Level 4 and above 54% 62% 62% 78% 70% 73%
Qualification completion rate for Pasifika tauira (SAC eligible EFTS)
Level 1 to 3 71% 72% 68% 76% 65% 77%
Level 4 and above 65% 75% 64% 78% 80% 77%
Qualification completion rate for tauira aged under 25 (SAC eligible EFTS)
Level 1 to 3 58% 59% 64% 68% 57% 60%
Level 4 and above 56% 56% 58% 68% 66% 58%
Successful qualifiction completion
Qualification completion indicators provide a longer term view of tauira achievement. A qualification is made up of a number of courses. Qualification completion is important for the future employment and income prospects of tauira.
Performance at level 4 and above peaked last year and in line with our projections (refer 2013 Annual Report) are now levelling off. As discussed above changes in government policy had a discernible impact on qualification completion rates at level 1 to 3. Although qualification completion rates at level 1 to 3 are lower than previous years, the performance is comparable for learners with no previous qualifications.
Supporting the educational journey
As part of whānau transformation through education, our aim is to provide tauira with the opportunity to continue to engage in education. To assess our success in this area, Te Wānanga o Aotearoa measures progression and retention.
Progression measures the proportion of tauira studying at level 1 to 3 who after completing a qualification with Te Wānanga o Aotearoa, enrol in study in a higher level at any institution. Although the progression target was not achieved, the rate still increased by 3% compared with 2013.
The retention rate measures the proportion of tauira who successfully complete a qualification and enrol in another programme with us. In 2014, a retention rate of 76% was achieved which is above the target.
Indicator Achieved 2010
Achieved 2011
Achieved 2012
Achieved 2013
Interim 2014
Target 2014
Progression rate for tauira (SAC eligible EFTS) at levels 1 to 3
40% 38% 40% 42% 45% 50%
Retention rate for all tauira (SAC eligible EFTS) 68% 73% 73% 76% 76% 75%
43
Ma
na
gin
g o
ur
pe
rfo
rma
nce

Supporting quality research to help drive innovation
Our responsibility to advance mātauranga Māori is enshrined in legislation and at the core of our organisation’s beliefs. To meet these obligations, Te Wānanga o Aotearoa focuses on increasing rangahau activities. Rangahau activities include the publication of wānanga journals, presentation at conferences and peer reviewed journals. In 2014, the target was exceeded by 163 outputs and the number of EFTS enrolled in postgraduate programmes exceeded the target by 8 EFTS.
Indicator Achieved 2012
Achieved 2013
Target 2013
Target 2014
No of research outputs 384 185 363 200
The number of EFTS enrolled in post-graduate programmes N/A 37 28 20
4 4
TE
PŪ
RO
NG
O 2
01
4

Richard Batley, Chairman CA, BMS (Waikato)
In the financial year ended 31 December 2014, Te Mana Whakahaere (the Council) and the
management of Te Wānanga o Aotearoa were responsible for:
• preparation of the annual financial statements and statement of service performance and the judgements used in them
• establishing and maintaining a system of internal control designed to provide reasonable assurance as to the integrity and reliability of financial reporting
In the opinion of Te Mana Whakahaere and management of Te Wānanga o Aotearoa, the financial statements and statement of service performance fairly reflect the financial position and operations of Te Wānanga o Aotearoa for the year ended 31 December 2014.
Date
Jim Mather, Te Taiurungi (CEO) BBus, MBA, ACA
Date
29/04/2015 29/04/2015
Statement of
responsibilityFor the year ended 31 December 2014
45

4 6
TE
PŪ
RO
NG
O 2
01
4

tahuaFinancial report
Te
47
Ma
na
gin
g o
ur
pe
rfo
rma
nce

Independent Auditor’s Report
To the readers of Te Wānanga o Aotearoa Te Kuratini o Ngā Waka and group’s financial statements and non-financial performance information for the year ended 31 December 2014
The Auditor-General is the auditor of Te Wānanga o Aotearoa Te Kuratini o Ngā Waka (the Wānanga) and group. The Auditor-General has appointed me, B H Halford, using the staff and resources of Audit New Zealand, to carry out the audit of the financial statements and non-financial performance information of the Wānanga and group on her behalf.
We have audited:
• the financial statements of the Wānanga and group on pages 50 to 88, that comprise the statement of financial position as at 31 December 2014, the statement of comprehensive income, statement of changes in equity and statement of cash flows for the year ended on that date and the notes to the financial statements that include accounting policies and other explanatory information; and
• the non-financial performance information of the Wānanga and group on pages in the statement of service performance on pages 34 to 44.
Opinion
In our opinion:
• the financial statements of the Wānanga and group on pages 50 to 88:
- comply with generally accepted accounting practice in New Zealand; and
- fairly reflect the Wānanga and group’s:
• financial position as at 31 December 2014; and
• financial performance and cash flows for the year ended on that date;
• the non-financial performance information of the Wānanga and group on pages 34 to 44 fairly reflects the Wānanga and group’s service performance achievements measured against the performance targets adopted in the investment plan for the year ended 31 December 2014.
Our audit was completed on 29 April 2015. This is the date at which our opinion is expressed.
The basis of our opinion is explained below. In addition, we outline the responsibilities of Te Mana Whakahere and our responsibilities, and we explain our independence.
Basis of opinion
We carried out our audit in accordance with the Auditor-General’s Auditing Standards, which incorporate the International Standards on Auditing (New Zealand). Those standards require that we comply with ethical requirements and plan and carry out our audit to obtain reasonable assurance about whether the financial statements and non-financial performance information are free from material misstatement.
Material misstatements are differences or omissions of amounts and disclosures that, in our judgement, are likely to influence readers’ overall understanding of the financial statements and non-financial performance information. If we had found material misstatements that were not corrected, we would have referred to them in our opinion.
An audit involves carrying out procedures to obtain audit evidence about the amounts and disclosures in the financial statements and non-financial performance information. The procedures selected depend on our judgement, including our assessment of risks of material misstatement of the financial statements and non-financial performance information, whether due to fraud or error. In making those risk assessments, we consider internal control relevant to the Wānanga and group’s preparation of the financial statements and non-financial performance information that fairly reflect the matters to which they relate. We consider internal control in order to design audit procedures that are appropriate in the circumstances but not for the purpose of expressing an opinion on the effectiveness of the Wānanga and group’s internal control.
4 8
TE
PŪ
RO
NG
O 2
01
4
An audit also involves evaluating:
• the appropriateness of accounting policies used and whether they have been consistently applied;
• the reasonableness of the significant accounting estimates and judgements made by the Te Mana Whakahaere;
• the adequacy of all disclosures in the financial statements and non-financial performance information; and
• the overall presentation of the financial statements and non-financial performance information.
We did not examine every transaction, nor do we guarantee complete accuracy of the financial statements and non-financial performance information. Also we did not evaluate the security and controls over the electronic publication of the financial statements and non-financial performance information.
We have obtained all the information and explanations we have required and we believe we have obtained sufficient and appropriate audit evidence to provide a basis for our audit opinion.
Responsibilities of Te Mana Whakahaere
Te Mana Whakahaere is responsible for preparing financial statements that:
• comply with generally accepted accounting practice in New Zealand; and
• fairly reflect the Wānanga and group’s financial position, financial performance and cash flows.
Te Mana Whakahaere is also responsible for preparing non-financial performance information that fairly reflects the Wānanga and group’s service performance achievements measured against the performance targets adopted in the investment plan.
Te Mana Whakahaere is responsible for such internal control as it determines is necessary to enable the preparation of financial statements and non-financial performance information that are free from material misstatement, whether due to fraud or error. Te Mana Whakahaere is also responsible for the publication of the financial statements and non-financial performance information, whether in printed or electronic form.
Te Mana Whakahaere’s responsibilities arise from the Education Act 1989 and the Crown Entities Act 2004.
Responsibilities of the Auditor
We are responsible for expressing an independent opinion on the financial statements and non-financial performance information and reporting that opinion to you based on our audit. Our responsibility arises from section 15 of the Public Audit Act 2001 and the Crown Entities Act 2004.
Independence
When carrying out the audit, we followed the independence requirements of the Auditor-General, which incorporate the independence requirements of the External Reporting Board.
Other than the audit, we have no relationship with or interests in the Wānanga or any of its subsidiaries.
B H Halford Audit New Zealand On behalf of the Auditor-General Tauranga, New Zealand 49
Ma
na
gin
g o
ur
pe
rfo
rma
nce

Statement of
comprehensive incomeFor the year ended 31 December 2014
The accompanying notes form part of these financial statements.
Group Group Group Parent Parent Parent Actual Budget Actual Actual Budget Actual Dec 14 Dec 14 Dec 13 Dec 14 Dec 14 Dec 13 Notes $’000 $’000 $’000 $’000 $’000 $’000
Income
Government funding 2(a) 135,180 135,060 133,943 135,180 135,061 133,943Tauira fees 2(b) 6,592 8,081 6,500 5,851 7,248 5,598Interest income 3,196 2,987 3,070 3,075 2,950 2,920Other income 2(c) 10,057 7,949 8,222 23,836 11,402 16,603
Total income 155,025 154,077 151,735 167,942 156,661 159,064
Expenditure
Kaimahi costs 3 91,112 85,243 88,326 81,557 76,233 79,196Depreciation and amortisation expense 12,13 9,565 8,474 8,239 7,959 7,215 7,034Other expenses 4 49,272 55,208 51,141 63,480 68,039 65,048
Total expenditure 149,949 148,925 147,706 152,996 151,487 151,278
Surplus/(deficit) 5,076 5,152 4,029 14,946 5,174 7,786
Other comprehensive income
Gains/(loss) on property revaluations - - - - - -
Total other comprehensive income - - - - - -
Total comprehensive income 5,076 5,152 4,029 14,946 5,174 7,786
Explanation of major variances against budget are provided in note 23.
50
TE
PŪ
RO
NG
O 2
01
4

Statement of
changes in equityFor the year ended 31 December 2014
The accompanying notes form part of these financial statements.
Group Group Group Parent Parent Parent Actual Budget Actual Actual Budget Actual Dec 14 Dec 14 Dec 13 Dec 14 Dec 14 Dec 13 Notes $’000 $’000 $’000 $’000 $’000 $’000
Balance at 1 January 142,793 143,392 138,764 130,345 123,752 122,559Comprehensive income
Surplus/(deficit) 5,076 5,152 4,029 14,946 5,174 7,786
Total comprehensive income 5,076 5,152 4,029 14,946 5,174 7,786
Balance at 31 December 14 147,869 148,544 142,793 145,291 128,926 130,345
51
Ma
na
gin
g o
ur
pe
rfo
rma
nce

Statement of
financial positionAs at 31 December 2014
The accompanying notes form part of these financial statements.
Jim Mather, Te Taiurungi (CEO) BBus, MBA, ACADateRichard Batley, Chair CA, BMS (Waikato)
Date
Group Group Group Parent Parent Parent Actual Budget Actual Actual Budget Actual Dec 14 Dec 14 Dec 13 Dec 14 Dec 14 Dec 13 Notes $’000 $’000 $’000 $’000 $’000 $’000
Current assets
Cash and cash equivalents 5 5,136 288 3,034 3,372 1,995 1,924Tauira and other receivables 6 3,219 2,724 3,176 3,171 2,702 3,059Inventories 7 1,882 1,653 2,580 1,847 217 1,225Prepayments 848 - 897 783 - 866
Tauira fees - - - 155 - -
Assets held for sale 8 739 - 189 739 - 189Other financial assets 9 32,626 41,699 38,699 30,526 39,000 36,000
Total current assets 44,450 46,364 48,575 40,593 43,914 43,263
Current liabilities
Creditors and other payables 10 9,380 5,346 8,676 8,404 15,086 9,759Tauira fees 26 271 357 - 271 211Kaimahi entitlements 11(a) 8,587 7,622 6,283 8,204 6,659 5,634Lease make-good 11(b) 104 - 118 82 - 40
Total current liabilities 18,097 13,239 15,434 16,690 22,016 15,644
Working capital surplus / (deficit) 26,353 33,125 33,141 23,903 21,898 27,619
Non-current assets
Investment in subsidiaries 15 - - - 476 1 1Investment property 16 1,333 - - 1,333 - -Other financial assets 9 25,500 13,841 12,106 25,500 11,989 12,106Property, plant and equipment 12 88,029 93,880 89,999 87,613 90,114 86,768Intangible assets 13 6,850 7,698 7,624 6,615 4,924 3,928
Total non-current assets 121,712 115,419 109,729 121,537 107,028 102,803
Non-current liabilities
Lease make-good 11(b) 196 - 77 149 - 77
Total non-current liabilities 196 - 77 149 - 77
Net assets 147,869 148,544 142,793 145,291 128,926 130,345
Equity
Retained earnings 14 138,467 139,020 133,269 135,889 119,524 120,943Property revaluation reserve 14 9,402 9,524 9,524 9,402 9,402 9,402
Total equity 147,869 148,544 142,793 145,291 128,926 130,345
Explanations of major variances against budget are provided in note 23.
For and on behalf of Te Mana Whakahaere (the Council):
29/04/201529/04/2015
52
TE
PŪ
RO
NG
O 2
01
4

Statement of
cash flowsFor the year ended 31 December 2014
The accompanying notes form part of these financial statements.
Group Group Group Parent Parent Parent Actual Budget Actual Actual Budget Actual Dec 14 Dec 14 Dec 13 Dec 14 Dec 14 Dec 13 $’000 $’000 $’000 $’000 $’000 $’000
Cash flows from operating activities
Receipts from government grants 135,382 135,018 133,649 135,350 135,061 133,705Receipts from tauira fees 6,261 7,952 6,481 5,485 7,248 5,492Dividend income 1 - 1 1 - 1Interest income received 2,606 3,082 3,714 2,471 2,950 3,484Receipts from other income 10,186 7,854 7,255 10,513 11,402 15,546Payments to kaimahi (88,808) (85,244) (87,773) (78,622) (76,233) (78,571)Payments to suppliers (46,633) (55,537) (53,653) (57,936) (68,410) (72,139)
Net cash flow from operating activities 18,995 13,125 9,674 17,262 12,018 7,518
Cash flows from investing activities
Sale of property, plant and equipment 57 - 436 61 - 407Sale of investments 42,249 - 39,692 37,500 - 38,500Purchase of property, plant and equipment (7,696) (11,625) (11,699) (7,232) (10,402) (10,618)Purchase of software development (356) (1,610) (850) (228) (1,135) (78)Purchase of programme development (1,577) (2,760) (2,102) (495) (1,200) (1,115)Purchase of investments (49,570) - (37,493) (45,420) - (37,393)
Net cash flow from investing activities (16,893) (15,995) (12,016) (15,814) (12,737) (10,297)
Net cash flow from financing activities - - - - - -
Net increase/(decrease) in cash and cash equivalents 2,102 (2,870) (2,342) 1,448 (719) (2,779)Cash and cash equivalents 1 January 3,034 3,158 5,376 1,924 2,714 4,703
Cash and cash equivalents 31 December 5,136 288 3,034 3,372 1,995 1,924
53
Ma
na
gin
g o
ur
pe
rfo
rma
nce
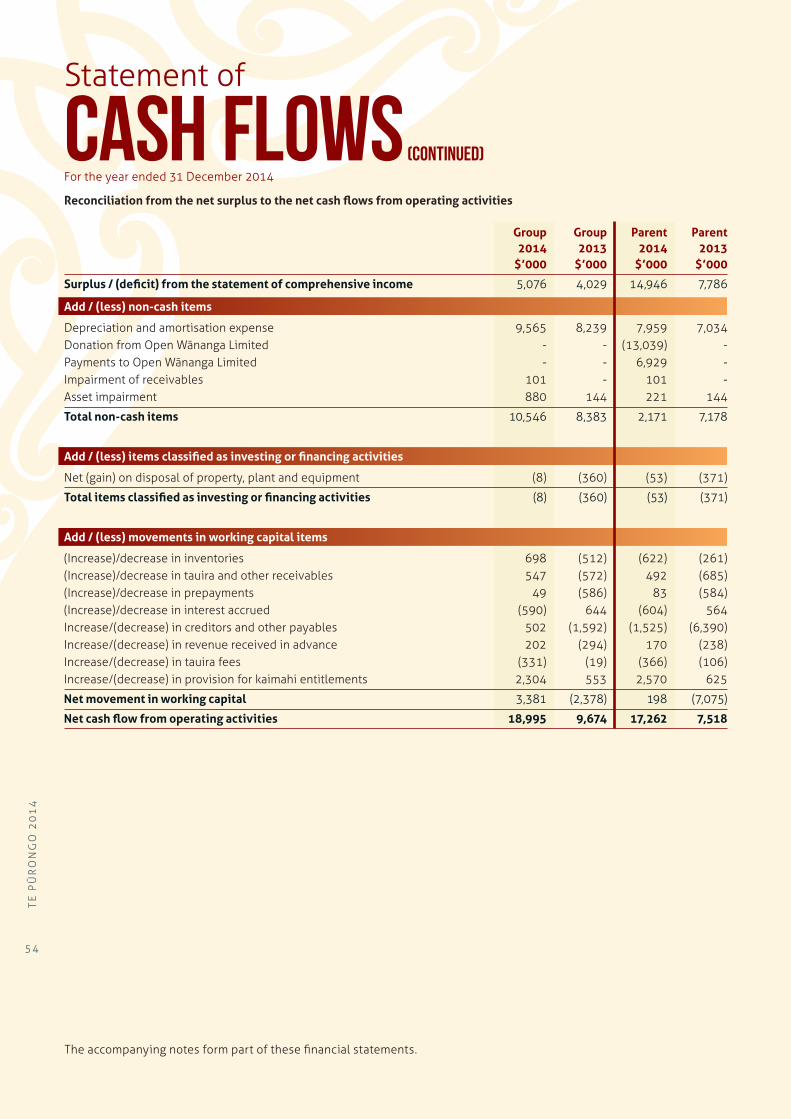
Statement of
cash flows (continued)For the year ended 31 December 2014
The accompanying notes form part of these financial statements.
Reconciliation from the net surplus to the net cash flows from operating activities
Group Group Parent Parent 2014 2013 2014 2013 $’000 $’000 $’000 $’000
Surplus / (deficit) from the statement of comprehensive income 5,076 4,029 14,946 7,786
Add / (less) non-cash items
Depreciation and amortisation expense 9,565 8,239 7,959 7,034Donation from Open Wānanga Limited - - (13,039) -Payments to Open Wānanga Limited - - 6,929 -Impairment of receivables 101 - 101 - Asset impairment 880 144 221 144
Total non-cash items 10,546 8,383 2,171 7,178
Add / (less) items classified as investing or financing activities
Net (gain) on disposal of property, plant and equipment (8) (360) (53) (371)
Total items classified as investing or financing activities (8) (360) (53) (371)
Add / (less) movements in working capital items
(Increase)/decrease in inventories 698 (512) (622) (261)(Increase)/decrease in tauira and other receivables 547 (572) 492 (685)(Increase)/decrease in prepayments 49 (586) 83 (584)(Increase)/decrease in interest accrued (590) 644 (604) 564Increase/(decrease) in creditors and other payables 502 (1,592) (1,525) (6,390)Increase/(decrease) in revenue received in advance 202 (294) 170 (238)Increase/(decrease) in tauira fees (331) (19) (366) (106)Increase/(decrease) in provision for kaimahi entitlements 2,304 553 2,570 625
Net movement in working capital 3,381 (2,378) 198 (7,075)
Net cash flow from operating activities 18,995 9,674 17,262 7,518
54
TE
PŪ
RO
NG
O 2
01
4

1. Statement of Accounting Policies
Reporting entity Te Wānanga o Aotearoa is a TEI domiciled in New Zealand and is governed by the Crown Entities Act 2004 and the Education Act 1989.
Te Wānanga o Aotearoa group consists of Te Wānanga o Aotearoa, and its subsidiaries, Open Wānanga Limited (100% owned), DynaSpeak (100% owned) and the Aotearoa Scholarship Trust (100% controlled). The subsidiaries are incorporated and domiciled in New Zealand.
Te Wānanga o Aotearoa has designated itself and group as public benefit entities for the purposes of New Zealand Equivalents to International Financial Reporting Standards (NZ IFRS).
The primary purpose of Te Wānanga o Aotearoa is to provide tertiary education.
The financial statements cover all of the activities pertaining to an educational and research institution including but not limited to:
• The provision of student services and the facilitating of student activities, including scholarships.
• The activities of a researcher, developer, publisher, property owner, occupier including tenant or landlord, trustee, provider of accommodation, early childhood services, conferences, exhibitions, recreation facilities, sponsorship and hireage.
• And any other activity or occupation incidental to an educational and research institution.
The financial statements of Te Wānanga o Aotearoa and group are for the year ended 31 December 2014. The financial statements were authorised for issue on 29 April 2015 by Te Mana Whakahaere.
Basis of preparation
Statement of complianceThe financial statements of Te Wānanga o Aotearoa have been prepared in accordance with the requirements of the Crown Entities Act 2004 and the Education Act 1989 , which include the requirement to comply with New Zealand Generally Accepted Accounting Practice (NZ GAAP).
These financial statements have been prepared in accordance with NZ GAAP and they comply with NZ IFRS as appropriate for public entities.
Measurement baseThe financial statements have been prepared on a historical cost basis except where modified by the revaluation of artwork, land and buildings.
Functional and presentation currencyThe financial statements are presented in New Zealand dollars and all values are rounded to the nearest thousand dollars ($’000).
The functional currency of Te Wānanga o Aotearoa and its subsidiaries is New Zealand dollars.
Changes in accounting policies and estimates There have been no changes in accounting policies during the financial year.
The Minister of Commerce has approved a new Accounting Standards Framework (Incorporating a Tier Strategy) developed by the External Reporting Board (XRB). Under this Accounting Standards Framework, Te Wānanga o Aotearoa is classified as a Tier 1 reporting entity and it will be required to apply full Public Benefit Entity Accounting Standards (PAS). The effective date for the new standards for public sector entities will be for reporting periods beginning on or after 1 July 2014. This means Te Wānanga o Aotearoa will transition to the new standards in preparing its 31 December 2015 financial statements. Te Wānanga o Aotearoa has not yet assessed the implications of the new Accounting Standards Framework at this time.
Due to the change in the Accounting Standards Framework for public benefit entities, the XRB has effectively frozen the financial reporting requirements for public benefit entities up until the new Accounting Standards Framework is effective. Accordingly, no disclosure has been made about new or amended NZ IFRS that exclude public benefit entities from their scope.
Significant accounting policies
a. Basis of consolidationThe group financial statements are prepared by adding together like items of assets, liabilities, equity, income, expenses and cashflows on a line-by-line basis. All significant intra-group balances, transactions, income and expenses are eliminated in full on consolidation.
Subsidiaries
Te Wānanga o Aotearoa consolidates in the group financial statements all entities where Te Wānanga o Aotearoa has the capacity to control their financing and operating policies so as to obtain benefits from the activities of those entities. This power exists where Te Wānanga o Aotearoa controls the majority voting power on the governing body or where such policies have been irreversibly predetermined by Te Wānanga o Aotearoa or where the determination of such policies is unable to materially impact the level of potential ownership benefits that arise from the activities of the subsidiary.
Investments in subsidiaries are carried at cost in the parent entity financial statements of Te Wānanga o Aotearoa.
Notes to the
financial STATEMENTSFor the year ended 31 December 2014
55
Ma
na
gin
g o
ur
pe
rfo
rma
nce

Notes to the financial statements (continued)
b. Foreign currency translation Transactions in foreign currencies are initially recorded in the functional currency at the exchange rates ruling at the date of the transaction. Monetary assets and liabilities denominated in foreign currencies are translated at the rate of exchange ruling at the balance sheet date.
Non-monetary items that are measured in terms of historical cost in a foreign currency are translated using the exchange rate as at the date of the initial transaction.
Non-monetary items measured at fair value in a foreign currency are translated using the exchange rates at the date when the fair value was determined.
c. Property, Plant and equipmentProperty, plant and equipment asset classes consist of land and buildings, leasehold improvements, furniture & equipment, computers, motor vehicles, waka, library books and artwork.
The measurement base used for determining the gross carrying amount for each class of assets is as follows:
• Buildings are measured at cost or valuation less subsequent accumulated depreciation and impairment losses.
• Land and Artwork is stated at cost or valuation and are not depreciated.
• All other asset classes are stated at cost less accumulated depreciation and impairment losses.
Depreciation
Depreciation is provided on a straight-line basis on all property, plant and equipment other than land and artwork at rates that will write off the cost (or valuation) of the assets to their estimated residual values over their useful lives. The useful lives and associated depreciation rates of major classes of assets have been estimated as follows:
Buildings 10-50 years 2%-10%
Leasehold improvements 1-18 years 6%-100%
Furniture & Equipment 5 years 20%
Computers 2-4 years 25%-50%
Motor vehicles 5 years 20%
Waka 10 years 10%
Library books 10 years 10%
Library subscriptions 2 years 50%
Leasehold improvements are depreciated over the non-cancellable period for which Te Wānanga o Aotearoa has contracted to lease the asset together with any further terms for which Te Wānanga o Aotearoa has the option to continue to lease the asset.
The residual value and useful life of an asset is reviewed and adjusted if applicable, at the end of each financial year end.
Revaluations
Land and buildings are revalued with sufficient regularity to ensure that the carrying amount does not differ materially from fair value and at least every three years.
The carrying values of revalued classes are assessed annually to ensure that they do not differ materially from fair value. If
there is evidence supporting a material difference, then the off-cycle asset classes are revalued.
Property, plant and equipment revaluation movements are accounted for on a class-of-asset basis.
The net revaluation results are credited or debited to other comprehensive income and are accumulated to an asset revaluation reserve in equity for that class of asset. Where this would result in a debit balance in the asset revaluation reserve this balance is not recognised in other comprehensive income but is recognised in the surplus or deficit. Any subsequent increase on revaluation that reverses a previous decrease in value recognised in the surplus or the deficit up to the amount previously expensed and then recognised in other comprehensive income.
Additions
The cost of an item of property, plant and equipment is recognised as an asset if, and only if, it is probable that future economic benefits or service potential associated with the item will flow to Te Wānanga o Aotearoa and the cost of the item can be measured reliably.
Work in progress is recognised at cost less impairment and is not depreciated.
In most instances, an item of property, plant and equipment is initially recognised at its cost. Where an asset is acquired at no cost, or for a nominal cost, it is recognised at fair value as at the date of acquisition.
Disposals
Gains and losses on disposals are determined by comparing the proceeds with the carrying value of the asset. Gains and losses on disposals are recognised in the surplus or deficit.
When revalued assets are sold, the amounts included in the revaluation reserve in respect of those assets are transferred to retained earnings.
Subsequent costs
Costs incurred subsequent to initial acquisition are capitalised only when it is probable that future economic benefits or service potential associated with the item will flow to Te Wānanga o Aotearoa and the cost of the item can be measured reliably.
The costs of day-to-day servicing of property, plant and equipment are recognised in the surplus or deficit as they are incurred.
d. Intangible assets
Computer software
Computer software is separately acquired and capitalised at its cost as at the date of acquisition. After initial recognition, separately acquired intangible assets are carried at cost less accumulated amortisation and accumulated impairment losses.
Programme development costs
Programme development costs relate to development of educational courses and are capitalised once accreditation has been received and when it is probable that future economic benefit arising from use of the intangible asset will flow to the group.
Following initial recognition of programme development costs, the cost model is applied and the asset is carried
56
TE
PŪ
RO
NG
O 2
01
4

at cost less accumulated amortisation and accumulated impairment losses.
Amortisation
A summary of policies applied to the group’s intangible assets is as follows:
Computer software
Programme development costs
Useful lives Finite - 5 years Finite - 5 years
Method used
Straight line method
Straight line method from capitalisation
Internally generated/acquired
Separately acquired Internally generated/separately acquired
The amortisation period and amortisation method for each class of intangible asset having a finite life are reviewed at the end of each financial year. If the expected useful life or expected pattern of consumption is different from the previous assessment, changes are made accordingly.
The carrying value of each class of intangible asset is reviewed annually for indicators of impairment. Intangible assets are tested for impairment where an indicator of impairment exists.
Gains or losses arising from de-recognition of an intangible asset are measured as the difference between the net disposal proceeds and the carrying amount of the asset and are recognised in the surplus or deficit when the asset is de-recognised.
All other research and development costs are recognised as expenses in the surplus or deficit in the year in which they are incurred.
e. Impairment of property, plant and equipment and intangible assetsIntangible assets that have an indefinite useful life or are not yet available for use are not subject to amortisation and are tested annually for impairment. Assets that have a finite useful life are reviewed for indicators of impairment at each balance date. When an asset is found to be impaired, a recoverable amount is estimated. An impairment loss is recognised for the amount by which the asset’s carrying amount exceeds its recoverable amount. The recoverable amount is the higher of an asset’s fair value less costs to sell and value in use.
Value in use is a term for depreciated replacement cost for an asset where the future economic benefits or service potential of the asset are not primarily dependent on the asset’s ability to generate net cash inflows and where Te Wānanga o Aotearoa would, if deprived of the asset, replace its remaining future economic benefits or service potential.
The value in use for cash-generating assets is the present value of expected future cash flows.
If an asset’s carrying amount exceeds its recoverable amount, the asset is impaired and the carrying amount is written down to the recoverable amount. For revalued assets the impairment loss is recognised against the revaluation reserve for that class of asset. Where that results in a debit balance in the revaluation reserve, the balance is recognised in the surplus or deficit.
For assets not carried at a revalued amount, the total impairment loss is recognised in the surplus or deficit.
The reversal of an impairment loss on a revalued asset is credited to other comprehensive income and increases the asset revaluation reserve for that class of asset. However, to the extent that an impairment loss for that class of asset was previously recognised in the surplus or deficit, a reversal of the impairment loss is also recognised in the surplus or deficit.
For assets not carried at a revalued amount, the reversal of an impairment loss is recognised in the surplus or deficit.
f. Investment propertyProperties leased to third parties under operating leases are classified as investment property unless the property is held to meet service delivery objectives, rather than to earn rentals or for capital appreciation.
Property held to meet service delivery objectives is classified as property, plant and equipment. Investment property is measured initially at its cost, including transaction costs. After initial recognition, investment property is measured at fair value as determined annually by an independent valuer. Gains or losses arising from a change in the fair value of investment property are recognised in the surplus or deficit.
g. Other financial assetsFinancial assets are initially recognised at fair value plus transaction costs unless they are carried at fair value through surplus or deficit in which case the transaction costs are recognised in the surplus or deficit.
Purchases and sales of financial assets are recognised on trade-date, the date on which the organisation and group commits to purchase or sell the asset. Financial assets are derecognised when the rights to receive cash flows from the financial assets have expired or have been transferred and the organisation and group has transferred substantially all the risks and rewards of ownership.
Financial assets are classified into the following categories for the purposes of measurement:
• fair value through surplus or deficit;
• loans and receivables; and
• fair value through other comprehensive income.
Classification of the financial asset depends on the purpose for which the instruments were acquired.
Financial assets at fair value through surplus or deficit
Financial assets at fair value through surplus or deficit include financial assets held for trading. A financial asset is classified in this category if acquired principally for the purpose of selling in the short-term or is part of a portfolio that are managed together and for which there is evidence of short-term profit-taking. Derivatives are also categorised as held for trading. Financial assets acquired principally for the purpose of selling in the short-term or part of a portfolio classified as held for trading are classified as a current asset.
After initial recognition, financial assets in this category are measured at their fair values with gains or losses on remeasurement recognised in the surplus or deficit.
Loans and receivables (including cash and cash equivalents and tauira and other receivables)
Loans and receivables are non-derivative financial assets with fixed or determinable payments that are not quoted in an active market. They are included in current assets, except for maturities greater than 12 months after the balance date,
57
Ma
na
gin
g o
ur
pe
rfo
rma
nce

Notes to the financial statements (continued)
which are included in non-current assets.
After initial recognition, loans and receivables are measured at amortised cost using the effective interest method less any provision for impairment.
Gains and losses when the asset is impaired or derecognised are recognised in the surplus or deficit.
Financial assets at fair value through other comprehensive income
Financial assets at fair value through other comprehensive income are those that are designated as fair value through other comprehensive income or are not classified in any of the other categories above. They are included in non-current assets unless management intends to realise the investment within 12 months of balance date. The organisation and group designates in this category:
• investments that it intends to hold long-term but which may be realised before maturity; and
• shareholdings that it holds for strategic purposes.
After initial recognition, these investments are measured at their fair value, with gains and losses recognised in other comprehensive income, except for impairment losses, which are recognised in the surplus or deficit.
On derecognition, the cumulative gain or loss previously recognised in other comprehensive income is reclassified from equity to the surplus or deficit.
Impairment of financial assets
At each balance date, Te Wānanga o Aotearoa assesses whether there is any objective evidence that a financial asset or group of financial assets is impaired.
Any impairment losses are recognised in the surplus or deficit.
Loans and receivables (including cash and cash equivalents and tauira and other receivables)
Impairment of a loan or a receivable is established when there is objective evidence that Te Wānanga o Aotearoa will not be able to collect amounts due according to the original terms of the loan or receivable. Significant financial difficulties of the debtor, probability that the debtor will enter into bankruptcy, receivership, or liquidation, and default in payments are considered indicators that the asset is impaired. The amount of the impairment is the difference between the asset’s carrying amount and the present value of estimated future cash flows, discounted using the original effective interest rate. For tauira and other receivables, the carrying amount of the asset is reduced through the use of an allowance account, and the amount of the loss is recognised in the surplus or deficit. When the receivable is uncollectible, it is written off against the allowance account.
Overdue receivables that have been renegotiated are reclassified as current (that is, not past due). For other financial assets, impairment losses are recognised directly against the instrument’s carrying amount.
Financial assets at fair value through other comprehensive income
For equity investments, a significant or prolonged decline in the fair value of the investment below its cost is considered objective evidence of impairment.
For debt investments, significant financial difficulties of the debtor, probability that the debtor will enter into receivership
or liquidation, and default in payments are considered objective indicators that the asset is impaired.
If impairment evidence exists for investments at fair value through other comprehensive income, the cumulative loss (measured as the difference between the acquisition cost and the current fair value, less any impairment loss on that financial asset previously recognised in the surplus or deficit) recognised in other comprehensive income is reclassified from equity to the surplus or deficit.
Equity instrument impairment losses recognised in the surplus or deficit are not reversed through the surplus or deficit.
If in a subsequent period the fair value of a debt instrument increases and the increase can be objectively related to an event occurring after the impairment loss was recognised, the impairment loss is reversed in the surplus or deficit.
h. InventoriesInventories held for distribution or consumption in the provision of services that are not issued on a commercial basis are measured at the lower of cost and net realisable value. Where inventories are acquired at no cost or for nominal consideration, the cost is the current replacement cost at the date of acquisition.
The replacement cost of the economic benefits or service potential of inventory held for distribution reflects any obsolescence or any other impairment.
The cost of purchased inventory is determined as follows:
• inventories held for resale – purchase cost is on a weighted average cost
• materials and consumables to be utilised for rendering of services – purchase cost is on a first-in, first-out basis.
The write-down from cost to current replacement cost or net realisable value is recognised in the surplus or deficit in the period when the write-down occurs.
i. Tauira and other receivablesTauira fees and other receivables are recognised and carried at original receivable amount less any provision for impairment.
A specific provision for impairment is made when collection of the full amount is no longer probable. Bad debts are written off when identified.
j. Cash and cash equivalentsCash and cash equivalents in the statement of financial position comprise cash at bank and in hand and short-term deposits with an original maturity of three months or less.
k. Creditors and other payables Creditors and other payables are recorded at their face value.
l. Provisions A provision is recognised for future expenditure of uncertain amount or timing when there is a present obligation (either legal or constructive) as a result of a past event, it is probable that an outflow of future economic benefits will be required to settle the obligation, and a reliable estimate can be made of the amount of the obligation.
Provisions are measured at the present value of the expenditures expected to be required to settle the obligation using a pre-tax discount rate that reflects current market assessments of the time value of money and the risks specific
58
TE
PŪ
RO
NG
O 2
01
4

to the obligation. The increase in the provision due to the passage of time is recognised as an interest expense and is included in “finance costs”.
m. Kaimahi entitlements
Short-term kaimahi entitlements
Kaimahi entitlements that Te Wānanga o Aotearoa expects to be settled within 12 months of balance date are measured at nominal values based on accrued entitlements at current rates of pay. These include salaries and wages accrued up to balance date, annual leave earned, but not yet taken at balance date and sick leave.
Te Wānanga o Aotearoa recognises a liability for sick leave to the extent that compensated absences in the coming year are expected to be greater than the sick leave entitlements earned in the coming year. The amount is calculated based on the unused sick leave entitlement that can be carried forward at balance date to the extent Te Wānanga o Aotearoa anticipates it will be used by staff to cover those future absences.
n. Superannuation schemes
Defined contribution schemes
Obligations for contributions to Kiwisaver are accounted for as defined contribution superannuation schemes and are recognised as an expense in the surplus or deficit as incurred.
o. LeasesLeases where the lessor retains substantially all the risks and benefits of ownership of the asset are classified as operating leases. Initial direct costs incurred in negotiating an operating lease are added to the carrying amount of the leased asset and recognised over the lease term on the same basis as the lease income.
Operating lease payments are recognised as an expense in the surplus or deficit on a straight-line basis over the lease term.
p. RevenueRevenue is measured at the fair value of consideration or receivable.
Government grants
Government grants are recognised as revenue upon entitlement.
Other government grants
Funding is received from the Tertiary Education Commission (TEC) in relation to costs expected to be incurred by Te Wānanga o Aotearoa to complete specific projects agreed between TEC and Te Wānanga o Aotearoa. Revenue from these projects is recognised based on the stage of the completion of the project. The stage of completion is measured based on the percentage of costs incurred to date compared to the total estimated costs to complete the full project. When funding is received in advance of the project being completed, deferred income is recognised and is released over the specific period using the stage of completion method.
Tauira fees
Revenue from tauira fees is recognised over the period in which the course is taught by reference to the stage of completion of the course as at the balance sheet date. Stage
of completion is measured by reference to the days of course completed as a percentage of total days for each course.
Rental income
Rental income is recognised in the surplus or deficit on an accrual basis.
Interest
Revenue is recognised as the interest accrues (using the effective interest method which applies the interest rate that exactly discounts estimated future cash receipts through the expected life of the financial instrument) to the net carrying amount of the financial asset.
q. DonationsDonations are received by Te Wānanga o Aotearoa from the subsidiary company, Open Wānanga Limited. These donations are recognised as revenue in the surplus or deficit in the period in which they are received.
r. EquityEquity is measured as the difference between total assets and total liabilities. Equity is disaggregated and classified into a number of reserves. The components of equity are:
• retained earnings
• property revaluation reserve
Property revaluation reserve This reserve relates to the revaluation of property, plant, and equipment to fair value.
s. Goods and Services Tax (GST)Revenues, expenses and assets are recognised net of the amount of GST except:
• where the GST incurred on a purchase of goods and services is not recoverable from the taxation authority, in which case the GST is recognised as part of the cost of acquisition of the asset or as part of the expense item as applicable
• receivables and payables are stated with the amount of GST included.
The net amount of GST recoverable from or payable to the taxation authority is included as part of receivables or payables in the statement of financial position.
The net GST paid to, or received from the taxation authority, including the GST relating to investing and financing activities, is classified as a net operating cash flow in the statement of cash flows. Commitments and contingencies are disclosed exclusive of GST.
t. Budget figuresBudget figures are those approved by Te Mana Whakahaere at the beginning of the year. Budget figures are prepared in accordance with NZ GAAP and are consistent with the accounting policies adopted by Te Mana Whakahaere for the preparation of the financial statements.
u. Key judgements, estimates and assumptionsThe following items have been included in the financial statements as a result of key judgements or estimates.
Operating lease commitments
Te Wānanga o Aotearoa has entered into commercial property
59
Ma
na
gin
g o
ur
pe
rfo
rma
nce
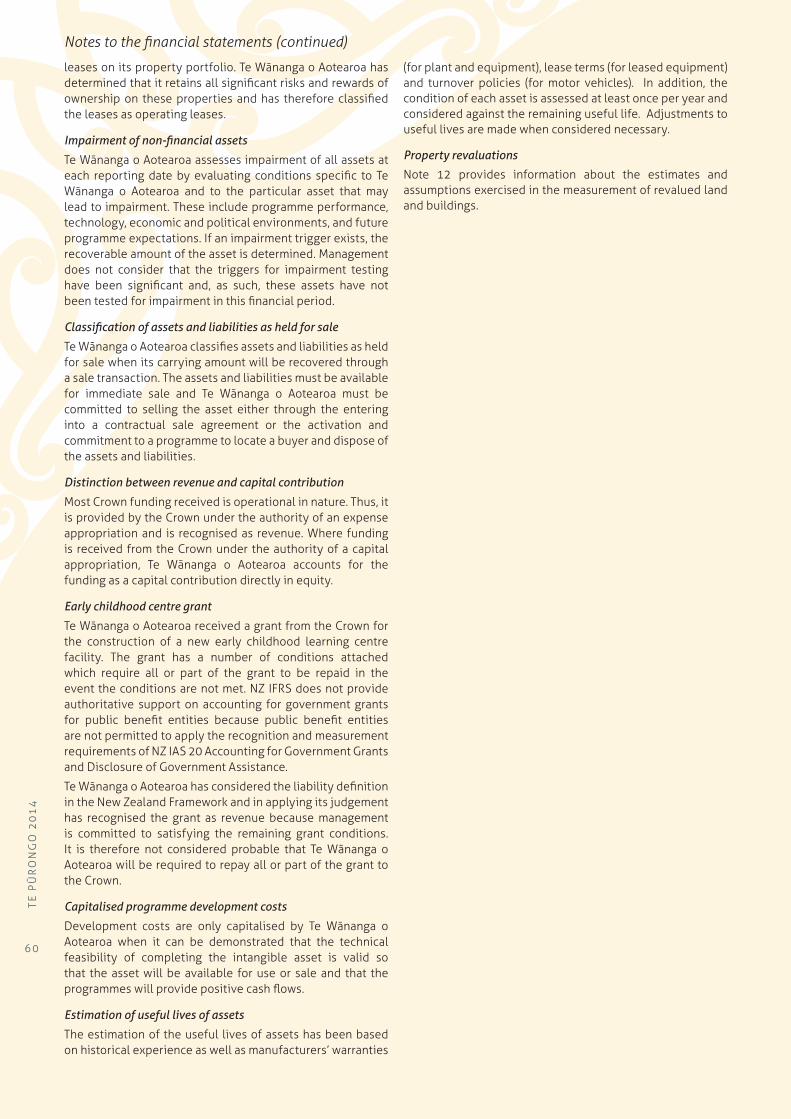
Notes to the financial statements (continued)
leases on its property portfolio. Te Wānanga o Aotearoa has determined that it retains all significant risks and rewards of ownership on these properties and has therefore classified the leases as operating leases.
Impairment of non-financial assets
Te Wānanga o Aotearoa assesses impairment of all assets at each reporting date by evaluating conditions specific to Te Wānanga o Aotearoa and to the particular asset that may lead to impairment. These include programme performance, technology, economic and political environments, and future programme expectations. If an impairment trigger exists, the recoverable amount of the asset is determined. Management does not consider that the triggers for impairment testing have been significant and, as such, these assets have not been tested for impairment in this financial period.
Classification of assets and liabilities as held for sale
Te Wānanga o Aotearoa classifies assets and liabilities as held for sale when its carrying amount will be recovered through a sale transaction. The assets and liabilities must be available for immediate sale and Te Wānanga o Aotearoa must be committed to selling the asset either through the entering into a contractual sale agreement or the activation and commitment to a programme to locate a buyer and dispose of the assets and liabilities.
Distinction between revenue and capital contribution
Most Crown funding received is operational in nature. Thus, it is provided by the Crown under the authority of an expense appropriation and is recognised as revenue. Where funding is received from the Crown under the authority of a capital appropriation, Te Wānanga o Aotearoa accounts for the funding as a capital contribution directly in equity.
Early childhood centre grant
Te Wānanga o Aotearoa received a grant from the Crown for the construction of a new early childhood learning centre facility. The grant has a number of conditions attached which require all or part of the grant to be repaid in the event the conditions are not met. NZ IFRS does not provide authoritative support on accounting for government grants for public benefit entities because public benefit entities are not permitted to apply the recognition and measurement requirements of NZ IAS 20 Accounting for Government Grants and Disclosure of Government Assistance.
Te Wānanga o Aotearoa has considered the liability definition in the New Zealand Framework and in applying its judgement has recognised the grant as revenue because management is committed to satisfying the remaining grant conditions. It is therefore not considered probable that Te Wānanga o Aotearoa will be required to repay all or part of the grant to the Crown.
Capitalised programme development costs
Development costs are only capitalised by Te Wānanga o Aotearoa when it can be demonstrated that the technical feasibility of completing the intangible asset is valid so that the asset will be available for use or sale and that the programmes will provide positive cash flows.
Estimation of useful lives of assets
The estimation of the useful lives of assets has been based on historical experience as well as manufacturers’ warranties
(for plant and equipment), lease terms (for leased equipment) and turnover policies (for motor vehicles). In addition, the condition of each asset is assessed at least once per year and considered against the remaining useful life. Adjustments to useful lives are made when considered necessary.
Property revaluations
Note 12 provides information about the estimates and assumptions exercised in the measurement of revalued land and buildings.
6 0
TE
PŪ
RO
NG
O 2
01
4
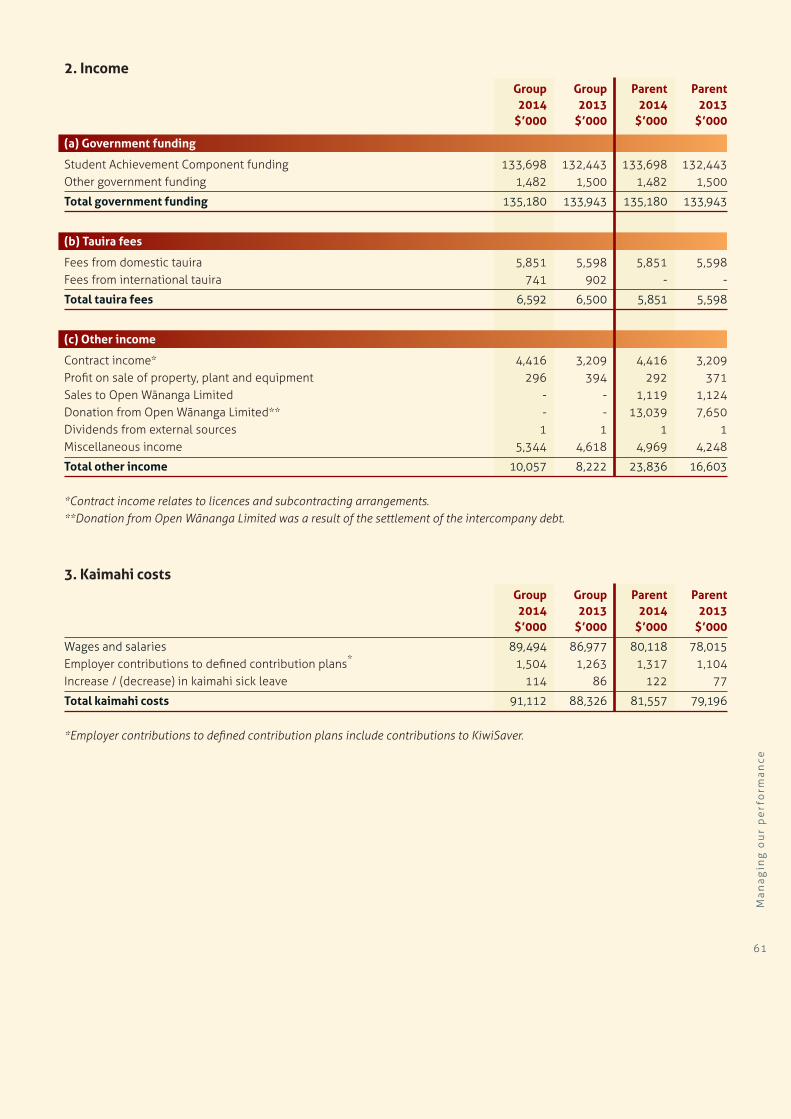
2. Income Group Group Parent Parent 2014 2013 2014 2013 $’000 $’000 $’000 $’000
(a) Government funding
Student Achievement Component funding 133,698 132,443 133,698 132,443Other government funding 1,482 1,500 1,482 1,500
Total government funding 135,180 133,943 135,180 133,943
(b) Tauira fees
Fees from domestic tauira 5,851 5,598 5,851 5,598Fees from international tauira 741 902 - -
Total tauira fees 6,592 6,500 5,851 5,598
(c) Other income
Contract income* 4,416 3,209 4,416 3,209Profit on sale of property, plant and equipment 296 394 292 371Sales to Open Wānanga Limited - - 1,119 1,124Donation from Open Wānanga Limited** - - 13,039 7,650Dividends from external sources 1 1 1 1Miscellaneous income 5,344 4,618 4,969 4,248
Total other income 10,057 8,222 23,836 16,603
*Contract income relates to licences and subcontracting arrangements.**Donation from Open Wānanga Limited was a result of the settlement of the intercompany debt.
3. Kaimahi costs Group Group Parent Parent 2014 2013 2014 2013 $’000 $’000 $’000 $’000
Wages and salaries 89,494 86,977 80,118 78,015Employer contributions to defined contribution plans* 1,504 1,263 1,317 1,104Increase / (decrease) in kaimahi sick leave 114 86 122 77
Total kaimahi costs 91,112 88,326 81,557 79,196 *Employer contributions to defined contribution plans include contributions to KiwiSaver.
61
Ma
na
gin
g o
ur
pe
rfo
rma
nce

4. Other expenses Group Group Parent Parent 2014 2013 2014 2013 $’000 $’000 $’000 $’000
Fees to auditorFees to Audit New Zealand for audit of financial statements 300 289 200 195
Management fees 1,107 1,296 - -Administration* 12,911 14,430 10,230 10,916Impairment of receivables (note 6) 101 (33) 101 (33)Bad debts written off 213 128 213 128Sponsorship and koha 150 279 143 262Satellite payments 1,670 1,900 1,670 1,900 Intercompany expenses
Payments to Open Wānanga Limited - - 23,498 24,031Payments to Aotearoa Scholarship Trust - - 5 5Donation to Open Wānanga Limited - - 382 -
Small capital purchases 2,134 1,716 1,969 1,493Consultancy fees* 4,087 4,279 2,746 2,987Inventories consumed 2,510 2,298 2,510 2,298Tauira resources 8,875 10,075 6,970 8,162Travel* 1,483 1,966 1,483 1,964Occupancy expenses* 6,677 6,532 6,212 6,020Rent 2,229 2,369 1,020 1,137Minimum lease payments – operating lease 3,569 3,378 3,569 3,378Impairment of property, plant and equipment and stock 968 205 320 205Loss on sale of property, plant and equipment 288 34 239 -
Total other expenses 49,272 51,141 63,480 65,048 * Te Raumairanga costs of $657K is included here. The total Te Raumairanga costs are $2.5m. Refer to note 24 for further information.
5. Cash and cash equivalents Group Group Parent Parent 2014 2013 2014 2013 $’000 $’000 $’000 $’000
Cash at bank and in hand 5,136 3,034 3,372 1,924
Total cash and cash equivalents 5,136 3,034 3,372 1,924
The carrying value of cash at bank and term deposits with maturities less than three months approximates their fair value.
There were no cash or cash equivalent balances held at 31 December 2014 that were not available for use by the group.
Reconciliation of cash for the purpose of the cash flow statement
For the purpose of the cash flow statement, cash and cash equivalents comprise the following as at 31 December.
Group Group Parent Parent 2014 2013 2014 2013 $’000 $’000 $’000 $’000
Cash at bank and in hand 5,136 3,034 3,372 1,924
Total cash and cash equivalents 5,136 3,034 3,372 1,924
Notes to the financial statements (continued)
62
TE
PŪ
RO
NG
O 2
01
4

6. Tauira and other receivables Group Group Parent Parent 2014 2013 2014 2013 $’000 $’000 $’000 $’000
Tauira receivables
Tauira fee receivables 678 928 678 928Less: provision for impairment (76) - (76) -
Net tauira fee receivables 602 928 602 928
Other receivables
Trade receivables 869 1,005 868 1,001Accrued interest 1,754 1,164 1,723 1,119Related party receivables
Subsidiary (note 20) - - 3 11Other related party (note 20) 19 79 - -
Gross tauira and other receivables 2,642 2,248 2,594 2,131Less: provision for impairment (25) - (25) -
Total tauira and other receivables 3,219 3,176 3,171 3,059
Fair Value
Other receivables are non-interest bearing and receipt is normally on 30-day terms. Therefore the carrying value of other receivables approximates their fair value.
Tauira receivables are non-interest bearing and receipt is normally on enrolment and no later than graduation. Therefore the carrying value of tauira receivables approximates their fair value.
63
Ma
na
gin
g o
ur
pe
rfo
rma
nce

6. Tauira and other receivables (continued)
Impairment
The ageing profile of receivables at year end is detailed below:
2014 2013 Gross Impairment Net Gross Impairment Net $’000 $’000 $’000 $’000 $’000 $’000Group
Not past due 2,242 - 2,242 1,551 - 1,551Past due 1-60 days 41 - 41 444 - 444Past due 61-120 days 152 - 152 269 - 269Past due > 120 days 885 (101) 784 912 - 912
Total 3,320 (101) 3,219 3,176 - 3,176
Parent
Not past due 2,214 - 2,214 1,517 - 1,517Past due 1-60 days 41 - 41 444 - 444Past due 61-120 days 151 - 151 186 - 186Past due > 120 days 866 (101) 765 912 - 912
Total 3,272 (101) 3,171 3,059 - 3,059
All receivables greater than 30 days in age are considered to be past due.
The impairment provision has been calculated based on expected losses for Te Wānanga o Aotearoa and the pool of receivables.
Expected losses have been determined based on an analysis of losses for Te Wānanga o Aotearoa in previous periods and a review of specific receivables.
Other impaired receivables have been determined to be impaired because of the significant financial difficulties being experienced by the debtor.
Movements in the provision for impairment of receivables are as follows:
Group Group Parent Parent 2014 2013 2014 2013 $’000 $’000 $’000 $’000
At 1 January - 33 - 33Additional provisions made during the year 274 95 274 95Receivables written off during the period (173) (128) (173) (128)
At 31 December 101 - 101 -
7. Inventory Group Group Parent Parent 2014 2013 2014 2013 $’000 $’000 $’000 $’000
Inventories held for distribution 1,882 2,580 1,847 1,225
The carrying amount of inventories for distribution are measured at cost as at 31 December 2014 and therefore, the carrying amount at current replacement cost is NIL (2013 - NIL).
Inventories are made up of consumables and inventories held for distribution to rohe. Consumables are materials or supplies which will be consumed in conjunction with the delivery of services and predominantly comprise books and resources used in the teaching of courses to tauira.
The write down of inventories held for distribution due to tauira resources being revised and redeveloped amounted to $98,953 in 2014 (2013 - $61,442). There have been no reversals of write-downs (2013 - NIL).
No inventories are pledged as security for liabilities.
Notes to the financial statements (continued)
64
TE
PŪ
RO
NG
O 2
01
4

9. Other financial assets Group Group Parent Parent 2014 2013 2014 2013 $’000 $’000 $’000 $’000
Current portion
Term deposits with maturities of 4-12 months 32,626 38,699 30,526 36,000
Total current portion 32,626 38,699 30,526 36,000
Non-current portion
Term deposits with maturities >12 months 25,500 12,106 25,500 12,106
Total non-current portion 25,500 12,106 25,500 12,106
Total other financial assets 58,126 50,805 56,026 48,106
Fair Value
Term deposits
The carrying amount of term deposits approximates their fair value. The weighted average effective interest rate for term deposits is 4.91% (2013 - 4.65%).
Impairments
There were no impairment provisions for other financial assets. None of the assets are either past due or impaired.
New Zealand BondDuring 2014, the bond held matured. In 2013 the fair value of the bond was $5,012,352. Fair value was determined by discounting future interest cash flows using a discount rate based on the market rate on the bond at balance date with principal terms to maturity that match as closely as possible the cash flows of the bond held.
8. Assets for saleTe Wānanga o Aotearoa owns three buildings located in Auckland, Huntly and Gisborne and land in Palmerston North that are Assets Held for Sale.
The three buildings were built by tauira as part of Te Wānanga o Aotearoa carpentry programme. These buildings have been presented as Assets Held for Sale, with expected completion dates for all sales due in April 2015. The land in Palmerston North is with the Office of Treaty Settlements being assessed.
Group Group Parent Parent 2014 2013 2014 2013 $’000 $’000 $’000 $’000
Assets held for sale
Buildings 739 189 739 189
Total assets held for sale 739 189 739 189
65
Ma
na
gin
g o
ur
pe
rfo
rma
nce

11. Provisions
(a) Kaimahi entitlements Group Group Parent Parent 2014 2013 2014 2013 $’000 $’000 $’000 $’000
Accrued salaries 1,282 577 1,151 506Other entitlements 715 - 715 -Annual leave 6,167 5,412 5,931 4,858Sick leave 423 294 407 270
Total kaimahi entitlements 8,587 6,283 8,204 5,634
Annual leave and sick leave entitlements expected to be settled within 12 months of the balance sheet date are measured at the current rates of pay and classified as current liabilities.
(b) Lease make-good Group Group Parent Parent 2014 2013 2014 2013 $’000 $’000 $’000 $’000
Current portionLease make-good 104 118 82 40
Total current portion 104 118 82 40
Non-current portionLease make-good 196 77 149 77
Total non-current portion 196 77 149 77
Total lease make-good 300 195 231 117
Notes to the financial statements (continued)
10. Creditors and other payables Group Group Parent Parent 2014 2013 2014 2013 $’000 $’000 $’000 $’000
Trade payables 3,208 3,201 2,653 2,639Accrued expenses 2,397 2,031 2,351 1,936Other government funding 391 247 391 247Income in advance 117 59 85 59PAYE payable 1,846 1,778 1,640 1,578
GST payable 1,421 1,360 1,284 1,190 9,380 8,676 8,404 7,649Related party payable:Subsidiary - Open Wānanga Limited and Aotearoa Scholarship Trust - - - 2,110
Total creditors and other payables 9,380 8,676 8,404 9,759
Creditors and other payables are non-interest bearing and are normally settled on terms varying between 7 days and 20th of the month following invoice date. Therefore, the carrying value of trade and other payables approximates their fair value.
For terms and conditions relating to related parties payables, refer to note 20.
66
TE
PŪ
RO
NG
O 2
01
4

11. Provisions (continued)GroupMovements for each class of provision are as follows: Lease make-good Total $’000 $’000
Balance at 1 January 2014 195 195Additional provisions 143 143Amounts used - -Unused amounts reversed (33) (33)Discount unwind - -Utilised during the year (5) (5)
Balance at 31 December 2014 300 300
Lease make-good Total $’000 $’000
Balance at 1 January 2013 195 195 Additional provisions - - Amounts used - - Unused amounts reversed - - Discount unwind - -
Balance at 31 December 2013 195 195
ParentMovements for each class of provision are as follows: Lease make-good Total $’000 $’000
Balance at 1 January 2014 117 117Additional provisions 114 114Amounts used - -Unused amounts reversed - -Discount unwind - -
Balance at 31 December 2014 231 231
Lease make-good Total $’000 $’000
Balance at 1 January 2013 117 117 Additional provisions - - Amounts used - - Unused amounts reversed - - Discount unwind - -
Balance at 31 December 2013 117 117
In respect of a number of leased premises, Te Wānanga o Aotearoa is required at the expiry of the lease term to make-good any fixtures or fittings installed in the premises. In many cases, Te Wānanga o Aotearoa has the option to renew these leases, which impacts on the timing of expected cash outflows to make-good the premises.
The cash flows associated with the non-current portion of the lease make-good provision are expected to occur in December 2016, 2017 and August 2018. Information about Te Wānanga o Aotearoa leasing arrangements are disclosed in note 19.
67
Ma
na
gin
g o
ur
pe
rfo
rma
nce

12. Property, Plant and Equipment Virtual Leasehold Furniture & Motor Learning Work in Land Buildings Improvements equipment Computers Vehicles Waka Artwork Library Computers Progress Total $’000 $’000 $’000 $’000 $’000 $’000 $’000 $’000 $’000 $’000 $’000 $’000
Group 2014
Opening cost at 1 January 2014 23,280 49,988 7,073 1,575 4,255 10,388 1,312 3,575 6,052 2,394 1,061 110,953Additions 250 4,611 414 517 308 2,212 47 367 611 402 4,442 14,181Disposals (250) (1,270) (106) (164) (622) (2,772) (26) (263) - - (4,293) (9,766)Reclassification (700) (1,096) 6 6 (6) (23) 23 - - - - (1,790)Impairment - - (420) (167) (1,356) - - (30) - (1,172) - (3,145)Revaluation - - - - - - - - - - - -
Closing cost at 31 December 2014 22,580 52,233 6,967 1,767 2,579 9,805 1,356 3,649 6,663 1,624 1,210 110,433
Opening accumulated depreciation at 1 January 2014 - (2,983) (1,819) (1,079) (2,750) (6,207) (730) - (3,390) (1,996) - (20,954)Depreciation - (2,964) (570) (237) (661) (1,487) (434) - (692) (447) - (7,494)Disposals - 179 20 128 584 2,220 - - - - - 3,131Reclassification - - - (6) 6 - - - - - - -Impairment - - 420 167 1,152 - - - - 1,172 - 2,911Revaluation - - - - - - - - - - - -
Closing accumulated depreciation at 31 December 2014 - (5,768) (1,949) (1,027) (1,669) (5,474) (1,164) - (4,082) (1,271) - (22,404)
NBV At 1 January 2014 23,280 47,005 5,254 496 1,505 4,181 582 3,575 2,662 398 1,061 89,999
NBV At 31 December 2014 22,580 46,465 5,018 740 910 4,331 192 3,649 2,581 353 1,210 88,029
Group 2013
Opening cost at 1 January 2013 23,280 47,333 2,961 1,718 3,435 9,490 1,272 3,448 6,216 2,615 1,273 103,041Additions - 2,920 3,911 139 1,115 2,344 40 147 715 391 6,886 18,608Disposals - - (44) - - (1,446) - (2) - - (7,098) (8,590)Reclassification - (265) 265 - - - - - - - - -Impairment - - (20) (282) (295) - - (18) (879) (612) - (2,106)Revaluations - - - - - - - - - - - -
Closing cost at 31 December 2013 23,280 49,988 7,073 1,575 4,255 10,388 1,312 3,575 6,052 2,394 1,061 110,953
Opening accumulated depreciation at 1 January 2013 - - (1,523) (1,146) (2,593) (6,213) (685) - (3,558) (2,201) - (17,919)Depreciation - (2,985) (315) (213) (444) (1,400) (45) - (711) (407) - (6,520)Disposals - - 10 - - 1,406 - - - - - 1,416Reclassification - 2 (2) - - - - - - - - -Impairment - - 11 280 287 - - - 879 612 - 2,069Revaluations - - - - - - - - - - - -
Closing accumulated depreciation at 31 December 2013 - (2,983) (1,819) (1,079) (2,750) (6,207) (730) - (3,390) (1,996) - (20,954)
NBV At 1 January 2013 23,280 47,333 1,438 572 842 3,277 587 3,448 2,658 414 1,273 85,122
NBV At 31 December 2014 23,280 47,005 5,254 496 1,505 4,181 582 3,575 2,662 398 1,061 89,999
Notes to the financial statements (continued)
6 8
TE
PŪ
RO
NG
O 2
01
4

12. Property, Plant and Equipment Virtual Leasehold Furniture & Motor Learning Work in Land Buildings Improvements equipment Computers Vehicles Waka Artwork Library Computers Progress Total $’000 $’000 $’000 $’000 $’000 $’000 $’000 $’000 $’000 $’000 $’000 $’000
Group 2014
Opening cost at 1 January 2014 23,280 49,988 7,073 1,575 4,255 10,388 1,312 3,575 6,052 2,394 1,061 110,953Additions 250 4,611 414 517 308 2,212 47 367 611 402 4,442 14,181Disposals (250) (1,270) (106) (164) (622) (2,772) (26) (263) - - (4,293) (9,766)Reclassification (700) (1,096) 6 6 (6) (23) 23 - - - - (1,790)Impairment - - (420) (167) (1,356) - - (30) - (1,172) - (3,145)Revaluation - - - - - - - - - - - -
Closing cost at 31 December 2014 22,580 52,233 6,967 1,767 2,579 9,805 1,356 3,649 6,663 1,624 1,210 110,433
Opening accumulated depreciation at 1 January 2014 - (2,983) (1,819) (1,079) (2,750) (6,207) (730) - (3,390) (1,996) - (20,954)Depreciation - (2,964) (570) (237) (661) (1,487) (434) - (692) (447) - (7,494)Disposals - 179 20 128 584 2,220 - - - - - 3,131Reclassification - - - (6) 6 - - - - - - -Impairment - - 420 167 1,152 - - - - 1,172 - 2,911Revaluation - - - - - - - - - - - -
Closing accumulated depreciation at 31 December 2014 - (5,768) (1,949) (1,027) (1,669) (5,474) (1,164) - (4,082) (1,271) - (22,404)
NBV At 1 January 2014 23,280 47,005 5,254 496 1,505 4,181 582 3,575 2,662 398 1,061 89,999
NBV At 31 December 2014 22,580 46,465 5,018 740 910 4,331 192 3,649 2,581 353 1,210 88,029
Group 2013
Opening cost at 1 January 2013 23,280 47,333 2,961 1,718 3,435 9,490 1,272 3,448 6,216 2,615 1,273 103,041Additions - 2,920 3,911 139 1,115 2,344 40 147 715 391 6,886 18,608Disposals - - (44) - - (1,446) - (2) - - (7,098) (8,590)Reclassification - (265) 265 - - - - - - - - -Impairment - - (20) (282) (295) - - (18) (879) (612) - (2,106)Revaluations - - - - - - - - - - - -
Closing cost at 31 December 2013 23,280 49,988 7,073 1,575 4,255 10,388 1,312 3,575 6,052 2,394 1,061 110,953
Opening accumulated depreciation at 1 January 2013 - - (1,523) (1,146) (2,593) (6,213) (685) - (3,558) (2,201) - (17,919)Depreciation - (2,985) (315) (213) (444) (1,400) (45) - (711) (407) - (6,520)Disposals - - 10 - - 1,406 - - - - - 1,416Reclassification - 2 (2) - - - - - - - - -Impairment - - 11 280 287 - - - 879 612 - 2,069Revaluations - - - - - - - - - - - -
Closing accumulated depreciation at 31 December 2013 - (2,983) (1,819) (1,079) (2,750) (6,207) (730) - (3,390) (1,996) - (20,954)
NBV At 1 January 2013 23,280 47,333 1,438 572 842 3,277 587 3,448 2,658 414 1,273 85,122
NBV At 31 December 2014 23,280 47,005 5,254 496 1,505 4,181 582 3,575 2,662 398 1,061 89,999
69
Ma
na
gin
g o
ur
pe
rfo
rma
nce

12. Property, Plant and Equipment (continued) Virtual Leasehold Furniture & Motor Learning Work in Land Buildings Improvements equipment Computers Vehicles Waka Artwork Library Computers Progress Total $’000 $’000 $’000 $’000 $’000 $’000 $’000 $’000 $’000 $’000 $’000 $’000
Parent 2014
Opening cost at 1 January 2014 23,030 48,723 6,704 1,254 2,920 8,886 1,312 3,302 6,049 2,394 1,061 105,635Additions 250 4,606 373 468 211 1,962 47 347 609 402 4,442 13,717Disposals - - - - - (1,127) (26) - - - (4,293) (5,446)Reclassification (700) (1,096) 6 6 (6) (23) 23 - - - - (1,790)Impairment - - (420) (167) (728) - - - - (1,172) - (2,487)Revaluation - - - - - - - - - - - -
Closing cost at 31 December 2014 22,580 52,233 6,663 1,561 2,397 9,698 1,356 3,649 6,658 1,624 1,210 109,629
Opening accumulated depreciation at 1 January 2014 - (2,889) (1,651) (912) (2,001) (5,298) (730) - (3,390) (1,996) - (18,867)Depreciation - (2,879) (545) (191) (322) (1,271) (434) - (692) (447) - (6,781)Disposals - - - - - 1,145 - - - - - 1,145Reclassification - - - (6) 6 - - - - - - -Impairment - - 420 167 728 - - - - 1,172 - 2,487Revaluation - - - - - - - - - - - -
Closing accumulated depreciation at 31 December 2014 - (5,768) (1,776) (942) 1,589 (5,424) (1,164) - (4,082) (1,271) - (22,016)
NBV At 1 January 2014 23,030 45,834 5,053 342 919 3,588 582 3,302 2,659 398 1,061 86,768
NBV At 31 December 2014 22,580 46,465 4,887 619 808 4,274 192 3,649 2,576 353 1,210 87,613
Parent 2013
Opening cost at 1 January 2013 23,030 46,133 2,684 1,413 2,668 8,234 1,272 3,210 6,216 2,615 1,196 98,671Additions - 2,855 3,775 123 547 2,009 40 112 712 391 6,886 17,450Disposals - - - - - (1,357) - (2) - - (7,021) (8,380)Reclassification - (265) 265 - - - - - - - - -Impairment - - (20) (282) (295) - - (18) (879) (612) - (2,106)Revaluations - - - - - - - - - - - -
Closing cost at 31 December 2013 23,030 48,723 6,704 1,254 2,920 8,886 1,312 3,302 6,049 2,394 1,061 105,635
Opening accumulated depreciation at 1 January 2013 - - (1,393) (1,027) (1,999) (5,454) (685) - (3,558) (2,201) - (16,317)Depreciation - (2,891) (267) (165) (289) (1,167) (45) - (711) (407) - (5,942)Disposals - - - - - 1,323 - - - - - 1,323Reclassification - 2 (2) - - - - - - - - -Impairment - - 11 280 287 - - - 879 612 - 2,069Revaluations - - - - - - - - - - - -
Closing accumulated depreciation at 31 December 2013 - (2,889) (1,651) (912) (2,001) (5,298) (730) - (3,390) (1,996) - (18,867)
NBV At 1 January 2013 23,030 46,133 1,291 386 669 2,780 587 3,210 2,658 414 1,196 82,354
NBV At 31 December 2013 23,030 45,834 5,053 342 919 3,588 582 3,302 2,659 398 1,061 86,768
Notes to the financial statements (continued)
70
TE
PŪ
RO
NG
O 2
01
4

12. Property, Plant and Equipment (continued) Virtual Leasehold Furniture & Motor Learning Work in Land Buildings Improvements equipment Computers Vehicles Waka Artwork Library Computers Progress Total $’000 $’000 $’000 $’000 $’000 $’000 $’000 $’000 $’000 $’000 $’000 $’000
Parent 2014
Opening cost at 1 January 2014 23,030 48,723 6,704 1,254 2,920 8,886 1,312 3,302 6,049 2,394 1,061 105,635Additions 250 4,606 373 468 211 1,962 47 347 609 402 4,442 13,717Disposals - - - - - (1,127) (26) - - - (4,293) (5,446)Reclassification (700) (1,096) 6 6 (6) (23) 23 - - - - (1,790)Impairment - - (420) (167) (728) - - - - (1,172) - (2,487)Revaluation - - - - - - - - - - - -
Closing cost at 31 December 2014 22,580 52,233 6,663 1,561 2,397 9,698 1,356 3,649 6,658 1,624 1,210 109,629
Opening accumulated depreciation at 1 January 2014 - (2,889) (1,651) (912) (2,001) (5,298) (730) - (3,390) (1,996) - (18,867)Depreciation - (2,879) (545) (191) (322) (1,271) (434) - (692) (447) - (6,781)Disposals - - - - - 1,145 - - - - - 1,145Reclassification - - - (6) 6 - - - - - - -Impairment - - 420 167 728 - - - - 1,172 - 2,487Revaluation - - - - - - - - - - - -
Closing accumulated depreciation at 31 December 2014 - (5,768) (1,776) (942) 1,589 (5,424) (1,164) - (4,082) (1,271) - (22,016)
NBV At 1 January 2014 23,030 45,834 5,053 342 919 3,588 582 3,302 2,659 398 1,061 86,768
NBV At 31 December 2014 22,580 46,465 4,887 619 808 4,274 192 3,649 2,576 353 1,210 87,613
Parent 2013
Opening cost at 1 January 2013 23,030 46,133 2,684 1,413 2,668 8,234 1,272 3,210 6,216 2,615 1,196 98,671Additions - 2,855 3,775 123 547 2,009 40 112 712 391 6,886 17,450Disposals - - - - - (1,357) - (2) - - (7,021) (8,380)Reclassification - (265) 265 - - - - - - - - -Impairment - - (20) (282) (295) - - (18) (879) (612) - (2,106)Revaluations - - - - - - - - - - - -
Closing cost at 31 December 2013 23,030 48,723 6,704 1,254 2,920 8,886 1,312 3,302 6,049 2,394 1,061 105,635
Opening accumulated depreciation at 1 January 2013 - - (1,393) (1,027) (1,999) (5,454) (685) - (3,558) (2,201) - (16,317)Depreciation - (2,891) (267) (165) (289) (1,167) (45) - (711) (407) - (5,942)Disposals - - - - - 1,323 - - - - - 1,323Reclassification - 2 (2) - - - - - - - - -Impairment - - 11 280 287 - - - 879 612 - 2,069Revaluations - - - - - - - - - - - -
Closing accumulated depreciation at 31 December 2013 - (2,889) (1,651) (912) (2,001) (5,298) (730) - (3,390) (1,996) - (18,867)
NBV At 1 January 2013 23,030 46,133 1,291 386 669 2,780 587 3,210 2,658 414 1,196 82,354
NBV At 31 December 2013 23,030 45,834 5,053 342 919 3,588 582 3,302 2,659 398 1,061 86,768
71
Ma
na
gin
g o
ur
pe
rfo
rma
nce

12. Property, plant and equipment (continued)
Valuation
Land Land is valued at fair value using market-based evidence based on its highest and best use with reference to comparable land values.
The most recent valuation of land was performed by registered independent valuers William Hickey and Dave Wigmore of Jones Lang LaSalle and the valuation is effective as at 31 December 2012.
Buildings Specialised buildings (for example, campuses) are valued at fair value using depreciated replacement cost as no reliable market data is available for buildings designed for education delivery purposes.
Depreciated replacement cost is determined using a number of significant assumptions including:
• The replacement asset is based on the reproduction cost of the specific assets with adjustments where appropriate for obsolescence due to over-design or surplus capacity.
• The replacement cost is derived from recent construction contracts of similar assets and Property Institute of New Zealand cost information.
• The remaining life of assets is estimated.
• Straight-line depreciation has been applied in determining the depreciated replacement cost value of the asset.
Non-specialised buildings (for example, residential buildings) are revalued at fair value using market-based evidence. Market rates and capitalisation rates were applied to reflect market value.
The most recent valuation of buildings was performed by registered independent valuers William Hickey and Dave Wigmore of Jones Lang LaSalle and the valuation is effective as at 31 December 2012.
Work in progress
The total value of property, plant and equipment in the course of construction is $1,210,280 (2013 - $1,060,650).
Notes to the financial statements (continued)
72
TE
PŪ
RO
NG
O 2
01
4

13. Intangible assetsProgramme development costs were incurred in developing NCEA L2 Curriculum, Te Reo Māori Degree, Mahi Toa, Mauri Ora Level 4, Papa Whairawa, Papa Kupu, He Papa Tikanga, Te Ara Reo Māori, Ako Ki Tawhiti and Papa Reo.
Programme Work in Software Development Progress Total $’000 $’000 $’000 $’000
Group 2014
Opening cost at 1 January 2014 3,688 13,261 1,796 18,745Additions 1,152 3,661 1,893 6,706Disposals (1,978) (6,565) (1,532) (10,075)Impairment - - (835) (835)
Closing cost at 31 December 2014 2,862 10,357 1,322 14,541
Opening accumulated amortisation at 1 January 2014 (2,269) (8,852) - (11,121)Amortisation (595) (1,478) - (2,073)Impairment - 200 - 200Disposals 1,183 4,120 - 5,303
Closing accumulated amortisation at 31 December 2014 (1,681) (6,010) - (7,691)
NBV at 1 January 2014 1,419 4,409 1,796 7,624
NBV at 31 December 2014 1,181 4,347 1,322 6,850
Group 2013
Opening cost at 1 January 2013 2,931 10,988 2,210 16,129Additions 850 2,516 2,110 5,476 Impairment (93) (243) - (336)Disposals - - (2,524) (2,524)
Closing cost at 31 December 2013 3,688 13,261 1,796 18,745
Opening accumulated amortisation at 1 January 2013 (1,830) (7,801) - (9,631)Amortisation (503) (1,216) - (1,719) Impairment 64 165 - 229
Closing accumulated amortisation at 31 December 2013 (2,269) (8,852) - (11,121)
NBV at 1 January 2013 1,101 3,187 2,210 6,498
NBV at 31 December 2013 1,419 4,409 1,796 7,624
73
Ma
na
gin
g o
ur
pe
rfo
rma
nce

13. Intangible assets (continued) Programme Software Development WIP Total $’000 $’000 $’000 $’000
Parent 2014
Opening cost at 1 January 2014 1,775 7,850 898 10,523Additions 1,024 2,672 1,225 4,921Disposals - - (835) (835)Impairment - (271) (150) (421)
Closing cost at 31 December 2014 2,799 10,251 1,138 14,188
Opening accumulated amortisation at 1 January 2014 (1,343) (5,252) - (6,595)Amortisation (326) (852) - (1,178)Impairment - 200 - 200
Closing accumulated amortisation at 31 December 2014 (1,669) (5,904) - (7,573)
NBV at 1 January 2014 432 2,598 898 3,928
NBV at 31 December 2014 1,130 4,347 1,138 6,615
Parent 2013
Opening cost at 1 January 2013 1,790 6,481 1,395 9,666Additions 78 1,612 1,123 2,813 Impairment (93) (243) - (336)Disposals - - (1,620) (1,620)
Closing cost at 31 December 2013 1,775 7,850 898 10,523
Opening accumulated amortisation at 1 January 2013 (1,068) (4,664) - (5,732)Amortisation (339) (753) - (1,092) Impairment 64 165 - 229
Closing accumulated amortisation at 31 December 2013 (1,343) (5,252) - (6,595)
NBV at 1 January 2013 722 1,817 1,395 3,934
NBV at 31 December 2013 432 2,598 898 3,928
There are no restrictions over the title of Te Wānanga o Aotearoa intangible assets, nor are any intangible assets pledged as security for liabilities.Te Wānanga o Aotearoa wrote of intangible assets of $421,170 in 2014 consisting of NZ Career Preparation (Health), Post Graduate Diploma in Adult Education, Bachelor Māori Advancement (Hauora), Certificate Iwi Marine, Diploma in Tū Taua (2013 - $336,139).
Notes to the financial statements (continued)
74
TE
PŪ
RO
NG
O 2
01
4

14. Equity
Group Group Parent Parent 2014 2013 2014 2013 $’000 $’000 $’000 $’000
Retained earnings
Balance at 1 January 133,269 129,240 120,943 113,157Surplus/(deficit) 5,076 4,029 14,946 7,786Property revaluation reserve transfer on disposal 122 - - -
Balance at 31 December 138,467 133,269 135,889 120,943
Property revaluation reserves
Balance at 1 January 9,524 9,524 9,402 9,402Property revaluation reserve transfer on disposal (122) - - - Gains/(loss) on property revaluations - - - -
Balance at 31 December 9,402 9,524 9,402 9,402
Total equity 147,869 142,793 145,291 130,345
Property revaluation reserves
Group Group Parent Parent 2014 2013 2014 2013 $’000 $’000 $’000 $’000
Land and buildings 9,402 9,524 9,402 9,402
15. Investment in Subsidiaries Group Group Parent Parent 2014 2013 2014 2013 $000 $000 $000 $000
Shares in Open Wānanga Limited (Cost) - - 1 1 Shares in DynaSpeak Limited (Cost) - - 475 -
Total Investment in Subsidiaries - - 476 1
16. Investment Property Group Group Parent Parent 2014 2013 2014 2013 $’000 $’000 $’000 $’000
Balance at 1 January - - - - Additions from acquisitions 1,333 - 1,333 - Fair value gains/ (losses) on valuation - - - -
Balance at 31 December 1,333 - 1,333 - Rickit Road was purchased on 30 November 2014 from Open Wānanga Limited. This was recorded and depreciated in the Fixed Asset register until 31 December 2014. This property was reclassified as an investment property at 31 December 2014 as the intention was to lease the premises within three months of balance date. At 31 December 2014, the building was still occupied by the organisation and therefore the carrying amount is disclosed at cost less depreciation.
75
Ma
na
gin
g o
ur
pe
rfo
rma
nce
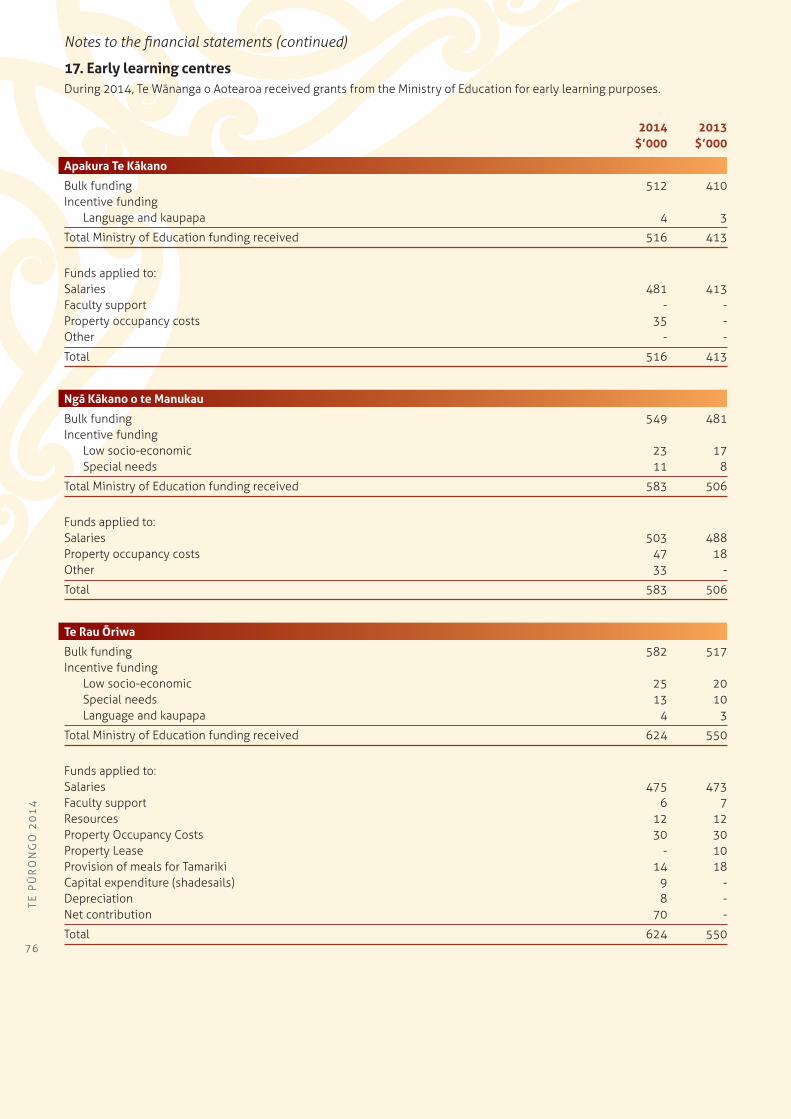
17. Early learning centresDuring 2014, Te Wānanga o Aotearoa received grants from the Ministry of Education for early learning purposes.
2014 2013 $’000 $’000
Apakura Te Kākano
Bulk funding 512 410Incentive funding
Language and kaupapa 4 3
Total Ministry of Education funding received 516 413
Funds applied to:Salaries 481 413Faculty support - -Property occupancy costs 35 -Other - -
Total 516 413
Ngā Kākano o te Manukau
Bulk funding 549 481Incentive funding
Low socio-economic 23 17Special needs 11 8
Total Ministry of Education funding received 583 506
Funds applied to:Salaries 503 488Property occupancy costs 47 18Other 33 -
Total 583 506
Te Rau Ōriwa
Bulk funding 582 517Incentive funding
Low socio-economic 25 20Special needs 13 10Language and kaupapa 4 3
Total Ministry of Education funding received 624 550
Funds applied to:Salaries 475 473Faculty support 6 7Resources 12 12Property Occupancy Costs 30 30Property Lease - 10Provision of meals for Tamariki 14 18Capital expenditure (shadesails) 9 -Depreciation 8 -Net contribution 70 -
Total 624 550
Notes to the financial statements (continued)
76
TE
PŪ
RO
NG
O 2
01
4

17. Early learning centres (continued) 2014 2013 $’000 $’000
Raroera Te Puāwai
Bulk funding 657 544Incentive funding
Low socio-economic 14 10Special needs 12 9Language and kaupapa 4 3
Total Ministry of Education funding received 687 566
Funds applied to:Salaries 543 512Faculty Support 4 -Property occupancy costs 23 -Resources 15 3Captial expenditure 9 51Provision of meals for Tamariki 12 -Depreciation 38 -Net contribution 43 -
Total 687 566
Whare Āmai
Bulk funding 393 320Incentive funding
Low socio-economic 17 19Special needs 9 10
Total Ministry of Education funding received 419 349
Funds applied to:Salaries - 349Property occupancy costs - -Other 419 -
Total 419 349
18. Financial instruments
Financial instrument categoriesThe accounting policies for financial instruments have been applied to the line items below:
Group Group Parent Parent 2014 2013 2014 2013 $’000 $’000 $’000 $’000Financial assets
Loans and receivables
Cash and cash equivalents 5,136 3,034 3,372 1,924Tauira and other receivables 3,219 3,176 3,171 3,059Other financial assets:Term deposits 58,126 50,805 56,026 48,106
Total loans and receivables 66,481 57,015 62,569 53,089
Financial liabilities at amortised costCreditors and other payables 9,380 8,676 8,404 9,759
Total financial liabilities at amortised cost 9,380 8,676 8,404 9,759
77
Ma
na
gin
g o
ur
pe
rfo
rma
nce
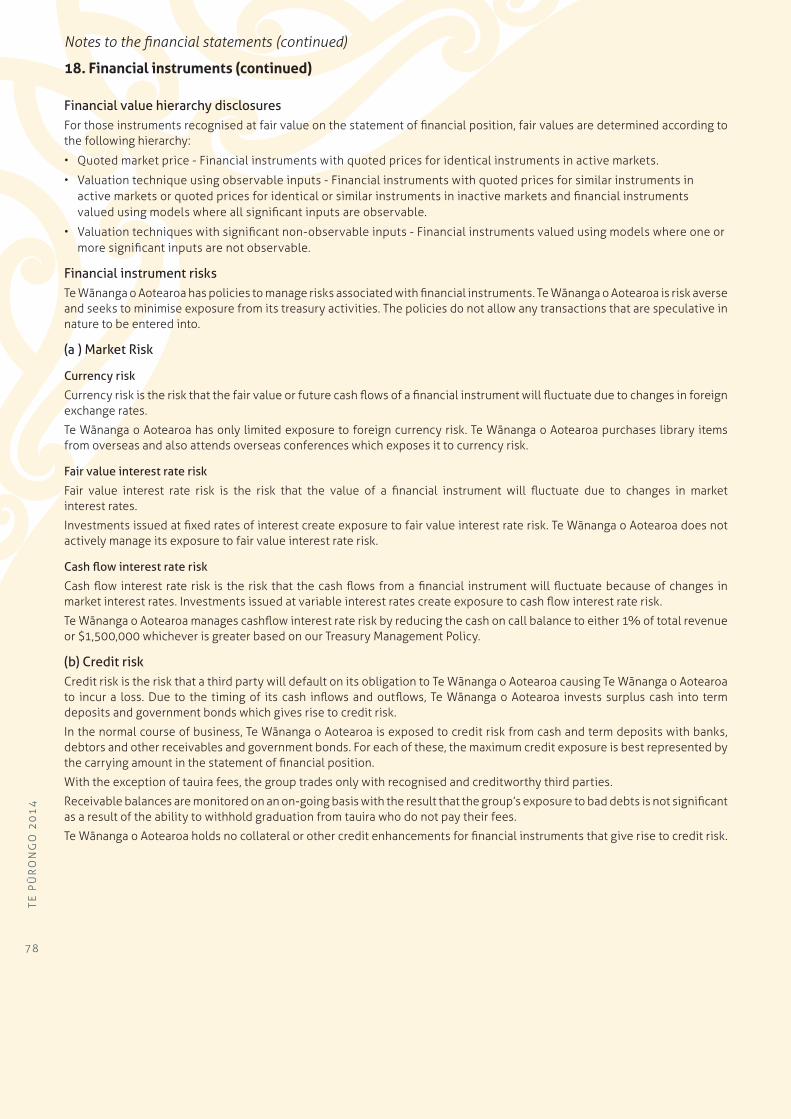
18. Financial instruments (continued)
Financial value hierarchy disclosures For those instruments recognised at fair value on the statement of financial position, fair values are determined according to the following hierarchy:
• Quoted market price - Financial instruments with quoted prices for identical instruments in active markets.
• Valuation technique using observable inputs - Financial instruments with quoted prices for similar instruments in active markets or quoted prices for identical or similar instruments in inactive markets and financial instruments valued using models where all significant inputs are observable.
• Valuation techniques with significant non-observable inputs - Financial instruments valued using models where one or more significant inputs are not observable.
Financial instrument risksTe Wānanga o Aotearoa has policies to manage risks associated with financial instruments. Te Wānanga o Aotearoa is risk averse and seeks to minimise exposure from its treasury activities. The policies do not allow any transactions that are speculative in nature to be entered into.
(a ) Market Risk
Currency risk
Currency risk is the risk that the fair value or future cash flows of a financial instrument will fluctuate due to changes in foreign exchange rates.
Te Wānanga o Aotearoa has only limited exposure to foreign currency risk. Te Wānanga o Aotearoa purchases library items from overseas and also attends overseas conferences which exposes it to currency risk.
Fair value interest rate risk
Fair value interest rate risk is the risk that the value of a financial instrument will fluctuate due to changes in market interest rates.
Investments issued at fixed rates of interest create exposure to fair value interest rate risk. Te Wānanga o Aotearoa does not actively manage its exposure to fair value interest rate risk.
Cash flow interest rate risk
Cash flow interest rate risk is the risk that the cash flows from a financial instrument will fluctuate because of changes in market interest rates. Investments issued at variable interest rates create exposure to cash flow interest rate risk.
Te Wānanga o Aotearoa manages cashflow interest rate risk by reducing the cash on call balance to either 1% of total revenue or $1,500,000 whichever is greater based on our Treasury Management Policy.
(b) Credit riskCredit risk is the risk that a third party will default on its obligation to Te Wānanga o Aotearoa causing Te Wānanga o Aotearoa to incur a loss. Due to the timing of its cash inflows and outflows, Te Wānanga o Aotearoa invests surplus cash into term deposits and government bonds which gives rise to credit risk.
In the normal course of business, Te Wānanga o Aotearoa is exposed to credit risk from cash and term deposits with banks, debtors and other receivables and government bonds. For each of these, the maximum credit exposure is best represented by the carrying amount in the statement of financial position.
With the exception of tauira fees, the group trades only with recognised and creditworthy third parties.
Receivable balances are monitored on an on-going basis with the result that the group’s exposure to bad debts is not significant as a result of the ability to withhold graduation from tauira who do not pay their fees.
Te Wānanga o Aotearoa holds no collateral or other credit enhancements for financial instruments that give rise to credit risk.
Notes to the financial statements (continued)
78
TE
PŪ
RO
NG
O 2
01
4

Credit quality of financial assets
The credit quality of financial assets that are neither past due nor impaired can be assessed by reference to Standard and Poor’s credit ratings (if available) or to historical information about counterparty default rates.
Group Group Parent Parent 2014 2013 2014 2013 $’000 $’000 $’000 $’000
Counterparties with credit ratings
Cash at bank and term depositsA+ 4,500 - 4,500 -AA- 58,762 53,839 54,898 50,030
Total cash at bank and term deposits 63,262 53,839 59,398 50,030
Counterparties without credit ratings
Tauira and other receivablesExisting counterparty with no defaults in the past 3,219 3,176 3,171 3,059
Total debtors and other receivables 3,219 3,176 3,171 3,059
Total financial instrument assets 66,481 57,015 62,569 53,089
(c) Liquidity risk
Management of liquidity risk
Liquidity risk is the risk that Te Wānanga o Aotearoa will encounter difficulty raising liquid funds to meet commitments as they fall due. Prudent liquidity risk management implies maintaining sufficient cash, the availability of funding through an adequate amount of committed credit facilities and the ability to close out market positions. Te Wānanga o Aotearoa aims to maintain flexibility in funding by keeping committed credit lines available. Te Wānanga o Aotearoa manages liquidity risk by continuously monitoring forecast and actual cash flow requirements.
Contractual maturity analysis of financial liabilities
The table below shows an analysis of Te Wānanga o Aotearoa financial liabilities grouped according to maturity, based on the remaining period at the balance date to the contractual maturity date. The amounts disclosed are the contractual undiscounted cash flows.
Carrying Contractual Less than More than amount cash flows 1 year 1-2 years 2-5 years 5 years $’000 $’000 $’000 $’000 $’000 $’000
Group 2014
Creditors and other payables 9,380 9,380 9,380 - - -Accrued pay 1,282 1,282 1,282 - - -
Total 10,662 10,662 10,662 - - -
Group 2013
Creditors and other payables 8,676 8,676 8,676 - - -Accrued pay 577 577 577 - - -
Total 9,253 9,253 9,253 - - -
Parent 2014
Creditors and other payables 8,404 8,404 8,404 - - -Accrued pay 1,151 1,151 1,151 - - -
Total 9,555 9,555 9,555 - - -
Parent 2013
Creditors and other payables 9,759 9,759 9,759 - - -Accrued pay 506 506 506 - - -
Total 10,265 10,265 10,265 - - -
79
Ma
na
gin
g o
ur
pe
rfo
rma
nce

18. Financial instruments (continued)
(c) Liquidity risk (continued)
Contractual maturity analysis of financial assets
The table below shows an analysis of Te Wānanga o Aotearoa financial liabilities grouped according to maturity, based on the remaining period at the balance date to the contractual maturity date.
Carrying Contractual Less than More than amount cash flows 1 year 1-2 years 2-5 years 5 years $’000 $’000 $’000 $’000 $’000 $’000
Group 2014
Cash and cash equivalents 5,136 5,136 5,136 - - -Tauira and other receivables 3,219 3,219 3,219 - - -Other financial assets - term deposits 58,126 58,126 32,626 25,500 - -
Total 66,481 66,481 40,981 25,500 - -
Group 2013
Cash and cash equivalents 3,034 3,034 3,034 - - -Tauira and other receivables 3,176 3,176 3,176 - - -Other financial assets - term deposits 50,805 50,805 38,699 12,106 - -
Total 57,015 57,015 44,909 12,106 - -
Parent 2014
Cash and cash equivalents 3,372 3,372 3,372 - - -Tauira and other receivables 3,171 3,171 3,171 - - -Other financial assets - term deposits 56,026 56,026 30,526 25,500 - -
Total 62,569 62,569 37,069 25,500 - -
Parent 2013
Cash and cash equivalents 1,924 1,924 1,924 - - -Tauira and other receivables 3,059 3,059 3,059 - - -Other financial assets - term deposits 48,106 48,106 36,000 12,106 - -
Total 53,089 53,089 40,983 12,106 - -
Notes to the financial statements (continued)
80
TE
PŪ
RO
NG
O 2
01
4

(d) Sensitivity analysis The tables below illustrate the potential impact to the surplus or deficit and equity (excluding retained earnings) for reasonably possible market movements with all variables held constant based on the financial instrument exposures of Te Wānanga o Aotearoa at balance sheet date.
-100bps +100bps -100bps +100bps Other Other Other Other Note Surplus Equity Surplus Equity Surplus Equity Surplus Equity
Group
Interest rate riskFinancial assetsCash and cash equivalents 1 (50) - 50 - (30) - 30 -
Total sensitivity to interest rate risk (50) - 50 - (30) - 30 -
Parent
Interest rate riskFinancial assetsCash and cash equivalents 1 (33) - 33 - (19) - 19 -
Total sensitivity to interest rate risk (33) - 33 - (19) - 19 -
1. Explanation of interest rate risk sensitivity
The interest rate sensitivity is based on a reasonable possible movement in interest rates, with all other variables held constant, measured as a basis points (bps) movement. For example a decrease in 100 bps is equivalent to a decrease in interest rates of 1.0%.
Capital Management The capital of Te Wānanga o Aotearoa is its equity, which comprises of retained earnings and the property revaluation reserve. Equity is represented by net assets.
Te Wānanga o Aotearoa is subject to the financial management and accountability provisions of the Education Act 1989, which includes restrictions in relation to: disposing of assets or interests in assets, ability to mortgage or otherwise charge assets or interests in assets, granting leases of land or buildings or parts of buildings and borrowings.
Te Wānanga o Aotearoa manages its revenues, expenses, assets, liabilities, investments, and general financial dealings prudently and in a manner that promotes the current and future interests of the community. The equity of Te Wānanga o Aotearoa’s is largely managed as a by-product of managing revenues, expenses, assets, liabilities and general financial dealings.
The objective of managing the equity of Te Wānanga o Aotearoa is to ensure that it effectively and efficiently achieves the goals and objectives for which it has been established, while remaining a going concern.
2014 $000 2013 $000
81
Ma
na
gin
g o
ur
pe
rfo
rma
nce

19. Statement of commitments and contingencies
(a) Commitments Group Group Parent Parent 2014 2013 2014 2013 $’000 $’000 $’000 $’000
Capital commitmentsProperty, plant and equipment 440 420 440 420Intangible Assets - 100 - -
440 520 440 420
Capital commitments represent capital expenditure contracted for at balance date, but not yet incurred.
Operating lease commitments - Group as lessee
The group has entered commercial leases on certain buildings where it is not in the best interest of the group to purchase these assets.
These leases have an average life of between one and eighteen years with renewal terms included in the contracts. Renewals are at the option of the group. There are no restrictions placed upon the lessee by entering into these leases.
Future minimum rentals payable under non-cancellable operating leases as at 31 December 2014 are as follows:
Group Group Parent Parent 2014 2013 2014 2013 $’000 $’000 $’000 $’000
Within one year 4,006 4,082 3,296 3,185After one year but no more than five years 6,681 6,248 4,606 3,833More than five years 570 392 570 17
11,257 10,722 8,472 7,035
Operating lease commitments - Group as lessor
The group owns a number of buildings and has entered commercial leases where it is not in the best interest of the group to use these buildings for their operations.
These leases have an average life of between one and two years with renewal terms included in the contracts. Renewals are at the option of the lessee. There are no restrictions placed upon the lessee by entering into these leases.
Future minimum rentals receivable under non-cancellable operating leases as at 31 December are as follows:
Group Group Parent Parent 2014 2013 2014 2013 $’000 $’000 $’000 $’000
Within one year 106 130 106 130After one year but no more than five years 3 105 3 105
109 235 109 235
No contingent rents have been recognised in surplus or deficit during the period.
Notes to the financial statements (continued)
82
TE
PŪ
RO
NG
O 2
01
4

b) Contingencies
Contingent Liabilities
Personal grievances
As at 31 December 2014, there are two personal grievance claims against Te Wānanga o Aotearoa (2013 - four).
Te Wānanga o Aotearoa is not expecting any payments to be made.
Litigation
Te Wānanga o Aotearoa and Open Wānanga Limited has seven contingent liabilities as at balance date (2013 -Nil).
Government funding
Te Wānanga o Aotearoa has a contingent liability of $692,533 (2013 - $692,533) related to the creation of a new early learning centre in Manukau. In order to fulfil the conditions of funding the centre must remain open for ten years. The centre opened in 2008 and must remain open until 2018. Failure to achieve this will result in the repayment of the funding.
Financial guarantee
Te Wānanga o Aotearoa entered an arrangement in 2008 with the Bank of New Zealand to provide a guarantee for Open Wānanga Limited. This arrangement ceased during the 2014 year.
Te Wānanga o Aotearoa had an overdraft facility of $1 million in place as at 31 December 2013.
The overdraft facility ceased on 17 January 2014. This was a result of Te Wānanga o Aotearoa changing to a new banking provider.
Contingent Assets
Te Wānanga o Aotearoa has no contingent assets as at balance date (2013 - NIL).
Country of 2014 2013 2014 2013 Incorporation % % $’000 $’000
Open Wānanga Limited New Zealand 100 100 1 1Aotearoa Scholarship Trust New Zealand 100 100 - -DynaSpeak Limited New Zealand 100 100 475 -
Equity Interest Investment
20. Related party disclosureThe consolidated financial statements include the financial statements of Te Wānanga o Aotearoa and its subsidiaries Open Wānanga Limited, DynaSpeak Limited and the Aotearoa Scholarship Trust.
83
Ma
na
gin
g o
ur
pe
rfo
rma
nce
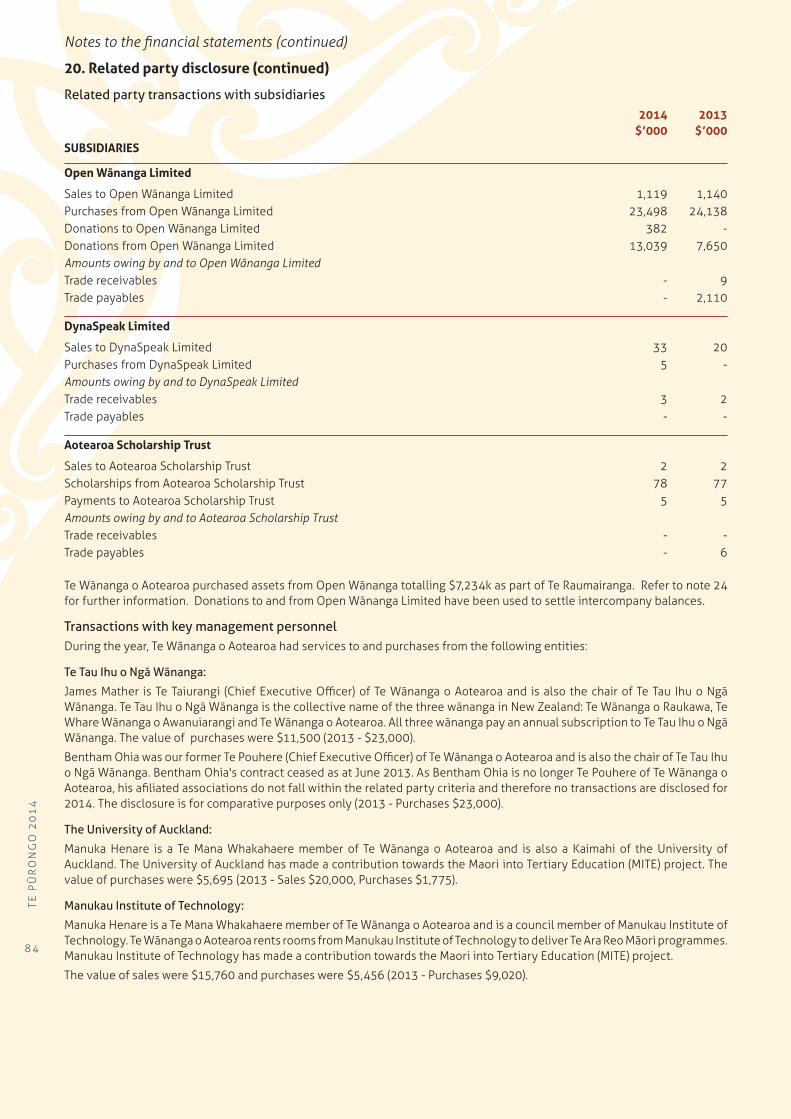
20. Related party disclosure (continued)
Related party transactions with subsidiaries 2014 2013 $’000 $’000SUBSIDIARIES
Open Wānanga Limited
Sales to Open Wānanga Limited 1,119 1,140 Purchases from Open Wānanga Limited 23,498 24,138 Donations to Open Wānanga Limited 382 - Donations from Open Wānanga Limited 13,039 7,650 Amounts owing by and to Open Wānanga Limited Trade receivables - 9 Trade payables - 2,110
DynaSpeak Limited
Sales to DynaSpeak Limited 33 20 Purchases from DynaSpeak Limited 5 - Amounts owing by and to DynaSpeak LimitedTrade receivables 3 2 Trade payables - -
Aotearoa Scholarship Trust
Sales to Aotearoa Scholarship Trust 2 2 Scholarships from Aotearoa Scholarship Trust 78 77 Payments to Aotearoa Scholarship Trust 5 5 Amounts owing by and to Aotearoa Scholarship TrustTrade receivables - - Trade payables - 6
Te Wānanga o Aotearoa purchased assets from Open Wānanga totalling $7,234k as part of Te Raumairanga. Refer to note 24 for further information. Donations to and from Open Wānanga Limited have been used to settle intercompany balances.
Transactions with key management personnelDuring the year, Te Wānanga o Aotearoa had services to and purchases from the following entities:
Te Tau Ihu o Ngā Wānanga:
James Mather is Te Taiurangi (Chief Executive Officer) of Te Wānanga o Aotearoa and is also the chair of Te Tau Ihu o Ngā Wānanga. Te Tau Ihu o Ngā Wānanga is the collective name of the three wānanga in New Zealand: Te Wānanga o Raukawa, Te Whare Wānanga o Awanuiarangi and Te Wānanga o Aotearoa. All three wānanga pay an annual subscription to Te Tau Ihu o Ngā Wānanga. The value of purchases were $11,500 (2013 - $23,000).
Bentham Ohia was our former Te Pouhere (Chief Executive Officer) of Te Wānanga o Aotearoa and is also the chair of Te Tau Ihu o Ngā Wānanga. Bentham Ohia's contract ceased as at June 2013. As Bentham Ohia is no longer Te Pouhere of Te Wānanga o Aotearoa, his afiliated associations do not fall within the related party criteria and therefore no transactions are disclosed for 2014. The disclosure is for comparative purposes only (2013 - Purchases $23,000).
The University of Auckland:
Manuka Henare is a Te Mana Whakahaere member of Te Wānanga o Aotearoa and is also a Kaimahi of the University of Auckland. The University of Auckland has made a contribution towards the Maori into Tertiary Education (MITE) project. The value of purchases were $5,695 (2013 - Sales $20,000, Purchases $1,775).
Manukau Institute of Technology:
Manuka Henare is a Te Mana Whakahaere member of Te Wānanga o Aotearoa and is a council member of Manukau Institute of Technology. Te Wānanga o Aotearoa rents rooms from Manukau Institute of Technology to deliver Te Ara Reo Māori programmes. Manukau Institute of Technology has made a contribution towards the Maori into Tertiary Education (MITE) project.
The value of sales were $15,760 and purchases were $5,456 (2013 - Purchases $9,020).
Notes to the financial statements (continued)
84
TE
PŪ
RO
NG
O 2
01
4

Tai Wānanga:
Manaoterangi Forbes is a Te Mana Whakahaere member of Te Wānanga o Aotearoa and is also the chair of the Board of Trustees of Tai Wānanga. The value of sales were $1,728 (2013 - Sales $6,004).
Clendon Park Primary School:
Anthony Iwikau is a Te Mana Whakahaere member of Te Wānanga o Aotearoa and is also a board member of Clendon Park Primary School.
Te Wānanga o Aotearoa paid for accommodation to facilitate our noho marae to Clendon Park Primary School. There were no transactions in 2014 (2013 - Purchases $1,435).
Forbes Trustee Limited
Manaoterangi Forbes is a Te Mana Whakahaere member of Te Wānanga o Aotearoa and is also a director of Forbes Trustee Limited (FTL). Te Wānanga o Aotearoa paid rent for property owned by FTL and paid for tutorial services provided by FTL. The value of purchases were $78,443 (2013 - purchases $86,835).
Kura Huna Limited
Pakake Winiata is a Tumu of Te Wānanga o Aotearoa and a director of Kura Huna Limited.
Kura Huna provided Te Reo programmes to Te Wānanga o Aotearoa. The value of purchases were $40,000.
Crystal Resonance Limited
Pakake Winiata is a Tumu of Te Wānanga o Aotearoa and a director of Crystal Resonance Limited.
Te Wānanga o Aotearoa paid for rent of property owned by Crystal Resonance Limited. The value of purchases were $6,245.
Waikato Raupatu Lands Trust
Tukoroirangi Maatiaha-Morgan is a Te Mana Whakahaere member of Te Wānanga o Aotearoa and is also a trustee of Waikato Raupatu Lands Trust.
Te Wānanga o Aotearoa paid for the hirage of marquees from Waikato Raupatu Lands Trust. The value of purchases were $2,564 (2013 Purchases - $1,320).
Significant transactions with government-related entities The government influences the roles of Te Wānanga o Aotearoa as well as being a major source of revenue.
Te Wānanga o Aotearoa has received funding and grants from the Tertiary Education Commission totalling $135.180m (2013 - $133.943m) to provide education and research services for the year ended 31 December 2014.
Collectively, but not individually, significant transactions with government-related entities In conducting its activities, Te Wānanga o Aotearoa is required to pay various taxes and levies (such as GST, PAYE and ACC levies) to the Crown and entities related to the Crown. The payment of these taxes and levies is based on the standard terms and conditions that apply to all tax and levy payers.
Te Wānanga o Aotearoa is exempt from paying income tax, resident withholding tax and FBT.
Te Wānanga o Aotearoa purchases goods and services from entities related to the Crown and it also provides services to entities related to the Crown.
The purchase and provision of goods and services to government-related entities for the year ended 31 December 2014 are small when compared to the total expenditure and revenue of Te Wānanga o Aotearoa and have all been conducted on an arms length basis. The purchase of goods and services included the purchase of electricity from Genesis and Meridian, air travel from Air New Zealand and postal services from New Zealand Post. The provision of services to government-related entities mainly related to the provision of educational courses. The sale and/or purchase of goods and services with third party entities include The University of Auckland, Manukau Institute of Technology and Southern Institute of Technology. These are of an arm’s length transaction.
Terms and conditions of transactions with related parties Provision of services to and purchases from related parties are made in arm’s length transactions at both normal market prices and normal commercial terms.
Outstanding balances at 31 December 2014 and 2013 are unsecured and settlement occurs in cash. There have been no guarantees provided or received for any related party receivables.
For the year ended 31 December 2014, the group has not raised any provision for impairment of receivables relating to amounts owed by related parties as the payment history has been excellent, (2013 - NIL).
This assessment is undertaken each financial year following an examination of the financial position of the related party and the market in which the related party operates in. When assessed as required the group raises such a provision.
85
Ma
na
gin
g o
ur
pe
rfo
rma
nce

21. Key Kaimahi Remuneration
Te Mana Whakahaere remuneration Wages and salaries include Te Mana Whakahaere and sub-committees remuneration of $86,052 (2013 - $121,058) distributed as follows:
Appointment Retirement 2014 2013
Date Date $’000 $’000
Lloyd Anderson Council / Audit & Risk Nov-93 Nov-13 - 10 Richard Batley Council Aug-04 - 25 25
Sir Toby Curtis Council Apr-09 - 6 12
Deirdre Dale Council Jan-08 Jul-13 - 5
Gary Dyall Audit & Risk Aug-11 - 1 2
Manaoterangi Forbes Council Jun-98 - 13 13
Manuka Henare Council / Audit & Risk Jan-06 - 5 4
Tania Hodges Council Oct-01 Apr-14 3 12
Peter Joseph Council Sep-07 - 3 5
June McCabe Council Mar-05 Jul-13 - 10
Wayne McLean Audit & Risk Jul-08 - 2 1
Tukoroirangi Maatiaha-Morgan Council Feb-13 - 2 3
Nicholas Manukau Council Sep-12 Sep-13 - 4
Angelina Matekohi Council & Academic Board Oct-13 Oct-14 5 2
Steve Ruru Audit & Risk Jun-10 - 1 2
Colleen Tuuta Council Aug-11 - 6 5
Rea Wikaira Audit & Risk Aug-13 - 8 4
Karl Wixon Council Aug-13 - 6 2
86 121
Directors fees paid by Open Wānanga Limited were as follows:
2014 2013
$’000 $’000
Lloyd Anderson - 18
Richard Batley 45 45
June McCabe 18 18
63 81
Key management personnel compensation
Parent Parent
2014 2013
$’000 $’000
Kaihautū/ Tumu* 1,636 1,120
Te Mana Whakahaere 86 121
1,722 1,241
Notes to the financial statements (continued)
86
TE
PŪ
RO
NG
O 2
01
4

Group Group Parent Parent 2014 2013 2014 2013 $’000 $’000 $’000 $’000
Short term and kaimahi welfare benefits 2,550 2,248 1,518 1,190Other long term benefits - KiwiSaver 24 13 24 13Termination payments 289 38 180 38
2,863 2,299 1,722 1,241
* As part of the organisation review in 2014, the senior executive Ngā Kaihautū was replaced with the senior executive Ngā Tumu.
22. Events after the balance dateThere are no events after balance date.
23. Explanation of major group variances against budget
Statement of comprehensive income
Tauira fees
Tauira fee income is below budget by $1.5m due to the programme mix varying from budget.
Other income
Other income is above budget by $2.1m mainly due to an increase in subcontracting revenue.
In particular, major contracts with the Ministry of Social Development and Ministry of Education - Child Care Grants were extended to deliver additional services.
Kaimahi costs
Kaimahi costs are above budget by $5.9m mainly due to the reclassification of actual spend from kaimahi costs to other expenses and also the following factors:
- Change in programme mix
- Kaiako to tauira ratio differing from plan
- Te Raumairanga related costs varying from budget
Depreciation and Amortisation costs
Depreciation and amortisation is above budget by $1.1m. This is mainly due to the actual timing and capitalisation of expenditure after the budget set.
Other expenses
Other expenses are below budget by $6.0m mainly due to the reclassification of actual spend from other expenses to kaimahi costs. In addition, there are significant variances to budget against student resources, travel and accommodation and marketing and advertising.
Statement of financial position
Current assets
Current assets are below budget by $1.9m mainly due to classification of other financial assets and timing of spend in relation to capital expenditure.
Non-current assets
Non-current assets are above budget by $6.3m mainly due to classification of other financial assets, and property, plant and equipment spend not occurring as anticipated, particularly in the area of hardware spend.
Current liabilities
Current liabilities are above budget by $4.9m mainly due to creditors and other payables as a result of an increase in intercompany donations.
87
Ma
na
gin
g o
ur
pe
rfo
rma
nce
24. Te RaumairangaIn January 2014, Te Wānanga o Aotearoa (TWoA) initiated a project called Te Raumairanga. The purpose of Te Raumairanga is focused on strengthening capacity and transforming TWoA to continue to strive for the destination of whānau transformation through education. This will be realised through TWoA providing unique, high quality educational opportunities for Māori and all others, which contributes to positive transformational changes for TWoA students through achievement of their aspirations and goals.
Te Raumairanga consists of two phases. Phase 1 focused on the transformation of support kaimahi and functions within Te Puna Mātauranga and Open Wānanga Limited (OWL) integrated to become “One Wānanga”. Phase 2 will focus on the transformation of TWoA rohe.
The key deliverables achieved from Phase 1 were:
• the appointment of a new executive leadership team (Ngā Tumu);
• new uepu structures designed and implemented;
• OWL incorporated into TWoA as at 19 December 2014. The intention of the OWL Board is to wind up the company in early 2015; and
• Te Puna Mātauranga refurbishment and co-location of kaimahi to Te Puna Mātauranga.
As part of Phase 1, certain assets and liabilities of OWL were transferred to TWoA on 19 December 2014. The value of assets and liabilities transferred were at the book value as recorded within the Open Wānanga Limited’s financial statements. This included the shareholding in DynaSpeak Limited. The net value of assets trasferred to TWoA was credited to the intercompany payable account. Open Wānanga Limited made a donation to TWoA to settle this balance prior to balance date. See related party transactions at note 20.
Details of the items transferred are provided below:
Assets transferred to TWoA $000
Shareholding in DynaSpeak Limited 475Property, plant and equipment (Net Book Value) 2,292Intangible assets (Net Book Value) 3,363Inventory (cost) 1,103
Total 7,233
Liabilities transferred to TWoA
Sick leave and annual leave liabilities and make good provision (for leases) 369
Lease commitments transferred to TWoA
Operating Leases commitments 64
TWoA’s intention is to deregister OWL around April/May 2015. At that stage, there will be a full and final donation made from OWL to TWoA to clear out any items still remaining in OWL’s financial statements. Once all remaining liabilities in OWL financial statements have been settled, OWL will be removed from the Companies Register.
Phase 2 was initiated in October 2014 with discussions and consultation with Rohe Senior Leadership Teams. The existing six rohe will be consolidated into three takiwa (districts). Phase 2 is expected to be completed in March 2016.
Notes to the financial statements (continued)
8 8
TE
PŪ
RO
NG
O 2
01
4


He takapau ma-tauranga, he wha-nau huarewa.
www.twoa.ac.nz I 0800 355 553