habitat suitability models developed - devotes project · milestone 15 habitat suitability models...
TRANSCRIPT
Habitat sui tabi l i ty models developed
M i l e s t o n e 1 5
WP 4 Milestone 15
LEAD CONTRACTOR
Cefas
SUBMISSION DATE
30 | April | 2014
Dissemination level
Restricted to other programme participants (including the Commission Services)
AUTHORS Christian Wilson (OceanDTM), Christopher Lynam (Cefas), Markus Diesing (Cefas), Fernando Tempera (JRC), Heliana Teixeira (JRC), Stelios Katsanevakis (JRC), Ibon Galparsoro (AZTI), Nathalie Niquil (CNRS), Ana Queiros (PML), Martynas Bucas (KUCORPI), Gokhan Kaboglu (DEU), Slava Suslin (MHI-‐NASU), Tanya Churilova (MHI-‐NASU)

2

Contents
1. Summary ............................................................................................................................................. 1
2. Milestone scope .................................................................................................................................. 4
3. Approach ............................................................................................................................................. 4
4. Next steps .......................................................................................................................................... 31
5. Relevant publications ........................................................................................................................ 37


1
1. Summary
This document reports the progress made by task 4.1.3 Improve and validate GIS maps of
benthic habitat using physical and biological data along with the next steps planned. It
accompanies files in directory DEVOTES_MS15 that have been placed on the partners area of
the DEVOTES website http://www.devotes-‐project.eu/. For ease of interrogation of these files
and for subsequent dissemination of information, we have extended the DEVOTES website to
include a repository for spatial data: http://maps.devotes.eu/ and this can be navigated to from
http://www.devotes-‐project.eu/software-‐and-‐tools/.
A range of studies have been pursued as part of this task reflecting the different levels of
advances made by previous projects and the development needs in the differing regional seas:
NE Atlantic
Refine and finalize habitat suitability models for 28 octocoral genera that can form particularly
diverse habitats. Statistical modelling (MaxEnt) of deep-‐sea coral distributions on the Azores
Plateau will build upon the progress made under the project CoralFish
(EC/FP7:ENV/2007/1/213144). A work plan has been drafted to potentially compare these
projections with those estimated via a size-‐spectrum dynamic bioclimatic envelope model
(Fernades et a. 2013) for common species of interest, which were produced for FP7 project
VECTORS. This comparison will enable a more balanced perspective about the potential effects
of changes in the distribution of suitable habitat on species distributions, as the two models
consider a different set of parameters to predict distribution.
For the North Sea and English Channel sediment compositional data (Content of mud, sand and
gravel) from the British Geological Survey (26319 samples) and 28152 samples newly acquired
from the Information Integration System for Marine Substrates (dbSEABED) have been merged.
These data have been linked with a composite bathymetric model such that useful derivatives
can be calculated and used for habitat models.
An interpretation schema to characterise benthic habitats has been developed from an analysis
of high resolution multi-‐beam data for the English Channel and this analysis has shown
significant differences from existing broadscale habitat maps. Fish species abundance data from

Milestone 15 Habitat suitability models developed
2
beam trawl surveys have been linked to the new and traditional seafloor maps and the acoustic
classifications were shown consistently to be among the best predictors for a suite of species.
Fish assemblage data have also been used to map spatial change in diversity over the area and
additional benthic data are planned to be included in these analyses.
In the Bay of Biscay, a process-‐driven benthic sedimentary habitat model has been developed
which maps the major environmental factors influencing soft-‐bottom macrobenthic community
structure and the life-‐history traits of species. It was observed that the habitat classes defined
in the process-‐driven model reflected different structural and functional characteristics of the
benthos. Moreover, benthic community structure anomalies due to human pressures could
also be detected within the model produced.
Mediterranean Sea
Habitat suitability models are being used to predict the distribution of high impact marine
invasive species (SDMs) and identify areas vulnerable to invasions. The current and the
potential cumulative impacts of these invasive species on biodiversity in the whole regional sea
will be evaluated and mapped. A work plan has been drafted to potentially compare these
projections with those estimated via a size-‐spectrum dynamic bioclimatic envelope model
(Fernades et a. 2013) for common species of interest, which were produced for FP7 project
VECTORS (FP7/2007-‐2013 266445). This comparison will enable a more balanced perspective
about the potential effects of changes in the distribution of suitable habitat on species
distributions, as the two models consider a different set of parameters to predict distribution.
Black Sea
A regional model has been developed by DEVOTES partners (and described in Deliverable 4.1
Report on available models for biodiversity and needs for development) and allows for the
modelling of downwelling radiance based on bio-‐optical features. The outputs of this research
will be to determine the maximum depth that macrophytes can be extend to on the western
and north-‐western shelf (i.e. including the WP6 case study area).
Baltic Sea
Existing habitat suitability model of the red alga is being improved by additional data from the
eastern Baltic Sea coast. Empirical relationship between the red alga distribution and cover, and

3
environmental parameters will be determined in order to predict its maximum depth
distribution. The obtained result will be correlated to the parameters of eutrophication
gradient (e.g., Secchi-‐depth, nutrients), in order to test the sensitivity of species maximum
depth limit to the pressure, which may serve as indicator for the water quality assessment.
Table 1. Information on Milestone 15 of DEVOTES project.
Milestone
number
Milestone name Work
package(s)
involved
Expected
date
Means of verification
MS15 Habitat suitability
models developed
4 18 Outputs from spatial
analyses available on the
website

Milestone 15 Habitat suitability models developed
4
2. Milestone scope
The work detailed in this milestone report has been conducted during the initial stages of Task
4.1.3, which aims to build on the current benthic habitats maps available to supporting the
MSFD and develop this evidence base using state-‐of-‐the-‐art methods.
Task 4.1.3: Improve and validate GIS maps of benthic habitat using physical and biological data.
Habitat suitability models (such as Ecological-‐Niche Factor Analysis (ENFA), openModeller,
Maxent, Biomapper, Hyperniche) will be used to model change in the habitat and the prevailing
species diversity. A manuscript relating habitat models to species diversity will be published.
Participants: Leader // OceanDTM; Partners // JRC, CEFAS, PML, AZTI, KUCORPI, DEU, CNRS,
MHI-‐NASU.
3. Approach
In Deliverable 4.1 Report on available models for biodiversity and needs for development we
evaluated the range of models that are able to address marine biodiversity indicators, which
are considered suitable to assess biological diversity (D1), non-‐indigenous species (D2), food-‐
web (D4), and seafloor integrity (D6), as described in the MSFD (COM Dec; 2010/477/EU).
Drawing upon the expertise within the WP4 team, we have been able to apply a subset of those
models described within Deliverable 4.1 in Task 4.1.3. For example, the bio-‐optical model
developed for the Black Sea (MHI-‐NASU) and the use of maximum entropy modelling (DEU and
JRC). Where possible DEVOTES partners have attempted to build upon developments in habitat
modelling made in previous projects (e.g. MeshAtlantic, CoralFish, VECTORS, EuroBasin) and
attempted to link this work to ongoing modelling to support the MSFD.
GIS maps are available for layers and can be viewed online at http://maps.devotes.eu/
A short description of the work conducted and planned by area and partner is given here:
5
NE Atlantic (including the Channel and North Sea): OceanDTM, Cefas, PML, JRC.
(Cefas) Seabed habitats of the Greater North Sea
(Leads: Christopher Lynam and Markus Diesing)
Scope & main objectives
This component of the work aims to develop benthic habitat maps for the Greater North Sea
using physical data on bathymetry, including derivatives thereof (e.g. slope, curvature,
rugosity), and seabed samples (sediment composition) linked to biological data on benthic
fauna and demersal fish.
Currently available products such as the EMODnet-‐Geology seabed substrate map and the
EUNIS level 3/4 broadscale habitat map (EUSeaMap), will be considered and compared to
newly available data collated here and acoustic multi-‐beam data collected in-‐situ through WP5
activities. As currently available products are based on divisions of a modified Folk
classifications (e.g. mud and sandy mud, sand and muddy sand, coarse sediment, mixed
sediment) statistical analyses are potentially overly limited by this fixed classification. When
considering a great range of species, the percentage of sediment fractions in a location (mud to
sand for instance) that can be considered important for a particular species may differ to that
for another. Therefore, habitat suitability models can benefit from spatial predictions of the
relative proportions of sediment fractions at sample locations.
Data acquisition
Physical data
Typically, for marine habitat studies, bathymetry is an important variable predicting habitat
suitability. The best data layer in current existence for the northeast Atlantic is freely available
from EMODnet http://www.emodnet-‐hydrography.eu/. However, even this layer shows
inaccuracies when viewed at fine resolution (see Fig 1 top). To complement this data we are
attempting to merge the EMODnet layer with the higher resolved UK Defra Digital Elevation
Model (DEM, Fig 1 middle). The combination (Fig 1, bottom) gives a powerful dataset for use in
statistical modelling studies and a more accurate representation of the extent of a type of
habitat sampled by point source biological data (e.g. from benthic grabs or trawls for fish). Of
course, bathymetry on its own does not give all the information of relevance to biota.
Therefore we are conducting spatial predictions of sediment composition using machine

Milestone 15 Habitat suitability models developed
6
learning algorithms (e.g. Random Forest), based on sediment sample data (response variable)
and various physical data layers such as bathymetry, its derivatives and hydrodynamic model
outputs (predictor variables). For this purpose, we have acquired sediment data from the
University of Colorado, Boulder, (28152 samples, Fig 2 top), extracted from the database
dbSEABED “Information Integration System for Marine Substrates”
http://instaar.colorado.edu/~jenkinsc/dbseabed/, and collated these with data from the British
Geological Survey (BGS) (26319 samples, Fig 2 middle). The samples in the BGS dataset were
collected between 1967 and 1994 with a variety of samplers; however in approximately 80% of
cases a Shipek grab was used. The data contained in dbSEABED were obtained from a large
variety of sources and contain measured as well as parsed (i.e. estimated from verbal
descriptions) data. Although a large dataset of 54471 samples, the dataset still has an uneven
distribution spatially with most samples on the UK continental shelf (less than 200 m depth).
Response variable (Biological data)
Benthic infauna and epifauna for many (>3000) taxa recorded at differing levels (e.g. families,
species where possible) collected 2001 – 2012 (Fig 3). Many of these taxa are recorded simply
as present/absent; however, 554 groups are represented by 50 or more individuals. Benthic
epifauna have also been recorded during ICES co-‐ordinated surveys for fish. The benthos data is
particularly useful from the beam trawl surveys, however much of this data is still held on
national databases. Current work by the ICES working group for beam trawl surveys (WGBEAM)
aims to collate benthos data and share it through the DATRAS online database data, which
currently houses the data for fish and invertebrate species. Preliminary analyses have been
made in DEVOTES using data on 40 species of fish and invertebrates, which have been obtained
from ICES for the International beam trawl surveys (Fig 4) and the International bottom trawl
survey (IBTS, Fig 5).
Environmental covariates
Useful climatology data (maximum of the density gradient, mixed Layer depth, bottom salinity
and bottom temperature), available from The Environmental Marine Information System
(EMIS) housed by the JRC, http://emis.jrc.ec.europa.eu/, along with bottle and CTD samples

7
housed by ICES http://ecosystemdata.ices.dk/ , have been collated and will be explored in
habitat suitability modelling.
Modelling Approach and relevant outputs
Habitat suitability models will be developed by statistical modelling: spatial generalized additive
models (GAM) extended with integrated nested Laplacian approximation (INLA), and/or
Maximum Entropy Modeling (MaxEnt); possibly also size-‐spectrum dynamic bioclimatic
envelope models (SS-‐DBEM, Fernandes et al. 2013). The biological response data will be
modelled using the spatial predictions of the sediment fractions, bathymetry and
environmental covariate data. The SS-‐DBEM further consider also changes in productivity as
derived from coupled hydrodynamic-‐biogeochemical models (e.g. POLCOMS_ERSEM), and
changes in target species population dynamics and dispersal associated with changes in habitat.
Habitat suitability maps will then be predicted from the model.
The habitat maps generated for the North Sea will be of further use in WP4 to develop spatial
ecosystem models (T4.1.4), examine habitat type for selected pilot areas relative to wider
regional sea habitats (T4.2.1), and in WP6 as a basis to develop the Operational biodiversity
assessment tool (T6.1.2), in testing and validation of the biodiversity assessment tool (T6.2.2),
and in the comparison of the biodiversity assessment across pilot areas (T6.3.1).
Future work
Benthic habitat suitability models for benthos and fish will be developed from physical and
environmental data collated already in DEVOTES. However, to improve the modelling we will
also attempt to combine these data with additional information on water column. Specifically,
eco-‐hydrodynamic zones based on stratification regimes (from ERSEM modelling) are being
developed for the Greater North Sea (in T4.1.4, Develop spatial ecosystem models) and should
provide an additional source of information on the water column processes that can refine
benthic habitat suitability models. Similarly, maps of phytoplankton productivity have been
generated in T3.2.1, Quality analysis of the indicators, from remote sensing data and may prove
beneficial to the modelling study. The combination of data on water column and seafloor
processes in this way is a particularly novel and exciting opportunity. We will attempt to
combine information from the benthic habitat suitability models for the various benthic fauna

Milestone 15 Habitat suitability models developed
8
and fish species in order to generate a map showing the change in the diversity of habitats and
species spatially.
Figure 1. Bathymetry data from EMODnet (top), UK Defra Digital Elevation Model (DEM middle) and the
two datasets combined (bottom) coloured by depth band. Arrows indicate inadequacies of the
EMODnet layer relative to the UK DEM.

9
Figure 2. Substrate samples from dbSEABED (top), BGS (middle) and the two datasets combined
(bottom) coloured by classification for ease of visualisation.

Milestone 15 Habitat suitability models developed
10
Figure 3. Sampling locations of benthic fauna from a suite of surveys using grabs 2001-‐2012.
Figure 4. Sampling locations of demersal fish and benthic epifauna using beam trawls from international
surveys: 1983-‐2012 during quarter 3 and 4 (left) along with mean catch per unit effort of all fish species
(kg per hour, right) gridded by ICES statistical rectangle.
11
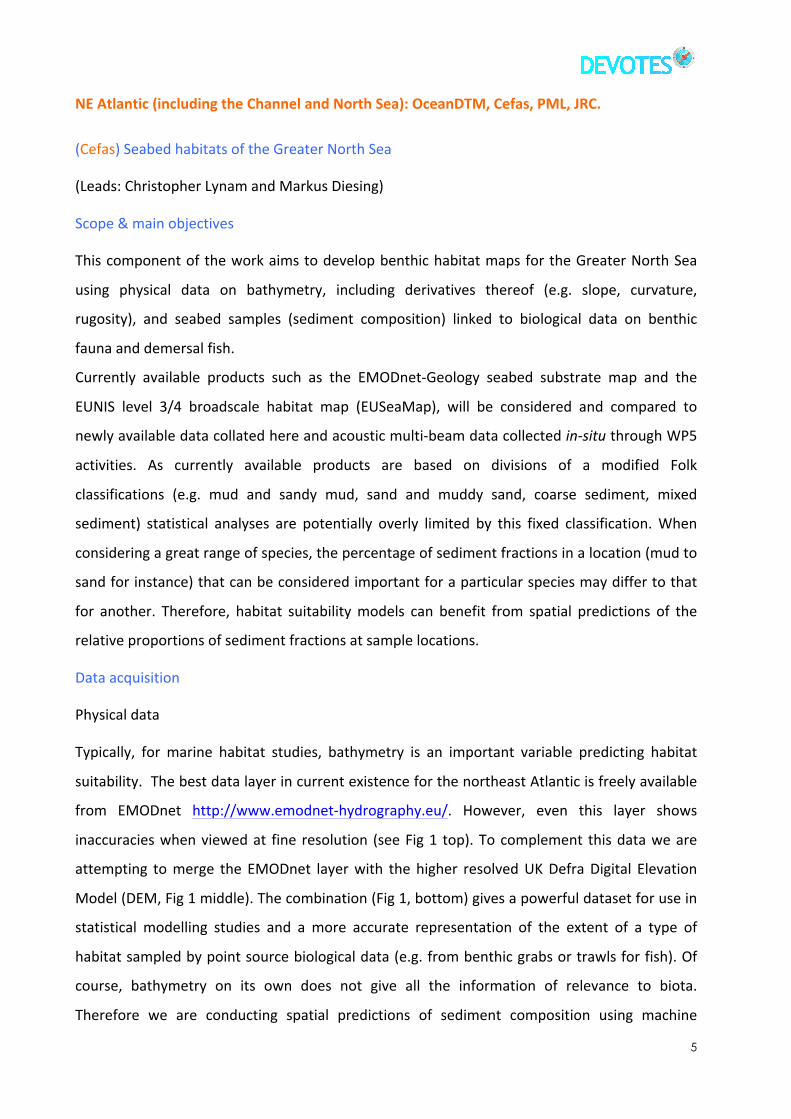
Figure 5. Sampling locations of demersal and pelagic fish using the GOV from the IBTS: 1983-‐2012 during
quarter 1 (left) and 1991-‐2012 during quarter 3 (right).
Relevant files on the website:
http://maps.devotes.eu/layers/geonode:north_sea_benthic_samples
http://maps.devotes.eu/layers/geonode:dbseabed_metadata
http://maps.devotes.eu/layers/geonode:bgs_20131125_metadata
(OceanDTM) Improvement of seabed substrate maps using high resolution bathymetric data.
(Lead: Christian Wilson)
Scope & main objectives
Existing habitat maps used for national and European-‐scale marine management (such as the
broadscale EUNIS maps) suffer from serious limitations which, if not recognised, can result in
poor correlation with biological datasets and thus impair the effectiveness of monitoring and
management decisions. However, the need to have maps showing the spatial relationship of
significant environmental gradients and features is so fundamental and pressing that the
distinction between “best available” and “fit for purpose” can be overlooked. It is the goal of

Milestone 15 Habitat suitability models developed
12
this part to the task to demonstrate the suitability of widely available multi-‐beam datasets to
improve our knowledge of seabed sedimentary environments. It is useful to consider the two
main factors constraining the suitability of a habitat map for use in environmental monitoring
and management.
Firstly the matter of accuracy, which is largely dependent on the qualities of the underlying
source data. Secondly the interpretation or classification schema into which the data are used
to construct. A basic requirement for mapping is that the data used should be of appropriate
spatial and temporal resolution. For example Wiggert et al. (1994) showed that the effects of
temporal undersampling on primary production estimates could lead to errors in excess of 85%
when estimating a total annual value based on a monthly rather than daily sampling frequency.
Of course not all environmental variables have the same magnitude and rate of change as
phytoplankton abundances, but basic sampling theory demonstrates that even a perfectly
regular and noise-‐free signal of a known bandwidth requires a sampling rate/resolution of
twice that of the highest frequency/smallest feature to be described accurately (Govaere et al.
1980). The accurate characterisation of high resolution spatial and temporal variability is in
itself a worthwhile goal as it may represent the most significant “niche space” exploited by
certain species or populations (Benedetti-‐Cecchi, 2003) (i.e. the rate of change may be more
significant than the absolute maximum and minimum values attained). This undersampling
problem manifests itself very clearly when describing seabed types which are frequently patchy
and heterogeneous and therefore requite very resolute initial datasets to allow for meaningful
generalisations to be made. In addition to sparse data the quality of the final maps will suffer if
there are errors or biases in the sampling strategies. So for example a seabed sediment grab
may under-‐represent the fine sediments in a sample as these may be washed out during
recovery. Or there may not be enough replicates of a biological dataset to provide a statistically
significant representation of the species composition of a site.
The second major difficulty for habitat mapping is that the source data (with whatever biases
and uncertainties) are then coerced into a classification or interpretation schema. A recent
paper by Kostylev (2012) highlights a number of assumptions made when undertaking this step
of reducing the dimensionality of the natural environment down to a map. The next level of
abstraction then is to try and link these rather nebulous physical environmental classes to even
more nebulous biological assemblages or communities in the form of biotopes or biocenosis.
The limitations of our current understanding and thus difficulties in developing meaningful

13
ways of representing “habitats” was captured by Fraschetti et al. (2011): “current
classifications generally lack explicit recognition of overarching scientific criteria for the choice
of habitat/species inclusion in the lists”.
Data acquisition
As part of WP5 we have detailed the collection of “opportunistic” high resolution seabed
acoustic data from the Cefas Endeavour research vessel. In summary Cefas (using the Olex
software package) operate their multi-‐beam system as an “acoustic ferrybox” logging multi-‐
beam data even when the vessel is undertaking other research activities or transiting between
fixed stations. Using this strategy it is possible to build up an extensive and valuable dataset
(Figure 6) with almost no additional costs (there are no mechanical parts in the multi-‐beam
transducer and the life expectancy of the system is not adversely affected by continuous use).
Figure 6. Compilation of data collected on Cefas Endeavour, between 2007-‐20012, during ecosystems
monitoring cruises, primarily focused on beam-‐trawling at random-‐stratified sites.
The utility of such data is becoming more widely appreciated and a recent report by “Olsen et
al. (2013) entitled “Achieving Ecologically Coherent MPA Networks in Europe: Science Needs
and Priorities” contains the following statement:
“If MPAs are to protect the full range of marine biodiversity at multiple levels then multi-‐beam
surveys with biological surface and deep-‐water sampling are a critical first step in
Milestone 15 Habitat suitability models developed
14
understanding the three-‐dimensional marine environment. Existing data (often from separate
research cruises) should be collated, on-‐going work should be completed, and geographical
gaps filled.”
Also, in recent advice to OSPAR (1.5.6.4 Special request, Advice June 2013), ICES recognised the
potential for utilising acoustic data from the IBTS and Beam Trawl Surveys (BTS) to provide
information for use in the MSFD GEnS assesment.
“Acoustic surveys probably also represent our best option for collecting the Pelagic Habitat (PH)
indicators, and also the Benthic Habitat (BH) indicators via Acoustic Sea Bed classification
methodologies including multi-‐beam technology.”
Modelling Approach
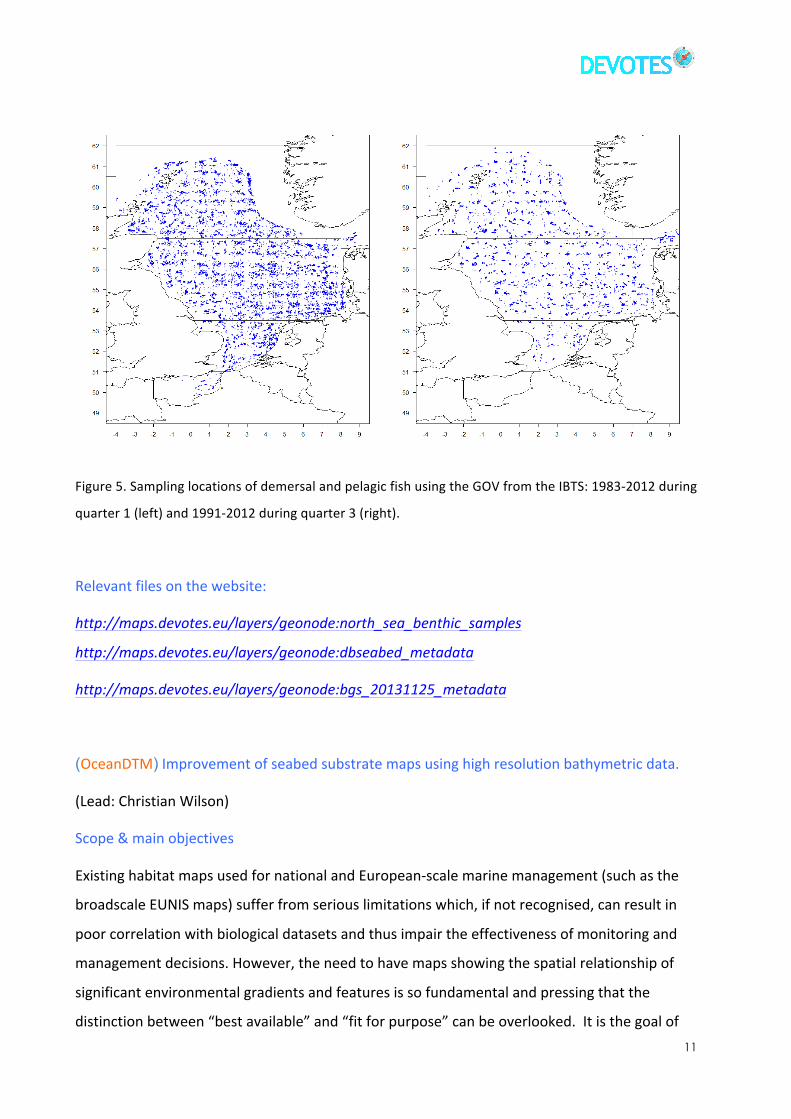
In order to provide some context for the study we investigated what data were currently
available and determined that the Global Biodiversity Information Facility (GBIF) contained the
most extensive dataset that would be suitable for our purposes (Figure 7).
Figure 7. Distribution of species presence records in the GBIF repository (data were filtered to exclude
records of less than 4m water depth to reduce the bias towards much more intensively sample coastal
areas resulting in over 4 million records).
Using these data it was then possible to segment the area and determine the total number of
records and number of unique species per quadrat. As expected there was an increase in
species richness with an increase in sampling effort (Figures 7, 8).

15
Figure 7. Transformed species richness plotted against transformed sampling effort coloured by
difference from linear regression of relationship.
Figure 8. Uncorrected species richness which totals the number of unique species per analysis polygon.
Areas that had a lower than predicted richness/effort ratio would therefore be comparatively
less diverse (in terms of unique species richness) and so comparisons between areas with
differing levels of effort could be made. We also used the Global Map of human Impact on
Marine Ecosystems (Halpern 2008) to investigate links with environmental pressures. It is then

Milestone 15 Habitat suitability models developed
16
possible to cluster the quadrats according to their associated biological and environmental
characteristics to give a broad overview of differing bio-‐geographic zones at a European scale.
The site specific work carried out focused on the Western English Channel and the creation of
an interpretation scheme suited to a whole acoustically derived map (i.e. no ground-‐truthing
data). Basing the classes only on seabed morphology and backscatter has some disadvantages
in terms of absolute accuracy in determining grain-‐size characteristics for example (the strength
of the acoustic backscatter return signal does provide some information on sediment
properties but this is not quantitative so distinctions between gradational sediment classes
such as such as between silty-‐sand and sandy-‐silt are subject to considerable uncertainty).
However the advantages are that the interpretation can incorporate information at multiple
scales to describe a broader range of environments which include the presence of bedforms
(indicating differing hydrodynamic conditions) or differing types of rock outcrop (which can
significantly influence terrain complexity see Figure 9).
Figure 9. Marine seascape classification schema based on high-‐resolution multibeam data.
The interpreted classes where then combined with other environmental variables (depth,
bottom shear stress, distance from coast and landscape metrics based on automatically
classified regions) and then modelled against species abundance composition data (collected by
Cefas with support from the Strategic Evidence Partnership Fund (SEFP)) using boosted
regression trees analysis (Elith et al. 2008).

17
Relevant outputs
By clustering derived attributes from the GBIF and Marine Impacts (Halpern et al. 2008)
datasets we were able to create a bio-‐geographic map (Figure 10). There are of course some
large sources of uncertainty, not least the highly uneven nature and distribution of the
biological sample data. Such analyses may inform us as much about data gaps as they do about
the actual status of the marine environment.
Figure 10. Plot of cluster groups derived from combining attributes from species and environmental
variable layers.
Figure 11. Relative diversity plot showing the relative abundance of unique species per analysis zone
once the effects of sampling effort have been corrected for.

Milestone 15 Habitat suitability models developed
18
Figure 12. Analysis polygons grouped according to the cluster and coloured according to corrected
species abundance.
For the detailed interpretation we used kriging to extrapolate a probability surface across the
area for each class in turn. The class with the maximum probability was then assigned to each
cell.
Figure 13. Extrapolation of interpreted seabed classes using geostatistical weighting create surfaces for
each layer and then assign membership according to which layer had the maximum probability per cell.
Inset map shows the extracted EUNIS level 3 classes for the same area.

19
Further work
The main focus of future work will be to automate the process of interpreting the multi-‐beam
data using the detailed interpretations already carried out as a training dataset. We will then
apply the technique to a wider area and test it against biotic variables to determine which are
the most important attributes or classes to use when investigating habitat distribution.
Figure 14. Processing workflow developed to handle large quantities of multibeam data and produce an
ecologically relevant set of environmental variables for use in habitat mapping work.
Relevant files on the website:
http://maps.devotes.eu/layers/geonode:weng_sed_krig_odtmp http://maps.devotes.eu/layers/geonode:hex115attrributes
(JRC) Habitat forming Cold-‐Water Coral Habitat Suitability and Biodiversity Hotspots on the
Azores Plateau
(Lead: Fernando Tempera, in collaboration with IMAR/DOP-‐UAz)
Scope & main objectives
This works builds upon the progress made under project CoralFish
(EC/FP7:ENV/2007/1/213144) regarding the statistical modelling of deep-‐sea coral distributions
on the Azores Plateau (NE Atlantic). It aims at refining and finalizing Habitat Suitability Models
for 28 habitat-‐forming octocoral genera using the statistical package MaxEnt.
Milestone 15 Habitat suitability models developed
20
Data acquisition
Response variable
A comprehensive coral occurrence dataset was kindly provided by IMAR/DOP, University of the
Azores. The data were extracted from the COLETA database at IMAR/DOP-‐UAz containing both
published cold-‐water coral records and fisheries by-‐catch data.
The original 1350 coral records were inspected and their quality assessed. Only 998 non-‐
colocated records with a geographical accuracy better than <3km were retained for the
analysis. The occurrence numbers varied between 10 and 91 depending on the coral genus.
Environmental covariates
Occurrence data were intersected with the following 35 variables to produce an occurrence
matrix. A mesoscale resolution bathymetric grid of the Azores (cell size: 280m; projection: UTM
26N; datum: WGS84) produced by IMAR/DOP-‐UAz was used as the best available
geomorphological source. Terrain variables (general and complexity) were extracted from this
layer in an ArcGIS environment.
General terrain variables
• Depth
• Slope
• Eastness (zonal component of aspect)
• Northness (meridional component of aspect)
• General Curvature
• Profile Curvature
• Plan Curvature
• Residual bathymetry (neighbourhood radius: 1,400m)
• Bathymetry Positioning Index or BPI (neighbourhood radius: 1,400m)
Terrain complexity parameters
• Vectorial Rugosity Measure (VRM)
• Standard Deviation of Slope
• Surface to Area ratio
21
Near-‐seabed oceanographic conditions were calculated by upscaling from the 280m-‐resolution
bathymetry using data from the Global Ocean Data Analysis Project (GLODAP), the World
Ocean Atlas v.2009 (WOA 09) and Orr (2005).
Seabed chemical and physical conditions
(Collaboration with Chris Yesson, project CoralFish, Zoological Society of London)
• Temperature (WOA 09)
• pH (Orr 2005 e GLODAP)
• Alkalinity (GLODAP)
• ΩAragonite (Orr 2005 e GLODAP)
• ΩCalcite (Orr 2005 e GLODAP)
• Salinity (WOA 09)
• Phosphate concentration (WOA 09)
• Silicate concentration (WOA 09)
• Nitrate concentration (WOA 09)
• Dissolved Oxygen (WOA 09)
• Oxygen Saturation (WOA 09)
• Apparent Oxygen Utilization (WOA 09)
Near-‐seabed currents
(Collaboration with Manuela Juliano and Anabela Simões, project EASYCO, University of the
Azores)
• Mean current intensity (velocity in m/s)
• Mean current northness
• Mean current eastness
• Maximum current intensity (velocity in m/s)
• Maximum current northness
• Maximum current eastness
• Leeward/weatherside location in relation to average current direction
• Leeward/weatherside location in relation to maximum current direction
Milestone 15 Habitat suitability models developed
22
After conversion to the ascii raster required by MaxEnt using the ArcGIS Raster to ascii tool,
these variables were used as covariates in the development of spatial predictive models for the
different deep-‐sea coral taxa.
Modelling Approach
Habitat suitability is being modelled using the presence-‐only machine learning routine MaxEnt
(version 3.3.3k; http://www.cs.princeton.edu/~schapire/maxent). This statistical modelling
package estimates the probability distribution of maximum entropy (i.e. closest to uniform) for
presence-‐only data based on environmental constraints. Instead of presences and true
absences, MaxEnt requires only species presence data and grids of continuous or categorical
environmental variables for the study area. MaxEnt has been shown to surpass all other models
when predicting distribution based on presence-‐only data and remain effective despite small
sample sizes.
The settings used during the runs were the following:
-‐ presence records used for training: 10 to 91, depending on the coral genus;
-‐ background points used to determine the MaxEnt distribution (10,000 background
points + presence points for each genus; in order to create a similar bias between
sample data and background points, the background domain is confined to a mask
delimited by the maximum depth of coral occurrence in the response variable dataset
among all genera);
-‐ Environmental layers used: all
-‐ Regularization values (default): linear/quadratic/product: 0.133, categorical: 0.250,
threshold: 1.290, hinge: 0.500
-‐ Feature types used: all (linear, quadratic, hinge, product, threshold)
-‐ Response curves output: true
-‐ Jackknife: false
-‐ Output format: logistic
-‐ adjustsampleradius: -‐5
-‐ algorithm terminated after 500 iterations.
No constraints were imposed to the feature types (which essentially represent our ecological
response assumptions) due to the observation that the coral gardens to model were dominated

23
by a variety of species that could induce multimodal responses along environmental gradients –
an effect that would be better seized if a high degree of flexibility was conferred to the model.
The logistic output option was chosen as it provides a relative index of suitability that is easier
to interpret. This post-‐transformation of MaxEnt’s output scales up the raw values in a non-‐
linear way to values between 0 and 1, where 0 = unsuitable habitat and 1 = optimal habitat. If
species prevalence (τ, the chance of species being present in suitable areas) used for training
are from environmental conditions where probability of presence is ~0.5 (i.e., 50% of the study
area is occupied by the species) then the logistic output can be interpreted as an estimate of
the probability that the species is present conditional on the environmental conditions. As this
is generally not known, the output can be interpreted as the probability of presence under a
similar level of sampling effort as was required to obtain the known occurrence data.
Model performance evaluation
Model performance is being evaluated using the AUC (Area Under the Receiver Operating
Characteristic Curve) which is generated by the MaxEnt model using pseudo-‐random absence
(background) points. Usually its values range from 0.5 (random) to 1.0 (perfect discrimination)
with values lower than 0.5 indicating that the model performance is worse than a random
guess (Engler et al 2004). AUC’s were computed for both training and test datasets as there was
interest in assessing the model’s ability to accurately predict the occurrences used in model
building (AUCTrain) as well of independent occurrences (AUCTest).
A five-‐fold partitioning of the occurrence dataset was used for cross-‐validation. Using this
approach, each fold in turn (representing 20% of the full dataset) provides the test data for the
model run whilst the other 4 folds (corresponding to 80% of the full dataset) are used to train
the model.
The importance of the individual environmental variables was assessed using percent
contribution and permutation importance. Percent contribution refers to the increase in
regularized gain added by each variable. Permutation importance for each environmental
variable reflect the drop in training AUC (normalized to a percentage) produced by randomly
permuting the values of each variable on training presence and background data.
Milestone 15 Habitat suitability models developed
24
Relevant outputs
Based on the final model equation, the environmental covariate fields will be used to produce a
predictive habitat suitability map for the region of interest, displaying the potential distribution
of each genus. The predicted coral distribution map obtained for each genus is made into a
binary layer (representing suitable vs. poorly suitable habitat) using an Equal training sensitivity
and specificity criterion. A synthesis map of species richness will then be produced from a sum
of the 28 binary maps that highlights potential species-‐rich areas (hotspots) for the Azores
Plateau.
Future work
Enhancement of the background domain using customized background domain masks for each
genus. For each genus, this mask will extend between the shallowest and deepest coral
occurrences.
Relevant files on the website: none to date for this activity

25
Mediterranean Sea: JRC, DEU
(JRC) Mapping and forecasting vulnerable areas to invasions in the Mediterranean Sea
(Leads: Heliana Teixeira, Fernando Tempera, Stelios Katsanevakis)
Scope & main objectives
Identify vulnerable areas to invasions in the Mediterranean Sea, using habitat suitability models
for predicting distribution of high impact marine invasive species (SDMs).
After modelling the selected species potential distribution in the Mediterranean, both the
realized and the potential distribution maps will be used to map most vulnerable areas. Also
the current and the potential cumulative impacts of these invasive species on biodiversity in
the whole regional sea will be evaluated and mapped.
In addition, the impact of future scenarios on the potential distribution of the species will be
modelled, using both climatic drivers (as forecasted in recent climate change scenarios) and
anthropogenic drivers (to be built based on most relevant pressures identified in the
Mediterranean area and their future trends).
The final goal is to understand regional and local threats to biodiversity in the Mediterranean
area caused by invasive species, using their potential distribution and trends (observed &
predicted) in their invasive patterns.
Modelling approach
The potential distribution of high impact marine invasive species will be developed using a
correlative model (MaxEnt). The models will take presence-‐only species records using both
native range (possibly applying the Projected Dispersal Envelop concept -‐ PDE) and invaded
range, to better infer on the invasive potential of the species.
The following climatic variables and environmental variables are currently being considered for
use: temperature, depth, habitat type, substrate nature. pH, primary production, light
availability/transparency.
The potential distributions of the selected species will also be modelled under future scenarios
of climatic change and anthropogenic changes in order to evaluate future spatial changes in the
impacts. A work plan has been drafted to potentially compare these projections with those
estimated via a size-‐spectrum dynamic bioclimatic envelope model (Fernades et a. 2013) for

Milestone 15 Habitat suitability models developed
26
common species of interest, which were produced for FP7 project VECTORS (FP7/2007-‐2013
266445).The SS-‐DBEM further consider also changes in productivity as derived from coupled
hydrodynamic-‐biogeochemical models (e.g. POLCOMS_ERSEM), and changes in target species
population dynamics and dispersal associated with changes in habitat. This comparison will
enable a more balanced perspective about the potential effects of changes in the distribution
of suitable habitat on species distributions, as the two models consider a different set of
parameters to predict distribution.
Data acquisition
Data on species native range and invaded range will be sourced from global databases such as
GBIF (native range) and EASIN (invaded range in the Mediterranean region). Other information
on impacts of each invasive species and pathways of invasion are also being gathered from
literature and the EASIN database.
Environmental layers are currently being gathered from different sources (e.g. Giakoumi et al
2013; Micheli et al 2013, EMIS portal, and others to be detailed).
Publicly available IPCC climate change datasets as well as JRC in-‐house modelling results will
likely provide the geospatial layers representing future marine climate scenarios.
Anthropogenic scenarios will be built using DEVOTES outputs from other tasks as well as
complementary sources to be detailed.
Relevant outputs
Vulnerability maps showing areas with higher potential for future invasions, under current and
future climatic scenarios for the whole the Mediterranean area.
Cumulative impact maps and consequences for biodiversity, for all scenarios modelled, will also
be produced for the whole the Mediterranean area.
Planning of activities and task due date
To date: activities for this tasks have started with the compilation of data and literature review,
namely:
a. species data -‐ list of species to be modelled and type of data available from sources of data on species alien range (acquired) and native range (compilation will start in April 2014);
27
b. environmental data -‐ parameters selection, GIS layers searched (compilation will start in April 2014);
c. scenarios data (climatic change scenarios)
Future:
d. complete the collation of the above-‐mentioned data
e. gather anthropogenic scenarios information
f. establish single species impact on biodiversity
g. run species models
h. add scenarios to modelling
Relevant files on the website: none to date for this activity
(DEU) Species distribution dependence on pressure variables: An assessment using Habitat
Suitability Models (HSM)
(Lead: Gökhan Kaboğlu)
Scope & main objectives
In literature, HSM applications have mainly focused on the estimation of the relationship
between species presence data and environmental parameters characterizing the spatial
properties of the species niche (Phillips et al., 2004; Phillips et al., 2006; Elith et al., 2011).
Anthropogenic pressures in the marine environment are also studied well (Stelzenmüller et al.,
2010; Parravicini et al., 2011), but are rarely coupled to species distribution. Besides niche
preferences of the species (environmental parameters), their present distribution is also
affected at a local scale by human activities such as aquaculture, fishing, shipping, coastal,
marine and underwater structures, dumping, aggregates, landfill & dredging, etc. and at a
global scale by the climate change.
The main objective of this activity is to test whether HSMs are capable of predicting the inter-‐
relation between species distribution and anthropogenic pressures. The idea depends on the
fact that species distribution does not depend only on the environmental (geomorphological
and physico-‐chemical) parameters of the marine environment, but also is limited with the
human disturbance.

Milestone 15 Habitat suitability models developed
28
A number of cases will be run in the models to determine the changes in HSM distribution
probabilities. The research will be structured to answer the following questions to improve and
validate GIS maps of benthic habitats:
• Are HSMs capable of coupling anthropogenic pressure variables with environmental
parameters in producing benthic species distribution patterns?
• How do benthic species distribution patterns change under the effect of human
activities?
• Which pressures (activities) have major effect in this change?
Linked to Tasks: T1.1.2 Create generic/regional sea-‐specific matrices of pressure-‐impact
links and variations in biodiversity and T1.3.1 Evaluate the adequacy of pressure-‐impact
links as means to indicate status and changes of key processes, determination of
pressure-‐impact links.
• Which benthic groups are more sensitive to human activities (disturbance)?
Linked to enhancing monitoring techniques: T5.1.1 Applying remote sensing to assess
marine biodiversity (from species distribution to habitat types and their heterogeneity)
and T5.2.1 Validation of the metagenetic and metagenomic approaches to assess
structural and functional biodiversity (from phytoplankton to macro-‐invertebrates).
Modelling approach
The MaxEnt model will be used to assess if HSMs are capable of coupling these pressure
parameters with traditionally used environmental parameters.
The modelling approach will include following steps:
Determination of species: Models will be run for a wide number of benthic species, giving
priority to key, endemic, endangered and invasive species, as possible as existing dataset allows
in two case areas (Gulf of Izmir and Ildiri, at the Aegean coast of Turkey). Presence-‐only data
will be used for modelling.
Environmental parameters will, at minimum, include terrain variables (depth, slope, aspect),
seabed physical variables (temperature, salinity, density, mean current velocity), chemical
variables (pH, dissolved oxygen, organic carbon) and sediment variables (grain size). HSM will

29
be run with these environmental parameters for the selected species in order to obtain
distribution probabilities.
Pressure variable: Major human activities in the study areas will be digitized in GIS. Then,
"relative distance" of each grid cell (which will define the resolution of mapped environmental
parameters) to each activity will be calculated. Relative distance values will be treated as the
pressure variable to MaxEnt, in addition to the environmental parameters mentioned above.
The difference maps will be obtained by comparing the model outputs of both cases (with and
without pressure variable) for each species of interest.
Data acquisition
Species presence, terrain, physical, chemical and sediment datasets will mainly obtained from
several finalized DEU projects, and will be supported by published literature.
Human activities dataset will be obtained from the local authorities and will be mapped in the
GIS software.
Relevant outputs
Difference maps of test results indicating whether HSM MaxEnt is capable of coupling
environmental parameters with pressure variable.
Majority list of environmental parameters affecting the distribution of selected benthic species.
Majority list of human activities affecting the distribution of selected benthic species (in case of
success in output 1).
Assessment of sensitiveness to human pressure of selected species (dependent on output 1).
Planning of activities
To date:
a. Data inventory search for 7 sites along the Mediterranean and Aegean coasts of Turkey
b. Two sites (Gulf of Izmir and Ildiri) with best datasets for HSM application are selected for the case studies.
Future:
c. Preparation of GIS basemaps and importing all datasets to the GIS and HSM;
d. Run Maxent for only environmental parameters;
e. Run MaxEnt with additional "relative distance" variable;

Milestone 15 Habitat suitability models developed
30
f. Obtain "difference maps" of two cases for each selected species;
g. Assessment of environmental parameters and human activities that affect species distribution.
Relevant files on the website: none to date for this activity
Bay of Biscay: AZTI, CNRS
(AZTI) Seabed habitat mapping in the Bay of Biscay
(Lead: Ibon Galparsoro)
Scope & main objectives
The approach developed by AZTI is described in Galparsoro (2013) but in summary this method
creates a process-‐driven benthic sedimentary habitat model which maps the major
environmental factors influencing soft-‐bottom macrobenthic community structure and the life-‐
history traits of species. Among the 16 environmental variables considered, a combination of
water depth, mean grain size, a wave-‐induced sediment re-‐suspension index and annual
bottom maximum temperature, were the most significant factors explaining the variability in
the structure of benthic communities in the area. It was observed that the habitat classes
defined in the process-‐driven model reflected different structural and functional characteristics
of the benthos. Moreover, benthic community structure anomalies due to human pressures
could also be detected within the model produced. Thus, the final process-‐driven habitat map
can be considered as being highly useful for seafloor integrity and biodiversity assessment,
within the European MSFD as well as for conservation, environmental status assessment and
managing human activities, especially within the marine spatial planning process.
Relevant files on the website: http://maps.devotes.eu/layers/geonode:process_flat
Black Sea: MHI-‐NASU, DEU, KUCORPI
(MHI-‐NASU) Habitat mapping of macrophytes in the Black Sea
(Lead: Tanya Churilova)
Scope & main objectives

31
The regional model of downwelling radiance was developed based on bio-‐optical features of
the Black Sea (Churilova and Suslin, 2008, described in D4.1) and will be used by MHI-‐NASU to
assess the potential extension of macrophytes on the north-‐western shelf, using a regional bio-‐
optical model based on remote sensing data, by:
a. assessing water transparency; which will allow to estimate light condition near bottom;
b. analysing seasonal variability in the light intensity near bottom,
c. estimating maps of potential extension of benthic flora taking into account known data on photo-‐physiological characteristics of macrophytes
To apply this model for assessment of near bottom photosynthetic available radiation (PAR)
data on the bottom depth in the Black Sea shelf are required. Based on these information the
PAR distribution on the shelf bottom (PARbottom) have been calculated with high spatial
resolution (4 x 4 km). The two-‐ weekly composition maps of PARbottom have been done (Figure
15). The strong (one-‐two order) inter-‐annual variability in PARbottom was observed. Minimum
values of PARbottom are typical for winter-‐spring and maximum values for late summer (Figure
15).
1st half of Jan 2nd half of Jan 1st half of Feb 2nd half of Feb
1st half of Mar 2nd half of Mar 1st half of Apr 2nd half of Apr
1st half of May 2nd half of May 1st half of Jun 2nd half of Jun
1st half of Jul 2nd half of Jul 1st half of Aug 2nd half of Aug

Milestone 15 Habitat suitability models developed
32
1st half of Sept 2nd half of Sept 1st half of Oct 2nd half of Oct
1st half of Nov 2nd half of Nov 1st half of Dec 2nd half of Dec
Figure 15. Maps of photosynthetic available radiation (PAR, in E m-‐2 day-‐1) near bottom simulated for 2006 by regional model
Figure 16. Dynamics of chlorophyll a concentration (Chl) and light absorption coefficient of colored dissolved organic matter in sum with non-‐algal particles (aCDM(490)) simulated by regional Chl model (Suslin et al., 2008) near Danube delta.
The inter-‐annual variability in PARbottom resulted from the seasonal dynamics of water
transparency, which in turn was dependent on phytoplankton pigments, suspended non-‐algal
particles (NAP) and coloured dissolved organic matter (CDOM) content that absorb light energy
within the water column. Figure 16 shows the dynamics of chlorophyll a concentration (top
panel) and the light absorption coefficient of CDOM (bottom panel) in sum with NAP relevant
for upper layer (averaged for first optical depth) in a fixed station near Danube Delta.
0
4
8
12
16
1998 1999 2000 2001 2002 2003 2004 2005 2006 2007 2008 2009 2010 2011 2012
Chl, mg m-3
0
0.05
0.1
0.15
0.2
0.25
1998 1999 2000 2001 2002 2003 2004 2005 2006 2007 2008 2009 2010 2011 2012
aCDM(490), m-1

33
Further work
Analysis of published information on light compensation point for macrophytes growth will
allow an assessment of the minimum light required for growth. We will then aim to find the
maximum depth of macrophytes distribution on the western (Case Study area), north–western
shelf of the Black Sea. For this aim the annual value of PARbottom will be calculated. Then isolines
relevant to minimum PAR required for macrophyte growth will be defined. As result we will be
able to map the potential distribution of macrophytes on the Black Sea shelf.
Analyse the inter-‐annual variability in phytoplankton bloom intensity (using chl a concentration
as proxy of phytoplankton biomass); dissolved and suspended organic matter enrichment
(using light absorption as indicator) will be analysed in order to show the effect of
eutrophication-‐related pressures on decreasing potential area of macrophytes distribution,
Relevant files on the website: none to date
(KUCORPI) Species distribution dependence on pressure variables: An assessment using Habitat
Suitability Models (HSM)
(Lead: Martynas Bučas)
Scope & main objectives
The prediction of species distribution can provide useful information for the management and
conservation of threatened and endangered species and vulnerable ecological communities.
Indeed, the ability to effectively predict species habitats and biological communities has
become urgent in the context of recent rapid habitat loss and the impacts of global climate
change (Clark et al., 2001). Importantly, the results of HSM can enhance our understanding of
the degree of influence of various environmental parameters on distributions of habitats (e.g.
Austin, 2002; Franklin, 1995; Guisan and Zimmermann, 2000). Moreover, new marine survey
techniques (e.g., multibeam sonar; georeferenced underwater video) coupled with an increase
in the need to conserve biodiversity over large areas, are now enabling and driving research
into marine ecological processes and the effective mapping of species’ habitats and biological
Milestone 15 Habitat suitability models developed
34
communities (e.g., Greene et al., 1999; Roff et al., 2003) and testing against human pressures
(e.g., Bergström et al., 2003).
The main objective of this activity is to improve HSM of the red alga (Furcellaria lumbricalis)
habitat distribution in the eastern Baltic Sea coast (Bučas, 2009) and derive its maximum depth
limit, which may be related to local eutrophication gradient and serve as indicator for the water
quality assessment. The existing HSM model was based on data from the Lithuanian coastal
waters, whereas additional species distribution and environmental data is now available from
Latvian coastal waters. It will be added to the common dataset and the HSM will be extended
along the local eutrophication gradient formed by outflow of turbid and nutrient enriched
waters from the Curonian lagoon. The maximum depth limit will be derived from the empirical
relationship between algal cover and depth, and correlated to the parameters of
eutrophication gradient, e.g., Secchi depth, nutrients. The obtained results may serve to the
Task 3.3.3: Develop tools/methodologies for setting reference and target values for biodiversity
and food-‐web GES indicators where possible.
Modelling approach
The nonlinear predictive species distribution modelling methods (e.g. GAM, MaxEnt) will be
used to assess HSM of the red alga (Furcellaria lumbricalis) habitat distribution and cover.
Data acquisition
Species data: existing data is from the Baltic Sea Lithuanian coast containing 400 descriptions of
bottom vegetation occurrence and cover by SCUBA divers or using underwater video systems.
Additional data is now available from Latvian coastal waters on species occurrence, and the
data of algal cover most likely will be available too.
The main environmental parameters that could cause the species distribution and/or cover,
and for which is available data will be used in the HSM. Existing data from the both areas in the
eastern Baltic Sea coast contains these environmental parameters: Secchi depth, bottom
substrate type, wave exposure, depth, slope, aspect, salinity, mean current velocity. The data is
obtained from national monitoring programs, other national and international (e.g. BALANCE
project) data resources. In order to collate the datasets of environmental parameters from
Lithuanian and Latvian coastal waters it is necessary to unify data according the time frame and
methods. The point-‐sampled data will be interpolated within the study area in order to obtain
GIS layers of environmental parameters, needed for the HSM.
35
Relevant outputs
The empirical relationships between the red alga (occurrence and cover) and environmental
variables.
The red alga distribution and cover map in the eastern Baltic Sea coast.
Assessment of sensitiveness to eutrophication pressure (Secchi depth, concentration of
nutrients).
Planning of activities
To date:
d. Data inventory search for the eastern Baltic Sea coastal waters.
e. Creation of common dataset of species occurrence in the eastern Baltic Sea coastal waters.
Future:
f. Preparation of GIS basemaps and importing all datasets to the GIS and HSM;
g. Run of HSM for species occurrence;
h. Run of HSM for species cover;
i. Assessment of eutrophication parameters that affect species maximum depth distribution.
4. Next steps
Task 4.1.3 will be completed with the contribution from several project partners (OceanDTM,
JRC, CEFAS, PML, AZTI, KUCORPI, DEU, CNRS, MHI-‐NASU) in the next phase. DEVOTES T4.1.3
partners will:
Participant Location Future activity Cefas / OceanDTM/ PML
North Sea, English Channel
▪ Benthic habitat suitability models for benthos and fish will be developed from physical and environmental data collated already in DEVOTES and include water-‐column and phytoplankton productivity information. SS-‐DBEM further considers changes in population dynamics parameters and dispersal (from T4.1.4 and T3.2.1 respectively).
▪ We will combine information from the benthic habitat suitability models for the various benthic fauna and
Milestone 15 Habitat suitability models developed
36
fish species to show change in the diversity of habitats and species spatially.
OceanDTM / Cefas
English Channel, North Sea
▪ Automate method for deriving morphometric parameters from high resolution multi-‐beam datasets.
▪ Use existing manually interpreted data as a training dataset to develop classification schema.
▪ Use biological sampling datasets to test the ability of acoustic data to improve upon existing habitat classifications and maps.
PML English Channel
▪ Utilize Western Channel Observatory data in habitat studies to assess changes between driver and impact relationships across scales
▪ Examine variability and error in habitat maps JRC / IMAR Azores
Plateau ▪ Enhancement of the background domain using
customized background domain masks for each genus. ▪ For each genus, this mask will extend between the
shallowest and deepest coral occurrences. JRC/PML (possibly)
Mediterra-‐nean (entire area)
▪ scenarios data (climatic change scenarios) ▪ complete the collation of the species list and native
range data ▪ gather anthropogenic scenarios information ▪ establish single species impact on biodiversity ▪ run species models ▪ add scenarios to modelling ▪ compare projections between different models
DEU Gulf of Izmir and Ildiri, at the Aegean coast of Turkey
▪ Preparation of GIS basemaps and importing all datasets to the GIS and HSM;
▪ Run MaxEnt for only environmental parameters; ▪ Run MaxEnt with additional "relative distance"
variable; ▪ Obtain "difference maps" of two cases for each
selected species; ▪ Assessment of environmental parameters and human
activities that affect species distribution. MHI-‐NASU Black Sea ▪ Determine the maximum depth of macrophytes
distribution on the western (Case Study area) ▪ Assess eutrophication-‐related pressures and model the
potential decrease in the area of macrophytes distribution
KUCORPI Baltic Sea ▪ Prepare GIS basemaps and import all datasets to the GIS and HSM;
▪ Run HSM for species occurrence; ▪ Run HSM for species cover; ▪ Assess eutrophication parameters that affect species
maximum depth distribution.

37
5. Relevant publications
DEVOTES authors in bold and DEVOTES papers online: www.devotes-‐project.eu/publications/
Austin, M.P. (2002). Spatial prediction of species distribution: an interface between ecological theory and statistical modelling. Ecol. Modell. 157: 101-‐118.
Benedetti-‐Cecchi, L. (2003). The importance of the variance around the mean effect size of ecological processes. Ecology, 84(9), 2335-‐2346.
Bergström, U., G. Sundblad, A.-‐L. Downie, M. Snickars, C. Boström, and M. Lindegarth (2013). Evaluating eutrophication management scenarios in the Baltic Sea using species distribution modelling. Journal of Applied Ecology 50: 680–690.
Bucas, M. (2009). Distribution patterns and ecological role of the red alga Furcellaria lumbricalis (Hudson) J.V. Lamouroux off the exposed Baltic Sea coast of Lithuania. Doctoral degree theses of Ph.D. in ecology and environmental studies, Klaipeda University. Klaipeda, 124 p.
Churilova T., Suslin V. Parametrization of light absorption by all in-‐water optically active components in the Black Sea: Impact for underwater irradiance and primary production modeling. Proceeding of the fifth international conference on EuroGOOS “Coastal to Global Operational Oceanography: Achievements and Challenges” 20 -‐ 22 May 2008, Exeter, UK. published by EuroGOOS Office, 2010. N28. P. 199 – 205.
Clark, J.S., Lewis, M., Horvath, L. (2001). Invasion by extremes: population spread with variation in dispersal and reproduction. Am. Nat. 157, 537–554.
Elith, J., Leathwick, J. R., & Hastie, T. (2008). A working guide to boosted regression trees. Journal of Animal Ecology, 77(4), 802-‐813.
Elith. J., Phillips, S. J., Hastie, T., Dudik, M., Chee, Y. E. and Yates, C. J. (2011). A statistical explanation of MaxEnt for ecologists. Diversity and Distributions 17, 43–57
Fraschetti, S., Guarnieri, G., Bevilacqua, S., Terlizzi, A., Claudet, J., Russo, G. F., & Boero, F. (2011). Conservation of Mediterranean habitats and biodiversity countdowns: what information do we really need? Aquatic Conservation: Marine and Freshwater Ecosystems. 21(3), 299-‐306.
Fernandes, J. A., W. W. Cheung, S. Jennings, M. Butenschön, L. Mora, T. L. Frölicher, M. Barange, and A. Grant. 2013. Modelling the effects of climate change on the distribution and production of marine fishes: accounting for trophic interactions in a dynamic bioclimate envelope model. Global Change Biology 19:2596–2607.
Franklin, J. (1995) Predictive vegetation mapping: geographic modeling of biospatial patterns in relation to environmental gradients. Progress in Physical Geography, 19: 474–499.
Galparsoro, I., Á. Borja, V. E. Kostylev, J. G. Rodríguez, M. Pascual, I. Muxika (2013). A process-‐driven sedimentary habitat modelling approach, explaining seafloor integrity and biodiversity assessment within the European Marine Strategy Framework Directive. Estuarine, Coastal and Shelf Science 131,194-‐205
Govaere, J. C. R., Van Damme, D., Heip, C., & De Coninck, L. A. P. (1980). Benthic communities in the Southern Bight of the North Sea and their use in ecological monitoring. Helgoländer Meeresuntersuchungen, 33(1-‐4), 507-‐521.
Greene, H.G., Yoklavich, M.M., Starr, R.M., O'Connell, V.M., Wakefield, W.W., Sullivan, D.E., McRea Jr, J.E., Cailliet, G.M. (1999). A classification scheme for deep seafloor habitats. Oceanologica Acta 22 (6), 663-‐678.

Milestone 15 Habitat suitability models developed
38
Guisan, A. and Zimmerman, N.E. (2000). Predictive habitat distribution models in ecology. Ecol. Modell. 135: 147-‐186.
Halpern, B. S., Walbridge, S., Selkoe, K. A., Kappel, C. V., Micheli, F., D'Agrosa, C., & Watson, R. (2008). A global map of human impact on marine ecosystems. Science, 319(5865), 948-‐952.
Kostylev, V. E. (2012). Benthic habitat mapping from seabed acoustic surveys: do implicit assumptions hold? Sediments, Morphology and Sedimentary Processes on Continental Shelves: Advances in technologies, research and applications (Special Publication 44 of the IAS), 108, 405-‐416.
Olsen EM, Johnson D, Weaver P, Goñi R, Ribeiro MC, Rabaut M, Macpherson E, Pelletier D, Fonseca L, Katsanevakis S, Zaharia T (2013). Achieving Ecologically Coherent MPA Networks in Europe: Science Needs and Priorities. Marine Board Position Paper 18. Larkin, KE and McDonough N (Eds.). European Marine Board, Ostend,Belgium.
Roff, J.C., Taylor, M.E., Laughren, J. (2003). Geophysical approaches to the classification, delineation and monitoring of marine habitats and their communities. Aquatic Conservation: Marine and Freshwater Ecosystems 13, 77-‐90.
Steven J. Phillips, Miroslav Dudík, Robert E. Schapire (2004). A maximum entropy approach to species distribution modeling. Proceedings of the Twenty-‐First International Conference on Machine Learning, 655-‐662
Steven J. Phillips, Robert P. Anderson, Robert E. Schapire (2006). Maximum entropy modeling of species geographic distributions. Ecological Modelling 190, 231-‐259
Stelzenmüller V., J. Lee, A. South, S.I. Rogers (2010). Quantifying cumulative impacts of human pressures on the marine environment: a geospatial modelling framework. Marine Ecology Progress Series 398, 19-‐32
Suslin V.V., Churilovs T.J., Sosik H.M. The SeaWiFS algorithm of chlorophyll a in the Black Sea. Marine Ecological Journal, 2008, Vol. VII, No. 2, p. 24-‐42 (in Russian)
Parravicini V., A. Rovere, P. Vassallo, F. Micheli, M. Montefalcone, C. Morri, C. Paoli, G. Albertelli, M. Fabiano, C. N. Bianchi (2011). Understanding relationships between conflicting human uses and coastal ecosystems status: A geospatial modeling approach. Ecological Indicators (2011), doi:10.1016/j.ecolind.2011.07.027
Wiggert, J., Dickey, T., & Granata, T. (1994). The effect of temporal undersampling on primary production estimates. Journal of Geophysical Research: Oceans (1978–2012), 99(C2), 3361-‐3371.