half year results 2017 1 - mitchells & butlers · - operating margin down 0.9ppts - ytd total...
TRANSCRIPT

– 1 –– 1 –Half Year Results 2017
– 2 –– 2 –
Financial Review H1 2017
Tim Jones
Finance Director

– 3 –– 3 –
Income Statement
H1 2017 H1 2016
£m £m
Revenue 1,123 1,096 2.5%
Operating costs (974) (940)
Operating profit 149 156 (4.5)%
Interest (66) (68)
Pensions finance charge (4) (6)
Profit before tax 79 82 (3.7)%
Operating margin 13.3% 14.2% (0.9) ppts
Earnings per share 15.2p 15.7p (3.2)%

– 4 –– 4 –
Like-for-like sales
• Strong recovery in LFL sales across the estate from prior year
• Half year results are impacted by Easter moving to second half
• Sales growth driven by increase in spend per item on volume
marginally down, in part reflecting premiumisation of the estate
• Recovery built on slightly higher gross margins
Week Week Week Week
1 – 15 16 – 28 1 – 28 1 – 33
Food 1.6% (0.1)% 0.8% 1.4%
Drink 1.7% 3.2% 2.3% 2.4%
Total 1.7% 1.4% 1.6% 1.9%

– 5 –– 5 –
Building sales momentum
Total like-for-like sales Uninvested like-for-like sales
Oct 2015
Rolling 12-week average
May 2017 Oct 2015 May 2017
● Improvement in sales trend including uninvested estate
● Continuation of market outperformance
Weeks 1 – 33 +1.9%
Weeks 1 – 33 (0.5)%

– 6 –– 6 –
EBIT movement
H1 2016
£156m
H1 2017
£149m
FY 2016
openings and
remodels
Easter
movement
FY 2017
openings and
remodels
Like-for-like
trading;
mainly
inflationary
costs
£(4)m
+£13m
£(10)m
£(6)m

– 7 –– 7 –
Inflationary cost headwinds unchanged
FY17
Food/ drink
(including
currency
impact)
Labour Property Energy Other
• Inflationary cost headwinds remain in line with previous guidance:
• FY18 outlook for similar overall rate of cost inflation (notably wages,
business rates, auto-enrolment, sugar tax, apprenticeship levy)
£m

– 8 –– 8 –
Group Cash Flow
H1 2017 H1 2016 FY 2016
£m £m £m
EBITDA before adjusted items 210 217 431
Working capital / non cash items - - (7)
Pension deficit contributions (23) (26) (49)
Cash flow from operations 187 191 375
Capital expenditure (93) (88) (167)
Net interest paid (60) (62) (125)
Tax (11) (8) (28)
Other 1 1 5
Free cash flow 24 34 60
Dividends (4) (21) (31)
Net cash flow 20 13 29
Group net debt (1,825) (1,862) (1,840)
Net debt : EBITDA* 4.3x 4.2x 4.3x
* based on annualised EBITDA

– 9 –– 9 –
Capital expenditure and returns
• Increase in return generating capex investment reflecting revised estate plan
and reduced remodel lifecycle
• Partly funded by a reduction in maintenance and infrastructure investment
• Annual EBITDA return for conversion and acquisition projects of 18%, with
recent projects performing more strongly
• Sales uplift on remodel projects continues to exceed 10%

– 10 –– 10 –
Summary
• Strong improvement in sales across the estate
• Movement of Easter will now help the second half
• Inflationary cost headwinds remain strong putting margins under pressure
• Unchanged interim dividend at 2.5p per share
• Pension negotiations ongoing, will update once concluded
– 11 –– 11 –
Phil Urban
Chief Executive Officer

– 12 –– 12 –
The Macro Environment – The Consumer
Consumer confidence
Source: GFK
Disposable income growth
Source: Asda Income Tracker
●Consumer confidence remains low driven by macro economic concerns not personal finance
●Consumer spending has remained in growth however indications of a slow down in real disposable income growth
Brexit
●Positive performance against uncertain economic backdrop

– 13 –– 13 –
The Macro Environment - Inflation
Inflation
Source: CPI ONS, FPI Prestige Purchasing ltd
● Inflationary cost environment unchanged:
- Cost headwinds remain and are in line with previous guidance
- Food inflation accelerated by supply issues and foreign exchange
- Pricing: market has begun to respond to increasing costs

– 14 –– 14 –
The Market Context
Supply Discounting
Restaurant Supply Growth
● Slow down in restaurant openings
● Instances of new brands closing sites or slowing growth
● Pockets of growth tend to be in branded chains
● Widespread discounting during quieter periods disguises some of the pricing impact of increased cost head winds
2012 2013 2014 20152011 2016
Source: CGA Peach
Competitor ad.

– 15 –– 15 –
First half sales
● Continued positive sales momentum:
- Sales improved in uninvested estate
- Strong performance over key dates
- Operating margin down 0.9ppts
- YTD total sales up 2.6%
- YTD like-for-like sales up 1.9%
● Easter movement distorts financial performance of H1

– 16 –– 16 –
Like-for-like sales versus market
(5%)
(4%)
(3%)
(2%)
(1%)
0%
1%
2%
3%
4%
5%
6%
7%
Rolling four-weekly average vs Peach Tracker
Oct2015
Oct2016
Apr2016
Apr2017
MAB underperformance MAB outperformance

– 17 –– 17 –
Our Performance – Improvement across portfolio
Change in brand like-for-like: H1 2016 vs H1 2017
● Improvement in brand LFL sales performance across the majority of brands
● Sales growth is not all capital driven

– 18 –– 18 –
Recap on three priorities
Build a more
balanced business
Instil a more
commercial culture
Driving an
innovation agenda
- Brand propositions
- Conversion to successful formats
- Upgraded amenity in core
- Profitable sales
- Core operational drivers
- Build on technology investment
- Digital marketing
- New concept development
– 19 –– 19 –
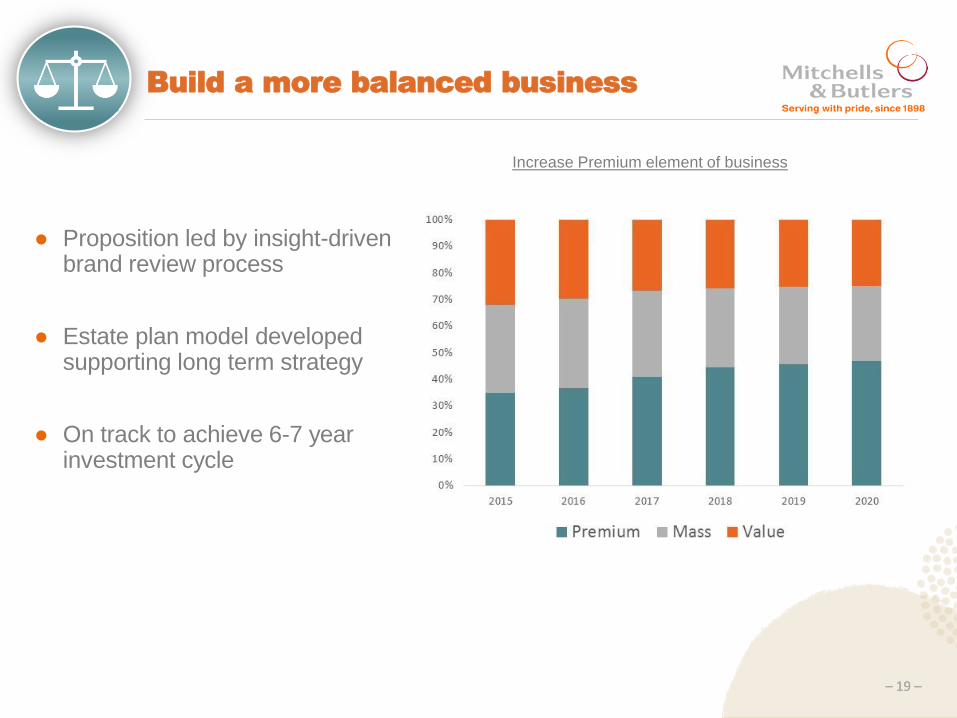
Build a more balanced business
● Proposition led by insight-driven brand review process
● Estate plan model developed supporting long term strategy
● On track to achieve 6-7 year investment cycle
Increase Premium element of business
– 20 –– 20 –
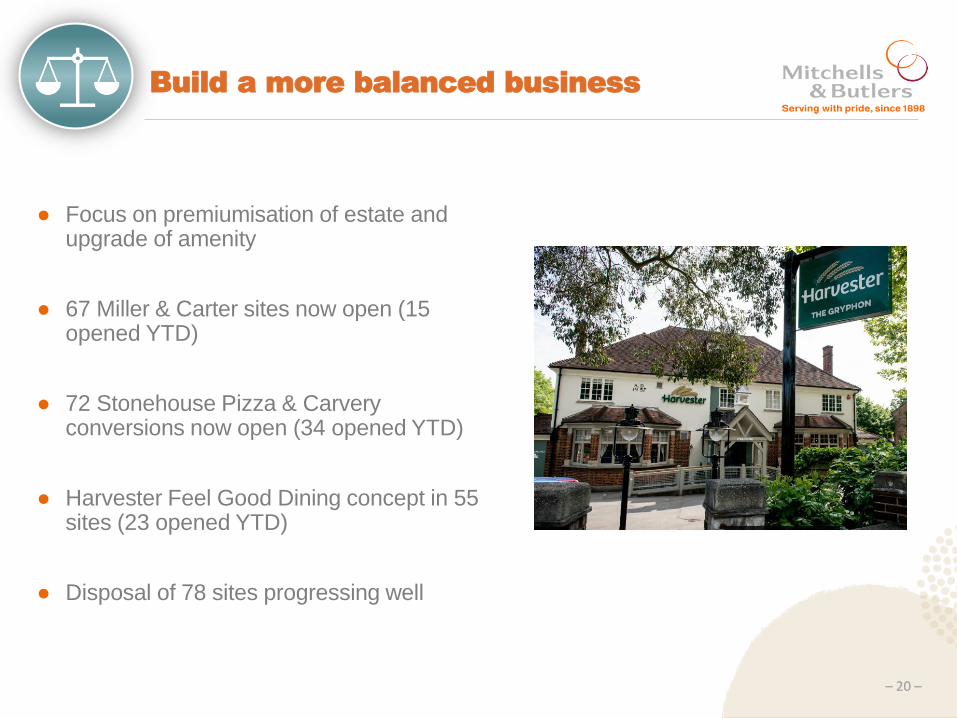
Build a more balanced business
● Focus on premiumisation of estate and upgrade of amenity
● 67 Miller & Carter sites now open (15 opened YTD)
● 72 Stonehouse Pizza & Carvery conversions now open (34 opened YTD)
● Harvester Feel Good Dining concept in 55 sites (23 opened YTD)
● Disposal of 78 sites progressing well

– 21 –– 21 –
Instil a more commercial culture
● New divisional structure embedded
● Improved sales forecasting enabling better cost management
● Time and Attendance enabled through system upgrade
● Team flexibility facilitated through technology
0 (0)
0 (0)
0 (0)
2
0
0 (0)
6
1

– 22 –– 22 –
Instil a more commercial culture –
Guest care
● Online tool which consolidates all digital feedback launched
● Increased engagement from teams and increased positive ratings
● Over 40k feedback and review comments per month
● In March we responded to 82% of comments vs. 40% this time last year

– 23 –– 23 –
Instil a more commercial culture –
Guest care
● Positive link between ratings and other key output metrics
Reputation score
Increase LFL sales
Decrease complaints
ratio
Increase guest
satisfaction
– 24 –– 24 –
Instil a more commercial culture –
Profitable sales
● Pricing strategy
- Menu development with opportunities to increase spend per head
- Utilise data to drive pricing decisions
● Central procurement leverages scale
- Product substitution - Joint procurement
● Commercial ethos
- Second wireless device for managers - Reduced number of meetings

– 25 –– 25 –
Driving an innovation agenda –
Technology and digital
● Mobile payment through Flypay
● Order at table facility under development
● Upgraded Wi-Fi
Online bookings – average per week
● Continued focus on bookings
● Focus on improving booking journey through integrated table management and website improvements
Guest digital experience

– 26 –– 26 –
● 6 brands now have apps live
● 825k downloads
● Browns is the latest app to be launched and includes a loyalty mechanic
● Number of loyalty mechanics being tested
Driving an innovation agenda –
Technology and digital

– 27 –– 27 –
Driving an innovation agenda –
Delivery
● 55 sites now live on Deliveroo
● Average sales per week at £300 a site
● 7 of top 10 performing sites outside major cities
● New concepts demand is particularly high
● Trial with new partners to access more of this growing market
● Opportunity in up to 25% of the estate

– 28 –– 28 –
● Two new trial concepts now open, monitoring and refining the offers
● Process of development bringing progressive thinking to existing brands
● Further new concepts currently in development
Driving an innovation agenda –
New concepts

– 29 –– 29 –
People
● Turnover
• Total pub staff turnover reduced by 2.6% in H1
● Engagement
• 1,500 more responses than last year
• Total engagement up 3%
• Improved scores for every cohort
● Focus on recruiting and training apprentices
• 2,000 apprentices on our programme
• 600 new apprentices recruited in H1

– 30 –– 30 –
Summary
● Encouraging like-for-like sales momentum
● Inflationary cost headwinds remain
● Strong progress made and continuing on all three strategic priorities

QUESTIONS