half-yearly financial report at 30 june …. +39 0522 9433 fax +39 0522 944044 share capital: €...
TRANSCRIPT

Half-yearly financial report – H1 2012 ________________________________________________________________ 1
HALF-YEARLY FINANCIAL REPORT AT 30 JUNE 2012
(Translation of the Italian original which remains the definitive version)

Half-yearly financial report – H1 2012 ________________________________________________________________ 2
CONTENTS
1. GENERAL INFORMATION
1.1. Corporate officers and information 1.2. Group Structure 1.3. Landi Group Financial Highlights 1.4. Significant Events During the Six Months
2. INTERIM REPORT ON OPERATING PERFORMANCE
2.1. Macroeconomic context and reference market 2.2. Company development 2.3. Innovation, industrial research and development 2.4. Human Resources, training and safety at work 2.5. Operating performance 2.6. Landi Renzo and the financial markets 2.7. Policy for analyzing and managing risks connected with the activities of the Group 2.8. Other information 2.9. Significant events after closing the six-month period and forecast for operations.
3. ABBREVIATED SIX-MONTHLY INTERIM CONSOLIDATED FINANCIAL STATEMENTS AS AT 30 JUNE
2012
3.1. CONSOLIDATED STATEMENT OF FINANCIAL POSITION 3.2. General consolidated Income Statement 3.3. Consolidated cash flow statement 3.4. Consolidated statement of changes in Equity
4. EXPLANATORY NOTES TO THE ABBREVIATED SIX-MONTHLY CONSOLIDATED FINANCIAL STATEMENTS AS AT 30 JUNE 2012
4.1. General information 4.2. General preparation criteria and Consolidation Principles 4.3. Consolidation scope 4.4. Explanatory notes to the consolidated financial statements
5. Declaration of the abbreviated consolidated half-yearly financial statements pursuant to art. 154-bis,
subsections 3 and 4, of Legislative Decree 58/1998 6. Auditors' Report

Half-yearly financial report – H1 2012 ________________________________________________________________ 3
1. GENERAL INFORMATION
1.1. CORPORATE OFFICERS AND INFORMATION
Board of directors
Chairperson of the board of directors Stefano Landi
Director - Honorary Chairperson Giovannina Domenichini
Chief Executive Officer Claudio Carnevale
Executive Director Carlo Alberto Pedroni
Director Carlo Coluccio
Independent Director Alessandro Ovi (*)
Independent Director Tomaso Tommasi di Vignano
Board of Statutory Auditors
Chairman of the Board of Statutory Auditors Luca Gaiani
Standing Auditor Massimiliano Folloni
Standing Auditor Marina Torelli
Alternate Auditor Filippo Nicola Fontanesi
Alternate Auditor Filomena Napolitano
Control and Risks Committee
Chairman Carlo Coluccio
Member of the Committee Alessandro Ovi
Member of the Committee Tomaso Tommasi di Vignano
Committee for Remuneration
Chairman Carlo Coluccio
Member of the Committee Alessandro Ovi
Member of the Committee Tomaso Tommasi di Vignano
Committee for Transactions with Related Parties
Member of the Committee Alessandro Ovi
Member of the Committee Tomaso Tommasi di Vignano
Surveillance Body pursuant to Legislative Decree 231/01
Chairman Daniele Ripamonti
Member of the Body Domenico Aiello
Member of the Body Enrico Gardani
Independent Auditors
KPMG S.p.A.
(*) The Director also holds the office of Lead Independent Director

Half-yearly financial report – H1 2012 ________________________________________________________________ 4
Registered office and parent details
Landi Renzo S.p.A.
Via Nobel 2/4
42025 Corte Tegge – Cavriago (RE) – Italy
Tel. +39 0522 9433
Fax +39 0522 944044
Share capital: € 11,250,000 Tax No. and VAT No. IT00523300358 This report is available on the website
www.landi.it
Half-yearly financial report – H1 2012 ________________________________________________________________ 5
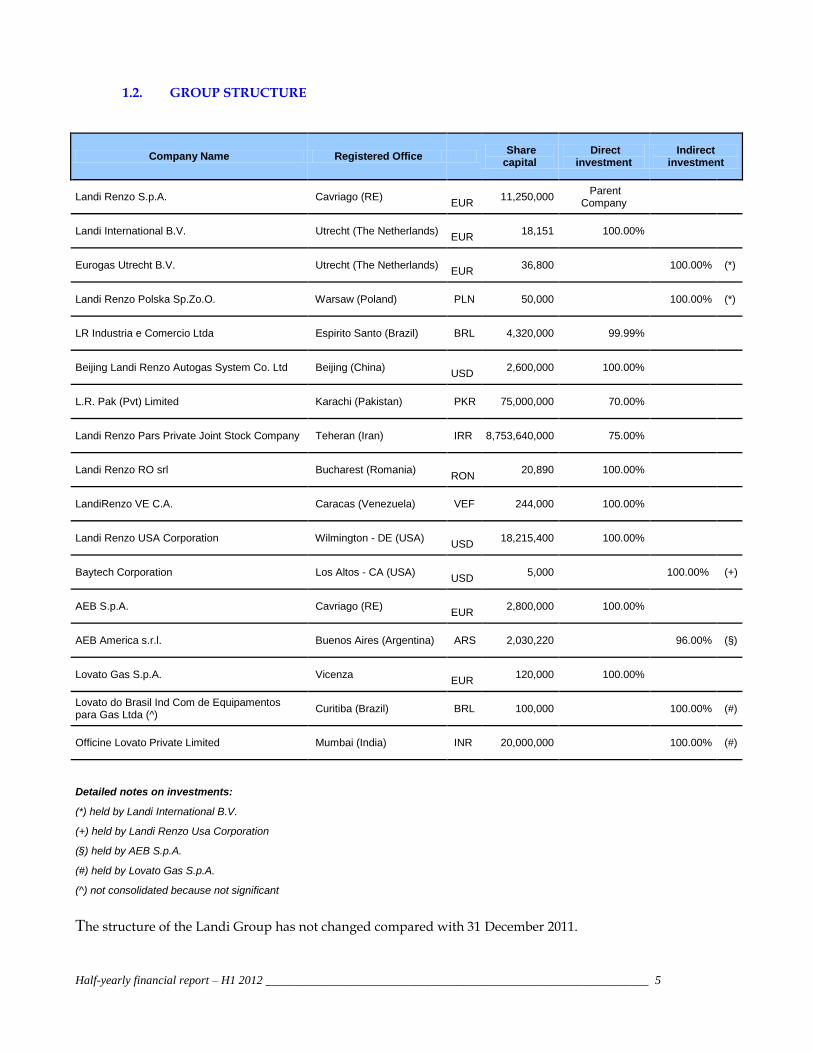
1.2. GROUP STRUCTURE
Company Name Registered Office Share capital
Direct investment
Indirect investment
Landi Renzo S.p.A. Cavriago (RE) EUR
11,250,000 Parent
Company
Landi International B.V. Utrecht (The Netherlands) EUR
18,151 100.00%
Eurogas Utrecht B.V. Utrecht (The Netherlands) EUR
36,800 100.00% (*)
Landi Renzo Polska Sp.Zo.O. Warsaw (Poland) PLN 50,000 100.00% (*)
LR Industria e Comercio Ltda Espirito Santo (Brazil) BRL 4,320,000 99.99%
Beijing Landi Renzo Autogas System Co. Ltd Beijing (China) USD
2,600,000 100.00%
L.R. Pak (Pvt) Limited Karachi (Pakistan) PKR 75,000,000 70.00%
Landi Renzo Pars Private Joint Stock Company Teheran (Iran) IRR 8,753,640,000 75.00%
Landi Renzo RO srl Bucharest (Romania) RON
20,890 100.00%
LandiRenzo VE C.A. Caracas (Venezuela) VEF 244,000 100.00%
Landi Renzo USA Corporation Wilmington - DE (USA) USD
18,215,400 100.00%
Baytech Corporation Los Altos - CA (USA) USD
5,000 100.00% (+)
AEB S.p.A. Cavriago (RE) EUR
2,800,000 100.00%
AEB America s.r.l. Buenos Aires (Argentina) ARS 2,030,220 96.00% (§)
Lovato Gas S.p.A. Vicenza EUR
120,000 100.00%
Lovato do Brasil Ind Com de Equipamentos para Gas Ltda (^)
Curitiba (Brazil) BRL 100,000 100.00% (#)
Officine Lovato Private Limited Mumbai (India) INR 20,000,000 100.00% (#)
Detailed notes on investments:
(*) held by Landi International B.V.
(+) held by Landi Renzo Usa Corporation
(§) held by AEB S.p.A.
(#) held by Lovato Gas S.p.A.
(^) not consolidated because not significant
The structure of the Landi Group has not changed compared with 31 December 2011.

Half-yearly financial report – H1 2012 ________________________________________________________________ 6
1.3. LANDI GROUP FINANCIAL HIGHLIGHTS
1.3. LANDI GROUP FINANCIAL HIGHLIGHTS

Half-yearly financial report – H1 2012 ________________________________________________________________ 7

Half-yearly financial report – H1 2012 ________________________________________________________________ 8
(Amounts in thousands of Euros) 6 MONTHS QUARTER
2011 2012 2011 Var. Diff. % Q2 2012 Q2 2011 Var. Diff. %
INCOME STATEMENT
253,529 Net Revenues 139,155 127,743 11,412 8.9% 79,557 80,575 -1,018 -1.3%
19,477 Gross Operating Profit 15,885 10,885 5,000 45.9% 10,267 11,996 -1,729 -14.4%
-3,260 Operating Profit 6,736 1,797 4,939 274.8% 5,661 6,789 -1,128 -16.6%
-8,213 Result Before Tax 4,902 -1,748 6,650 n.a. 5,594 4,634 960 20.7%
-9,138 Net Result for the Group 2,606 -2,397 5,003 n.a. 3,398 2,926 472 16.1%
7.7% Gross Operating Profit/Net Revenues 11.4% 8.5% 12.9% 14.9%
-1.3% Operating Profit/Net Revenues 4.8% 1.4% 7.1% 8.4%
-3.6% Net Group Result/Net Revenues 1.9% -1.9% 4.3% 3.6%
CONSOLIDATED BALANCE SHEET
INVESTED CAPITAL
143,974 Net tangible and other non-current assets 140,215 147,865
103,188 Working Capital (1) 90,487 95,190
-20,046 Non-current liabilities (2) -19,290 -20,410
227,116 NET CAPITAL EMPLOYED 211,412 222,645
SOURCES
90,112 Net financial position (opening cash) 71,565 80,394
137,004 Equity 139,848 142,251
227,116 BORROWINGS 211,412 222,645
MAIN INDICATORS
40.7% Working Capital/Turnover (rolling) 34.2% 36.9%
65.8% Net Financial Debt / Equity 51.2% 56.5%
11,992 Gross tangible and intangible investments 6,428 6,320
866 Personnel (peak) 860 884
(1) This is calculated as the difference between Trade Receivables, Inventories, Other Current Assets and Trade Payables, Tax liabilities, Other Current Liabilities;
(2) These are calculated by totaling Deferred Tax Liabilities, Defined Benefit Plans and Provisions for Risks and Charges;
Half-yearly financial report – H1 2012 ________________________________________________________________ 9
1.4. SIGNIFICANT EVENTS DURING THE SIX MONTHS
April On 24 April 2012 the Shareholders' Meeting resolved, amongst other things, the following:
Covering of the loss for the year posted by Landi Renzo S.p.A. equal to € 8,529,753.47 through
use of the Extraordinary Reserve.
renewal of authorization for the purchase and disposal of treasury shares;
April In April 2012 the subsidiary Landi Renzo USA obtained EPA approval for the conversion of
Ford F-series Medium Duty Vehicles including F-250/F-350 2WD /4WD pickup variants, which
use CNG systems.
May In May 2012 Landi Renzo S.p.A. proposed, with completion in the following July, rental - with
conditional purchase - of the former SAFE business unit from Agave S.r.l. in arrangement with
creditors.
The aim of this transaction, strategic for the expansion of the industrial offer and know-how, is to
relaunch the SAFE brand, known for more than 35 years in the gas treatment compressor
manufacturing sector and active in the main business areas related to compressed natural gas
(systems for the supply of CNG for vehicles)), in Oil and Gas (compressors and auxiliary systems
for processing gas from extraction to distribution), and in systems for the processing of
biomethane, hydrogen, and liquefied natural gas.
The purchase of the business unit is subject to the approval of the agreement with creditors.
Half-yearly financial report – H1 2012 ________________________________________________________________ 10
2. INTERIM REPORT ON OPERATING PERFORMANCE
This consolidated half-yearly financial report at 30 June 2012 was prepared pursuant to Legislative Decree 58/1998 and subsequent modifications, as well as by the Issuer Regulations issued by CONSOB.
This Report has been prepared in accordance with International Financial Reporting Standards (“IFRS”) issued by the International Accounting Standards Board (“IASB”) and endorsed by the European Union, and has been prepared in accordance with IAS 34 - Interim Financial Reporting, applying the same accounting policies as adopted in preparing the consolidated financial statements at 31 December 2011. In partial exception to the provisions of IAS 34, this report provides detailed rather than synthetic schemes in order to provide a clearer view of the economic-patrimonial and financial dynamics that occurred over the six-month period. The explanatory notes are also presented in compliance with the information required by IAS 34 with the supplements considered useful for a clearer understanding of the half-yearly financial statements.
The consolidated financial statements of the Landi Group at 30 June 2012 close with a net profit for the Group of
€ 2,606 thousand, compared with a loss for the Group of € -2,397 in the first half of 2011.
Revenues (goods and services) amounted to € 139,155 thousand, up by 8.9% compared with the same period in
2011.
The gross operating profit (EBITDA) is equal to € 15,885 thousand, compared with € 10,885 in June 2011, an
increase of 45.9%.
The operating profit (EBIT) is equal to € 6,736 thousand, compared with € 1,797 in 2011, an increase of 274.8%.
The net financial position at 30 June 2012 is negative for € 71,565 thousand, while at 30 June 2011 it was negative
for € 80,394 thousand.
In the second quarter of this year the Landi Group achieved revenues of € 79,557 thousand, an increase of €
19,959 thousand compared with the first quarter of 2012 (+33.5%).
The Group's net profit for the second quarter was € 3,398 thousand, an increase of 16.1% compared with the
second quarter of 2011.
2.1. MACROECONOMIC CONTEXT AND REFERENCE MARKET
In the early months of 2012, world economic activity, although hampered by stagnation in Europe and the
slowdown in the U.S. and emerging economies, showed some acceleration expanding at a moderate pace, while
international trade showed general signs of recovery.
From April 2012 the economic environment weakened again, conditioned by uncertainty on the evolution of the
sovereign debt crisis in the Euro zone and fiscal policy in the United States, although there was an attenuation of
inflationary pressures due to the decline in the prices of raw materials. According to the latest projections by the

Half-yearly financial report – H1 2012 ________________________________________________________________ 11
International Monetary Fund (IMF), released in July 2012, global growth this year is expected to fall to 3.5%
(from 3.9% in 2011), held back by the fall in business in the Euro zone and a slowdown in emerging markets.
The signs of a slowdown arriving from the Eurozone are compounded by the volatility in financial markets,
characterized by a considerable increase in aversion to riskier assets.
At a global level, however, the trend in the car market is positive. Registrations of new cars actually increased
worldwide by 6.6% in the first half of 2012, mainly due to the growth seen in the United States, as well as in
China, India and Russia and to the recovery of the Japanese market.
The positive trend in this auto market, however, does not seem to reach the Euro zone countries where, during
the first six months of the year, there was a decline in registrations of 6.8% (according to data released by ACEA
– Association des Constructeurs Européens d’Automobiles) compared with the same period last year, although with
differing trends among the major countries. The exact figure just for the month of June showed a decrease
limited to 2.8%.
Amidst this economic uncertainty, registrations of new cars in Italy during the first half of 2012 showed a
decrease of 19.7% compared with the same period last year, despite a significant increase in registrations of cars
powered by LPG, up from 2.82% of total registrations in 2011 to 7.52% in 2012, as well as the registration of
CNG-powered cars, which increased from 1.94% in 2011 to 3.56% in 2012.
The Landi Group, in the macroeconomic context described above, was able to follow the growth trend of its own
business sector, although in a declining Italian and European auto market, while at the same time grabbing some
of the opportunities offered by the worldwide automotive market.
The commercial strategy of the Landi Group focused on the one hand on strengthening relations with major
OEM players in the European market and on the other, in driving sales in the After Market channel, especially in
emerging markets, such as Asia and Latin America where, increasingly, policies are implemented for
diversification of energy sources favoring the use of natural gas for vehicles.
2.2. COMPANY DEVELOPMENT
A leader in sustainable mobility since 1954, Landi Renzo holds about a 30% share of the world market for gas
fuel supply systems for motor vehicles, a sector that currently operates in a fleet of more than 30 million LPG or
CNG vehicles, a number that confirms the absolute primacy of technologies of this sector to promote ecological
mobility.
In recent years, technological innovation and continuous research have made Landi Renzo a prestigious brand
worldwide, increasingly aimed at the development of new expertise and functional choices in the context of a
strategy of growth and internationalization.
The continuous technological and quality development of its products, characterized by the combination of
seeking excellence in production, a flexible approach to the customer, and the international vocation (as

Half-yearly financial report – H1 2012 ________________________________________________________________ 12
demonstrated by the direct presence in key markets and indirect presence in more than 50 countries), are the
cornerstones underlying the company's success.
A key element of this strategy has been the ability to identify, with precise timing, each region capable of
expressing sales potential of innovative technologies for gas fuel supply systems.
With regard to the business sectors, alongside the historic After Market channel (retailers and importers), the
Group has also expressed its leadership through its collaboration with leading car manufacturers (Original
Equipment Manufacturing or “OEM” customers) worldwide, providing systems and installation services while
constantly monitoring quality at the critical stages of the production process.
During the first half of 2012, the Group finalized the development of dual fuel technology (diesel and CNG mix)
and continued with the HERS project (hybrid electric vehicles already on the road), showing its constant cutting
edge proposals for the use of energy sources with a lower environmental impact.
With regard to expansion of the product range, aimed at completing its offer and capacity for partnerships with
industrial and institutional partners, in July 2012 the Group expanded its business perimeter by renting a
business unit with subsequent conditional purchase, of the company Agave S.r.l. (formerly SAFE) operating in
the production of compressors for treatment of gases for multiple applications.
In the first half of 2012, the Group further strengthened its internationalization strategy, consolidating its
presence in the markets of the BRIC and neighboring countries, which are characterized by an increasing use of
CNG vehicles in the presence of substantial reserves of natural gas and government incentive policies.
2.3. INNOVATION, INDUSTRIAL RESEARCH AND DEVELOPMENT
During the first half of 2012, research continued on innovative technologies and development of fuel supply
systems that can contribute to reducing emissions of pollutants and greenhouse gases (CO2).
In particular, the Group introduced its new range of After Market CNG and LPG conversion kits to the market,
consisting of a series of new components developed during the previous year such as injectors, gearboxes,
electronic and multi-valve power units. The success of the sale of these kits supported further development
activities aimed at expanding the range of new products for the conversion of all types of vehicles. In this
context, the first conversion kits for direct injection petrol engines were recently presented: this type of engine,
increasingly widespread on the market, is characterized by the fact that the fuel is injected directly into the
combustion chamber with consequent optimization in terms of consumption and performance.
The guidelines used for the development of applications intended for direct injection engines are the same as
those used for adapting gas fuel supply systems to all the technological innovations that car manufacturers
introduce regarding the operation and control of the engine, including those of the latest generation.
With regard to collaboration with auto manufacturers, the first half of the year was characterized by the
development of systems to be applied to new car models for CNG and LPG supply, in order to complete the
entire range aimed at customers.

Half-yearly financial report – H1 2012 ________________________________________________________________ 13
Studies on the dual fuel diesel-CNG combustion process were continued, after the first approvals obtained in
2011, toward increasingly complex types of engines and applications, with particular reference to the buses used
in public transport as well as small goods vehicles. Thanks to this innovative dual fuel system it is now possible
to apply a dual diesel/CNG fuel supply, capable of reducing polluting emissions and running costs. The system
developed by the Landi Group allows CNG to be mixed with diesel, guaranteeing driving performances similar
to those obtained by full diesel engines. In this way, the system increases the fuel distance of vehicles, with
significant savings on consumption, and allows dual fuel supply to be reversed to diesel only at any time.
Research activities on new technologies are being continued both at the Cavriago headquarters and in the
branches, and were demonstrated during an event held at the new Research and Development Center in June
2012, at the same time as the NGV 2012 fair in Bologna.
On this occasion, a group of customers selected from around the world were able to test some of the
technologies recently implemented or under development on vehicles at their disposal, including systems for
direct injection vehicles, dual-fuel engines for ecological fleets, and applications for hybrid-electrical vehicles.
2.4. HUMAN RESOURCES, TRAINING AND SAFETY AT WORK
Human resources
The total number of employees of the Landi Group at 30 June 2012 was 860 units compared with 866 at 31
December 2011, an overall decrease of 6 units during the six-month period.
The following table lists the number of employees in the workforce.
Company 30/06/2012 31/12/2011 30/06/2011
Landi Renzo S.p.A. 359 363 369
A.E.B. S.p.A. 189 172 181
Lovato Gas S.p.A. 107 108 105
Foreign companies 205 223 229
Total 860 866 884
The number of employees compared with the first half of 2011 shows a decrease of 24 units, mainly because of
the reduction in the number of employees at foreign subsidiaries in Iran and Pakistan.
Training
Landi Renzo believes that the training of human resources represents a fundamental investment for the
development of company activities and, for this purpose, promotes the sharing of business know-how between
employees through training initiatives put forward by “LANDIRENZO Corporate University”.

Half-yearly financial report – H1 2012 ________________________________________________________________ 14
The 2012 training plan is aimed at strengthening technical and managerial skills, as well as updating and
qualification of human resources. During the first half of 2012, more than 750 hours of training were carried out
with a strong focus on the issue of safety in the context of the new State-Region Agreement.
As regards the activity for discovering and promoting new talents, the companies of the Landi Group continued
to host students coming from university and post-university specialization paths, involved internships and
company field projects in Research and Development, Commercial and Business Development areas.
In the area of installer training, the R&D function and the Corporate University worked in close contact with
important results: 250 hours of training with more than 450 installers trained throughout the national territory.
Another important goal was attained by the Corporate University thanks to the issue of the first two books in
the series of publications created in collaboration with the Group Il Sole24Ore: “Landi Renzo and Sustainable
Mobility” and “Eco & Green Car, A guide to the ecological and sustainable car”.
Health, Safety and Environment
The Landi Group, which has always been active regarding safety in the workplace, is subject to the regulatory
principles pursuant to Legislative Decree no. 81 of 9 April 2008 regarding safety in the workplace.
On the strength of its OHSAS 18001:2007 certification, the Group continued with its activity of spreading
knowledge on safety and risk prevention in the workplace, also through innovative internal communication
systems for improved communication of the main standards and conduct regarding safety in the workplace.
Aware that environmental protection is one of the factors on which our future depends, the Group, in line with
its corporate mission, considered its commitment in this area within its own structures to be important,
spreading information on ecological topics in order to educate towards sustainable behavior while monitoring
the environmental impacts associated with its activities. Against this background, projects were started up for
the implementation of the Environmental Management System and ISO 14001 Certification, and to update the
Organization and Control Model pursuant to Legislative Decree 231/2001.
2.5. OPERATING PERFORMANCE
Consolidated results
In the first half of 2012, the Landi Group achieved revenues of € 139,155 thousand, an increase of 8.9% over the
previous year.
Gross operating profit amounted to € 15,885 thousand (+45.9%), while there a net profit for the Group equal to €
2,606 thousand was recorded, compared with a net loss of € -2,397 thousand in the first half of 2011.
The figures for the six-month period show a strong improvement in the results achieved for the second quarter
of 2012 in terms of both turnover and profit compared with the first quarter.

Half-yearly financial report – H1 2012 ________________________________________________________________ 15
The following table shows the evolution of the main economic performance indicators divided by six-month
period.
(thousands of Euros) H1 2012 % H2 2011 % H1 2011 %
Revenues (goods and services) 139,155 125,786 127,743
Other Revenue and Income 959 968 678
Operating costs -124,229 -89.3% -118,162 -
93.9% -117,536 -92.0%
Gross Operating Profit 15,885 11.4% 8,592 6.8% 10,885 8.5%
Amortization, depreciation and impairment losses -9,149 -6.6% -13,649 * -
10.9% -9,088 -7.1%
Operating Profit 6,736 4.8% -5,057 -4.0% 1,797 1.4%
Financial income 352 0.3% 211 0.2% 271 0.2%
Financial expenses -2,177 -1.6% -2,010 -1.6% -1,600 -1.3%
Exchange rate gains and losses -9 0.0% 391 0.3% -2,216 -1.7%
Profit (Loss) before tax 4,902 3.5% -6,465 -5.1% -1,748 -1.4%
Taxes -2,177 -1.6% -19 0.0% -907 -0.7%
Net profit (loss) for the Group and minority interests, including: 2,725 2.0% -6,484 -5.2% -2,655 -2.1%
Minority interests 119 0.1% 257 0.2% -258 -0.2%
Net Profit (Loss) of the Group 2,606 1.9% -6,741 -5.4% -2,397 -1.9%
* of which € 4,316 thousand relates to writedowns of tangible and intangible assets.
The increase in revenues recorded in the first half of 2012 compared with the same period in 2011 is primarily
due - while taking account of the negative trend of the South-West Asian market reasons that will be discussed
later - to the significant progress recorded in the Italian market (+96.7%) and in the European market (+35.8%)
and to the positive growth of the markets in the rest of the world (+11.8%).
In further detail, two macro elements can be highlighted that generated this positive performance compared to
last year:
the increase in registrations of LPG and CNG vehicles in Italy and Europe on EuroV engines;
the significant recovery in motor vehicle conversions in the After Market, favored mainly by the increase in
the price of traditional fuels, especially in Italy, and also as a result of the positive trend in demand in far east
countries and in some Latin American countries where the Group is increasing its penetration.
Breakdown of sales by business segment

Half-yearly financial report – H1 2012 ________________________________________________________________ 16
Q2 2012 v. Q2 2011
(Thousands of Euros) Q2 2012 % of
revenue Q2 2011
% of revenue
Change %
Gas sector - LPG line 55,761 70.1% 35,254 43.8% 20,507 58.2%
Gas sector - CNG line 19,876 25.0% 41,751 51.8% -21,875 -52.4%
Total revenues - GAS sector 75,637 95.1% 77,005 95.6% -1,368 -1.8% Other (Alarm systems, Sound, Aquatronics and Robotics) 3,920 4.9% 3,570 4.4% 350 9.8%
Total revenues 79,557 100.0% 80,575 100.0% -1,018 -1.3%
H1 2012 v. H1 2011
(Thousands of Euros) At 30/06/12 % of
revenue At 30/06/11
% of revenue
Change %
Gas sector - LPG line 92,453 66.4% 59,667 46.7% 32,786 54.9%
Gas sector - CNG line 39,620 28.5% 61,431 48.1% -21,812 -35.5%
Total revenues - GAS sector 132,073 94.9% 121,098 94.8% 10,974 9.1% Other (Alarm systems, Sound, Aquatronics and Robotics) 7,082 5.1% 6,645 5.2% 438 6.6%
Total revenues 139,155 100.0% 127,743 100.0% 11,412 8.9%
Revenues from sales of products and services in the GAS segment increased over the six months in question
from € 121,098 thousand in the first half of 2011 to € 132,073 thousand in the first half of 2012, recording an
increase of 9.1%. The increase (+ 54.9%) in six-monthly sales in the gas sector – LPG line was generated mainly
by the European markets, and in particular by the Italian market where there was a strong increase in demand
in both the OEM and After Market sectors, also favored by the increase in the price of traditional fuels (Petrol and
Diesel) recorded in the first part of 2012, as well as by the increasing interest regarding environmental and
energy issues. Sales in the gas segment - CNG line, on the other hand, dropped by 35.5% compared with the
first half of 2011, mainly due to the contraction of the market recorded in South-West Asia. This downturn can
be ascribed on the one hand to the significant slowdown in the Iranian market, which is suffering under trade
and financial restrictions as a result of the increasingly stringent embargo, and on the other to the contraction of
the Pakistani market as a result of unfavorable regulations.
Revenues from the sales of products in the Alarms, Sound and Other sector increased by 6.6% from € 6,645
thousand to € 7,082 thousand.
Revenues from sales of products and services in the GAS segment for the quarter in question decreased, overall,
from € 77,005 thousand in the second quarter of 2011 to € 75,637 thousand in the second quarter of 2012,
recording a decrease of 1.8%.

Half-yearly financial report – H1 2012 ________________________________________________________________ 17
Within the Gas segment, revenues from the sale of LPG systems increased 58.2% from € 35,254 thousand to €
55,761 thousand. On the other hand, revenues from the sale of CNG systems dropped 52.4% from € 41,751
thousand to € 19,876 thousand.
Based on these figures, and given the little materiality of Alarm Systems, Sound and Other sales, the Landi
Group's sole business segment can be considered to be the “Gas Segment” for the production of LPG and CNG
fuel supply systems. Considering that the principal source of risks and benefits is connected with the activity
carried out and that the structure of the internal reporting uses a single activity segment, it is not considered
necessary to provide further specifications regarding the Gas Sector since it coincides substantially with that of
the entire company.
Geographical distribution of sales
Q2 2012 v. Q2 2011
(Thousands of Euros) Q2 2012 % of
revenue Q2 2011
% of revenue
Change %
Italy 24,589 30.9% 14,000 17.4% 10,589 75.6%
Europe (excluding Italy) 27,481 34.5% 20,727 25.7% 6,754 32.6%
South-west Asia 5,589 7.0% 19,295 23.9% -13,706 -71.0%
America 8,903 11.2% 14,912 18.5% -6,009 -40.3%
Rest of the World 12,995 16.3% 11,641 14.4% 1,354 11.6%
Total 79,557 100% 80,575 100% -1,018 -1.3%
H1 2012 v. H1 2011
(Thousands of Euros) At 30/06/12 % of
revenue At 30/06/11
% of revenue
Change %
Italy 42,954 30.9% 21,832 17.1% 21,122 96.7%
Europe (excluding Italy) 44,904 32.3% 33,068 25.9% 11,836 35.8%
South-west Asia 12,393 8.9% 35,171 27.5% -22,778 -64.8%
America 17,174 12.3% 18,233 14.3% -1,059 -5.8%
Rest of the World 21,730 15.6% 19,439 15.2% 2,291 11.8%
Total 139,155 100% 127,743 100% 11,412 8.9%

Half-yearly financial report – H1 2012 ________________________________________________________________ 18
Analyzing the geographical distribution of revenues, during the first half of 2012 the Landi Group realized
69.1% (82.9% at 30 June 2011) of its consolidated revenues abroad (32.3% in Europe and 36.8% outside Europe).
The Italian market, in the six-month period, grew by 96.7% compared with the same period of the previous year
and revenues stood at € 42,954 thousand. This increase was generated by the increase in the demand for cleaner
and cheaper fuels (LPG and CNG) and by the full availability, from the start of the year, of the product range for
the OEM channel, completely renewed with systems that comply with the requirements of the Euro V standard
currently in force. Indeed, even in the context of an automobile market in steep decline (814,132 registrations in
the first half of 2012, in other words -19.7% compared with first half of 2011 - data source UNRAE) the sales mix
of new cars equipped with LPG and CNG systems increased in significantly (from 4.76% in the first half of 2011
to 11.08% in the first half of 2012), generating a positive effect on the volumes and revenues recorded in the first
part of the year.
The After Market conversions market in Italy has also developed significantly: the data processed by the Ecogas
consortium show the number of conversions in the first half of 2012 as 101,884, a strong increase (+45%)
compared with the same period of the previous year when they amounted to 70,143. The Landi Group's share of
the national market on the After Market channel in the first half of 2012 was close to 28.5%.
The trend in revenues in Europe increased by 35.8% compared with first half of 2011: Group sales benefited both
from the growth of the main markets in this geographical area, and from the positive effect generated by the
market launch of a completely renovated product range for the After Market channel. We point out that there
were significant increases in sales in Eastern European countries, with excellent performances in Poland and
Romania, as well as in Western Europe - in particular France.
The South West Asian market, as already shown in the first quarter of 2012, recorded a downturn in sales of
64.8% compared with the same period in 2011, primarily due to a serious slowdown in the Iranian and Pakistani
markets
A decrease of 5.8% was recorded in the American markets compared with the same period last year, while the
markets in the Rest of the World recorded an increase of 11.8% as a result of the positive trend in demand in
Thailand and the good performance of the Indian market, where the Group recently signed a preliminary
agreement to set up a Joint Venture with a local partner operating in the automotive sector.
Profit
Over the six-month period the Gross Operating Profit (GOP) of the Landi Group was positive for € 15,885
thousand (11.4% of turnover), an increase of 45.9% compared with value recorded for the same in 2011 (8.5% of
turnover). This increase can be ascribed to the elements summarized below:
increase in sales volumes and turnover;
productive optimizations to reduce the incidence of costs of materials achieved through rationalization of

Half-yearly financial report – H1 2012 ________________________________________________________________ 19
supplies and better industrialization of the products;
activities for the reduction and rationalization of structural costs already in operation during the previous
year.
Operating Profit was equal to € 6,736 thousand, compared with € 1,797 thousand in the first half of 2011, after
taking account of the depreciation and amortization of tangible and intangible fixed assets for € 9,149 thousand,
compared with depreciation and amortization of € 9,088 thousand recorded in the same period of 2011.
The result before tax was positive and equal to € 4,902 thousand compared with a pre-tax loss of € -1,748
thousand recorded in the first half of the previous year.
The Net Result of the Group for the first half of 2012 showed a profit of € 2,606 thousand, compared with a
negative net result for the first half of 2011 equal to € -2,397.
The following table is included to provide a clearer representation and to understand the positive trend of the
key performance indicators of the Group, analyzed by quarters with the same consolidation scope.
CONSOLIDATED INCOME STATEMENT
Q2 2012 % Q1 2012 % Q4 2011 % Q3 2011 % (thousands of Euros)
Revenues (goods and services) 79,557 59,598 63,390 62,396
Gross Operating Profit 10,267 12.9% 5,618 9.4% 3,473 5.5% 5,119 8.2%
Operating Profit 5,661 7.1% 1,075 1.8% -1,265 -2.0% -3,792 -6.1%
Profit Before Tax 5,594 7.0% -692 -1.2% -2,230 -3.5% -4,235 -6.8% Net profit (loss) for the Group and minority interests 3,547 4.5% -822 -1.4% -1,271 -2.0% -5,213 -8.4%
Note that the results obtained in the second quarter of 2012 as well as showing a significant increase in turnover
of € 19,959 thousand compared with the first quarter of 2012, also record an improvement in gross operating
profit, 12.9% of turnover, a significant increase compared with trend in recent quarters.
More particularly, the economic results of the second quarter show:
- consolidated EBITDA up by 82.7% compared with the previous quarter and which has almost trebled
compared to the last quarter of 2011;
- a net result of € 3,547 thousand that follows the same positive trend - the first result in profit after three
quarters closed with a net loss.
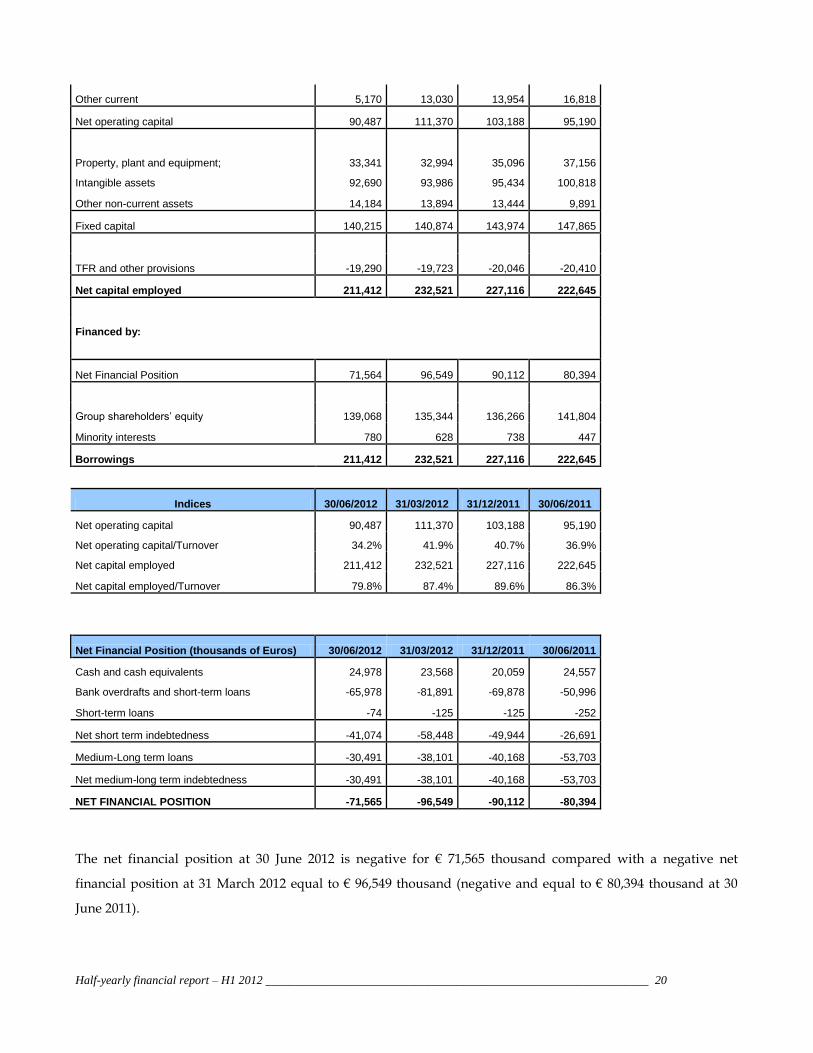
Net financial position
Financial Position (thousands of Euros) 30/06/2012 31/03/2012 31/12/2011 30/06/2011
Trade receivables 92,708 82,855 77,790 80,298
Inventories 79,028 72,052 67,408 74,079
Trade Payables -86,419 -56,567 -55,964 -76,005
Half-yearly financial report – H1 2012 ________________________________________________________________ 20
Other current 5,170 13,030 13,954 16,818
Net operating capital 90,487 111,370 103,188 95,190
Property, plant and equipment; 33,341 32,994 35,096 37,156
Intangible assets 92,690 93,986 95,434 100,818
Other non-current assets 14,184 13,894 13,444 9,891
Fixed capital 140,215 140,874 143,974 147,865
TFR and other provisions -19,290 -19,723 -20,046 -20,410
Net capital employed 211,412 232,521 227,116 222,645
Financed by:
Net Financial Position 71,564 96,549 90,112 80,394
Group shareholders’ equity 139,068 135,344 136,266 141,804
Minority interests 780 628 738 447
Borrowings 211,412 232,521 227,116 222,645
Indices 30/06/2012 31/03/2012 31/12/2011 30/06/2011
Net operating capital 90,487 111,370 103,188 95,190
Net operating capital/Turnover 34.2% 41.9% 40.7% 36.9%
Net capital employed 211,412 232,521 227,116 222,645
Net capital employed/Turnover 79.8% 87.4% 89.6% 86.3%
Net Financial Position (thousands of Euros) 30/06/2012 31/03/2012 31/12/2011 30/06/2011
Cash and cash equivalents 24,978 23,568 20,059 24,557
Bank overdrafts and short-term loans -65,978 -81,891 -69,878 -50,996
Short-term loans -74 -125 -125 -252
Net short term indebtedness -41,074 -58,448 -49,944 -26,691
Medium-Long term loans -30,491 -38,101 -40,168 -53,703
Net medium-long term indebtedness -30,491 -38,101 -40,168 -53,703
NET FINANCIAL POSITION -71,565 -96,549 -90,112 -80,394
The net financial position at 30 June 2012 is negative for € 71,565 thousand compared with a negative net
financial position at 31 March 2012 equal to € 96,549 thousand (negative and equal to € 80,394 thousand at 30
June 2011).
Half-yearly financial report – H1 2012 ________________________________________________________________ 21
The significant reduction in debt, which dropped in the quarter by € 24,984 thousand, is a result of greater
profits produced and the change in net working capital, with particular regard to the increase in trade payables.
Net operating capital (€ 90,487 thousand) decreased compared with 31 March 2012, by € 20,883 thousand, while
the percentage indicator, calculated on rolling turnover decreased from 41.9% to 34.2%.
An analysis of the individual items in comparison to the previous quarter shows:
- an increase in trade receivables equal to € 9,853 thousand as a result of increased revenue;
- a greater level of stocks amounting to € 6,976 thousand;
- a significant increase in trade payables of € 29,852 thousand primarily due to the increase in business volumes
as well as to the more favorable contractual conditions agreed with the suppliers;
- a reduction in other current assets of € 7,860 thousand, mostly due to assignment without recourse of the 2011
VAT credit of the parent company.
Net capital employed (€ 211,412 thousand), the fixed portion of which remains substantially unchanged,
decreased compared with 31 March 2012 by € 21,109 thousand, while the percentage indicator, calculated on
rolling turnover decreased from 87.4% to 79.8% .
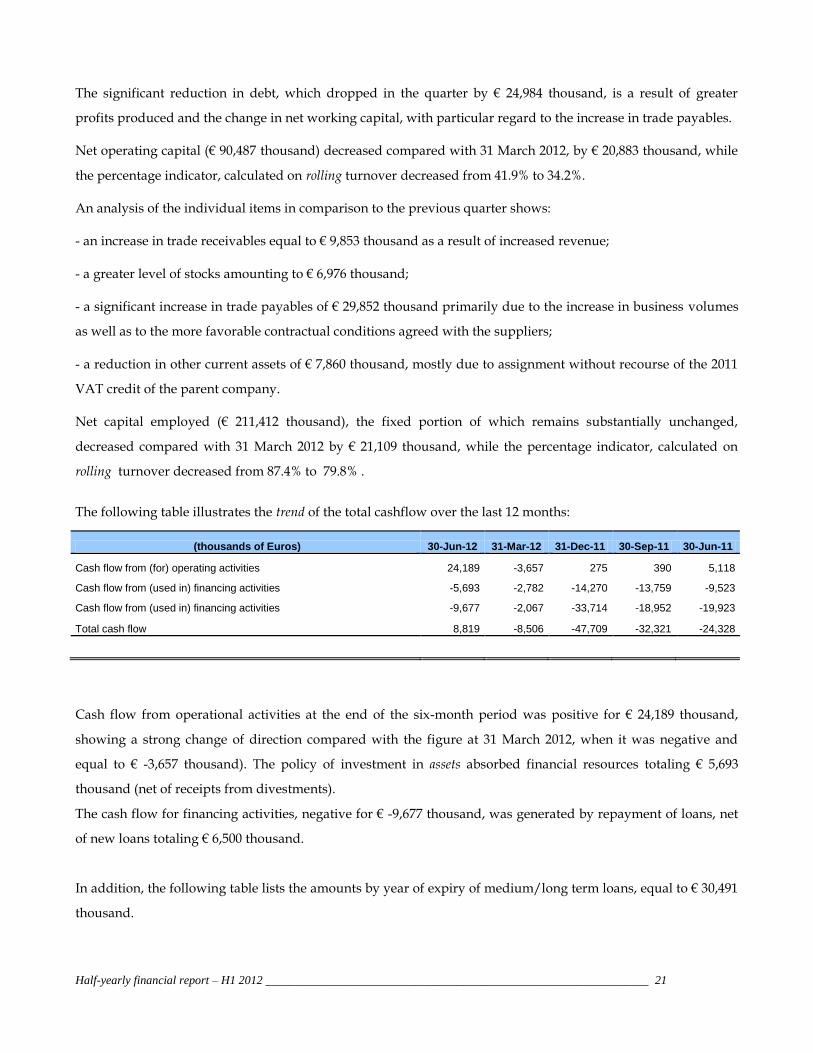
The following table illustrates the trend of the total cashflow over the last 12 months:
(thousands of Euros) 30-Jun-12 31-Mar-12 31-Dec-11 30-Sep-11 30-Jun-11
Cash flow from (for) operating activities 24,189 -3,657 275 390 5,118
Cash flow from (used in) financing activities -5,693 -2,782 -14,270 -13,759 -9,523
Cash flow from (used in) financing activities -9,677 -2,067 -33,714 -18,952 -19,923
Total cash flow 8,819 -8,506 -47,709 -32,321 -24,328
Cash flow from operational activities at the end of the six-month period was positive for € 24,189 thousand,
showing a strong change of direction compared with the figure at 31 March 2012, when it was negative and
equal to € -3,657 thousand). The policy of investment in assets absorbed financial resources totaling € 5,693
thousand (net of receipts from divestments).
The cash flow for financing activities, negative for € -9,677 thousand, was generated by repayment of loans, net
of new loans totaling € 6,500 thousand.
In addition, the following table lists the amounts by year of expiry of medium/long term loans, equal to € 30,491
thousand.

Half-yearly financial report – H1 2012 ________________________________________________________________ 22
Year falling due
(thousands of Euros) 2013 - H2 2014 2015
Medium-Long term loans 14,849 13,975 1,667
Investments
Investments in property, plant and equipment were equal to € 4,313 thousand (€ 4,153 thousand at 30 June 2011)
and relate both to the purchase of machinery and production equipment in order to deal with the new
production and business needs.
The increases in intangible assets were equal to € 1,416 thousand (€ 2,293 thousand at 30 June 2011) and relate
primarily to capitalized costs for the development of new products and the costs incurred for the
implementation of management software.
Statement of reconciliation between the data of the Parent Company's financial statements and the data of
the consolidated financial statements
Pursuant to CONSOB Communication no.6064293 of 28 July 2006, a reconciliation statement between the result
for the period and equity of the group with the corresponding values of the Parent Company is provided.
RECONCILIATION STATEMENT (in thousands of €) Equity at
30/06/2012
Result for the year at
30/06/2012 Equity at
31/12/2011
Result for the year at
31/12/2011
Equity and result for the year of the Parent Company 120,638 -108 120,745 -8,530 Difference in value between carrying value ad pro-quota value of the accounting equity of the consolidated companies 21,432 -627 18,225 501
Pro-quota results achieved by investees 0 5,634 0 2,977
Elimination of intercompany dividends 0 -1,999 0 -7,600
Elimination of the effects of intercompany commercial transactions -2,754 -294 -2,258 -164
Elimination of revaluation/write-down of investments 0 0 0 3681
Elimination of the effects of intercompany assets -248 0 -237 0
Accounting for financial leasing operations 0 0 -209 -2
Equity and result for the year from Consolidated Financial Statements 139,068 2,606 136,266 -9,138
Equity and result for the year of minority interests 780 119 738 -1
Equity and result for the year of the Group 139,848 2,725 137,004 -9,139

Half-yearly financial report – H1 2012 ________________________________________________________________ 23
Performance of the main companies of the Group
Landi Renzo S.p.A. (Parent Company)
In the first six months of 2012 Landi Renzo S.p.A. achieved revenues of € 72,740 thousand, compared with €
59,876 thousand in the first half of 2011, an increase of 21.5%. The increase in turnover can be ascribed primarily
to the increase in sales on the LPG line, primarily in Italy and Europe, achieving significant volumes on OEM
installations, and to consolidation in the After Market sector.
Gross Operating Profit was € 3,183 thousand, compared with a negative result of € 805 thousand at 30 June 2011.
The net financial position at 30 June 2012 is negative and equal to € -64,796 thousand, compared with a negative
net financial position at 31 December 2011 equal to € -87,281 thousand. At the close of the six-month period, the
Parent Company's workforce numbered 359 employees, an increase of 4 units compared with 31 December 2011.
Lovato Gas S.p.A.
The revenues of Lovato Gas dropped from € 33,825 thousand at 30 June 2011 to € 27,466 thousand at 30 June
2012, recording a decrease of 18.8% primarily due to the steep slowdown in the Iranian market, which is
suffering under trade and financial restrictions related to the increasingly stringent international embargo
provisions. The gross operating result of the first half of 2012 was positive and equal to € 3,183 thousand,
compared with a positive gross operating result equal to € 3,896 thousand reported in the first half of 2011. The
net financial position, negative, was € -13,899 thousand at 30 June 2012, compared with € -12,214 thousand at 31
December 2011.
A.E.B. S.p.A.
Revenues of A.E.B. S.p.A. at 30 June 2012 were € 41,957 thousand, including € 13,972 thousand from Group
companies, and were up by 26.4% compared with the same period of the previous year. The gross operating
result was positive and equal to € 7,390 thousand (17.6% of turnover).
The net financial position, positive, was equal to € 1,705 thousand at 30 June 2012 compared with € 4,157
thousand at 31 December 2011, after payment of dividends of € 2,000 thousand to the Parent Company.
The foreign subsidiaries of the Group, whose percentage weight in terms of revenue was 30% lower than
consolidated turnover, recorded an overall positive Gross Operating Profit, influenced to a large extent by the
good performance of the subsidiaries located in Romania and Poland.

Half-yearly financial report – H1 2012 ________________________________________________________________ 24
2.6. LANDI RENZO AND THE FINANCIAL MARKETS
The Landi Group maintains a constant dialog with its Shareholders through a responsible and transparent
activity of communication carried out by the Investor Relations office with the aim of providing a clear
explanation of the company's evolution. The Investor Relations function is also assigned the task of organizing
presentations, events and “Roadshows” that enable a direct relationship between the financial community and the
Group's Top management. For further information and to consult the economic-financial data, corporate
presentations, periodical publications, official communications and real time updates on the share price you can
visit the Investor Relations section of the site www.landi.it.
The following table summarizes the main share and stock market data for the six-month period.
Share Price and Stock Market Information (source Borsa Italiana S.p.A.)
Price at 2 January 2012 1.265
Price at 29 June 2012 1.35
Maximum price 2012 (02/01/12 - 29/06/12) 2.08
Minimum price 2012 (02/01/12 - 29/06/12) 1.228
Market Capitalization at 30 June 2012 151,875,000
Number of shares representing the share capital 112,500,000
The share capital is made up of 112,500,000 shares with a nominal value of € 0.10 per share, for a total of €
11,250,000.00.
2.7. POLICY FOR ANALYZING AND MANAGING RISKS CONNECTED WITH THE ACTIVITIES OF THE LANDI GROUP
This section provides information on exposure to risks connected with the activities of the Group as well as the
objectives, policies and processes for managing such risks and the methods used to asses and to mitigate them
mitigate them.
The Guidelines for the Internal Control System of the Landi Group defined by the Board of Directors identify the
Internal Control System as a cross-sectional process integrated with all the company activities, based on the
international principles of Enterprise risk management, and in particular on the framework CoSo Report indicated by
the Sarbanes-Oxley Act of 2002 as a reference best practice for the architecture of internal control systems. The
purpose of the Internal Control System is to help the Group to realize its performance and profit objectives, to
obtain reliable economic-financial information and to ensure compliance with the laws and regulations in force,
avoiding damage to the company's image and economic losses. In this process, particular importance is given to
the identification of corporate objectives and the classification and control of the business risks connected to

Half-yearly financial report – H1 2012 ________________________________________________________________ 25
them, through the implementation of specific actions aimed at containing such risks. There can be various types
of business risks: strategic, operational (related to the effectiveness and efficiency of business operations),
financial, reporting (related to the reliability of economic-financial information) and, lastly compliance (related to
the observance of the laws and regulations in force, to avoid the company suffering damage to its image or
and/or economic losses). In addition, all these risks can originate within or outside the Group. The exposure of
the Group to the above-mentioned risks has not changed significantly compared with 31 December 2011.
Those in charge of the various branches of company management identify and assess the risks within their
jurisdiction and identify actions to limit and reduce them (so-called “first line control”).
To the above-mentioned activities we can also add those of the Manager in charge of drafting corporate
documents and his staff (so-called “second level control”), the Supervisor for Internal Control (so-called “third
level control”), who continuously monitors the efficiency and effectiveness of the internal control system
through risk assessment activities, the cyclical performance of audit operations and the subsequent management
of follow up.
The results of the risk identification procedures are reported and discussed at the Top Management level of the
Group in order to create the prerequisites for their cover, insurance and for the assessment of the residual risk.
The following paragraphs describe the risks considered to be significant and connected with the activities of the
Group (the order in which they are listed does not imply any indication, either in terms of probability of their
occurrence or in terms of possible impact).
STRATEGIC RISKS
Risks connected with the international expansion strategy
The Group sells its products in more than 50 countries, in 11 of which it operates directly through its own
companies. During these six months, the Group achieved 69.1% of consolidated revenues abroad.
In pursuing its expansion strategy, the Landi Group has invested, and may invest more in the future, also in
countries characterized by considerable instability of their political institutions and/or at the center of situations
of international tension. The above-mentioned strategy could expose the Landi Group to various risks of a
macroeconomic nature, arising, for example, from changes in the political, social, economic and regulatory
systems of such countries or from extraordinary events such as acts of terrorism, civil disorder, restrictions on
trade, sanctions, limitation on foreign investment, nationalization and inadequate protection of intellectual
property rights. The probability of the above mentioned events actually occurring varies from country to
country and is difficult to predict. However, a constant monitoring activity is carried out by company Top

Half-yearly financial report – H1 2012 ________________________________________________________________ 26
management in order to become aware of any changes as early as possible, so as to minimize any economic
impact that may ensue.
Risks related to growth
The Group aims at continued growth by means of a strategy based on gaining strength in the markets where it is
already present and on further geographical expansion. In the context of such a strategy, the Group could
encounter difficulties in managing the adaptation of the structure and business model or in the ability to identify
market trends or the preferences of local consumers. Furthermore, the company may have to incur start-up costs
arising from the opening of new companies. Lastly, in the case where the Group's growth is pursued through
external lines through acquisition transactions, it may encounter, amongst other things, difficulties related to the
correct valuation of the assets acquired, to the integration of such assets and also to the failure to achieve the
expected synergy, which may have a negative impact on the activity and on the future economic-financial
results of the Group.
Risks connected with the recoverability of intangible assets, in particular goodwill
Intangible assets totaling € 92,690 thousand are reported in the consolidated financial statements at 30 June 2011,
including € 8,875 thousand for development expenditure, € 55,582 thousand for goodwill, € 28,233 thousand for
trademarks and licenses, as well as net prepaid tax totaling € 13,992 thousand. The recoverability of such values
is related to the materialization of future product plans and the cash generating unit to which they refer.
In particular, in the context of its development strategy, the Landi Group has acquired companies that have
allowed it to increase its market presence and to take advantage of the opportunities for growth that it provides.
In regard to such investments, recorded in the financial statements as goodwill, there is no guarantee that the
Landi Group will succeed in achieving the benefits originally expected from these operations.
The Landi Group constantly monitors the progress of performance in comparison to the forecast plans, initiating
the necessary corrective actions whenever unfavorable trends emerge that may involve significant changes in
expected cash flows used for impairment test when evaluating the coherency of the values recorded in the
financial statements.
OPERATING RISKS
Risks connected to relationships with OEM customers
The Landi Group distributes and sells its systems and components to the main automobile manufactures at a
world-wide level (OEM customers). In the half-year ending 30 June 2012, sales of systems and components by
the Landi Group to OEM customers represented approximately 37% of the total sales of such products. The
Group boasts long-standing relationships with the main world-wide automobile manufacturers. The ability of

Half-yearly financial report – H1 2012 ________________________________________________________________ 27
the group to strengthen the existing relationships with such customers, or to establish new relationships, is a
determining factor in order to consolidate the leadership position that Landi Group holds in the market. The
relationships with OEM customers are typically governed by agreements that do not require minimum purchase
quantities. Therefore the demand for predefined quantities of Landi Group products from such customers
cannot be guaranteed. In order to best satisfy the requirements of various customers to its best ability, the Landi
Group has over the last few years initiated a policy of delocalization of part of its production in countries where
it already has a number of customers and is attempting to do the same in other countries. Due to these
considerations, and also in the light of the competitive advantage acquired in the offer of solutions for the
development of sales in the After Market channel, the Group does not consider itself to be a subject with a
significant risk of dependency on OEM customers. However, it is not possible to exclude the fact that a possible
loss of important customers or a reduction in orders from them or a delay in collection compared to contractual
stipulations may determine negative effects on the economic-financial results of the Group.
Product liability risks
Any design or manufacturing defects in the products of the Landi Group, also attributable to third party subjects
such as suppliers and installers, may generate product liability against third party subjects. In addition, should
the products turn out to be defective or fail to comply with technical and legal specifications, the Landi Group,
also at the request of its customers, could be obliged to withdraw such products from the market while incurring
the related costs. For these reasons an insurance structure has been set up that is centered on master policies
negotiated and contracted centrally and local policies of initial risk. The latter guarantee immediate activation of
the cover which is supplemented by master policies where the impact of the damage exceeds the local maximum
amount. In addition, allocations are made to appropriate risk provisions determined on the basis of historical
analysis and through evaluation of the individual commercial contracts signed with the main customers.
FINANCIAL RISKS
Interest rate risk
The Landi Group is exposed to the interest rate risk associated both with cash at hand and with short, medium
and long term financing. The exposure refers mainly to the Euro zone. As regards exposure to the risk of interest
rate volatility, note that the financial indebtedness is regulated primarily by variable interest rates. Therefore, the
financial management of the Group remains exposed to fluctuations in interest rates, not having, at the date of
the present financial statements, subscribed to instruments covering the variability of the interest rates on loans
contracted with the banks.
Exchange risk

Half-yearly financial report – H1 2012 ________________________________________________________________ 28
The Landi Group sells part of its production and, although to much lesser degree, also purchases some
components also in Countries outside the Euro zone. In relation to the exchange risk, note that the amount of the
consolidated equity balances expressed in currency other than the functional currency is to be considered as
rather insignificant at Group level, although more important for the Iranian and Pakistani subsidiaries. The
Group has not subscribed to any instruments to cover exchange rate fluctuations and, in accordance with the
Group’s policy up to this moment, no speculative derivatives have been subscribed.
Credit risk
Credit risk is the risk that a customer or one of counterparts of a financial instrument causes a financial loss
through failure to fulfill an obligation and derives primarily from trade receivables, from other financial assets
and from guarantees that may have been given by the Group.
Trade receivables and other receivables
The Group normally deals with known and reliable customers. It is the Landi Group's policy to subject
customers requesting extended payment conditions to procedures for checking their credit class. This check also
includes external assessments when available. In addition, the balance of the receivables is monitored on a
fortnightly basis over the period, in order to minimize exposure to the risk of losses. Finally, regarding new
customers and those not operating in EU countries, a letter of credit to guarantee successful collection is
normally used, where possible.
The Parent Company insures part of its foreign receivables, which are not guaranteed by letters of credit,
through a leading Insurance Company and makes use of pro-soluto assignment of debts. The Group allocates a
provision for loss of value that reflects the estimated losses on trade receivables and on other creditors, made up
primarily of individual write-downs of significant exposures.
Lastly, we point out that the persistence or deterioration of the current economic and financial crisis could have
an impact, even significantly, on the capacity of some client companies to regularly meet their obligations to the
Group.
Other financial assets
The credit risk regarding the other financial assets of the Group, including cash and cash equivalents, presents a
maximum risk equal to the book value of these assets in the case of insolvency of the counterpart.
Guarantees
The policies of the Group provide for the issue of financial guarantees only in favor of subsidiary companies.
Liquidity risk
The liquidity risk is the risk that the Group may have difficulty in meeting obligations associated with financial

Half-yearly financial report – H1 2012 ________________________________________________________________ 29
liabilities. The Landi Group manages the liquidity risk by maintaining an adequate level of available financial
resources and bank credit granted by the main Credit Institutions, in order to satisfy the finance requirements of
the operational activity. The uncertainty in the markets in which the Group operates and of the financial markets
requires particular attention in managing the liquidity risk and, to this end, particular attention is given to the
actions aimed at generating financial resources with operating activities and at maintaining an adequate level of
cash and cash equivalents as an important factor in facing this and future years. Therefore, the Group expects to
deal with the necessities arising from receivables falling due and from investments planned by means of flows
deriving from operating activities, available liquidity, and the renewal or refinancing of bank loans.
The Group has not adopted a specific policy for management of the centralized treasury. In particular, the
management of the ordinary treasury is delegated locally to the individual companies of the Group, while the
extraordinary treasury is subject to the decision-making process of the Parent company.
2.8. OTHER INFORMATION Transactions with related parties
The creditor/debtor relationships and economic transactions with related companies are the subject of a specific
analysis in “Explanatory Notes to the Abbreviated Half-yearly Consolidated Financial Statements” to which you
may refer. Please also note that sales and purchases between the parties cannot be qualified as either atypical or
unusual, as they are part of the normal activities of the Group companies, and that they are carried out at normal
market values. Regarding the relationships with the parent company Girefin S.p.A., also bear in mind that the
Directors of Landi Renzo S.p.A. do NOT consider it to exercise the management and coordination activities
provided for by article 2497 of the Italian Civil Code. Lastly, please note that in accordance with CONSOB
Regulation 17221/2010, and pursuant to Article 2391-bis of the Civil Code, the Board of Directors has adopted
the specific procedure for transactions with related parties, available on the company website, to which you are
referred.
Positions or transactions deriving from atypical and/or unusual transactions
Pursuant to CONSOB communication no. 6064293 of July 28th 2006, note that during the six-month period no
atypical and/or unusual transactions occurred outside the normal operation of the company that could give rise
to doubts regarding the correctness and completeness of the information in the financial statements, conflicts of
interest, the protection of company assets or the safeguarding of minority stockholders.
Treasury shares and shares of parent companies
In compliance with the provisions of article 2428 of the Italian Civil Code, it is confirmed that during the year
2011 and the first six months of 2012 the Parent company did not negotiate any treasury shares or shares of
parent companies and does not at present hold any treasury shares or shares of parent companies.

Half-yearly financial report – H1 2012 ________________________________________________________________ 30
Sub-offices
No sub-offices were set up.

Half-yearly financial report – H1 2012 ________________________________________________________________ 31
2.9. SIGNIFICANT EVENTS AFTER CLOSING OF THE SIX-MONTH PERIOD AND FORECAST FOR OPERATIONS
After the closing of the six-month period and up to the present we point out that:
registrations of motor vehicles in Italy in the period January-July (ANFIA figures) totaled 928,064 units,
a decrease of 19.9% compared to the same period in 2011. In July 2012 a total of 109,380 vehicles were
registered, a decrease of 21.6% compared with volumes in 2011. also in July 2012 (UNRAE figures)
registration of LPG and CNG bi-fuel vehicles represented 13.4% of the total (5.2% in July 2011), including
9.8% LPG and 3.5% CNG.
since 18 July 2012, as mentioned in the introduction, the company structure acquired on rental with
conditional purchase of the former SAFE business unit has been active, for which, taking account of
current jobs in the portfolio, good revenue prospects are expected over the next six-month period.
on 30 July 2012 an agreement was signed setting up a joint venture in India between Landi Renzo S.p.A.
and Krishna Group, which will have the aim of becoming a leader in the supply of automobile gas
conversion systems for the Indian OEM sector, and in particular for the customer Maruti Suzuki.
Forecast for operations
The performance of the first six months is aligned with the Group's forecasts for the year 2012, posting positive
results regarding both revenues and margins, despite ongoing difficulties related to the macroeconomic scenario
and the reference market, including the business restrictions related to problematic countries in South West
Asia.
As regards the foreseeable future development of operations, the Landi Group confirms a positive outlook for
2012 with turnover up by more than 5% compared with 2011, and EBITDA margin greater than 10%, also due to
the consolidation of all the activities for optimization of structural and product costs already implemented as of
2011. The extraordinary operation linked to the company structure acquired on rental ex Safe represents, in the
current year, an additional turnover of more than € 6 million.
Cavriago, 28 August 2012
Chief Executive Officer: Claudio Carnevale

Half-yearly financial report – H1 2012 ________________________________________________________________ 32
3. ABBREVIATED SIX-MONTHLY INTERIM CONSOLIDATED FINANCIAL STATEMENTS AS AT 30 JUN 2012
3.1. CONSOLIDATED STATEMENT OF FINANCIAL POSITION
ASSETS (thousands of Euros) Notes 30/06/2012 31/12/2011 30/06/2011
Non-current assets
Property, plant and equipment 2 33,341 35,096 37,156
Development expenditure 3 8,875 10,346 10,992
Goodwill 4 55,582 55,582 59,498
Other intangible assets with finite useful lives 5 28,233 29,506 30,328
Other non-current financial assets 6 192 170 259
Deferred tax assets 7 13,992 13,274 9,632
Total non-current assets 140,215 143,974 147,865
Current assets
Trade receivables 8 92,423 77,429 79,837
Trade receivables - related parties 285 361 461
Inventories 9 79,028 67,408 74,079
Other receivables and current assets 10 20,549 27,452 30,389
Current financial assets 11 174 176 152
Cash and cash equivalents 12 24,978 20,059 24,557
Total current assets 217,437 192,885 209,475
TOTAL ASSETS 357,652 336,859 357,340
EQUITY AND LIABILITIES (thousands of Euros) 30/06/2012 31/12/2011 30/06/2011
Equity
Share capital 11,250 11,250 11,250
Other reserves 125,212 134,154 132,951
Profit (loss) for the period 2,606 -9,138 -2,397
Total equity attributable to the shareholders of the parent 139,068 136,266 141,804
Minority interests 780 738 447
TOTAL EQUITY 13 139,848 137,004 142,251
Non-current liabilities
Bank loans 14 30,442 40,119 53,580
Other non-current financial liabilities 15 49 49 123
Provisions for risks and charges 16 5,292 4,860 4,240
Defined benefit plans 17 2,938 2,835 3,067
Deferred tax liabilities 18 11,060 12,351 13,103
Total non-current liabilities 49,781 60,214 74,113
Current liabilities
Bank overdrafts and short-term loans 19 65,978 69,878 50,996
Other current financial liabilities 20 74 125 252
Trade payables 21 86,358 55,903 75,671
Trade payables – related parties 61 61 334
Tax liabilities 22 6,965 6,458 5,203
Other current liabilities 23 8,587 7,216 8,520
Total current liabilities 168,023 139,641 140,976
TOTAL EQUITY AND LIABILITIES 357,652 336,859 357,340

Half-yearly financial report – H1 2012 ________________________________________________________________ 33
3.2. GENERAL CONSOLIDATED INCOME STATEMENT
GENERAL CONSOLIDATED INCOME STATEMENT (thousands of Euro) Note
s 30/06/2012 30/06/2011
Revenues (goods and services) 24 139,143 126,844
Revenues (goods and services) - related parties 12 899
Other revenue and income 25 959 678
Cost of raw materials, consumables and goods and change in inventories 26 -62,422 -61,296
Costs for services and use of third party assets 27 -37,961 -32,976
Costs for services and use of third party assets – related parties -788 -762
Personnel expenses 28 -21,846 -21,161
Accruals, doubtful debts and other operating expenses 29 -1,212 -1,341
Gross Operating Profit 15,885 10,885
Amortization, depreciation and impairment losses 30 -9,149 -9,088
Operating Profit 6,736 1,797
Financial income 31 352 271
Financial expenses 32 -2,177 -1,600
Exchange rate gains (losses) 33 -9 -2,216
Profit (Loss) before tax 4,902 -1,748
Taxes 34 -2,177 -907
Net profit (loss) for the Group and minority interests, including: 2,725 -2,655
Minority interests 119 -258
Net profit (loss) for the Group 2,606 -2,397
Basic earnings (loss) per share (calculated on 112,500,000 shares) 35 0.0232 -0.0213
Diluted earnings (loss) per share 0.0232 -0.0213
OTHER COMPONENTS OF THE GENERAL INCOME STATEMENT (thousands of Euro) 30/06/2012 30/06/2011
Net profit (loss) for the Group and minority interests: 2,725 -2,655
Exchange rate differences from conversion of foreign operations 191 -1,609
Other Equity movements from foreign operations 0 0
Profits/Losses recorded directly to Equity net of tax effects 191 -1,609
Total general income statement for the year 2,916 -4,264
Profit (loss) for Shareholders of the Parent Company 2,803 -3,952
Minority interests 113 -312

Half-yearly financial report – H1 2012 ________________________________________________________________ 34
3.3. CONSOLIDATED CASH FLOW STATEMENT
CASH FLOW STATEMENT (thousands of Euros) 30/06/2012 31/12/2011 30/06/2011
Opening cash and cash equivalents -49,819 -2,110 -2,110
Profit (Loss) before tax (less minority interests) 4,782 -8,212 -1,489
Adjustments for:
Net financial Income / (Charges) including exchange rate differences 1,834 4,737 4,878
Amortization, depreciation and impairment losses 9,149 18,421 9,088
Impairment of tangible and intangible fixed assets 0 4,316 0
Changes in provisions and benefits for employees 347 343 22
Changes in other provisions 1,105 107 -513
Net change in deferred taxes -2,008 -2,567 0
(Increase) decrease in current assets:
Inventories -11,621 -428 -7,099
trade receivables -14,994 2,757 348
trade receivables – related parties 76 351 251
receivables from others and other receivables 6,526 -6,149 -9,062
Increase (decrease) in current liabilities:
trade payables 30,454 -4,285 11,198
trade payables – related parties 0 -293 -20
payables to others and other liabilities 1,321 1,747 1,796
Financial flow from (for) operating activities 26,971 10,845 9,398
Net interest paid (including exchange rate differences realized) -1,630 -4,737 -1,334
Income taxes paid -1,152 -5,833 -2,946
Net financial flow from (for) operating activities 24,189 275 5,118
Investments in intangible assets -1,062 -1,307 -1,559
Development expenditure -1,238 -3,089 -1,450
Investments in property, plant and equipment -3,850 -10,495 -6,514
Proceeds from the sale of fixed assets 478 569 0
Investments in other non-current financial assets -21 52 0
Financial flow for acquisition of equity investments -5,693 -14,270 -9,523
Dividends paid in the period 0 -6,188 -6,188
Loans obtained/repaid to/from banks and other financial backers during the period -9,677 -27,079 -13,417
Payments for reduction of payables for financial leasing 0 -447 -318
Financial flow from (for) financing activities -9,677 -33,714 -19,923
Total financial flow 8,819 -47,709 -24,328
Closing cash and cash equivalents -41,000 -49,819 -26,438
This statement, as required by IAS 7 paragraph 18, was prepared using the indirect method; the items posted in the current year were uniformly included in the previous year's statement. The opening and closing cash and cash equivalents reflect the difference between cash and cash equivalents and bank overdrafts and short-term loans.
Half-yearly financial report – H1 2012 ________________________________________________________________ 35
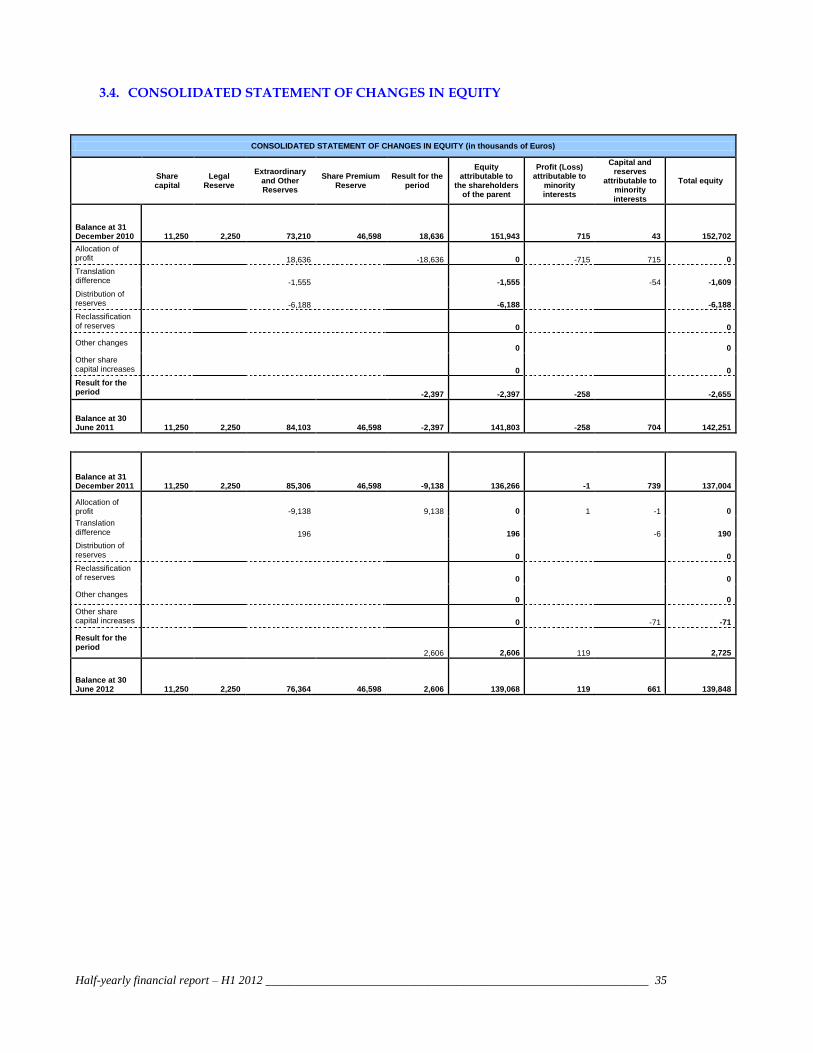
3.4. CONSOLIDATED STATEMENT OF CHANGES IN EQUITY
CONSOLIDATED STATEMENT OF CHANGES IN EQUITY (in thousands of Euros)
Share capital
Legal Reserve
Extraordinary and Other Reserves
Share Premium Reserve
Result for the period
Equity attributable to
the shareholders of the parent
Profit (Loss) attributable to
minority interests
Capital and reserves
attributable to minority interests
Total equity
Balance at 31 December 2010 11,250 2,250 73,210 46,598 18,636 151,943 715 43 152,702
Allocation of profit 18,636 -18,636 0 -715 715 0
Translation difference -1,555 -1,555 -54 -1,609
Distribution of reserves -6,188 -6,188 -6,188
Reclassification of reserves 0 0
Other changes 0 0
Other share capital increases 0 0
Result for the period -2,397 -2,397 -258 -2,655
Balance at 30 June 2011 11,250 2,250 84,103 46,598 -2,397 141,803 -258 704 142,251
Balance at 31 December 2011 11,250 2,250 85,306 46,598 -9,138 136,266 -1 739 137,004
Allocation of profit -9,138 9,138 0 1 -1 0
Translation difference 196 196 -6 190
Distribution of reserves 0 0
Reclassification of reserves 0 0
Other changes 0 0
Other share capital increases 0 -71 -71
Result for the period
2,606 2,606 119 2,725
Balance at 30 June 2012 11,250 2,250 76,364 46,598 2,606 139,068 119 661 139,848
Half-yearly financial report – H1 2012 ________________________________________________________________ 36
4. EXPLANATORY NOTES TO THE ABBREVIATED SIX-MONTHLY INTERIM CONSOLIDATED FINANCIAL STATEMENTS AS AT 30 JUNE 2012
4.1. GENERAL INFORMATION
The LANDI RENZO Group has been active for more than fifty years in the automotive fuel supply systems
sector operating in the design, manufacture installation and sale of eco-compatible LPG and CNG systems (the
“LPG line” and “CNG line” respectively). To a much lesser extent, the Group also deals with car audio and
alarm systems under the MED brand through its subsidiary A.E.B. S.p.A. The Group also maintains commercial
and technical collaboration relationships with the main car manufacturers at a world-wide level (OEM
customers) and with independent retailers and importers (After Market customers).
Note that the structure of the Group has not changed compared with 31 December 2011.
The parent company of the LANDI RENZO Group is Landi Renzo S.p.A. with its registered office in Cavriago
(RE). The company is listed on the Milan Stock Exchange in the FTSE Italy STAR segment.
4.2. GENERAL PREPARATION CRITERIA AND CONSOLIDATION PRINCIPLES
4.2.1. Premise
The abbreviated half-yearly consolidated financial statements at 30 June 2012 were prepared pursuant to Article
154-ter of Legislative Decree 58/1998 “Consolidated Financial Law (Testo Unico della Finanza)”, in accordance
with the provisions of international accounting principles (IAS/IFRS) recognized in the European Community,
and in particular those of IAS 34 “Interim Financial Statements”. In partial exception to the provisions of IAS 34,
this report provides detailed rather than synthetic schemes in order to provide a clearer view of the economic-
patrimonial and financial dynamics that occurred over the six-month period. The explanatory notes are also
presented in compliance with the information required by IAS 34 with the supplements considered useful for a
clearer understanding of the half-yearly financial statements.
The abbreviated half-yearly consolidated financial statements at 30 June 2012, approved by the Board of
Directors on 28 August 2012, must be read in conjunction with the consolidated annual financial statements as at
31 December 2011.
These Financial Statements are submitted to limited auditing by KPMG S.p.A.
They are consolidated on a line-by-line basis to include all assets and liabilities in their entirety.
The accounting policies used for the preparation of the consolidated financial statements for the six months
closed at 30 June 2012 are the same as those used for the consolidated financial statements as at 31 December
2011.
Half-yearly financial report – H1 2012 ________________________________________________________________ 37
In addition to the interim values of the income statement and overall income statement at 30 June 2012 and 2011,
the balance sheet figures for the year closed at 31 December 2011 and at 30 June 2011 are included in the tables
below for purposes of comparison. The functional and presentation currency is the Euro. Figures in the
schedules and tables in this half-yearly financial report are in thousands of Euros.
In consideration of the proposed changes to the Issuer Regulations contained in the Consultation Document
issued by CONSOB on 7 July 2008, the half-yearly communication of the Parent Company has not been inserted
in this report.
The accounting principles are described in the Consolidated Financial Statements at 31 December 2011 and were
applied uniformly across all the companies of the Group and for all periods presented. Note also that the new
accounting principles approved by the European Union that will come into force after 30 June 2012 have not
been adopted in advance.
4.2.2. Consolidation procedures and Accounting policies
The preparation of the abbreviated half-yearly consolidated financial statements requires the directors to apply
accounting standards and methods that are sometimes based on difficult and subjective assessments and
estimates derived from past experience and based on assumptions that are considered reasonable and realistic
given the circumstances. Application of these estimates and assumptions affects the amounts presented in the
financial statements, such as the Balance Sheet, Income Statement, Overall Income Statement, Cash Flow
Statement and disclosures. Estimates are used in recognizing goodwill, impairment of non-current assets,
development expenditure, taxes, provisions for bad debts and inventories, employee benefits and other accruals
and provisions. Estimates are used in recognizing goodwill, impairment of non current assets, development
expenditure, taxes, provisions for bad debts and inventories, employee benefits and other accruals and
provisions.
It is also pointed out that some valuation processes, especially the more complex ones such as establishing any
loss in value of non-current assets, are normally carried out to a fuller extent only during preparation of the
annual financial statements, when all the necessary information is available, except for those cases in which
there are impairment indicators that require an immediate assessment of possible losses in value.
The Group performs activities that do not on the whole present significant seasonal or cyclical variations total
sales over the course of the year, except for the signing of new supply contracts on the OEM channel which may
provide for planned and differing delivery schedules in the individual quarters.

Half-yearly financial report – H1 2012 ________________________________________________________________ 38
4.2.3. Conversion of the financial statements of foreign companies
The Financial Statements in the currency of the foreign subsidiaries are converted into the accounting currency,
adopting the half-year end exchange rate for the Statement of Financial Position and the average exchange rate
over the six months for the Income Statement. The conversion differences deriving from the adjustment of
opening Equity to the current rates at the end of the period, and those due to the different method used for
conversion of the result for the period, are accounted for in Equity under the other reserves.
The following table specifies the exchange rates used for the conversion of financial statements expressed in
currencies other than the accounting currency.
Exchange rate (Value against €) At 30/06/12
Average H1 2012 At 31/12/2011 Average 2011 At 30/06/2011
Average H1 2011
Real – Brazil 2.579 2.414 2.416 2.326 2.260 2.287
Renminbi – China 8.001 8.190 8.159 8.996 9.342 9.176
Iranian Rial 15464.900 15674.798 14449.300 14779.592 15423.100 14757.017
Pakistani Rupee 119.048 118.422 116.382 120.132 124.259 119.802
Zloty – Poland 4.249 4.246 4.458 4.119 3.990 3.952
Leu - Romania 4.451 4.390 4.323 4.239 4.244 4.180
US Dollar 1.259 1.296 1.294 1.392 1.445 1.403
Bolivar Fuerte - Venezuela 5.407 5.568 3.360 3.614 3.753 3.644
Peso Argentina 5.643 5.691 5.568 5.743 5.932 5.679
Indian Rupee 70.120 67.596 68.713 64.867 64.562 63.132

Half-yearly financial report – H1 2012 ________________________________________________________________ 39
4.3. CONSOLIDATION SCOPE
The consolidation scope includes the parent company Landi Renzo S.p.A. and the companies over which the
latter exercises direct and indirect control. Control exists when the parent has the majority voting rights or when,
despite not holding such rights, has the power to govern the financial and operating policies of an entity so as to
obtain benefits from its activities.
Companies consolidated with the global consolidation method
At 30 June 2012 the LANDI RENZO Group is made up of the following companies, consolidated with the full
consolidation method:
Company Name Registered Office Share capital
Direct investment Indirect
investment
Landi Renzo S.p.A. Cavriago (RE) EUR
11,250,000 Parent Company
Landi International B.V. Utrecht (The Netherlands) EUR
18,151 100.00%
Eurogas Utrecht B.V. Utrecht (The Netherlands) EUR
36,800 100.00% (*)
Landi Renzo Polska Sp.Zo.O. Warsaw (Poland) PLN 50,000 100.00% (*)
LR Industria e Comercio Ltda Espirito Santo (Brazil) BRL 4,320,000 99.99%
Beijing Landi Renzo Autogas System Co. Ltd
Beijing (China) USD
2,600,000 100.00%
L.R. Pak (Pvt) Limited Karachi (Pakistan) PKR 75,000,000 70.00%
Landi Renzo Pars Private Joint Stock Company
Teheran (Iran) IRR 8,753,640,000 75.00%
Landi Renzo RO srl Bucharest (Romania) RON
20,890 100.00%
LandiRenzo VE C.A. Caracas (Venezuela) VEF 244,000 100.00%
Landi Renzo USA Corporation Wilmington - DE (USA) USD
18,215,400 100.00%
Baytech Corporation Los Altos - CA (USA) USD
5,000 100.00% (+)
AEB S.p.A. Cavriago (RE) EUR
2,800,000 100.00%
AEB America s.r.l. Buenos Aires (Argentina) ARS 2,030,220 96.00% (§)
Lovato Gas S.p.A. Vicenza EUR
120,000 100.00%
Lovato do Brasil Ind Com de Equipamentos para Gas Ltda (^)
Curitiba (Brazil) BRL 100,000 100.00% (#)
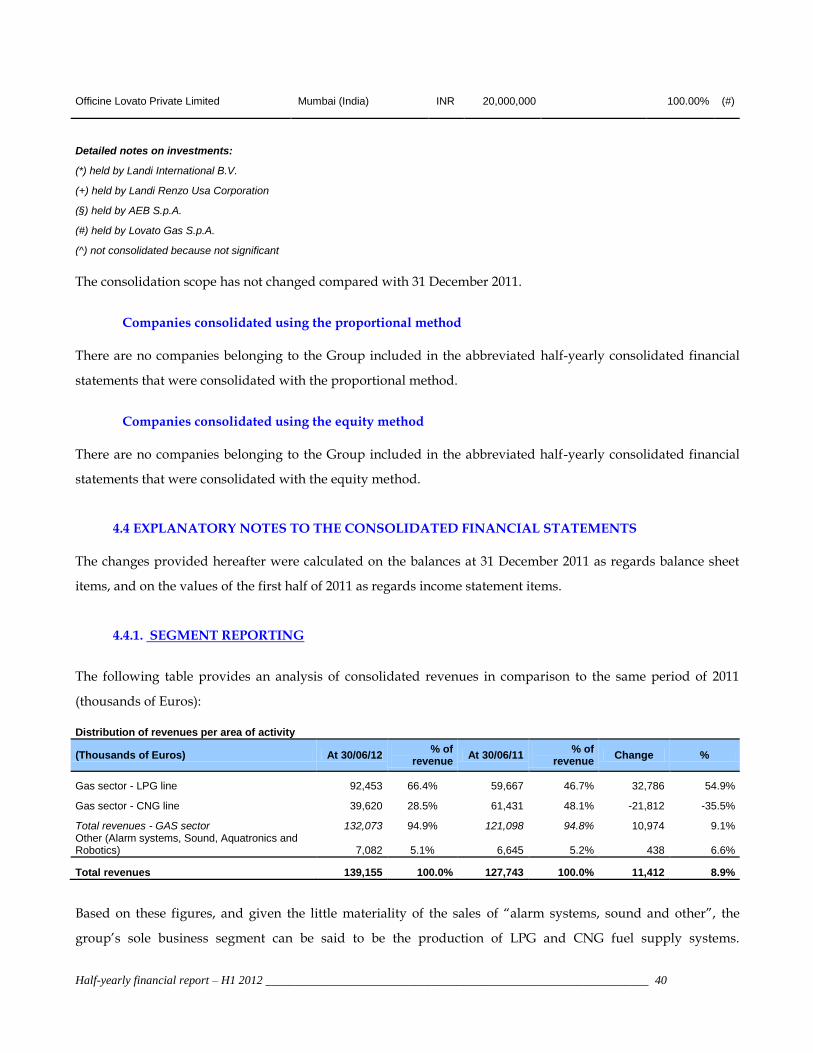
Half-yearly financial report – H1 2012 ________________________________________________________________ 40
Officine Lovato Private Limited Mumbai (India) INR 20,000,000 100.00% (#)
Detailed notes on investments:
(*) held by Landi International B.V.
(+) held by Landi Renzo Usa Corporation
(§) held by AEB S.p.A.
(#) held by Lovato Gas S.p.A.
(^) not consolidated because not significant The consolidation scope has not changed compared with 31 December 2011.
Companies consolidated using the proportional method
There are no companies belonging to the Group included in the abbreviated half-yearly consolidated financial
statements that were consolidated with the proportional method.
Companies consolidated using the equity method
There are no companies belonging to the Group included in the abbreviated half-yearly consolidated financial
statements that were consolidated with the equity method.
4.4 EXPLANATORY NOTES TO THE CONSOLIDATED FINANCIAL STATEMENTS The changes provided hereafter were calculated on the balances at 31 December 2011 as regards balance sheet
items, and on the values of the first half of 2011 as regards income statement items.
4.4.1. SEGMENT REPORTING
The following table provides an analysis of consolidated revenues in comparison to the same period of 2011
(thousands of Euros):
Distribution of revenues per area of activity
(Thousands of Euros) At 30/06/12 % of
revenue At 30/06/11
% of revenue
Change %
Gas sector - LPG line 92,453 66.4% 59,667 46.7% 32,786 54.9%
Gas sector - CNG line 39,620 28.5% 61,431 48.1% -21,812 -35.5%
Total revenues - GAS sector 132,073 94.9% 121,098 94.8% 10,974 9.1% Other (Alarm systems, Sound, Aquatronics and Robotics) 7,082 5.1% 6,645 5.2% 438 6.6%
Total revenues 139,155 100.0% 127,743 100.0% 11,412 8.9%
Based on these figures, and given the little materiality of the sales of “alarm systems, sound and other”, the
group’s sole business segment can be said to be the production of LPG and CNG fuel supply systems.

Half-yearly financial report – H1 2012 ________________________________________________________________ 41
Considering that the principal source of risks and benefits is connected with the activity carried out and that the
structure of the internal reporting uses a single activity segment, it is not considered necessary to provide further
specifications regarding the Gas Sector since it coincides substantially with those of the entire company.
The revenues of the Landi Renzo Group have been divided by geographical area, with reference to location of
the end customer, while the value of the assets and investments are broken down by geographical segment
based on location of the actual assets.
Consolidated revenues recorded for the first half of 2012 and 2011 by the Landi Renzo group are analyzed by
geographical segment as follows (thousands of Euros):
(Thousands of Euros) At 30/06/12 % of
revenue At 30/06/11
% of revenue
Change %
Italy 42,954 30.9% 21,832 17.1% 21,122 96.7%
Europe (excluding Italy) 44,904 32.3% 33,068 25.9% 11,836 35.8%
South-west Asia 12,393 8.9% 35,171 27.5% -22,778 -64.8%
America 17,174 12.3% 18,233 14.3% -1,059 -5.8%
Rest of the World 21,730 15.6% 19,439 15.2% 2,291 11.8%
Total 139,155 100% 127,743 100% 11,412 8.9%
For a more detailed analysis of sales dynamics, broken down both geographically and by area of activity, please
refer to the interim Directors' Report
The following table provides the values (in thousands of €) relating to assets analyzed by geographical segment
of origin:
Total Assets 30 June 2012 31 December 2011 Change
Italy 293,361 277,205 16,156
Western Europe (excluding Italy) 1,650 1,423 227
Eastern Europe 18,664 9,771 8,893
South-west Asia 16,460 21,576 -5,116
Rest of Asia 10,625 9,267 1,358
America 16,892 17,617 -725
Total ASSETS 357,652 336,859 20,793

Half-yearly financial report – H1 2012 ________________________________________________________________ 42
The values (in thousands of €) relating to investments are provided below, net of disposals, analyzed by
geographical segment of origin:
Total Investments in Fixed Assets 30/06/12 30/06/11 Change
Italy 3,648 5,432 -1,784
Western Europe (excluding Italy) 38 5 33
Eastern Europe 404 454 -50
South-west Asia 148 151 -3
Rest of Asia -9 40 -48
America 38 238 -200
Total INVESTMENTS IN FIXED ASSETS 4,267 6,320 -2,053
NON-CURRENT ASSETS
4.4.2. PROPERTY, PLANT AND EQUIPMENT
Property, plant and equipment show an overall net decrease of € 1,755 thousand, decreasing from € 35,096
thousand at 31 December 2011 to € 33,341 thousand at 30 June 2012.
The following is an analysis of changes in “Property, plant and equipment” that took place during the period
(thousands of Euro):
HISTORICAL COST
Net
Valu
e a
t 31/1
2/2
011
Gro
ss V
alu
e a
t 31/1
2/2
011
Dep
recia
tio
n F
un
ds
at
31/1
2/2
011
Inv
estm
en
ts
Dis
po
sals
Red
uc
tio
n i
n f
un
ds
Dep
recia
tio
n
Exch
an
ge d
iffe
ren
ces
on
tran
sla
tio
n
Net
Valu
e a
t 30/0
6/2
012
Gro
ss V
alu
e a
t 30/0
6/2
012
Dep
recia
tio
n F
un
ds
at
30/0
6/2
012
Property, plant and equipment 35,096 4,313 -3,119 1,658 -4,812 205 33,341
87,245 -52,149 88,644 -55,303
The main increases in property, plant and equipment during the first half of 2012 relate to:
- purchase of plant and machinery for € 2,089 thousand;
- purchase of industrial equipment, in particular moulds for € 407 thousand and testing and control tools for €
618 thousand;
- payments on account made to suppliers and assets under construction for € 929 thousand.
The main decreases in property, plant and equipment during the first half of 2012 relate to disposals of industrial
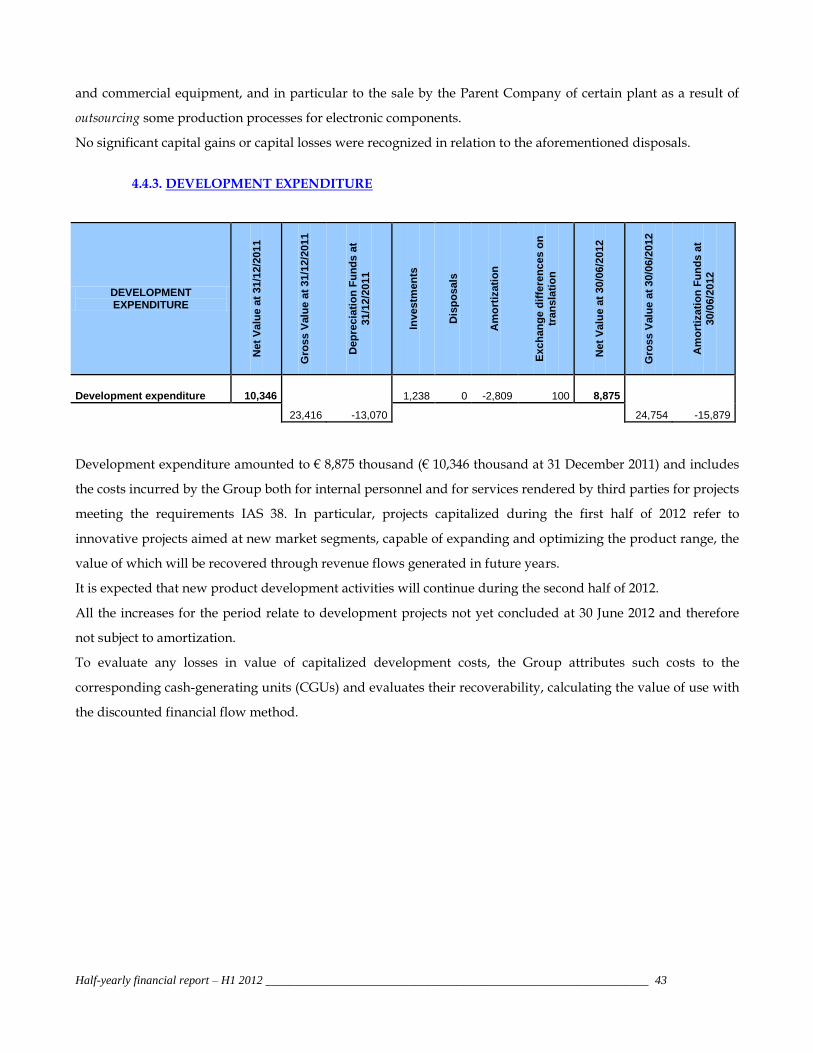
Half-yearly financial report – H1 2012 ________________________________________________________________ 43
and commercial equipment, and in particular to the sale by the Parent Company of certain plant as a result of
outsourcing some production processes for electronic components.
No significant capital gains or capital losses were recognized in relation to the aforementioned disposals.
4.4.3. DEVELOPMENT EXPENDITURE
DEVELOPMENT EXPENDITURE
Net
Valu
e a
t 31/1
2/2
011
Gro
ss V
alu
e a
t 31/1
2/2
011
Dep
recia
tio
n F
un
ds
at
31/1
2/2
011
Inv
estm
en
ts
Dis
po
sals
Am
ort
izati
on
Exch
an
ge d
iffe
ren
ces o
n
tran
sla
tio
n
Net
Valu
e a
t 30/0
6/2
012
Gro
ss V
alu
e a
t 30/0
6/2
012
Am
ort
izati
on
Fu
nd
s a
t
30/0
6/2
012
Development expenditure 10,346 1,238 0 -2,809 100 8,875
23,416 -13,070 24,754 -15,879
Development expenditure amounted to € 8,875 thousand (€ 10,346 thousand at 31 December 2011) and includes
the costs incurred by the Group both for internal personnel and for services rendered by third parties for projects
meeting the requirements IAS 38. In particular, projects capitalized during the first half of 2012 refer to
innovative projects aimed at new market segments, capable of expanding and optimizing the product range, the
value of which will be recovered through revenue flows generated in future years.
It is expected that new product development activities will continue during the second half of 2012.
All the increases for the period relate to development projects not yet concluded at 30 June 2012 and therefore
not subject to amortization.
To evaluate any losses in value of capitalized development costs, the Group attributes such costs to the
corresponding cash-generating units (CGUs) and evaluates their recoverability, calculating the value of use with
the discounted financial flow method.

Half-yearly financial report – H1 2012 ________________________________________________________________ 44
4.4.4. GOODWILL
31/1
2/2
011
Ch
an
ge in
co
ns
olid
ati
on
sco
pe
Inv
estm
en
ts
Dis
po
sals
Am
ort
izati
on
Exch
an
ge d
iffe
ren
ces
on
tra
ns
lati
on
Net
Valu
e a
t 30/0
6/2
012
Gro
ss V
alu
e a
t
30/0
6/2
012
Am
ort
izati
on
Fu
nd
s a
t
30/0
6/2
012
Goodwill 55,582 55,582
Total 55,582 0 0 0 0 0 55,582 0 0
The item Goodwill is equal to € 55,582 thousand, unchanged compared with 31 December 2011.
The following table analyses this amount broken down by company:
Company June 2012 year 2011 Change
Lovato Gas S.p.A. 50,221 50,221 0
AEB S.p.A. 2,813 2,373 440
MED S.p.A. (merged into Landi Renzo in 2010) 2,548 2,988 -440
Total 55,582 55,582 0
The increase in the value of goodwill for the company A.E.B. S.p.A., for € 440 thousand, and the equivalent
decrease for the parent company Landi Renzo S.p.A. is a result of the contribution - with effect from 1 January
2012 - of the business unit active in the “Alarm Systems” segment, including the corresponding portion of
goodwill, to the subsidiary A.E.B. S.p.A.
No events or circumstances arose during the period indicating possible impairment losses related to the
goodwill mentioned above. The performance of the CGUs over the six months was, however, found to be
substantially in line with the business plan and budget plans used at 31 December 2011, and the assumptions
underlying the determination of WACC (cost of capital) at 31 December 2011 were found to be still valid at 30
June 2012. Therefore, no trigger events emerged that would have required reformulation of the impairment test at
30 June 2012 given that all the Goodwill items were subject to impairment test at 31 December 2011.

Half-yearly financial report – H1 2012 ________________________________________________________________ 45
4.4.5. OTHER INTANGIBLE ASSETS WITH FINITE USEFUL LIVES
Other intangible assets with finite useful lives
Net
Valu
e a
t 31/1
2/2
011
Gro
ss V
alu
e a
t 31/1
2/2
011
Am
ort
izati
on
Fu
nd
s a
t
31/1
2/2
011
Ch
an
ge in
co
ns
olid
ati
on
sco
pe
Inv
estm
en
ts
Dis
po
sals
Red
uc
tio
n i
n f
un
ds
Am
ort
izati
on
Exch
an
ge d
iffe
ren
ces o
n
tran
sla
tio
n
Net
Valu
e a
t 30/0
6/2
012
Gro
ss V
alu
e a
t 30/0
6/2
012
Am
ort
izati
on
Fu
nd
s a
t 30/0
6/2
012
Other intangible assets with finite useful lives 29,506 0 178 -11 11 -1,528 77 28,233
40,840 11,335 41,086 -12,853
The other intangible assets with finite useful lives, equal to € 28,233 thousand at 30 June 2012 (€ 29,506 thousand
at 31 December 2011), include primarily Rights to use intellectual property and Trademarks owned by the
Group, in particular the values of the LOVATO trademark, for € 13,379 thousand, the trademarks A.E.B. and
18SOUND, for € 11,555 thousand, and the Baytech trademark, for € 1,307 thousand, stated at fair value at the
moment of the purchase on the basis of valuations made by independent professionals and amortized over 18
years, the period deemed representative of the useful life of the trademarks.
4.4.6. OTHER NON-CURRENT FINANCIAL ASSETS Other Non-current Financial Assets, equal to € 192 thousand (€ 170 thousand at 31 December 2010) include,
primarily, guarantee deposits. These items were not actualized since the impact of the financial effect is not
significant.
4.4.7. DEFERRED TAX ASSETS
Deferred tax assets, equal to € 13,274 thousand (€ 13,274 thousand at 31 December 2010), refer to the following
main cases:
- remission of the goodwill ex Legislative Decree no. 185/2008, recorded by the subsidiary Lovato Gas S.p.A.
prior to acquisition by the Landi Renzo Group;
- temporary differences deriving from asset adjustment funds posted primarily by the Italian companies of the
Group;
- temporary differences deriving from adjustments for consolidation;
- previous tax losses of the parent company Landi Renzo S.p.A. and the subsidiary Landi Renzo Usa

Half-yearly financial report – H1 2012 ________________________________________________________________ 46
Corporation.
The allocation of deferred tax assets is carried out for each company of the Group by assessing the existence of
the conditions of future recoverability of such taxes on the basis of the updated strategic plans, together with the
corresponding tax plans, taking the applicable tax rules into consideration.
CURRENT ASSETS
4.4.8. TRADE RECEIVABLES (including related parties) Trade receivables (including trade receivables due from related parties), stated net of the related depreciation
fund, are analyzed by geographical segment as follows (thousands of Euros):
Trade receivables per geographical area 30/06/2012 31/12/2011 Change
Italy 29,354 17,769 11,585
Europe (excluding Italy) 23,127 14,970 8,157
South-west Asia 19,427 26,084 -6,657
America 15,856 18,763 -2,907
Rest of the World 9,579 4,624 4,955
Provision for bad debts -4,635 -4,420 -215
Total 92,708 77,790 14,918
Trade Receivables at 30 June 2012 amount to € 92,708 thousand, net of the Provision for Bad Debts equal to €
4,635 thousand, compared with € 77,790 thousand at 31 December 2011.
The Parent Company carried out operations for assignment of trade receivables through pro-soluto factoring
and at 30 June 2012 total assignments with credit maturity, for which the corresponding receivables were
derecognized, amounted to € 7,311 thousand (€ 196 thousand at 31 December 2011).
The provision for bad debts, which was calculated using analytical criteria on the basis of the data available and,
in general, of the historical trend, changed as follows:
Provision for bad debts 31/12/2011 Provision Utilization 30/06/2012
Provision for bad debts 4,420 377 -162 4,635

Half-yearly financial report – H1 2012 ________________________________________________________________ 47
The allocations made during the period, taking account of the assurance policies set up for part of the foreign
receivables of the Parent Company, are equal to € 377 thousand and their purpose is to adjust the receivables to
their assumed recovery value utilizations, equal to € 162 thousand, refer mainly to the write-off of a receivable of
the subsidiary Lovato Gas S.p.A.
In accordance with the requirements of Accounting Principle IFRS 7, the following table provides information on
the maximum credit risk divided by expiry classes, gross of the Provision for Bad Debts:
Past due
(Thousands of Euros) Not past due 0-30 days 30-60 days 60 and beyond Provision for Bad
Debts
Trade Receivables at 31/12/2011 50,492 8,595 4,412 18,711 -4,420
Trade Receivables at 30/06/2012 66,322 5,565 2,156 23,300 -4,635
It is considered that the book value of the Trade Receivables approximates their fair value. In addition, to date, it
is believed that there are no particular risks of solvency.
The increase in receivables overdue by more than 60 days, an increase of € 4.589 thousand compared with 31
December 2011, was mainly due to a lengthening of payment times by several major Iranian auto manufacturers
as a result of financial constraints related to the increasingly strict measures of the international embargo. It
should also be emphasized that a significant portion of these items was collected after the date of these interim
financial statements.
4.4.9. INVENTORIES
This item is analyzed as follows (thousands of Euros):
Inventories 30/06/2012 31/12/2011 Change
Raw materials and parts 49,668 45,674 3,994
Work in progress and semi-finished products 11,432 7,440 3,992
Finished products 24,271 20,381 3,890
(Provision for inventories) -6,343 -6,087 -256
Total 79,028 67,408 11,620
Closing inventories at 30 June 2011 amount overall to € 79,028 thousand, net of the provision for inventories
equal to € 6,343 thousand, and therefore record an increase of € 11,620 thousand compared to 31 December 2011,

Half-yearly financial report – H1 2012 ________________________________________________________________ 48
primarily due to the dynamics of supply related to the increase the volume of business.
The Group estimated the size of the provision for inventories so as to take account of the risks of technical
obsolescence of inventories and to align the book value with their assumed recovery value. At 30 June 2012 this
item was equal to € 6,343 thousand, an increase of € 256 thousand compared with 31 December 2011.
4.4.10. OTHER RECEIVABLES AND CURRENT ASSETS
This item is analyzed as follows (thousands of Euros):
Other receivables and current assets 30/06/2012 31/12/2011 Change
Tax assets 15,202 21,376 -6,174
Amounts due from others 3,503 5,164 -1,661
Prepayments and accrued income 1,844 912 932
Total 20,549 27,452 -6,903
Tax assets
Tax assets consist primarily of VAT recoverable from the tax authorities for € 9,385 thousand, including € 7,373
thousand requested as a refund. The remainder consists of credits for income taxes due to a surplus of advance
payments made during the previous year by the Italian companies of the Group as well as other tax credits
attributable to the foreign Group companies
Please note that during the six month period the parent company completed the sale without recourse of a VAT
credit equal to € 5,500 thousand.
Amounts due from others
These refer to payments on account granted, credit notes to be received and other receivables, mainly of the
Italian companies of the Group
Prepayments and accrued income
This item includes primarily prepaid insurance premiums, rental, membership contributions, and for hardware
and software maintenance fees paid in advance.
4.4.11. CURRENT FINANCIAL ASSETS
At 30 June 2012 the other current financial assets amount to € 174 thousand and consist primarily of the equity
investment in Deutsche Telekom, held by the Parent Company and entered for € 117 thousand, which
corresponds to the stock market share price at the end of the six month period.

Half-yearly financial report – H1 2012 ________________________________________________________________ 49
4.4.12. CASH AND CASH EQUIVALENTS This item, consisting of the active balances of bank current accounts and cash in hand in both Euros and foreign
currency, is analyzed as follows (thousands of Euros):
Cash and cash equivalents 30/06/2012 31/12/2011 Change
Bank and post office accounts 24,960 20,007 4,953
Cash 18 52 -34
Total 24,978 20,059 4,919
Cash and cash equivalents at 30 June 2012 amount to € 24,978 thousand (€ 20,059 thousand at 31 December 2011).
For an analysis relating to the generation and absorption of cash during the year, please refer to the cash flow
statement.
The values stated can be readily converted into cash and are subject to an insignificant risk of change in value. It
is considered that the carrying value of Cash and cash equivalents is aligned with their fair value at the balance
sheet date.
The credit risk relating to Cash and cash equivalents is therefore deemed to be limited since the deposits are split
over primary national and international banking institutions.
4.4.13. EQUITY
The following table provides a breakdown of the items of equity (in thousands of Euros):
Equity 30/06/2012 31/12/2011 Change
Share capital 11,250 11,250 0
Other reserves 125,212 134,154 -8,942
Profit (loss) for the period 2,606 -9,138 11,744
Total Equity attributable to the Shareholders of the Parent 139,068 136,266 2,802
Capital and Reserves attributable to minority interests 661 739 -78
Profit (loss) attributable to minority interests 119 -1 120
Total Minority Interests 780 738 42
Total Consolidated Equity 139,848 137,004 2,844
The share capital stated in the Financial Statements for the year at 30 June 2012 represents the share capital fully
subscribed and paid-up of the company Landi Renzo S.p.A. with a nominal value of € 11,250 thousand,

Half-yearly financial report – H1 2012 ________________________________________________________________ 50
subdivided into a total of 112,500,000 shares with a par value of € 0.10.
Consolidated Equity at 30 June 2012 shows a positive change of € 2,844 thousand compared with 31 December
2011, mainly due to the result of the period.
The other reserves are analyzed as follows:
Other reserves 30/06/2012 31/12/2011 Change
Legal Reserve 2,250 2,250 0
Extraordinary and Other reserves 76,364 85,306 -8,942
Share premium reserve 46,598 46,598 0
Total Other Reserves of the Group 125,212 134,154 -8,942
The balance of the Legal Reserve at 30 June 2012 amounts to € 2,250 thousand and remains unchanged since it
has reached one fifth of the share capital. The Extraordinary Reserve and the other reserves refer to the profits
recorded by the Parent Company and by the subsidiary companies in the preceding years and have decreased by
€ 8,942 thousand as a result of the previous year's loss and the movements of the translation reserve.
The Share Premium Reserve originated as a result of the floatation operation for an amount equal to € 46,598
thousand, net of the related costs.
The minority interests represent the share of equity and year's profit of those foreign subsidiaries not owned in
full. During the period, the item “capital and reserves attributable to minority interests” decreased by € 71
thousand due to the purchase from third parties by the parent company of further shares representing 3.99% of
the share capital of the subsidiary LR Industria e Comercio Ltda.
NON-CURRENT LIABILITIES
4.4.14. BANK LOANS
This item includes medium/long term portion of the bank debts for unsecured loans and finance. At 30 June
2012 it was equal to € 30,442 thousand compared with € 40,119 thousand at 31 December 2011.
The structure of the debt is exclusively at a variable rate indexed to the Euribor and increased by a spread aligned
with the normal market conditions; the loan currency is the Euro. The loans are not secured by collateral, do not
provide for covenants and there are no clauses other than the early payment clauses normally envisaged by
commercial practice. The Group does not have any derivatives to cover the loans.

Half-yearly financial report – H1 2012 ________________________________________________________________ 51
4.4.15. OTHER NON-CURRENT FINANCIAL ASSETS At 30 June 2012 the item, equal to € 49 thousand (€ 49 thousand at 31 December 2011) includes only the long
term portions of facilitated fixed rate loans obtained from the Ministry for Economic Development on the basis
of specific regulations.
4.4.16. PROVISIONS FOR RISKS AND CHARGES These provisions can be broken down as follows (thousands of Euros):
Provisions for risks and charges 31/12/2011 Provision Utilization
Exchange differences
on translation
30/06/2012
Provision for product warranties 4,493 501 -81 4,913
Provision for lawsuits in progress 232 14 246
Provisions for pensions 105 5 -7 103
Other provisions 30 30
Total 4,860 506 -88 14 5,292
The item “Provision for Product Warranties” includes the best estimate of the costs related to the commitments
that the Group companies have incurred as an effect of legal or contractual provisions, in relation to the expenses
connected with providing product warranties for a fixed period of time starting from the sale thereof.
This estimate was determined on the basis of the Group's experience, with specific contractual content, and has
been increased compared with 31 December 2011 as a result of new commercial agreements with car
manufacturers and the effect of expansion of the supply perimeter to them.
At 30 June 2012 this provision amounted to € 4,913 thousand (€ 4,493 thousand at 31 December 2011). The
provision was recognized in the Income statement under the item “Accruals, impairment losses and other
operating expenses”.
Management believes that the value set aside as at 30 June 2012 is sufficient to cover any future requests for
damages deriving from product warranties.
4.4.17. DEFINED BENEFIT PLANS
This item includes exclusively employee severance indemnity funds set up by the Italian companies in
compliance with the regulations in force. The following is the overall change in defined benefit plans for
employees (thousands of Euros):

Half-yearly financial report – H1 2012 ________________________________________________________________ 52
Defined benefit plans 31/12/2011 Provision Utilization 30/06/2012
Employee termination indemnities 2,835 231 -128 2,938
The allocation is due to the effect of the revaluation of the TFR of employees in existence at the end of the period
(net of the actuarial adjustment as provided for by IAS 19). The utilizations, totaling € 128 thousand, refer to the
amounts paid out to employees who ceased to work for the Italian companies of the Group.
4.4.18. DEFERRED TAX LIABILITIES
At 31 June 2012 deferred tax liabilities amount to € 11,060 thousand (€ 12,351 thousand at 31 December 2011)
with a decrease equal to € 1,291 thousand, and are primarily related to temporary differences between the book
values of certain tangible and intangible assets and the values recognized for tax purposes.
No deferred taxes have been recorded on undistributed profit reserves of subsidiaries, since the Parent
Company is able to control the time frame for the distribution of said reserves and it is currently likely that they
will not be distributed.
CURRENT LIABILITIES
4.4.19. BANK OVERDRAFTS AND SHORT-TERM LOANS
The item “Bank overdrafts and short-term loans” at 30 June 2012, totaling € 65,978 thousand, compared with €
69,878 thousand in 2011 consists of the current portion of existing unsecured loans and financing amounting to €
40,869 thousand (€ 39,596 thousand at 31 December 2011) and the current use of short term credit facilities for
advances on invoices and portfolio subject to final payment amounting to € 25,109 thousand. Note that the
above-mentioned financing is not secured by guarantees.
An analysis of the net financial position of the Group is provided below (thousands of Euros):
Net financial position (thousands of Euros) 30/06/2012 31/12/2011
Cash and cash equivalents 24,978 20,059
Bank overdrafts and short-term loans -65,978 -69,878
Short-term loans -74 -125
Net short term indebtedness -41,074 -49,944
Medium-Long term loans -30,491 -40,168
Net medium-long term indebtedness -30,491 -40,168
NET FINANCIAL POSITION -71,565 -90,112

Half-yearly financial report – H1 2012 ________________________________________________________________ 53
The net financial position at 30 June 2012 is negative for € 71,565 thousand compared with a negative net
financial position at 31 December 2011 equal to € 90,112 thousand.
Note that the short-term net financial position also includes the current portion of the other financial liabilities,
which are not included, however, not in the analytical structure of the table relating to the cash flow statement.
4.4.20. OTHER CURRENT FINANCIAL LIABILITIES
At 30 June 2009 this item, equal to € 74 thousand, concerns the short-term portions of the fixed rate facilitated
loans provided by the Italian Ministry for Economic Development on the basis of specific regulations. At 31
December 2011 the other current financial liabilities amounted to € 125 thousand.
4.4.21. TRADE PAYABLES (including related parties)
Trade payables at 30 June 2012 amount to € 86,419 thousand, with an increase of € 30,455 thousand compared
with 31 December 2011.
Trade payables (including trade payables to related parties) can be analyzed by geographical segment as follows
(thousands of Euros):
Trade payables per geographical area 30/06/2012 31/12/2011 Change
Italy 69,326 47,599 21,727
Europe (excluding Italy) 11,629 5,101 6,528
South-west Asia 534 1,171 -637
America 828 544 284
Rest of the World 4,102 1,549 2,553
Total 86,419 55,964 30,455
Trade payables to related parties amounting to € 61 thousand refer primarily to the dealings of the company
A.E.B. S.p.A. with the company Gestimm S.r.l., for property rental charges.
All the related transactions are carried out at normal market conditions. For further details see the next chapter
OTHER INFORMATION – paragraph TRANSACTIONS WITH RELATED PARTIES.
4.4.22. TAX LIABILITIES
Tax liabilities at 30 June 2012 amount to € 6,965 thousand (€ 6,458 thousand at 31 December 2011) and are made
up of the total of payables to the Tax Authorities of the individual countries in which the Group companies are
located.

Half-yearly financial report – H1 2012 ________________________________________________________________ 54
4.4.23. OTHER CURRENT LIABILITIES - (including related parties)
Other current liabilities 30/06/2012 31/12/2011 Change
Amounts owed to pension and social security institutions 1,903 2,050 -147
Other payables (amounts owed to employees, to others) 6,170 4,888 1,282
Accrued expenses and deferred income 514 278 236
Total 8,587 7,216 1,371
Other current liabilities at 30 June 2012 amount to € 8,587 thousand, an increase of € 1,371 thousand compared
with 31 December 2011.
In particular, the item “other payables”, totaling € 6,170 thousand, refers primarily to amounts due for current
and deferred pay to be settled for employees. The increase in this item compared with the total at 31 December
2011 relates to the amount owing for deferred salaries and accrued holidays.
INCOME STATEMENT
4.4.24. REVENUES (including related parties)
Revenues (goods and services) 30/06/2012 30/06/2011 Change
Revenues related to the sale of assets 136,869 126,555 10,314
Revenues for services and other revenues 2,285 1,188 1,097
Total 139,155 127,743 11,412
The Net Revenues of the Group in the first half of 2012 amounted to € 139,155 thousand (€ 127,743 thousand at
30 June 2011), up by 8.9% compared with the same period in 2011.
The item “Revenues for services and other” includes reimbursements of transport costs, insurance
reimbursements, revenues for services rendered and revenues for technical consultancy supplied to third parties
by Group companies.
Revenues from related parties totaling € 12 thousand refer in whole to supplies of goods to the Pakistani
company AutoFuels.
4.4.25. OTHER REVENUE AND INCOME
This item is analyzed as follows (thousands of Euros):

Half-yearly financial report – H1 2012 ________________________________________________________________ 55
Other revenue and income 30/06/2012 30/06/2011 Change
Grants 107 160 -53
Other income 852 518 334
Total 959 678 281
Other revenues and income at 30 June 2012 amount to € 959 thousand compared with € 678 thousand at 30 June
2011.
4.4.26. COST OF RAW MATERIALS, CONSUMABLES AND GOODS (including related parties)
Cost of raw materials, consumables and goods and change in inventories
30/06/2012 30/06/2011 Change
Raw materials and parts 52,658 47,991 4,667
Finished products intended for sale 7,959 11,185 -3,226
Other materials and equipment for use and consumption 1,804 2,120 -316
Total 62,422 61,296 1,126
The total costs for purchases of raw materials, consumables and goods (including the change in inventories)
increased from € 61,296 thousand at 30 June 2011 to € 62,422 thousand at 30 June 2012.
4.4.27. COSTS FOR SERVICES AND USE OF THIRD PARTY ASSETS (including related parties)
This item is analyzed as follows (thousands of Euros):
Costs for services and use of third party assets 30/06/2012 30/06/2011 Change
Industrial and technical services 26,638 18,865 7,773
Commercial services 4,546 6,571 2,025
General and administrative services 5,806 6,432 -626
Costs for use of third party assets 1,759 1,870 -111
Total 38,749 33,738 5,011
The items posted in the current year were uniformly included in the previous year's statement.
Costs for services and the use of third party assets at 30 June 2012 amounts to € 38,749 thousand, compared with
€ 33,738 thousand at 30 June 2011, with an increase of € 5,011 thousand.
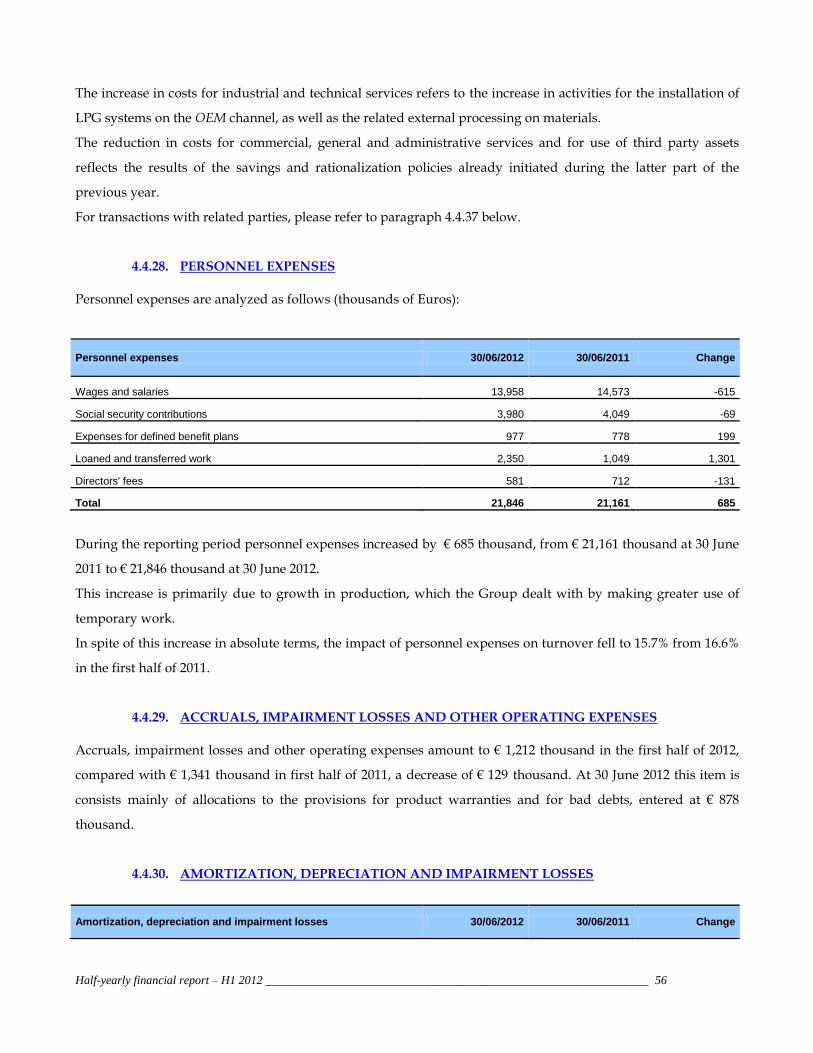
Half-yearly financial report – H1 2012 ________________________________________________________________ 56
The increase in costs for industrial and technical services refers to the increase in activities for the installation of
LPG systems on the OEM channel, as well as the related external processing on materials.
The reduction in costs for commercial, general and administrative services and for use of third party assets
reflects the results of the savings and rationalization policies already initiated during the latter part of the
previous year.
For transactions with related parties, please refer to paragraph 4.4.37 below.
4.4.28. PERSONNEL EXPENSES Personnel expenses are analyzed as follows (thousands of Euros):
Personnel expenses 30/06/2012 30/06/2011 Change
Wages and salaries 13,958 14,573 -615
Social security contributions 3,980 4,049 -69
Expenses for defined benefit plans 977 778 199
Loaned and transferred work 2,350 1,049 1,301
Directors' fees 581 712 -131
Total 21,846 21,161 685
During the reporting period personnel expenses increased by € 685 thousand, from € 21,161 thousand at 30 June
2011 to € 21,846 thousand at 30 June 2012.
This increase is primarily due to growth in production, which the Group dealt with by making greater use of
temporary work.
In spite of this increase in absolute terms, the impact of personnel expenses on turnover fell to 15.7% from 16.6%
in the first half of 2011.
4.4.29. ACCRUALS, IMPAIRMENT LOSSES AND OTHER OPERATING EXPENSES Accruals, impairment losses and other operating expenses amount to € 1,212 thousand in the first half of 2012,
compared with € 1,341 thousand in first half of 2011, a decrease of € 129 thousand. At 30 June 2012 this item is
consists mainly of allocations to the provisions for product warranties and for bad debts, entered at € 878
thousand.
4.4.30. AMORTIZATION, DEPRECIATION AND IMPAIRMENT LOSSES
Amortization, depreciation and impairment losses 30/06/2012 30/06/2011 Change

Half-yearly financial report – H1 2012 ________________________________________________________________ 57
Amortization of intangible assets 4,337 4,045 292
Depreciation of property, plant and equipment 4,812 5,043 -231
Total 9,149 9,088 61
Depreciation and amortization at 30 June 2012 amount to € 9,149 thousand, a slight increase compared with €
9,088 thousand at 30 June 2011.
The amortization of intangible assets refers primarily to the amortization of development and design costs
incurred by the Group, costs for the purchase and registration of trademarks and licenses and for software
(applications and management) purchased over time.
Depreciation of property, plant and equipment refers primarily to property, plant and machinery for production,
assembly and running-in of the products, to industrial and commercial equipment for the purchase of moulds, to
testing and control tools and to electronic processors.
4.4.31. FINANCIAL INCOME
Financial income at 30 June 2012 amounts to € 352 thousand, compared with € 271 thousand at 30 June 2011,
with an increase of € 81 thousand, and relates primarily to interest income on bank deposits.
4.4.32. FINANCIAL EXPENSES
Financial expenses at 30 June 2012 amount to € 2,177 thousand, compared with € 1,600 thousand at 30 June 2011,
and relate to the higher average debt for the period compared to the first half of 2011.
4.4.33. EXCHANGE RATE GAINS (LOSSES)
At 30 June 2012 the net negative exchange rate differences amount to € -9 thousand, compared to net negative
exchange rate differences of € -2,216 thousand in the first half of the previous year, mainly due to the revaluation
of currencies linked to the U.S. dollar against the Euro during the six months under review.
At 30 December 2012 the company does not have any financial instruments to cover of the variability of
exchange rates.
4.4.34. TAXES
Taxes at 30 June 2012 - when the expected tax rate is applied - amount to € 2,177 thousand, compared with € 907
thousand at 30 June 2011, with an increase of € 1,270 thousand. The increase in taxes is determined by the
increase in taxable income as a result of the better economic results achieved.
The theoretical rate used for the calculation of taxes on the income of Italian companies is 31.40% of the taxable
Half-yearly financial report – H1 2012 ________________________________________________________________ 58
income subject to IRES and IRAP for the year. The taxes of the foreign companies are calculated according to the
rates applicable in the respective countries.
4.4.35. EARNINGS PER SHARE
The “base” earnings per share were calculated by relating the net profit of the Group to the weighted average
number of ordinary shares in circulation in the period ( 112,500,000). The “base” earnings per share, which
correspond to the “diluted” earnings per share since there are no convertible bonds, are positive and equal to €
0.0232. The earnings per share in the first half of 2011 were equal to € -0.0213 (negative € -0.0812 at 31 December
2011).
OTHER INFORMATION
4.4.36. ANALYSIS OF THE MAIN DISPUTES IN PROGRESS
The Group companies are involved in proceedings, for both assets and liabilities, for non-significant amounts.
The directors of the Parent Company, supported by the opinion of its lawyers, did not deem it necessary to
make provision for any further funds in the financial statements beyond those already allocated as at 31
December 2011.
There are currently no disputes with the Tax Authority.
4.4.37. TRANSACTIONS WITH RELATED PARTIES
The Landi Group deals with related parties at market conditions considered to be normal in the markets in
question, taking account of the characteristics of the goods and the services supplied.
Transactions with related parties listed below include:
- relationships for supply of services between Gireimm S.r.l. and Landi Renzo S.p.A. for rent of the
property used as the operational headquarters of the Parent Company;
- relationships for supply of services between Gestimm S.r.l., a company in which a stake is held through
the parent company Girefin S.p.A., and the company A.E.B. S.p.A. for rent of the property used as the
operational headquarters of the subsidiary;

Half-yearly financial report – H1 2012 ________________________________________________________________ 59
- relationships for supply of services between Bynet di Vecchi e Turini S.n.c., a company subject to
considerable influence by the manager with strategic responsibilities, and the company A.E.B. S.p.A. for
the supply of IT services;
- the relationships for supply of goods to the Pakistani company AutoFuels (held by a minority
shareholder of the Pakistani subsidiary LR PAK).
The following table summarizes the relationships with related parties (thousands of Euros):
Incidence of Transactions with Related Parties Total item
Absolute value
related parties
% Related party
a) incidence of the transactions or positions with related parties on balance sheet items
Trade receivables 92,708 285 0.31% Autofuels
Trade payables 86,419 61 0.07% Gestimm, Bynet
b) incidence of the transactions or positions with related parties on income statement items
Cost for services and use of third party assets 38,749 788 2.03% Gireimm, Gestimm, Bynet
Revenues (goods and services) 139,155 12 0.01% Autofuels
4.4.38. POSITIONS OR TRANSACTIONS DERIVING FROM ATYPICAL AND/OR UNUSUAL TRANSACTIONS
Pursuant to CONSOB communication no. 6064293 of July 28th 2006, note that during the first six months of 2012
no atypical and/or unusual transactions occurred outside the normal operation of the company that could give
rise to doubts regarding the correctness and completeness of the information in the financial statements, conflicts
of interest, protection of company assets, safeguarding the minority stockholders.
4.4.39. NON-RECURRING SIGNIFICANT EVENTS AND OPERATIONS
Pursuant to CONSOB communication no. 6064293 of 28th July 2006, it is stated that during the first half of 2012
no non-recurring significant events or operations took place.
4.4.40. SIGNIFICANT EVENTS OCCURRING AFTER THE CLOSE OF THE FINANCIAL YEAR Please refer to comments relating to this in the interim directors' report.

Half-yearly financial report – H1 2012 ________________________________________________________________ 60
5. Declaration of the abbreviated half-yearly Financial Statements pursuant to art. 81-ter of CONSOB Regulation no. 11971 of May 14, 1999 and subsequent modifications and
supplements
We the undersigned, Claudio Carnevale and Paul Cilloni, respectively Chief Executive Officer and Officer in
charge of preparing the corporate Financial Statements of Landi Renzo S.p.A., declare, also taking account of the
provisions of article 154-bis, subsections 3 and 4, of Legislative Decree no. 58 dated 24 February 1998 :
- the appropriateness to the characteristics of the company and
- the effective application of the administrative and accounting procedures for preparing the abbreviated
half-yearly financial statements as at 30 June 2012.
There are no significant aspects to report in relation thereto.
We furthermore declare that:
1) the abbreviated half-yearly consolidated financial statements at 30 June 2012:
- have been prepared in compliance with the international accounting principles issued by the
International Accounting Standards Board and adopted by the European Commission in accordance
with the procedure specified in art. 6 of the Regulation (CE) no. 1606/2002 of the European Parliament
and the Council, dated 19 July 2002;
- correspond to the information in the accounting books and records;
- are capable of providing a true and correct representation of the patrimonial, economic and financial
situation of the issuer and of the companies included in the consolidation.
2) the interim directors' report includes a reliable analysis of the references to the important events that
occurred in the first six months of the year and to their impact on the abbreviated half-yearly consolidated
financial statements, together with a description of the main risks and uncertainties for the remaining
months of the year. The interim directors' report also includes a reliable analysis of the information on the
significant transactions with related parties.
Cavriago, 28 August 2012 Officer in charge of preparing Chief Executive Officer corporate Financial Statements Claudio Carnevale Paolo Cilloni

KPMG S.p.A.
Revisione e organizzazione contabile
Viale Mentana, 148
43121 PARMA PR
Telefono 0521 236211
Telefax 0521 2362303
e-mail [email protected]
KPMG S.p.A. è una società per azioni di diritto italiano e fa parte del
network KPMG di entità indipendenti affiliate a KPMG International
Cooperative (“KPMG International”), entità di diritto svizzero.
Ancona Aosta Bari Bergamo
Bologna Bolzano Brescia Cagliari
Catania Como Firenze Genova
Lecce Milano Napoli Novara
Padova Palermo Parma Perugia
Pescara Roma Torino Treviso
Trieste Udine Varese Verona
Società per azioni
Capitale sociale
Euro 8.128.900,00 i.v.
Registro Imprese Milano e
Codice Fiscale N. 00709600159
R.E.A. Milano N. 512867
Partita IVA 00709600159
VAT number IT00709600159
Sede legale: Via Vittor Pisani, 25
20124 Milano MI ITALIA
(Translation from the Italian original which remains the definitive version)
Auditors’ report on review of condensed interim consolidated financial statements
To the shareholders of
Landi Renzo S.p.A.
1 We have reviewed the condensed interim consolidated financial statements of the Landi
Renzo Group as at and for the six months ended 30 June 2012, comprising the statement
of financial position, statement of comprehensive income, statement of changes in equity,
statement of cash flows and notes thereto. The parent’s directors are responsible for the
preparation of these condensed interim consolidated financial statements in accordance
with the International Financial Reporting Standard applicable to interim financial
reporting (IAS 34), endorsed by the European Union. Our responsibility is to prepare this
report based on our review.
2 We conducted our review in accordance with Consob (the Italian Commission for Listed
Companies and the Stock Exchange) guidelines set out in Consob resolution no. 10867
dated 31 July 1997. The review consisted primarily of the collection of information about
the captions of the condensed interim consolidated financial statements and the
consistency of application of the accounting policies through discussions with parent
company directors and analytical procedures applied to the financial data presented in
such condensed interim consolidated financial statements. The review excluded such
audit procedures as tests of controls and substantive procedures on assets and liabilities
and is substantially less in scope than an audit conducted in accordance with generally
accepted auditing standards. As a consequence, contrary to our report on the annual
consolidated financial statements, we do not express an audit opinion on the condensed
interim consolidated financial statements.
With regard to the corresponding figures included in the prior year consolidated financial
statements and condensed interim consolidated financial statements, presented for
comparative purposes, reference should be made to our reports dated respectively
30 March 2012 and 28 August 2011.

Landi Renzo Group
Auditors’ report on review of condensed interim consolidated financial statements
30 June 2012
2
3 Based on our review, nothing has come to our attention that causes us to believe that the
condensed interim consolidated financial statements of the Landi Renzo Group as at and
for the six months ended 30 June 2012 have not been prepared, in all material respects, in
conformity with the International Financial Reporting Standard applicable to interim
financial reporting (IAS 34), endorsed by the European Union.
Parma, 28 August 2012
KPMG S.p.A.
(signed on the original)
Lino Barbieri
Director of Audit