hamilton niagara haldimand brant lhin 2016/2017 qip ... · health quality ontario the provincial...
TRANSCRIPT

Health Quality OntarioThe provincial advisor on the quality of health care in Ontario
Hamilton Niagara Haldimand Brant LHIN 2016/2017 QIP Snapshot Report

INTRODUCTION
1

2
Purpose• To give each Local Health Integration Network (LHIN)
a snapshot of its quality improvement efforts as reflected in the 2016/17 Quality Improvement Plans (QIPs) submitted to Health Quality Ontario by hospitals, interdisciplinary primary care organizations, community care access centres and long-term care homes
• To identify general observations, highlight areas that have shown improvement, and identify potential areas for improvement (focusing on a few indicators)

3
How This Report Should Be Used• We intend for this report to:
– Be used for discussion between the LHIN and its health service providers on successes and areas for improvement as reflected in the QIPs
– Stimulate collaboration within and among organizations across the LHIN who may be working on similar change ideas or areas for improvement
– Be used as a discussion point with the Regional Quality Tables
– Be shared with the LHIN board and/or health service provider boards in the LHIN
• This report has been produced in an editable PowerPoint format to support the above uses

4
Report StructureFor a select number of 2016/17 QIP indicators, this report will summarize:
1. Quantitative data, including:• Current performance and indicator selection• Progress made on 2015/16 QIPs
2. Qualitative data, including: • Change ideas and partnerships• Barriers and challenges• Success stories
For more information about these and other indicators, please visit the Health Quality Ontario website to access the publicly posted QIPs (Sector QIP) or search the QIP database (QIP Query)

5
Rationale for Selected IndicatorsThis snapshot provides information on priority indicators that require collaboration and integration across sectors
Hospital• 30-Day Readmissions for Select HBAM Inpatient Groupers• 30-Day Readmissions for Select Quality-Based Procedure (QBP) Cohorts (Chronic
Obstructive Pulmonary Disease, Stroke, Congestive Heart Failure)• Alternative Level of Care Rate
Primary care• 7-Day Post-Discharge Follow-up• Timely Access to Primary Care• Hospital Readmissions for Primary Care Patients
Community care• Hospital Readmissions for Community Care Access Centre (CCAC) Clients
Long-term care (LTC)• Emergency Department Visits for Ambulatory Care−Sensitive Conditions
For more information about these QIP
indicators, see the 2016/17 QIP indicator technical specification
document

6
Sector QIP Count DescriptionHospitals 9 • 4 large community hospitals
• 2 small community hospitals• 2 acute teaching hospitals• 1 CCC & Rehab
Primary Care 23 • 15 Family Health Teams• 7 Community Health Centres• 1 Aboriginal Health Access Centre
Community 1 • CCAC
Long-Term Care 85 • 47 for-profit• 24 not-for-profit• 14 municipal
Multi-sector 0
Hamilton Niagara Haldimand Brant LHIN Overview

7
Key Observations – Overarching• Reflecting back on their 2015/16 QIPs, more than 85% of
organizations reported progress on at least one priority or additional indicator, and more than half reported progress on three or more.
• There was a high uptake of priority issues in the 2016/17 QIPs, particularly patient experience and integration. – More than three-quarters (78%) of organizations described working
on at least one of the indicators related to integration.– More than 80% of organizations described working on at least one of
the indicators related to patient experience.• Most organizations set targets to improve, but many of these
targets are modest – typically within 1–5% of their current performance). – While this may be appropriate for some indicators, organizations are
encouraged to reflect on their current performance and consider whether a stretch target might be appropriate.

All sectors described an increased use of Patient and Family Advisory Councils and Forums in the
development of their QIPs
0
10
20
30
40
50
60
70
80
90
100
PER
CEN
T
SECTOR
Percentage of Organizations that reported engaging Patient Advisory Councils and Forums in development of 2015/16 QIPs and 2016/17 QIPs across all four sectors
HOSPITALS
HOMECARE
PRIMARY CARE
LONG TERM CARE
2015/162016/17
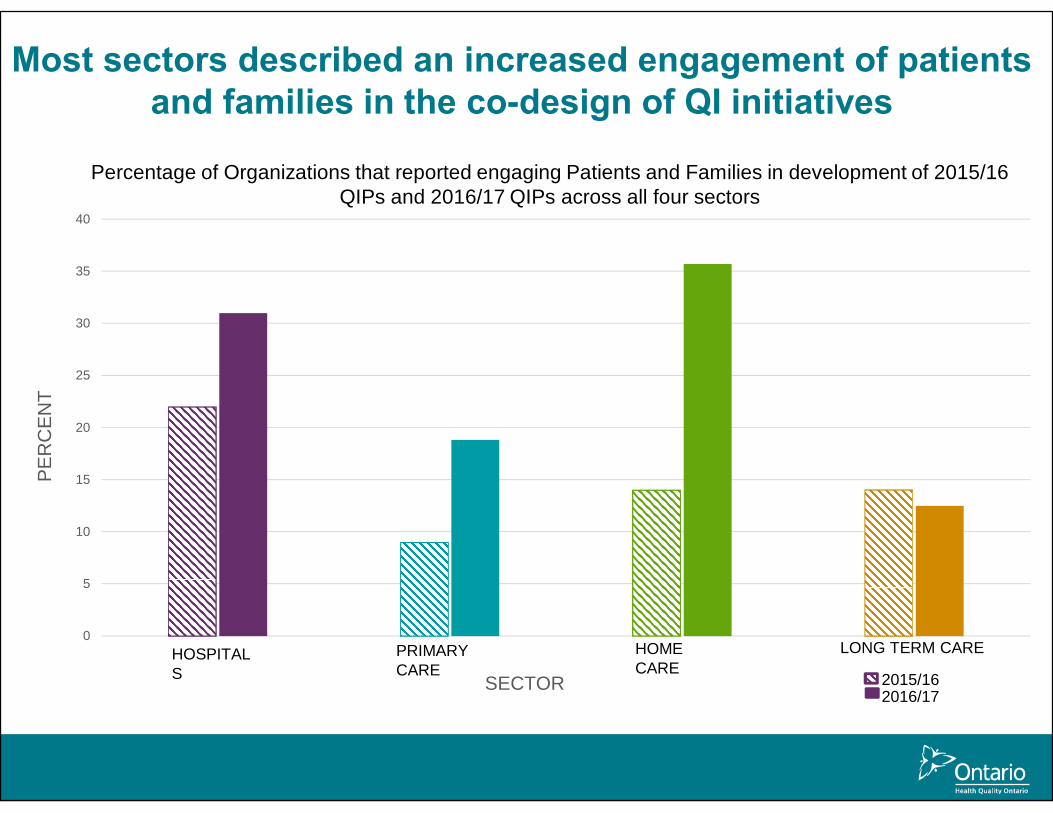
Most sectors described an increased engagement of patients and families in the co-design of QI initiatives
0
5
10
15
20
25
30
35
40
PER
CEN
T
SECTORHOSPITALS
HOMECARE
PRIMARY CARE
LONG TERM CARE
Percentage of Organizations that reported engaging Patients and Families in development of 2015/16 QIPs and 2016/17 QIPs across all four sectors
2015/162016/17

Key Observations – Per Sector• Hospitals: The area where the most hospitals reported progress was
emergency department length of stay (61% of hospitals reporting progress), followed by positive patient experience (recommend hospital; 60% of hospitals reporting progress).
• Primary care: The area where the most primary care organizations reported progress was cancer screening (65% reporting progress in colorectal cancer screening and 55% reporting progress in cervical cancer screening).
• Home care: The area where the most CCACs saw progress was related to integration issues (77% of CCACs reported progress on unplanned emergency visits and 75% of CCACs reported progress on hospital readmissions).
• Long-term care: The area where the most homes reported progress was appropriate prescribing of antipsychotics (78% of homes reporting progress).

QUALITY IMPROVEMENT PLAN DATA
11

12
Provincial Averages
23.824.6
22.0
19.618.217.2
14.3
16.8 16.2
13.8
8.7
5.0
10.0
15.0
20.0
25.0
30.0
2014/15 2015/16 2016/17
Perc
ent/
Rat
e pe
r 100
Fiscal Year
Ontario provincial averages (%) for selected integration indicators across sectors*, QIP 2014/15−QIP 2016/17
Potentially Avoidable EmergencyDepartment Visits for Long-TermCare Residents
Risk-Adjusted 30-Day All-CauseReadmission Rate for Patients withCongestive Heart Failure
Risk-Adjusted 30-Day All-CauseReadmission Rate for Patients withChronic Obstructive PulmonaryDiseaseHospital Readmissions for CCACs
Readmission Within 30 Days forSelected HBAM Inpatient Grouper
Alternative Level of Care Rate—Acute
Risk-Adjusted 30-Day All-CauseReadmission Rate for Patients withStroke
Better performance
*Data were obtained from external sources, and indicators presented in the graph are risk-unadjusted unless specified otherwise. Potentially avoidable ED visits for long-term care residents has a unit of rate per 100 long-term care residents; all other indicators have a unit of percent. Provincial average data were not available for primary care organization indicators from external data sources and are not presented in this graph.Data sourcesPotentially Avoidable Emergency Department Visits for Long-term Care Residents: Canadian Institute for Health Information. Risk-Adjusted 30-Day All-Cause Readmission Rate for Patients with Congestive Heart Failure; Risk-Adjusted 30-Day All-Cause Readmission Rate for Patients with Chronic Obstructive Pulmonary Disease, Readmission Within 30 Days for Selected HBAM Inpatient Groupers, Risk-Adjusted 30-Day All-Cause Readmission Rate for Patients with Stroke: Canadian Institute for Health Information, Discharge Abstract Database.Hospital Readmissions for CCAC: Home Care Database, Canadian Institute for Health Information, Discharge Abstract Database, National Ambulatory Care Reporting System.Alterna�ve Level of Care Rate−Acute: Cancer Care Ontario, Wait Time Informa�on System.

13
Ontario QIP Data: Progress Made in 2016/17
This graph represents organizations that selected the indicator in their 2015/16 and 2016/17 QIPs, comparing their current performance from both years, as reported in the 2016/17 QIP Progress Report. The numbers represent the original definitions of the indicators only.
41.0%
75.0%
37.2%
28.2%
39.7%
48.6%
8.3%
5.5%
53.1%
16.7%
30.3%
42.5%
46.2%
36.5%
5.5%
26.9%
23.8%
13.7%
13.5%
0.0% 20.0% 40.0% 60.0% 80.0% 100.0%
Potentially Avoidable Emergency Department Visits for Long-Term CareResidents (n=420)
Hospital Readmissions for CCAC (n=12)
Hospital Readmission Rate for Primary Care Patient Population (n=145)
7-Day Post-Hospital Discharge Follow-Up Rate for Selected Conditions(n=273)
Timely Access to a Primary Care Provider (n=277)
Readmission Within 30 Days for Selected HBAM Inpatient Grouper(n=74)
Percent
Sele
cted
Inte
grat
ion
Indi
cato
rs
Looking back: Percentage of organizations in Ontario that progressed, maintained or worsened their performance between the 2015/16 QIP and the 2016/17 QIP on
selected integration indicators, as reported in the QIP 2016/17 Progress Report
Progressed Maintained Worsened 2015/16 or 2016/17 Performance—N/A

Hamilton Niagara Haldimand Brant LHIN QIP Data: Progress Made in 2016/17
The graph represents organizations that selected the indicator in their 2015/16 and 2016/17 QIPs, comparing the current performance (CP) from both years, as reported in 2016/17 QIP Progress Report. The numbers represent the original definitions of the indicators only. The number of organizations in each LHIN may be small; please consider the sample size (n) of each indicator when interpreting the data presented – for example, there is only one CCAC per LHIN, so interpret data with caution.
14
34.4%
63.6%
42.9%
40.9%
50.0%
1.6%
18.2%
14.3%
60.7%
18.2%
33.3%
45.5%
25.0%
3.3%
9.5%
13.6%
25.0%
0.0% 20.0% 40.0% 60.0% 80.0% 100.0%
Potentially Avoidable Emergency Department Visits for Long-Term CareResidents (n=61)
Hospital Readmission Rate for Primary Care Patient Population (n=11)
7-Day Post-Hospital Discharge Follow-Up Rate for Selected Conditions(n=21)
Timely Access to a Primary Care Provider (n=22)
Readmission Within 30 Days for Selected HBAM Inpatient Grouper(n=4)
Percent
Sele
cted
Inte
grat
ion
Indi
cato
rs
Looking back: Percentage of organizations in Hamilton Niagara Haldimand Brant LHIN that progressed, maintained or worsened in their performance between the
2015/16 QIP and the 2016/17 QIP on selected integration indicators, as reported in the QIP 2016/17
Progressed Maintained Worsened 2015/16 or 2016/17 Performance—N/A

Hamilton Niagara Haldimand Brant LHIN QIP Data: Target Setting in 2016/17
15
The graph represents organizations that selected the indicator in their 2016/17 QIPs, comparing the Current Performance (CP) from 2016/17 to Target Performance (TP) in 2016/17, as reported in 2016/17 QIP Workplan. The numbers represent the original definitions of the indicators only. The number of organizations in each LHIN may be small; please consider the sample size (n) of each indicator when interpreting the data presented – for example, there is only one CCAC per LHIN, so interpret data with caution.
94.4%
81.8%
90.0%
85.0%
100.0%
75.0%
100.0%
5.6%
9.1%
10.0%
10.0%
9.1%
5.0%
25.0%
0.0% 20.0% 40.0% 60.0% 80.0% 100.0%
Potentially Avoidable ED Visits for Long-Term Care Residents (n=54)
Hospital Readmission Rate for Primary Care Patient Population (n=11)
7-Day Post-Hospital Discharge Follow-Up Rate for Selected Conditions (n=20)
Timely Access to a Primary Care Provider (n=20)
30-Day All-Cause Readmission Rate for Patients with CHF (n=1)
Readmission Within 30 Days for Selected HBAM Inpatient Grouper (n=4)
Alternative Level of Care Rate—Acute (n=3)
Percent
Sele
cted
Inte
grat
ion
Indi
cato
rs
Looking forward: Percentage of organizations in Hamilton Niagara Haldimand Brant LHIN that set a target to improve, maintain or worsen performance in the 2016/17
QIP on selected integration indicators, as reported in the 2016/17 QIP Workplan
Improvement Maintainance Retrograde Target
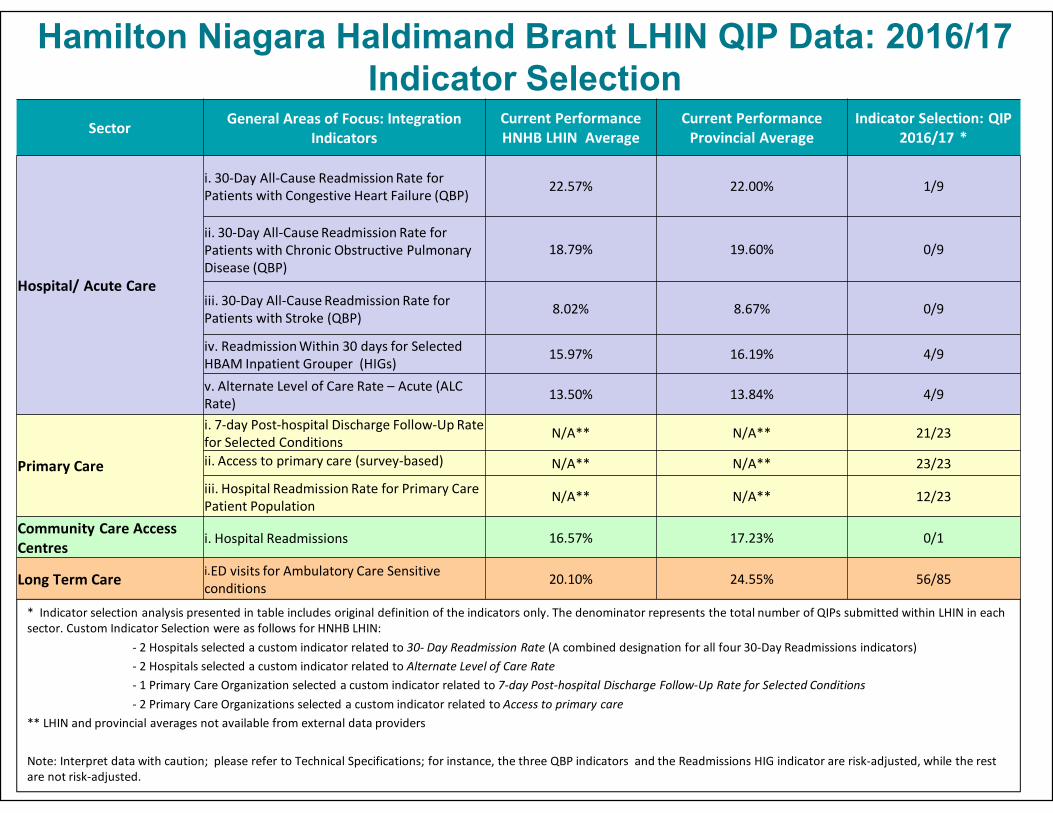
Hamilton Niagara Haldimand Brant LHIN QIP Data: 2016/17 Indicator Selection
Sector General Areas of Focus: Integration Indicators
Current Performance HNHB LHIN Average
Current Performance Provincial Average
Indicator Selection: QIP 2016/17 *
Hospital/ Acute Care
i. 30-Day All-Cause Readmission Rate for Patients with Congestive Heart Failure (QBP) 22.57% 22.00% 1/9
ii. 30-Day All-Cause Readmission Rate for Patients with Chronic Obstructive Pulmonary Disease (QBP)
18.79% 19.60% 0/9
iii. 30-Day All-Cause Readmission Rate for Patients with Stroke (QBP) 8.02% 8.67% 0/9
iv. Readmission Within 30 days for Selected HBAM Inpatient Grouper (HIGs)
15.97% 16.19% 4/9
v. Alternate Level of Care Rate – Acute (ALC Rate) 13.50% 13.84% 4/9
Primary Care
i. 7-day Post-hospital Discharge Follow-Up Rate for Selected Conditions N/A** N/A** 21/23
ii. Access to primary care (survey-based) N/A** N/A** 23/23
iii. Hospital Readmission Rate for Primary Care Patient Population
N/A** N/A** 12/23
Community Care Access Centres i. Hospital Readmissions 16.57% 17.23% 0/1
Long Term Care i.ED visits for Ambulatory Care Sensitive conditions 20.10% 24.55% 56/85
* Indicator selection analysis presented in table includes original definition of the indicators only. The denominator represents the total number of QIPs submitted within LHIN in each sector. Custom Indicator Selection were as follows for HNHB LHIN:
- 2 Hospitals selected a custom indicator related to 30- Day Readmission Rate (A combined designation for all four 30-Day Readmissions indicators)- 2 Hospitals selected a custom indicator related to Alternate Level of Care Rate - 1 Primary Care Organization selected a custom indicator related to 7-day Post-hospital Discharge Follow-Up Rate for Selected Conditions- 2 Primary Care Organizations selected a custom indicator related to Access to primary care
** LHIN and provincial averages not available from external data providers
Note: Interpret data with caution; please refer to Technical Specifications; for instance, the three QBP indicators and the Readmissions HIG indicator are risk-adjusted, while the rest are not risk-adjusted.

MOST COMMON CHANGE IDEAS FROM 2015/16 AND 2016/17
17

18
Common Change Ideas • The following slides show common change ideas at the
provincial level; ideas have been categorized by theme• Graphs display change ideas by indicator and show:
– The most common change ideas included in the 2016/17 QIPs (Progress Report), and a look back at progress made in implementing change ideas
– The extent to which these change ideas were also included in QIP Workplans
– LHIN-specific notes to capture regional change ideas or unique ideas in Workplans

19
* The information presented combines data submitted by organizations on the following four 30-day readmission indicators: 30-Day All-Cause Readmission Rate for Patients with Congestive Heart Failure, 30-Day All-Cause Readmission Rate for Patients with Chronic Obstructive Pulmonary Disease, 30-Day All-Cause Readmission Rate for Patients with Stroke and Readmission Within 30 Days for Selected HBAM Inpatient Groupers.
12
14
15
24
29
1
3
4
21
29
33
34
36
0 5 10 15 20 25 30 35 40
Primary Care follow up within 7 days of discharge
Patient education
Audit and feedback
Individualized coordinated care and dischargeplanning
Create partnerships with other sectors to followcomplex patients
Patient education
Primary Care follow-up within 7 days of discharge
Readmission risk assessment linked to post-discharge follow-up
Individualized coordinated care and dischargeplanning
Create partnerships with other sectors to followcomplex patients
Number of Hospitals
Chan
ge Id
eas
Most common change ideas in Ontario from 2015/16 and 2016/17 hospital QIPs for 30-Day Readmission Rate,* as reported in the 2016/17 QIPs
QIP 2016/17 Progress Report — Implemented IdeasQIP 2016/17 Progress Report — Unimplemented IdeasQIP 2016/17 Workplan — Proposed Ideas
In Hamilton Niagara Haldimand Brant LHIN, organizations are working on change ideas such as creatingpartnerships with other sectors, auditand feedback, patient education, and individualizedcare and discharge planning (based on QIP 2016/17 Workplans).
Additionallyorganizations proposed changeideas relating to referral to speciality clinicsto prevent readmission.

20
18
24
31
31
32
1
1
1
17
18
18
29
32
0 5 10 15 20 25 30 35
Health Links, or partnerships with primary care
Bed utilization management to reduce length of stay and…
Audit and feedback
CCAC "Home First" philosophy and programs
Optimal discharge—use of predictive models
Staff education
"Assess and restore" philosophy and function
CCAC "Home First" philosophy and programs
Bed utilization management to reduce length of stay and…
Optimal discharge—use of predictive models
Number of Hospitals
Chan
ge Id
eas
Most common change ideas in Ontario from 2015/16 and 2016/17 hospital QIPs for Alternative Level of Care,* as reported in the
2016/17 QIPs
QIP 2016/17 Progress Report—Implemented Ideas QIP 2016/17 Progress Report—Unimplemented Ideas
QIP 2016/17 Workplan—Proposed Ideas
* The information presented combines data submitted by organizations on the following Alternative Level of Care indicators: Alternative Level of Care Rate— Acute, and Percent Alternative Level of Care Days.
In Hamilton Niagara Haldimand Brant LHIN, organizations are working on change ideas such as bed utilization management (based on QIP 2016/17 Workplans).
Additionallyorganizations proposedchange ideas relating tosenior-friendly hospital principles.

21
In Hamilton Niagara Haldimand Brant LHIN, organizations are working on change ideas such as electronic solutions (e.g.,Hospital Report Manager), create partnerships with other sectors, Identify hospitalized patients through shared EMR with hospital, and auditand feedback (based on QIP 2016/17 Workplans).
41
64
80
107
8
11
13
18
50
51
66
83
94
0 20 40 60 80 100 120 140
Using data for improvement (audit, tracking, visual display ofdata or dashboards)
Identify hospitalized patients through shared electronicmedical record with hospital
Audit and feedback
Electronic solutions such as Hospital Report Manager
Create partnerships with other sectors
Individualized coordinated care and discharge planning withhospitals or Health Links
Using data for improvement
Electronic solutions such as Hospital Report Manager
Create partnerships with other sectors to follow complexpatients
Number of Primary Care Organizations
Chan
ge Id
eas
Most common change ideas in Ontario from 2015/16 and 2016/17 primary care QIPs for 7-Day Post-Hospital Discharge Follow-Up Rate for
Selected Conditions, as reported in the 2016/17 QIPs
QIP 2016/17 Progress Report—Implemented Ideas QIP 2016/17 Progress Report—Unimplemented Ideas
QIP 2016/17 Workplan—Proposed Ideas
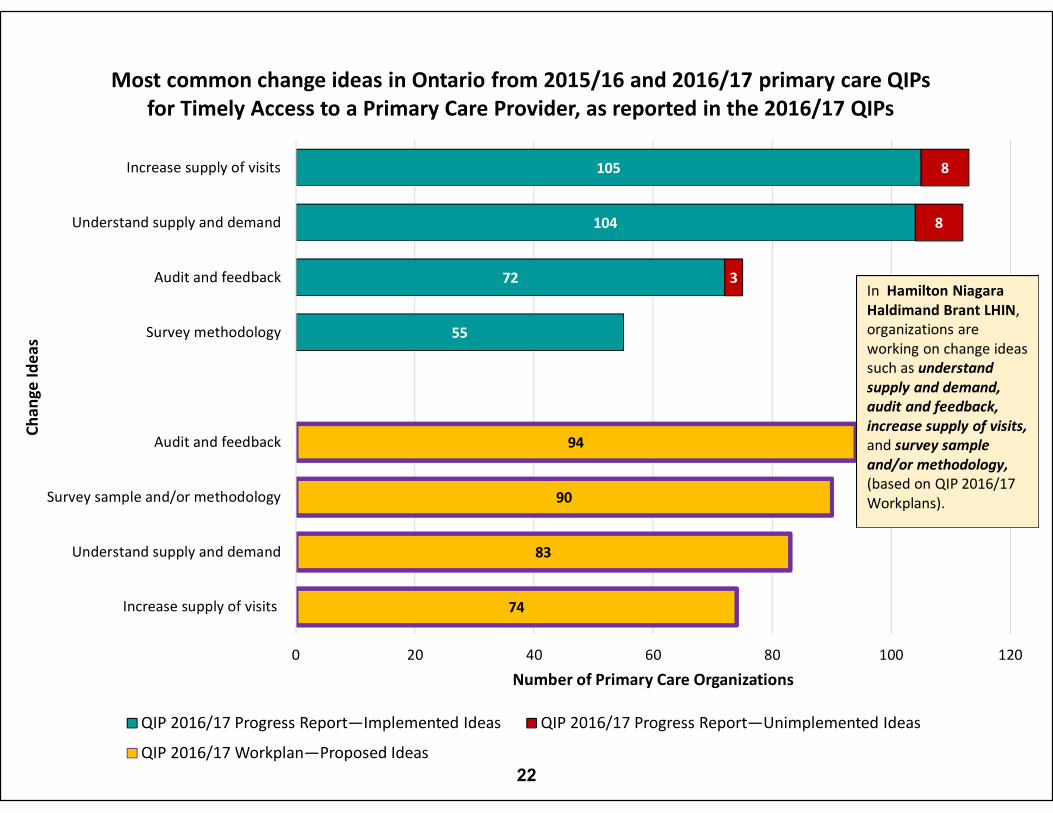
55
72
104
105
3
8
8
74
83
90
94
0 20 40 60 80 100 120
Increase supply of visits
Understand supply and demand
Survey sample and/or methodology
Audit and feedback
Survey methodology
Audit and feedback
Understand supply and demand
Increase supply of visits
Number of Primary Care Organizations
Chan
ge Id
eas
Most common change ideas in Ontario from 2015/16 and 2016/17 primary care QIPs for Timely Access to a Primary Care Provider, as reported in the 2016/17 QIPs
QIP 2016/17 Progress Report—Implemented Ideas QIP 2016/17 Progress Report—Unimplemented Ideas
QIP 2016/17 Workplan—Proposed Ideas
In Hamilton NiagaraHaldimand Brant LHIN, organizations are working on change ideas such as understand supply and demand, audit and feedback, increase supply of visits, and survey sample and/or methodology,(based on QIP 2016/17 Workplans).
22

23
In Hamilton Niagara HaldimandBrant LHIN, organizations working on change ideas such as audit and feedback, assess post discharge risk for readmission, activate appropriate community follow up, and technology enablers like telehomecare/ telemonitoring(based on QIP 2016/17 Workplans).
Additionally organizations proposed change ideas relating to the use of specialized teams like palliative teams/ mental health services to prevent readmissions.
15
16
19
14
18
20
23
35
1
1
6
3
3
3
4
13
13
17
24
24
28
0 5 10 15 20 25 30 35 40 45
Assess post-discharge risk for readmission
Coordinated care plans
Technology enablers like telehomecare, telemonitoring
Working with hospitals
Audit and feedback
Activate appropriate community follow-up
Working with hospitals
Refer complex patients to Health Links
Enhanced care coordination in primary care
Technology enablers like telehomecare, telemonitoring
Assess post-discharge risk for readmission
Audit and feedback
Coordinated care plans
Activate appropriate community follow-up
Number of Primary Care Organizations
Chan
ge Id
eas
Most common change ideas in Ontario from 2015/16 and 2016/17 primary care QIPs for Readmission Within 30 Days for Selected HBAM Inpatient Groupers, as reported in
the 2016/17 QIPs
QIP 2016/17 Progress Report—Implemented Ideas QIP 2016/17 Progress Report—Unimplemented Ideas
QIP 2016/17 Workplan—Proposed Ideas

24
5
5
7
9
2
2
2
5
6
7
0 2 4 6 8 10
Rapid Response Nursing program for complex patients
Spreading quality initiatives
Technology like telehomecare and emergency medical service systems
Audit and feedback
Assess post-discharge risk and activate appropriate community follow-up
Refer complex patients to health links or integrated funding model
Refer complex patients to health links or integrated funding models.
Technology enablers like telehomecare
Use of specialized teams like palliative and outreach teams
Assess post-discharge risk and activate appropriate community follow-up
Number of Community Care Access Centres
Chan
ge Id
eas
Most common change ideas in Ontario from 2015/16 and 2016/17 QIPs for Hospital Readmissions for Community Care Access Centres, as reported in the 2016/17 QIPs
QIP 2016/17 Progress Report—Implemented Ideas QIP 2016/17 Workplan—Proposed Ideas
25
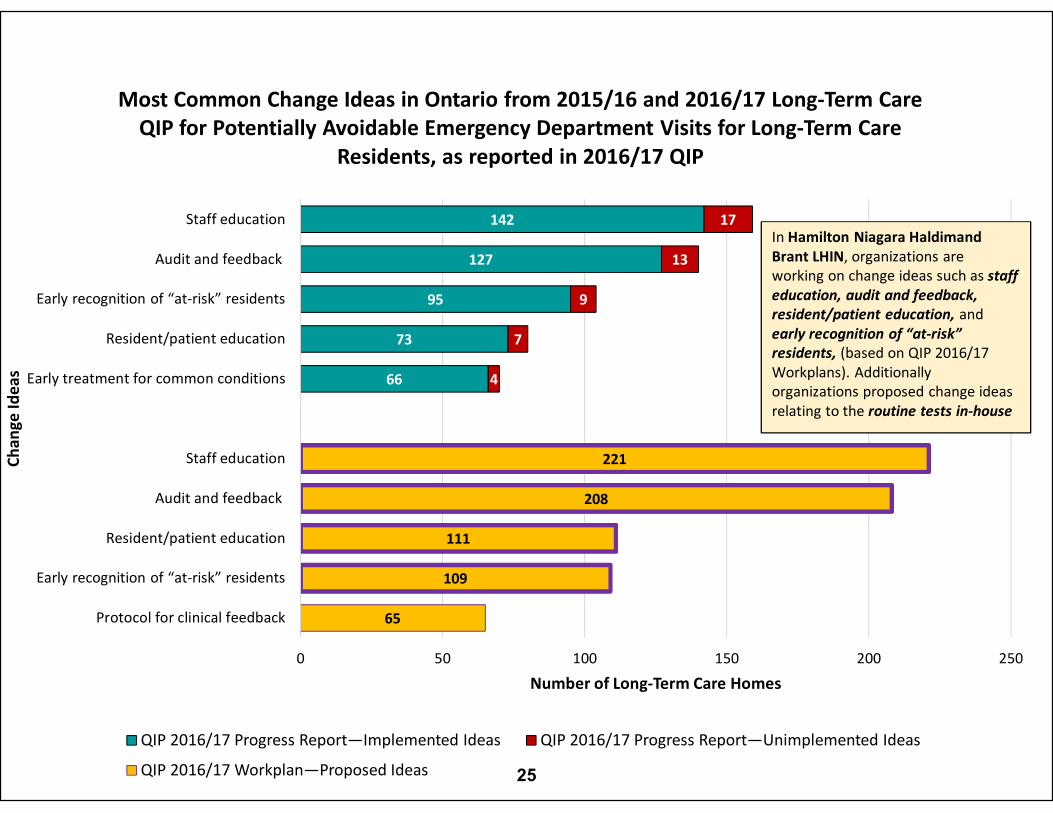
66
73
95
127
142
4
7
9
13
17
65
109
111
208
221
0 50 100 150 200 250
Protocol for clinical feedback
Early recognition of “at-risk” residents
Resident/patient education
Audit and feedback
Staff education
Early treatment for common conditions
Resident/patient education
Early recognition of “at-risk” residents
Audit and feedback
Staff education
Number of Long-Term Care Homes
Chan
ge Id
eas
Most Common Change Ideas in Ontario from 2015/16 and 2016/17 Long-Term Care QIP for Potentially Avoidable Emergency Department Visits for Long-Term Care
Residents, as reported in 2016/17 QIP
QIP 2016/17 Progress Report—Implemented Ideas QIP 2016/17 Progress Report—Unimplemented Ideas
QIP 2016/17 Workplan—Proposed Ideas
In Hamilton Niagara HaldimandBrant LHIN, organizations are working on change ideas such as staff education, audit and feedback, resident/patient education, and early recognition of “at-risk” residents, (based on QIP 2016/17 Workplans). Additionally organizations proposed change ideas relating to the routine tests in-house

SPOTLIGHTS
26
27
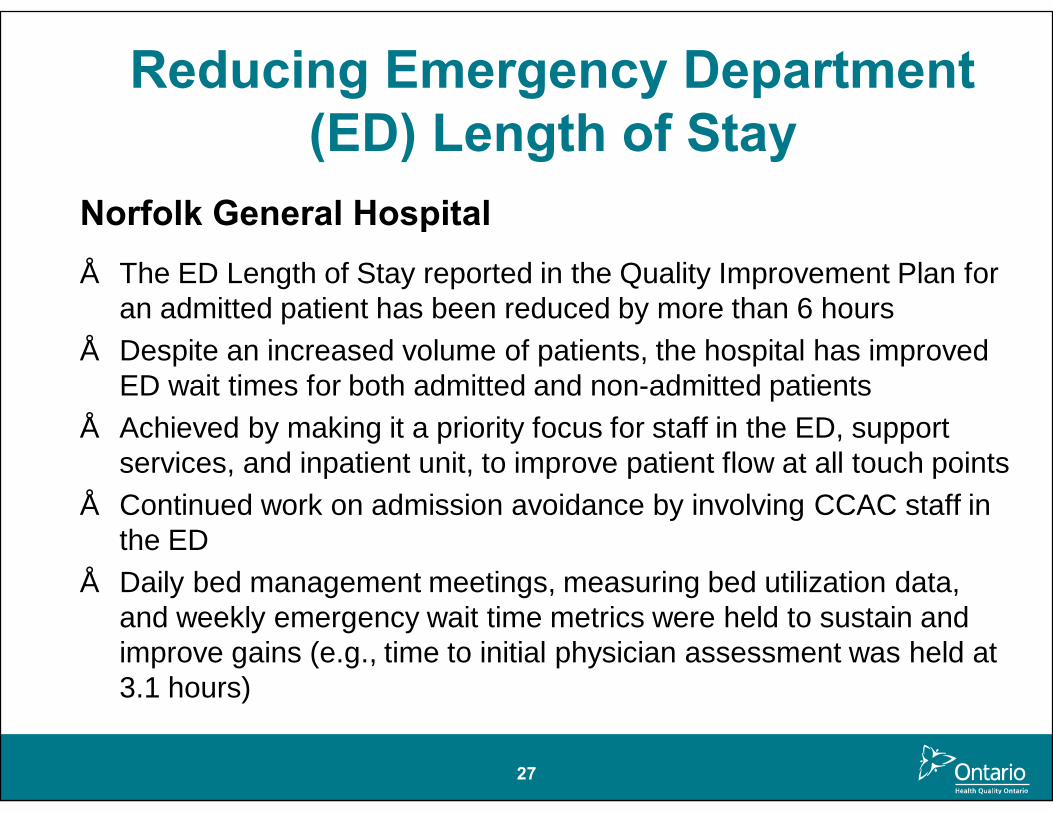
Reducing Emergency Department (ED) Length of Stay
Norfolk General Hospital• The ED Length of Stay reported in the Quality Improvement Plan for
an admitted patient has been reduced by more than 6 hours• Despite an increased volume of patients, the hospital has improved
ED wait times for both admitted and non-admitted patients• Achieved by making it a priority focus for staff in the ED, support
services, and inpatient unit, to improve patient flow at all touch points• Continued work on admission avoidance by involving CCAC staff in
the ED• Daily bed management meetings, measuring bed utilization data,
and weekly emergency wait time metrics were held to sustain and improve gains (e.g., time to initial physician assessment was held at 3.1 hours)

28
Improving 7-Day Follow-Up Post-Discharge
Bridges Community Health• Improved primary care follow-up within 7 days of
discharge from hospital from 18.8% in 2012 to 30.8% in 2014, which is 4% higher than the Ontario average (based on March 31, 2014 Practice Profile report)
• The team continues to make strides in improving the performance of this indicator
• Access to Clinical Connect over the past year has made a significant and positive difference for the team
29
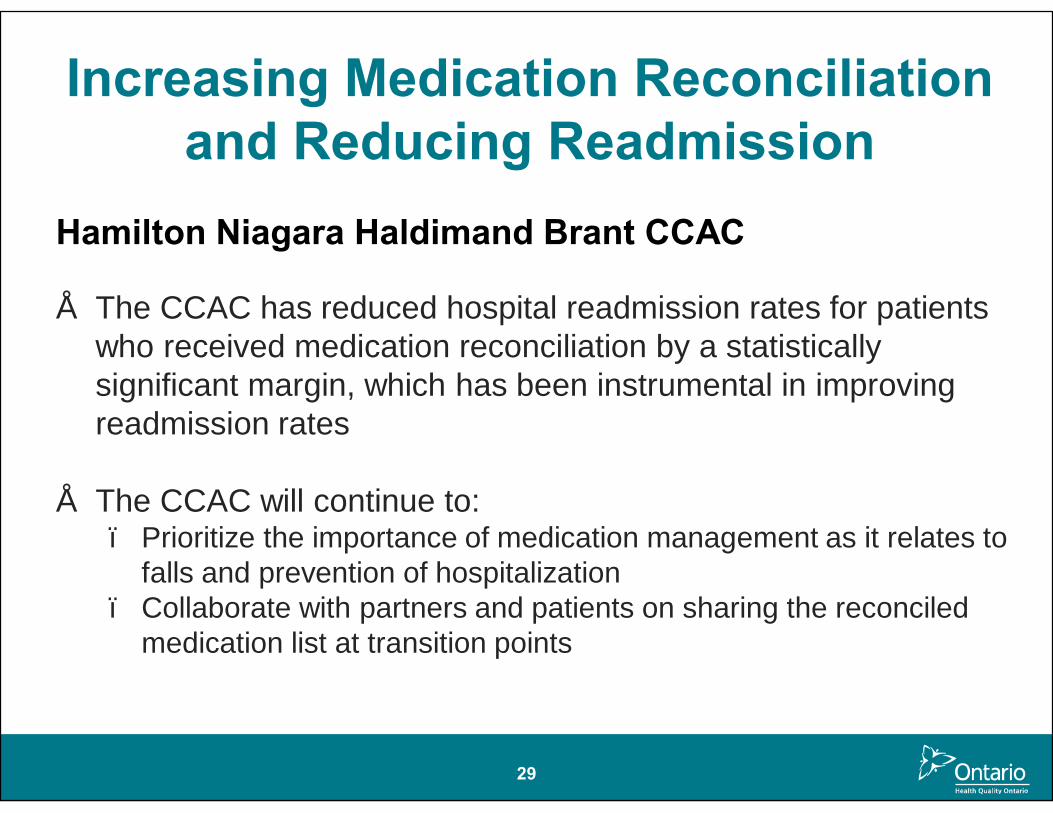
Increasing Medication Reconciliation and Reducing Readmission
Hamilton Niagara Haldimand Brant CCAC
• The CCAC has reduced hospital readmission rates for patients who received medication reconciliation by a statistically significant margin, which has been instrumental in improving readmission rates
• The CCAC will continue to: – Prioritize the importance of medication management as it relates to
falls and prevention of hospitalization– Collaborate with partners and patients on sharing the reconciled
medication list at transition points

30
Reducing Emergency Department (ED) Visits
Billings Court Manor (Long-Term Care Home)• Building staff capacity has improved the team’s ability to
manage many complex care cases without the need for an ED visits
• The main contributor to the success in this area is the culture within the home, which is led by the physicians, ownership, and staff
• The home actively promotes its ability to manage residents within its care team and encourages families to think deeply about what unnecessary transfers to the ED, invasive procedures, and unfamiliar care teams can have on residents from long-term care homes—especially residents with dementia/Alzheimer's disease

31
Reducing ED Visits• Billings Court Manor: Building staff capacity has improved
their preparedness to manage complex care cases that have warranted an ER visit.
• However, the culture within the home, which is led by the medical team of physicians, ownership and staff is the main contributor to the success within this area.
• The Home actively promotes its capability to manage residents within its care team and encourages families to think deeply about what unnecessary transfers to the ER, invasive procedures and unfamiliar care teams can have on residents from long term care homes, especially residents with dementia/Alzheimer's disease
32
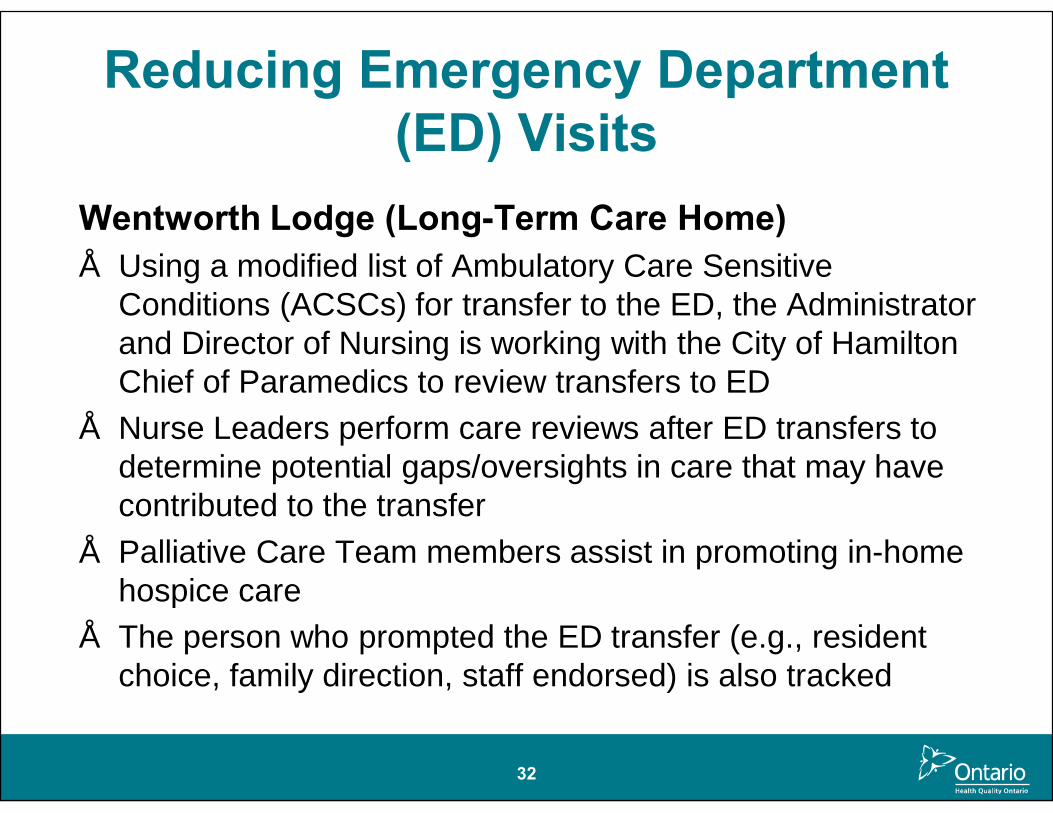
Reducing Emergency Department (ED) Visits
Wentworth Lodge (Long-Term Care Home)• Using a modified list of Ambulatory Care Sensitive
Conditions (ACSCs) for transfer to the ED, the Administrator and Director of Nursing is working with the City of Hamilton Chief of Paramedics to review transfers to ED
• Nurse Leaders perform care reviews after ED transfers to determine potential gaps/oversights in care that may have contributed to the transfer
• Palliative Care Team members assist in promoting in-home hospice care
• The person who prompted the ED transfer (e.g., resident choice, family direction, staff endorsed) is also tracked

DISCUSSION
33
34
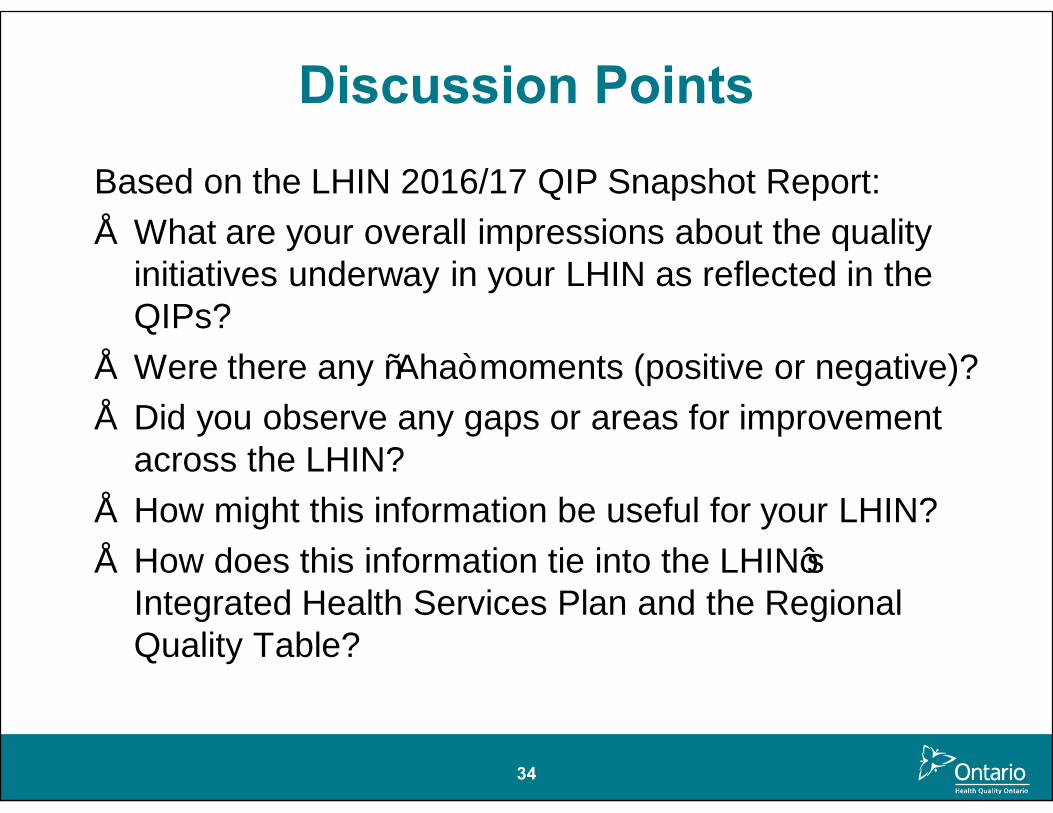
Discussion PointsBased on the LHIN 2016/17 QIP Snapshot Report:• What are your overall impressions about the quality
initiatives underway in your LHIN as reflected in the QIPs?
• Were there any “Aha” moments (positive or negative)?• Did you observe any gaps or areas for improvement
across the LHIN?• How might this information be useful for your LHIN?• How does this information tie into the LHIN’s
Integrated Health Services Plan and the Regional Quality Table?

www.HQOntario.ca
FOLLOW@HQOntario