hampton roads real estate markets sentiment …...primary hampton roads real estate activity: fall...
TRANSCRIPT

HAMPTON ROADS REAL ESTATE MARKETS SENTIMENT SURVEY: FALL 2015created and collected by the E.V. Williams Center for Real Estate
Sponsored by Valbridge Property Advisors

Q.1. Please identify your primary Hampton Roads
real estate activity (select one).
0% 5% 10% 15% 20% 25% 30%
Consumer-agriculture property
Consumer- commercial property
Consumer - homeowner or renter
Consumer - industrial property
Entrepreneurial (Developing)
Governing
Investing
Lending
Professional - appraiser
Professional - architect
Professional - broker/sales
Professional - civil engineer
Professional - consultant
Professional - law
Professional - property management
Successor entrepreneurial
None of the above. Please explain below
Percentage of Participants
Real Est
ate
Acti
vit
y
Primary Hampton Roads Real Estate Activity: Fall 2015 n = 127
Source: E.V. Williams Center for Real Estate and the Bureau of Labor Statistics

Q.2. Please identify a secondary Hampton Roads real
estate activity, if you have one (select one).
0% 5% 10% 15% 20% 25% 30% 35%
Consumer-agriculture property
Consumer- commercial property
Consumer - homeowner or renter
Consumer - industrial property
Entrepreneurial (Developing)
Governing
Investing
Lending
Professional - appraiser
Professional - architect
Professional - broker/sales
Professional - civil engineer
Professional - consultant
Professional - law
Professional - property management
Successor entrepreneurial
None of the above. Please explain below
I do not have a secondary real estate activity
Percentage of Participants
Real Est
ate
Acti
vit
y
Secondary Hampton Roads Real Estate Activity: Fall 2015n = 127
Source: E.V. Williams Center for Real Estate and the Bureau of Labor Statistics

Q.3. Please identify your primary real estate market
affiliation (select one).
0% 5% 10% 15% 20% 25% 30%
Agriculture
Industrial
Land
Multi-family residential
Office
Retail
Single-family residential
No response
Percentage of Participants
Ham
pto
n R
oads
Real Est
ate
Mark
ets
Primary Market Affiliation: Fall 2015 n = 127
Source: E.V. Williams Center for Real Estate and the Bureau of Labor Statistics

Q.4 and 5. Please rate current and anticipated 6
month sentiment levels for the following Hampton
Roads real estate market segments.
1 2 3 4 5
Agriculture
Industrial
Land
Multi-family residential
Office
Retail
Single-family residential
Overall Average
Sentiment Level
Ham
pto
n R
oad
s R
eal E
stat
e M
arke
ts
Average Sentiment - Present and 6 Month Projection: Fall 2015n = 127
Avg. Current Sentiment
Avg. 6 mo. Sentiment Projection
Negative Mild Negative Neutral Mild Positive Positive
Source: E.V. Williams Center for Real Estate and the Bureau of Labor Statistics

Q.6. Over the next 6 months, which Hampton Roads
real estate property sector has the best investment
potential (select one).
0% 10% 20% 30% 40% 50% 60%
Agriculture
Land
Retail
Office
Single-family residential
Industrial
No Opinion
Multi-family residential
Percentage of Participants
Real Est
ate
Mark
et
Segm
ents
Best Hampton Roads Investment Potential Over Next 6 Months: Fall 2015 n = 127
Source: E.V. Williams Center for Real Estate and the Bureau of Labor Statistics
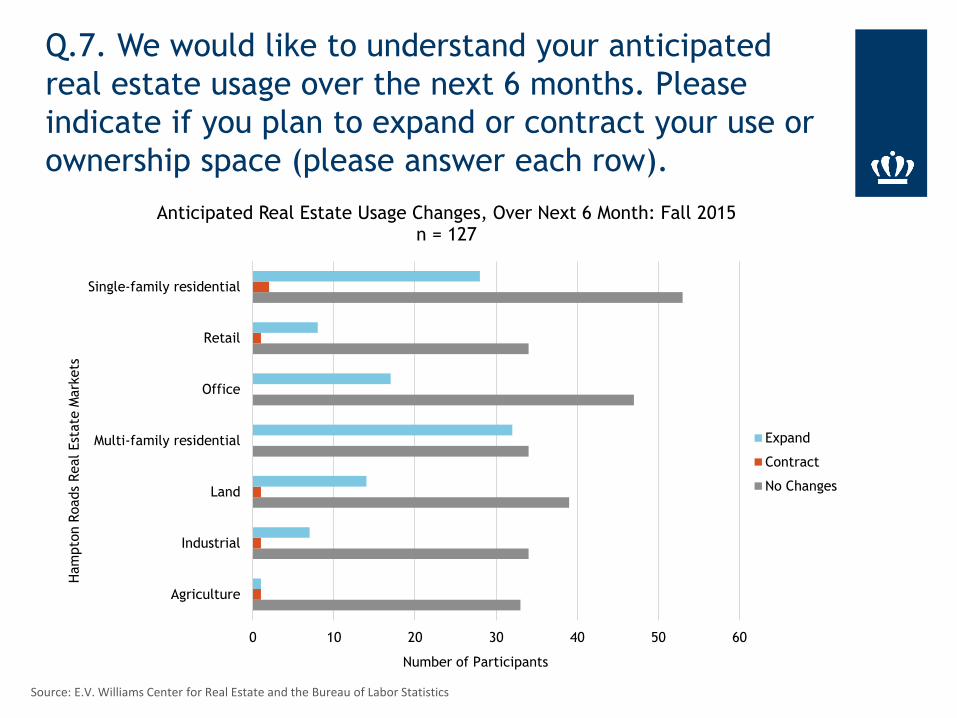
Q.7. We would like to understand your anticipated
real estate usage over the next 6 months. Please
indicate if you plan to expand or contract your use or
ownership space (please answer each row).
0 10 20 30 40 50 60
Agriculture
Industrial
Land
Multi-family residential
Office
Retail
Single-family residential
Number of Participants
Ham
pto
n R
oads
Real Est
ate
Mark
ets
Anticipated Real Estate Usage Changes, Over Next 6 Month: Fall 2015 n = 127
Expand
Contract
No Changes
Source: E.V. Williams Center for Real Estate and the Bureau of Labor Statistics

Q.8. Over the next 6 months, what is your
expectation for the change in general mortgage
interest rates (select one).
0% 10% 20% 30% 40% 50% 60% 70%
Decreasing
No Change
Increasing
Percentage of Participants
Change E
xpecta
tion
Expected Change of Mortgage Interest Rates Over Next 6 Months: Fall 2015 n = 127
Source: E.V. Williams Center for Real Estate and the Bureau of Labor Statistics

Q.9. Please choose the statement below which best
reflects the impact of sea-level rise and your
Hampton Roads real estate interests (select one).
0% 5% 10% 15% 20% 25% 30% 35% 40%
No impact
Minimal impact
Moderate impact
Severe impact
Percentage of Participants
Level of
Impact
Impact of Sea-level Rise on Personal Hampton Roads Real Estate Interests: Fall 2015
n = 127
Source: E.V. Williams Center for Real Estate and the Bureau of Labor Statistics

Recognition and thank you! The EV Williams Center for Real Estate would like to thank the volunteer
participants of this survey. This survey would not be possible without
your support.
The EV Williams Center for Real Estate would like to thank Valbridge
Property Advisors for financial support to conduct this survey.
Finally, the EV Williams Center for Real Estate would like to thank the
Hampton Roads Sentiment Survey Advisory Subcommittee for
technical advice and editing, interpretation of results, and
recommendations for the future direction of the HR Sentiment Survey.
The Hampton Roads Sentiment Survey Advisory Subcommittee consists
of the following EV Williams for Real Estate Center members?
Larry Colorito, Subcommittee Chair
Member 1
Member 2
Member 3
Member 4

HAMPTON ROADS REAL ESTATE MARKETS SENTIMENT SURVEY: FALL 2015created and collected by the E.V. Williams Center for Real Estate
Sponsored by Valbridge Property Advisors