handbook of nutraceuticals scale-up, processing and
TRANSCRIPT

This article was downloaded by: 10.3.98.104On: 02 Apr 2022Access details: subscription numberPublisher: CRC PressInforma Ltd Registered in England and Wales Registered Number: 1072954 Registered office: 5 Howick Place, London SW1P 1WG, UK
Handbook of NutraceuticalsScale-Up, Processing and AutomationYashwant Pathak
LiquidLiquid Extraction and Adsorption Applied to theProcessing of Nutraceuticals and Functional Foods
Publication detailshttps://www.routledgehandbooks.com/doi/10.1201/b10912-4
Antonio J. A. Meirelles, Eduardo A. C. Batista, Mariana C. Costa, MarceloLanzaPublished online on: 16 May 2011
How to cite :- Antonio J. A. Meirelles, Eduardo A. C. Batista, Mariana C. Costa, Marcelo Lanza.16 May 2011, LiquidLiquid Extraction and Adsorption Applied to the Processing of Nutraceuticals andFunctional Foods from: Handbook of Nutraceuticals, Scale-Up, Processing and Automation CRC PressAccessed on: 02 Apr 2022https://www.routledgehandbooks.com/doi/10.1201/b10912-4
PLEASE SCROLL DOWN FOR DOCUMENT
Full terms and conditions of use: https://www.routledgehandbooks.com/legal-notices/terms
This Document PDF may be used for research, teaching and private study purposes. Any substantial or systematic reproductions,re-distribution, re-selling, loan or sub-licensing, systematic supply or distribution in any form to anyone is expressly forbidden.
The publisher does not give any warranty express or implied or make any representation that the contents will be complete oraccurate or up to date. The publisher shall not be liable for an loss, actions, claims, proceedings, demand or costs or damageswhatsoever or howsoever caused arising directly or indirectly in connection with or arising out of the use of this material.

Dow
nloa
ded
By:
10.
3.98
.104
At:
17:5
3 02
Apr
202
2; F
or: 9
7814
3982
3705
, cha
pter
3, 1
0.12
01/b
1091
2-4
53
3Chapter
Liquid–Liquid extraction and adsorption applied to the processing of
Nutraceuticals and Functional Foods
Antonio J. A. Meirelles, Eduardo A. C. Batista, Mariana C. Costa, and Marcelo Lanza
CoNteNts
3.1 Introduction ....................................................................................................543.2 Processing of Functional Foods and Recovery of Nutraceutical
Compounds by Liquid–Liquid Extraction or Adsorption............................... 553.2.1 Liquid–Liquid Extraction ................................................................... 55
3.2.1.1 Liquid–Liquid Equilibrium Diagrams for Oil Deacidification and the Recovery of Nutraceuticals............ 57
3.2.1.2 Continuous Deacidification of Edible Oils by Liquid–Liquid Extraction .................................................................64
3.2.1.3 Patents on Oil Processing by Liquid–Liquid Extraction ..... 673.2.2 Adsorption ..........................................................................................68
3.3 Fundamentals of Liquid–Liquid Extraction Applied to the Processing of Functional Foods ........................................................................................ 723.3.1 Liquid–Liquid Equilibrium Diagrams for Fatty Systems .................. 723.3.2 Liquid–Liquid Extraction Equipment ................................................. 74
3.3.2.1 Equipment for Stagewise Contact ........................................ 743.3.2.2 Equipment for Continuous Contact...................................... 753.3.2.3 Centrifugal Extractors ......................................................... 76
3.3.3 Mass Transfer Equations and the Types of Extraction ....................... 763.3.3.1 Single-Stage Equilibrium Extraction ................................... 783.3.3.2 Continuous Multistage Countercurrent Extractor ................80
3.3.4 Retention of Nutraceuticals in the Deacidification of Vegetable Oils by Liquid–Liquid Extraction ...................................................... 81
3.4 Fundamentals of Adsorption Applied to the Recovery of Nutraceuticals ......853.4.1 Phase Equilibrium in Adsorptive Processes .......................................86

Dow
nloa
ded
By:
10.
3.98
.104
At:
17:5
3 02
Apr
202
2; F
or: 9
7814
3982
3705
, cha
pter
3, 1
0.12
01/b
1091
2-4
54 Handbook of nutraceuticals: Volume ii
3.1 INtroduCtIoN
Food processing involves a series of mass and heat transfer steps performed with the aims of obtaining the crude product, eliminating undesirable components present in this product, and pasteurizing or sterilizing it, so that the final product becomes appropriate for storage and human consumption. Several of these steps are carried out under conditions of high temperature that can diminish the nutritional value of the end product, either by thermal degradation or by evaporation of nutraceutical compounds.
A typical example is the refining of palm oil, an edible oil that, in its crude form, is rich in carotenes, tocopherols, and tocotrienols. When submitted to the extreme temperature conditions of the so-called physical refining process, carotenes are thermally degraded, and significant amounts of tocopherols and tocotrienols are evaporated. Recent estimations reported in the literature indicated that the amount of carotenes degraded worldwide every day during palm oil refining corresponds to the suggested daily intake of vitamin A for the whole world population (Mayamol et al. 2007).
In fact, losses of nutraceutical components occur in the refining of most edible oils, even in the case of chemical treatment, a purification process usually carried out under milder temperature conditions compared with physical refining. For example, crude rice bran oil contains large amounts of γ-oryzanol (0.9%–2.9%), a valuable antioxidant, but the corresponding final product, refined by the chemical method, contains less than 0.2% (Orthoefer 1996).
The loss of nutraceuticals represents a significant drawback of the traditional purification procedures for oil refining, especially from a nutritional point of view. These minor components certainly enhance the nutritional value of the final prod-uct, but their presence in the refined product is sometimes not desired, especially in the case of widespread industrial use in food formulations. This is exactly the case for palm oil, given that its natural color, caused by the carotene content, should be avoided in those fractions used as food constituents. Although the increasing con-sumer interest in healthy foodstuffs may diminish the pressure for refined oils and fatty products with a light yellow color, almost colorless fatty fractions will still be favored by the industry in the formulation of food products, as is the case nowadays for the use of palm stearin as a natural trans-fatty acid–free substitute for hydroge-nated oils. Thus, the best technological option would probably be to extract and/or recover the natural antioxidants from the crude product before refining it.
This chapter is focused on the use of two different purification techniques for either recovering nutraceuticals from natural products or producing nutraceutical-rich refined foodstuffs, that is, functional foods. Liquid–liquid extraction is a technique
3.4.2 Equipment and Operation Modes ....................................................... 893.4.3 Modeling Breakthrough Curves .........................................................95
3.5 Concluding Remarks .................................................................................... 100Acknowledgments .................................................................................................. 101References .............................................................................................................. 101

Dow
nloa
ded
By:
10.
3.98
.104
At:
17:5
3 02
Apr
202
2; F
or: 9
7814
3982
3705
, cha
pter
3, 1
0.12
01/b
1091
2-4
liquid–liquid extraction and adsorption 55
based on the use of a selective solvent for extracting specific components from a liq-uid feed stream. The feasibility of its use for deacidifying crude oils without causing high losses of antioxidants has already been shown in the literature and will be dis-cussed in this chapter. Adsorption involves the selective capture of components from a fluid stream by a solid phase with a large contact surface. This technique is fre-quently suggested for recovering nutraceutical components from natural extracts.
In the next section we will review the recent literature on the use of these tech-niques for processing functional foods and recovering nutraceuticals. The third and fourth sections show the fundamentals of these purification techniques, including information on phase equilibrium, equipment and its operation, the main aspects of their design, and an evaluation of their performance.
3.2 proCessINg oF FuNCtIoNaL Foods aNd reCovery oF NutraCeutICaL CompouNds by
LIquId–LIquId extraCtIoN or adsorptIoN
3.2.1 Liquid–Liquid extraction
Liquid–liquid extraction can be used for purifying liquid foods without a loss of nutraceutical compounds, as well as for extracting those components from foods in the fluid state. Such possible applications of liquid–liquid extraction are discussed in this chapter in the context of edible oil deacidification and the recovery of nutraceu-ticals from fatty systems.
The crude oil extracted from oilseeds is a mixture of triacylglycerols, partial acylglycerols, free fatty acids, phosphatides, pigments, sterols, and tocopherols (com-pounds that present vitamin E activity) (Cheryan 1998). The usual oil extraction and refining processes involve either solid–liquid extraction or pressing, solvent stripping and recovery, degumming, dewaxing, bleaching, deacidification, and deodorization. Deacidification can be done by chemical refining, associated with caustic treat-ment, or by physical refining, associated with steam stripping. Of the whole refining sequence, the removal of free fatty acids (deacidification) is the most difficult step of the oil purification process because it normally results in losses of neutral oil and, for this reason, has the largest impact on the economic performance of the process. In physical refining the deacidification step is performed by stripping with direct steam injection and is carried out under extreme conditions of temperature (463.15–543.15 K) and low pressures (400–1333.2 Pa) (Ceriani and Meirelles 2006). Under such conditions, the free fatty acids and flavor materials are volatile components and can be stripped out of the edible oil. Nevertheless, under these extreme conditions some other components may also be removed from the oil phase, either by evapora-tion, as in the case of short-chain fatty acid triacylglycerols, partial acylglycerols, and nutraceutical compounds such as tocols (tocopherols + tocotrienols), or by ther-mal degradation, which occurs with carotenes, for example. Thus, the loss of natural antioxidants (e.g., carotenes, γ-oryzanol, and tocols) is a significant drawback of this purification procedure, especially from a nutritional point of view. Although these
Dow
nloa
ded
By:
10.
3.98
.104
At:
17:5
3 02
Apr
202
2; F
or: 9
7814
3982
3705
, cha
pter
3, 1
0.12
01/b
1091
2-4
56 Handbook of nutraceuticals: Volume ii
minor components surely enhance the nutritional value of the final product, their presence in the refined product is sometimes not desired, as in the case of palm oil, given that its natural color (red), caused by the carotene content, should be avoided in the fractions used as food constituents.
A loss of nutraceutical components occurs in the refining of most edible oils, even in the case of chemical treatments (Leibovitz and Ruckenstein 1983; Orthoefer 1996; Antoniassi, Esteves, and Meirelles 1998). Previous investigations on oil refin-ing based on solvent extraction have usually indicated this mass transfer operation as a predeacidification step that can reduce the acidity and make the intermediary product more appropriate for a final deacidification by conventional methods, with a reduced loss of neutral oil. They have also suggested it is a good way to recover and/or maintain nutraceutical compounds. Although oil deacidification by solvent extraction is not a new concept, the effective development of an industrial process based on this procedure requires that a series of prior studies be developed, mainly involving the recovery of nutraceuticals. Some of these recently applied studies are summarized in this review, such as the liquid–liquid equilibrium data for vegetable oil deacidification and nutraceutical recovery, continuous deacidification in labora-tory equipment, and process simulation for continuous deacidification.
The development of liquid–liquid extraction for the deacidification process and recovery of nutraceuticals requires a systematic study of the corresponding phase equilibria, involving several oils of commercial and nutritional interest, as well as studies with the continuous process on a pilot scale. Liquid–liquid equilibrium data can be found in the literature (Batista et al. 1999a, 1999b; Gonçalves et al. 2002, 2004, 2007; Rodrigues et al. 2003, 2004, 2005a, 2005b, 2006a, 2006b, 2007, 2008; Cuevas, Rodrigues, and Meirelles 2009) for a series of vegetable oils, including palm, rice bran, corn, soybean, canola, and cottonseed; Brazil and Macadamia nuts; grape, avocado, and sesame seeds; garlic, peanut, sunflower, and babassu oils; and for some pure triacylglycerols, such as triolein and tricaprylin. The complete set of equilibrium data found in the literature includes nutraceutical compounds such as tocols (tocopherols + tocotrienols), carotenes, and γ-oryzanol, as well as fatty acids such as lauric, palmitic, oleic, and linoleic acids. These data were determined in a temperature range of 283.15–328.15 K, and short-chain alcohols were used as the solvents (methanol, ethanol, propanol, and isopropanol). For the majority of the experimental data, ethanol, with varying degrees of hydration, was used as the extraction solvent. Part of the experimental data was determined with model sys-tems obtained using refined oils and commercial fatty acids, but equilibrium data for different crude or semiprocessed (bleached or degummed) oils were also deter-mined and published in the scientific literature (Rodrigues et al. 2003, 2004, 2005b; Gonçalves, Batista, and Meirelles 2004). Detailed information on the experimen-tal and analytical methodologies commonly used in determining the liquid–liquid extraction and equilibrium data for oil deacidification and the recovery of nutra-ceuticals can be found in several selected reports and obtained from the literature used for this review (Batista et al. 1999a, 1999b; Gonçalves et al. 2002, 2004, 2007; Rodrigues et al. 2003, 2004, 2005a, 2005b, 2006a, 2006b, 2007, 2008; Cuevas, Rodrigues, and Meirelles 2009).

Dow
nloa
ded
By:
10.
3.98
.104
At:
17:5
3 02
Apr
202
2; F
or: 9
7814
3982
3705
, cha
pter
3, 1
0.12
01/b
1091
2-4
liquid–liquid extraction and adsorption 57
3.2.1.1 Liquid–Liquid Equilibrium Diagrams for Oil Deacidification and the Recovery of Nutraceuticals
As the first step in the design of a liquid–liquid extraction process, the solvent selection is fundamental to the development of an efficient process. Solvent selection depends on a series of specific features, such as the appropriate distribution coeffi-cients for the components that should be extracted, high selectivity, low mutual solu-bility with the feed stream diluent, easy recoverability, nonreactivity, non toxicity, availability on the market, cost, and adequate physical properties (e.g., density, viscosity, and vapor pressure). Batista et al. (1999a) evaluated different alcoholic solvents (ethanol, methanol, n-propanol, and isopropanol) for the deacidification of canola oil, and the main results are shown in Figure 3.1.
Although various solvents exhibit some of the features described previously, in the case of edible oil deacidification and the recovery of nutraceuticals, short-chain alcohols are the most frequently recommended ones. Isopropanol and n- propanol show considerable mutual solubility with oils (Batista et al. 1999a), requiring either the use of low temperatures or the addition of a polar cosolvent modifier, for exam-ple, small amounts of water. Methanol shows an appropriate region of phase splitting (see Figure 3.1) (Batista et al. 1999a), but concerns related to its toxicity might hinder its application as a solvent for processing food products, despite its high volatility and ease of stripping from the raffinate phase, characteristics that make it possible to obtain a final product containing solvent residues far below the safe limits. According to Figure 3.1, ethanol seems to be the best alternative for a series of reasons: (1) the distribution coefficients of the fatty acids, as well as the solvent selectivity and
Methanol at 303.15 KEthanol at 303.15 KIsopropanol at 283.15 Kn-Propanol at 283.15 KBinodal curvesTie lines
45
40
35
30
25
20
15
10
5
0
Fatty
acid
(% b
y mas
s)
0 10 20 30 40 50 60 70 80 90 100Solvent (% by mass)
Figure 3.1 liquid–liquid equilibrium diagrams for canola oil + oleic acid + alcoholic solvent. (from batista, e., s. monnerat, k. kato, l. stragevitch, and a. J. a. meirelles, J. Chem. Eng. Data, 44, 1360, 1999. With permission.)

Dow
nloa
ded
By:
10.
3.98
.104
At:
17:5
3 02
Apr
202
2; F
or: 9
7814
3982
3705
, cha
pter
3, 1
0.12
01/b
1091
2-4
58 Handbook of nutraceuticals: Volume ii
mutual solubility with neutral oil, show values appropriate for a liquid–liquid pro-cess, and these features can be further adjusted by adding small amounts of water to the solvent; (2) ethanol has adequate physical properties and can easily be stripped from the raffinate stream; (3) it is a biotechnological product available on the world market, mainly from Brazil and North America; and (4) ethanol residues, at least in low concentrations, can be considered as nontoxic. In fact, pure ethanol, which can be considered a food-grade solvent, is used in the formulation of some alcoholic beverages, as the extraction medium for natural products, and in many other applica-tions in industries processing goods for direct human consumption. This product is known as extrafine or neutral alcohol (Decloux and Coustel 2005).
Gonçalves and Meirelles (2004) reported liquid–liquid experimental data for systems containing palm oil + palmitic–oleic acid + ethanol + water at 318.15 K, with the objective of evaluating the influence of different water contents in ethanol. Figure 3.2 shows the phase diagrams obtained for systems containing palmitic acid.
As shown in Figure 3.2, the size of the phase-splitting region increased with the water content of the solvent. In other words, the mutual solubility of the solvent and neutral oil decreased significantly with the addition of water to the ethanol. This addition only has a slight influence on the fatty acid distribution coeffi cient, pro-vided the water content is not greater than 7%. For larger water contents, the distribu-tion coefficient falls below 1 and decreases steadily.
The phase behavior obtained for the systems containing palmitic acid was also observed for the systems containing oleic acid: The regions of phase splitting are
35
30
25
20
15
10
5
0
Palm
itic a
cid
(% b
y mas
s)
0 10 20 30 40 50 60 70 80 90 100Solvent (% by mass)
0.0%6.10%12.41%Binodal curvesTie lines
Figure 3.2 liquid–liquid equilibrium diagrams at 318.15 k for palm oil + palmitic acid + eth-anol with different water contents (0.0%, 6.10%, and 12.41% by mass). (from Gonçalves, c. b. and a. J. a. meirelles, Fluid Phase Equilib., 221, 139, 2004. With permission.)

Dow
nloa
ded
By:
10.
3.98
.104
At:
17:5
3 02
Apr
202
2; F
or: 9
7814
3982
3705
, cha
pter
3, 1
0.12
01/b
1091
2-4
liquid–liquid extraction and adsorption 59
similar, and the same occurs for the distribution coefficients whose results are shown in Figure 3.3 for the systems containing palmitic acid.
In terms of the net effect on its distribution between the alcoholic and oil phases, the unsaturation of the oleic acid compensates the negative effect of its larger carbon chain. Figure 3.4 shows the results for the distribution coefficients of the free fatty acids present in a bleached palm oil sample (free acidity equal to 3.9% by mass) in mixtures with an equal amount of hydrated ethanol (water content equal to 6.39% by mass) at 318.15 K.
As indicated in Figure 3.4, the double bond can more than compensate the size of the carbon chain. Based on the results obtained by Gonçalves and Meirelles (2004), one can conclude that hydrated ethanol containing 6%–8% by mass of water is the best solvent for deacidifying palm oil because it guarantees a distribution coeffi-cient of around 1 and high selectivity. In fact, in the range of fatty acid contents relevant for the deacidification process (usually free acidity <4.0% by mass), such a solvent has selectivity values greater than 20 (Figure 3.5). This means that the extraction of fatty acids can occur without a significant loss of neutral oil, whose value in this case is restricted by its low solubility in hydrated ethanol.
Similar behavior was observed in the investigation of other oils (Batista et al. 1999a, 1999b; Gonçalves et al. 2002, 2004, 2007; Rodrigues et al. 2003, 2004, 2005a, 2005b, 2006a, 2006b, 2007, 2008; Cuevas, Rodrigues, and Meirelles 2009), but the highly unsaturated ones (linoleic oils) and those with shorter carbon chains (lauric oils) showed greater mutual solubility with hydrated ethanol than the palm -itic and oleic oils. In these cases the best approach might be the use of ethanolic solutions with larger amounts of water.
20
16
12
8
4
00 4 8 12 16 20
Palmitic acid in oil phase (% by mass)
Palm
itic a
cid
in al
coho
lic p
hase
(% b
y mas
s)
0.0%6.10%12.41%
Figure 3.3 distribution diagrams at 318.15 k for palmitic acid in palm oil + ethanol systems (0.0%, 6.10%, or 12.41% by mass of water in ethanol). (from Gonçalves, c. b. and a. J. a. meirelles, Fluid Phase Equilib., 221, 139, 2004. With permission.)

Dow
nloa
ded
By:
10.
3.98
.104
At:
17:5
3 02
Apr
202
2; F
or: 9
7814
3982
3705
, cha
pter
3, 1
0.12
01/b
1091
2-4
60 Handbook of nutraceuticals: Volume ii
C12:0 C16:0 C18:0 C18:1 C18:2 C20:0Fatty acids
1.2
1.0
0.8
0.6
0.4
0.2
0.0
Dist
ribut
ion
coeffi
cien
t
Figure 3.4 distribution coefficients for the free fatty acids of palm oil in the system with aque-ous ethanol containing 6.39% by mass of water. fatty acids: c12:0 is lauric acid; c16:0 is palmitic acid; c18:0 is stearic acid; c18:1 is oleic acid; c18:2 is linoleic acid; and c20:0 is araquidic acid. (from Gonçalves, c. b. and a. J. a. meirelles, Fluid Phase Equilib., 221, 139, 2004. With permission.)
0 4 8 12 16 20Palmitic acid in alcoholic phase (% by mass)
0.0%6.1%12.4%
100
80
60
40
20
0
Solv
ent s
elec
tivity
for p
alm
itic a
cid
Figure 3.5 solvent selectivity for palmitic acid as a function of the alcoholic phase acidity (0.0%, 6.10%, or 12.41% by mass of water in the ethanol). (from Gonçalves, c. b. and a. J. a. meirelles, Fluid Phase Equilib., 221, 139, 2004. With permission.)

Dow
nloa
ded
By:
10.
3.98
.104
At:
17:5
3 02
Apr
202
2; F
or: 9
7814
3982
3705
, cha
pter
3, 1
0.12
01/b
1091
2-4
liquid–liquid extraction and adsorption 61
Palm oil contains a considerable amount of tocopherols, tocotrienols, and caro-tenes. Although they do have nutritional value, the carotenoids are removed in the physical refining process to obtain a light yellow color oil, which has better accep-tance for industrial purposes (Gonçalves, Pessôa Filho, and Meirelles 2007). In fact, physical refining is responsible for great losses of nutraceutical compounds during the processing of palm oil. The carotenoid content (~500–700 ppm in crude palm oil) is reduced by 50% during the bleached step of the physical refining process, the remainder being completely destroyed during the deacidification and/or deodor-ization steps as a result of the high temperatures (513.15–533.15 K) and low pres-sures (133.3–400 Pa) used. The tocopherols also are partially steam stripped during this stage of the refining process, their levels being reduced from 600–1000 ppm to 356–630 ppm (Gonçalves, Pessôa Filho, and Meirelles 2007). Thus, liquid–liquid extraction using appropriate solvents such as ethanol could be an alternative tech-nique for refining palm oil. With this in mind, Gonçalves et al. (2007) studied the influence of deacidification by solvent extraction on the partition coefficients of caro-tenoids and tocopherols by measuring the equilibrium data for the system palm oil + fatty acids + ethanol + water + nutraceutical compounds at 318.15 K.
Figure 3.6 shows the distribution coefficients of the nutraceuticals between the alcoholic and palm oil phases, using ethanol with different water contents as the solvent (Gonçalves, Pessôa Filho, and Meirelles 2007).
As can be seen in Figure 3.6, the addition of water to the solvent decreases the distribution coefficients of both nutraceutical compounds. This means that if the water concentration is larger, the capacity of the solvent to extract the carotenoids and tocopherols is smaller.
0 4 8 12 16 20Water mass percentage in solvent
CarotenesTocopherols
0.8
0.7
0.6
0.5
0.4
0.3
0.2
0.1
0.0
Dist
ribut
ion
coeffi
cien
t
Figure 3.6 distribution coefficients of the nutraceuticals in palm oil + hydrated ethanol systems at 318.15 k. (from Gonçalves, c. b., p. a. pessôa filho, and a. J. a. meirelles, J. Food Eng., 81, 21, 2007. With permission.)

Dow
nloa
ded
By:
10.
3.98
.104
At:
17:5
3 02
Apr
202
2; F
or: 9
7814
3982
3705
, cha
pter
3, 1
0.12
01/b
1091
2-4
62 Handbook of nutraceuticals: Volume ii
The distribution coefficients of the carotenes decrease to values less than 0.01 for ethanol containing almost 6% by mass of water. For tocopherols, the distribution coef-ficient is much larger, approximately 0.25 for water contents in the range of 6%–8% by mass, but still well below 1. This indicates that in a deacidification step based on solvent extraction by hydrated ethanol, the carotenes will remain almost completely in the raffinate phase (oil-rich phase), although part of the tocopherols will be trans-ferred to the extract stream (solvent-rich phase). It is important to emphasize that this effect is desirable because it demonstrates that most of such compounds remain in the oil refined by liquid–liquid extraction. As described previously, the tocopherols are extracted into the alcoholic phase to a larger extent than the carotenoids. Both the tocopherols and carotenoids are insoluble in water because they have a long apolar chain (which makes them liposoluble), but the OH group linked to the aromatic ring of the tocopherols enhances their solubility in ethanol. Gonçalves et al. (2007) con-cluded that the liquid–liquid extraction process carried out using an ethanolic solvent containing approximately 6% by mass of water, and with an oil/solvent mass ratio equal to 1:1, for example, allows for the maintenance of up to 99% by mass of the carotenoids and approximately 80% by mass of the tocopherols in the refined palm oil. In contrast, traditional physical refining usually provides a refined palm oil with approximately 0.03% by mass of tocopherols and exempt of carotenoids.
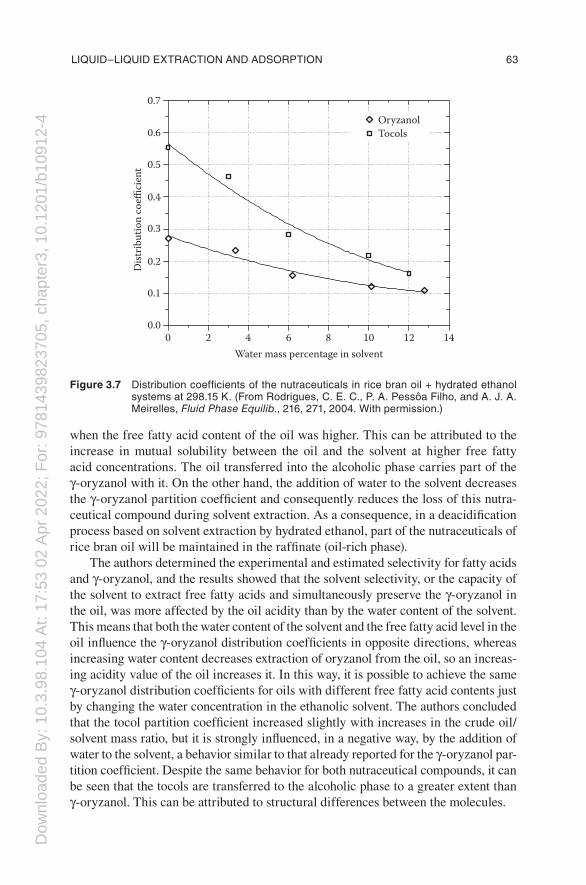
As in the case of palm oil, the physical refining of rice bran oil also partially removes important nutraceutical compounds such as γ-oryzanol and tocopherols/tocotrienols, hereafter referred to as tocols. Rice bran oil presents considerable potential as a nutraceutical food because of the health benefits that may be attributed to its high level of unsaponifiable matter, of which the most important nutraceutical component is γ-oryzanol, a complex mixture of ferulate esters with sterols and trit-erpene alcohols (Kim et al. 2001; Patel and Naik 2004; Rodrigues et al. 2006b), and tocols, a family of isomers that present vitamin E activity (Shin et al. 1997; Kim et al. 2001). Marshall and Wadworth (1994) showed a loss of up to 90% of the γ-oryzanol and tocotrienol contents of the crude oil throughout the processing steps. From these observations, it is evident that new techniques in the processing of crude oil must be developed to preserve the active components of rice bran oil. Therefore, Rodrigues et al. (2003, 2004) reported experimental equilibrium data for fatty systems contain-ing rice bran oil, free fatty acids, ethanol, water, γ-oryzanol, and tocols at 298.15 K, providing important information on the phase equilibrium for designing separation processes involving fatty systems. The main objective of these data was to determine the distribution coefficients of the nutraceuticals (γ-oryzanol and tocols) in rice bran oil as a function of the water content of the ethanol. Figure 3.7 presents the main results obtained by these authors.
The behavior of the tocols (tocopherols + tocotrienols) is similar to that previ-ously determined for the tocopherols of palm oil (see Figure 3.6), and in the case of solvents containing 6%–8% by mass of water, the corresponding distribution coefficients varied around the same value of 0.25. The distribution coefficient of γ-oryzanol is not much lower than the results obtained for the tocols; in fact, it shows a value of approximately 0.15 for the same range of water contents (6%–8% by mass). The authors observed that the partition coefficient of γ-oryzanol increased
Dow
nloa
ded
By:
10.
3.98
.104
At:
17:5
3 02
Apr
202
2; F
or: 9
7814
3982
3705
, cha
pter
3, 1
0.12
01/b
1091
2-4
liquid–liquid extraction and adsorption 63
when the free fatty acid content of the oil was higher. This can be attributed to the increase in mutual solubility between the oil and the solvent at higher free fatty acid concentrations. The oil transferred into the alcoholic phase carries part of the γ-oryzanol with it. On the other hand, the addition of water to the solvent decreases the γ-oryzanol partition coefficient and consequently reduces the loss of this nutra-ceutical compound during solvent extraction. As a consequence, in a deacidification process based on solvent extraction by hydrated ethanol, part of the nutraceuticals of rice bran oil will be maintained in the raffinate (oil-rich phase).
The authors determined the experimental and estimated selectivity for fatty acids and γ-oryzanol, and the results showed that the solvent selectivity, or the capacity of the solvent to extract free fatty acids and simultaneously preserve the γ-oryzanol in the oil, was more affected by the oil acidity than by the water content of the solvent. This means that both the water content of the solvent and the free fatty acid level in the oil influence the γ-oryzanol distribution coefficients in opposite directions, whereas increasing water content decreases extraction of oryzanol from the oil, so an increas-ing acidity value of the oil increases it. In this way, it is possible to achieve the same γ-oryzanol distribution coefficients for oils with different free fatty acid contents just by changing the water concentration in the ethanolic solvent. The authors concluded that the tocol partition coefficient increased slightly with increases in the crude oil/solvent mass ratio, but it is strongly influenced, in a negative way, by the addition of water to the solvent, a behavior similar to that already reported for the γ-oryzanol par-tition coefficient. Despite the same behavior for both nutraceutical compounds, it can be seen that the tocols are transferred to the alcoholic phase to a greater extent than γ-oryzanol. This can be attributed to structural differences between the molecules.
0.7
0.6
0.5
0.4
0.3
0.2
0.1
0.00 2 4 6 8 10 12 14
Water mass percentage in solvent
Dist
ribut
ion
coeffi
cien
tOryzanolTocols
Figure 3.7 distribution coefficients of the nutraceuticals in rice bran oil + hydrated ethanol systems at 298.15 k. (from rodrigues, c. e. c., p. a. pessôa filho, and a. J. a. meirelles, Fluid Phase Equilib., 216, 271, 2004. With permission.)

Dow
nloa
ded
By:
10.
3.98
.104
At:
17:5
3 02
Apr
202
2; F
or: 9
7814
3982
3705
, cha
pter
3, 1
0.12
01/b
1091
2-4
64 Handbook of nutraceuticals: Volume ii
Karan (1998) investigated the recovery of γ-oryzanol from crude rice bran oil using liquid–liquid extraction. In contrast to edible oil deacidification by solvent extraction as described previously, the work of Karan (1998) intended to remove the γ-oryzanol from the crude oil and thus obtain a concentrate of the nutraceutical that could be used for other purposes, such as the enrichment of various food products. Organic solvents such as methanol, ethanol, and N,N-dimethylformamide (DMF) were tested as solvents. In the case of methanol, a mixture containing 10% of water on a volumetric basis was used, but even for a large solvent/oil ratio (5:1), only 3.4% of the γ-oryzanol was extracted from the crude oil. In relation to the amount of γ-oryzanol extracted, Karan (1998) obtained a much better result using pure ethanol in a sequence of five extraction steps. In each extraction step, a solvent/oil ratio of 4:1 was used, and the raffinate (oil) phase generated in each step was used as the oil source for the subsequent extraction step. In this way the author was able to extract 75% of the γ-oryzanol present in the original crude rice bran oil. Unfortunately, this scheme also caused the extraction of large amounts of rice bran oil, so that approximately 70% of the initial mass of oil was simultaneously extracted. For this reason, the γ-oryzanol concentration in the oil fraction at the end of the process was 0.93%, only slightly higher than its original concentration (0.871%) in the crude oil. It is evident that alcohol extraction for obtaining γ-oryzanol concentrates is a low efficiency process. Such results are compatible with the previous discussion on oil deacidification by extraction with alcoholic solvents. As that discussion indicated, alcoholic solvents do not usually extract large amounts of γ-oryzanol, and if these amounts were increased, larger amounts of other fatty components such as free fatty acids and acylglycerol would also be extracted.
Another approach tested by Karan (1998) involved the use of DMF as the solvent, and the rice bran oil source dissolved in hexane. The author observed an increase in the amounts of γ-oryzanol extracted into the DMF phase when the oil source was dissolved in relatively large amounts of hexane. Because some nonpolar com-pounds were also extracted from the oil by the DMF, a further purification step was applied by washing the DMF extract phase with hexane. The hexane was able to remove the nonpolar compounds from the DMF extract with only a minimal loss of the extracted γ-oryzanol contained in the DMF phase. Based on these results, the author investigated the following approach: a sequence of three to seven extraction steps using rice bran oil dissolved in hexane and DMF as the solvent. The combined DMF layers were then washed using hexane. According to Karan (1998), the best extraction scheme was that using five DMF extraction steps, allowing for 85.8% of the γ-oryzanol present in the original crude oil to be extracted and resulting in a DMF-combined layer with a γ-oryzanol concentration of 8.4% and a concentration factor of 9.7-fold.
3.2.1.2 Continuous Deacidification of Edible Oils by Liquid–Liquid Extraction
According to the results described previously, the oil deacidification process can be successfully performed via liquid–liquid extraction. To test whether this process

Dow
nloa
ded
By:
10.
3.98
.104
At:
17:5
3 02
Apr
202
2; F
or: 9
7814
3982
3705
, cha
pter
3, 1
0.12
01/b
1091
2-4
liquid–liquid extraction and adsorption 65
would be a technically viable, continuous operation, the deacidification step was investigated by some authors (Antoniassi 1996; Pina and Meirelles 2000; Pina 2001; Reipert 2005; Sa 2007) on a laboratory scale, using different versions of the rotat-ing disc contactor (RDC). RDC is a mechanically agitated liquid–liquid extractor composed of a cylindrical shell containing stator rings and a central rotating shaft carrying equally spaced perforated discs. The acidified oil stream is the heavy liquid and should be fed in at the top of the equipment, flowing downward as a dispersed phase of small oil droplets. The solvent stream represents the continuous phase, flow-ing upward and leaving the equipment as an acid-rich extract stream. The raffinate stream, containing neutral oil saturated with the solvent, leaves the equipment at the bottom. Continuous deacidification was tested for crude, pretreated, and model oil systems, including palm, rice bran, soybean, corn, and cottonseed oils (Antoniassi 1996; Pina and Meirelles 2000; Pina 2001; Reipert 2005; Sa 2007). The influence of the solvent/oil mass flow ratio, water content of the solvent, rotating disc speed, and oil mass flow were investigated. The final acidity, loss of neutral oil, solvent concen-tration in the raffinate stream, loss of nutraceuticals, percentage of fatty acids and partial acylglycerols transferred to the extract stream, and volumetric mass transfer coefficients were evaluated during the experiments, and detailed information can be found in the literature (Antoniassi 1996; Pina and Meirelles 2000; Pina 2001; Reipert 2005; Sa 2007).
The hydrodynamics and mass transfer performance in the continuous deacidifi-cation of edible oils were investigated by Pina and Meirelles (2000) using different versions of the RDC with an extraction zone length equal to 1.0 meter (Pina and Meirelles 2000). The best results for the dispersed phase holdup, and in consequence for the mass transfer area, were obtained using the RDC version equipped with per-forated discs but without stator rings. This version was further tested in the deacidi-fication of a model system composed of corn oil, with the free acidity obtained by the addition of commercial oleic acid. Hydrated ethanol was used as the solvent. The results shown in Figure 3.8 were obtained for an oil/solvent mass flow ratio equal to 1.0:2.0 and a rotating speed of 250 rpm.
As indicated in Figure 3.8, under such operational conditions an extraction zone of 1.0 meter was sufficient to deacidify edible oils (final acidity ≤0.3% by mass), provided the acidity in the feed stream was not greater than 4.0% by mass. In these experiments the loss of neutral oil varied in the range of 4.5%–4.9%, values much lower than those reported in the literature (Leibovitz and Ruckenstein 1983).
Further experiments on continuous deacidification were carried out with degummed and bleached corn oil, degummed soybean oil, crude and degummed cot-tonseed oils, bleached palm oil, and crude and degummed rice bran oils (Antoniassi 1996; Pina and Meirelles 2000; Pina 2001; Reipert 2005; Sa 2007), and similar results were found. The experiments were carried out using the same kind of extrac-tor, and the results obtained confirmed the technical feasibility of the total deacidifi-cation of edible oils by solvent extraction.
With respect to the loss of nutraceuticals during the continuous deacidification by liquid–liquid extraction, some research studies have reported interesting results. In the case of bleached palm oil, the continuous deacidification experiments were

Dow
nloa
ded
By:
10.
3.98
.104
At:
17:5
3 02
Apr
202
2; F
or: 9
7814
3982
3705
, cha
pter
3, 1
0.12
01/b
1091
2-4
66 Handbook of nutraceuticals: Volume ii
carried out at 318.15 K using an ethanolic solvent with approximately 6% by mass of water (Gonçalves 2004). The oil free acidity was decreased to less than 0.2% by mass, and the observed carotene loss was less than 20%. In the case of degummed rice bran oil, the free acidity also decreased to a value less than 0.2% by mass, and the losses of tocols and γ-oryzanol were approximately 25% (Rodrigues 2004). These losses could be further reduced using an extractor with an appropriate extrac-tion zone length. Because the initial acidity of both oils was high, they had to be reprocessed in the extractor more than twice, using a fresh solvent stream for each deacidification step, and part of the nutraceutical losses can be attributed to the use of a fresh solvent stream in each deacidification step.
Further investigations on continuous oil deacidification were carried out by Batista (2001) using process simulation based on the Newton–Raphson algorithm adapted for calculating liquid–liquid extractors. Corn oil was selected as the crude edible oil to be investigated. It was assumed that corn oil was composed of 9 different free fatty acids, 12 diacylglycerols, and 14 triacylglycerols, in a proportion equal to 4:4:92, respec-tively. The deacidification step was optimized based on the simulated results and a corresponding factorial design using the number of ideal stages of the extraction, the solvent/oil ratio, and the water percentage in the alcoholic solvent as the factors. Response surface methodology provided the following optimal result: an extractor equipped with 10 ideal stages was able to reduce the free acidity to a value less than 0.3% using aqueous ethanol as the solvent with 5.75% of water, and to guarantee a loss of neutral oil no higher than 2.4%, provided a solvent to oil ratio of 1.27 was used. Most of the neutral oil lost consisted of diacylglycerols, the amount extracted being close to 60% of the original amount in the crude oil (Batista et al. 2002).
0.6
0.5
0.4
0.3
0.2
0.1
0.01 2 3 4 5
Crude oil acidity (% by mass)
Refin
ed o
il ac
idity
(% b
y mas
s)
Figure 3.8 refined oil acidity (composition on a solvent-free basis) as a function of the acid-ity of the feed stream to the rdc equipment. (from pina, c. G., and a. J. a. meirelles, JAOCS, 77, 553, 2000. With permission.)

Dow
nloa
ded
By:
10.
3.98
.104
At:
17:5
3 02
Apr
202
2; F
or: 9
7814
3982
3705
, cha
pter
3, 1
0.12
01/b
1091
2-4
liquid–liquid extraction and adsorption 67
3.2.1.3 Patents on Oil Processing by Liquid–Liquid Extraction
Various patents have been deposited around the world, mainly in Europe and the United States, presenting processes for refining edible oils without the loss of nutraceutical compounds or, alternatively, for concentrating these compounds in oil fractions, both processes being carried out by liquid–liquid extraction. The patents indicated various advantages of a purification process based on selective extraction. Swoboda (1985) reported a process for refining palm oil and palm oil fractions that could be carried out by extraction of the oil with an alcoholic solvent, or option-ally with a hydrated alcoholic solvent (with 25% by mass of water), subsequently bleaching the raffinate stream of this solvent extraction or the oil derived therefrom. The solvent should either be a mixture of ethanol and water, or one of isopropanol and water, preferably with a composition close to the azeotropic one. Azeotropic mixtures are preferred because of the advantages of recycling the solvent. The experiments were carried out using a countercurrent configuration in a continuous process. According to the results reported by the authors, crude palm oil subjected to solvent extraction may produce a raffinate stream containing a carotenoid concen-tration similar to, or even larger than, the carotenoid concentration in the original oil. The palm oil obtained via alcoholic solvent extraction may be of considerable nutritional value by virtue of its high carotene content, absence of odor and flavor, and low free fatty acid level. Because the oil at this stage of refining generally has a pronounced red color, it may be used to provide a dietary source of vitamin A precursor (Daun 2005).
Hamm (1992) and Rodrigues et al. (2007) cited an application for a Japanese patent by Nippon Oils and Fats that presented the possibility of producing fish oil fractions enriched with eicosapentaenoic acid (EPA) by solvent extraction with aque-ous acetone. According to this report, the EPA content was increased by 85% by extracting the original oil, containing 12.88% of this fatty compound, with 10 times its weight of a 9:1 acetone/water mixture.
In another invention suggested by Plonis and Trujillo-Quijano (1995), the deacid-ification of palm oil by liquid–liquid extraction produced an olein (the liquid frac-tion of palm oil, with a high content of unsaturated fatty acids) with a carotene content of 750–1000 mg/kg. The solvents used were short-chain alcohols, preferably ethanol or ketones, containing 1%–25% by volume of water and approximately 1% of citric acid. The authors also reported that the patented process could produce deacidified oil containing high levels of carotene and reduced amounts of diacylglycerols and free fatty acids. However, the deacidified oil presented enhanced flavor and aroma.
Cherukuri et al. (1999) deposited a patent to obtain rice bran oil enriched with high levels of tocols (tocopherols and tocotrienols) and γ-oryzanol, using a liquid–liquid extraction process employing lower aliphatic alcohols containing from one to six carbons, such as methanol, ethanol, or isopropanol. The process, developed based on experimental runs carried out in separation funnels on a laboratory scale, involves mixing rice bran oil and alcohol, separating the alcohol layer, and subse-quently distilling this layer to recover the enriched rice bran oil.

Dow
nloa
ded
By:
10.
3.98
.104
At:
17:5
3 02
Apr
202
2; F
or: 9
7814
3982
3705
, cha
pter
3, 1
0.12
01/b
1091
2-4
68 Handbook of nutraceuticals: Volume ii
3.2.2 adsorption
Adsorption–desorption processes are generally used as separation techniques in the food, chemical, and pharmaceutical industries. The desired product, after a determined contact time, can be found free in the solution or, alternatively, adhered to the adsorbent. In the latter case, the desired product should be recovered by the passage of an appropriate solvent through the adsorbent, desorbing the desired prod-uct (elution).
Adsorption–desorption processes are used to separate, concentrate, or purify nutraceutical compounds present in aqueous or organic solutions, resulting from different steps in the production of juices and oils, for example. It is also possi-ble to use this technique to recover nutraceuticals present in the wastewaters from some industries. One example is the production of olive oil, which generates a large amount of wastewater rich in polyphenols, sugars, lipids, and so on, and is respon-sible for environmental problems because of its high phytotoxicity. Agalias et al. (2007) suggested a system to recover the high polyphenol and lactone contents from olive oil production wastewaters using adsorbent resins after successive filtration steps to reduce the supernatants. This adsorption system made it possible to obtain an extract rich in polyphenols and lactones with wastewater in adequate conditions to be discarded.
Scordino et al. (2004) performed a test with a series of commercial resins to choose the best one to concentrate cyanidin 3-glucoside, a phenolic compound (anthocya-nins), from an aqueous batch solution. When the authors used a methacrylic resin, the amount of cyanidin 3-glucoside adsorbed was approximately 6 mg/g resin, and when they used styrene-divinylbenzene copolymers as the adsorbent, the amount of cyanidin 3-glucoside adsorbed increased considerably to approximately 15 mg/g resin. Comparing the values adsorbed by each resin, it was clear that the cyani-din 3-glucoside had a greater affinity for the styrene-divinylbenzene copolymer, a strongly hydrophobic resin. In this study the authors also show that an increase in the pH value did not interfere significantly in the adsorption capacity of each resin. With adsorption onto styrene-divinylbenzene copolymers, a small fluctuation of approxi-mately 2 mg/g resin was observed in the adsorption capacity with the increase in pH value. This fluctuation is not significant, indicating that the structural behavior of cyanidin 3-glucoside, which changes according to the pH value of the solution, did not interfere in the adsorption processes. Thus, in this case, the conformational form of the molecule, which depends on the pH value of the solution, was not a problem in the adsorption process.
Continuing the investigation, the authors compared the adsorption of cyanidin 3-glucoside and hesperidin, a compound also present in pigmented orange juice, using the same resins tested before to verify the selectivity of the resins. Of all the resins tested, just one, styrene-divinylbenzene copolymer, adsorbed the same amount of both components. This fact was an indication of the selective capacity of another resin that could be used to separate cyanidin 3-glucoside and hesperidin, cheaper than the first one, from the same solution. In this way, the authors tested the

Dow
nloa
ded
By:
10.
3.98
.104
At:
17:5
3 02
Apr
202
2; F
or: 9
7814
3982
3705
, cha
pter
3, 1
0.12
01/b
1091
2-4
liquid–liquid extraction and adsorption 69
resin that presented the best adsorption capacity from aqueous solution (EXA-118) to remove cyanidin 3-glucoside and hesperidin from a pigmented orange juice. After elution with methanol, the amount of the anthocyanin cyanidin 3-glucoside recov-ered, was more than fourfold higher than the amount of hesperidin recovered, which was an excellent result considering that the amount of anthocyanins in the juice was approximately half that of hesperidin. The most concentrated extract was obtained using a solution of methanol/water (50%:50% v/v) as the eluting solution (Scordino et al. 2005).
Kammerer et al. (2007) used a polymethylmethacrylate resin to study the pro-cessing parameters of the apple juice adsorption process. The authors observed a decrease in the total amount of polyphenols adsorbed by each gram of the resin as the temperature used in the adsorption process was increased from 293.15 K to 353.15 K.
They also evaluated the amount of each polyphenolic compound recovered from the resin by elution using water–methanol or water–ethanol solutions with differ-ent concentrations. The best elution results were obtained with increased amounts of alcohol concentration in the solution, of approximately 70%–80% by volume of methanol and 60% for ethanol. Significant amounts of individual phenolic com-pounds, such as chlorogenic acid, 4-caffeoylquinic acid, phloridzin, and some quer-cetin derivatives, among others, were recovered, and the amount of each one was different according to the solvent used and its concentration in the solution. Based on these results the authors concluded that the resins exhibited higher affinity for specific phenolic compounds found in apple juice. In principle, this selective behav-ior by the resin makes it possible to separate and recover specific compounds with elevated purity. They also observed that the adsorption of phenolic compounds was improved by decreasing the solution pH value, whereas the desorption step was mainly dependent on the hydrophobicity of the different phenolic compounds.
Vinu, Hossian, and Srinivasu (2007) increased the selectivity of mesoporous carbon by way of the functionalization technique using ammonium persulfate. Functionalization is a technique used to enrich the surface of a material with a desired chemical group that can foment, for example, the adsorption of a group of molecules onto the surface of the material. The aforementioned authors per-formed the functionalization of the mesoporous carbon by an oxidation process using an ammonium persulfate solution and obtained a good adsorbent material for use with biomolecules. Another example of functionalization is the use of ionic liquids to modify a mesoporous siliceous substrate (Li et al. 2008). The func-tionalized resin was successfully used for extracting α-tocopherol from a model mixture of soybean oil deodorizer distillate, and it presented good reusability and selectivity.
The use of ion-exchange resins is another option to separate undesired compo-nents from desired ones by adsorption. Because of the presence of anionic or cationic sites along the solid surface, a compound with the opposite charge will be adsorbed by the resin. Such a mechanism was used to remove the acidity from juices (Chung et al. 2003; Lineback et al. 2003) and oleic acid from ethanol–water solutions (Cren and Meirelles 2005; Cren et al. 2009).
Dow
nloa
ded
By:
10.
3.98
.104
At:
17:5
3 02
Apr
202
2; F
or: 9
7814
3982
3705
, cha
pter
3, 1
0.12
01/b
1091
2-4
70 Handbook of nutraceuticals: Volume ii
A series of synthetic adsorbents was tested to improve the recovery of carotene from crude palm oil (CPO), preserving the edible oil quality (Latip et al. 2000). The recovery process consisted of diluting the CPO with three parts of isopropanol, with subsequent adsorption onto synthetic adsorbents by mixing at a controlled tempera-ture. The CPO was then eluted using isopropanol. The nonadsorbed carotene was removed from the adsorbent using hexane at a constant temperature. Both solvents were evaporated off under vacuum, so that one carotene-rich fraction and another CPO-rich fraction were obtained. In this way, the authors chose the best synthetic resins and the best process condition to recover carotene from CPO, preserving the oil quality.
In a subsequent study, Latip et al. (2001) investigated the influence of tempera-ture, adsorption time, and elution time in the recovery of oil using isopropanol as the solvent. The temperature was varied from 313.15 K to 353.15 K, and they observed that at higher temperatures the concentration of carotene in the eluted oil increased, whereas the amount of carotene recovered by the subsequent resin elution with hexane decreased. In fact, the best recovery of carotene from the oil was obtained at 313.15 K. They also concluded that a contact time of at least 0.5 hours during the adsorption process was required to recover appropriate amounts of carotene. In the case of elution with isopropanol, they observed that increasing the contact time decreased the amount of carotene retained by the resin and, consequently, the quan-tity of carotene recovered by elution of the resin with hexane. Based on these results it can be concluded that by controlling the temperature of the adsorption process and the elution contact time with isopropanol, one can define the amount of carotene to be maintained in the palm oil and the amount to be recovered as an isolated nutra-ceutical dissolved in hexane.
As expected, adsorption is influenced by the kind of adsorbent used, and small changes in the adsorbent structure may have a significant effect on the adsorp-tion process. Ahmad et al. (2009) observed that the adsorption of β-carotene from CPO using silica gel and florisil (Sigma-Aldrich, St. Louis, MO)—two silica-based absorbents—was greater using florisil, which includes magnesium oxide and a small portion of sodium sulfate in its structure in addition to a difference in its pore size. Independent of these differences, the author observed that the adsorption of β-carotene was dependent on the temperature, the contact time, and the initial con-centration. Increasing these variables increased the adsorption of β-carotene. The adsorption process was also influenced by the adsorbent/solution mass ratio, the agitation speed in the case of batch adsorption, the temperature, and the adsorbent particle size, as observed by Ma and Li (2004) in the adsorption of β-carotene from soybean oil using clay as the adsorbent.
The adsorption of polyphenols obtained by extraction from crude Inga edulis leaves (an Amazonian tree) has also been investigated (Silva et al. 2007). The authors used macroporous resins and concluded that adsorption was influenced by the type of adsorbent and by the proportion of water in the ethanolic solutions, but not by the pH value of the solution. Isotherms for the two classes of polyphenols—phenolic and flavonoid compounds—were determined in a previously mentioned article by Scordino et al. (2004), and it was also observed that the adsorption of cyanidin

Dow
nloa
ded
By:
10.
3.98
.104
At:
17:5
3 02
Apr
202
2; F
or: 9
7814
3982
3705
, cha
pter
3, 1
0.12
01/b
1091
2-4
liquid–liquid extraction and adsorption 71
3-glucoside, a flavonoid, was not influenced by the solution acidity. Nevertheless, acidity is usually an important factor in the adsorption of biological molecules that can exhibit some structural change according to the pH value of the solution.
Advances in the development of mesoporous materials can result in the improve-ment of the adsorption and desorption process because these materials exhibit large specific surface areas, large specific pore volumes, and well-ordered pore structures (Ciesla and Schüth 1999; Taguchi and Schüth 2005). Although the mechanism for obtaining such materials is not completely understood, it is possible to produce mes-oporous materials with controlled pore sizes and distribution (Zhao et al. 1998). The application of mesoporous materials to adsorption–desorption processes has been widely investigated, and they can diminish some of the difficulties caused by the pore size, especially when the adsorbate molecule is a large one, as in the case for proteins.
The adsorption of vitamin B2 (riboflavin) and two proteins (lysozyme and trypsin) by two different mesoporous molecular sieves was studied by Kisler et al. (2001). The amount of riboflavin adsorbed by the molecular sieves was smaller than that adsorbed by mesoporous activated carbon, but, as expected, it was greater than the amount of protein adsorbed as a result of the size differences of the molecules, riboflavin being more than 30 times smaller than lysozyme and 60 times smaller than trypsin. This means that these molecules were mainly separated by size exclusion.
Another investigation confirmed that the adsorption of vitamin E from a solu-tion of n-heptane and n-butanol was dependent on the volume and the pore diam-eter of the adsorbent used (mesoporous material), as well as on the solvent polarity (Hartmann, Vinu, and Chandrasekar 2005).
Chen and Payne (2001) investigated the possibility of recovering and separating α- and δ-tocopherols from hexane by adsorption onto an acrylic ester resin. In a first stage of the study, a solution with α- and/or δ-tocopherols was added to the resin, and after reaching equilibrium, the hexane solution was analyzed. It was found that the acrylic ester resin adsorbed 3 to 4 times more δ-tocopherol than α-tocopherol. The authors used ethyl propionate to simulate the binding site of the acrylic ester adsor-bent. The results obtained indicated the formation of an intermolecular hydrogen bond between the phenolic hydroxyl of the tocopherols and the ethyl propionate, in a way similar to that occurring between the tocopherols and the adsorbent. However, in the case of α-tocopherol, this hydrogen bonding is weak as a result of steric con-straints by its methyl and hydroxyl groups. According to the authors, it is possible to separate similar molecules such as α- and δ-tocopherols, although it is a difficult task. However, it can become easier with an understanding of the mechanisms gov-erning the adsorption processes. Bono, Ming, and Sundang (2007) also studied the adsorption of vitamin E (α-tocopherol) from ethanolic solutions onto activated car-bon and concluded that this process appears to obey the monolayer theory.
The monolayer theory is one of the hypotheses assumed in deriving the Langmuir isotherm. Many investigations on adsorption begin by determining the adsorption isotherms to better understand the mechanism of adsorption and desorption (Chan, Baharin, and Man 2000; Sabah 2007; Ahmad et al. 2009). In Section 3.4 of this chapter (“Fundamentals of Adsorption Applied to the Recovery of Nutraceuticals”),

Dow
nloa
ded
By:
10.
3.98
.104
At:
17:5
3 02
Apr
202
2; F
or: 9
7814
3982
3705
, cha
pter
3, 1
0.12
01/b
1091
2-4
72 Handbook of nutraceuticals: Volume ii
the modeling of adsorption isotherms will be discussed, as well as some basic aspects of the batchwise operation of the adsorption process and the corresponding break-through curves.
3.3 FuNdameNtaLs oF LIquId–LIquId extraCtIoN appLIed to the proCessINg oF FuNCtIoNaL Foods
Liquid–liquid extraction or solvent extraction is a unit operation that brings into contact two insoluble liquids: a feed stream and a solvent. When the components of the original mixture distribute themselves in different ways in the two liquid phases, a degree of separation is obtained.
If a vegetable oil with certain free fatty acid content is shaken with a polar sol-vent such as a short-chain alcohol, part of the free fatty acid and relatively little of the vegetable oil will migrate to the alcoholic phase. When shaking stops, the two phases will decant as a result of the difference in their densities. The free fatty acid contents in the two phases will be different from each other and from the original content, and thus a degree of free fatty acid extraction will be obtained. This is an example of stagewise contact, which can be carried out in a batch or continuous way. If one wishes to reduce the free fatty acid content, for example, to produce edible oil, the residual oil phase can be put in contact with more solvent.
The original mixture containing the solute to be extracted is called the feed, and the other chemically different liquid is the solvent. The solvent-rich phase that leaves the equipment is the extract stream, and the residual liquid from which the solute was extracted is the raffinate stream.
3.3.1 Liquid–Liquid equilibrium diagrams for Fatty systems
Liquid–liquid extraction involves at least three components that appear to dif-ferent extents in the two phases. A liquid–liquid equilibrium diagram in which only one pair of components is partially soluble is presented in Figure 3.9. The diagrams, presented with triangular coordinates, are used at constant temperature and pres-sure. Liquid C (solute, in the present case, the fatty acid) is completely soluble in liquids A (diluent, in the present case, vegetable oil) and B (solvent), but A and B only dissolve into each other to a limited extent and are represented in the diagram by the saturated liquid binary solutions at L (rich in diluent – A) and at K (rich in solvent – B). On the rectangular coordinates, the abscissa and ordinate present the compositions of the solvent (component B) and solute (component C), respectively. Any binary mixture between L and K will separate into two immiscible liquids with the compositions shown at L and K. Point L represents the solubility of the solvent in the diluent and point K, the solubility of the diluent in the solvent at the temperature of the diagram.
The LRPEK curve is the binodal curve and represents the change in solubility of the diluent-rich phase and the solvent-rich phase. Any ternary mixture on the outside of the curve will be a one-phase solution (homogeneous region), and any ternary

Dow
nloa
ded
By:
10.
3.98
.104
At:
17:5
3 02
Apr
202
2; F
or: 9
7814
3982
3705
, cha
pter
3, 1
0.12
01/b
1091
2-4
liquid–liquid extraction and adsorption 73
mixture underneath the curve (heterogeneous region), such as mixture M, will form two immiscible phases with the equilibrium compositions indicated at R (diluent-rich phase) and E (solvent-rich phase). The line RE is a tie line and must necessarily pass through point M, which represents the overall composition.
The point P, known as the plait point, is the last tie line, where the binodal curve converges and the compositions of the diluent-rich phase and the solvent-rich phase are equal. The LRP curve represents the diluent-rich phase, and the KEP curve rep-resents the solvent-rich phase.
The distribution coefficient (ki) of component i is defined as the ratio of its composition in the solvent-rich phase (E) to its composition in the diluent-rich phase (R):
k
y
xi E
Ri
i
= ,
, (3.1)
According to Figure 3.9, the composition of C (solute) in solvent-rich phase (yC,E) is larger than in the diluent-rich phase (xC,R), and hence the solute distribution coef-ficient is larger than unity.
The capacity of solvent (B) to separate solute (C) from diluent (A) is measured by the ratio of the distribution coefficient of the solute (C) to the distribution coefficient of the diluent (A). This separation factor is known as the selectivity and represents the effectiveness of a solvent in extracting the solute from the diluent. The selectivity must exceed unity, and the greater the value, the better or easier the separation.
β
CAC
Ak
=k
(3.2)
MR
P
E
KL
0.0 0.2 0.4Solvent (mass fraction)
0.6 0.8 1.0
0.20
0.18
0.16
0.14
0.12
0.10
0.08
0.06
0.04
0.02
0.00
Fatty
acid
(mas
s fra
ctio
n)
Figure 3.9 liquid–liquid equilibrium diagram. L – K, base line; R – E, tie line; M, overall composition; P, plait point.

Dow
nloa
ded
By:
10.
3.98
.104
At:
17:5
3 02
Apr
202
2; F
or: 9
7814
3982
3705
, cha
pter
3, 1
0.12
01/b
1091
2-4
74 Handbook of nutraceuticals: Volume ii
If the selectivity is equal to unity, this means that the diluent and the solute are distributed in the same way in the phases, and thus their separation from each other is not possible.
3.3.2 Liquid–Liquid extraction equipment
The rate of mass transfer between two liquid phases is directly proportional to the overall mass transfer coefficient, the interfacial area, and the composition differ-ence driving force. The rate may be increased by dispersing one of the liquids into smaller droplets immersed in the other one, with a consequent increase in the inter-facial area. This favors eddy diffusion and improves the mass transference between the phases.
Liquid–liquid extraction equipment provides direct contact between two immis-cible liquids that are not in equilibrium and involves dispersing one liquid in the form of small droplets (the dispersed phase) into the other liquid (continuous phase) in an attempt to bring the liquids to equilibrium. After this contact the resulting liquids are mechanically separated because of the difference in their densities. This equip-ment can be classified according to the type of phase contact, either in stagewise or in continuous (differential) contact, or by the type of its internal construction, in this case into mixer–settlers, columns without agitation, mechanically agitated columns, and centrifugal extractors (Frank et al. 2008).
3.3.2.1 Equipment for Stagewise Contact
This type of equipment is organized in different stages, each stage represent-ing a step of mass transfer contact between the two phases and, subsequently, of its separation by density difference. Each stage should work as close as possible to an equilibrium stage, which means that the effluent streams should leave this stage as close as possible to the corresponding equilibrium concentrations.
Mixer–settler is the most typical and oldest extraction equipment, in which each stage presents two well-defined and delimited regions: the first region, the mixer, involves dispersing one liquid into the other, and the second, the settler, involves the mechanical separation. The equipment may be operated in a batch way or in a continuous one. If batch, the same vessel will be used for both mixing and settling, but if continuous, the mixing and settling are usually done in different vessels. The mixing vessel uses some form of rotating impeller placed at its center, which pro-vides an effective dispersion of the phases. The basic unit of the mixer–settler may be connected to form a cascade for cross flow or, more commonly, for countercurrent flow. For economic reasons the use of several mixer–settler units is limited up to five theoretical stages (Blass and Goettert 1994), but it is mostly preferred in cases where no more than two stages are necessary.
The perforated-plate (sieve-plate) column is similar to a tray distillation column. For dispersed phases consisting of light liquids, the plates contain downspouts at their free extremity, which allow for the downward flow of the heavy liquid (continu-ous phase). Below each plate and outside the downspout, the droplets of the light

Dow
nloa
ded
By:
10.
3.98
.104
At:
17:5
3 02
Apr
202
2; F
or: 9
7814
3982
3705
, cha
pter
3, 1
0.12
01/b
1091
2-4
liquid–liquid extraction and adsorption 75
phase coalesce and accumulate in a liquid layer. This layer of liquid flows through the holes of the plate and is dispersed in a large number of droplets within the con-tinuous phase located above this plate. For dispersed phases consisting of heavy liquids, the flow configuration is the other way up.
3.3.2.2 Equipment for Continuous Contact
In such equipment, the liquids flow in continuous multistage countercurrent con-tact as a result of the difference in density of the liquid streams, without complete separation. The force of gravity acts to provide the flows, and the equipment is usu-ally a vertical column with the light liquid entering at the bottom and the heavy one entering at the top. Complete separation of the phases only occurs at one extremity of the equipment, at the top if the dispersed phase is the light liquid, or at the bottom if the heavy liquid is the dispersed one.
The simplest equipment for differential contact is the spray column, which basi-cally consists of an empty shell with provision for introducing and removing the liquids. If the light liquid is the dispersed one, the heavy liquid enters at the top through the distributor and fills the column, then flows downward as a continuous phase and leaves at the bottom. The light liquid enters at the bottom of the column through a distributor, which disperses it into small droplets. These droplets flow upward through the continuous phase, coalesce, and form an interface at the top of the column where the light liquid leaves the equipment. Although this column is eas-ily constructed, it is not recommended for use with more than one or two theoretical stages because of its low mass transfer efficiency as a result of the absence of internal parts that would improve phase dispersion.
In packed columns the shell of the column is filled with random or structural packing arrangements. In the first case, the packing consists of small regular ele-ments with size no larger than one-eighth of the column diameter. On the other hand, structured packing is formed from vertical corrugated thin sheets of ceramic, metal, or plastic materials, with the angle of the corrugations reversed in adjacent sheets to form an open honeycomb structure with inclined channels and a large surface area.
Extractors can also be mechanically agitated to disperse one liquid into the other and ensure rapid mass transfer. There are a great variety of mechanically agitated columns for continuous contact. The first example is the RDC column, which consists of a column with a rotating central shaft containing equally spaced flat discs. Each disc is positioned at the center of a chamber delimited by horizontal stator rings fixed to the column shell. Modifications of the original RDC column can be found in the literature, such as the ones that use perforated discs or columns without stator rings.
The Khüni column has a rotating central shaft with impellers that are fixed at the center of a compartment delimited by two adjacent perforated plates. Pulsed columns are a variation of agitated columns, where perforated plates move up and down or the liquids are pulsed in a stationary column by an outside mechanism. This last type of agitation is compatible with other extractors, such as packed or perforated-plate columns.

Dow
nloa
ded
By:
10.
3.98
.104
At:
17:5
3 02
Apr
202
2; F
or: 9
7814
3982
3705
, cha
pter
3, 1
0.12
01/b
1091
2-4
76 Handbook of nutraceuticals: Volume ii
3.3.2.3 Centrifugal Extractors
The force of gravity may be replaced by centrifugal force in cases where the difference between the phase densities is small, or for mixtures with tendencies to form emulsions. The most important centrifugal extractor is the Podbielniak extrac-tor, which consists of a cylindrical drum containing perforated concentric shells that rotate rapidly. Continuous centrifuges can also be used connected to a settler to accelerate separation of the phases.
More information about equipment for liquid–liquid extraction can be found in Treybal (1980), Godfrey and Slater (1994), and Robbins and Cusak (1997).
3.3.3 mass transfer equations and the types of extraction
The mass balances for an extractor of the stagewise type are presented below. Each stage is a theoretical stage so that the leaving extract and raffinate streams are in equilibrium. The lever-arm rule is discussed first because this rule is required for understanding the mathematical calculations associated with each type of extraction.
Lever-arm rule: If a mixture containing A and C with F kilograms is shaken with a solvent B with S kilograms, a new ternary mixture is generated with M kilo-grams. When agitation stops, the system will separate into two phases, one phase rich in component A with R kilograms and other phase rich in component B with E kilograms.
The mixer and settler units are represented in Figures 3.10 and 3.11, respec-tively, and the lever-arm rule for mixing and settling processes is represented in Figure 3.12.
In case of the mixing process the global mass balance and the mass balances for components B and C are:
F + S = M (3.3)
Component B:
Fx Sy MxB F B S B M, , ,+ = (3.4)
Component C:
F Sy MxC F C S C M
x , , ,+ = (3.5)
SM
yC,S xC,M
F xC,F
Figure 3.10 mixing process.

Dow
nloa
ded
By:
10.
3.98
.104
At:
17:5
3 02
Apr
202
2; F
or: 9
7814
3982
3705
, cha
pter
3, 1
0.12
01/b
1091
2-4
liquid–liquid extraction and adsorption 77
If one substitutes Equation 3.3 into Equation 3.4 and rearranges, the following result is obtained:
F
S
y x
x x
NS
ON
B S B M
B M B F
=−−
=, ,
, , (3.6)
When Equation 3.3 is substituted into Equation 3.5, the result is:
F
S
x y
x x
MN
FP
C M C S
C F C M
=−−
=, ,
, , (3.7)
Equations 3.6 and 3.7 can be combined and rearranged to obtain Equation 3.8:
x x
x x
x y
y xC F C M
B M B F
C M C S
B S B M
, ,
, ,
, ,
, ,
−−
=−− (3.8)
EM
yC,E
xC,M R xC,R
Figure 3.11 settling process.
0.00 0.25 0.50 0.75 1.00
N S
EM
R
O
P
F
1.00
0.75
0.50
0.25
0.00
xB, yB
x C, y
C
Figure 3.12 lever-arm rule with rectangular coordinates.

Dow
nloa
ded
By:
10.
3.98
.104
At:
17:5
3 02
Apr
202
2; F
or: 9
7814
3982
3705
, cha
pter
3, 1
0.12
01/b
1091
2-4
78 Handbook of nutraceuticals: Volume ii
This indicates that points F, M, and S must be lined up (see Figure 3.12). By using the similarity of triangles one can obtain Equation 3.9:
F MN MS
S FP FM= =
(3.9)
By analogy one can derive Equation 3.10:
R
E
ME
RM=
(3.10)
For more details on the lever-arm rule, see Treybal (1980), Geankoplis (1993), and Batista et al. (2009).
As described earlier, there are a variety of equipment configurations, from a single-stage contact, such as a mixer–settlers operating in a batch or continuous way, to countercurrent multistage operations, such as columns of multistage type.
In the design of mass transfer stagewise operations, the first step is the calcula-tion of theoretical stages solving mass balance equations and equilibrium condi-tions. In the sequence graphical methods are presented for calculating liquid–liquid extraction in single-stage and multistage countercurrent equipment.
3.3.3.1 Single-Stage Equilibrium Extraction
Consider the following example: 100 kg/h of a vegetable oil (A) containing 5 mass% of free fatty acids (C) and 100 kg/h of aqueous ethanol (B) enter a single equilibrium stage as that shown in Figure 3.13. The required equilibrium data were taken from Gonçalves and Meirelles (2004), who measured liquid–liquid equilib-rium systems containing palm oil, free fatty acids, and aqueous ethanol at 318.15 K. Feed and solvent streams are mixed, and the exit streams R1 and E1 leave the stage in equilibrium.
The following result is obtained for the global mass balance:
F + S = E1 + R1 = M = 200 kg/h
The lever-arm rule allows indicating the composition of the overall mixture M in Figure 3.14.
F
FS
S
M
M = = =100
2000 5.
R1
E1 S = 100 kg/h, yB,S = 1
F = 100 kg/h
xC,F = 0.05
Figure 3.13 single-stage extraction.

Dow
nloa
ded
By:
10.
3.98
.104
At:
17:5
3 02
Apr
202
2; F
or: 9
7814
3982
3705
, cha
pter
3, 1
0.12
01/b
1091
2-4
liquid–liquid extraction and adsorption 79
This composition can also be calculated by the mass balances for component C and B:
x
x F y S
MC M
C F C S
,
, ,=+
1
x
x F y S
MB M
B F B S
,
, ,=+
1
The extract and raffinate mass flows can be calculated according to the lever-arm rule:
R
E R1
1
1
11 10 83 0 3
M
M
EE R= = ⇒ = ⋅. .8
E
R1
1
90 71
109 29
====
.
.
/
/
kg h
kg h
The composition of extract (E1) and raffinate (R1) streams can be obtained directly from the liquid–liquid diagram (see Figure 3.14):
E1 R1
yC E, .
10 027= x
C R, .1
0 023=
yB E, .
10 938=
x
B R, .1
0 138=
y y yA E B E C E, , ,( )
1 1 11= − + x x x
A R B R C R, , ,( )1 1 1
1= − +y
A E, .1
0 035=
xA R, .
10 839=
0.06
0.04
0.02
0.000.0 0.2 0.4 0.6 0.8 1.0
F
M E1R1
S
xB, yB
x C, y
C
Figure 3.14 phase diagram for a single-stage extraction.

Dow
nloa
ded
By:
10.
3.98
.104
At:
17:5
3 02
Apr
202
2; F
or: 9
7814
3982
3705
, cha
pter
3, 1
0.12
01/b
1091
2-4
80 Handbook of nutraceuticals: Volume ii
3.3.3.2 Continuous Multistage Countercurrent Extractor
Consider the following case: 100 kg/h of a vegetable oil (A) with 5 mass% of free fatty acids (C) enters in the first stage of a countercurrent extractor, and 300 kg/h of aqueous ethanol (B) is fed into the opposite side of the extractor. Extract and raffinate streams flow in a countercurrent arrangement, such as that shown in Figure 3.15. All the raffinate and extract streams that leave the same stage are in equilibrium. Also suppose that the mass fraction of fatty acids in the final raffinate stream must be ≤0.005 (0.5 mass%). The procedure indicated below allows determining the number of theoretical stages required for deacidifying the edible oil according to these speci-fied conditions.
The global mass balance for the whole extractor is given by:
F S R SN
+ = = +M 1
The mass balances for each stage are:
Stage 1: E R F E E F E R1 1 2 1 2 1+ = + ⇒ − = −
Stage 2: E R R E E R E R2 2 1 3 2 1 3 2+ = + ⇒ − = −
Stage 3: E R R E E R E R3 3 2 4 3 2 4 3+ = + ⇒ − = −
And for the N stage (last stage):
Stage N: E R R S E R S RN N N N N N+ = + ⇒ − = −− −1 1
The equations above indicated that the difference between the extract and raffi-nate streams that flows between the same two adjacent stages remains constant. This difference is indicated below by the symbol Δ:
E F E R E R E R S RN N N1 2 1 3 2 1− = − = − = = − =−… − = ∆
Using these sets of equations the following results can be obtained in the case of the deacidification by countercurrent extraction. The global mass balance for the extractor is
F S M R SN
+ = = + = 400 /kg h
S = 300 kg/h, yB,S = 1
1
F = 100 kg/hxC,F = 0.05
N
R1
2...
...E1
xC, RN ≤ 0.005
R2 RN-1 RN
E2 E3 EN
Figure 3.15 flow sheet of countercurrent extraction.
Dow
nloa
ded
By:
10.
3.98
.104
At:
17:5
3 02
Apr
202
2; F
or: 9
7814
3982
3705
, cha
pter
3, 1
0.12
01/b
1091
2-4
liquid–liquid extraction and adsorption 81
By matching the points F and S and applying the lever-arm rule one can mark in the diagram the composition for the global mixture M:
FM
FS
S
M= = =300
400
3
4
This can also be obtained by the mass balances of components B and C:
xx F y S
MC M
C F C S
,, ,=
+
xC M, .= 0 0125
xx F y S
MB M
B F B S
,, ,=
+
xB M, .= 0 750
By matching point RN to M one can determine the composition of E1 in the binod al curve. Points RN and E1 are lined up by mass balance. To obtain point Δ, trace the
lines FE1 and R SN
. The interception of these two lines corresponds to point Δ.
According to the mass balance for the first stage, points F, E1, and Δ are lined up. The same must occur in case of the last stage for points RN, S, and Δ:
E F S RN1 − = − = ∆
According to the mass balance for the second stage, point R1 should be connected to Δ to obtain point E2 in the binodal curve:
E R2 1− = ∆
This procedure should be used until xC RN, .≤ 0 005. In this example, only two
stages are required to reach this composition of component C in the raffinate stream.
The mass flows of raffinate and extract can be calculated by using the lever-arm rule, as indicated in Figure 3.16:
R M
E M
E
RE RN
NN
1
113 3 3 3= = ⇒ =. .
E R
R
E
N
N
1
1
400
93 02
306 98
+ ===
/
/
/
kg h
kg h
kg h
.
.
3.3.4 retention of Nutraceuticals in the deacidification of vegetable oils by Liquid–Liquid extraction
When both operating and equilibrium curves are straight lines, the number of theoretical stages can be calculated without using a graphical method as that shown

Dow
nloa
ded
By:
10.
3.98
.104
At:
17:5
3 02
Apr
202
2; F
or: 9
7814
3982
3705
, cha
pter
3, 1
0.12
01/b
1091
2-4
82 Handbook of nutraceuticals: Volume ii
in Figure 3.16. If the quantity of solute is small and only this component distrib-utes between the two liquid phases, the extract (E) and raffinate (R) streams remain approximately constant along the whole equipment, and their values are equal to the solvent (S) and feed streams (F), respectively. In this case the operating curve will be a straight line. The equilibrium curve can be obtained from liquid–liquid equilibrium data, and for a diluted system, this line is also a straight one. Even for a relatively large quantity of solute, the equilibrium curve may still be a straight line if the solute concentrations in both liquid phases are calculated in a solute-free basis. In this con-centration basis (solute-free), the operating line also remains straight, provided that diluent and solvent are immiscible liquids and only the solute is transferred from one phase to the other. In this case the number of theoretical stages can be calculated by Equation 3.11 (Treybal 1980).
N
x y m
x y mA AC F C S
C R C SN=
−−
− +
log/
/( ), ,
, ,
1
llog( / )1 A (3.11)
where N = number of theoretical stagesx
C F, = solute (C) concentration in the feed stream Fx
C RN, = solute concentration in the raffinate stream RN
yC S, = solute concentration in the solvent streamm = slope of the straight equilibrium line
A is the extraction factor, calculated by Equation 3.12, using the values of the feed (F) and solvent (S) streams.
R1RNR2
0.0 0.4 0.80.2 0.6 1.00.00
0.02
0.04
0.06
xB, yB
x C, y
C
∆
F
SE2
E1
Figure 3.16 phase diagram for countercurrent extraction.

Dow
nloa
ded
By:
10.
3.98
.104
At:
17:5
3 02
Apr
202
2; F
or: 9
7814
3982
3705
, cha
pter
3, 1
0.12
01/b
1091
2-4
liquid–liquid extraction and adsorption 83
A
F
m S=
⋅ (3.12)
As an example, Equation 3.11 was used for estimating the number of theoretical stages required for palm oil deacidification by liquid–liquid extraction. Consider a CPO with 2 mass% of free fatty acids. In this case the solute concentration in the feed stream is x
FFA F, .= 0 02, and the concentration in the raffinate stream should be decreased to x
FFA RN, .= 0 003 (0.3 mass%), so that the final product can be consid-
ered a refined oil. Equilibrium data for this system were measured by Gonçalves and Meirelles (2004) using ethanol with 6.10 mass% of water as the solvent at a temperature of 318.15 K. The corresponding equilibrium line is given by Equation 3.13, whose slope is m = 1.067 (R2 = 0.995). Taking into account that aqueous etha-nol contains no fatty acids (y
FFA S, .= 0 0), the number of theoretical stages was cal-culated for different solvent stream/feed stream ratios (S/F) and is represented in Figure 3.17.
y xFFA E FFA R, ,. .= 1 067 (3.13)
Figure 3.17 shows that the number of stages decreases as the S/F ratio increases. In other words, for a higher number of stages less solvent is required to reach the desirable oil deacidification.
On the other hand, the results shown in Figure 3.17 should be considered as estimated values. As indicated by the equilibrium data (Gonçalves and Meirelles
5
4
3
2
1
0.5 1.0 1.5 2.0 2.5 3.0 3.5 4.0 4.5 5.0 5.5S/F ratio
Num
ber o
f the
oret
ical
stag
es (N
)
Figure 3.17 number of theoretical stages as a function of S/F ratio in palm oil deacidification by liquid–liquid extraction.
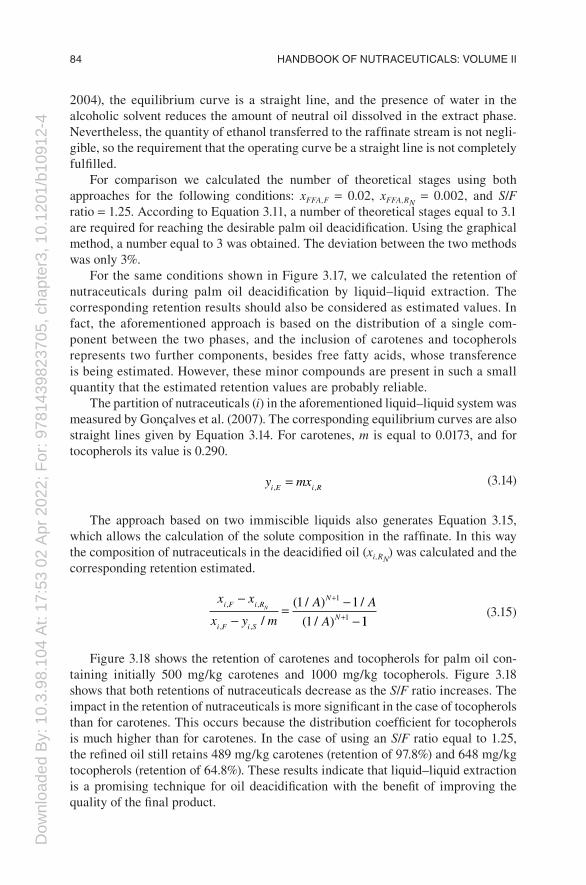
Dow
nloa
ded
By:
10.
3.98
.104
At:
17:5
3 02
Apr
202
2; F
or: 9
7814
3982
3705
, cha
pter
3, 1
0.12
01/b
1091
2-4
84 Handbook of nutraceuticals: Volume ii
2004), the equilibrium curve is a straight line, and the presence of water in the alcoholic solvent reduces the amount of neutral oil dissolved in the extract phase. Nevertheless, the quantity of ethanol transferred to the raffinate stream is not negli-gible, so the requirement that the operating curve be a straight line is not completely fulfilled.
For comparison we calculated the number of theoretical stages using both approaches for the following conditions: xFFA,F = 0.02, xFFA,RN = 0.002, and S/F ratio = 1.25. According to Equation 3.11, a number of theoretical stages equal to 3.1 are required for reaching the desirable palm oil deacidification. Using the graphical method, a number equal to 3 was obtained. The deviation between the two methods was only 3%.
For the same conditions shown in Figure 3.17, we calculated the retention of nutraceuticals during palm oil deacidification by liquid–liquid extraction. The corresponding retention results should also be considered as estimated values. In fact, the aforementioned approach is based on the distribution of a single com-ponent between the two phases, and the inclusion of carotenes and tocopherols represents two further components, besides free fatty acids, whose transference is being estimated. However, these minor compounds are present in such a small quantity that the estimated retention values are probably reliable.
The partition of nutraceuticals (i) in the aforementioned liquid–liquid system was measured by Gonçalves et al. (2007). The corresponding equilibrium curves are also straight lines given by Equation 3.14. For carotenes, m is equal to 0.0173, and for tocopherols its value is 0.290.
y mxi E i R, ,=
(3.14)
The approach based on two immiscible liquids also generates Equation 3.15, which allows the calculation of the solute composition in the raffinate. In this way the composition of nutraceuticals in the deacidified oil (xi,RN
) was calculated and the corresponding retention estimated.
x x
x y m
A A
A
i F i R
i F i S
N
NN, ,
, , /
( / ) /
( / )
−
−= −
−
+
+
1 1
1
1
1 11 (3.15)
Figure 3.18 shows the retention of carotenes and tocopherols for palm oil con-taining initially 500 mg/kg carotenes and 1000 mg/kg tocopherols. Figure 3.18 shows that both retentions of nutraceuticals decrease as the S/F ratio increases. The impact in the retention of nutraceuticals is more significant in the case of tocopherols than for carotenes. This occurs because the distribution coefficient for tocopherols is much higher than for carotenes. In the case of using an S/F ratio equal to 1.25, the refined oil still retains 489 mg/kg carotenes (retention of 97.8%) and 648 mg/kg tocopherols (retention of 64.8%). These results indicate that liquid–liquid extraction is a promising technique for oil deacidification with the benefit of improving the quality of the final product.

Dow
nloa
ded
By:
10.
3.98
.104
At:
17:5
3 02
Apr
202
2; F
or: 9
7814
3982
3705
, cha
pter
3, 1
0.12
01/b
1091
2-4
liquid–liquid extraction and adsorption 85
3.4 FuNdameNtaLs oF adsorptIoN appLIed to the reCovery oF NutraCeutICaLs
Adsorption is a separation process in which a solute, originally dissolved in a fluid stream, is transferred to a solid phase and attached to the exposed surface of this solid by physical and/or chemical interactions. The ion-exchange processes, in which a reversible reaction occurs between the active ionic sites distributed along the solid phase of an ion-exchange resin and some of the ions dissolved in the fluid stream, are also included in this terminology.
The solid phase retaining the solute is called the adsorbent. There are several porous solids with a large interfacial area per unit of volume, including the surface area related to the pore walls inside the solid particles, which work as adsorbents, for example, the zeolites and molecular sieves used for dehydrating gaseous and vapor mixtures. Other examples are activated carbon, activated alumina, and silica gel. There are also synthetic resins, either of an exclusively adsorptive kind without specific active sites or ion-exchange ones containing ionic sites that can capture ions of opposite charge dissolved in the fluid stream.
The solute transferred from the fluid to the solid phase is called the adsorbate. In the processing of food and natural products, the fluid streams containing the adsor-bate are usually liquid extracts, although in other areas adsorptive processes are also used for purifying or for recovering components from gaseous or vapor streams. The present item is focused on the use of adsorption for processing liquid extracts of interest in the production of nutraceuticals and nutritional foods.
The type of interaction that binds the adsorbate to the adsorbent is used for classifying different kinds of adsorption. In the case of physical adsorption
100
90
80
70
60
50
40CarotenesTocopherols
0.5 1.0 1.5 2.0 2.5 3.0 3.5 4.0 4.5 5.0 5.5S/F ratio
Rete
ntio
n of
nut
race
utic
als (
%)
Figure 3.18 retention of nutraceuticals in oil deacidification by liquid–liquid extraction.

Dow
nloa
ded
By:
10.
3.98
.104
At:
17:5
3 02
Apr
202
2; F
or: 9
7814
3982
3705
, cha
pter
3, 1
0.12
01/b
1091
2-4
86 Handbook of nutraceuticals: Volume ii
(physisorption), the solute can be maintained at any point on the surface of the adsorbent by the relatively weak Van der Waals forces, and the adsorption can occur in multiple layers distributed over the whole solid surface. Chemical sorp-tion, also called chemisorption, occurs when a chemical bond is formed between the molecules of solute and active sites present on the solid surface. In this case the solute molecules are attached to specific points on the surface of the adsorbent, not at any place on its surface. The heat of adsorption involved is large, similar to the energy of chemical bonds, and usually only a single layer of solute molecules is adsorbed.
Whereas some authors consider ion exchange as chemical adsorption (Ibarz and Barbosa-Canovas 2003), other researchers opt for classifying it as electro-static adsorption (Inglesakis and Poupoulos 2006). In fact, coulomb attractive forces are the interactions responsible for attachment of the ionic species, trans-ferred from the liquid stream to the charged functional groups that are part of the solid structure. Similar to chemical adsorption, the ionic species adsorbed during ion-exchange processes are connected only to the active sites of the solid phase. Furthermore, ion exchange involves a reversible reaction in which an ionic species linked to the active sites of the solid phase is displaced by ionic species dissolved in the liquid stream according to a stoichiometric relationship defined by the charges of both species. Ion-exchange resins are classified according to the type of ions they can capture from the liquid phase. For example, strong anionic resins are efficient in the adsorption of anions originating from the dissociation of weak acids, such as carbonate, bicarbonate, and acetate. On the other hand, weak anionic resins have greater adsorption capacity but are more appropriate for adsorbing anions derived from strong acids, such as sulfate and chloride. Cationic resins have anionic sites distributed over their surfaces that are able to capture cations from the liquid phase, such as calcium, magnesium, and sodium. The adsorption of anions displaces hydroxyl (OH–) species originally linked to the anionic resin active sites, so that the pH of the liquid phase increases. In the case of cationic resins, H+-ions are displaced by the cations present in the fluid stream, so that the pH decreases.
The design of new adsorptive processes and the evaluation of old ones requires a range of knowledge related to phase equilibrium, the kinetics of diffusion and con-vective mass transfer, and possible equipment configurations. Some of these aspects will be discussed in Sections 3.4.1 to 3.4.3.
3.4.1 phase equilibrium in adsorptive processes
The contact of an adsorbent with an adsorbate dissolved in a fluid medium gen-erates the transference of the solute to the solid surface and its attachment onto this surface. If enough contact time is allowed—a situation more likely to occur in batch systems—stable solute concentrations in the liquid and solid phases are attained, corresponding to the adsorption equilibrium for the specific system under consider-ation, composed of adsorbent, adsorbate, and solvent medium and the corresponding fixed temperature selected for the experiments.

Dow
nloa
ded
By:
10.
3.98
.104
At:
17:5
3 02
Apr
202
2; F
or: 9
7814
3982
3705
, cha
pter
3, 1
0.12
01/b
1091
2-4
liquid–liquid extraction and adsorption 87
The function that relates the solute concentration in the solid phase to its remain-ing value in the fluid media at the selected equilibrium temperature is called the adsorption isotherm. The Langmuir and Freundlich isotherms are two of the most used equations found in the literature for representing adsorption equilibrium data. The Langmuir isotherm is given by Equation 3.16:
q
q K C
K CeL e
L e
=⋅ ⋅
+ ⋅max
1 (3.16)
where qe = equilibrium concentration of the adsorbate in the solid phaseqmax = maximum uptake capacity of the solid phase, that is, the maximum
adsorbate concentration that can be retained by the adsorbentCe = equilibrium concentration of adsorbate in the liquid phaseKL = Langmuir adsorption equilibrium constant
Usually qe and qmax are given in milligrams of adsorbate per gram of solid phase, and Ce is expressed in milligrams of adsorbate per liter of solution. In this case KL is expressed in L × mg−1.
The Langmuir model is based on the assumption that the adsorbent contains fixed individual sites able to adsorb a single molecule per site, so that qmax corre-sponds to the total monolayer capacity of the adsorbent. This model can be derived from kinetic considerations supposing that the net adsorption of the solute depends on the difference of its adsorption and desorption rates; when both rates are equal and the net adsorption attains a value equal to zero, a dynamic equilibrium between solid and liquid phases is obtained.
Another model for adsorption equilibrium is the Freundlich isotherm, given by Equation 3.17. This model does not assume the formation of a monolayer and can be used for adsorbents with heterogeneous surface-containing sites with different adsorption potentials.
q K Ce F e= ⋅ ( )n
(3.17)
where qe and Ce = same meaning already given previouslyKF and n = Freundlich constants
Using units such as mg × g−1 and mg × L−1 for qe and Ce, respectively, n is dimen-sionless and KF is expressed in mg × (g⋅(mg × L−1)1/n)−1.
Figure 3.19 shows the Langmuir isotherms for the adsorption of β-carotene from hexane solutions onto silica gel, according to data reported by Ahmad et al. (2009). Figure 3.20 shows the Freundlich isotherms for the adsorption of phenolic and flavonoid compounds from hydroalcoholic plant extracts onto the macroporous resin XAD-7, according to data reported by Silva et al. (2007).
Although ion-exchange equilibrium can also be represented in terms of the equilibrium constant associated with the exchange reaction, the corresponding equilibrium data are also frequently represented using one of the previously noted

Dow
nloa
ded
By:
10.
3.98
.104
At:
17:5
3 02
Apr
202
2; F
or: 9
7814
3982
3705
, cha
pter
3, 1
0.12
01/b
1091
2-4
88 Handbook of nutraceuticals: Volume ii
isotherms, especially the Langmuir equation. Cren and Meirelles (2005) used the Langmuir isotherm to describe the adsorption of oleic acid from alcoholic solutions onto the strong anionic resin Amberlyst A26-OH (Dow, Midland, Michigan). The exchange reaction is represented by Equation 3.18:
323 K303 K
0 50 100 150 200 250 300
20
15
10
5
0
β-Carotene in liquid phase Ce (mg × L–1)
β-Ca
rote
ne in
solid
pha
se q
e (m
g ×
g–1 )
Figure 3.19 langmuir isotherms for β-carotene adsorption onto silica gel. (from ahmad, a. l., c. Y. chan, s. r. a. shukor, and m. d. mashitah, Chem. Eng. J., 148, 378, 2009. With permission.)
240
200
160
120
80
40
00 500 1000 1500 2000 2500 3000
Polyphenols in liquid phase Ce (mg L–1)
PhenolicsFlavonoidsPo
lyph
enol
s in
solid
pha
se q
e (mg
g
–1)
Figure 3.20 freundlich isotherms for polyphenol adsorption onto resin xad-7. (from silva, e. m., d. r. pompeu, Y. larondelle, and H. rogez, Sep. Purif. Tech., 53, 274, 2007. With permission.)

Dow
nloa
ded
By:
10.
3.98
.104
At:
17:5
3 02
Apr
202
2; F
or: 9
7814
3982
3705
, cha
pter
3, 1
0.12
01/b
1091
2-4
liquid–liquid extraction and adsorption 89
E OH R COO H E OH R COO +( )+αα
αα δ
+ − − +−
− −+ − ↔ − −β β β δδ+ RR
COO H OH+− + +− −β δ . (3.18)
where E OHαα
+ − = anionic resin in its OH-form, containing α active sitesR COO− − = fatty acid in its dissociated form
E OH R COO-α
α+
δ δ− −− = resin with δ sites occupied by the acid anion
The corresponding Langmuir isotherm for oleic acid adsorption by ion exchange is given in Figure 3.21. In this case, as well as in the case of the β-carotene adsorp-tion shown in Figure 3.19, the solid-phase concentration is expressed in milligrams of adsorbate per gram of dry solid phase.
As can be seen in Figure 3.21, the ion-exchange isotherm is steeply inclined, indicating that adsorption of the oleate anions by the resin is favorable. This is nor-mal behavior for ion-exchange adsorption, as a consequence of the high specificity of the resin active sites in capturing species of the opposite charge dissolved in the liquid medium. In fact, isotherms with an upward convex shape, such as those shown in Figures 3.19 to 3.21, are favorable to adsorption. In contrast, isotherms with an upward concave shape are unfavorable because in this case the corresponding adsor-bents only work well with large solute concentrations in the liquid phase.
Because the equilibrium behavior in adsorption processes of interest in the pro-cessing of nutraceuticals and functional foods has been discussed, information con-cerning equipment used on an industrial scale and their operation modes will be discussed in the next section.
3.4.2 equipment and operation modes
Adsorptive processes are usually carried out with the solid phase organized in a fixed bed that is continuously percolated by the liquid stream, as in the scheme
1400
1200
1000
800
600
400
200
00
(a) (b)50 100 150 200 250 300
Oleic acid in liquid phase Ce (mg L–1)0 2 4 6 8 10 12 14 16 18 20Oleic acid in liquid phase Ce (mg L–1)
Ole
ic ac
id in
solid
pha
se q
e (m
g
g–1
)
1400
1200
1000
800
600
400
200
0
Ole
ic ac
id in
solid
pha
se q
e (m
g
g–1
)
Figure 3.21 langmuir isotherms for oleic acid adsorption onto the anionic resin amberlyte a26-oH (a) and the corresponding zoom for lower concentrations (b). (from cren, e. c., and a. J. a. meirelles, J. Chem. Eng. Data, 50, 1529, 2005. With permission.)

Dow
nloa
ded
By:
10.
3.98
.104
At:
17:5
3 02
Apr
202
2; F
or: 9
7814
3982
3705
, cha
pter
3, 1
0.12
01/b
1091
2-4
90 Handbook of nutraceuticals: Volume ii
shown in Figure 3.22. The equipment is a vertical cylindrical shell charged with the desired amount of solid phase, resting on a support with a series of small holes at the bottom of the cylinder, allowing for the exit of the fluid stream without carrying the small beads of the adsorbent with it. The most common operation mode is to feed the liquid stream in at the top of the equipment, so that the liquid phase flows downward, covering the entire solid bed. In fact, the solid bed should be totally immersed in the liquid phase, and air and gas bubbles must be avoided inside the bed to guarantee better contact between both phases.
The fixed-bed operation mode is also a batch operation in which the frontline of the solid-phase concentration migrates from the top of the adsorbent bed downward, as shown in Figure 3.23. During this migration the bed can be divided into three
Figure 3.22 scheme of typical equipment for fixed-bed adsorption.
Time
Figure 3.23 migration of the solid-phase concentration as adsorption evolves.

Dow
nloa
ded
By:
10.
3.98
.104
At:
17:5
3 02
Apr
202
2; F
or: 9
7814
3982
3705
, cha
pter
3, 1
0.12
01/b
1091
2-4
liquid–liquid extraction and adsorption 91
concentration zones: the bottom one almost free of solute adsorption because this part is being percolated by a fluid stream that already contains no adsorbate; the top one practically saturated with the adsorbate and percolated by the fluid stream without net mass transfer; and the intermediate zone, which corresponds to the real adsorption or exchange zone, where the solute mass transfer is in fact occurring. At every instant the solid-phase concentration in this intermediate zone is changing from a value corresponding to saturation at its top borderline to an almost null concentra-tion at its bottom borderline. This zone migrates downward with time as an adsorp-tion wave and finally reaches the bottom of the bed, where the solute concentration begins to increase in the fluid stream that exits the equipment (Treybal 1980).
The line representing the exit concentration as a function of time or volume of the processed liquid stream is known as the breakthrough curve. Figure 3.24 shows two typical breakthrough curves with the exit concentration expressed as a dimen-sionless concentration obtained by dividing the instantaneous exit concentration, Ct, by the input concentration of the liquid phase, Co. The solid curve represents an idealized step function, in which the exit concentration is equal to zero until the solute adsorption reaches and saturates the bottom of the solid bed, but then increases instantaneously to a value equal to the input concentration, or to 1.0, on the dimensionless concentration scale. The ideal step curve corresponds to a situ-ation in which the intermediate zone mentioned previously reduces to a borderline between the top saturation region and the bottom zone with no adsorption. When this borderline reaches the bottom of the solid bed, the saturation of the adsorbent is complete and the exit concentration jumps to the input value. Such a situation requires an infinitely rapid mass transfer rate.
Real breakthrough curves show a behavior similar to that indicated by the dashed line in Figure 3.24. In this case the “leakage” of solute into the exit stream begins to occur well before the solid bed is saturated. The exact form of the breakthrough
0 50 100Time (min)
150 200
IdealNo ideal
1.0
0.8
0.6
0.4
0.2
0.0
C t/C
0
Figure 3.24 typical breakthrough curves.

Dow
nloa
ded
By:
10.
3.98
.104
At:
17:5
3 02
Apr
202
2; F
or: 9
7814
3982
3705
, cha
pter
3, 1
0.12
01/b
1091
2-4
92 Handbook of nutraceuticals: Volume ii
curve depends on a series of factors related to the mass transfer mechanism, the type of equilibrium between adsorbent and adsorbate, and the liquid-phase flow condi-tions through the solid bed because such aspects define the size of the intermediate (or mass transfer) zone mentioned previously.
Figure 3.25 shows an actual breakthrough curve divided into three subregions: the first one evolving from the start of the process up to the breakthrough point indicated by the time tbreak, the second one limited by tbreak and tend, and the third one obtained after the solid bed achieved equilibrium with the liquid stream, indi-cated by the exhaustion time tend. The exhaustion time tend is defined by the first instant at which C C
t o/ ≅ 1 0. and the continuation of the adsorption process after this
instant has no practical purpose, but even in the second region the continuation of the adsorption process already compromises the recovery of the solute or the quality of the exit stream. For this reason, adsorption processes are only carried out until the breakthrough point is reached. The breakthrough point tbreak is defined as the instant at which the outlet stream reaches a specific adimensional concentration, usually a low value within the range 0 01 0 10. .≤ ≤C C
t obreak/ , but the exact specification has
some arbitrariness. In the present case we will assume that tbreak corresponds to an adimensional concentration C C
t obreak/ = 0 10. . Based on these definitions, the follow-
ing equations for calculating the amount of solute can be formulated:
S C Q tC
Ct
break o breakt
o
tbreak
= ⋅ ⋅ − ⋅
∫ d
0 (3.19)
S C Q tC
Ct
end o endt
o
tend
= ⋅ ⋅ − ⋅
∫ d
0 (3.20)
0 50 100 150 200 250 300Time (min)
1.0
0.8
0.6
0.4
0.2
0.0
C t/C
0
tbreaktend
Figure 3.25 the breakthrough curve and the exhaustion and breakthrough points.

Dow
nloa
ded
By:
10.
3.98
.104
At:
17:5
3 02
Apr
202
2; F
or: 9
7814
3982
3705
, cha
pter
3, 1
0.12
01/b
1091
2-4
liquid–liquid extraction and adsorption 93
where Sbreak and Send = amounts of solute adsorbed before the breakthrough and exhaustion points, respectively, were achieved, both expressed in milligrams of adsorbate
Q = volumetric flow rate (L × min−1)
Considering that fixed-bed adsorption is carried out using a constant volumetric flow rate of the liquid phase, the breakthrough curves can be represented as evolv-ing in time or as a function of the accumulated volume of processed liquid stream, without any significant change in Equations 3.19 and 3.20. In fact, the volume of processed liquid stream, Vl, is given by the term V1 = Q ⋅ t, so that Equation 3.21 can replace Equation 3.19.
S C VC
CV
break o l breakt
ol
Vl break
= ⋅ − ⋅
∫,
,
d0
(3.21)
As is clear from the previous definitions, in real breakthrough curves part of the resin capacity cannot effectively be used because all the adsorption occurring after the breakthrough point should be avoided in industrial practice. On the other hand, Sbreak and Send only coincide in the case of an idealized step function, whose corre-sponding breakthrough time tideal also coincides with tbreak = tend.
The exhaustion time tend indicates that the total amount of solute adsorbed by the whole solid bed corresponds to the equilibrium concentration qo with a feed stream concentration Co. Considering that the step function is defined by the following conditions: ∀ < → =t t C C
ideal t o/ 0 0. and ∀ ≥ → =t t C C
ideal t o/ 1 0. ,
the integration of Equations 3.19 and 3.20 gives Equation 3.22. Furthermore, dividing the amount of solute adsorbed before the breakthrough point for an ideal curve, Sideal, by the mass of adsorbent ms should give the uptake capacity of the solid phase qo under the prevailing equilibrium conditions, as indicated by Equation 3.23. Care should be taken in expressing the mass of adsorbent adequately because, as mentioned previously, the uptake capacity of adsorbents is sometimes given as the mass of adsorbate per mass of dry solid phase, and in this case ms in Equation 3.23 must be replaced by the mass of dry adsorbent ms,dry.
S C Q tideal o ideal
= ⋅ ⋅ (3.22)
S
m
C Q t
mqideal
s
o ideal
so
=⋅ ⋅
=
(3.23)
Note that Equation 3.23 allows for the estimation of the amount of adsorbent ms for an ideal breakthrough curve, provided a value for the corresponding break-through time is selected, and the solid-phase uptake capacity under the prevailing equilibrium conditions is known.
The amount of adsorbent ms and the volume of the solid phase are related by the adsorbent bulk density ρb, defined as the mass of solid divided by the total bed

Dow
nloa
ded
By:
10.
3.98
.104
At:
17:5
3 02
Apr
202
2; F
or: 9
7814
3982
3705
, cha
pter
3, 1
0.12
01/b
1091
2-4
94 Handbook of nutraceuticals: Volume ii
volume Vb. In this way, the bed length corresponding to an ideal breakthrough curve Lideal can be determined from Equation 3.24:
L
V
A
m
Aidealb s
b
=ρ
=⋅
(3.24)
where A = cross sectional area of the equipment containing the solid bed
As already observed, if solid-phase concentrations are expressed on a dry weight basis, the mass of adsorbent in Equation 3.24 must take into account the humid-ity of the solid Xs, given in mass of solvent per mass of dry solid, according to Equation 3.25:
m m Xs s dry s= ⋅ +, ( )1
(3.25)
A practical approach for scaling up adsorption processes makes use of the previous equations in the following way. Based on an actual breakthrough curve obtained using a pilot-scale column, the length of unused bed Lnu can be evaluated (Cooney 1999). This bed height corresponds to that part of the adsorption process that would occur between tbreak and tend, so that the actual solid bed should have this additional height to adsorb, up to the breakthrough time, the same total amount of solute Sideal adsorbed in the case of an ideal breakthrough curve. Considering the aforementioned aspects, the actual bed length Lactual for a full-scale process, con-ducted under conditions similar to those used in the pilot test, can be estimated according to Equation 3.26:
L L L L
t
tactual ideal nu idealbreak
ideal
= + = + − ⋅( )1 LL Lt
tideal idealbreak
ideal
= ⋅ −( )2
(3.26)
Once the breakthrough point is reached, the adsorbent should be regenerated so that a new adsorption cycle can be initiated. For this reason fixed-bed operations frequently involve two parallel operating solid beds, one in the adsorption period and the other in the desorptive recovery of the adsorbent, so that the whole process can be conducted continuously.
The use of a larger number of fixed beds in the adsorption period, operating in series, so that the liquid stream percolates through the sequence of solid beds, allows for better usage of the adsorption capacity. Consider a set of n fixed beds, one in desorptive recovery and the other (n-1) beds in the adsorption step. The liquid phase should first be fed into the fixed bed closest to its exhaustion time and flow from this through the sequence of (n-1) beds in the direction of the fixed bed con-taining the most recently recovered adsorbent, so that the whole set of fixed beds simulates countercurrent contact with the best distribution of mass transfer driving force. Because the n adsorbent beds are in fact fixed beds, with no movement or flow of the solid phase, the inlet and outlet positions, through which the liquid streams are fed into and withdrawn from each bed, are switched at regular time intervals to

Dow
nloa
ded
By:
10.
3.98
.104
At:
17:5
3 02
Apr
202
2; F
or: 9
7814
3982
3705
, cha
pter
3, 1
0.12
01/b
1091
2-4
liquid–liquid extraction and adsorption 95
simulate countercurrent contact, always guaranteeing that the liquid stream flows through the sequence of beds from the most saturated to the least saturated one. When a bed reaches complete exhaustion, it is excluded from the sequence and sub-mitted to desorptive recovery, whereas the most recently recovered bed is reintro-duced into the sequence as the last one through which the liquid stream percolates. At every switching of the liquid stream inlets and outlets, a determined bed “moves” one step closer to the point at which the liquid stream is fed into the apparatus, that is, the first step in the sequence of fixed beds. At the next switching, the bed that reaches the first step will be separated and directed to adsorbent recovery. In this way it is possible to use almost the whole adsorbent capacity and also avoid any risk of solute “leakage.”
The use of similar schemes and even of more sophisticated ones, the latter case being applied to the fractionation and purification of mixtures containing two or more solutes of importance, is a topic of growing interest in the pharmaceutical and biotechnological areas. Such equipment, known as simulated moving beds, include two inlet streams, the mixture to be fractionated and the eluent for adsorbent recov-ery, and two outlet streams, extract and raffinate, which are rich in different solutes contained in the feed stream.
3.4.3 modeling breakthrough Curves
As indicated previously, most adsorption and ion-exchange processes are carried out in fixed-bed operations. Besides the practical approach for scaling up adsorp-tion processes mentioned previously, more rigorous alternatives are based on the formulation and solving of differential mass balance equations for the adsorbate. The integration of such equations allows an appropriate representation of break-through curves experimentally determined under different conditions, as well as the prediction of fixed-bed operations for design purposes. In the present item we will present some basic formulations for the mass balance equation and discuss one of its mathematical solutions and the corresponding results in terms of the calculated breakthrough curves.
The phenomenological model was developed using the following assumptions: (1) there is a single adsorbable component in the liquid phase, the liquid stream is fed into the fixed bed under constant conditions of concentration and temperature, and the solute concentration in the feed stream is sufficiently small for the liquid-phase velocity through the solid bed to be unaffected by the adsorption process; (2) the process conditions are isothermal and isobaric; (3) the physical properties of the fluid and solid phases are constant; (4) the column porosity (extraparticle void fraction) is constant, and the particle porosity (intraparticle void fraction) is negligible; and (5) plug flow conditions prevail, so that axial and radial dispersions can be neglected.
Under such assumptions the mass balance equation for the solute, applied to an element of volume in the adsorption column, takes into account the depletion of the solute concentration in the liquid phase as a result of adsorption (first term in Equation 3.27), solute accumulation in the solid phase (second term), and the change

Dow
nloa
ded
By:
10.
3.98
.104
At:
17:5
3 02
Apr
202
2; F
or: 9
7814
3982
3705
, cha
pter
3, 1
0.12
01/b
1091
2-4
96 Handbook of nutraceuticals: Volume ii
in solute concentration resulting from liquid-phase flow (third term), assuming the following form:
∂∂
+ ρε∂∂
= −ν ∂∂
C
t t
C
zb
1 q
(3.27)
where C (mg × L−1) and q (mg/g adsorbent) = solute concentrations in the liquid and solid phases, respectively
ε = column void fraction (volume voids per total bed volume)ρb = bed bulk density (mass of adsorbent per total bed volume, g × L−1)v = interstitial velocity of the liquid phase (dm × min−1)t = time (min)z = axial distance coordinate (dm)
Integration of Equation 3.27 allows one to calculate how the solute concentra-tion in the liquid and adsorbent phases evolves with time and varies with the axial position in the bed. Evolution of the fluid-phase concentration at the fixed-bed exit, that is, the breakthrough curve, can also be obtained. To integrate Equation 3.27 one must define the initial and boundary conditions, and, in addition, relate the rate of solute uptake by the adsorbent ∂ ∂q t/ to either the liquid- (C) or solid-phase (q) concentrations.
Considering that the adsorbent and liquid phases within the fixed bed are ini-tially free of solute and the feed stream has a constant concentration Co at the bed entrance, the following initial and boundary conditions can be defined: ∀ = ⇒ = =z t C z q zand and0 0 0 0 0( , ) ( , ) . and ∀ = ⇒ =t z C t C
oand 0 0( , ) . On the
other hand, the relation of ∂ ∂q t/ to C or q defines the type of solution obtained and the kind of physical situation described.
The easiest assumption is that local equilibrium prevails at every axial position along the fixed bed, so that the concentrations of the solid and liquid phases are related by the equilibrium curve (isotherm) along the entire fixed bed. This assump-tion requires that the mass transfer rate between liquid and solid phases be necessar-ily fast. Nevertheless, in most practical situations, the mass transfer rate is controlled either by diffusion in the solid phase or by film resistance in the liquid phase, and, in the case of macroporous solids, pore diffusion can also be considered in an explicit way. Detailed discussions on the mass transfer mechanisms during adsorption and some of the corresponding ways of solving Equation 3.27 can be found in Perry and Green (1999) and Cooney (1999).
Our attention has been especially focused on an important case for the adsorption of relatively large molecules, in which case the mass transfer control by diffusion in the solid phase is more probable. In this case an approximate analytical solution is possible if one assumes a linear driving force (LDF) approach for describing the con-centration profile within the solid phase and an adsorption isotherm with a constant separation factor Fs less than 1.
The LDF approach can be seen in Equation 3.28 and assumes that the rate of solute uptake by the adsorbent is proportional to the difference between the local adsorbent equilibrium concentration and the instantaneous concentration of the

Dow
nloa
ded
By:
10.
3.98
.104
At:
17:5
3 02
Apr
202
2; F
or: 9
7814
3982
3705
, cha
pter
3, 1
0.12
01/b
1091
2-4
liquid–liquid extraction and adsorption 97
adsorbent at the corresponding axial position. The proportionality constant is the rate coefficient kn, expressed as min−1.
∂∂
= ⋅ −q
tk q q
n e( )
(3.28)
The separation factor FS is calculated using Equation 3.29:
F
Se e
e e
X Y
Y X=
/ ( )
/ ( )
1
1
−−
(3.29)
where X and Y = dimensionless concentrations of the liquid and solid phases
X and Y are obtained by dividing the corresponding original concentrations by those of the reference, in the present case selected as the liquid-phase input concen-tration Co and the corresponding equilibrium concentration in the solid phase qo, as indicated by Equations 3.30 and 3.31:
X
C
Co
=
(3.30)
Y
q
qo
=
(3.31)
Note that in Equation 3.29 the separation factor is defined in a way similar to that of relative volatility in distillation and selectivity in liquid–liquid extraction. In fact, it corresponds to the reciprocal of these variables. The Fs values allow for the following isotherm classification: Fs < 1 corresponds to favorable isotherms, Fs > 1 to unfavorable ones, Fs = 1 is obtained for linear isotherms, and Fs = 0 for irrevers-ible ones.
Thus, the dimensionless version of the Langmuir isotherm can be written as:
Y
X
F F Xee
s s e
=+ − ⋅( )1 (3.32)
In this case the separation factor is given by:
F
K CsL o
=+ ⋅
1
1 (3.33)
Note that the convex Langmuir isotherm, adimensionalized using a specific and constant feed stream concentration Co, gives a constant separation factor that is less than 1. In this case the approximate solution for Equation 3.27, already expressed in terms of the dimensionless concentration of the liquid-phase exit stream (break-through curve), is given as:
1
1
11 1
−⋅ −
+ = ⋅ −
F
X
XN
sFs
In( )
( )τ (3.34)

Dow
nloa
ded
By:
10.
3.98
.104
At:
17:5
3 02
Apr
202
2; F
or: 9
7814
3982
3705
, cha
pter
3, 1
0.12
01/b
1091
2-4
98 Handbook of nutraceuticals: Volume ii
where
N
k V
Qn b=⋅∧ ⋅
(3.35)
k
D
rns
p
=⋅ ⋅15
2
Ψ
(3.36)
∧ =
ρb o
o
q
C
⋅
(3.37)
Ψ = 0 894
1 0 106 0 5
.
. .− ⋅Fs
(3.38)
τ
ε
=−
⋅
⋅∧
tV
QV
Q
b
b
(3.39)
where N = solid-phase number of transfer units and corresponds to an adimensional-ized form of the rate coefficient kn
Λ = partition ratio and corresponds to the volumetric uptake capacity of the adsorbent divided by the input liquid concentration (i.e., the dimension-less uptake capacity of the solid phase)
Ψ = correction factor for improving the predictive capacity of this approxi-mated solution
Ds = diffusion coefficient for the adsorbate in the solid phase (dm2 × min–1)rp = radius of the adsorbent particles (dm)τ = a kind of dimensionless time
The other variables were already defined previously.The previous model was used for predicting breakthrough curves in the case
of the adsorption of oleic acid by ion exchange with the strong anionic resin Amberlyst A26-OH (Dow). The following conditions were considered: a fixed-bed volume of Vb = 0.250 L, porosity ε = 0.39, and containing resin particles with an average radius of rp = 3.0⋅10−3 dm. The bed is percolated by a solution containing oleic acid dissolved in azeotropic ethanol, with an initial concen-tration Co = 8000 mg × L−1 (≅1 mass% of acidity), temperature of 298.15 K, and volumetric flow rate Q = 2.5 × 10⁻² L × min−1. The Langmuir isotherm is shown in Figure 3.21 and has the following parameters: KL = 0.4925 L × mg−1 and qmax = 349.5 mg × (g of wet resin)−1, corresponding to 1329 mg of acid × (g of dry resin)−1.
Most values were taken from Cren et al. (2009), except for the liquid-phase con-centration that was decreased to guarantee an almost constant interstitial velocity,

Dow
nloa
ded
By:
10.
3.98
.104
At:
17:5
3 02
Apr
202
2; F
or: 9
7814
3982
3705
, cha
pter
3, 1
0.12
01/b
1091
2-4
liquid–liquid extraction and adsorption 99
despite the solute transference to the solid phase. The separation factor can be calcu-lated via Equation 3.33 and has the following value: Fs = 2.5⋅10−4.
Cren et al. (2009) also modeled experimental breakthrough curves for this sys-tem using the LDF approach. They solved the partial differential equation system, with no approximation, using the method of lines and adjusting a single rate coeffi-cient kn for the entire set of 11 curves, obtained for different oleic acid concentrations and volumetric flow rates. The kn value obtained was 2.54⋅10−2 min−1. Considering that the average size of the resin was rp = 3.0 × 10⁻³ dm, the solid-phase diffusivity was estimated by Equation 3.36 as Ds = 1.5 × 10⁻⁸ dm2 × min−1.
Figure 3.26 shows the breakthrough curves predicted for solid-phase diffusivi-ties varying within the range (1.2–30)⋅10−8 dm2 × min−1. As is clear from Figure 3.26, larger diffusion coefficients decrease the length of unused bed, improving utilization of the resin uptake capacity. For the largest value tested, the breakthrough curve showed behavior close to an idealized step function, whose ideal breakthrough time would be tideal = 295 minutes. In this case the behavior obtained was similar to the local equilibrium approach mentioned previously.
Figure 3.27 shows the breakthrough curves predicted for different separation factors Fs varying within the range from 2.5⋅10−4 to 4.0⋅10−1 for a diffusion coef-ficient Ds = 6.0 × 10⁻⁸ dm2 × min−1. In the case of adsorption by ion exchange, the Langmuir constant KL usually has a high value, so that the separation factor tends to be small, such as the lowest value in the range indicated previously. On the other hand, in simple adsorptive cases, KL is not so low and the separation factor is not so favorable. For example, in the case of the adsorption of β-carotene by silica gel, FS would have a value of approximately 0.18 according to the data reported by Ahmad et al. (2009) (see Figure 3.19), and an initial concentration Co = 500 mg × L−1, a value similar to the carotene content of CPO. It should be observed that for separation
1.0
0.8
0.6
0.4
C t/C
0
0.2
0.00 100 200 300 400 500 600
1.22.46.030.0
Time (min)
Ds 108 (dm2 min–1)
Figure 3.26 breakthrough curves for different solid-phase diffusivities.

Dow
nloa
ded
By:
10.
3.98
.104
At:
17:5
3 02
Apr
202
2; F
or: 9
7814
3982
3705
, cha
pter
3, 1
0.12
01/b
1091
2-4
100 Handbook of nutraceuticals: Volume ii
factors defined according to Equation 3.29, lower values mean isotherms more favor-able for adsorption, and in the limit case of F
s→ 0, the isotherm tends to be an irre-
versible one. For this reason larger separation factors increase the length of unused bed and advance the breakthrough time significantly, as shown in Figure 3.27.
According to the prevailing mass transfer mechanism, breakthrough curves can be predicted in the way indicated previously or by other strategies of integrating Equation 3.27 as suggested in the literature (Cooney 1999; Perry and Green 1999). By this phenomenological approach or by using the concept of the length of unused bed, one has the main tools for designing and/or evaluating the performance of adsorption processes carried out in a batch way.
3.5 CoNCLudINg remarks
In the present chapter, two different mass transfer unit operations, liquid–liquid extraction and adsorption, were presented as alternative processes for purifying liq-uid foods and/or recovering valuable components from liquid solutions with minimal losses of nutraceutical compounds. In fact, both separation processes are usually carried out under mild conditions of temperature, so that in this first step they are able to preserve components of nutritional value. Nevertheless, liquid–liquid extrac-tion necessarily requires the use of an appropriate solvent, and adsorption processes are often carried out with the original solution dissolved in a selected solvent.
To recover the final product as a pure one, such solvent must be stripped of the obtained liquid stream. Fortunately, the most appropriate solvents are usu-ally light components, such as anhydrous or hydrated short-chain alcohols in the case of liquid–liquid extraction, or water, alcohols, or hydrocarbons in the case of
1.0
0.8
0.6
0.4
0.2
0.0100 200 300 400
4.0 10–1
2.0 10–1
2.5 10–4
Time (min)
C t/C
0
Fs
Figure 3.27 breakthrough curves for different separation factors.

Dow
nloa
ded
By:
10.
3.98
.104
At:
17:5
3 02
Apr
202
2; F
or: 9
7814
3982
3705
, cha
pter
3, 1
0.12
01/b
1091
2-4
liquid–liquid extraction and adsorption 101
adsorption processes. This means that they can be easily stripped at relatively low temperatures, especially when the liquid streams are evaporated or distilled under vacuum conditions. Anyway, in the development of such processes special care should be taken during the solvent selection to guarantee that the subsequent strip-ping conditions are mild enough for preserving the quality of nutraceuticals and functional foods.
aCkNowLedgmeNts
The authors wish to acknowledge FAPESP (Fundação de Amparo à Pesquisa do Estado de São Paulo, 2008/56258-8 and 2008/09502-0), CNPq (Conselho Nacional de Desenvolvimento Científico e Tecnológico, 306250/2007 and 480992/2009-6), and CAPES/PNPD (Coordenação de Aperfeiçoamento de Pessoal de Nível Superior–Programa Nacional de Pós-Doutorado) for their financial support.
reFereNCes
Agalias, A., P. Magiatis, A. L. Skaltsounis, E. Mikros, A. Tsarbopoulos, E. Gikas, I. Spanos, and T. Manios. 2007. A New Process for the Management of Olive Oil Mill Waste Water and Recovery of Natural Antioxidants. Journal of Agricultural and Food Chemistry 55: 2671–76.
Ahmad, A. L., C. Y. Chan, S. R. A. Shukor, and M. D. Mashitah. 2009. Adsorption Kinetics and Thermodynamics of Beta-Carotene on Silica-Based Adsorbent. Chemical Engineering Journal 148: 378–84.
Antoniassi, R. 1996. Deacidification of Corn Oil with Ethanol in a Rotating Disc Column (RDC). PhD diss., State University of Campinas, Brazil.
Antoniassi, R., W. Esteves, and A. J. A. Meirelles. 1998. Pretreatment of Corn Oil for Physical Refining. Journal of the American Oil Chemists’ Society 75: 1411–15.
Batista, E., R. Antoniassi, M. R. Wolf-Maciel, and A. J. A. Meirelles. 2002. Liquid-Liquid Extraction for Deacidification of Vegetable Oils. Paper presented at the International Solvent Extraction Conference (ISEC 2002), Cape Town, South Africa, March 2002, 638–43.
Batista, E., S. Monnerat, K. Kato, L. Stragevitch, and A. J. A. Meirelles. 1999a. Liquid-Liquid Equilibrium for Systems of Canola Oil, Oleic Acid, and Short-Chain Alcohols. Journal of Chemical & Engineering Data 44: 1360–64.
Batista, E., S. Monnerat, L. Stragevitch, C. G. Pina, C. B. Gonçalves, and A. J. A. Meirelles. 1999b. Prediction of Liquid-Liquid Equilibrium for Systems of Vegetable Oils, Fatty Acids, and Ethanol. Journal of Chemical & Engineering Data 44: 1365–69.
Blass, E., and W. Goettert. 1994. Selection of Extractors and Solvents. Liquid-Liquid Extraction Equipment. Edited by J. C. Godfrey and M. J. Slater. Chichester, UK: John Wiley & Sons, 737–67.
Bono, A., C. C. Ming, and M. Sundang. 2007. Liquid Phase Adsorption of α-Tocopherol by Activated Carbon. Journal of Applied Sciences 7: 2080–83.
Ceriani, R., and A. J. A. Meirelles. 2006. Simulation of Continuous Physical Refiners for Edible Oil Deacidification. Journal of Food Engineering 76: 261–71.

Dow
nloa
ded
By:
10.
3.98
.104
At:
17:5
3 02
Apr
202
2; F
or: 9
7814
3982
3705
, cha
pter
3, 1
0.12
01/b
1091
2-4
102 Handbook of nutraceuticals: Volume ii
Chan, K. W., B. S. Baharin, and Y. B. C. Man. 2000. Adsorption Isotherm Studies of Palm, Carotene Extraction by Synthetic Polymer Adsorbent. Journal of Food Lipids 7: 127–41.
Chen, T. H., and G. F. Payne. 2001. Separation of Alpha- and Delta-Tocopherols Due to an Attenuation of Hydrogen Bonding. Industrial & Engineering Chemistry Research 40: 3413–17.
Cherukuri, R. S. V., R. Cheruvanky, I. Lynch, and D. L. McPeak. 1999. Process for Obtaining Micronutrient Enriched Rice Bran Oil. US Patent: 5,985,344, filed August 31,1998, and issued November 16, 1999.
Cheryan, M. 1998. Ultrafiltration and Microfiltration Handbook, 2nd ed. Boca Raton, FL: CRC Press.
Chung, Y., O. Chu, D. Lineback, M. Pepper, and M. Perez Alvarez. 2003. Single Strength Juice Deadification by Ion-Exchange Column. Patent: WO 03/028485 A1, filed September 20, 2002, and issued April 10, 2003.
Ciesla, U., and F. Schüth. 1999. Ordered Mesoporous Materials. Microporous and Mesoporous Materials 27: 131–49.
Cooney, D. O. 1999. Adsorption Design for Wastewater Treatment. Boca Raton, FL: CRC Press.Cren, E. C., L. Cardozo, E. A. Silva, and A. J. A. Meirelles. 2009. Breakthrough Curves for
Oleic Acid Removal from Ethanolic Solutions Using a Strong Anion Exchange Resin. Separation and Purification Technology 69: 1–6.
Cren, E. C., and A. J. A. Meirelles. 2005. Adsorption Isotherms for Oleic Acid Removal from Ethanol Plus Water Solutions Using the Strong Anion-Exchange Resin Amberlyst A26 OH. Journal of Chemical & Engineering Data 50: 1529–34.
Cuevas, M. S., C. E. C. Rodrigues, and A. J. A. Meirelles. 2009. Effect of Solvent Hydration and Temperature in the Deacidification Process of Sunflower Oil Using Ethanol. Journal of Food Engineering 95:291–97.
Daun, H. 2005. Produce Color and Appearance. Produce Degradation: Pathways and Prevention. Edited by O. Lamikanra, S. H. Iman, and D. Ukuku. Boca Raton, FL: Taylor & Francis, 191–222.
Decloux, M., and J. Coustel. 2005. Simulation of a Neutral Spirit Production Plant Using Beer Distillation. International Sugar Journal 107: 628–43.
Frank, T. C., L. Dahuron, B. S. Holden, W. D. Prince, A. S. Seibert, and L. C. Wilson. 2008. Liquid-Liquid Extraction and Other Liquid-Liquid Operations and Equipment. Perry´s Chemical Engineers´ Handbook. Edited by R. H. Perry and D. W. Green. New York: McGraw-Hill, 1–105.
Geankoplis, C. J. (1993). Transport Processes and Unit Operations. Upper Saddle River, NJ: Prentice Hall PTR.
Godfrey, J. C., and M. J. Slater. 1994. Liquid-Liquid Extraction Equipment. Chichester, UK: John Wiley & Sons.
Gonçalves, C. B. 2004. Phase Equilibrium of Systems Composed by Vegetable Oils, Fatty Acids and Hydrated Ethanol. PhD diss., State University of Campinas, Brazil.
Gonçalves, C. B., E. Batista, and A. J. A. Meirelles. 2002. Liquid-Liquid Equilibrium Data for the System Corn Oil + Oleic Acid + Ethanol + Water at 298.15 K. Journal of Chemical & Engineering Data 47: 416–20.
Gonçalves, C. B., and A. J. A. Meirelles. 2004. Liquid–Liquid Equilibrium Data for the System Palm Oil + Fatty Acids + Ethanol + Water at 318.2 K. Fluid Phase Equilibria 221: 139–50.
Gonçalves, C. B., P. A. Pessôa Filho, and A. J. A. Meirelles. 2007. Partition of Nutraceutical Compounds in Deacidification of Palm Oil by Solvent Extraction. Journal of Food Engineering 81: 21–26.
Dow
nloa
ded
By:
10.
3.98
.104
At:
17:5
3 02
Apr
202
2; F
or: 9
7814
3982
3705
, cha
pter
3, 1
0.12
01/b
1091
2-4
liquid–liquid extraction and adsorption 103
Hamm, W. 1992. Liquid-Liquid Extraction in Food Processing. Science and Practice of Liquid-Liquid Extraction. Editedd By J. D. Thornton. Oxford, UK: Clarendon Press, vol. 2, 309–52.
Hartmann, M., A. Vinu, and G. Chandrasekar. 2005. Adsorption of Vitamin E on Mesoporous Carbon Molecular Sieves. Chemistry of Materials 17: 829–33.
Ibarz, A., and G. V. Barbosa-Canovas. 2003. Unit Operations in Food Engineering. Boca Raton, FL: CRC Press.
Inglesakis, V. J., and S. Poupoulos. 2006. Adsorption, Ion Exchange, and Catalysis: Design of Operations and Environmental Applications. Amsterdam: Elsevier.
Karan, A. 1998. Separation of Oryzanol from Crude Rice Bran Oil. https://tspace.library. utoronto.ca/bitstream/1807/15517/1/MQ40908.pdf.
Kim, J., J. S. Godber, J. King, and W. Prinyawiwatkul. 2001. Inhibition of Cholesterol Autoxidation by the Nonsaponifiable Fraction in Rice Bran in an Aqueous Model System. Journal of the American Oil Chemists’ Society 78: 685–89.
Kisler, J. M., A. Dahler, G. W. Stevens, and A. J. O’Connor. 2001. Separation of Biological Molecules Using Mesoporous Molecular Sieves. Microporous and Mesoporous Materials 44: 769–74.
Latip, R. A., B. S. Baharin, Y. B. C. Man, and R. A. Rahman. 2000. Evaluation of Different Types of Synthetic Adsorbents for Carotene Extraction from Crude Palm Oil. Journal of the American Oil Chemists’ Society 77: 1277–81.
Latip, R. A., B. S. Baharin, Y. B. C. Man, and R. A. Rahman. 2001. Effect of Adsorption and Solvent Extraction Process on the Percentage of Carotene Extracted from Crude Palm Oil. Journal of the American Oil Chemists’ Society 78: 83–87.
Leibovitz, Z., and C. Ruckenstein. 1983. Our Experience in Processing Maize (Corn) Germ Oil. Journal of the American Oil Chemists’ Society 60: 347A–51A.
Li, M., P. J. Pham, C. U. Pittman, and T. Y. Li. 2008. Selective Solid-Phase Extraction of α-Tocopherol by Functionalized Ionic Liquid-Modified Mesoporous SBA-15 Adsorbent. Analytical Sciences 24: 1245–50.
Lineback, D., O. Chu, Y. Chung, M. Pepper, and M. Perez Alvarez. 2003. Juice Deadification. Patent: WO 03/028483 A2, filed September 20, 2002, and issued April 10, 2003.
Ma, M. H., and C. I. Lin. 2004. Adsorption Kinetics of Beta-Carotene from Soy Oil Using Regenerated Clay. Separation and Purification Technology 39: 201–09.
Marshall, W. E., and J. I. Wadworth. 1994. Rice Science and Technology. New York: Marcel Dekker Inc.
Mayamol, P. N., C. Balachandran, T. Samuel, A. Sundaresan, and C. Arumughan. 2007. Process technology for the production of micronutrient rich red palm olein. Journal of the American Oil Chemists’ Society 84: 587–96.
Orthoefer, F. T. 1996. Rice Bran Oil: Healthy Lipid Source. Food Technology 50: 62–64. Patel, M., and S. N. Naik. 2004. Gamma-Oryzanol from Rice Bran Oil—A Review. Journal of
Scientific & Industrial Research 63: 569–78. Perry, R. H., and D. W. Green. 1999. Perry’s Chemical Engineers’ Handbook. New York:
McGraw-Hill. Pina, C. G. 2001. Performance of a Rotating Disc Column in the Deacidification of Corn Oil.
PhD diss., State University of Campinas, Brazil.Pina, C. G., and A. J. A. Meirelles. 2000. Deacidification of Corn Oil by Solvent Extraction
in a Perforated Rotating Disc Column. Journal of the American Oil Chemists’ Society 77: 553–59.
Plonis, G. F., and J. Trujillo-Quijano. 1993. Process for Obtaining an Oil with Adjustable Carotene Content from Palm Oil. Patent: EP0529107A1, filed June 19, 1991, and issued March 03, 1993.

Dow
nloa
ded
By:
10.
3.98
.104
At:
17:5
3 02
Apr
202
2; F
or: 9
7814
3982
3705
, cha
pter
3, 1
0.12
01/b
1091
2-4
104 Handbook of nutraceuticals: Volume ii
Reipert, E. C. D’A. 2005. Deacidification of Babassu and Cottonseed Oils by Liquid-Liquid Extraction. Master’s diss., State University of Campinas, Brazil.
Robbins, L. A., and R. W. Cusack. 1997. Liquid-Liquid Extraction Operations and Equipment. Perry’s Chemical Engineers’ Handbook. Edited R. H. Perry and D. W. Green. New York: McGraw-Hill, 1–47.
Rodrigues, C. E. C. 2004. Deacidification of Rice Bran Oil by Liquid-Liquid Extraction (in Portuguese). PhD diss., State University of Campinas, Brazil.
Rodrigues, C. E. C., R. Antoniassi, and A. J. A. Meirelles. 2003. Equilibrium Data for the System Rice Bran Oil + Fatty Acids + Ethanol + Water at 298.2 K. Journal of Chemical & Engineering Data 48: 367–73.
Rodrigues, C. E. C., A. Filipini, and A. J. A. Meirelles. 2006a. Phase Equilibrium for Systems Composed by High Unsaturated Vegetable Oils + Linoleic Acid + Ethanol + Water at 298.2 K. Journal of Chemical & Engineering Data 51: 15–21.
Rodrigues, C. E. C., and A. J. A. Meirelles. 2008. Extraction of Free Fatty Acids from Peanut Oil and Avocado Seed Oil: Liquid-Liquid Equilibrium Data at 298.2 K. Journal of Chemical & Engineering Data 53: 1698–704.
Rodrigues, C. E. C., M. M. Onoyama, and A. J. A. Meirelles. 2006b. Optimization of the Rice Bran Oil Deacidification Process by Liquid-Liquid Extraction. Journal of Food Engineering 73: 370–78.
Rodrigues, C. E. C., E. C. D. Peixoto, and A. J. A. Meirelles. 2007. Phase Equilibrium for Systems Composed by Refined Soybean Oil + Commercial Linoleic Acid + Ethanol + Water, at 323.2K. Fluid Phase Equilibria 261: 122–28.
Rodrigues, C. E. C., P. A. Pessôa Filho, and A. J. A. Meirelles. 2004. Phase Equilibrium for the System Rice Bran Oil + Fatty Acids + Ethanol + Water + γ-Oryzanol + Tocols. Fluid Phase Equilibria 216: 271–83.
Rodrigues, C. E. C., E. C. D. Reipert, A. F. Souza, P. A. Pessôa Filho, and A. J. A. Meirelles. 2005a. Equilibrium Data for Systems Composed by Cottonseed Oil + Commercial Linoleic Acid + Ethanol + Water + Tocopherols at 298.2 K. Fluid Phase Equilibria 238: 193–203.
Rodrigues, C. E. C., F. A. Silva, A. Marsaioli Jr., and A. J. A. Meirelles. 2005b. Deacidification of Brazil Nut and Macadamia Nut Oils by Solvent Extraction: Liquid-Liquid Equilibrium Data at 298.2 K. Journal of Chemical & Engineering Data 50: 517–23.
Sa, L. A. 2007. Deacidification of Soybean Oil by Liquid-Liquid Extraction. Master’s diss., State University of Campinas, Brazil.
Sabah, E. 2007. Decolorization of Vegetable Oils: Chlorophyll-A Adsorption by Acid-Activated Sepiolite. Journal of Colloid and Interface Science 310: 1–7.
Scordino, M., A. Di Mauro, A. Passerini, and E. Maccarone. 2004. Adsorption of Flavonoids on Resins: Cyanidin 3-Glucoside. Journal of Agricultural and Food Chemistry 52: 1965–72.
Scordino, M., A. Di Mauro, A. Passerini, and E. Maccarone. 2005. Selective Recovery of Anthocyanins and Hydroxycinnamates from a Byproduct of Citrus Processing. Journal of Agricultural and Food Chemistry 53: 651–58.
Shin, T. S., J. S. Godber, D. E. Martin, and J. H. Wells. 1997. Hydrolytic Stability and Changes in E Vitamers and Oryzanol of Extruded Rice Bran during Storage. Journal of Food Science 62: 704–28.
Silva, E. M., D. R. Pompeu, Y. Larondelle, and H. Rogez. 2007. Optimisation of the Adsorption of Polyphenols from Inga edulis Leaves on Macroporous Resins Using an Experimental Design Methodology. Separation and Purification Technology 53: 274–80.
Swoboda, P. A. T. 1985. Refining of Palm Oils. Patent: GB2144143, filed June 28, 1984, and issued February 27, 1985.

Dow
nloa
ded
By:
10.
3.98
.104
At:
17:5
3 02
Apr
202
2; F
or: 9
7814
3982
3705
, cha
pter
3, 1
0.12
01/b
1091
2-4
liquid–liquid extraction and adsorption 105
Taguchi, A., and F. Schüth. 2005. Ordered Mesoporous Materials in Catalysis. Microporous and Mesoporous Materials 77: 1–45.
Treybal, R. 1981. Mass Transfer Operations. Singapore: McGraw-Hill. Vinu, A., K. Z. Hossian, P. Srinivasu, M. Miyahara, S. Anandan, N. Gokulakrishnan, T. Mori,
K. Ariga, and V. V. Balasubramanian. 2007. Carboxy-mesoporous Carbon and Its Excellent Adsorption Capability for Proteins. Journal of Materials Chemistry 17: 1819–25.
Zhao, D., Y. Peidong, H. Qisheng, F. C. Bradley, and D. S. Galen. 1998. Topological Construction of Mesoporous Materials. Current Opinion in Solid State & Materials Science 3: 111–21.

Dow
nloa
ded
By:
10.
3.98
.104
At:
17:5
3 02
Apr
202
2; F
or: 9
7814
3982
3705
, cha
pter
3, 1
0.12
01/b
1091
2-4