hanke-guttridge dcf methodology
DESCRIPTION
The Hanke-Guttridge Discounted Cash Flow Model (also known as the HG-DCF) is an adjusted method of the conventional DCF model. The proprietary model uses a more conservative approach and is different from a typical DCF in that it attempts to use the current market price of the publically traded stock to determine the primary value drivers in the model that help yield in the current stock price. Rather than attempting to estimate a finite price that is typical of a traditional DCF model, the HG-DCF focuses more on evaluating the market’s underlying sensitivities and expectations and values equities by backing into current expectations of the market. The firm’s performance that is assumed by the market is then compared to the past performance of the respective company and any relevant public information about the firm’s future operations, such as a firm’s management guidance from its press releases and any relevant reports on competition within a given sector.TRANSCRIPT
12/9/2013
Hanke-Guttridge Discounted
Cash Flow Methodology featuring Activision Blizzard (NASDAQ: ATVI) as an example
David Greenbaum JHU
Hanke-Guttridge Discounted Cash Flow Methodology
1
TABLE OF CONTENTS
I. Overview..................................................................................................................................... 2
II. Fundamental accounting principles........................................................................................... 3
III. The Hanke-Guttridge Discounted Cash Flow model ............................................................... 3
a) Cover Page tab.................................................................................................................... 3
b) Balance Sheet tab ............................................................................................................... 4
c) Income Statement tab .......................................................................................................... 8
d) Hanke-Guttridge Free Cash Flow tab .............................................................................. 11
e) Revenue Growth tab .......................................................................................................... 14
f) Hanke-Guttridge Discounted Cash Flow tab .................................................................... 16
g) Conclusion ........................................................................................................................ 23
h) Monte Carlo tab ................................................................................................................ 23
IV. The memorandum ................................................................................................................... 24
a) Philosophy ......................................................................................................................... 24
b) Technicalities ..................................................................................................................... 24
c) Sections .............................................................................................................................. 24
i. Abstract ......................................................................................................................... 24
ii. Firm description ............................................................................................................. 24
iii. Executive compensation ............................................................................................... 25
iv. Dividend and share history ........................................................................................... 25
v. Management guidance ................................................................................................... 26
vi. Insider transaction information ..................................................................................... 26
vii. Comparison table ......................................................................................................... 26
viii. Firm specific issues .................................................................................................... 26
ix. Conclusion ................................................................................................................... 27
x. Bibliography .................................................................................................................. 27
d) Analysis of Potential Investment in Activision Blizzard .................................................... 27
Hanke-Guttridge Discounted Cash Flow Methodology
2
I. Overview
Considering the fact that the finance discipline and world of investing and capital markets
is constantly changing, it is imperative for one to possess a solid technical skillset. Thus,
Professor Hanke and Mr. Guttridge’s Applied Economics and Finance course provides a select
group of students with real world experience on how to value a company in order to become
successful analysts and/or investors. There are currently three core valuation tools used by
bankers and analysts when valuing a firm. Such methods include the discounted cash flow
analysis (DCF), comparable company analysis, precedent transaction analysis, and, in certain
cases, the sum-of-the-parts analysis and leveraged buyout analysis (LBO) are implemented. It is
usually recommended to utilize the discounted cash flow method given its flexibility and focus
on calculating the present value of business’ free cash flows. Free cash flow is vital as it allows a
company to pursue opportunities that enhance shareholder value. Without cash, it is extremely
difficult to develop new products, make acquisitions, reduce debt, pay dividends, and implement
share repurchases.
The Hanke-Guttridge Discounted Cash Flow Model (also known as the HG-DCF) is an
adjusted method of the conventional DCF model. The proprietary model uses a more
conservative approach and is different from a typical DCF in that it attempts to use the current
market price of the publically traded stock to determine the primary value drivers in the model
that help yield in the current stock price. Rather than attempting to estimate a finite price that is
typical of a traditional DCF model, the HG-DCF focuses more on evaluating the market’s
underlying sensitivities and expectations and values equities by backing into current expectations
of the market. The firm’s performance that is assumed by the market is then compared to the past
performance of the respective company and any relevant public information about the firm’s
future operations, such as a firm’s management guidance from its press releases and any relevant
reports on competition within a given sector.
Therefore, the HG-DCF does not evaluate the current stock price relative to an estimated
price, but rather the analyst can deduce what the current market price stands for in terms of
expectations, such as projected revenue growth and profit margins. Instead of using the
discounting process to forecast the stock price, the analyst decides whether these expectations
are reasonable. Expectations that are overly bullish suggest that the firm is overvalued, while
exceedingly pessimistic expectations suggest that the firm is undervalued and a potential buy.
The benefit of this is that the investor does not have to precisely forecast the future movements
of an equity; the investor merely must have a relatively accurate depiction of the behavior of the
firm’s value drivers. This tactic has performed well historically across firms in various sectors
with different business models, geographic locations, stages of development, and financial and
operating metrics.
The latter part of this paper closely explains the HG-DCF through a model on Activision
Blizzard (NASDAQ: ATVI). This model is represented in an excel workbook that contains six
sheets: the Cover Page, Balance Sheet, Income Statement, Hanke-Guttridge FCF tab, Revenue
Growth tab (broken up by business and geographic segments), and DCF tab. The model is
concluded with a memo that captures the qualitative aspects of the firm, which complements the
quantitative focus of the HG-DCF. Specific sections include an abstract, firm description,
executive compensation, dividend and share history, management guidance, insider transaction
information, company comparison, firm specific issues, a conclusion, and bibliography.
Hanke-Guttridge Discounted Cash Flow Methodology
3
II. Fundamental Accounting Principles
In order to fully appreciate this paper, it is vital to understand basic accounting concepts
and reporting measures. Thus, this section includes a short background of relevant accounting
metrics for the reader to fully understand the HG-DCF.
All publicly traded firms with United States headquarters are required to file annual and
quarterly reports to the Security and Exchange Commission (SEC). In such reports, financial
statements including the balance sheet, the income statement, and the statement of cash flows of
the firm can be found, as well as important qualitative information such as Management
Discussion and Analysis (MD&A) and Executive Compensation.
Currently, the focus of accounting is accrual-based rather than cash-based. This method
measures the position and performance of a firm by recognizing economic events regardless of
when cash transactions occur. The main concept is that such events are recognized by matching
revenues to expenses (the matching principle) at the time in which the transaction occurs rather
than when payment is made or received. It is often argued that this method gives a more accurate
picture of a company's current financial condition as it allows the current cash inflows/outflows
to be combined with future expected cash inflows/outflows. For instance, a magazine publisher
that offers annual subscription payment methods will typically recognize revenue when the
customer receives each magazine, not when they pay for the total 52-week subscription service.
This is different than the HG-DCF’s focus on cash flows, where much of our work lies in
backing out cash flows from the financial statements.
III. The Hanke-Guttridge Discounted Cash Flow model
a) Cover Page
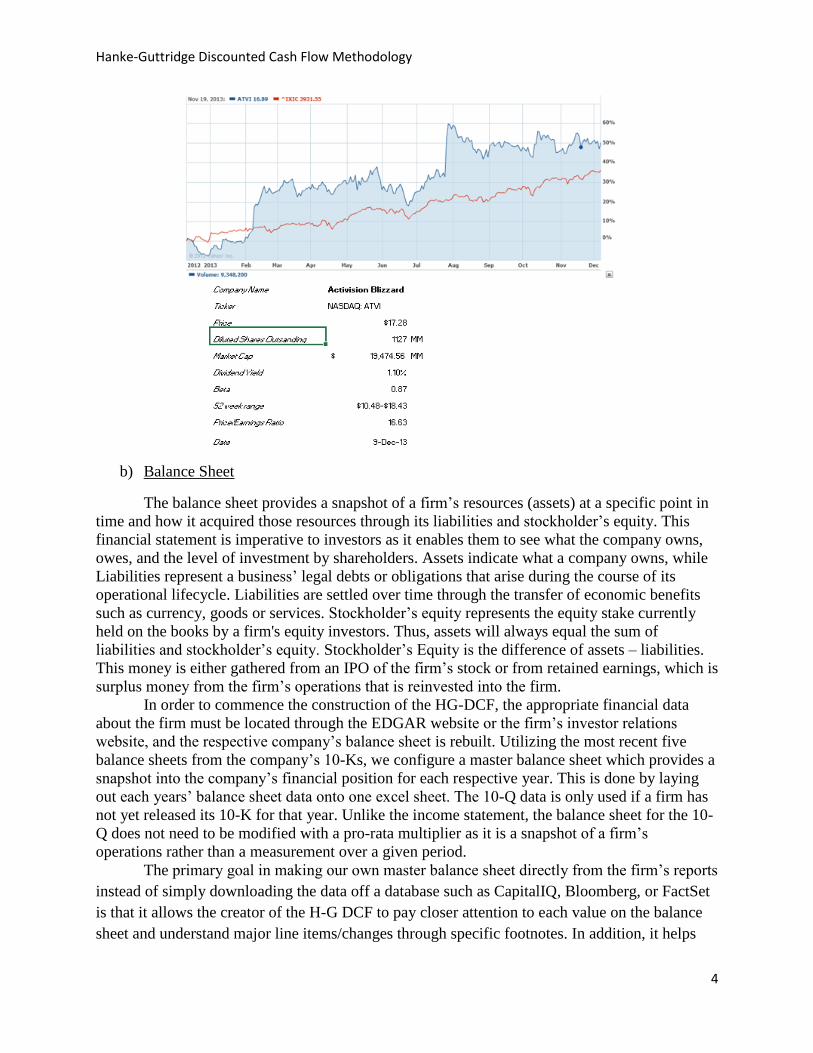
The cover page of the HG-DCF provides a brief snapshot of the firm from an investor’s
standpoint. The tab includes the name and ticker of the company being modeled, a five-year
chart of its stock price, the current price of the stock, its amount of diluted shares outstanding
and market capitalization, and various important ratios such as price/earnings (P/E) and dividend
yield. A five-year graph of the firm’s stock performance is incorporated as it allows the investor
to have a visual representation of clear trends in the stock price, understand its volatility and risk,
and evaluate how the stock price reacted to any large macro events, such as the financial crisis of
2008-2009. While the HG-DCF does not use multiples to calculate the firm’s estimate stock
price, these multiples are still vital to understand the firm and compare their financial and
operating metrics and statistics to those of relevant competitors. A screen shot of a sample cover
page can be found on the next page.
Hanke-Guttridge Discounted Cash Flow Methodology
4
b) Balance Sheet
The balance sheet provides a snapshot of a firm’s resources (assets) at a specific point in
time and how it acquired those resources through its liabilities and stockholder’s equity. This
financial statement is imperative to investors as it enables them to see what the company owns,
owes, and the level of investment by shareholders. Assets indicate what a company owns, while
Liabilities represent a business’ legal debts or obligations that arise during the course of its
operational lifecycle. Liabilities are settled over time through the transfer of economic benefits
such as currency, goods or services. Stockholder’s equity represents the equity stake currently
held on the books by a firm's equity investors. Thus, assets will always equal the sum of
liabilities and stockholder’s equity. Stockholder’s Equity is the difference of assets – liabilities.
This money is either gathered from an IPO of the firm’s stock or from retained earnings, which is
surplus money from the firm’s operations that is reinvested into the firm.
In order to commence the construction of the HG-DCF, the appropriate financial data
about the firm must be located through the EDGAR website or the firm’s investor relations
website, and the respective company’s balance sheet is rebuilt. Utilizing the most recent five
balance sheets from the company’s 10-Ks, we configure a master balance sheet which provides a
snapshot into the company’s financial position for each respective year. This is done by laying
out each years’ balance sheet data onto one excel sheet. The 10-Q data is only used if a firm has
not yet released its 10-K for that year. Unlike the income statement, the balance sheet for the 10-
Q does not need to be modified with a pro-rata multiplier as it is a snapshot of a firm’s
operations rather than a measurement over a given period.
The primary goal in making our own master balance sheet directly from the firm’s reports
instead of simply downloading the data off a database such as CapitalIQ, Bloomberg, or FactSet
is that it allows the creator of the H-G DCF to pay closer attention to each value on the balance
sheet and understand major line items/changes through specific footnotes. In addition, it helps
Hanke-Guttridge Discounted Cash Flow Methodology
5
avoid mistakes that may be in these sources and organize the balance sheet data in an easy to use
form needed for the construction of the FCF, revenue growth, and DCF tabs.
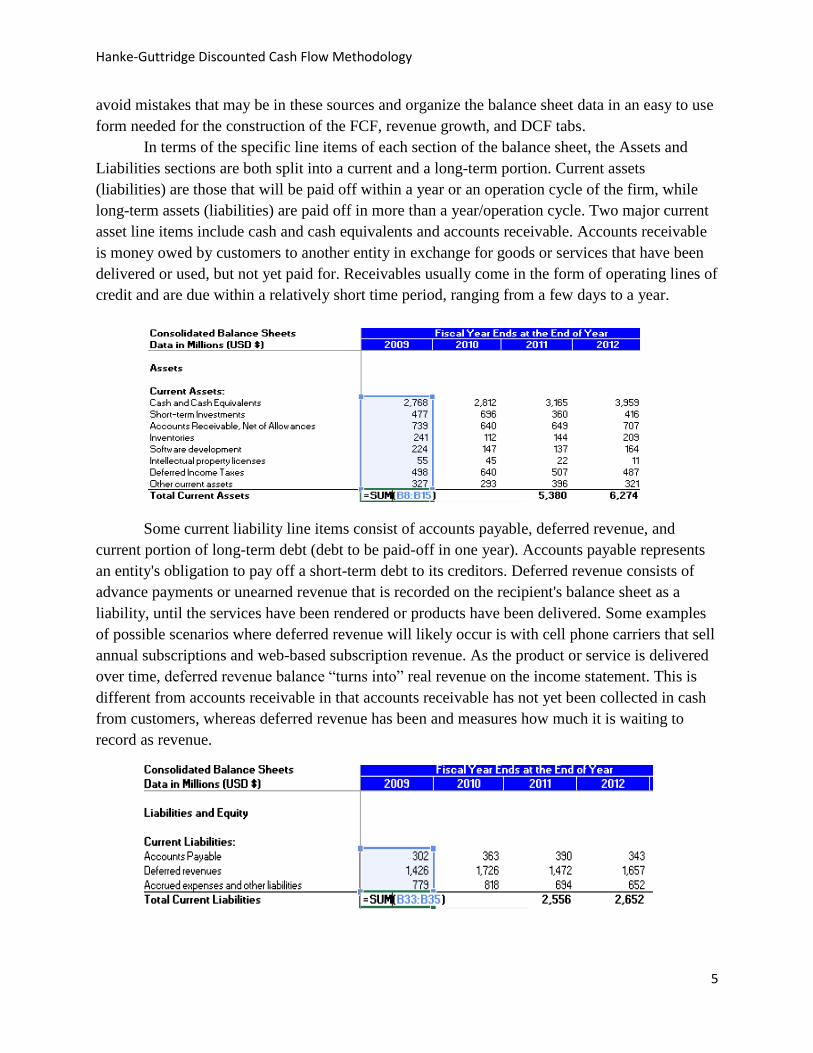
In terms of the specific line items of each section of the balance sheet, the Assets and
Liabilities sections are both split into a current and a long-term portion. Current assets
(liabilities) are those that will be paid off within a year or an operation cycle of the firm, while
long-term assets (liabilities) are paid off in more than a year/operation cycle. Two major current
asset line items include cash and cash equivalents and accounts receivable. Accounts receivable
is money owed by customers to another entity in exchange for goods or services that have been
delivered or used, but not yet paid for. Receivables usually come in the form of operating lines of
credit and are due within a relatively short time period, ranging from a few days to a year.
Some current liability line items consist of accounts payable, deferred revenue, and
current portion of long-term debt (debt to be paid-off in one year). Accounts payable represents
an entity's obligation to pay off a short-term debt to its creditors. Deferred revenue consists of
advance payments or unearned revenue that is recorded on the recipient's balance sheet as a
liability, until the services have been rendered or products have been delivered. Some examples
of possible scenarios where deferred revenue will likely occur is with cell phone carriers that sell
annual subscriptions and web-based subscription revenue. As the product or service is delivered
over time, deferred revenue balance “turns into” real revenue on the income statement. This is
different from accounts receivable in that accounts receivable has not yet been collected in cash
from customers, whereas deferred revenue has been and measures how much it is waiting to
record as revenue.
Hanke-Guttridge Discounted Cash Flow Methodology
6
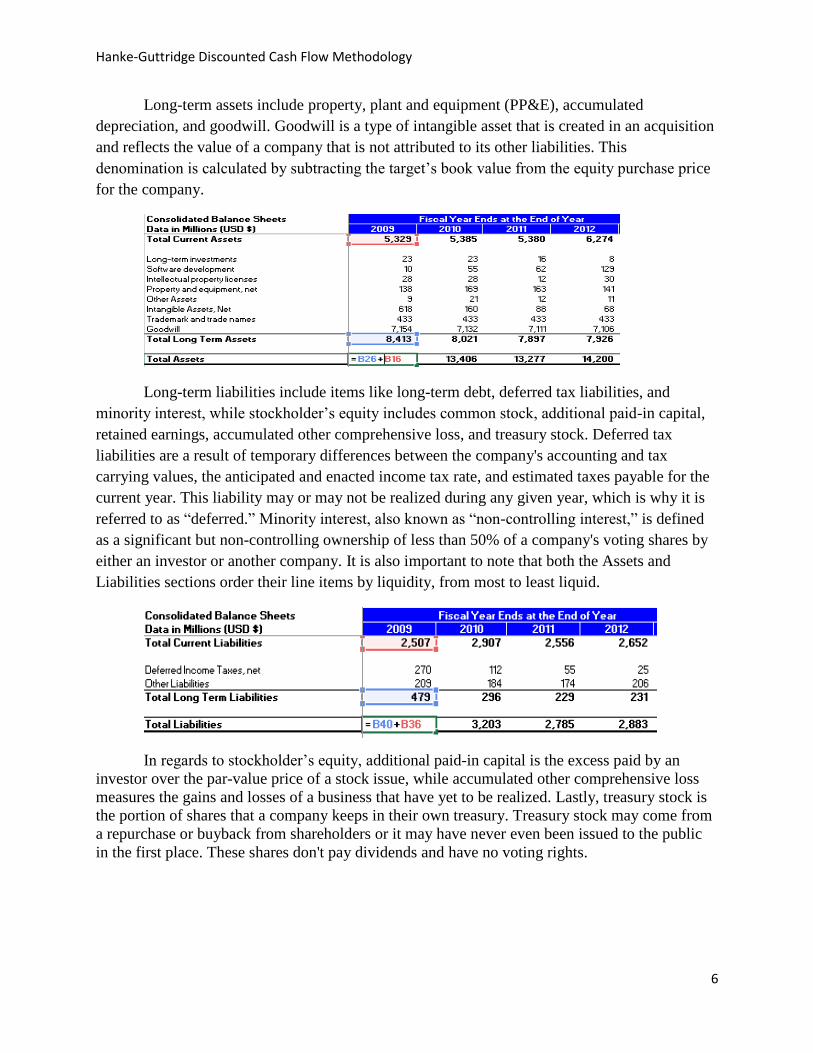
Long-term assets include property, plant and equipment (PP&E), accumulated
depreciation, and goodwill. Goodwill is a type of intangible asset that is created in an acquisition
and reflects the value of a company that is not attributed to its other liabilities. This
denomination is calculated by subtracting the target’s book value from the equity purchase price
for the company.
Long-term liabilities include items like long-term debt, deferred tax liabilities, and
minority interest, while stockholder’s equity includes common stock, additional paid-in capital,
retained earnings, accumulated other comprehensive loss, and treasury stock. Deferred tax
liabilities are a result of temporary differences between the company's accounting and tax
carrying values, the anticipated and enacted income tax rate, and estimated taxes payable for the
current year. This liability may or may not be realized during any given year, which is why it is
referred to as “deferred.” Minority interest, also known as “non-controlling interest,” is defined
as a significant but non-controlling ownership of less than 50% of a company's voting shares by
either an investor or another company. It is also important to note that both the Assets and
Liabilities sections order their line items by liquidity, from most to least liquid.
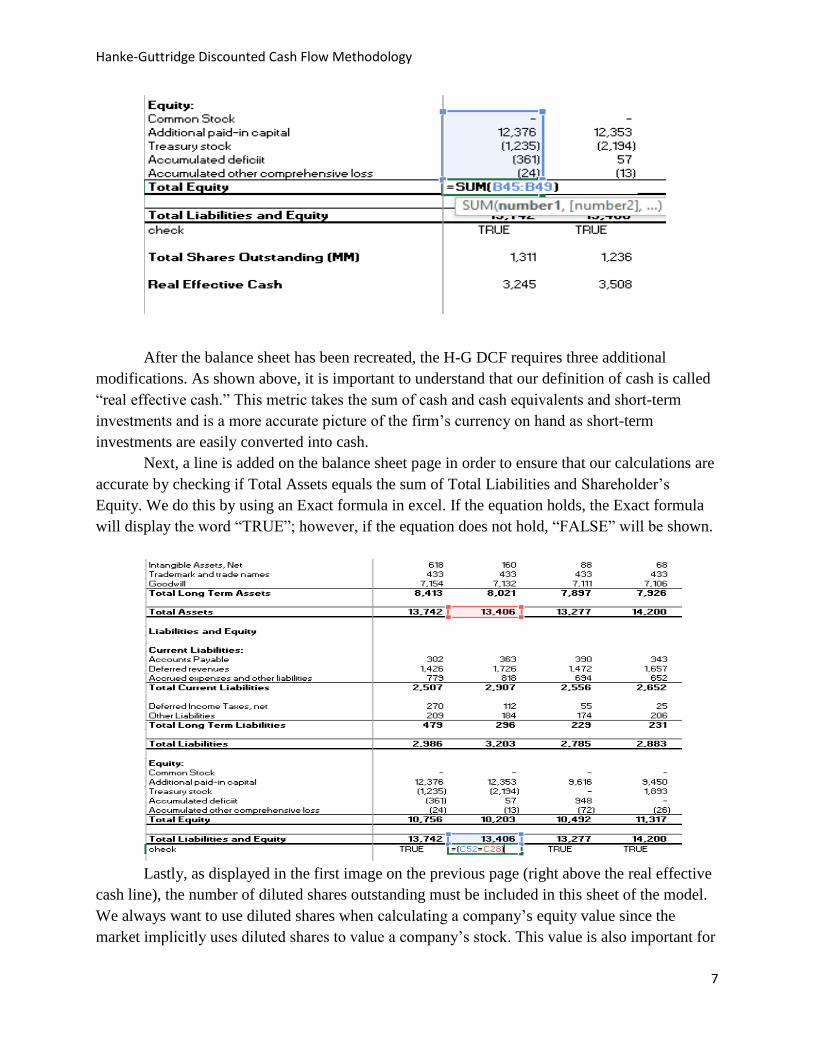
In regards to stockholder’s equity, additional paid-in capital is the excess paid by an
investor over the par-value price of a stock issue, while accumulated other comprehensive loss
measures the gains and losses of a business that have yet to be realized. Lastly, treasury stock is
the portion of shares that a company keeps in their own treasury. Treasury stock may come from
a repurchase or buyback from shareholders or it may have never even been issued to the public
in the first place. These shares don't pay dividends and have no voting rights.
Hanke-Guttridge Discounted Cash Flow Methodology
7
After the balance sheet has been recreated, the H-G DCF requires three additional
modifications. As shown above, it is important to understand that our definition of cash is called
“real effective cash.” This metric takes the sum of cash and cash equivalents and short-term
investments and is a more accurate picture of the firm’s currency on hand as short-term
investments are easily converted into cash.
Next, a line is added on the balance sheet page in order to ensure that our calculations are
accurate by checking if Total Assets equals the sum of Total Liabilities and Shareholder’s
Equity. We do this by using an Exact formula in excel. If the equation holds, the Exact formula
will display the word “TRUE”; however, if the equation does not hold, “FALSE” will be shown.
Lastly, as displayed in the first image on the previous page (right above the real effective
cash line), the number of diluted shares outstanding must be included in this sheet of the model.
We always want to use diluted shares when calculating a company’s equity value since the
market implicitly uses diluted shares to value a company’s stock. This value is also important for
Hanke-Guttridge Discounted Cash Flow Methodology
8
later calculations in the model and allows investors to see trends in the share count. Basic shares
represent the number of common shares that are outstanding today (or as of the reporting date).
Diluted shares outstanding takes the sum of basic shares outstanding, the dilutive effect of stock
options, and any other dilutive securities such as warrants, convertible preferred stock, and
convertible debt. The dilutive effect of stock options is calculated through the Treasury Stock
Method. The first step of this method is to take a tally of the company’s issued stock options and
weighted average exercise prices, which is located in the company’s most recent 10K. Once we
have this option information, we then subtract the exercise price of the options from the current
share price, divide by the share price, and multiply by the number of options outstanding. Since
most companies will report several line items of options categorized by exercise price, this
calculation is repeated for each subset of options reported in the 10K. Aggregating the
calculations gives us the amount of diluted shares. If the exercise price of an option is greater
than the share price, then the options are out-of-the-money and have no dilutive effect. The
concept of the treasury stock method is that when employees exercise options, the firm has to
issue the proper amount of new shares but also receives the exercise price of the options in
cash. The company can then “use” this cash to offset the cost of issuing new shares. This is why
the diluted effect of exercising one option is not one full share of dilution, but a portion of a
share equal to what the company does not receive in cash divided by the share price. The
equation for Earnings per Share (EPS) is given below:
EPS = Net Income / Diluted Shares Outstanding
We can see above that an increase in the number of shares in the denominator will lower EPS.
c) Income Statement
The income statement measures a firm’s revenues and expenses through both operating
and non-operating activities over a specific accounting period. The income statement is divided
into two components: the operating and non-operating sections. The portion of the income
statement that deals with operating items is important to analysts and investors as it discloses
information about revenues and expenses that are directly linked to the firm’s regular business
operations. For instance, if a business creates medical equipment, then the operating items
section would discuss the revenues and expenses involved with the production of medical
equipment. The non-operating items section discloses revenue and expense information about
activities that are not tied directly to a company's regular operations. For example, if the medical
equipment company sold a factory and old plant equipment, then this information would be in
the non-operating items section.
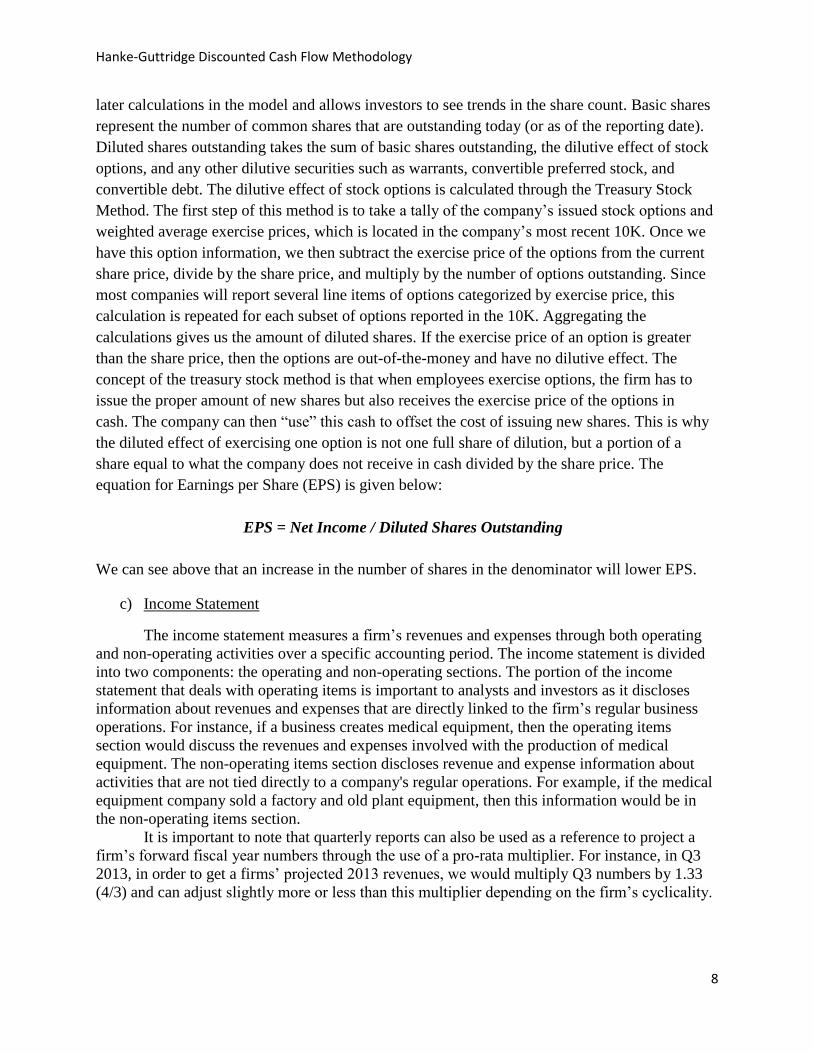
It is important to note that quarterly reports can also be used as a reference to project a
firm’s forward fiscal year numbers through the use of a pro-rata multiplier. For instance, in Q3
2013, in order to get a firms’ projected 2013 revenues, we would multiply Q3 numbers by 1.33
(4/3) and can adjust slightly more or less than this multiplier depending on the firm’s cyclicality.
Hanke-Guttridge Discounted Cash Flow Methodology
9
The income statement also depicts the net profit or loss incurred over a specific
accounting period, typically over a fiscal quarter or year. The equation for the income
statement’s net income or “bottom line” is given below:
Net Income = Revenue – Operating Expenses – Non-operating Expenses + Non-operating Income
The operating items vary by industry. While interest expense is classified as an operating
expense only for financial firms, income from financial derivatives gained through hedging is
considered non-operating income.
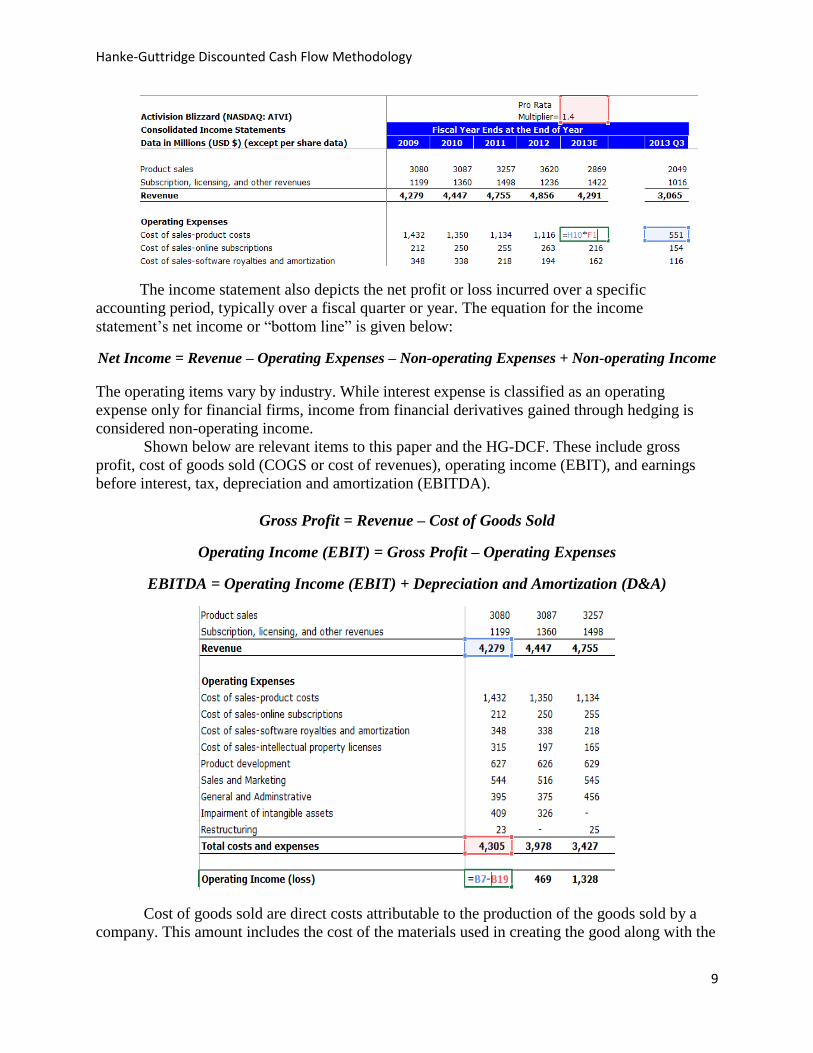
Shown below are relevant items to this paper and the HG-DCF. These include gross
profit, cost of goods sold (COGS or cost of revenues), operating income (EBIT), and earnings
before interest, tax, depreciation and amortization (EBITDA).
Gross Profit = Revenue – Cost of Goods Sold
Operating Income (EBIT) = Gross Profit – Operating Expenses
EBITDA = Operating Income (EBIT) + Depreciation and Amortization (D&A)
Cost of goods sold are direct costs attributable to the production of the goods sold by a
company. This amount includes the cost of the materials used in creating the good along with the
Hanke-Guttridge Discounted Cash Flow Methodology
10
direct labor costs used to produce the good. Many firms build Depreciation and Amortization
(D&A) into COGS. It excludes indirect or “operating” expenses such as distribution costs and
sales force costs. Depreciation is a non-cash expense that approximates the reduction of the book
value of a company’s PP&E over its estimated useful life, while amortization is the decrease of
intangible assets (e.g. patents, copyrights) over the asset’s life. These numbers can be found in a
firm’s Statement of Cash Flows under Cash Flow from Operations. Typically, a more mature
company will have a higher gross profit than a high growth start-up as a growth stage firm will
typically spend more in variable costs per each item sold and is not yet fully scaled nor have they
optimized cost efficiency and revenue maximization. Analysts and investors tend to focus on
EBITDA because it indicates the profitability of a firm’s main business operations as net income
contains many non-cash expenses that are excluded in EBITDA. Since some companies may
have unusually high D&A in years where they may have purchased a large amount of machinery,
EBITDA tends to be a more accurate picture of the company’s operations. Despite this, EBITDA
is a poor proxy for free cash flow as it is prior to capital expenditures and firms have different
capital intensities. This is evident as it is possible for a company with positive EBITDA to go
bankrupt if they are spending too much money on capital expenditures, there are significant one-
time charges (e.g. litigation expenses, restructuring expenses), and/or the company has high
interest expense and is no longer able to afford its debt.
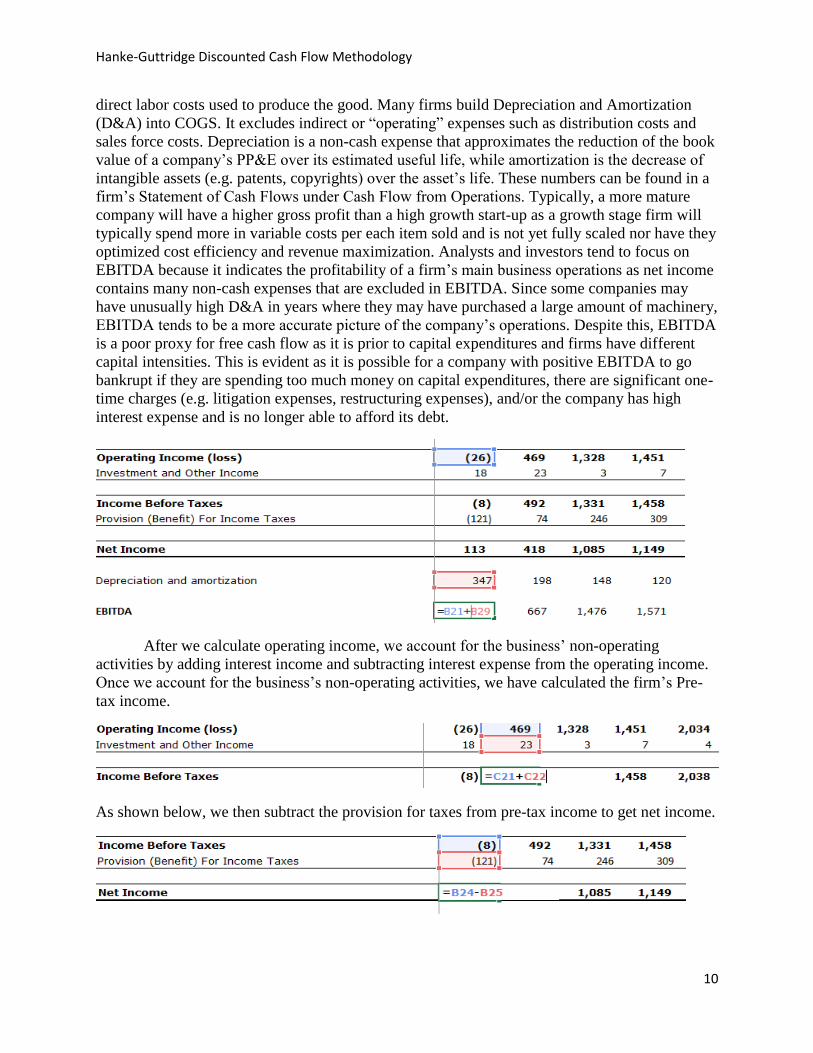
After we calculate operating income, we account for the business’ non-operating
activities by adding interest income and subtracting interest expense from the operating income.
Once we account for the business’s non-operating activities, we have calculated the firm’s Pre-
tax income.
As shown below, we then subtract the provision for taxes from pre-tax income to get net income.
Hanke-Guttridge Discounted Cash Flow Methodology
11
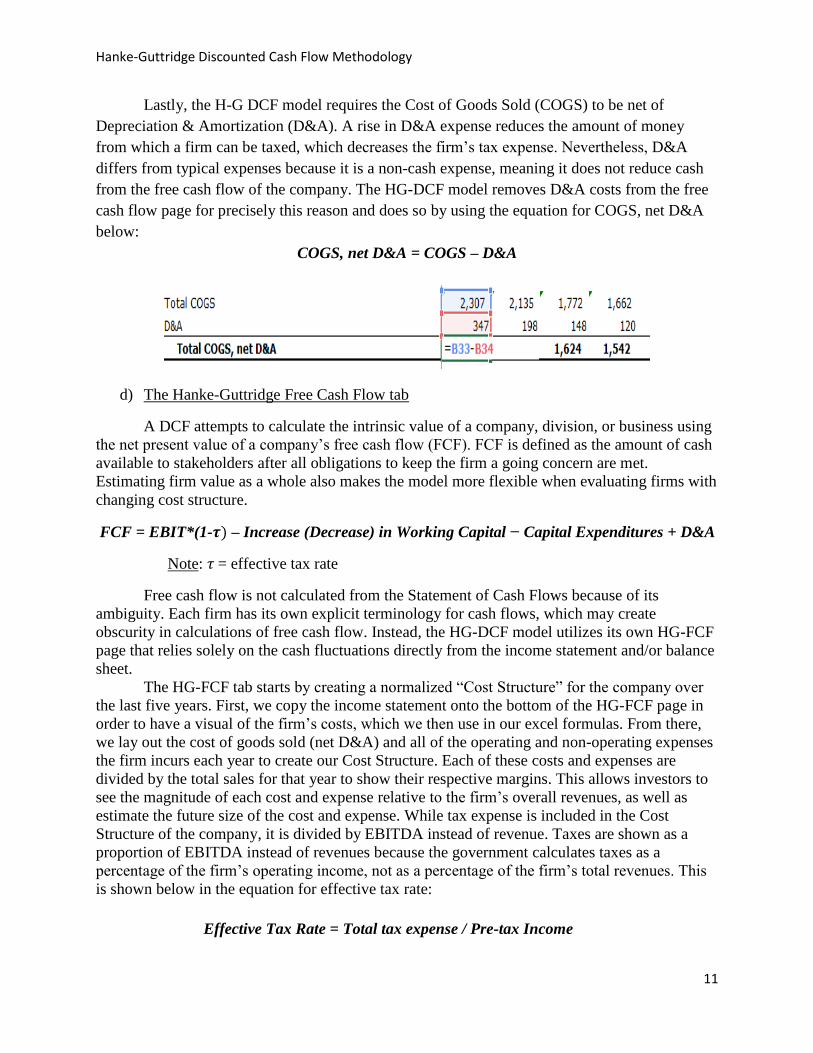
Lastly, the H-G DCF model requires the Cost of Goods Sold (COGS) to be net of
Depreciation & Amortization (D&A). A rise in D&A expense reduces the amount of money
from which a firm can be taxed, which decreases the firm’s tax expense. Nevertheless, D&A
differs from typical expenses because it is a non-cash expense, meaning it does not reduce cash
from the free cash flow of the company. The HG-DCF model removes D&A costs from the free
cash flow page for precisely this reason and does so by using the equation for COGS, net D&A
below:
COGS, net D&A = COGS – D&A
d) The Hanke-Guttridge Free Cash Flow tab
A DCF attempts to calculate the intrinsic value of a company, division, or business using
the net present value of a company’s free cash flow (FCF). FCF is defined as the amount of cash
available to stakeholders after all obligations to keep the firm a going concern are met.
Estimating firm value as a whole also makes the model more flexible when evaluating firms with
changing cost structure.
FCF = EBIT*(1-𝝉) – Increase (Decrease) in Working Capital − Capital Expenditures + D&A
Note: 𝜏 = effective tax rate
Free cash flow is not calculated from the Statement of Cash Flows because of its
ambiguity. Each firm has its own explicit terminology for cash flows, which may create
obscurity in calculations of free cash flow. Instead, the HG-DCF model utilizes its own HG-FCF
page that relies solely on the cash fluctuations directly from the income statement and/or balance
sheet.
The HG-FCF tab starts by creating a normalized “Cost Structure” for the company over
the last five years. First, we copy the income statement onto the bottom of the HG-FCF page in
order to have a visual of the firm’s costs, which we then use in our excel formulas. From there,
we lay out the cost of goods sold (net D&A) and all of the operating and non-operating expenses
the firm incurs each year to create our Cost Structure. Each of these costs and expenses are
divided by the total sales for that year to show their respective margins. This allows investors to
see the magnitude of each cost and expense relative to the firm’s overall revenues, as well as
estimate the future size of the cost and expense. While tax expense is included in the Cost
Structure of the company, it is divided by EBITDA instead of revenue. Taxes are shown as a
proportion of EBITDA instead of revenues because the government calculates taxes as a
percentage of the firm’s operating income, not as a percentage of the firm’s total revenues. This
is shown below in the equation for effective tax rate:
Effective Tax Rate = Total tax expense / Pre-tax Income
Hanke-Guttridge Discounted Cash Flow Methodology
12
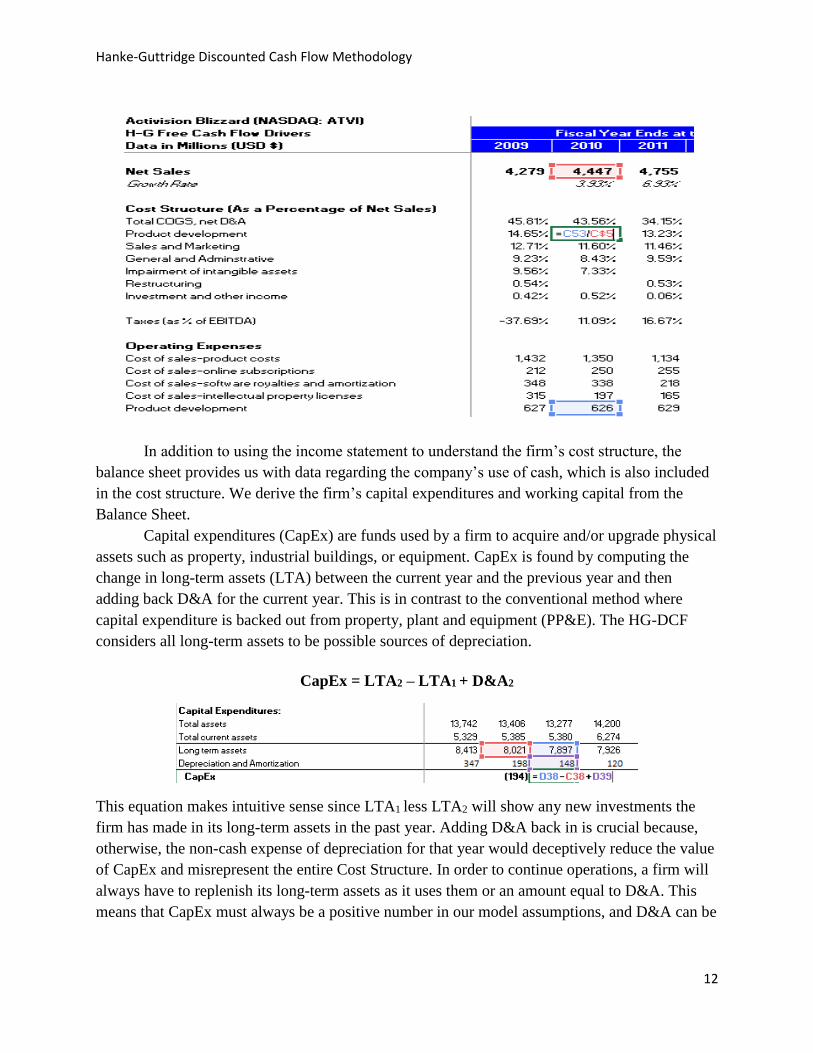
In addition to using the income statement to understand the firm’s cost structure, the
balance sheet provides us with data regarding the company’s use of cash, which is also included
in the cost structure. We derive the firm’s capital expenditures and working capital from the
Balance Sheet.
Capital expenditures (CapEx) are funds used by a firm to acquire and/or upgrade physical
assets such as property, industrial buildings, or equipment. CapEx is found by computing the
change in long-term assets (LTA) between the current year and the previous year and then
adding back D&A for the current year. This is in contrast to the conventional method where
capital expenditure is backed out from property, plant and equipment (PP&E). The HG-DCF
considers all long-term assets to be possible sources of depreciation.
CapEx = LTA2 – LTA1 + D&A2
This equation makes intuitive sense since LTA1 less LTA2 will show any new investments the
firm has made in its long-term assets in the past year. Adding D&A back in is crucial because,
otherwise, the non-cash expense of depreciation for that year would deceptively reduce the value
of CapEx and misrepresent the entire Cost Structure. In order to continue operations, a firm will
always have to replenish its long-term assets as it uses them or an amount equal to D&A. This
means that CapEx must always be a positive number in our model assumptions, and D&A can be
Hanke-Guttridge Discounted Cash Flow Methodology
13
used as a proxy for CapEx when the average CapEx value over the last five years is distorted by
significant Property, Plant, and Equipment sales or purchases.
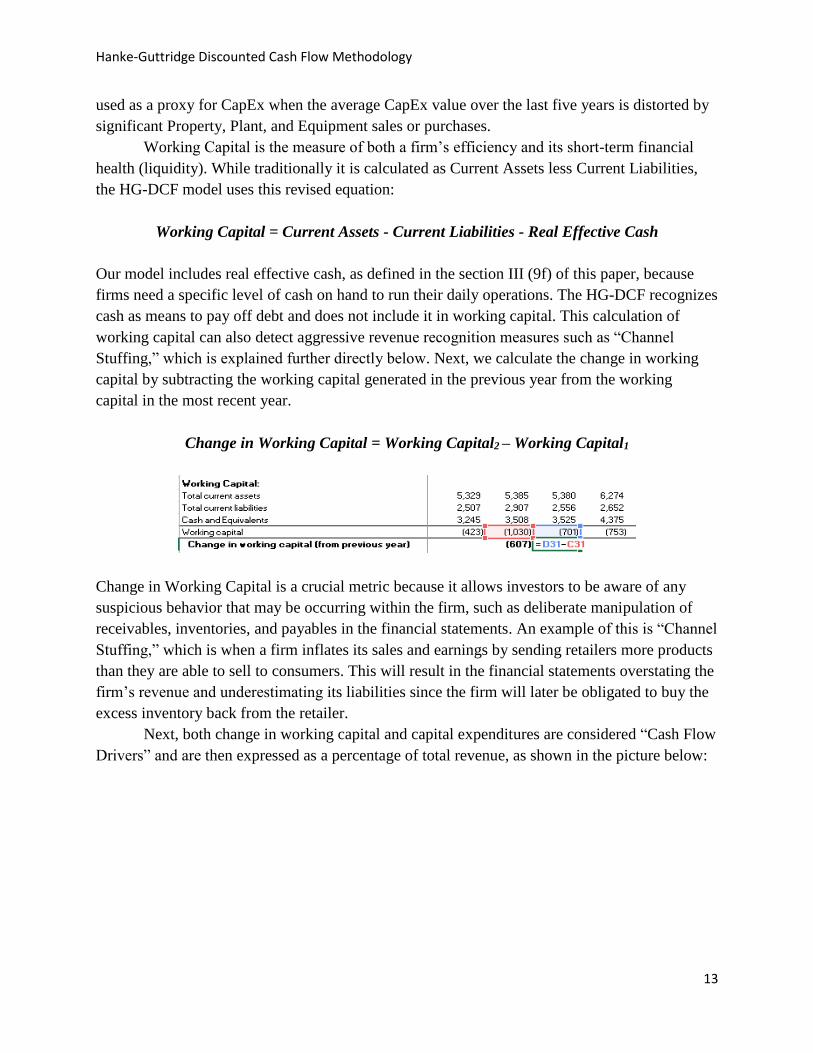
Working Capital is the measure of both a firm’s efficiency and its short-term financial
health (liquidity). While traditionally it is calculated as Current Assets less Current Liabilities,
the HG-DCF model uses this revised equation:
Working Capital = Current Assets - Current Liabilities - Real Effective Cash
Our model includes real effective cash, as defined in the section III (9f) of this paper, because
firms need a specific level of cash on hand to run their daily operations. The HG-DCF recognizes
cash as means to pay off debt and does not include it in working capital. This calculation of
working capital can also detect aggressive revenue recognition measures such as “Channel
Stuffing,” which is explained further directly below. Next, we calculate the change in working
capital by subtracting the working capital generated in the previous year from the working
capital in the most recent year.
Change in Working Capital = Working Capital2 – Working Capital1
Change in Working Capital is a crucial metric because it allows investors to be aware of any
suspicious behavior that may be occurring within the firm, such as deliberate manipulation of
receivables, inventories, and payables in the financial statements. An example of this is “Channel
Stuffing,” which is when a firm inflates its sales and earnings by sending retailers more products
than they are able to sell to consumers. This will result in the financial statements overstating the
firm’s revenue and underestimating its liabilities since the firm will later be obligated to buy the
excess inventory back from the retailer.
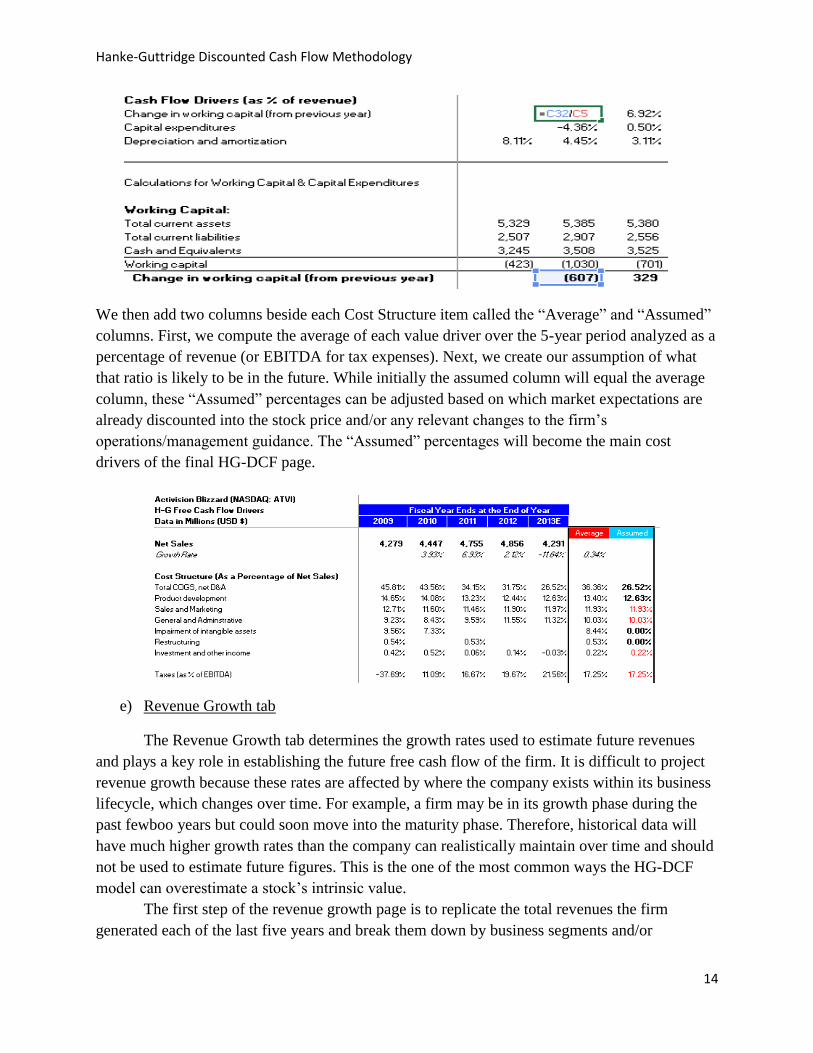
Next, both change in working capital and capital expenditures are considered “Cash Flow
Drivers” and are then expressed as a percentage of total revenue, as shown in the picture below:
Hanke-Guttridge Discounted Cash Flow Methodology
14
We then add two columns beside each Cost Structure item called the “Average” and “Assumed”
columns. First, we compute the average of each value driver over the 5-year period analyzed as a
percentage of revenue (or EBITDA for tax expenses). Next, we create our assumption of what
that ratio is likely to be in the future. While initially the assumed column will equal the average
column, these “Assumed” percentages can be adjusted based on which market expectations are
already discounted into the stock price and/or any relevant changes to the firm’s
operations/management guidance. The “Assumed” percentages will become the main cost
drivers of the final HG-DCF page.
e) Revenue Growth tab
The Revenue Growth tab determines the growth rates used to estimate future revenues
and plays a key role in establishing the future free cash flow of the firm. It is difficult to project
revenue growth because these rates are affected by where the company exists within its business
lifecycle, which changes over time. For example, a firm may be in its growth phase during the
past fewboo years but could soon move into the maturity phase. Therefore, historical data will
have much higher growth rates than the company can realistically maintain over time and should
not be used to estimate future figures. This is the one of the most common ways the HG-DCF
model can overestimate a stock’s intrinsic value.
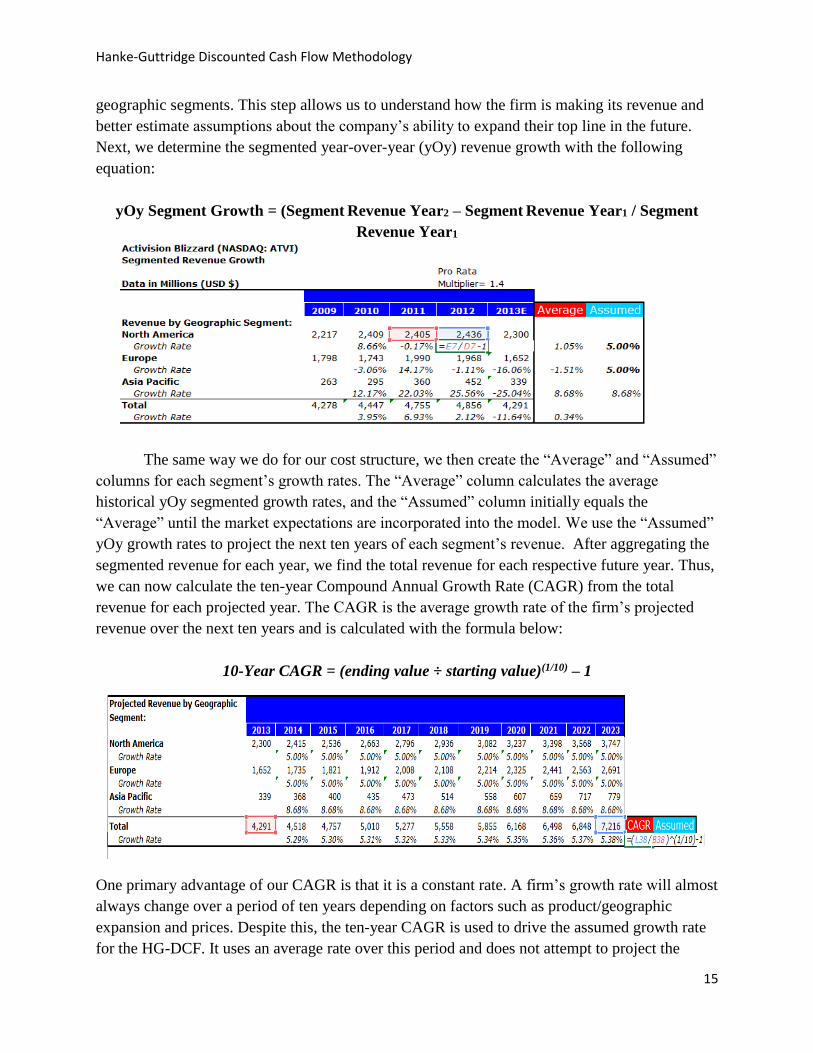
The first step of the revenue growth page is to replicate the total revenues the firm
generated each of the last five years and break them down by business segments and/or
Hanke-Guttridge Discounted Cash Flow Methodology
15
geographic segments. This step allows us to understand how the firm is making its revenue and
better estimate assumptions about the company’s ability to expand their top line in the future.
Next, we determine the segmented year-over-year (yOy) revenue growth with the following
equation:
yOy Segment Growth = (Segment Revenue Year2 – Segment Revenue Year1 / Segment
Revenue Year1
The same way we do for our cost structure, we then create the “Average” and “Assumed”
columns for each segment’s growth rates. The “Average” column calculates the average
historical yOy segmented growth rates, and the “Assumed” column initially equals the
“Average” until the market expectations are incorporated into the model. We use the “Assumed”
yOy growth rates to project the next ten years of each segment’s revenue. After aggregating the
segmented revenue for each year, we find the total revenue for each respective future year. Thus,
we can now calculate the ten-year Compound Annual Growth Rate (CAGR) from the total
revenue for each projected year. The CAGR is the average growth rate of the firm’s projected
revenue over the next ten years and is calculated with the formula below:
10-Year CAGR = (ending value ÷ starting value)(1/10) – 1
One primary advantage of our CAGR is that it is a constant rate. A firm’s growth rate will almost
always change over a period of ten years depending on factors such as product/geographic
expansion and prices. Despite this, the ten-year CAGR is used to drive the assumed growth rate
for the HG-DCF. It uses an average rate over this period and does not attempt to project the
Hanke-Guttridge Discounted Cash Flow Methodology
16
growth rate each individual year.
The Revenue Growth page can also be altered for different industries/sectors. For
instance, the historical revenue of retail stores such as Denny’s may be broken down by yOy
growth rate of sales per store and sales per store. This is computed by taking the amount of stores
the firm had each year from their 10-K and calculating the yOy growth rate for the number of
stores. We divide total annual revenue by the number of stores in the respective year to
determine sales per store. We then calculate the yOy growth rate of those numbers and use it to
generate projected sales per store for the next ten years. The projected revenue each year is found
by multiplying the projected sales per store by the projected number of stores. From here, we can
compute the ten-year CAGR the same way as we did previously.
f) The Hanke-Guttridge Discounted Cash Flow Model
The H-G DCF is markedly different from the conventional DCF model. Using the
previous five pages of the HG-DCF model discussed in parts (a)-(e), we can now calculate future
discounted cash flows. This last tab utilizes the previously calculated revenue projections and
cost structure to estimate the free cash flow for each year. The respective year’s free cash flow is
then discounted to its present value and summed to find the firm’s enterprise value. Once we
have enterprise value, an equity value and estimated price per share can be found. Below are the
main steps to configuring an HG-DCF:
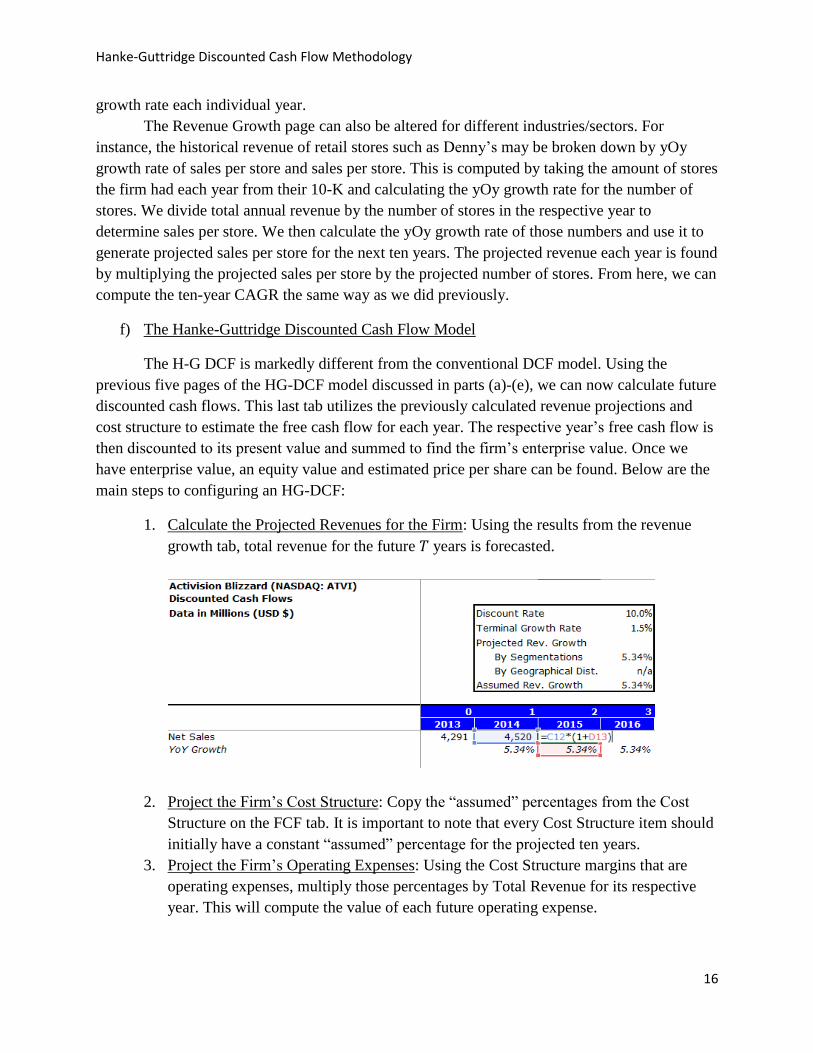
1. Calculate the Projected Revenues for the Firm: Using the results from the revenue
growth tab, total revenue for the future 𝑇 years is forecasted.
2. Project the Firm’s Cost Structure: Copy the “assumed” percentages from the Cost
Structure on the FCF tab. It is important to note that every Cost Structure item should
initially have a constant “assumed” percentage for the projected ten years.
3. Project the Firm’s Operating Expenses: Using the Cost Structure margins that are
operating expenses, multiply those percentages by Total Revenue for its respective
year. This will compute the value of each future operating expense.
Hanke-Guttridge Discounted Cash Flow Methodology
17
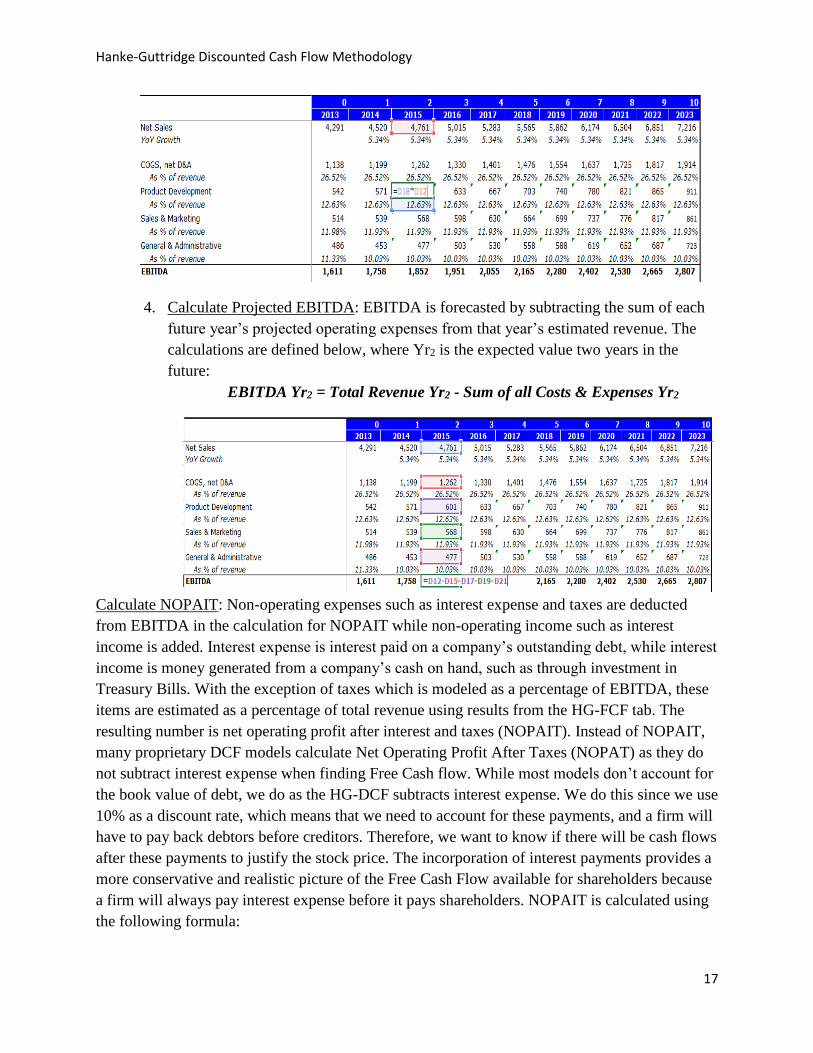
4. Calculate Projected EBITDA: EBITDA is forecasted by subtracting the sum of each
future year’s projected operating expenses from that year’s estimated revenue. The
calculations are defined below, where Yr2 is the expected value two years in the
future:
EBITDA Yr2 = Total Revenue Yr2 - Sum of all Costs & Expenses Yr2
Calculate NOPAIT: Non-operating expenses such as interest expense and taxes are deducted
from EBITDA in the calculation for NOPAIT while non-operating income such as interest
income is added. Interest expense is interest paid on a company’s outstanding debt, while interest
income is money generated from a company’s cash on hand, such as through investment in
Treasury Bills. With the exception of taxes which is modeled as a percentage of EBITDA, these
items are estimated as a percentage of total revenue using results from the HG-FCF tab. The
resulting number is net operating profit after interest and taxes (NOPAIT). Instead of NOPAIT,
many proprietary DCF models calculate Net Operating Profit After Taxes (NOPAT) as they do
not subtract interest expense when finding Free Cash flow. While most models don’t account for
the book value of debt, we do as the HG-DCF subtracts interest expense. We do this since we use
10% as a discount rate, which means that we need to account for these payments, and a firm will
have to pay back debtors before creditors. Therefore, we want to know if there will be cash flows
after these payments to justify the stock price. The incorporation of interest payments provides a
more conservative and realistic picture of the Free Cash Flow available for shareholders because
a firm will always pay interest expense before it pays shareholders. NOPAIT is calculated using
the following formula:
Hanke-Guttridge Discounted Cash Flow Methodology
18
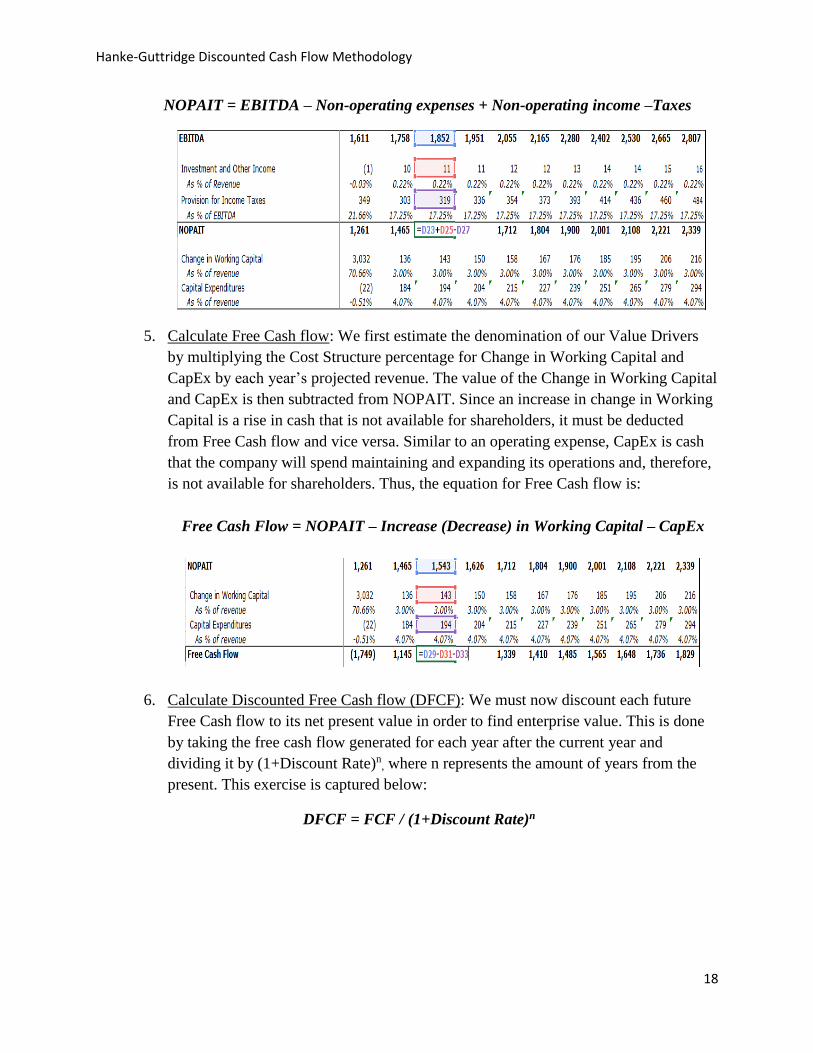
NOPAIT = EBITDA – Non-operating expenses + Non-operating income –Taxes
5. Calculate Free Cash flow: We first estimate the denomination of our Value Drivers
by multiplying the Cost Structure percentage for Change in Working Capital and
CapEx by each year’s projected revenue. The value of the Change in Working Capital
and CapEx is then subtracted from NOPAIT. Since an increase in change in Working
Capital is a rise in cash that is not available for shareholders, it must be deducted
from Free Cash flow and vice versa. Similar to an operating expense, CapEx is cash
that the company will spend maintaining and expanding its operations and, therefore,
is not available for shareholders. Thus, the equation for Free Cash flow is:
Free Cash Flow = NOPAIT – Increase (Decrease) in Working Capital – CapEx
6. Calculate Discounted Free Cash flow (DFCF): We must now discount each future
Free Cash flow to its net present value in order to find enterprise value. This is done
by taking the free cash flow generated for each year after the current year and
dividing it by (1+Discount Rate)n, where n represents the amount of years from the
present. This exercise is captured below:
DFCF = FCF / (1+Discount Rate)n
Hanke-Guttridge Discounted Cash Flow Methodology
19
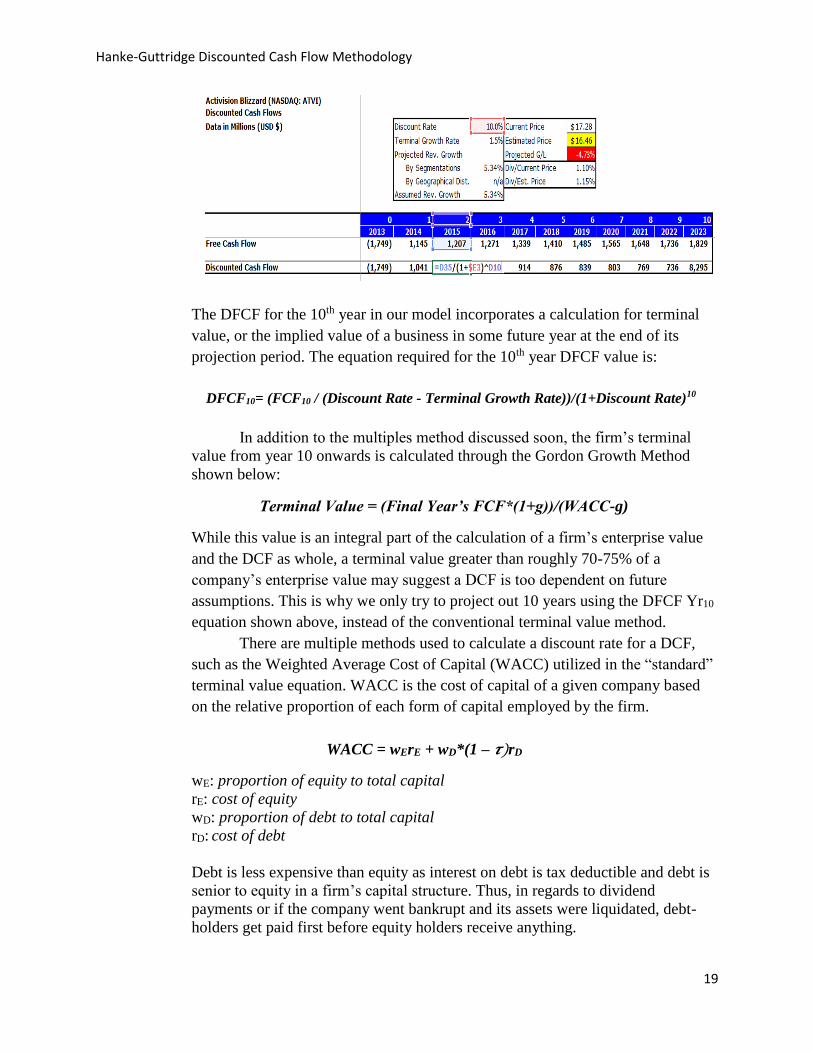
The DFCF for the 10th year in our model incorporates a calculation for terminal
value, or the implied value of a business in some future year at the end of its
projection period. The equation required for the 10th year DFCF value is:
DFCF10= (FCF10 / (Discount Rate - Terminal Growth Rate))/(1+Discount Rate)10
In addition to the multiples method discussed soon, the firm’s terminal
value from year 10 onwards is calculated through the Gordon Growth Method
shown below:
Terminal Value = (Final Year’s FCF*(1+g))/(WACC-g)
While this value is an integral part of the calculation of a firm’s enterprise value
and the DCF as whole, a terminal value greater than roughly 70-75% of a
company’s enterprise value may suggest a DCF is too dependent on future
assumptions. This is why we only try to project out 10 years using the DFCF Yr10
equation shown above, instead of the conventional terminal value method.
There are multiple methods used to calculate a discount rate for a DCF,
such as the Weighted Average Cost of Capital (WACC) utilized in the “standard”
terminal value equation. WACC is the cost of capital of a given company based
on the relative proportion of each form of capital employed by the firm.
WACC = wErE + wD*(1 – 𝝉)rD
wE: proportion of equity to total capital
rE: cost of equity
wD: proportion of debt to total capital
rD: cost of debt
Debt is less expensive than equity as interest on debt is tax deductible and debt is
senior to equity in a firm’s capital structure. Thus, in regards to dividend
payments or if the company went bankrupt and its assets were liquidated, debt-
holders get paid first before equity holders receive anything.
Hanke-Guttridge Discounted Cash Flow Methodology
20
A firm’s cost of equity is calculated through the Capital Asset Pricing
Model (CAPM). The CAPM equation is shown below:
CAPM = risk-free rate + (market risk premium * beta) + size premium
The risk-free rate is also the terminal growth rate (g) used in the Gordon
Growth Model above in the equation for terminal value. This rate is typically the
current yield on long-term Treasury bonds, which is presently around 2.8%. The
market risk premium is the premium investors demand for investing in the overall
market portfolio compared to a risk-free investment (e.g. Treasury bond). A
company’s beta measures a stock’s risk or volatility relative to the market and is
statistically calculated by taking the covariance between a stock’s return and the
market return divided by the variance of the market return. A beta of 1 means the
price of the security will move with the market, while a security with a beta under
1 will be less volatile, and an equity with a beta greater than 1 will be more
volatile. Lastly, for large public companies (such as Apple), cost of capital tends
to be somewhat stable. However, for small companies, this cost can fluctuate
significantly over economic and interest rate cycles. The greater a company's cost
of capital, the lower its DCF valuation will be. Thus, for the smallest companies
(below roughly $500 million in market cap), a "size premium" of 2-4% may be
added to the company's WACC to account for extra risk.
Discount methods like WACC that was just described have two distinct
weaknesses. First, a given firm’s WACC is constantly changing and is different
for all companies. Therefore, it is difficult to compare HG-DCF models of various
companies to each other. Next, WACC evaluates the firm’s opportunity cost of
investing in a project; however, we are not spending the company’s money to
make this investment. We are spending our own capital and must use a discount
rate that reflects our individual opportunity costs. The H-G DCF uses a constant
10% discount rate instead of WACC for these reasons. The 10% number was
selected as the discount rate because 10% has beaten the S&P 500 60% of the
time since 1871. Also, the discount rate must be higher than the rate of less risky
assets such as ten-year bonds or else there would be no incentive to invest in
equities.
The H-G DCF model also uses a flat rate of 1.5%, which is relatively low
compared to the current 2.8% 10-year Treasury yield. This value was chosen as
the H-G DCF model attempts to be conservative, and large terminal values can
significantly overestimate a firm’s enterprise value. Also, our terminal value must
be below the growth rate of US GDP or our model would unrealistically suggest
that the firm will be larger than the size of US GDP.
It is important to note that there exist two main issues with using a
terminal value in our model. First, using a terminal value indicates that we expect
Hanke-Guttridge Discounted Cash Flow Methodology
21
the company will perpetually exist, while this is not true for most companies.
Also, the terminal value of a firm often represents more than 50% of the firm’s
entire enterprise value, which means our estimated price per share is heavily
dependent on our assumptions.
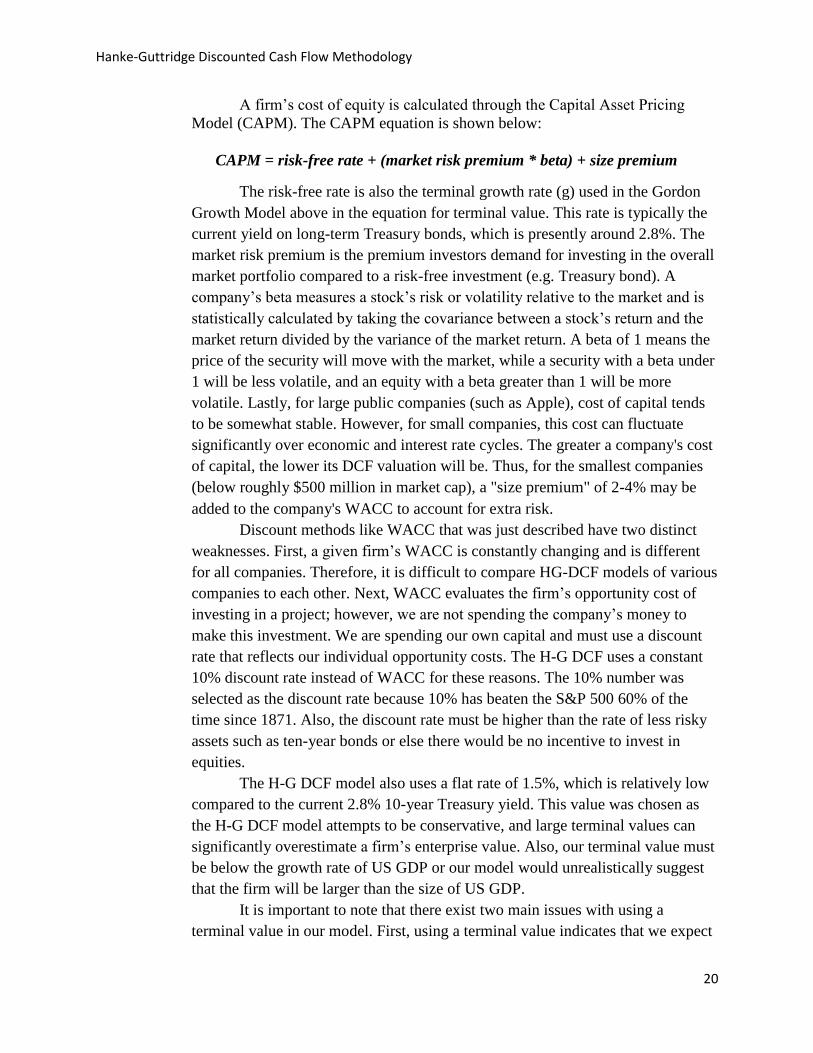
7. Calculate Enterprise Value: The Enterprise Value of a firm is calculated by summing
the DFCF for the projected 10 years. Enterprise Value is the value of the entirety of a
firm’s assets.
Enterprise Value = Sum of DFCF
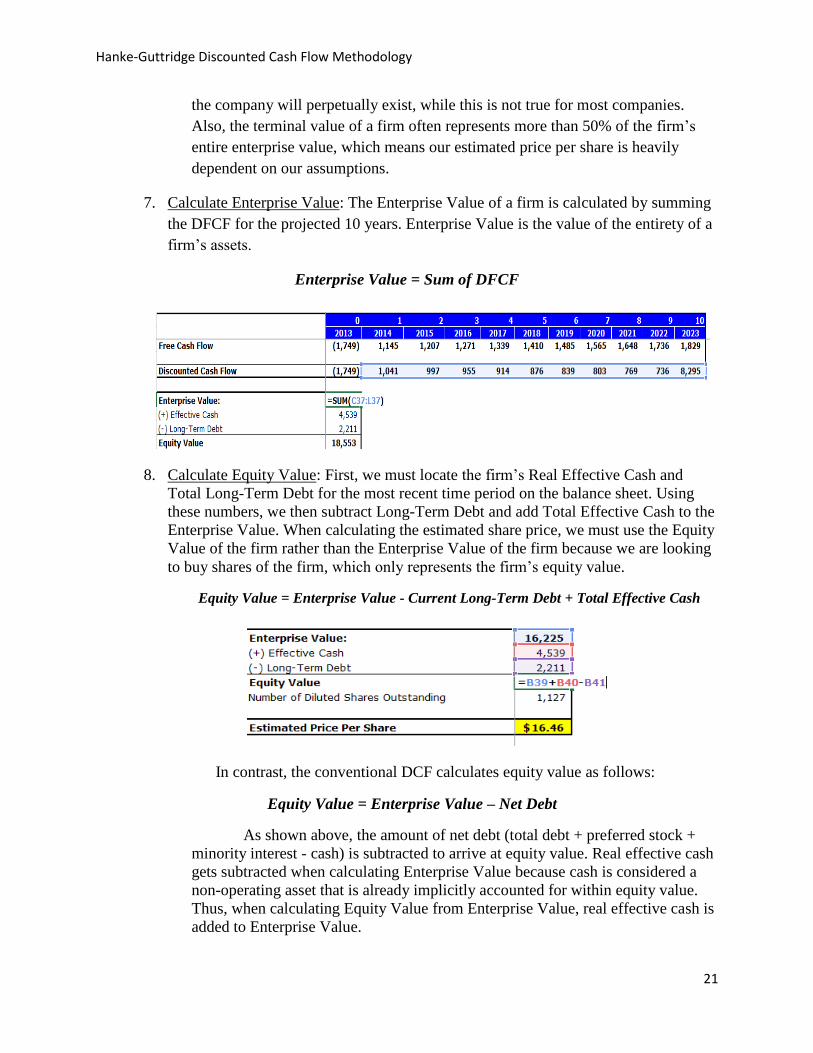
8. Calculate Equity Value: First, we must locate the firm’s Real Effective Cash and
Total Long-Term Debt for the most recent time period on the balance sheet. Using
these numbers, we then subtract Long-Term Debt and add Total Effective Cash to the
Enterprise Value. When calculating the estimated share price, we must use the Equity
Value of the firm rather than the Enterprise Value of the firm because we are looking
to buy shares of the firm, which only represents the firm’s equity value.
Equity Value = Enterprise Value - Current Long-Term Debt + Total Effective Cash
In contrast, the conventional DCF calculates equity value as follows:
Equity Value = Enterprise Value – Net Debt
As shown above, the amount of net debt (total debt + preferred stock +
minority interest - cash) is subtracted to arrive at equity value. Real effective cash
gets subtracted when calculating Enterprise Value because cash is considered a
non-operating asset that is already implicitly accounted for within equity value.
Thus, when calculating Equity Value from Enterprise Value, real effective cash is
added to Enterprise Value.
Hanke-Guttridge Discounted Cash Flow Methodology
22
When a company owns more than 50% of another company, the SEC
requires the parent company to consolidate its books. This means that the parent
company reflects 100% of the assets and liabilities and 100% of financial
performance (revenue, costs, profits, etc.) of the majority-owned subsidiary on its
own financial statements. However, since the parent company does not 100% of
the subsidiary, the parent company will have a line item called minority interest
on its income statement reflecting the percentage that it does not own. The parent
company’s balance sheet will also contain a line item called minority interest,
which reflects the percentage of the sub’s book value of equity that the parent
does not own. It is the balance sheet minority interest figure that we add in the
Enterprise Value formula. Also, while the HG-DCF uses the Gordon Growth
method to calculate terminal value, many conventional models use multiples to
calculate the firm’s terminal value. For instance, a high-growth Internet company
like Pandora that has negative net income would likely use an EV/Sales multiple
rather than EV/EBITDA or EV/EBIT. In this case, we then take the product of
Pandora’s EV/Sales multiple and the sales in the final year of your projections to
calculate terminal value. In order to counteract accounting consolidation that
results in sales, EBITDA, or EBIT from the parent company’s financial
statements containing 100% of the subsidiary’s respective figures, we must add to
enterprise value the dollar amount of the subsidiary the company does not own
(minority interest) to get a more “apples-to-apples” metric.
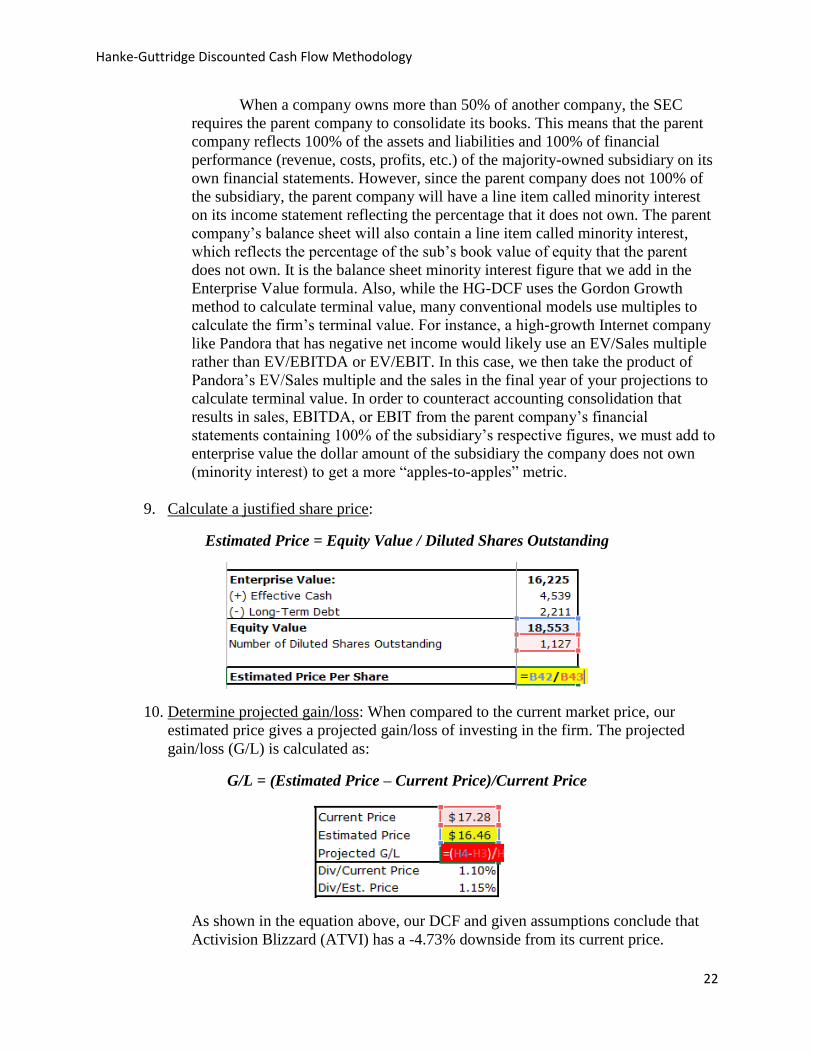
9. Calculate a justified share price:
Estimated Price = Equity Value / Diluted Shares Outstanding
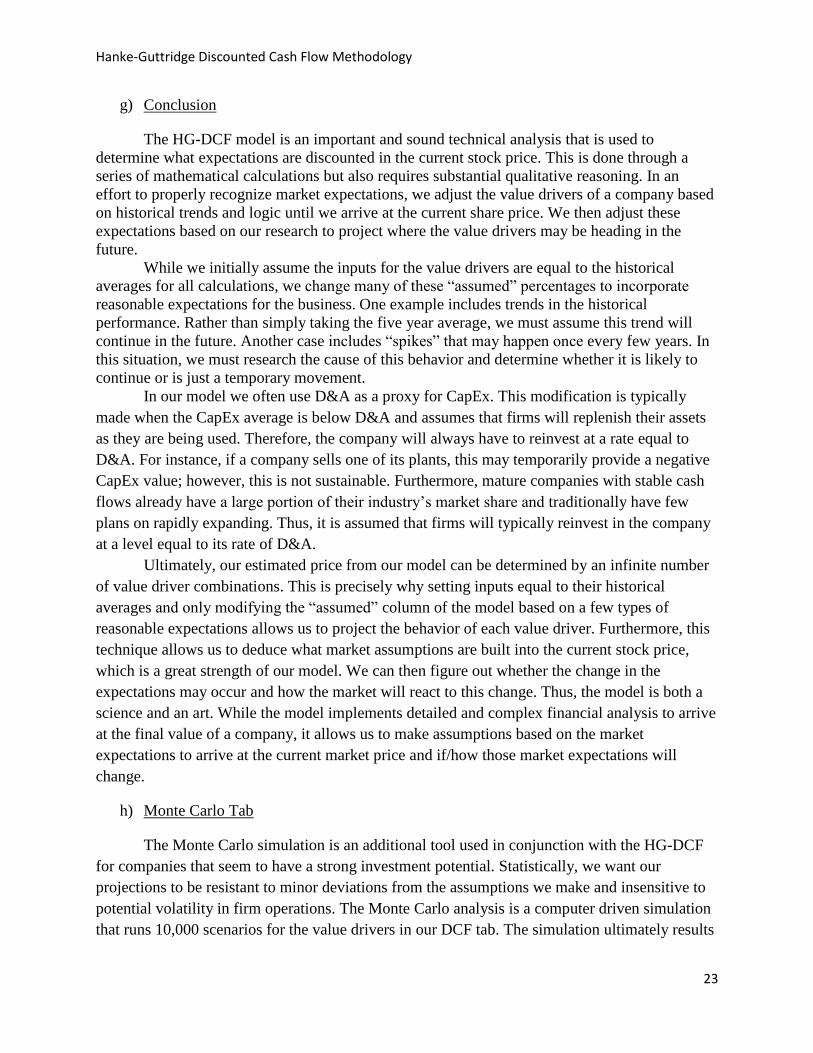
10. Determine projected gain/loss: When compared to the current market price, our
estimated price gives a projected gain/loss of investing in the firm. The projected
gain/loss (G/L) is calculated as:
G/L = (Estimated Price – Current Price)/Current Price
As shown in the equation above, our DCF and given assumptions conclude that
Activision Blizzard (ATVI) has a -4.73% downside from its current price.
Hanke-Guttridge Discounted Cash Flow Methodology
23
g) Conclusion
The HG-DCF model is an important and sound technical analysis that is used to
determine what expectations are discounted in the current stock price. This is done through a
series of mathematical calculations but also requires substantial qualitative reasoning. In an
effort to properly recognize market expectations, we adjust the value drivers of a company based
on historical trends and logic until we arrive at the current share price. We then adjust these
expectations based on our research to project where the value drivers may be heading in the
future.
While we initially assume the inputs for the value drivers are equal to the historical
averages for all calculations, we change many of these “assumed” percentages to incorporate
reasonable expectations for the business. One example includes trends in the historical
performance. Rather than simply taking the five year average, we must assume this trend will
continue in the future. Another case includes “spikes” that may happen once every few years. In
this situation, we must research the cause of this behavior and determine whether it is likely to
continue or is just a temporary movement.
In our model we often use D&A as a proxy for CapEx. This modification is typically
made when the CapEx average is below D&A and assumes that firms will replenish their assets
as they are being used. Therefore, the company will always have to reinvest at a rate equal to
D&A. For instance, if a company sells one of its plants, this may temporarily provide a negative
CapEx value; however, this is not sustainable. Furthermore, mature companies with stable cash
flows already have a large portion of their industry’s market share and traditionally have few
plans on rapidly expanding. Thus, it is assumed that firms will typically reinvest in the company
at a level equal to its rate of D&A.
Ultimately, our estimated price from our model can be determined by an infinite number
of value driver combinations. This is precisely why setting inputs equal to their historical
averages and only modifying the “assumed” column of the model based on a few types of
reasonable expectations allows us to project the behavior of each value driver. Furthermore, this
technique allows us to deduce what market assumptions are built into the current stock price,
which is a great strength of our model. We can then figure out whether the change in the
expectations may occur and how the market will react to this change. Thus, the model is both a
science and an art. While the model implements detailed and complex financial analysis to arrive
at the final value of a company, it allows us to make assumptions based on the market
expectations to arrive at the current market price and if/how those market expectations will
change.
h) Monte Carlo Tab
The Monte Carlo simulation is an additional tool used in conjunction with the HG-DCF
for companies that seem to have a strong investment potential. Statistically, we want our
projections to be resistant to minor deviations from the assumptions we make and insensitive to
potential volatility in firm operations. The Monte Carlo analysis is a computer driven simulation
that runs 10,000 scenarios for the value drivers in our DCF tab. The simulation ultimately results
Hanke-Guttridge Discounted Cash Flow Methodology
24
in a probability distribution of the stock price, given all the possible inputs of the value drivers.
This method enables analysts and investors to compare the current and historical stock prices to
the stock price probability distribution.
The first step of the Monte Carlo analysis is to copy the DCF page in a new tab, while
keeping numerical entries as values and not formulas. This is done by using the Alt-E-S-V
shortcut in excel. Next, the Oracle Crystal Ball in Excel chooses the standard deviation for each
value driver. The excel Oracle add-in allows us to take normalized value driver values and
simulate them 10,000 times. This, in turn, results in the probability distribution of the company’s
price per share. The share price is then calculated for these wide range of inputs by using the
mean of the probability distributions. The distance of a given price per share from the mean
implies its statistical likelihood. This emphasizes that as the price per share moves further away
from the mean, the probability of its incidence drops. We can then conclude that the further the
price falls from the mean, the more stock we should buy as the probability of the price reverting
to the mean rises.
IV. The Memorandum
a) Philosophy
The numbers attained via the HG-DCF are not meaningful without deep qualitative
knowledge of the respective company being evaluated. The memo provides the context in which
the firm should be evaluated and allows the analyst to state his/her investment thesis. In addition
to using the results generated by the HG-DCF, the thesis is affirmed or contested by evidence
drawn from the qualitative aspects of the firm.
b) Technicalities
Information used to construct memos is mostly obtained through EDGAR, Bloomberg
Terminals, and specific firms’ investor relations websites. All memos must start with a formal
heading, addressing the memo to Dr. Steve Hanke and Mr. Ryan Guttridge. The heading also
includes the author, date, and firm covered in the report.
c) Sections
i. The abstract
The abstract summarizes the main qualitative aspects of the firm. This section
always starts by summarizing the investment prospects of the firm, stating its
accompaniment to the Hanke-Guttridge discounted cash flow model, and disclosing the
various parts covered in the memo. The firm’s respective business and/or geographic
segments are briefly described, as well as its core business model. The current price and
52-week range of the stock price is provided, as well as any major recent acquisitions.
ii. Firm description
The firm description section provides a better view of the firm’s operations and
potential change in structure and business lines. It discusses how a company generates
Hanke-Guttridge Discounted Cash Flow Methodology
25
profit and its monetization strategy. Each business segment is described in detail, and the
percentage of sales generated from each segment is provided. We also typically include
the performance of the segment relative to the rest of the firm. Recent earnings calls are
highlighted and growth in terms of sales and earnings are explained. Lastly, acquisitions
are described in terms of their potential revenue and/or cost synergies and growth
opportunities.
iii. Executive compensation
The executive compensation section analyzes sources of management income and
is a crucial component of the memo as it describes whether the firm’s executive
compensation structure is aligned with the interests of their shareholders. This
information is found from a company’s proxy statement. The focus of this section is to
evaluate whether or not management’s interests are aligned with that of the shareholder.
Specific components of pay typically include salary, bonus, stock awards, option awards,
and non-equity incentive plan compensation. A colored bar graph is typically produced
through excel, which details the specific percentage break down of every executive’s pay
structure.
One possible source of alarm in terms of executive compensation is if most of
each officers’ income comes from the base salary and bonus, rather than equity awards.
This means that their compensation package is not closely related to the actual
performance of the company. Investors should also pay careful attention to the structure
of equity awards. Many firms award stock options based on operating metrics such as
EBITDA rather than actual stock appreciation. In addition, management with high short-
term cash awards may execute unnecessary acquisitions or reap short-term gains at the
expense of long-term growth. For all of these reasons, one must not overlook the
specifics of the compensation as it is easy to misinterpret the firm’s filings.
iv. Dividend and share history
The firm returns value to its shareholders primarily through dividends and equity
repurchases. It is important to note that many companies prefer to return value to
shareholders via share repurchase programs. This is because firms have more discretion
over such programs, and dividend policies are viewed by the public as permanent.
Two charts are included for this section of the memo. The charts included in this
section indicate whether value is actually returned to investors in general via share
repurchase programs. One chart maps out quarterly dividends, which analyzes seasonality
of dividends. The other graph is a plot of the number of shares outstanding and equity
float. Equity float is the number of shares outstanding available to the general public.
Significant changes of discrepancies between the amount of shares outstanding and
equity float can indicate whether the typical, minority shareholder will benefit from share
repurchases.
This section can be critical in determining the general trends of the company. A
firm that has been buying back a lot of shares may believe that their company is
undervalued. Thus, management is trying to make money as the stock price appreciates to
its intrinsic value. In terms of dividends, they could indicate a potential change in
business strategy. For instance, increasing dividends typically suggests that the company
Hanke-Guttridge Discounted Cash Flow Methodology
26
has entered a mature stage. In addition, paying higher dividends may have a negative side
because it could imply that the company has run out of projects that can provide a high
enough return to satisfy investors. It is also crucial to look at the changes in shares
outstanding for a company over time as this can give us a clearer depiction of dilution to
shareholders.
v. Management guidance
This section contains three sources of firm expectations: management
expectations, Bloomberg estimates, and historical expectations. Information for this
section can be found through Bloomberg’s Guidance (GUID) function, and snapshots of
this section are included in the memo. The Bloomberg Guidance section provides
management’s belief of future operating results and is useful in determining reasonable
value-driver assumptions for the HG-DCF. For instance, value-drivers such as projected
sales growth and capital expenditure are often reported in management’s guidance.
Management guidance from a firm’s investor relations website can then be
compared to Bloomberg estimates. It is crucial for an investor to understand that
companies that provide conservative projections are likely to continue to do so in the
future and vice versa. However, some companies instead choose to be rather opaque with
their projections and provide little or no financial estimates for the year. In this case, we
must proceed with caution and try to understand the reason for this lack of specification.
A graph of historic P/E ratios is also typically included. The historical average
P/E ratio is multiplied by Best EPS to arrive at an estimated share price under historical
expectations. A statement comparing current to historical expectations is then made by
comparing the current price to the product of this calculation.
vi. Insider transaction information
A reduction in shareholder value may occur when insiders trade on significant
non-public information. This section includes a graph of the percentage of insider
holdings and changes in such positions. By comparing this graph to significant
announcements of firm news and big shifts in price, we can check the integrity of the
firm’s insiders. In the unusual case that insider holdings are strong indicators of price
shifts, the investor can also exploit such insider transactions.
vii. Comparison table
This comparison table focuses on public market valuation levels, trading patterns,
and basic operating and financial ratios of companies in the same sector. Typically, the
table includes each firm’s revenue growth, earnings growth, and price multiples, which
are then compared to the given industry average. This section can also include an analysis
of the general stage and/or state of the industry.
viii. Firm specific issues
This section analyzes potential threats to shareholder value. The evaluation
analyzes procedures the firm must take to mitigate such risks and its demonstrated effort
to complete these procedures. For instance, this may include analyzing the impacts on
Hanke-Guttridge Discounted Cash Flow Methodology
27
various business and geographic segments and the general implications of such effects on
the market.
ix. Conclusion
Lastly, the conclusion highlights all the main points from the previous sections. It
should also include the author’s opinion of the firm in terms of where the company is
headed in the future relative to market expectations.
x. Bibliography
This section cites all referenced materials used to complete the memo.
d) Analysis of Potential Investment in Activision Blizzard
Company history and business segments
Activision Blizzard (NASDAQ: ATVI) develops, publishes, and distributes interactive
software products and content, with an emphasis on developing and publishing video games on
different consoles, handheld platforms and PC. The firm’s products cover various game
categories, including action/adventure, action sports, racing, role playing, simulation, first-person
action, music-based gaming and strategy. The company is behind some of the most lucrative
franchises of all time such as Call of Duty, Starcraft, World of Warcraft (WoW), and Diablo.
Headquartered in Santa Monica, CA, Activision Blizzard was originally incorporated as
Activision, Inc. in 1979 in California and was reincorporated in Delaware in December 1992. On
July 9, 2008, a business combination by Activision, Inc., Sego Merger Corporation, a wholly-
owned subsidiary of Activision, Inc., Vivendi S.A., VGAC LLC, a wholly-owned subsidiary of
Vivendi, and Vivendi Games, Inc., a wholly-owned subsidiary of VGAC LLC, was completed.
As a result of this consummation, Activision, Inc. was renamed Activision Blizzard, Inc.
Activision Blizzard is currently trading at $17.28, while its 52-week range is $10.48-
$18.43. On October, 11, 2013, Activision Blizzard, Inc. completed its previously announced all-
cash acquisition of approximately 429 million company shares and certain tax attributes from
Vivendi for approximately $5.83 billion, or $13.60 per share. As a result of this transaction,
Activision Blizzard is an independent company with a majority of its shares owned by public
shareholders. Vivendi has retained a stake of approximately 83 million shares, or 12% of the
company’s outstanding shares, down from 40% previously.
Activision Blizzard operates in three business segments: Activision Publishing, Blizzard
Entertainment, and Activision Blizzard Distribution. The Activision Publishing segment
represents 62% of total revenue for fiscal year 2012, while the Blizzard Entertainment and
Activision Blizzard Distribution markets represent 32% and 6% of total revenue, respectively.
Activision Publishing is a leading international developer and publisher of interactive
software products and content, including games from the Call of Duty and Skylanders franchises.
This division develops games primarily based on internally-developed properties, as well as
some licensed intellectual properties. The firm sells games through both retail channels and
digital downloads. Activision currently offers games that operate on the Sony PlayStation 3,
Nintendo Wii, and Microsoft Xbox 360 console systems; the Nintendo Dual Screen and
Nintendo 3DS handheld game systems; the PC; and other handheld and mobile devices. In
Hanke-Guttridge Discounted Cash Flow Methodology
28
addition, the company is planning to release games for Sony’s and Microsoft’s next-generation
console systems, the PlayStation 4 and Xbox One, respectively.
Blizzard Entertainment is a leader in the subscription-based massively multi-player
online role-playing game (“MMORPG”) category in terms of both subscriber base and revenues
generated through their World of Warcraft franchise. Blizzard also creates, markets and sells
role-playing action and strategy games for the PC and iPad, including games in the multiple-
award winning Diablo and StarCraft franchises. Blizzard has adapted Diablo III for certain
current and future console platforms and released Diablo III for the PS3 and Xbox 360 in
September 2013. Also, Blizzard offers a proprietary online-game related service called
Battle.net. Blizzard distributes its products and generates revenues worldwide through various
means, such as subscriptions; sale of prepaid subscription cards; value-added services such as
realm transfers and faction changes within the World of Warcraft interface; retail sales of
physical products; online download sales of PC products; and licensing of software to third-party
or related-party companies that distribute World of Warcraft, Diablo III, and StarCraft
II products.
Activision Blizzard’s Distribution segment consists of operations in Europe that provide
warehousing, logistical and sales distribution services to third-party publishers of interactive
entertainment software, as well as its own publishing operations and manufacturers of interactive
entertainment hardware.
All of Activision’s franchises have a dedicated user base, which allows them sell more
items through their direct digital channel, bypassing retailers, generating higher gross margins,
reducing physical inventories, and improving returns on invested capital. The firm is also
positioned to strengthen its leading position by re-establishing existing franchises and
introducing new franchises, such as Call of Duty: Ghosts, Skylanders SWAP Force, and
Destiny, as players upgrade to the Xbox One and Playstation 4.
In Q4 FY 2012, the firm’s revenue increased by 2.0% from Q4 2011’s $4.8 billion to
$4.9 billion. In terms of Q3 2013 earnings, Activision’s Bobby Kotick said, “Our third-quarter
results exceeded our expectations, and we are able to raise our outlook for 2013 net revenues and
earnings per share. Robust continued engagement with our core franchises drove digital revenue,
which constituted a majority of all revenue. This quarter demonstrates that games like Call of
Duty and World of Warcraft engage and entertain our fans year round.” For each of the nine
months ended September 30, 2013 and 2012, Activision Blizzard had net revenues of $3.1
billion. Earnings per diluted share for the nine months ended September 30, 2013 were $0.73,
compared to $0.70 for the same period in 2012. There have been no acquisitions in fiscal year
2012-13, besides the purchase of 40% of Vivendi’s outstanding shares.
Future Growth Strategies
Activision Blizzard, Inc. (NASDAQ:ATVI) has a market share of nearly 20% in the U.S.
video games market. In addition to this large industry position, the recent launch of the next-
generation consoles in November and positive growth in the sector bodes well for the publisher.
This stronghold is mainly due to the fact that the company has built three billion dollar franchises
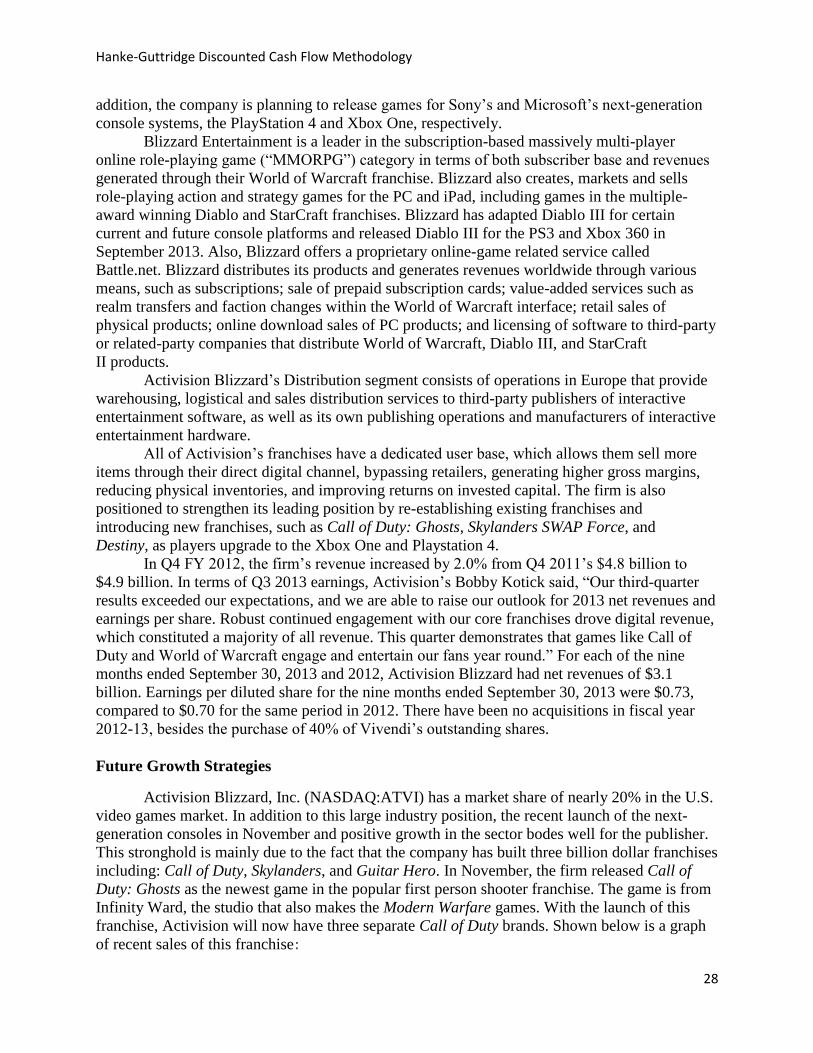
including: Call of Duty, Skylanders, and Guitar Hero. In November, the firm released Call of
Duty: Ghosts as the newest game in the popular first person shooter franchise. The game is from
Infinity Ward, the studio that also makes the Modern Warfare games. With the launch of this
franchise, Activision will now have three separate Call of Duty brands. Shown below is a graph
of recent sales of this franchise:
Hanke-Guttridge Discounted Cash Flow Methodology
29
Furthermore, the firm just released Skylanders: Swap Force, the newest game in the company's
popular interactive franchise. In its first week of sales, the game sold 184,094 copies on
Nintendo Wii, 127,084 copies on the XBOX 360, 96,654 copies on the Playstation 3, and 31,815
copies on the Nintendo 3DS. These numbers are a great start to the popular game and, with toy
sales factored in, Skylanders continues to be one of its biggest annual revenue generating
franchises.
The firm also has a great pipeline of anticipated core games for fiscal 2014 such as Call
of Duty: Black Ops, Destiny, Call of Duty Online China, Heroes of the Storm, Hearthstone, and
expansion in World of Warcraft, Diablo III and Skylanders. Destiny will be released in 2014 and
could become the latest “blockbuster” game from Activision Blizzard. The game from the
creators of Halo is highly anticipated and has over 200,000 pre-orders across three platforms,
according to VGChartz. In addition, further expansion in Diablo III will bring a raised cap level,
new storylines, and a new character class. The Diablo III has sold a remarkable number of over
12 million units through the PC platform, with a sales potential of over 10 million units for fiscal
year 2014. Also, with a rumored $30 price, Blizzard should be able to collect loads from people
playing the game on both PCs and consoles. This core game portfolio will continue to benefit
from strong quality over an expanding HD installed base. Despite Diablo’s success, World of
Warcraft recently reported a 7.6 million subscriber base, which is one of the world’s largest
despite its decline in recent quarters.
In the longer term, Activision has an attractive development pipeline that could offset
sales declines in its current maturing franchises. On the console side, Destiny and Comet (a
second franchise developed by Bungie to be released in 2015) could offset the eventual decline
of the CoD franchise. Longer-term CoD sales will also likely rise because first-person shooters
haven’t received as much public scrutiny as was previously anticipated. On the PC side, Titan
(the MMO successor to WoW) will partially offset the declining WoW user participation. In
aggregate, the firm's average revenue growth can easily run in the low- to mid-single digits over
the next five years. In terms of margins, they will likely stabilize over the next few years to just
above 30% as growth in high-margin digital sales are offset by diminishing WoW participation.
Competitive Landscape
The advent of multiple person gaming, advanced graphics design and technology,
internet delivery of entertainment, and wireless mobile devices has promoted interactive, real-
Hanke-Guttridge Discounted Cash Flow Methodology
30
time options for players across the world. As a result of nearly real life sensory experience and
interactive gaming, companies like Activision, Disney (DIS), Sony (SNE), Nintendo
(OTCPK:NTDOY), Microsoft (MSFT), Electronic Arts (EA), and Take Two
Interactive (TTWO) have gaming software divisions that rival the value and appeal of
Hollywood movie studios from earlier years. One important note is that opening month sales for
the biggest video game releases now eclipse the equivalent numbers from the biggest movie
openings in 2012-13. Clearly, this is a great sector for Activision to be in and, given their 20%
market share and new product releases, they are well-equipped to remain a large player despite
competition from publishers.
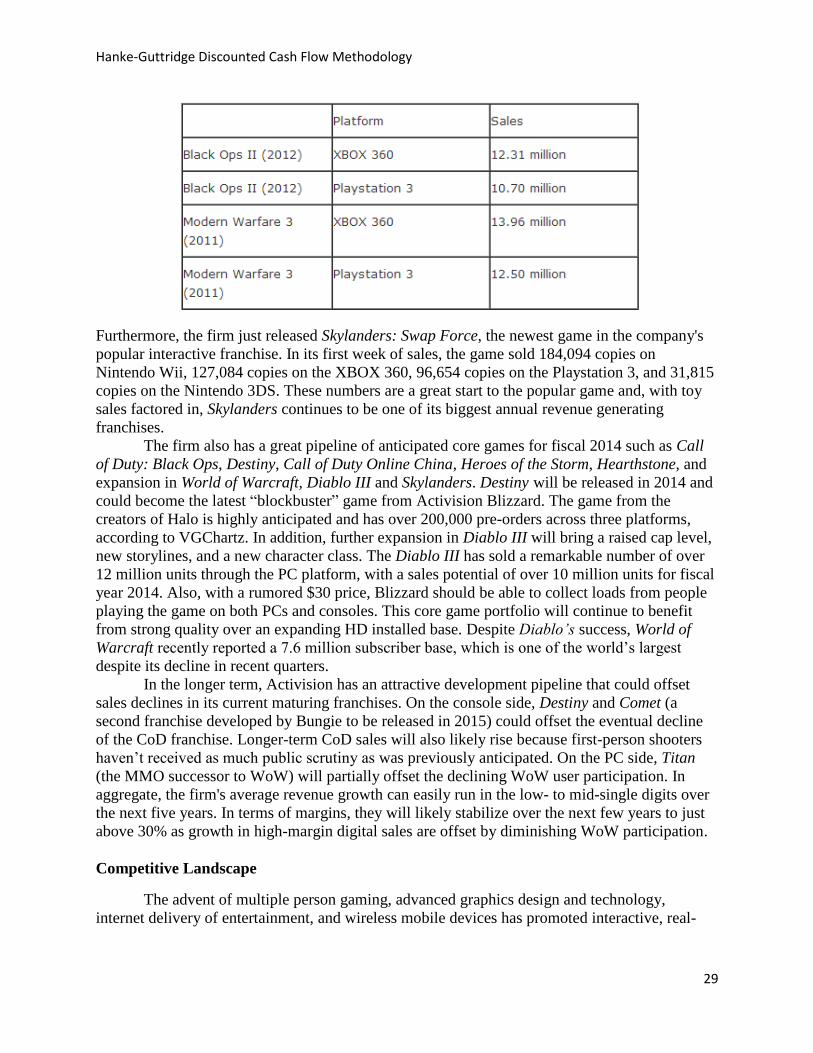
Executive Compensation
The firm’s executive compensation program for fiscal 2012 was:
Base salary: Provides a basic level of compensation to named executive officers in recognition
of their day-to-day job responsibilities. The level of base salary is reviewed upon each officer’s
individual work experience, performance during the fiscal year, leadership, time in position,
knowledge, and internal parity among those performing similar roles.
Annual Cash Incentives (Corporate Annual Incentive Plan, “CAIP”): Provides key management
members with the opportunity to earn annual cash bonuses based on performance as measured
against predetermined performance objectives. The purpose is to drive annual corporate and
business unit financial results as well as individual contributions toward strategic initiatives.
Long-Term Equity Incentive Awards: This program consists of stock options, restricted stock,
and restricted share units. By providing one-time, “upfront” equity grants with targets based on
the duration of the term of the executive’s employment agreement, Activision intends to secure
long-term commitments from its executives towards their multi-year business growth strategy.
The approximate grant value is targeted such that, when combined with base salary and annual
cash incentives, annualized total compensation is around the 75th percentile when compared to
industry peers.
0500,000
1,000,0001,500,0002,000,0002,500,0003,000,0003,500,0004,000,0004,500,000
RobertKotick
(President)
DennisDurkin(CFO)
ThomasTippl
(COO)
BrianHodous(Chief
CustomerOfficer)
HumamSakhini(ChiefTalent
Officer)
Activision Blizzard Compensation Base Salary
Annual CashIncentives
Hanke-Guttridge Discounted Cash Flow Methodology
31
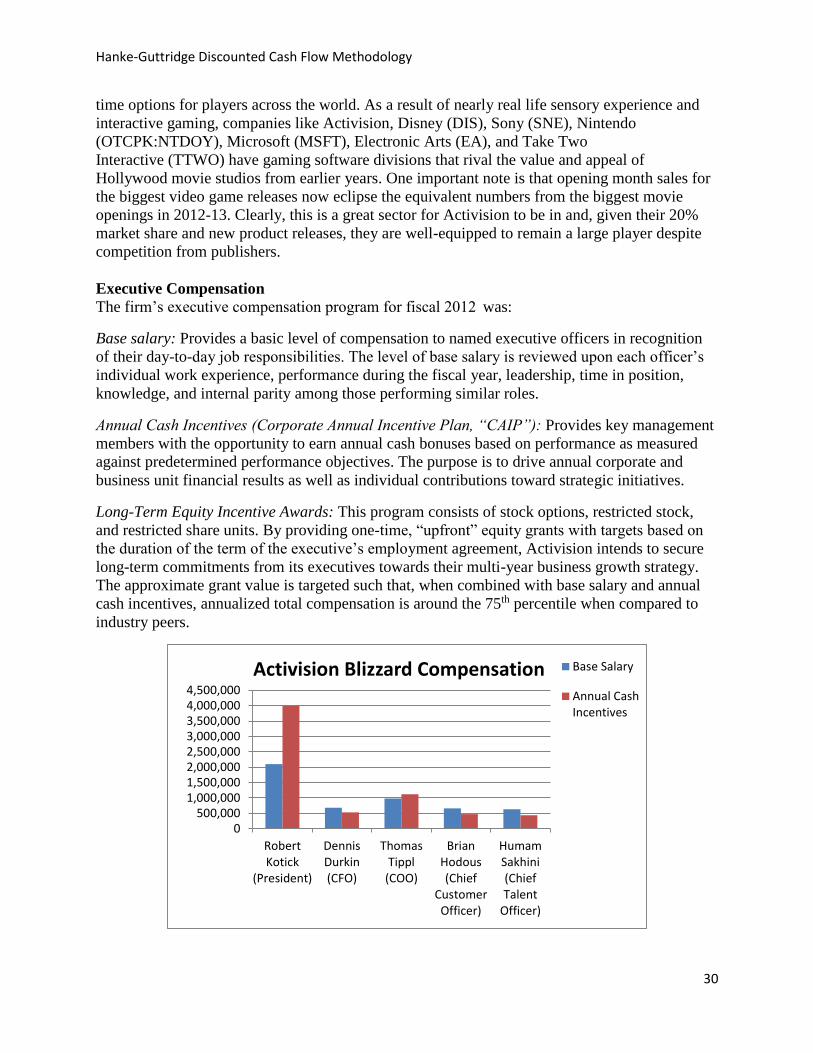
As shown above, with equity compensation is greater than base salary and cash bonus combined,
the firm’s management has interests directly in line with those of shareholders.
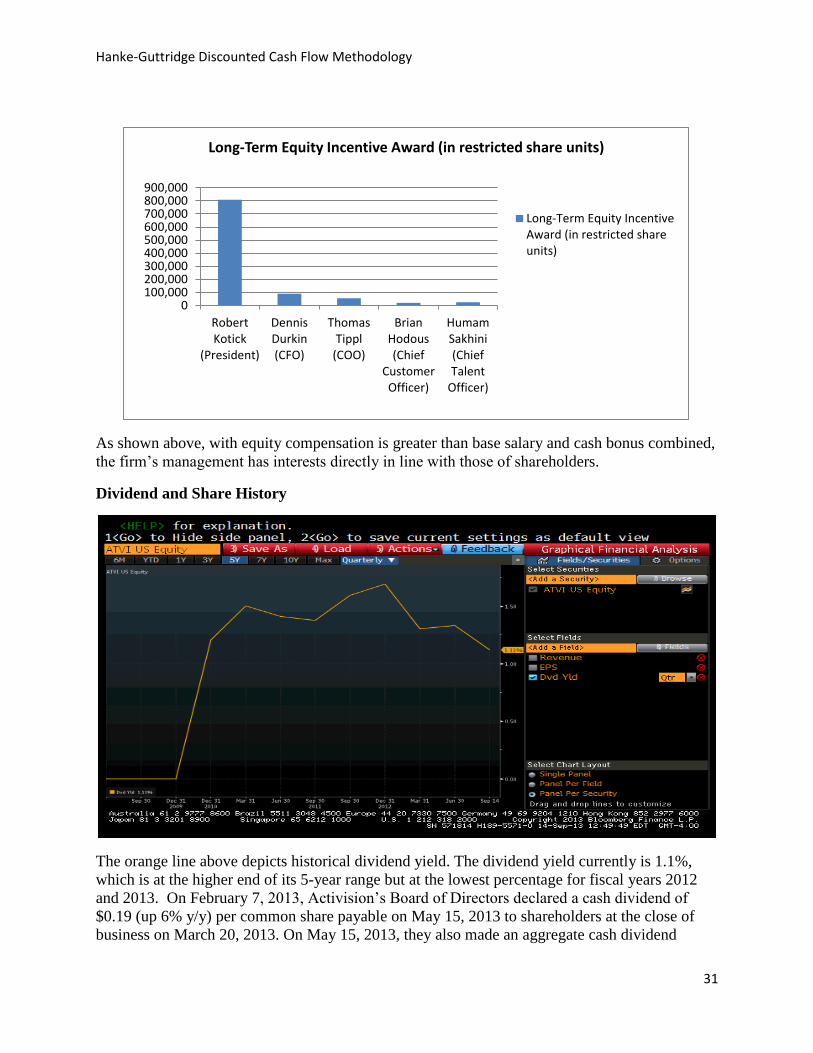
Dividend and Share History
The orange line above depicts historical dividend yield. The dividend yield currently is 1.1%,
which is at the higher end of its 5-year range but at the lowest percentage for fiscal years 2012
and 2013. On February 7, 2013, Activision’s Board of Directors declared a cash dividend of
$0.19 (up 6% y/y) per common share payable on May 15, 2013 to shareholders at the close of
business on March 20, 2013. On May 15, 2013, they also made an aggregate cash dividend
0100,000200,000300,000400,000500,000600,000700,000800,000900,000
RobertKotick
(President)
DennisDurkin(CFO)
ThomasTippl
(COO)
BrianHodous(Chief
CustomerOfficer)
HumamSakhini(ChiefTalent
Officer)
Long-Term Equity Incentive Award (in restricted share units)
Long-Term Equity IncentiveAward (in restricted shareunits)
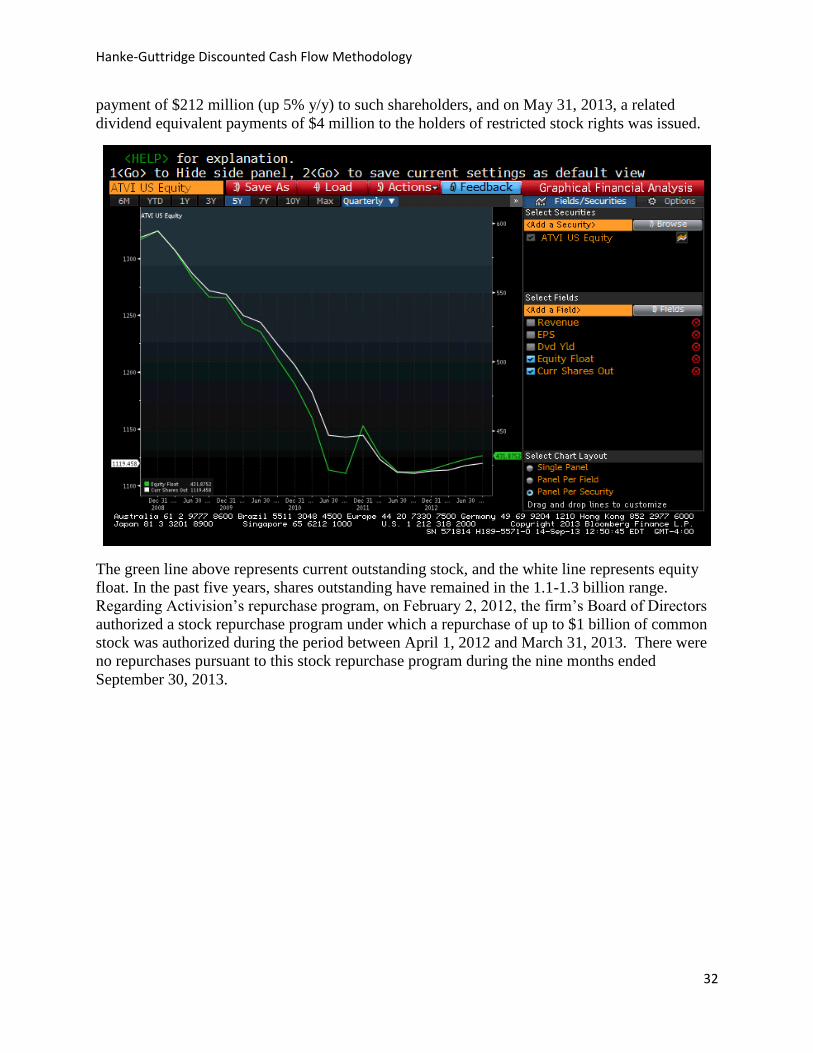
Hanke-Guttridge Discounted Cash Flow Methodology
32
payment of $212 million (up 5% y/y) to such shareholders, and on May 31, 2013, a related
dividend equivalent payments of $4 million to the holders of restricted stock rights was issued.
The green line above represents current outstanding stock, and the white line represents equity
float. In the past five years, shares outstanding have remained in the 1.1-1.3 billion range.
Regarding Activision’s repurchase program, on February 2, 2012, the firm’s Board of Directors
authorized a stock repurchase program under which a repurchase of up to $1 billion of common
stock was authorized during the period between April 1, 2012 and March 31, 2013. There were
no repurchases pursuant to this stock repurchase program during the nine months ended
September 30, 2013.
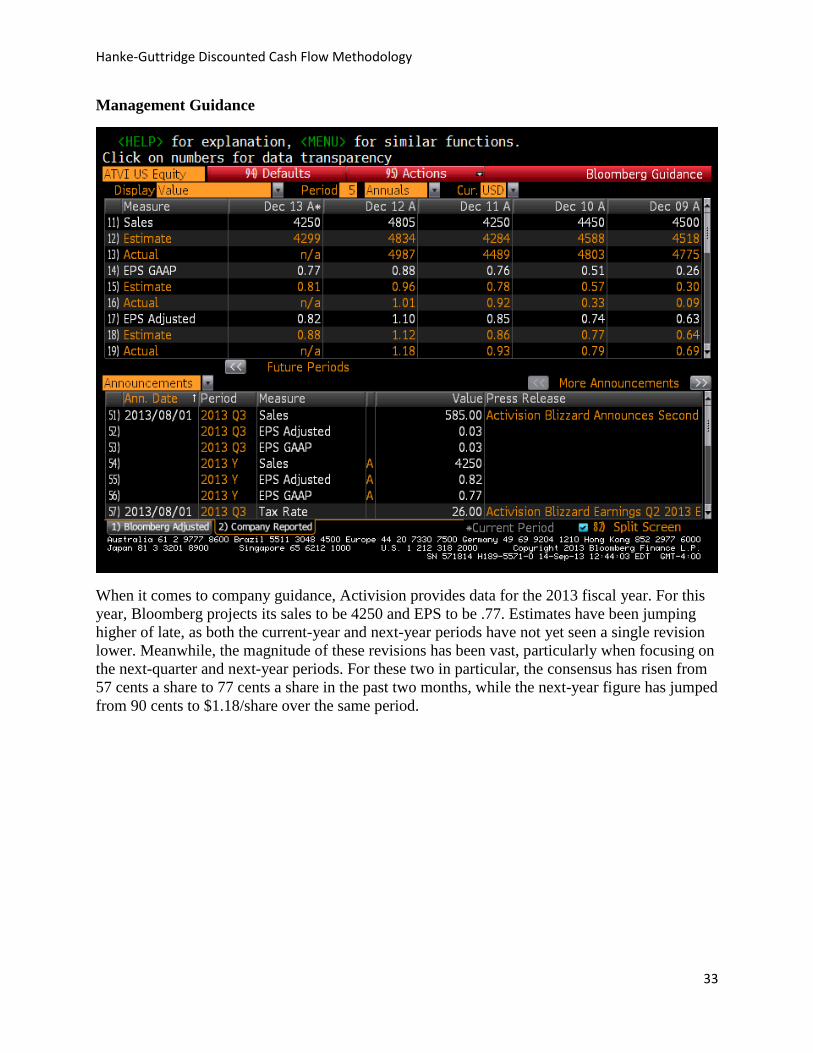
Hanke-Guttridge Discounted Cash Flow Methodology
33
Management Guidance
When it comes to company guidance, Activision provides data for the 2013 fiscal year. For this
year, Bloomberg projects its sales to be 4250 and EPS to be .77. Estimates have been jumping
higher of late, as both the current-year and next-year periods have not yet seen a single revision
lower. Meanwhile, the magnitude of these revisions has been vast, particularly when focusing on
the next-quarter and next-year periods. For these two in particular, the consensus has risen from
57 cents a share to 77 cents a share in the past two months, while the next-year figure has jumped
from 90 cents to $1.18/share over the same period.
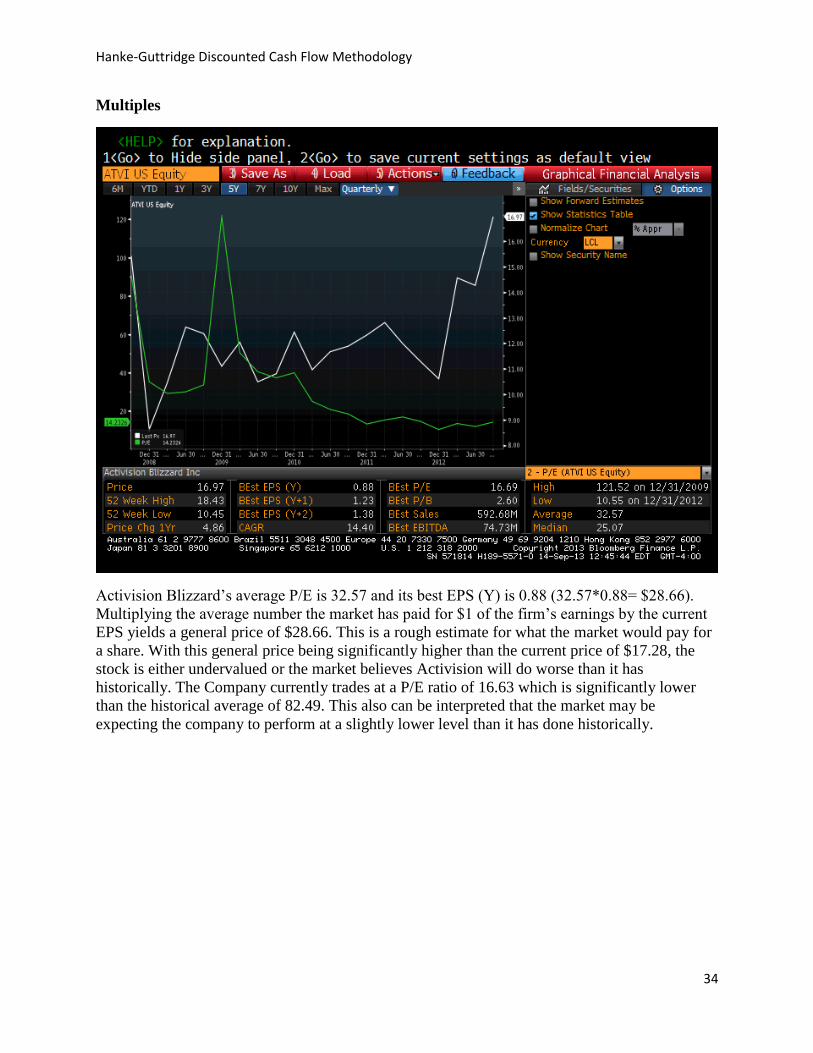
Hanke-Guttridge Discounted Cash Flow Methodology
34
Multiples
Activision Blizzard’s average P/E is 32.57 and its best EPS (Y) is 0.88 (32.57*0.88= $28.66).
Multiplying the average number the market has paid for $1 of the firm’s earnings by the current
EPS yields a general price of $28.66. This is a rough estimate for what the market would pay for
a share. With this general price being significantly higher than the current price of $17.28, the
stock is either undervalued or the market believes Activision will do worse than it has
historically. The Company currently trades at a P/E ratio of 16.63 which is significantly lower
than the historical average of 82.49. This also can be interpreted that the market may be
expecting the company to perform at a slightly lower level than it has done historically.
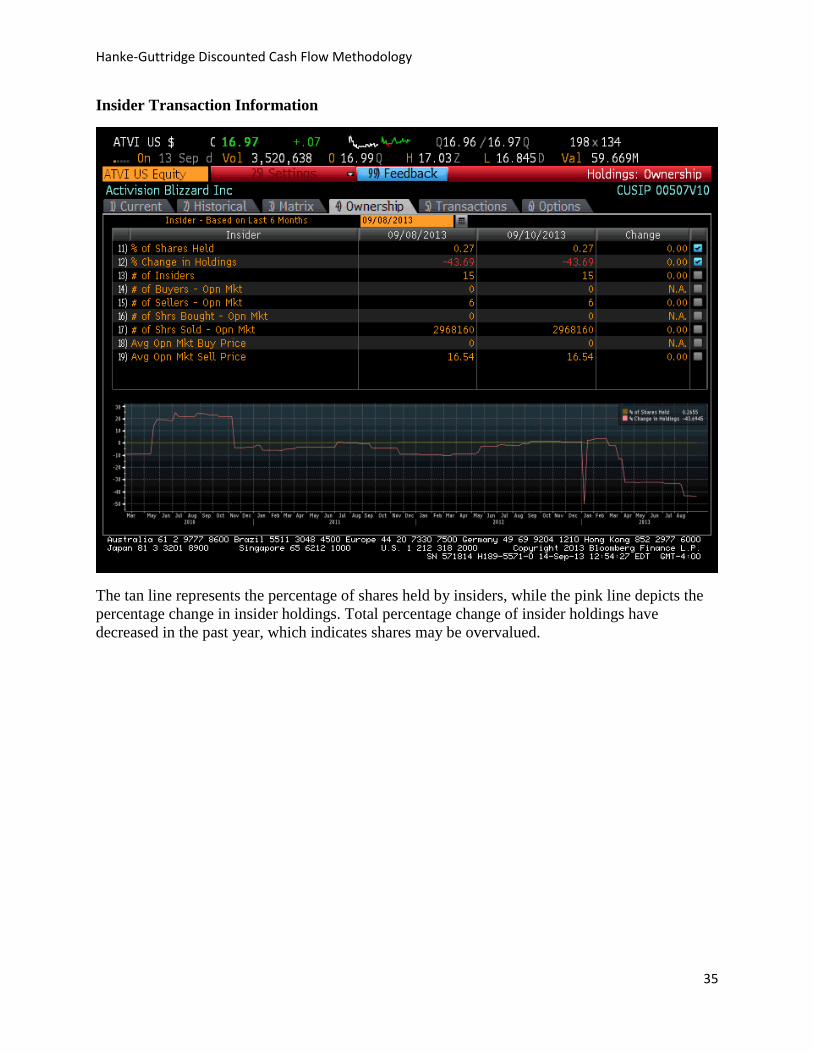
Hanke-Guttridge Discounted Cash Flow Methodology
35
Insider Transaction Information
The tan line represents the percentage of shares held by insiders, while the pink line depicts the
percentage change in insider holdings. Total percentage change of insider holdings have
decreased in the past year, which indicates shares may be overvalued.
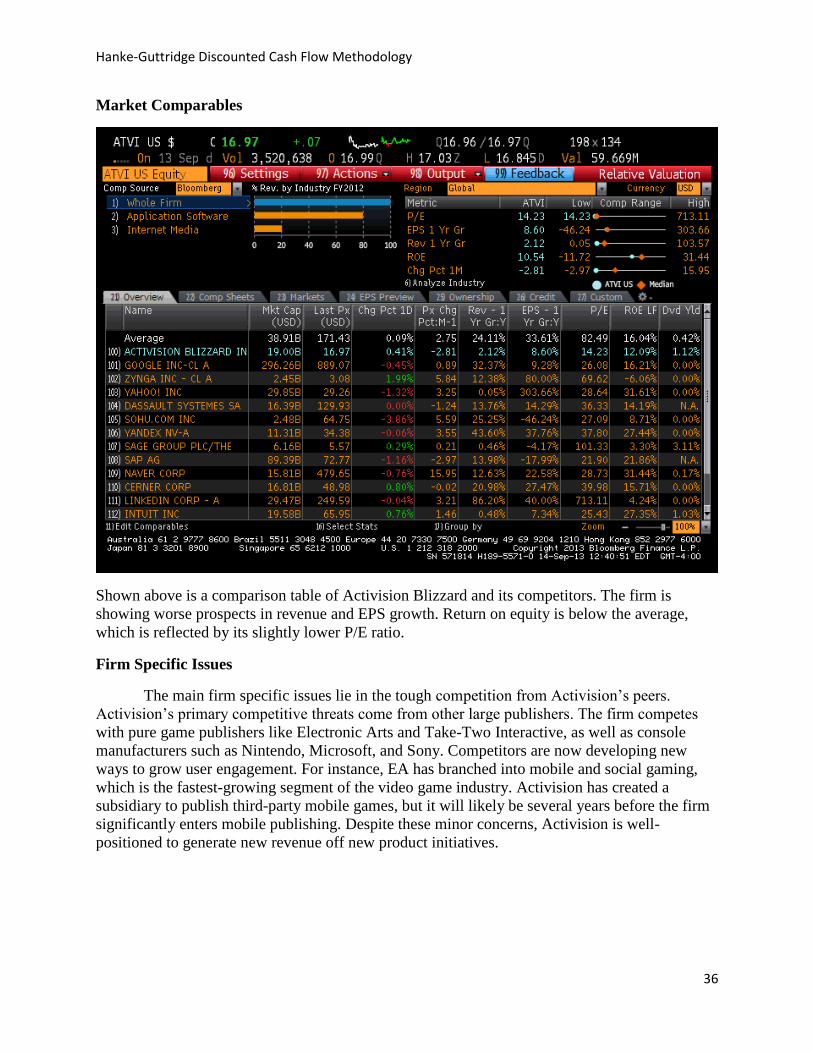
Hanke-Guttridge Discounted Cash Flow Methodology
36
Market Comparables
Shown above is a comparison table of Activision Blizzard and its competitors. The firm is
showing worse prospects in revenue and EPS growth. Return on equity is below the average,
which is reflected by its slightly lower P/E ratio.
Firm Specific Issues
The main firm specific issues lie in the tough competition from Activision’s peers.
Activision’s primary competitive threats come from other large publishers. The firm competes
with pure game publishers like Electronic Arts and Take-Two Interactive, as well as console
manufacturers such as Nintendo, Microsoft, and Sony. Competitors are now developing new
ways to grow user engagement. For instance, EA has branched into mobile and social gaming,
which is the fastest-growing segment of the video game industry. Activision has created a
subsidiary to publish third-party mobile games, but it will likely be several years before the firm
significantly enters mobile publishing. Despite these minor concerns, Activision is well-
positioned to generate new revenue off new product initiatives.
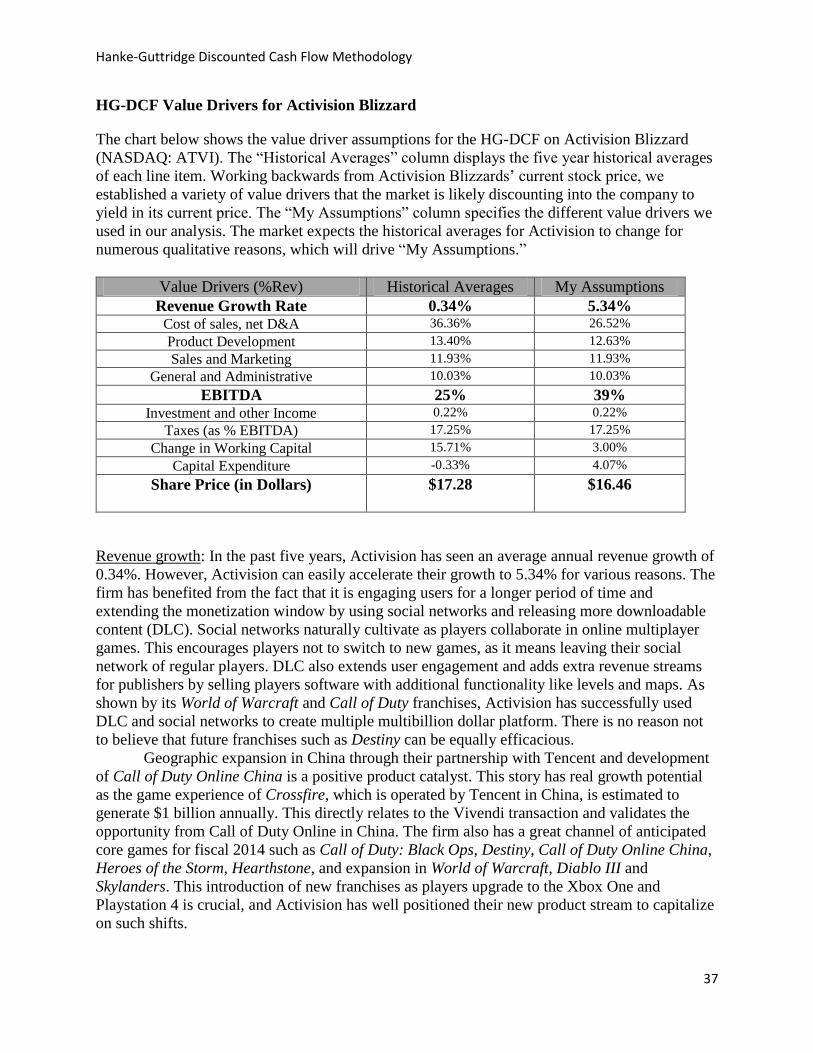
Hanke-Guttridge Discounted Cash Flow Methodology
37
HG-DCF Value Drivers for Activision Blizzard
The chart below shows the value driver assumptions for the HG-DCF on Activision Blizzard
(NASDAQ: ATVI). The “Historical Averages” column displays the five year historical averages
of each line item. Working backwards from Activision Blizzards’ current stock price, we
established a variety of value drivers that the market is likely discounting into the company to
yield in its current price. The “My Assumptions” column specifies the different value drivers we
used in our analysis. The market expects the historical averages for Activision to change for
numerous qualitative reasons, which will drive “My Assumptions.”
Revenue growth: In the past five years, Activision has seen an average annual revenue growth of
0.34%. However, Activision can easily accelerate their growth to 5.34% for various reasons. The
firm has benefited from the fact that it is engaging users for a longer period of time and
extending the monetization window by using social networks and releasing more downloadable
content (DLC). Social networks naturally cultivate as players collaborate in online multiplayer
games. This encourages players not to switch to new games, as it means leaving their social
network of regular players. DLC also extends user engagement and adds extra revenue streams
for publishers by selling players software with additional functionality like levels and maps. As
shown by its World of Warcraft and Call of Duty franchises, Activision has successfully used
DLC and social networks to create multiple multibillion dollar platform. There is no reason not
to believe that future franchises such as Destiny can be equally efficacious.
Geographic expansion in China through their partnership with Tencent and development
of Call of Duty Online China is a positive product catalyst. This story has real growth potential
as the game experience of Crossfire, which is operated by Tencent in China, is estimated to
generate $1 billion annually. This directly relates to the Vivendi transaction and validates the
opportunity from Call of Duty Online in China. The firm also has a great channel of anticipated
core games for fiscal 2014 such as Call of Duty: Black Ops, Destiny, Call of Duty Online China,
Heroes of the Storm, Hearthstone, and expansion in World of Warcraft, Diablo III and
Skylanders. This introduction of new franchises as players upgrade to the Xbox One and
Playstation 4 is crucial, and Activision has well positioned their new product stream to capitalize
on such shifts.
Value Drivers (%Rev) Historical Averages My Assumptions
Revenue Growth Rate 0.34% 5.34% Cost of sales, net D&A 36.36% 26.52%
Product Development 13.40% 12.63%
Sales and Marketing 11.93% 11.93%
General and Administrative 10.03% 10.03%
EBITDA 25% 39% Investment and other Income 0.22% 0.22%
Taxes (as % EBITDA) 17.25% 17.25%
Change in Working Capital 15.71% 3.00%
Capital Expenditure -0.33% 4.07%
Share Price (in Dollars) $17.28
$16.46
Hanke-Guttridge Discounted Cash Flow Methodology
38
EBITDA: While it is extremely difficult to accurately project each individual line item of the
cost structure, we can combine the operating expenses to get to our EBITDA percentage. Both
the market and I both expect the EBITDA margin to increase to roughly 39% in the future. This
is primarily due to growth in high-margin digital sales. In addition, the firm is projected to
increase its leading position by re-establishing existing franchises and introducing new
franchises as players upgrade to the Playstation 4 and XBoxOne.
Tax rate: The five year average shows that Apple has paid 17.25% of revenues in form of taxes. I
believe that this number will remain relatively constant as the lower rates from its growth in
emerging markets in recent years has already been factored into the model.
Change in working capital: The average change in net working capital shows large rise of
15.71%. While change working capital will continue to be positive due to the firm’s consistently
high level of cash on hand and strong asset base used to create and distribute complex gaming
systems, the market and I do not expect that this trend will continue at such a level going
forward. As a result, it is very reasonable to use the average of 2011 and 2012 change in working
capital going forward.
Capital expenditures: The historical average of -0.03% for capital expenditures is a pretty low
number for a firm in any given industry. Since Activision’s average rate of Depreciation and
Amortization compared to sales is 4.07%, we must use D&A as a proxy for CapEx. This
adjustment is often made when the CapEx average is below D&A and assumes that firms will
replenish their assets as they are being used. Therefore, the company will always have to reinvest
at a rate equal to D&A.
Conclusion
Activision Blizzard is the world’s largest video game publisher and the firm behind
franchises such as Call of Duty, Star Craft, World of Warcraft, and Diablo. With the buyout of
Vivendi's stake, Activision's earnings per share will be greatly boosted. In fact, Activision
estimated a 23% to 33% positive impact to earnings per share estimates. Analysts previously
were estimating earnings to hit $0.89. Activision's new guidance called for a range of $1.01 to
$1.09.
Activision is positioned to strengthen its leading position by re-establishing existing
franchises and introducing new franchises, such as Call of Duty: Ghosts, Skylanders SWAP
Force, and Destiny, as players upgrade to the Xbox One and Playstation 4. Destiny, in particular,
will drive significant sales growth during 2014 and gain a large user base early in the console
cycle.
Activision has benefited from the fact that game publishers are now more focused on
engaging users for a longer period of time and extending the monetization window by utilizing
social networks and releasing more downloadable content (DLC). Social networks develop as
players collaborate in online multiplayer games, which incentivize players not to switch to new
games (without others), as it means removing themselves from their respective network. DLC
also extends user engagement and adds additional revenue streams for publishers by selling
players software with additional functionality like levels and maps. Activision has used DLC and
social networks to create multiple multibillion dollar franchises such as World of Warcraft and
Call of Duty and analysts believe Destiny and other future franchises can be equally successful.
Hanke-Guttridge Discounted Cash Flow Methodology
39
The company is looking to expand the World of Warcraft pay-to-play model into new platforms
and, if successful, the firm could develop yet another recurring revenue stream that generates
gross margins of 75% to 80%.
In addition, Activision’s franchises have a dedicated user base, which gives them
leverage to push more of its sales through the direct digital channel, bypassing retailers,
generating higher gross margins, reducing physical inventories, and improving returns on
invested capital (ROIC). Activision’s adjusted ROICs averaged nearly 27% over the past three
years, well above its WACC, and most reports estimate average adjusted ROICs of 25% over the
next five years. Despite all of this positive factors, Activision’s current franchises are beginning
to mature and, while many are promising, it is hard to be certain that all upcoming releases will
be successful and generate large profits for the firm.
In regards to management compensation, management’s interests are in line with those of
its shareholders. The company’s dividend yield is currently 1.1%, and its current price is at the
higher end of historical averages.
The HG-DCF shows that the market seems to expect an improvement of a magnitude that
is unlikely to occur. Therefore, if historical averages run out, the stock is fairly valued.
Hanke-Guttridge Discounted Cash Flow Methodology
40
Bibliography
“Activision Blizzard.” Activision Blizzard Stock Quote. Morningstar, 9 Dec. 2013. Web. 9 Dec. 2013
<http://quotes.morningstar.com/stock/s?t=ATVI®ion=USA&culture=en-US>.
“Activision Blizzard.” Activision Blizzard Stock Quote. Yahoo Finance, 9 Dec. 2013. Web. 9 Dec. 2013
<http://finance.yahoo.com/q?s=ATVI>.
“Activision Blizzard Announces Better-Than-Expected Third Quarter 2013 Financial Results.”
Third Quarter Earnings Release. Activision Blizzard, 6 Nov. 2013. Web. 7 Dec. 2013.
<http://files.shareholder.com/downloads/ACTI/2834065578x0x704154/aea0172e-98c1-42d4-
b5f5-b92cb86d3211/ATVI_Q3_press_release_with_tables.pdf>.
"Definitive Proxy Statement." Definitive Proxy Statement. SEC, 26 April 2013. Web. 8 Sept. 2013.
<http://www.sec.gov/Archives/edgar/data/718877/000130817913000253/lactivision2013_def14a.
htm>.
"Form 10-K." Form 10-K. SEC, 22 Feb. 2013. Web. 8 Sept. 2013.
<http://www.sec.gov/Archives/edgar/data/718877/000104746913001506/a2213119z10-k.htm>.
Franke, Paul. “Activision Blizzard: Financial Engineering 101.” SeekingAlpha. SeekingAlpha, 8 Nov.
2013. Web. 1 Dec. 2013. <http://seekingalpha.com/article/1821562-activision-blizzard-financial-
engineering-101>.
Hickey, Mike. “Activision Blizzard, Inc. (ATVI).” 3Q Earnings Report. Benchmark Company, 7 Nov.
2013. Print. 8 Dec. 2013.
Katje, Chris. “Five Reasons Why Activision Blizzard Shares Are Headed For New Highs.” SeekingAlpha.
SeekingAlpha, 4 Nov. 2013. Web. 1 Dec. 2013. <http://seekingalpha.com/article/1800842-5-
reasons-why-activision-blizzard-shares-are-headed-for-new-highs>.