hans timmer, dilip ratha - depfe · pdf fileremittances and development hans timmer, based on...
TRANSCRIPT

Remittances and Development
Hans Timmer,based on work by Dilip Ratha
LINK meetingMexico CityMay 19, 2005

Remittances and Development
Why has development community become so interested in remittances?
How can the development-effectiveness of remittances be increased?
Is the impact of migration on development also positive?

Why the interest?
Remittances are a large, growing, and stable source of foreign exchange
Remittances go more than proportionally to the poor
Remittances don’t create debt problems
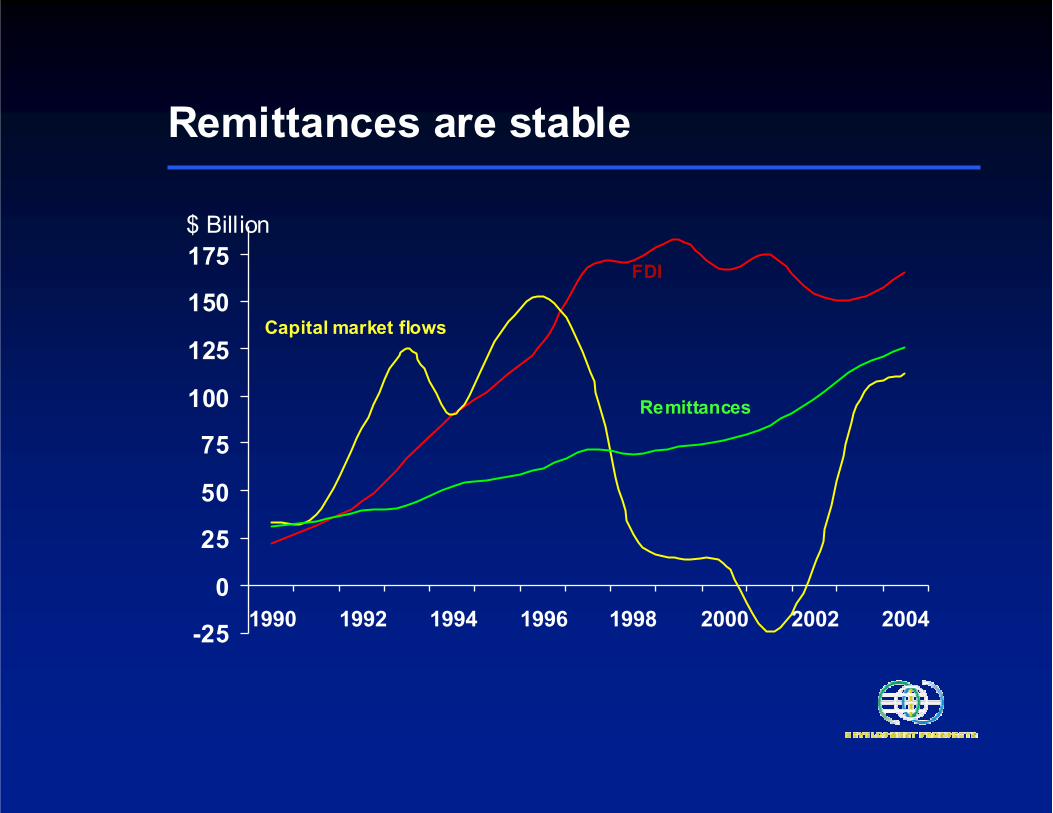
-25
0
25
50
75
100
125
150
175
1990 1992 1994 1996 1998 2000 2002 2004
$ Billion
Capital market flows
FDI
Remittances
Remittances are stable
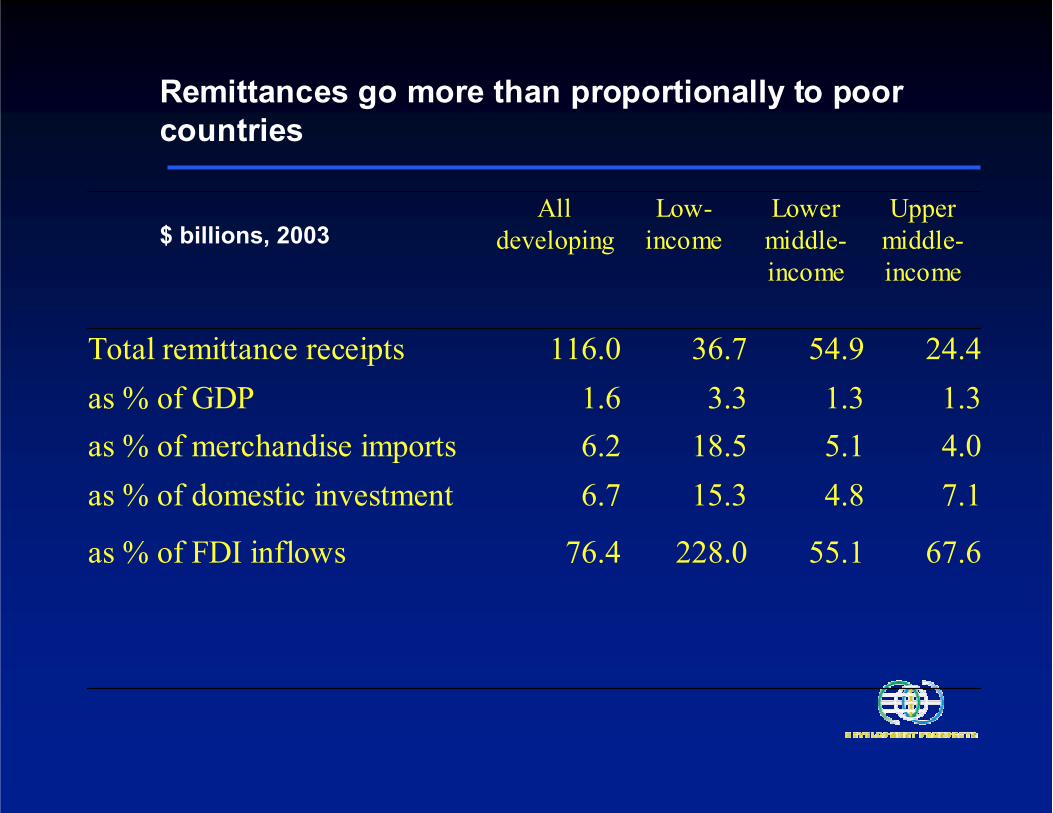
67.655.1228.076.4as % of FDI inflows
7.14.815.36.7as % of domestic investment4.05.118.56.2as % of merchandise imports1.31.33.31.6as % of GDP
24.454.936.7116.0Total remittance receipts
Upper middle-income
Lower middle-income
Low-income
All developing
Remittances go more than proportionally to poor countries
$ billions, 2003

Although top recipients are large countries….$ billion, 2003
13.2
8.4 8
3.2 2.9
India EgyptMoroccoPhilippinesMexico

12.413.914.214.514.614.714.816.116.918.720.022.323.725.0
29.5
40.6
12.0 11.7 11.2
05
1015202530354045
Tong
a
Hai
ti
Leso
tho
Mol
dova
Jord
an
Wes
t Ban
k an
d G
aza
Vanu
atu
Bosn
ia a
nd H
erze
govi
na
Jam
aica
Nep
al
El S
alva
dor
Dom
inic
an R
epub
lic
Alba
nia
Leba
non
Sam
oa
Hon
dura
s
Kiri
bati
Yem
en, R
ep.
Tajik
ista
n
Remittances are relatively larger in smaller countries

Remittance payments are larger in richer countries…Remittance payments $ bn
1.5
20.4
67.7
3.8
Low-income Lower middleincome
Upper-middle income
High income

…But as a share of GDP, remittance payments are larger in upper middle- income countries
Remittance payments as % of GDP
0.2
2.5
0.30.2
Low-income Lower middleincome
Upper-middle income
High income

“Neighborhood” effect on remittances to the poorest countries, 2000-02`
02468
101214161820
0 20 40 60 80 100
Sub-Saharan Countries
Lesotho
Moldova
Nepal
Uganda
Yemen
NicaraguaPakistan
VietnamBangladesh
Mongolia
Remittances (%GDP)
Share of country border with richer countries not in conflict

Data and Definition
Workers’ remittances + Compensation of Employees + Migrants’ transfers
No-reporting or under-reporting of informal flows
Bilateral flows missing

Improving data
G7 working group to improve statistics
Scrutiny of existing data for misclassification or under-reporting
Surveys of remittance service providers
Surveys of senders
Surveys of recipients
Surveys of central banks

Central Banks that have Central Banks that have participated in the survey so far*participated in the survey so far*
17.Bolivia18.Brazil19.Costa Rica20.Ecuador21.Guatemala22.Guyana23.Haiti24.Honduras25.Mexico26.Nicaragua
Latin America
27.Egypt28.Tunis
7. Azerbaijan8. Belarus9. Croatia10.Cyprus11.Georgia12.Latvia13.Moldova14.Poland15.Serbia 16.Slovenia
1.Bangladesh2.India3.Indonesia4.Pakistan5.Philippines6.Thailand
Middle EastEurope and Central AsiaAsia
*Total = 28 countries*Total = 28 countries that that received received $49 $49 billionbillion in in remittance flowsremittance flowsduringduring 2002, 2002, overover halfhalf ofof flowsflows toto developingdeveloping countriescountries..

Sources of Data on RemittancesSources of Data on Remittances
27%31%
35%
88%
0%
20%
40%
60%
80%
100%
CommercialBanks
MoneyTransfer
Companies
Other Fin.Institutions
Post Offices
Percent of Central BanksPercent of Central Banksthat Collect Data from:that Collect Data from:

85%
62%
46%
23%
0%
20%
40%
60%
80%
100%
Electronictransfers
Money orders Drafts Withdrawals atATMs
TransactionsTransactions
WhatWhat TypeType ofof TransactionsTransactionsare are RecordedRecorded as as RemittancesRemittances??
PercentPercent ofof Central Central BanksBanks thatthat Record Record RemittancesRemittances fromfrom thethe followingfollowing TypesTypes ofof
TransactionsTransactions

How to improve effectiveness?
Lower cost of transfers
Offer special incentives to diasporas
Facilitate international travel
Improve financial system and improve investment climate
But … recognize the person-to-person nature of remittances.

Remittance costs are high, and regressiveCharge
21%
10%9%
8% 7%
6%5% 4% 4% 4% 4% 3%
13%
40 75 150 225 300 375 560 745 930 1120 1305 1490 1860
Principal amount (euros)
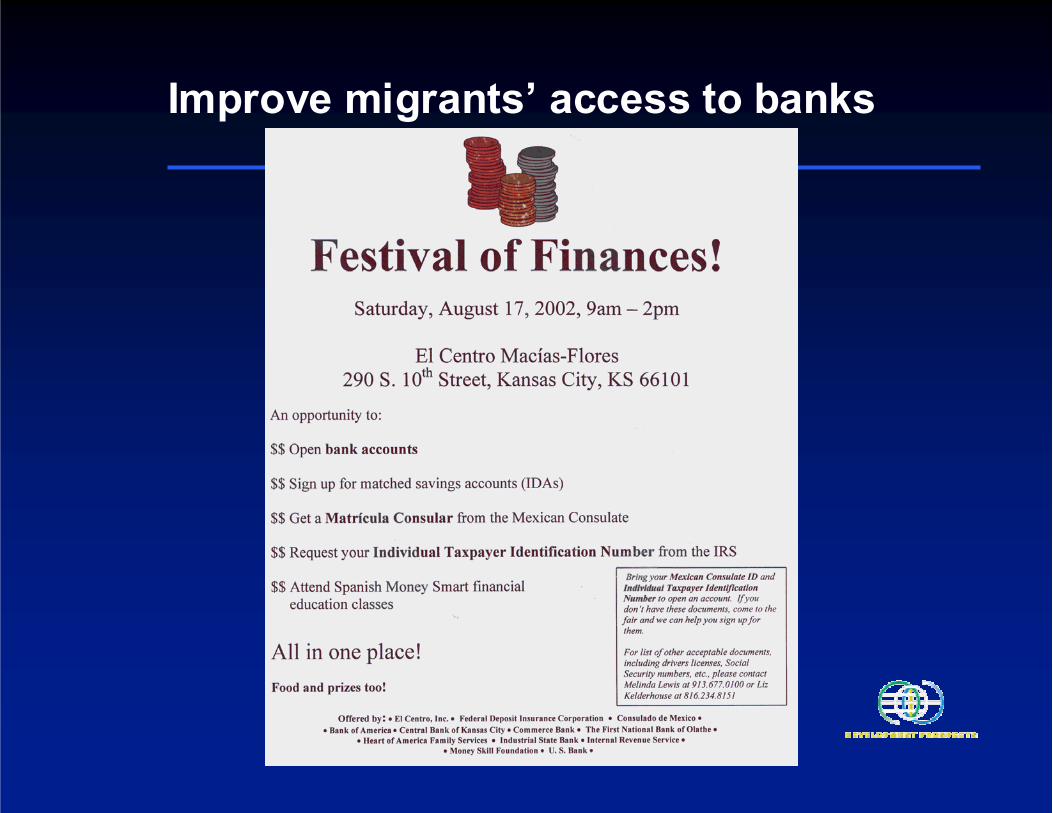
Improve migrants’ access to banks

Government Incentives to Transfer Government Incentives to Transfer Remittances Through Formal ChannelsRemittances Through Formal Channels
No61%
Yes39%
Which countries grant migrants Which countries grant migrants special incentives to send special incentives to send money back home?money back home?
1.1. AzerbaijanAzerbaijan2.2. BangladeshBangladesh3.3. EcuadorEcuador4.4. EgyptEgypt5.5. IndiaIndia6.6. MoldovaMoldova7.7. PakistanPakistan8.8. PhilippinesPhilippines9.9. SerbiaSerbia10.10.TunisTunis
Tax breaksTax breaksHigher interest rates Higher interest rates for depositsfor depositsFacilities for land Facilities for land purchasespurchasesEtc.Etc.

Improve investment climate in recipient countries
Remittances as % of GDP, 1996-2000
High Low
Corruption 0.5 1.9
Inequality 0.9 1.5
M2/GDP 1.2 0.9
Trade/GDP 1.2 1.0
What about migration?
Large gains for migrants (and receivers of remittances)
Mixed impacts on country of origin and host country.
Brain drain or brain gain?