hard evidence on soft skills ... · hard evidence on soft skills james j. heckman and tim d. kautz...
TRANSCRIPT
NBER WORKING PAPER SERIES
HARD EVIDENCE ON SOFT SKILLS
James J. HeckmanTim D. Kautz
Working Paper 18121http://www.nber.org/papers/w18121
NATIONAL BUREAU OF ECONOMIC RESEARCH1050 Massachusetts Avenue
Cambridge, MA 02138June 2012
This paper was presented as the Adam Smith Lecture at the Annual Meeting of the European Associationof Labour Economists held in Cyprus, September 2011. This research was supported in part by theUniversity of Chicago, A New Science of Virtues: A Project of the University of Chicago, the AmericanBar Foundation, a conference series from the Spencer Foundation, the JB & MK Pritzker Family Foundation,Susan Thompson Buffett Foundation, the Geary Institute, University College Dublin, Ireland, NICHDR37 HD065072 and R01 HD054702. We acknowledge the support of a European Research Councilgrant hosted by University College Dublin, DEVHEALTH 269874, a grant from the Institute for NewEconomic Thinking (INET), and an anonymous funder. The views expressed in this paper are thoseof the authors and not necessarily those of the funders or commentators mentioned here, nor of theNational Bureau of Economic Research.
NBER working papers are circulated for discussion and comment purposes. They have not been peer-reviewed or been subject to the review by the NBER Board of Directors that accompanies officialNBER publications.
© 2012 by James J. Heckman and Tim D. Kautz. All rights reserved. Short sections of text, not toexceed two paragraphs, may be quoted without explicit permission provided that full credit, including© notice, is given to the source.

Hard Evidence on Soft SkillsJames J. Heckman and Tim D. KautzNBER Working Paper No. 18121June 2012JEL No. D01,I20
ABSTRACT
This paper summarizes recent evidence on what achievement tests measure; how achievement testsrelate to other measures of "cognitive ability" like IQ and grades; the important skills that achievementtests miss or mismeasure, and how much these skills matter in life.
Achievement tests miss, or perhaps more accurately, do not adequately capture, soft skills—personalitytraits, goals, motivations, and preferences—that are valued in the labor market, in school, and in manyother domains. The larger message of this paper is that soft skills predict success in life, that they causallyproduce that success, and that programs that enhance soft skills have an important place in an effectiveportfolio of public policies.
James J. HeckmanDepartment of EconomicsThe University of Chicago1126 E. 59th StreetChicago, IL 60637and University College Dublin and IZAand also [email protected]
Tim D. KautzUniversity of ChicagoDepartment of Economics1126 E. 59th StreetChicago IL [email protected]
Contents
1 Introduction 2
2 Defining and Measuring Personality Traits 7
2.1 History and Measurement of Cognitive Ability . . . . . . . . . . . . . . . . . 7
2.2 Defining and Measuring Psychological Traits . . . . . . . . . . . . . . . . . . 9
2.3 Identification Problems in Measuring Traits . . . . . . . . . . . . . . . . . . 14
2.4 Are There Stable Personality Traits? . . . . . . . . . . . . . . . . . . . . . . 15
2.5 The Evolution of Personality Traits Over the Life Cycle . . . . . . . . . . . . 17
2.6 The Predictive Power of Personality . . . . . . . . . . . . . . . . . . . . . . . 18
3 Causal Evidence 20
3.1 Problems with Establishing Causality . . . . . . . . . . . . . . . . . . . . . . 20
3.2 Extreme Examples of Personality Change . . . . . . . . . . . . . . . . . . . . 22
3.3 Evidence from the GED Testing Program . . . . . . . . . . . . . . . . . . . . 23
3.4 Evidence from The Perry Preschool Program and Other Interventions . . . . 32
3.5 Additional Evidence . . . . . . . . . . . . . . . . . . . . . . . . . . . . . . . 36
4 Summary 37
1
1 Introduction
Contemporary society places great value on standardized achievement tests to sift and sort
people, to evaluate schools, and to assess the performance of nations. Admissions commit-
tees use tests like the SAT, the ACT, and the GRE (Graduate Record Examinations) to
screen applicants. In the United States, the No Child Left Behind (NCLB) Act stipulates
that government-run schools must administer standardized achievement tests in order to be
eligible for federal funding.1 The Programme for International Student Assessment (PISA)
evaluates student performance in math, science, and reading across countries. The results
attract media attention and influence policy. The year 2000 PISA test results caused Ger-
many to re-evaluate its educational system and introduce a variety of educational reforms
(Grek, 2009).
Despite the widespread use of standardized achievement tests, the traits that they mea-
sure are not well-understood. This paper summarizes recent evidence on what achievement
tests capture; how achievement tests relate to other measures of “cognitive ability” like IQ
and grades; the important skills that achievement tests miss or mismeasure, and how much
these other skills matter in life.
Achievement tests miss, or more accurately, do not adequately capture, soft skills—
personality traits, goals, motivations, and preferences that are valued in the labor market,
in school, and in many other domains. The larger message of this paper is that soft skills
predict success in life, that they produce that success, and that programs that enhance soft
skills have an important place in an effective portfolio of public policies.2
Measurement of cognition and educational attainment has been refined during the past
century. Psychometricians have shown that cognitive ability has multiple facets.3 This
1Sales of achievement tests have increased by nearly 400% between 1959 and 2005 (Digest of EducationStatistics, various years; The Bowker Annual: Library and Book Trade Almanac, various years).
2This paper draws on and supplements Borghans et al. (2008a), Almlund et al. (2011), and Heckmanet al. (2012a).
3See Carroll (1994) and Ackerman and Heggestad (1997) for a discussion.
2
progress is not widely appreciated. Many social scientists—even many psychologists—
continue to use IQ tests, standardized achievement tests, and grades interchangeably to
proxy “cognitive ability.”4 Even though scores on IQ tests, standardized achievement tests,
and grades are positively correlated with each other, the recent literature shows that they
measure different skills and depend on different facets of cognitive ability. Recent research
also shows that all three measures are associated with personality, but to different degrees
across various cognitive measures.
Standardized achievement tests were designed to capture “general knowledge” produced
in schools and through life experiences. Such knowledge is thought to be relevant to success
inside and outside of the classroom. However, achievement tests are often validated using
other standardized achievement tests or other measures of cognitive ability—surely a circular
practice.
A more relevant validity criterion is how well these tests predict meaningful outcomes,
such as educational attainment, labor market success, crime, and health. No single mea-
sure of cognitive ability predicts much of the variance in these outcomes, and measurement
error does not account for most of the remaining variance, leaving much room for other
determinants of success.5
Success in life depends on personality traits that are not well captured by measures of cog-
nition. Conscientiousness, perseverance, sociability, and curiosity matter. While economists
have largely ignored these traits, personality psychologists have studied them over the last
century.6 They have constructed measures of them and provide evidence that these traits
predict meaningful life outcomes.
Many scholars—inside and outside of psychology—have questioned the existence of sta-
ble personality traits, arguing that constraints and incentives in situations almost entirely
4Many call this “IQ”, e.g., Flynn (2007), Nisbett (2009), and Nisbett et al. (2012).5On the magnitudes of measurement error on a variety of economic measures, see Bound et al. (2001).
These authors report that at most 15–30% of earnings variance is due to measurement error.6Some early studies in economics are Bowles and Gintis (1976), and Bowles et al. (2001). An important
study in sociology is Jencks (1979). Work in psychology going back to Terman et al. (1925) shows thatpersonality traits matter (see Murray, 1938; Terman et al., 1947; and the discussion in Gensowski, 2012).
3
determine behavior. These scholars claim that people are like chameleons—they adapt to
any situation.7 A substantial body of evidence shows that stable traits exist. People tend
to behave in the same fashion across a wide range of situations.8 Evidence from genetics
and neuroscience provides a biological basis for the existence of such traits, suggesting that
something tied to the person, not the just the situation, affects behavior.9
Throughout this paper we use the term “personality traits” to describe the personal
attributes not thought to be captured by measures of abstract reasoning power. These at-
tributes go by many names in the literature, including soft skills, personality traits, noncogni-
tive skills, noncognitive abilities, character, and socioemotional skills. These different names
connote different properties. The term “traits” suggests a sense of permanence and possibly
also of heritability. The terms “skills” and “character” suggest that they can be learned. In
reality, the extent to which these personal attributes can change lies on a spectrum. Both
cognitive and personality traits can change and be changed over the life cycle but through dif-
ferent mechanisms and to different degrees at different ages. To avoid confusion, throughout
this paper we use the term “trait” to capture the set of personal attributes we study.10
Psychological traits are not directly observed. There is no ruler for perseverance, no
caliper for intelligence. All cognitive and personality traits are measured using performance
on “tasks,” broadly defined. Different tasks require different traits in different combinations.
Some distinguish between measurements of traits and measurements of outcomes, but this
distinction is misleading. Both traits and outcomes are measured using performance on some
task or set of tasks.
Psychologists sometimes claim to circumvent this measurement issue by creating tax-
onomies of traits and by applying intuitive names to responses on questionnaires. These
7See Mischel (1968). Some behavioral economists share this view. See, e.g., Thaler (2008).8See Epstein (1979) for an early paper showing that personality traits are stable across multiple situations.
See the special issue of Journal of Research in Personality (43),“Personality and Assessment at Age 40,” fora more recent discussion.
9See Bouchard and Loehlin (2001) for estimates of the heritability of traits. See Canli (2006) and DeYounget al. (2010) for evidence that regions of the brain are associated with different traits.
10Drawing on the literature in psychology, Borghans et al. (2008a) present one definition of cognitive traits.
4

questionnaires are not windows to the soul. They are still rooted in task performance or
behavior. Responding to a questionnaire is itself a task. Additionally, many of the question-
naires inquire directly about behavior, e.g., a measure of Agreeableness used in the German
Socioeconomic Panel asks the extent to which a respondent “is sometimes somewhat rude to
others.”11 How else can one answer that question but reflect on one’s behavior? IQ tests and
standardized achievement tests also measure performance on different “cognitively loaded”
tasks.
Performance on most tasks depends on effort, personality traits, cognitive ability, and
incentives, although the importance of each differs by task. This dependence creates a
fundamental problem in measuring traits. Most studies in psychology devise a set of measures
to capture a trait but do not standardize for incentives in the situation in which the trait
is being measured or for other traits. Measured cognitive ability and measured personality
depend on a constellation of factors. The identification problem arising from the multiple
determinants of performance on tasks is empirically important, even for measures of cognitive
ability. Incentives can affect performance on IQ tests. Multiple traits affect performance on
cognitive tasks. For example, personality traits affect achievement test scores and grades.12
Caution is required in taking the measures developed by psychologists too literally.
Nonetheless, measures of personality traits predict meaningful life outcomes. Conscien-
tiousness – the tendency to be organized, responsible, and hardworking—is the most widely
predictive of the commonly used personality measures. It predicts educational attainment,
health, and labor market outcomes as strongly as measures of cognitive ability.13
Most studies in psychology only report correlations between measured traits and out-
comes without addressing whether the traits cause the outcomes and without controlling for
the other traits and incentives that determine performance on the tasks used to measure the
traits. While traits are relatively stable across situations, they are not set in stone. They
11Throughout this paper, we adopt the convention of capitalizing traits from the “Big Five” personalitytaxonomy. See Table 3 for a description of the Big Five.
12See Borghans et al. (2011a).13See the evidence collected in Almlund et al. (2011), Borghans et al. (2008a), and Roberts et al. (2007).
5
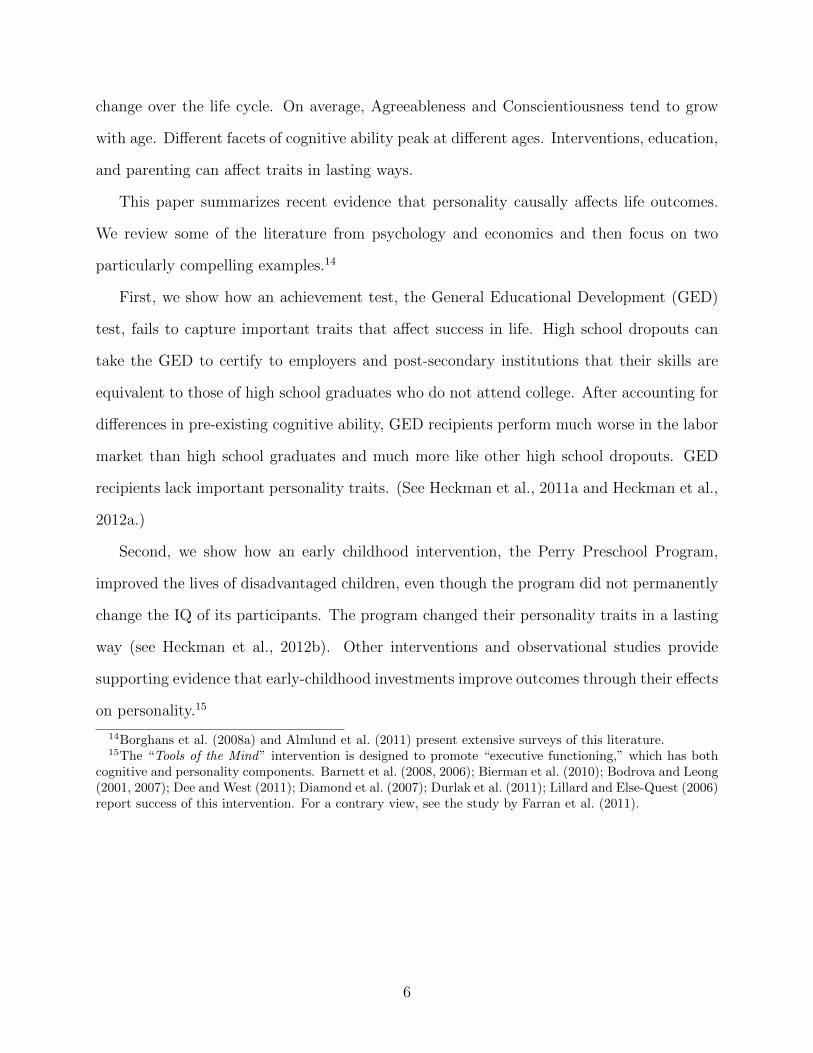
change over the life cycle. On average, Agreeableness and Conscientiousness tend to grow
with age. Different facets of cognitive ability peak at different ages. Interventions, education,
and parenting can affect traits in lasting ways.
This paper summarizes recent evidence that personality causally affects life outcomes.
We review some of the literature from psychology and economics and then focus on two
particularly compelling examples.14
First, we show how an achievement test, the General Educational Development (GED)
test, fails to capture important traits that affect success in life. High school dropouts can
take the GED to certify to employers and post-secondary institutions that their skills are
equivalent to those of high school graduates who do not attend college. After accounting for
differences in pre-existing cognitive ability, GED recipients perform much worse in the labor
market than high school graduates and much more like other high school dropouts. GED
recipients lack important personality traits. (See Heckman et al., 2011a and Heckman et al.,
2012a.)
Second, we show how an early childhood intervention, the Perry Preschool Program,
improved the lives of disadvantaged children, even though the program did not permanently
change the IQ of its participants. The program changed their personality traits in a lasting
way (see Heckman et al., 2012b). Other interventions and observational studies provide
supporting evidence that early-childhood investments improve outcomes through their effects
on personality.15
14Borghans et al. (2008a) and Almlund et al. (2011) present extensive surveys of this literature.15The “Tools of the Mind” intervention is designed to promote “executive functioning,” which has both
cognitive and personality components. Barnett et al. (2008, 2006); Bierman et al. (2010); Bodrova and Leong(2001, 2007); Dee and West (2011); Diamond et al. (2007); Durlak et al. (2011); Lillard and Else-Quest (2006)report success of this intervention. For a contrary view, see the study by Farran et al. (2011).
6
2 Defining and Measuring Personality Traits
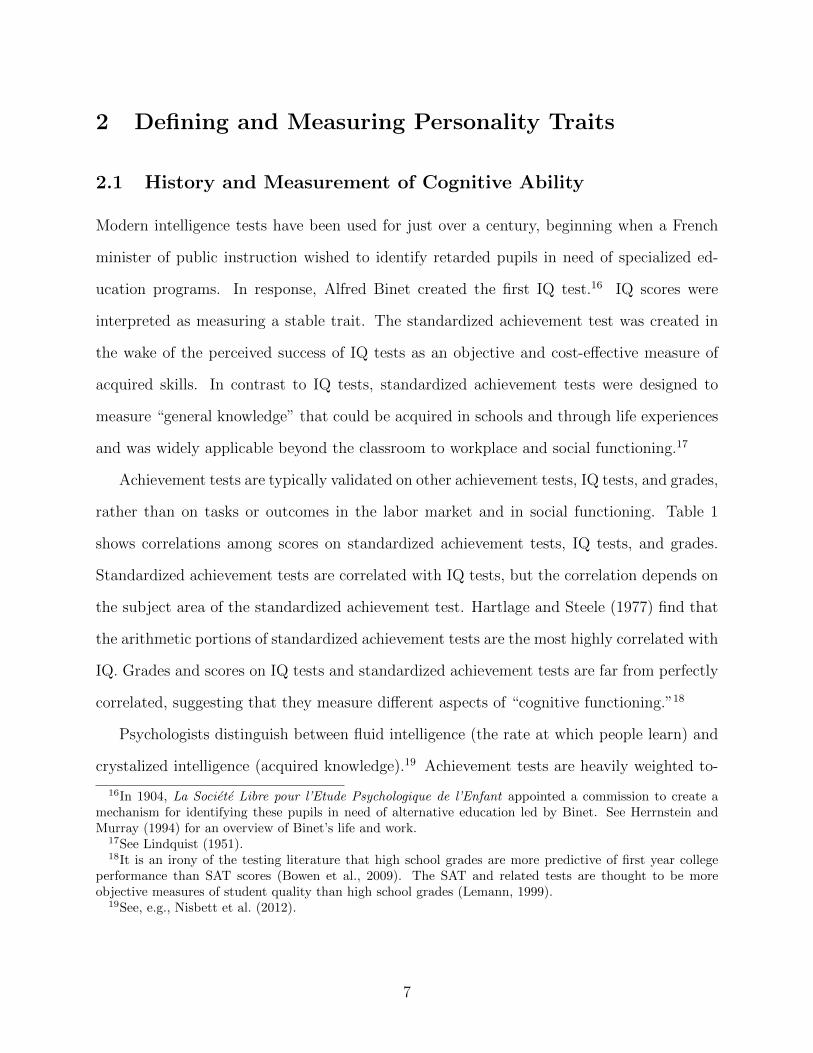
2.1 History and Measurement of Cognitive Ability
Modern intelligence tests have been used for just over a century, beginning when a French
minister of public instruction wished to identify retarded pupils in need of specialized ed-
ucation programs. In response, Alfred Binet created the first IQ test.16 IQ scores were
interpreted as measuring a stable trait. The standardized achievement test was created in
the wake of the perceived success of IQ tests as an objective and cost-effective measure of
acquired skills. In contrast to IQ tests, standardized achievement tests were designed to
measure “general knowledge” that could be acquired in schools and through life experiences
and was widely applicable beyond the classroom to workplace and social functioning.17
Achievement tests are typically validated on other achievement tests, IQ tests, and grades,
rather than on tasks or outcomes in the labor market and in social functioning. Table 1
shows correlations among scores on standardized achievement tests, IQ tests, and grades.
Standardized achievement tests are correlated with IQ tests, but the correlation depends on
the subject area of the standardized achievement test. Hartlage and Steele (1977) find that
the arithmetic portions of standardized achievement tests are the most highly correlated with
IQ. Grades and scores on IQ tests and standardized achievement tests are far from perfectly
correlated, suggesting that they measure different aspects of “cognitive functioning.”18
Psychologists distinguish between fluid intelligence (the rate at which people learn) and
crystalized intelligence (acquired knowledge).19 Achievement tests are heavily weighted to-
16In 1904, La Societe Libre pour l’Etude Psychologique de l’Enfant appointed a commission to create amechanism for identifying these pupils in need of alternative education led by Binet. See Herrnstein andMurray (1994) for an overview of Binet’s life and work.
17See Lindquist (1951).18It is an irony of the testing literature that high school grades are more predictive of first year college
performance than SAT scores (Bowen et al., 2009). The SAT and related tests are thought to be moreobjective measures of student quality than high school grades (Lemann, 1999).
19See, e.g., Nisbett et al. (2012).
7

Table 1: Cognitive Ability Validities
Test Validation Domain Estimate(s) Source(s)
SAT (Achievement) 1st Year College GPA 0.35 - 0.53 Kobrin et al. (2008)
ACT (Achievement) Early College GPA 0.42 ACT, Inc. (2007)
GED (Achievement) HS Senior GPA 0.33 - 0.49 GED Testing Service (2009)
DAT (Achievement) College GPA 0.13 - 0.62† Omizo (1980)
AFQT (Achievement) 9th Grade GPA 0.54 Borghans et al. (2011a)
WAIS (IQ) College GPA 0.38 - 0.43 Feingold (1982)
WAIS (IQ) HS GPA 0.62 Feingold (1982)
Various IQ∗∗ 9th Grade GPA 0.42 Borghans et al. (2011a)
WISC (IQ) WRAT (Achievement) 0.44 - 0.75‡ Hartlage and Steele (1977)
WISC-R (IQ) WRAT (Achievement) 0.35 - 0.76‡ Hartlage and Steele (1977)
Various IQ∗∗ AFQT (Achievement) 0.65 Borghans et al. (2011a)
Stanford Binet (IQ) WISC-R (IQ) 0.77 - 0.87 Rothlisberg (1987), Greene et al. (1990)
Raven’s (IQ) WAIS-R (IQ) 0.74 - 0.84 O’Leary et al. (1991)
WIAT (Achievement) CAT/2 (Achievement) 0.69 - 0.83∗ Michalko and Saklofske (1996)
Definitions: WISC – Wechsler Intelligence Scale for Children, WISC-R – Wechsler Intelligence Scale for Children - Revised,WAIS - Wechsler Adult Intelligence Scale, Raven’s IQ – Raven’s Standard Progressive Matrices, GED – General EducationalDevelopment, DAT – Differential Aptitude Tests, WIAT – Wechsler Individual Achievement Test, CAT – CaliforniaAchievement Test, WRAT – Wide Range Achievement Test, AFQT – Armed Forces Qualification Test† Large range is due to varying validity of eight subtests of DAT‡ Ranges are given because correlations vary by academic subject∗ Ranges are given because correlations vary by grade level∗∗ IQ test scores in the NLSY79 are pooled across several IQ tests using IQ percentiles
8

wards crystallized intelligence,20 whereas IQ tests like Raven’s progressive matrices (1962)
are heavily weighted toward fluid intelligence.21,22 Many psychologists do not recognize the
differences among these measures and interchangeably use IQ, achievement tests, and grades
to measure “cognitive ability” or “intelligence,” and this practice is also widespread in eco-
nomics.23
2.2 Defining and Measuring Psychological Traits
Validating one measure of cognitive ability using other measures of cognitive ability is circu-
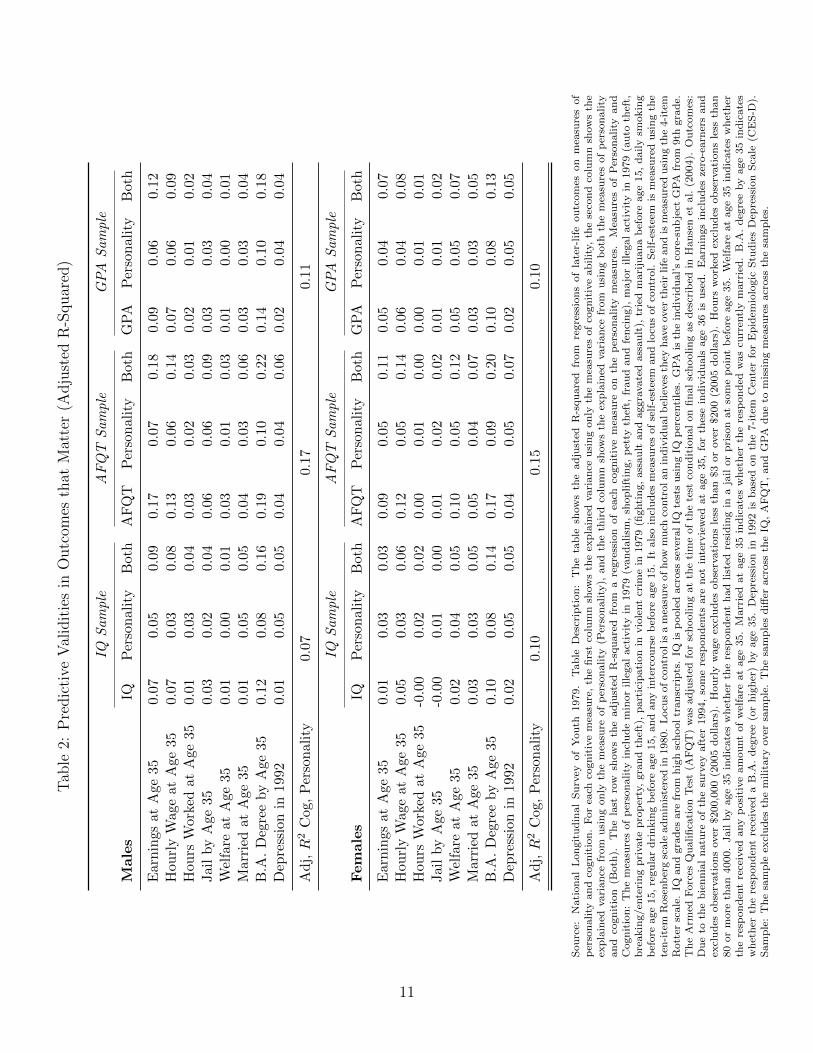
lar. More relevant is how well these measures predict important life outcomes. Table 2 shows
the extent to which IQ, standardized achievement tests, and grades explain the variance of
outcomes at age 35 in the National Longitudinal Survey of Youth, 1979 (NLSY79) data. The
three groups of columns under each category show results for different sub-samples based on
the availability of the different cognitive measures. For each category, the first column shows
the explained variance using only the designated measure of cognitive ability. Achievement
tests and grades are more predictive than IQ. But none of these measures explains much of
the variation of any outcome, leaving considerable room for other determinants. As noted
in the introduction, it is unlikely that measurement error accounts for all of the remaining
variance.
Personality is one missing ingredient. The second columns in each category preview our
later discussion of the explanatory power of personality. They show the variance explained
by measures of personality.24 In many cases, the variance explained by personality measures
rivals that explained by measures of cognitive ability. The relative importance of person-
20See Roberts et al. (2000).21See Raven et al. (1988). The high correlation between intelligence and achievement tests is in part due
to the fact that both require cognitive ability and knowledge. Common developmental factors may affectboth of these traits. Fluid intelligence promotes the acquisition of crystallized intelligence.
22Carroll (1994) and Ackerman and Heggestad (1997) discuss more disaggregated facets of cognitive ability.23See Flynn (2007) and Nisbett et al. (2012). For examples in economics, see Benjamin et al. (2006).24They include measures of adolescent risky behavior, self-esteem and locus of control (the extent to which
people feel they have control over their lives). For precise definitions of the measures used, see the notes toTable 2.
9

ality depends on the outcome. The third column for each sub-sample shows the variance
explained when both the cognitive and personality measures are used as predictors. In many
cases, including the measures of personality in a regression with cognitive measures explains
additional variance. The correlations between the set of measures of personality and the
measures of cognition are positive, but not especially strong (see the bottom row of each
table). Each set of traits has an independent influence on the outcomes in the table.
Even though economists have largely ignored personality traits, the pioneers of the orig-
inal IQ tests recognized their importance.25 Alfred Binet the creator of the first IQ test (the
Stanford-Binet test), noted that:
“[Success in school] ...admits of other things than intelligence; to succeed in his
studies, one must have qualities which depend on attention, will, and character;
for example a certain docility, a regularity of habits, and especially continuity of
effort. A child, even if intelligent, will learn little in class if he never listens, if
he spends his time in playing tricks, in giggling, in playing truant.”
-(Binet and Simon, 1916, p. 254)
Since the middle of the 19th century, personality psychologists have studied these traits.
One leading personality psychologist defines personality traits in the following way:
“Personality traits are the relatively enduring patterns of thoughts, feelings, and
behaviors that reflect the tendency to respond in certain ways under certain cir-
cumstances.”
-(Roberts, 2009, p. 140)
Personality traits are manifested through thoughts, feelings, and behaviors, and therefore,
must be inferred from measures of performance on “tasks,” broadly defined. Under this
25Lewis Terman, who created the Stanford-Binet test, even collected data on personality traits of a high-ability sample. In this sample, Conscientiousness is highly predictive of health and earnings (Savelyev, 2011;Gensowski, 2012).
10
Tab
le2:
Pre
dic
tive
Val
idit
ies
inO
utc
omes
that
Mat
ter
(Adju
sted
R-S
quar
ed)
IQS
am
ple
AF
QT
Sam
ple
GP
AS
am
ple
Males
IQP
erso
nal
ity
Bot
hA
FQ
TP
erso
nal
ity
Bot
hG
PA
Per
son
ali
tyB
oth
Ear
nin
gsat
Age
350.
070.
050.
090.
170.
070.
18
0.0
90.0
60.1
2H
ourl
yW
age
atA
ge35
0.07
0.03
0.08
0.13
0.06
0.14
0.0
70.0
60.0
9H
ours
Wor
ked
atA
ge35
0.01
0.03
0.04
0.03
0.02
0.03
0.0
20.0
10.0
2Jai
lby
Age
350.
030.
020.
040.
060.
060.
09
0.0
30.0
30.0
4W
elfa
reat
Age
350.
010.
000.
010.
030.
010.
03
0.0
10.0
00.0
1M
arri
edat
Age
350.
010.
050.
050.
040.
030.
06
0.0
30.0
30.0
4B
.A.
Deg
ree
by
Age
350.
120.
080.
160.
190.
100.
22
0.1
40.1
00.1
8D
epre
ssio
nin
1992
0.01
0.05
0.05
0.04
0.04
0.06
0.0
20.0
40.0
4
Ad
j,R
2C
og,
Per
son
alit
y0.
070.
170.1
1
IQS
am
ple
AF
QT
Sam
ple
GP
AS
am
ple
Females
IQP
erso
nal
ity
Bot
hA
FQ
TP
erso
nal
ity
Both
GP
AP
erso
nali
tyB
oth
Ear
nin
gsat
Age
350.
010.
030.
030.
090.
050.
11
0.0
50.0
40.0
7H
ourl
yW
age
atA
ge35
0.05
0.03
0.06
0.12
0.05
0.14
0.0
60.0
40.0
8H
ours
Wor
ked
atA
ge35
-0.0
00.
020.
020.
000.
010.
00
0.0
00.0
10.0
1Jai
lby
Age
35-0
.00
0.01
0.00
0.01
0.02
0.02
0.0
10.0
10.0
2W
elfa
reat
Age
350.
020.
040.
050.
100.
050.
12
0.0
50.0
50.0
7M
arri
edat
Age
350.
030.
030.
050.
050.
040.
07
0.0
30.0
30.0
5B
.A.
Deg
ree
by
Age
350.
100.
080.
140.
170.
090.
20
0.1
00.0
80.1
3D
epre
ssio
nin
1992
0.02
0.05
0.05
0.04
0.05
0.07
0.0
20.0
50.0
5
Ad
j,R
2C
og,
Per
son
alit
y0.
100.
150.1
0
Sou
rce:
Nati
on
al
Lon
git
ud
inal
Su
rvey
of
You
th1979.
Table
Des
crip
tion
:T
he
table
show
sth
ead
just
edR
-squ
are
dfr
om
regre
ssio
ns
of
late
r-life
ou
tcom
eson
mea
sure
sof
per
son
ality
an
dco
gn
itio
n.
For
each
cogn
itiv
em
easu
re,
the
firs
tco
lum
nsh
ow
sth
eex
pla
ined
vari
an
ceu
sin
gon
lyth
em
easu
res
of
cogn
itiv
eab
ilit
y,th
ese
con
dco
lum
nsh
ow
sth
eex
pla
ined
vari
an
cefr
om
usi
ng
on
lyth
em
easu
reof
per
son
ality
(Per
son
ality
),an
dth
eth
ird
colu
mn
show
sth
eex
pla
ined
vari
an
cefr
om
usi
ng
both
the
mea
sure
sof
per
son
ality
an
dco
gn
itio
n(B
oth
).T
he
last
row
show
sth
ead
just
edR
-squ
are
dfr
om
are
gre
ssio
nof
each
cogn
itiv
em
easu
reon
the
per
son
ality
mea
sure
s.M
easu
res
of
Per
son
ality
an
dC
ogn
itio
n:
Th
em
easu
res
of
per
son
ality
incl
ud
em
inor
ille
gal
act
ivit
yin
1979
(van
dalism
,sh
op
lift
ing,
pet
tyth
eft,
frau
dan
dfe
nci
ng),
ma
jor
ille
gal
act
ivit
yin
1979
(au
toth
eft,
bre
akin
g/en
teri
ng
pri
vate
pro
per
ty,
gra
nd
thef
t),
part
icip
ati
on
invio
lent
crim
ein
1979
(fighti
ng,
ass
au
ltan
daggra
vate
dass
au
lt),
trie
dm
ari
juan
ab
efore
age
15,
daily
smokin
gb
efore
age
15,
regu
lar
dri
nkin
gb
efore
age
15,
an
dany
inte
rcou
rse
bef
ore
age
15.
Itals
oin
clu
des
mea
sure
sof
self
-est
eem
an
dlo
cus
of
contr
ol.
Sel
f-es
teem
ism
easu
red
usi
ng
the
ten
-ite
mR
ose
nb
erg
scale
ad
min
iste
red
in1980.
Locu
sof
contr
olis
am
easu
reof
how
mu
chco
ntr
olan
ind
ivid
ualb
elie
ves
they
have
over
thei
rlife
an
dis
mea
sure
du
sin
gth
e4-i
tem
Rott
ersc
ale
.IQ
an
dgra
des
are
from
hig
hsc
hool
tran
scri
pts
.IQ
isp
oole
dacr
oss
sever
al
IQte
sts
usi
ng
IQp
erce
nti
les.
GP
Ais
the
ind
ivid
ual’s
core
-su
bje
ctG
PA
from
9th
gra
de.
Th
eA
rmed
Forc
esQ
ualifi
cati
on
Tes
t(A
FQ
T)
was
ad
just
edfo
rsc
hoolin
gat
the
tim
eof
the
test
con
dit
ion
al
on
fin
al
sch
oolin
gas
des
crib
edin
Han
sen
etal.
(2004).
Ou
tcom
es:
Du
eto
the
bie
nn
ial
natu
reof
the
surv
eyaft
er1994,
som
ere
spon
den
tsare
not
inte
rvie
wed
at
age
35,
for
thes
ein
div
idu
als
age
36
isu
sed
.E
arn
ings
incl
ud
esze
ro-e
arn
ers
an
dex
clu
des
ob
serv
ati
on
sover
$200,0
00
(2005
dollars
).H
ou
rly
wage
excl
ud
esob
serv
ati
on
sle
ssth
an
$3
or
over
$200
(2005
dollars
).H
ou
rsw
ork
edex
clu
des
ob
serv
ati
on
sle
ssth
an
80
or
more
than
4000.
Jail
by
age
35
ind
icate
sw
het
her
the
resp
on
den
th
ad
list
edre
sid
ing
ina
jail
or
pri
son
at
som
ep
oin
tb
efore
age
35.
Wel
fare
at
age
35
ind
icate
sw
het
her
the
resp
on
den
tre
ceiv
edany
posi
tive
am
ou
nt
of
wel
fare
at
age
35.
Marr
ied
at
age
35
ind
icate
sw
het
her
the
resp
on
ded
was
curr
entl
ym
arr
ied
.B
.A.
deg
ree
by
age
35
ind
icate
sw
het
her
the
resp
on
den
tre
ceiv
eda
B.A
.d
egre
e(o
rh
igh
er)
by
age
35.
Dep
ress
ion
in1992
isb
ase
don
the
7-i
tem
Cen
ter
for
Ep
idem
iolo
gic
Stu
die
sD
epre
ssio
nS
cale
(CE
S-D
).S
am
ple
:T
he
sam
ple
excl
ud
esth
em
ilit
ary
over
sam
ple
.T
he
sam
ple
sd
iffer
acr
oss
the
IQ,
AF
QT
,an
dG
PA
du
eto
mis
sin
gm
easu
res
acr
oss
the
sam
ple
s.
11
definition, performance on IQ tests is a personality trait because it is an enduring pattern
of behavior (how one “behaves” or “performs” on an IQ test).26
Personality psychologists primarily measure personality traits using self-reported surveys.
They have arrived at a relatively well-accepted taxonomy of traits called the “Big Five,”
which includes Openness to Experience, Conscientiousness, Extraversion, Agreeableness,
and Neuroticism. Table 3 defines these traits and their multiple facets.27 Some argue that
the Big Five are the longitude and latitude of personality, by which all more narrowly defined
traits may be categorized (see Costa and McCrae, 1992a). While the Big Five measures are
now the most widely used, there are several other taxonomies, including the Big Three, the
MPQ, and the Big Nine. They are conceptually and empirically related to the Big Five.28
Other taxonomies, including psychopathology as measured by the DSM IV and measures
of temperament, have also been related to the Big Five.29 Almlund et al. (2011) show
that economic preference parameters are not all that closely related to psychological traits
and apparently represent different traits that, along with the psychological traits, govern
behavior.
A deeper issue, as yet not systematically investigated in the literature in economics
or psychology, is whether the traits captured by the alternative measurement systems are
the manifestation of a deeper set of preferences or goals. Achieving certain goals requires
certain traits, e.g., a surgeon has to be careful and intelligent; a salesman has to be outgoing
and engaging and so forth, etc. Under this view, traits are developed through practice,
investment, and habituation. The deeper traits may be the preference parameters that
generate the manifest traits. The apparent stability of expressed traits across situations may
be a consequence of the stability of the goals and incentives to achieve these goals.30
26Studies of test-retest reliability of IQ tests show that scores are highly correlated across repeated testingoccasions (see, e.g., Niolon, 2005).
27See, e.g., Borghans et al. (2008a).28See Borghans et al. (2008a) and Almlund et al. (2011) for a comparison of these taxonomies.29See, e.g., Cloninger et al. (1999).30McAdams and Pals (2006) adds goals to the list of possible traits. Almlund et al. (2011) develop a model
in which preferences and traits determine the effort applied to tasks.
12

Tab
le3:
The
Big
Fiv
eD
omai
ns
and
Thei
rF
acet
s
Big
Fiv
eP
erso
n-
alit
yF
acto
rA
mer
ican
Psy
chol
ogy
Ass
oci
atio
nD
icti
onary
des
crip
tion
Fac
ets
(an
dco
rrel
ated
trai
tad
-je
ctiv
e)R
elat
edT
rait
sA
nal
ogou
sC
hil
dh
ood
Tem
per
a-
men
tT
rait
s
Con
scie
nti
ousn
ess
“th
ete
nd
ency
tob
eor
-gan
ized
,re
spon
sib
le,
and
har
dw
orkin
g”
Com
pet
ence
(effi
cien
t),
Ord
er(o
rgan
ized
),D
uti
fuln
ess
(not
care
less
),A
chie
vem
ent
stri
vin
g(a
mb
itio
us)
,S
elf-
dis
cip
lin
e(n
otla
zy),
and
Del
iber
atio
n(n
otim
pu
lsiv
e)
Gri
t,P
erse
vera
nce
,D
e-la
yof
grat
ifica
tion
,Im
-p
uls
eco
ntr
ol,
Ach
ieve
-m
ent
stri
vin
g,A
mb
itio
n,
and
Wor
ket
hic
Att
enti
on/(
lack
of)
dis
tract
ibil
-it
y,E
ffor
tfu
lco
ntr
ol,
Imp
uls
eco
ntr
ol/d
elay
ofgr
atifi
cati
on
,P
ersi
sten
ce,
Act
ivit
y∗
Op
enn
ess
toE
x-
per
ien
ce“t
he
ten
den
cyto
be
open
ton
ewae
sth
etic
,cu
l-tu
ral,
orin
tell
ectu
alex
-p
erie
nce
s”
Fan
tasy
(im
agin
ativ
e),
Aes
thet
ic(a
rtis
tic)
,F
eeli
ngs
(exci
tab
le),
Act
ion
s(w
ide
inte
rest
s),
Idea
s(c
uri
ous)
,an
dV
alu
es(u
nco
nve
n-
tion
al)
Sen
sory
sen
siti
vit
y,P
leasu
rein
low
-inte
nsi
tyac
tivit
ies,
Cu
riosi
ty
Extr
aver
sion
“an
orie
nta
tion
ofon
e’s
inte
rest
san
den
ergi
esto
-w
ard
the
ou
ter
wor
ldof
peo
ple
and
thin
gsra
ther
than
the
inn
erw
orld
ofsu
bje
ctiv
eex
per
ien
ce;
char
acte
rize
dby
pos
itiv
eaff
ect
and
soci
abilit
y”
War
mth
(fri
end
ly),
Gre
gari
ous-
nes
s(s
oci
able
),A
sser
tive
nes
s(s
elf-
con
fid
ent)
,A
ctiv
ity
(en
-er
geti
c),
Exci
tem
ent
seek
ing
(ad
ventu
rou
s),
and
Pos
itiv
eem
otio
ns
(enth
usi
asti
c)
Su
rgen
cy,
Soci
ald
omin
an
ce,
So-
cial
vit
alit
y,Sen
sati
on
seek
-in
g,S
hyn
ess*
,A
ctiv
ity*,
Posi
-ti
veem
otio
nal
ity,
and
Soci
ab
il-
ity/a
ffili
atio
n
Agr
eeab
len
ess
“th
ete
nd
ency
toac
tin
aco
op
erati
ve,
un
selfi
shm
ann
er”
Tru
st(f
orgi
vin
g),
Str
aigh
t-fo
rwar
dn
ess
(not
dem
and
ing)
,A
ltru
ism
(war
m),
Com
pli
-an
ce(n
otst
ub
bor
n),
Mod
esty
(not
show
-off
),an
dT
end
er-
min
ded
nes
s(s
ym
pat
het
ic)
Em
pat
hy,
Per
spec
tive
takin
g,C
oop
erat
ion
,an
dC
omp
etit
iven
ess
Irri
tab
ilit
y∗ ,
Agg
ress
iven
ess,
an
dW
illf
uln
ess
Neu
roti
cism
/E
mot
ion
alS
tab
ilit
y
Em
otio
nal
Sta
bil
ity
is“p
red
icta
bil
ity
and
con
-si
sten
cyin
emot
ion
alre
-ac
tion
s,w
ith
abse
nce
ofra
pid
mood
chan
ges
.”N
euro
tici
smis
“ach
ronic
leve
lof
emot
ion
alin
sta-
bil
ity
an
dp
ron
enes
sto
psy
chol
ogic
al
dis
tres
s.”
An
xie
ty(w
orry
ing)
,H
osti
lity
(ir-
rita
ble
),D
epre
ssio
n(n
otco
n-
tente
d),
Sel
f-co
nsc
iou
snes
s(s
hy),
Imp
uls
iven
ess
(moody),
Vu
lner
a-b
ilit
yto
stre
ss(n
otse
lf-c
onfi
den
t)
Inte
rnal
vs.
Exte
rnal
,L
ocu
sof
contr
ol,
Cor
ese
lf-e
valu
atio
n,
Sel
f-es
teem
,S
elf-
effica
cy,
Op
tim
ism
,an
dA
xis
Ip
sych
opat
hol
ogie
s(m
en-
tal
dis
ord
ers)
incl
ud
ing
dep
ress
ion
and
anxie
tyd
isor
der
s
Fea
rfu
lnes
s/b
ehav
iora
lin
hib
i-ti
on,
Shyn
ess∗
,Ir
rita
bil
ity∗ ,
Fru
stra
tion
(Lac
kof
)so
oth
ab
il-
ity,
Sad
nes
s
Not
es:
Fac
ets
spec
ified
by
the
NE
OP
I-R
per
son
alit
yin
vento
ry(C
osta
and
McC
rae,
1992
b).
Tra
itad
ject
ives
inp
aren
thes
esfr
omth
eA
dje
ctiv
eC
hec
kL
ist
(Gou
ghan
dH
eilb
run
,19
83).∗ T
hes
ete
mp
eram
ent
trai
tsm
ayb
ere
late
dto
two
Big
Fiv
efa
ctor
s.S
ourc
e:T
able
adap
ted
from
Joh
nan
dS
riva
stav
a(1
999)
.
13

2.3 Identification Problems in Measuring Traits
Measuring traits is difficult, because, as suggested by Roberts’ definition of personality, all
psychological measurements are calibrated on measured behavior, and the behaviors used
to measure one trait can be influenced by incentives and other traits. To infer traits from
behaviors requires standardizing for all of the other contributing factors that produce the
observed behavior. The inability to parse and localize behaviors that depend on a single
trait or ability gives rise to a fundamental identification problem that is typically ignored in
empirical research investigating how psychological traits affect outcomes.31
There are two primary issues. First, behavior depends on incentives created in situations.
Different incentives elicit different amounts of effort on the tasks used to measure traits.
Accurately measuring personality traits requires standardizing for the effort applied in any
task. Second, behavior in one task can depend on multiple traits. Not standardizing for
incentives and other traits can produce misleading estimates of any trait.
These identification problems are empirically important when measuring any given trait.
For example, incentives partly determine scores on IQ tests, even though some have argued
that performance on IQ tests reflects maximal effort.32 A series of studies conducted over
the past 40 years shows that incentives, like money or candy, can increase IQ scores, partic-
ularly among low-IQ individuals. The Black-White gap in IQ can be completely eliminated
by incentivizing students with M&M candies.33 The incentives in one test do not affect
performance on future tests.
The recent literature shows that personality traits are associated with standardized
achievement test scores, which many analysts use interchangeably with IQ scores.34 Figures
1 and 2 show how the variance in the scores on two achievement tests, the Armed Forces
31See Borghans et al. (2011a) and Almlund et al. (2011).32A leading psychometrician, Carroll (1993), does not accept the notion that IQ captures maximal effort.33See Ayllon and Kelly (1972); Borghans et al. (2008b); Breuning and Zella (1978); Clingman and Fowler
(1976); Edlund (1972); Holt and Hobbs (1979); Larson et al. (1994); Segal (2008). This evidence is summa-rized in Borghans et al. (2008a) and Almlund et al. (2011).
34See, e.g., Nisbett (2009).
14
Qualification Test (AFQT) and the closely related Differential Aptitudes Tests (DAT),35
are decomposed into IQ and personality measures. Personality traits explain a substantial
portion of the variances in both AFQT scores and DAT scores.36 The personality traits are
incrementally valid in that they explain the variance above and beyond the variance that IQ
explains in a regression. These findings caution the interpretation that standardized achieve-
ment tests only measure cognitive ability. They are bundled with personality traits. In data
from the Stella Maris secondary school in Maastricht, Holland, Openness to Experience is
strongly correlated with IQ.37
Further complicating identification, not everyone responds to incentives in the same way.
Borghans et al. (2008b) show that adults spend substantially more time answering questions
on IQ tests when rewards are higher. Subjects high in Emotional Stability and Conscien-
tiousness are less affected by rewards. Similarly, Segal (2008) shows that introducing cash
incentives for performance on the coding speed test of the Armed Services Vocational Bat-
tery (ASVAB) increases performance substantially, particularly for men with lower levels of
Conscientiousness.
2.4 Are There Stable Personality Traits?
Many have questioned whether personality traits exist. The publication of Walter Mischel’s
1968 book, Personality and Assessment, gave rise to a heated “personality-situation” debate
within psychology, which pitted the social psychologists who favored situational factors as
explaining behavior against those who considered stable personality traits as more conse-
quential. Mischel argued that aspects of situations overshadow any effect of personality on
35The correlation between DAT and AFQT scores in the National Longitudinal Study of Youth 1979(NLSY79) is 0.76 to 0.80 (Borghans et al., 2011b). Friedman and Streicher (1985) estimate correlationsbetween 0.65 and 0.82 for in a sample of high school sophomores and juniors. Kettner (1976) estimatescorrelations between DAT and the AFQT subtests of 0.76 to 0.89 in a sample of juniors and seniors.
36The lower explained variance in the sample with DAT is likely a consequence of restriction on range.The DAT data come from a single school, whereas the AFQT data come from a national sample.
37See Borghans et al. (2011b) for information on the Stella Marris secondary school and the analysisdescribed in the text.
15

Figure 1: Decomposing Achievement Tests and Grades into IQ and Personality [NLSY79]
0.48
0.23
0.43
0.190.16
0.10
0.00
0.10
0.20
0.30
0.40
0.50
0.60R-
Squa
red
IQ, Rosenberg, and Rotter IQ Rosenberg and Rotter
AFQT Grades
Achievement Grades
Source: Borghans et al. (2011a), National Longitudinal Survey of Youth 1979 (NLSY79). Notes: Rotter is a measure of locusof control designed to measure the extent to which individuals believe that they have control over their lives through self-motivation or self-determination as opposed to the extent to which individuals believe that the environment controls their lives(Rotter, 1966). Rosenberg is a measure of self-esteem designed to measure the degree of approval or disapproval toward oneself(Rosenberg, 1965). The Armed Forces Qualification Test (AFQT) score is constructed from the Arithmetic Reasoning, WordKnowledge, Mathematical Knowledge, and Paragraph Comprehension Armed Services Vocational Aptitude Battery (ASVAB)subtests. Rotter was administered in 1979. The ASVAB and Rosenberg were administered in 1980. IQ and GPA are fromhigh school transcript data. AFQT, Rosenberg, and Rotter have been adjusted for schooling at the time of the test conditionalon final schooling, as described in Hansen et al. (2004). IQ is pooled across several IQ tests using IQ percentiles. GPA is theindividual’s core subject GPA from 9th grade. Sample excludes the military over-sample.
behavior.38
A large body of evidence reviewed in Almlund et al. (2011) shows that stable personality
traits exist and are predictive of many behaviors.39 An important paper by Epstein (1979)
presents compelling evidence that, averaging over tasks and situations at a point in time,
people act in a predictable fashion with a high level of reliability (R2 of 0.6-0.8) of average
behavior (“measured personality”) across situations. The incentives in any situation also
matter. Heritability studies show that measures of personality traits tend to be about 40%-
60% heritable, suggesting that something tied to the person, rather than the situation,
influences behavior (Bouchard and Loehlin, 2001).40 Evidence in neuroscience suggests that
38This theme has been picked up in behavioral economics. See Thaler (2008).39See the special issue of Journal of Research in Personality (43), entitled “Personality and Assessment
at Age 40 ” for a recent discussion.40Devlin et al. (1997) suggest that traditional estimates of the heritability of IQ may be inflated because
16
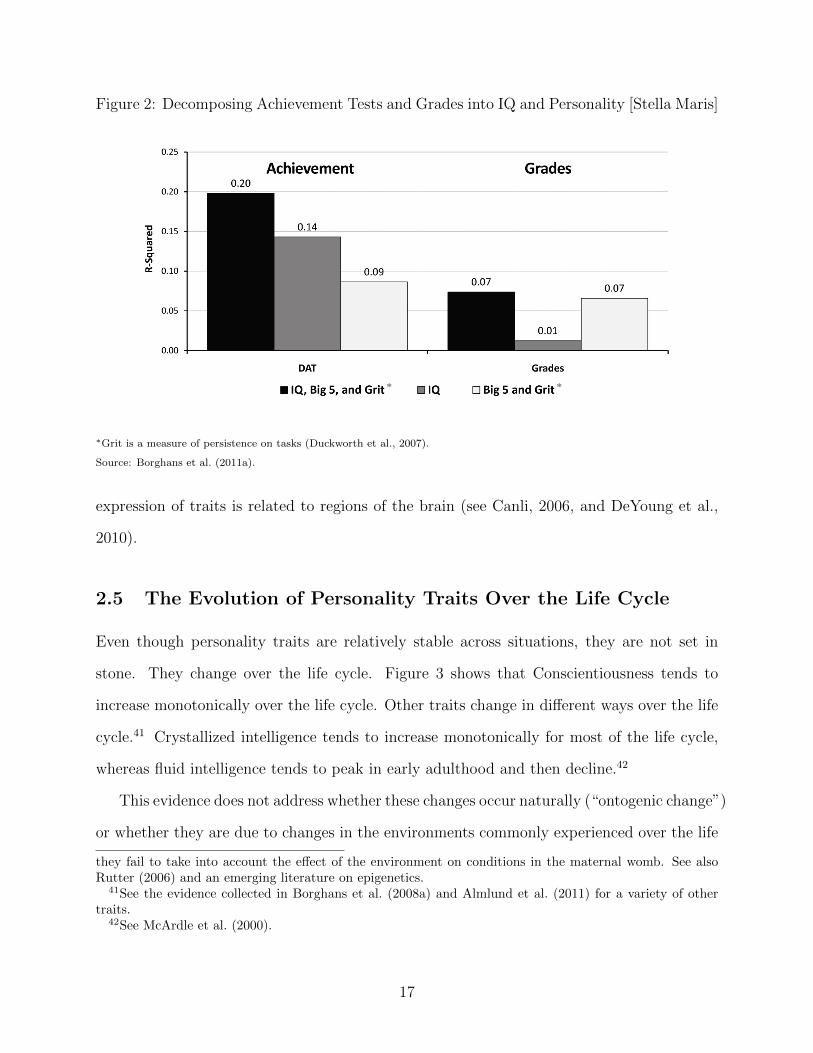
Figure 2: Decomposing Achievement Tests and Grades into IQ and Personality [Stella Maris]
∗Grit is a measure of persistence on tasks (Duckworth et al., 2007).
Source: Borghans et al. (2011a).
expression of traits is related to regions of the brain (see Canli, 2006, and DeYoung et al.,
2010).
2.5 The Evolution of Personality Traits Over the Life Cycle
Even though personality traits are relatively stable across situations, they are not set in
stone. They change over the life cycle. Figure 3 shows that Conscientiousness tends to
increase monotonically over the life cycle. Other traits change in different ways over the life
cycle.41 Crystallized intelligence tends to increase monotonically for most of the life cycle,
whereas fluid intelligence tends to peak in early adulthood and then decline.42
This evidence does not address whether these changes occur naturally (“ontogenic change”)
or whether they are due to changes in the environments commonly experienced over the life
they fail to take into account the effect of the environment on conditions in the maternal womb. See alsoRutter (2006) and an emerging literature on epigenetics.
41See the evidence collected in Borghans et al. (2008a) and Almlund et al. (2011) for a variety of othertraits.
42See McArdle et al. (2000).
17
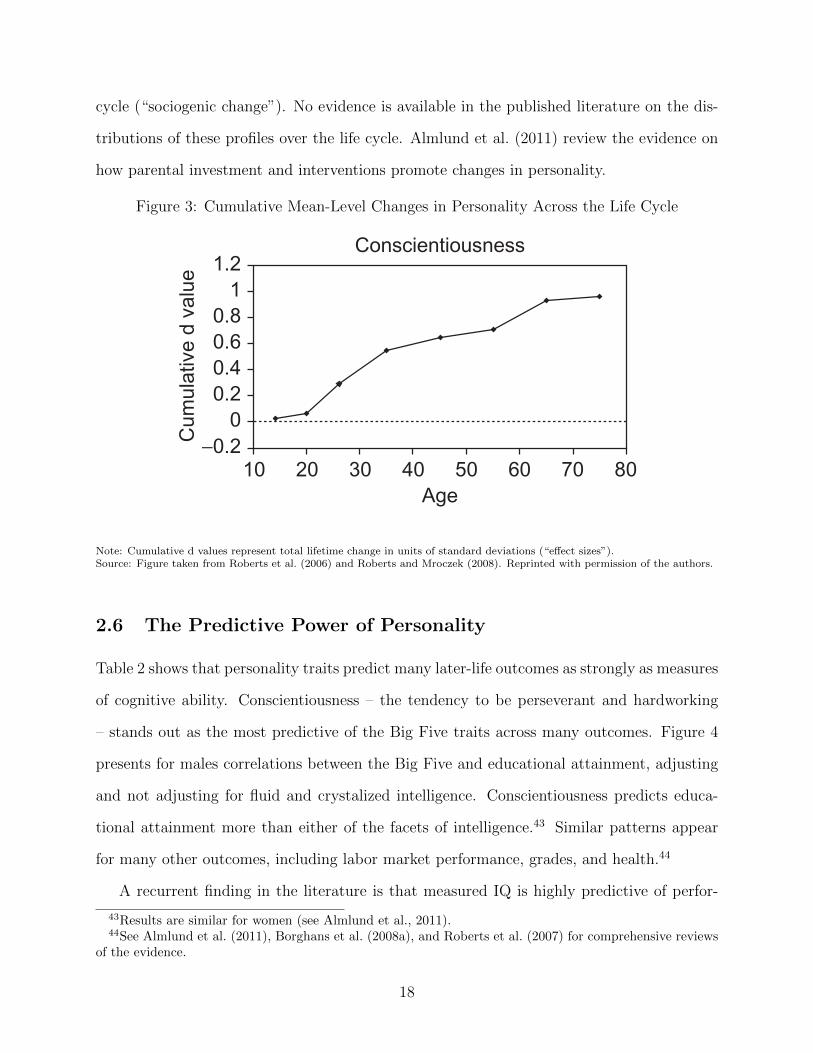
cycle (“sociogenic change”). No evidence is available in the published literature on the dis-
tributions of these profiles over the life cycle. Almlund et al. (2011) review the evidence on
how parental investment and interventions promote changes in personality.
Figure 3: Cumulative Mean-Level Changes in Personality Across the Life Cycle
−0.20
0.20.40.60.8
11.2
Cum
ulat
ive
d va
lue
Conscientiousness
Age10 20 30 40 50 60 70 80
Note: Cumulative d values represent total lifetime change in units of standard deviations (“effect sizes”).Source: Figure taken from Roberts et al. (2006) and Roberts and Mroczek (2008). Reprinted with permission of the authors.
2.6 The Predictive Power of Personality
Table 2 shows that personality traits predict many later-life outcomes as strongly as measures
of cognitive ability. Conscientiousness – the tendency to be perseverant and hardworking
– stands out as the most predictive of the Big Five traits across many outcomes. Figure 4
presents for males correlations between the Big Five and educational attainment, adjusting
and not adjusting for fluid and crystalized intelligence. Conscientiousness predicts educa-
tional attainment more than either of the facets of intelligence.43 Similar patterns appear
for many other outcomes, including labor market performance, grades, and health.44
A recurrent finding in the literature is that measured IQ is highly predictive of perfor-
43Results are similar for women (see Almlund et al., 2011).44See Almlund et al. (2011), Borghans et al. (2008a), and Roberts et al. (2007) for comprehensive reviews
of the evidence.
18
mance on complex tasks and jobs (Gottfredson, 1997). The importance of IQ increases with
job complexity, defined as the information processing requirements of the job: cognitive skills
are more important for professors, scientists, and senior managers than for semi-skilled or
unskilled laborers (Schmidt and Hunter, 2004). In contrast, the importance of Conscien-
tiousness does not vary much with job complexity (Barrick and Mount, 1991), suggesting
that it pertains to a wider spectrum of jobs.
The literature in economics establishes that the same bundle of traits has different pro-
ductivity in different tasks. People also differ in their endowments of traits. These two
features lead to sorting in the tasks people pursue in life and are a manifestation of the
general principle of comparative advantage in the labor market and in life. (See Almlund
et al., 2011; Borghans et al., 2008a; Cattan, 2012; Heckman et al., 2006a, 2011b.)
Achievement test scores are crude, low-dimensional summaries of high-dimensional vec-
tors of traits that operate in conjunction with effort. It is unlikely that these summaries
capture the precise combinations of traits required for success in specific life tasks. The
thrust of recent research in personality and economics is to isolate the traits that determine
life outcomes and to understand how those diverse traits determine choices of tasks.
Most of the evidence in personality psychology is correlational. The reported correla-
tions do not prove that personality traits cause higher educational attainment although it is
consistent with it. For example, the reported pattern in Figure 4 could arise if educational
attainment increased Conscientiousness. We next present causal evidence.
19

Figure 4: Association of the Big Five and intelligence with years of completed schooling
-0.1 -0.05 0 0.05 0.1 0.15 0.2 0.25 0.3 0.35
Crystalized Intelligence
Fluid Intelligence
Openness
Conscientiousness
Extraversion
Agreeableness
Emotional Stability
Standardized Regression Coefficient
Males
Unadjusted for Intelligence Adjusted for Intelligence
Notes: The figure displays standardized regression coefficients from a multivariate regression of years of school attended on theBig Five and intelligence, controlling for age and age squared. The bars represent standard errors. The Big Five coefficients arecorrected for attenuation bias. The Big Five were measured in 2005. Years of schooling were measured in 2008. Intelligence wasmeasured in 2006. The measures of intelligence were based on components of the Wechsler Adult Intelligence Scale (WAIS).The data is a representative sample of German adults between the ages 21 and 94.Source: Almlund et al. (2011), German Socio-Economic Panel (GSOEP), waves 2004-2008.
3 Causal Evidence
3.1 Problems with Establishing Causality
Most studies in personality psychology do not address the question of causality, i.e., whether
measured traits cause (rather than just predict) outcomes. Empirical associations are not
a reliable basis for policy analysis. In this section, we discuss difficulties in establishing
causality. We also summarize several studies that provide evidence that personality traits
cause outcomes.
We introduce a simple framework to analyze the effect of traits on outcomes and how
traits evolve over time.45 Equation (1) shows how an outcome at age a, Ta, which is the
45This framework draws on Almlund et al. (2011).
20
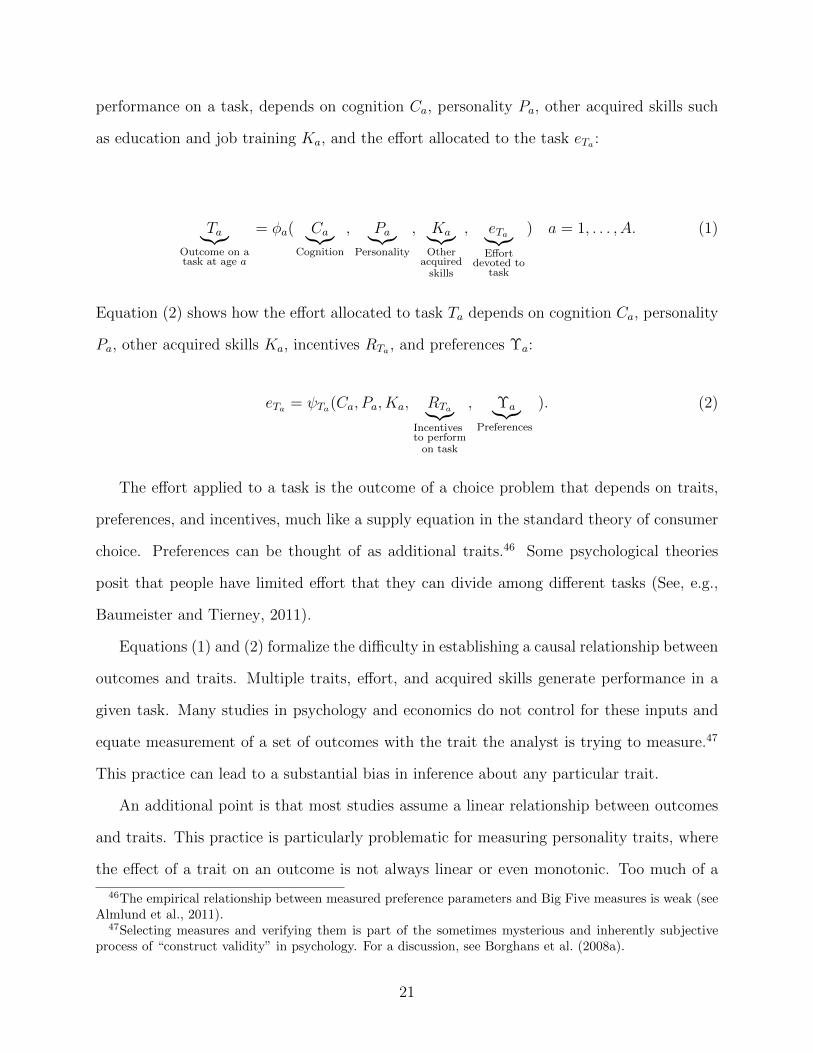
performance on a task, depends on cognition Ca, personality Pa, other acquired skills such
as education and job training Ka, and the effort allocated to the task eTa :
Ta︸︷︷︸Outcome on atask at age a
= φa( Ca︸︷︷︸Cognition
, Pa︸︷︷︸Personality
, Ka︸︷︷︸Other
acquiredskills
, eTa︸︷︷︸Effort
devoted totask
) a = 1, . . . , A. (1)
Equation (2) shows how the effort allocated to task Ta depends on cognition Ca, personality
Pa, other acquired skills Ka, incentives RTa , and preferences Υa:
eTa = ψTa(Ca, Pa, Ka, RTa︸︷︷︸Incentivesto perform
on task
, Υa︸︷︷︸Preferences
). (2)
The effort applied to a task is the outcome of a choice problem that depends on traits,
preferences, and incentives, much like a supply equation in the standard theory of consumer
choice. Preferences can be thought of as additional traits.46 Some psychological theories
posit that people have limited effort that they can divide among different tasks (See, e.g.,
Baumeister and Tierney, 2011).
Equations (1) and (2) formalize the difficulty in establishing a causal relationship between
outcomes and traits. Multiple traits, effort, and acquired skills generate performance in a
given task. Many studies in psychology and economics do not control for these inputs and
equate measurement of a set of outcomes with the trait the analyst is trying to measure.47
This practice can lead to a substantial bias in inference about any particular trait.
An additional point is that most studies assume a linear relationship between outcomes
and traits. This practice is particularly problematic for measuring personality traits, where
the effect of a trait on an outcome is not always linear or even monotonic. Too much of a
46The empirical relationship between measured preference parameters and Big Five measures is weak (seeAlmlund et al., 2011).
47Selecting measures and verifying them is part of the sometimes mysterious and inherently subjectiveprocess of “construct validity” in psychology. For a discussion, see Borghans et al. (2008a).
21
good thing can be bad(∂φa∂Pa
< 0 for Pa > P for threshold P)
. For example, extreme levels of
traits are associated with psychopathologies. High levels of Conscientiousness are associated
with Obsessive Compulsive Disorder, which hinders task performance (Samuel and Widiger,
2008). Nonlinearities can also arise when traits and incentives interact, as in the analyses
of Borghans et al. (2008b) and Segal (2008) who show that people with different personality
traits respond differently to incentives on tests.48
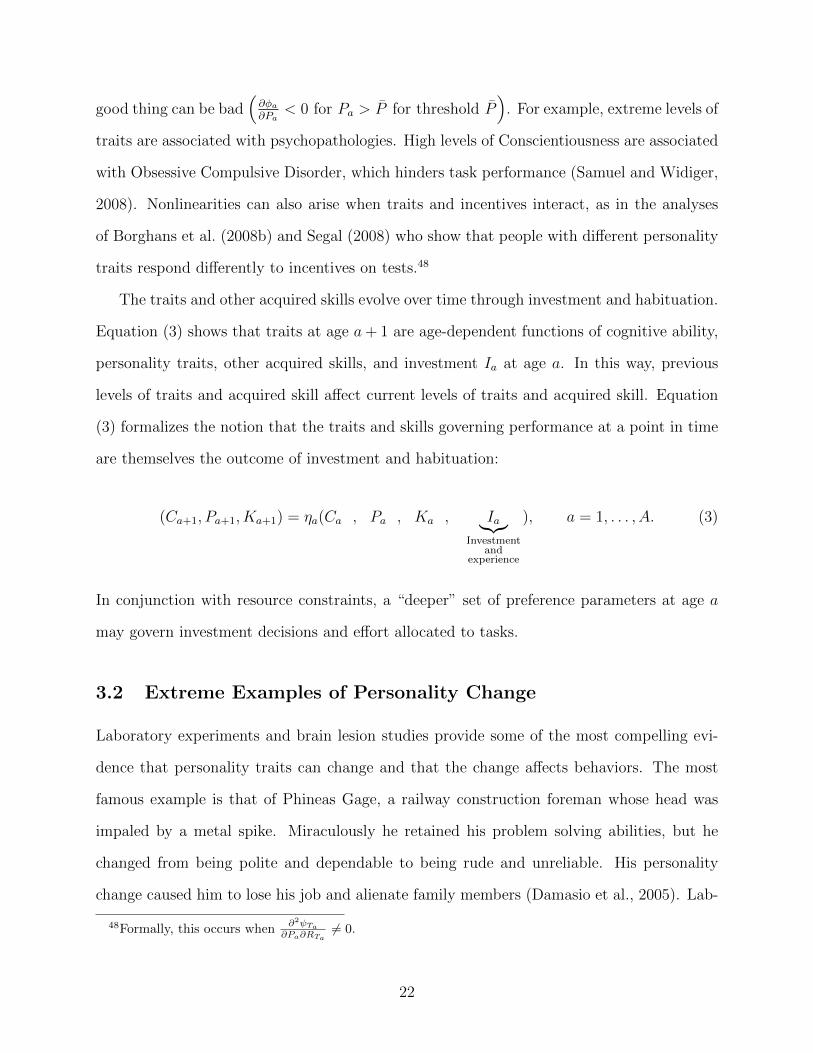
The traits and other acquired skills evolve over time through investment and habituation.
Equation (3) shows that traits at age a+ 1 are age-dependent functions of cognitive ability,
personality traits, other acquired skills, and investment Ia at age a. In this way, previous
levels of traits and acquired skill affect current levels of traits and acquired skill. Equation
(3) formalizes the notion that the traits and skills governing performance at a point in time
are themselves the outcome of investment and habituation:
(Ca+1, Pa+1, Ka+1) = ηa(Ca , Pa , Ka , Ia︸︷︷︸Investment
andexperience
), a = 1, . . . , A. (3)
In conjunction with resource constraints, a “deeper” set of preference parameters at age a
may govern investment decisions and effort allocated to tasks.
3.2 Extreme Examples of Personality Change
Laboratory experiments and brain lesion studies provide some of the most compelling evi-
dence that personality traits can change and that the change affects behaviors. The most
famous example is that of Phineas Gage, a railway construction foreman whose head was
impaled by a metal spike. Miraculously he retained his problem solving abilities, but he
changed from being polite and dependable to being rude and unreliable. His personality
change caused him to lose his job and alienate family members (Damasio et al., 2005). Lab-
48Formally, this occurs when∂2ψTa
∂Pa∂RTa6= 0.
22
oratory experiments show that expressed traits can be manipulated temporarily. Magnetic
disruption of the left lateral prefrontal cortex can increase experimentally elicited discount
rates (Figner et al., 2010) and nasal sprays of oxytocin increase trust (Kosfeld et al., 2005).
3.3 Evidence from the GED Testing Program
The GED is a standardized achievement test that serves as an alternative to a high school
diploma. High school dropouts can take the seven-and-a-half hour GED exam to certify
that they have the “general knowledge” of a high school graduate. The test is widely used.
The GED testing program currently produces 12% of high school certificates each year in
the United States. We draw on the analysis of Heckman et al. (2012a) and first present
results for males. The GED program provides insight into the effects of personality traits
on outcomes. GED recipients have the same cognitive ability as high school graduates, but
differ in their personality traits.
Table 4 shows the correlations between GED test scores and other achievement test scores.
GED test scores are strongly correlated with scores on other standardized achievement tests.
The correlations range from 0.61 with the General Aptitude Test Battery (GATB) to 0.88
with the Iowa Test of Educational Development, the progenitor of the GED.
23

Table 4: Validities of GED Test
Test Correlation Source(s)
Armed Forces Qualification Test (AFQT) 0.75 - 0.79 † Means and Laurence (1984)
Iowa Test of Educational Development 0.88 † Means and Laurence (1984)
ACT 0.80 † Means and Laurence (1984)
Adult Performance Level (APL) Survey 0.81 † Means and Laurence (1984)
New York’s Degrees of Reading Power (DRP) Test 0.77 † Means and Laurence (1984)
Test of Adult Basic Education (TABE) 0.66-0.68† Means and Laurence (1984)
General Aptitude Test Battery (GATB) 0.61-0.67† Means and Laurence (1984)
National Adult Literacy Survey (NALS) factor 0.78 ‡ Baldwin (1995)
† Uses mean GED subtest scores‡ Uses a general GED factor
GED recipients are smarter than other dropouts. Figure 5 shows the distributions of a fac-
tor extracted from the components of the ASVAB for male high school dropouts, GED recip-
ients, and high school graduates.49 The sample excludes people who attend post-secondary
education. The distribution of the scores of GED recipients is much more like that of high
school graduates than that of high school dropouts.
49Similar results are found for females.
24

Figure 5: Cognitive ability by educational status
Source: Reproduced from Heckman et al. (2011b), which uses data from the National Longitudinal Study of Youth 1979(NLSY79). Notes: The distributions above represent cognitive ability factors estimated using a subset of the Armed ServicesVocational Aptitude Battery (ASVAB) and educational attainment as laid out in Hansen et al. (2004). The sample is restrictedto the cross-sectional subsample for both males and females. Distributions show only those with no post-secondary educationalattainment. The cognitive ability factors are normalized by gender to be mean zero standard deviation one.
If they have the same cognitive ability as high school graduates, then why do they drop
out of high school? Success in school requires other traits. On a variety of other dimensions,
GED recipients behave much more like other dropouts. Figure 6 shows measures of early
adolescent drug use, crime, sex, and violence extracted from three data sources.50 Male
high school graduates perform better on all measures than high school dropouts or GED
recipients. GED recipients are much more similar to dropouts, but in several cases are
statistically significantly more likely to engage in risky behaviors than other dropouts. On
no outcome measure in that figure are dropouts statistically significantly more likely to
engage in risky behaviors compared to GED recipients. Figure 7 summarizes these adolescent
behaviors using a single factor and shows that unlike the cognitive summary measures, the
distribution of the noncognitive (personality) summary measure of GED recipients is much
closer to that of dropouts than to that of high school graduates.
50The data sets are the National Longitudinal Survey of Youth 1979 (NLSY79), National LongitudinalSurvey of Youth 1997 (NLSY97), and National Educational Longitudinal Survey (NELS). For discussion ofthese data sets, see Heckman et al. (2012a).
25
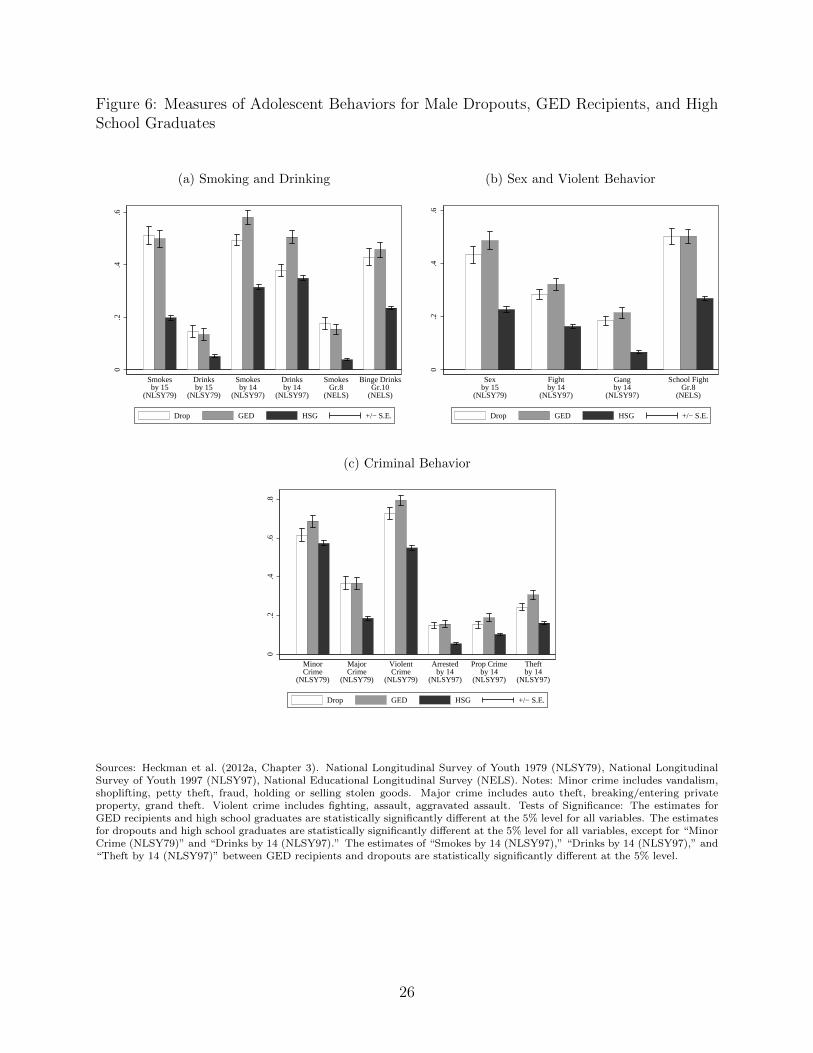
Figure 6: Measures of Adolescent Behaviors for Male Dropouts, GED Recipients, and HighSchool Graduates
(a) Smoking and Drinking
0.2
.4.6
Smokesby 15
(NLSY79)
Drinksby 15
(NLSY79)
Smokesby 14
(NLSY97)
Drinksby 14
(NLSY97)
SmokesGr.8
(NELS)
Binge DrinksGr.10
(NELS)
Drop GED HSG +/− S.E.
(b) Sex and Violent Behavior
0.2
.4.6
Sexby 15
(NLSY79)
Fightby 14
(NLSY97)
Gangby 14
(NLSY97)
School FightGr.8
(NELS)
Drop GED HSG +/− S.E.
(c) Criminal Behavior
0.2
.4.6
.8
MinorCrime
(NLSY79)
MajorCrime
(NLSY79)
ViolentCrime
(NLSY79)
Arrestedby 14
(NLSY97)
Prop Crimeby 14
(NLSY97)
Theftby 14
(NLSY97)
Drop GED HSG +/− S.E.
Sources: Heckman et al. (2012a, Chapter 3). National Longitudinal Survey of Youth 1979 (NLSY79), National LongitudinalSurvey of Youth 1997 (NLSY97), National Educational Longitudinal Survey (NELS). Notes: Minor crime includes vandalism,shoplifting, petty theft, fraud, holding or selling stolen goods. Major crime includes auto theft, breaking/entering privateproperty, grand theft. Violent crime includes fighting, assault, aggravated assault. Tests of Significance: The estimates forGED recipients and high school graduates are statistically significantly different at the 5% level for all variables. The estimatesfor dropouts and high school graduates are statistically significantly different at the 5% level for all variables, except for “MinorCrime (NLSY79)” and “Drinks by 14 (NLSY97).” The estimates of “Smokes by 14 (NLSY97),” “Drinks by 14 (NLSY97),” and“Theft by 14 (NLSY97)” between GED recipients and dropouts are statistically significantly different at the 5% level.
26

Figure 7: Distribution of a Summary Measure of Noncognitive Ability by Education Group
Source: Reproduced from Heckman et al. (2011b), which uses data from the National Longitudinal Study of Youth 1979(NLSY79). Notes: The distributions above represent noncognitive ability factors estimated using measures of early violentcrime, minor crime, marijuana use, regular smoking, drinking, early sexual intercourse, and educational attainment as inHansen et al. (2004). Sample restricted to the cross-sectional subsample for both males and females. Distributions show onlythose with no post-secondary educational attainment. The noncognitive ability factors normalized to be mean zero standarddeviation one.
The traits that cause GED recipients to drop out of high school manifest themselves
in many other life outcomes. One potential benefit of the GED certificate is that it opens
doors to post-secondary education. Figure 8 shows post-secondary educational attainment
for GED recipients and high school graduates. About 40% of GED recipients enroll in a 2-
or 4- year college. Nearly half drop out within the first year. Fewer than 5% earn a B.A.
degree and fewer than 10% earn an A.A. degree.
27

Figure 8: Post-Secondary Educational Attainment Across Education Groups Through Age40 - Males
0.2
.4.6
.8
Prop
ortio
n
SomeColl
Some Coll, MoreThan 1 Year
A.A. B.A.
GED HSG S.E.
Sources: Heckman et al. (2012a, Chapter 4). National Longitudinal Survey of Youth 1979 (NLSY79). Notes: The graph showspost-secondary educational attainment of GED recipients and high school graduates. Variable Definitions: “Some College”represents people who entered any post-secondary institution ever. “Some College, More Than a Year” represents people whocompleted at least a year of some post-secondary education ever. “A.A.” represents people who obtained associate’s degreesever. “B.A.” represents people who obtained bachelor’s degrees ever. “B.A.” also includes people with higher education:M.A. Ph.D and professional degrees. Tests of Significance: The estimates for GED recipients and high school graduates arestatistically significantly different at the 5% level for all but attainment of the A.A. degree.
GED recipients lack persistence in a variety of tasks in life. Figure 9 shows the survival
rates in employment, marriage, and in the condition of not having been incarcerated. GED
recipients tend to exit employment, become divorced, and enter jail at rates similar to those
of high school dropouts, while high school graduates are much more persistent.
28
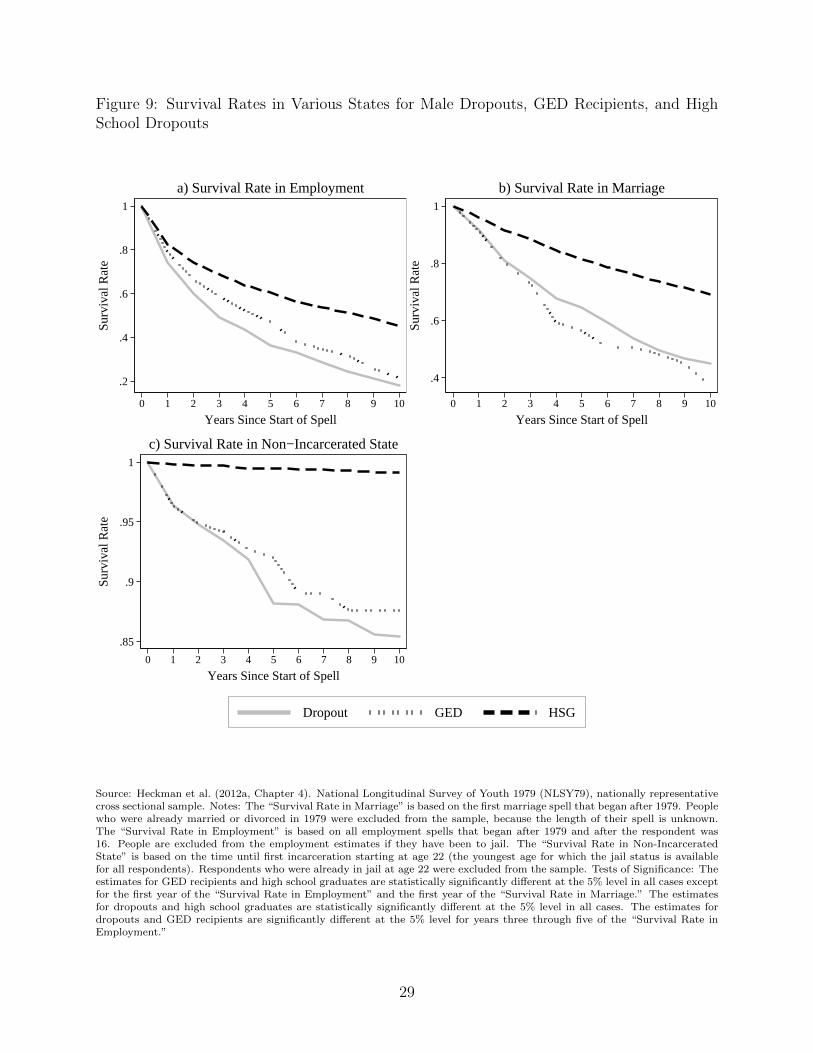
Figure 9: Survival Rates in Various States for Male Dropouts, GED Recipients, and HighSchool Dropouts
.2
.4
.6
.8
1
Sur
viva
l Rat
e
0 1 2 3 4 5 6 7 8 9 10
Years Since Start of Spell
a) Survival Rate in Employment
.4
.6
.8
1
Sur
viva
l Rat
e0 1 2 3 4 5 6 7 8 9 10
Years Since Start of Spell
b) Survival Rate in Marriage
.85
.9
.95
1
Sur
viva
l Rat
e
0 1 2 3 4 5 6 7 8 9 10
Years Since Start of Spell
c) Survival Rate in Non−Incarcerated State
Dropout GED HSG
Source: Heckman et al. (2012a, Chapter 4). National Longitudinal Survey of Youth 1979 (NLSY79), nationally representativecross sectional sample. Notes: The “Survival Rate in Marriage” is based on the first marriage spell that began after 1979. Peoplewho were already married or divorced in 1979 were excluded from the sample, because the length of their spell is unknown.The “Survival Rate in Employment” is based on all employment spells that began after 1979 and after the respondent was16. People are excluded from the employment estimates if they have been to jail. The “Survival Rate in Non-IncarceratedState” is based on the time until first incarceration starting at age 22 (the youngest age for which the jail status is availablefor all respondents). Respondents who were already in jail at age 22 were excluded from the sample. Tests of Significance: Theestimates for GED recipients and high school graduates are statistically significantly different at the 5% level in all cases exceptfor the first year of the “Survival Rate in Employment” and the first year of the “Survival Rate in Marriage.” The estimatesfor dropouts and high school graduates are statistically significantly different at the 5% level in all cases. The estimates fordropouts and GED recipients are significantly different at the 5% level for years three through five of the “Survival Rate inEmployment.”
29

Adjusting for their differences in cognitive ability, male GED recipients perform virtually
the same as high school dropouts in the labor market. Figure 10 shows the hourly wages
and annual earnings of male GED recipients and high school graduates compared to high
school dropouts for different age groups. The first set of bars shows the outcomes after
adjusting for age, race, year, and region of residence. The second set of bars shows the
effects after additionally adjusting for AFQT scores. The third set of bars shows the effects
after additionally adjusting for standard measures of family background. GED recipients
and high school graduates outperform dropouts in regressions that only adjust for age, race,
year, and region of residence. After adjusting for cognitive ability, GED recipients are
indistinguishable from dropouts, whereas high school graduates earn more and have higher
hourly wages. Controlling for family background characteristics does not change the story.
30

Figure 10: Labor Market Outcomes Differences - By Age - NLSY79 - Males
(a) Annual Earnings
010
000
2000
030
000
Ann
ual E
arni
ngs
Age 20 to 24 Age 25 to 29 Age 30 to 34 Age 35 to 39Raw Abil BG Raw Abil BG Raw Abil BG Raw Abil BG
GED HSG S.E.
(b) Hourly Wage
−5
05
10
Hou
rly W
age
Age 20 to 24 Age 25 to 29 Age 30 to 34 Age 35 to 39Raw Abil BG Raw Abil BG Raw Abil BG Raw Abil BG
GED HSG S.E.
Source: Heckman et al. (2012a, Chapter 3). National Longitudinal Survey of Youth 1979 (NLSY79). Controls: “Raw” – age,race, and region of residence; “Abil” –age, race, year, region of residence, and Armed Forces Qualification Test (AFQT) adjustedfor schooling at time of test; “BG” – age, race, year, region of residence, mother’s highest grade completed, urban status at age14, family income in 1978, broken home status at age 14, south at age 14, AFQT, and factors based on adolescent behavioralmeasures, crime and school performance. Regressions exclude those reporting earning more than $300,000 or working morethan 4,000 hours. Notes: All regressions allow for heteroskedastic errors and when appropriate clustering at the individuallevel.
31

Most of the patterns found for women parallel those found for men. However, there
are some important differences.51 While female GED recipients share similar cognitive and
personality traits as male GED recipients, their outcomes differ. After accounting for differ-
ences in cognitive ability, female GED recipients do not earn higher hourly wages than other
dropouts, but unlike men they have higher annual earnings because they are more likely to
participate in the labor force.52
3.4 Evidence from The Perry Preschool Program and Other In-
terventions
Evidence from the Perry Preschool Program shows how personality traits can be changed in
ways that produce beneficial lifetime outcomes. The Perry preschool Program enriched the
lives of three- and four-year-old low-income, Black children with initial IQs below 85 at age
3.53
Participants were taught social skills in a “plan-do-review” sequence where students
planned a task, executed it, and then reviewed it with teachers and fellow students. They
learned to work with others when problems arose.54 In addition, home visits promoted
parent-child interactions. The program ended after two years of enrollment and both treat-
ments and controls entered the same school. The program was evaluated by the method of
random assignment.
The program did not improve IQ scores in a lasting way. Figure 11 shows that, by age
ten, treatment and control groups had the same average IQ scores. Many critics of early
childhood programs seize on this finding and related evidence to dismiss the value of early
51See Heckman et al. (2012a).52The increased labor supply response is largely due to female GED recipients who attain some post-
secondary education or who have dropped out of high school due to pregnancy. See Heckman et al. (2012a)for a full discussion of the evidence on the performance of GED recipients.
53We draw on the analysis of Heckman et al. (2012b).54Sylva (1997) describes the Perry program as a Vygotskian program fostering personality traits. Vygotsky
developed a psychology of child development in structured social settings that emphasized development ofsocial and personality skills. The Vygotskian approach strongly influences the Tools of the Mind program(see Bodrova and Leong, 2001, 2007).
32
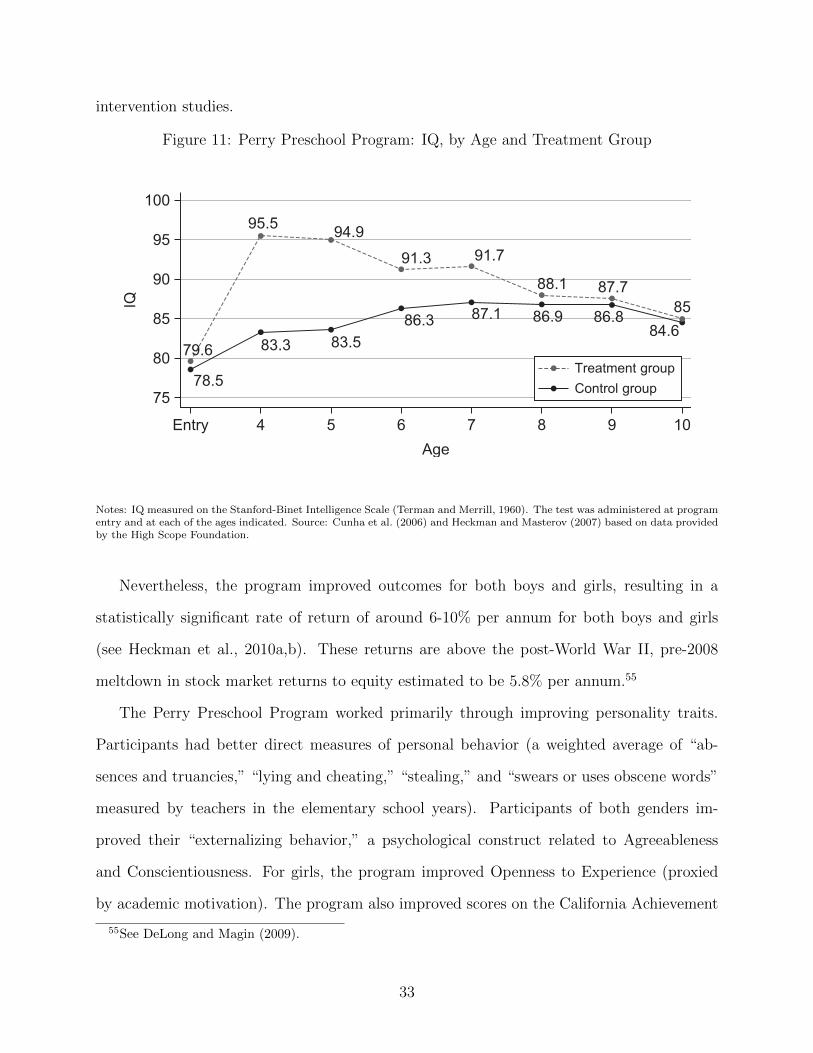
intervention studies.
Figure 11: Perry Preschool Program: IQ, by Age and Treatment Group
100
IQ
95
90
85
80
75
4Entry
78.5
83.3 83.5
86.3 87.1 86.9 86.884.6
8587.788.1
91.791.3
94.995.5
5 6
Age
Treatment group
Control group
7 8 9 10
79.6
Notes: IQ measured on the Stanford-Binet Intelligence Scale (Terman and Merrill, 1960). The test was administered at programentry and at each of the ages indicated. Source: Cunha et al. (2006) and Heckman and Masterov (2007) based on data providedby the High Scope Foundation.
Nevertheless, the program improved outcomes for both boys and girls, resulting in a
statistically significant rate of return of around 6-10% per annum for both boys and girls
(see Heckman et al., 2010a,b). These returns are above the post-World War II, pre-2008
meltdown in stock market returns to equity estimated to be 5.8% per annum.55
The Perry Preschool Program worked primarily through improving personality traits.
Participants had better direct measures of personal behavior (a weighted average of “ab-
sences and truancies,” “lying and cheating,” “stealing,” and “swears or uses obscene words”
measured by teachers in the elementary school years). Participants of both genders im-
proved their “externalizing behavior,” a psychological construct related to Agreeableness
and Conscientiousness. For girls, the program improved Openness to Experience (proxied
by academic motivation). The program also improved scores on the California Achievement
55See DeLong and Magin (2009).
33

Test (CAT). This evidence is consistent with the evidence presented in the previous section
that shows that performance on achievement tests depends on personality traits.
Other studies are broadly consistent with the evidence from the Perry Preschool study.
Analyses of data from Project STAR, a program that randomly assigned kindergartners and
teachers to classes of different sizes, yields results similar to the Perry Program. Using data
from Project STAR, Dee and West (2011) find that assignment to a small class is associated
with positive changes in personality. In a follow-up analysis, Chetty et al. (2011) examine
the Project STAR program and find that students placed in higher quality kindergarten
classes–as measured by their peer’s average performance on a Stanford Achievement Test–
had significantly higher earnings in early adulthood.
The curriculum of Promoting Alternative Thinking Strategies (PATHS) teaches self-
control, emotional awareness, and social problem-solving skills and is aimed at elementary
school children (see Bierman et al., 2010). A recent random-assignment, longitudinal study
demonstrates that the PATHS curriculum reduces teacher and peer ratings of aggression,
improves teacher and peer ratings of prosocial behavior, and improves teacher ratings of
academic engagement.56 PATHS is an exemplar of school-based social and emotional learning
(SEL) programs. A recent meta-analysis shows that the program improved grades by 0.33
standard deviations and achievement test scores by 0.27 standard deviations (Durlak et al.,
2011).57
Likewise, several random assignment evaluations of Tools of the Mind, a preschool and
early primary school curriculum targeting development of self-control, show that it improves
classroom behavior as well as executive function, defined as higher-level cognitive skills in-
cluding inhibitory control, working memory, and cognitive flexibility (Barnett et al., 2008,
2006; Bodrova and Leong, 2001, 2007; Diamond et al., 2007; Lillard and Else-Quest, 2006).58
56See Bierman et al. (2010).57Note, however, that the largest federal study to date on character education programs, including PATHS,
failed to find evidence for improvements in behavior or academic performance (see Social and CharacterDevelopment Research Consortium, 2010).
58However, a more recent large-scale study (Farran et al., 2011) does not find any effect of the programon self-regulation or literacy, language, and mathematics achievement.
34

Positive findings are reported for the Montessori preschool curriculum (Lillard and Else-
Quest, 2006). Unlike the Perry study, these studies do not have long-term followups.
There is evidence that targeted intervention efforts can improve aspects of Conscien-
tiousness. In contrast to the multi-faceted curricula described above, studies targeting im-
provement in this trait are designed to isolate a particular mechanism producing behavioral
change. For instance, Rueda et al. (2005) designed a set of computer exercises to train
attention in children between four and six years of age. Children in the intervention group
improved in performance on computer tasks of attention relative to children who instead
watched interactive videos for a comparable amount of time. Similarly, Stevens et al. (2008)
designed a 6-week computerized intervention and showed that it can improve selective au-
ditory attention (i.e., the ability to attend to a target auditory signal in the face of an
irrelevant, distracting auditory signal). As is typical of much of the literature, all of these
programs have only short-term follow-ups.
Several studies suggest that personality can be remediated in adolescence. Martins (2010)
analyzes data from EPSIS, a program developed to improve student achievement of 13-15
year-olds in Portugal by increasing motivation, self-esteem, and study skills. The program
consists of one-on-one meetings with a trained staff member or meetings in small groups. The
intervention was tailored to each participant’s individual skill deficit. Overall, the program
was successful and cost-effective, decreasing grade retention by 10 percentage points.
Other life experiences, like employment, can improve personality. Gottschalk (2005)
analyzes evidence from a randomized control trial that working at a job can improve locus
of control, a trait related to Neuroticism that measures the extent to which individuals
believe that they have control over their lives through self-motivation or self-determination
as opposed to the extent that the environment controls their lives (Rotter, 1966).59 He uses
data from the Self-Sufficiency Project (SSP) in which some welfare recipients were randomly
offered substantial subsidies to work. The subsidy more than doubled the earnings of a
59The relationship between locus of control and the Big Five trait of Neuroticism is discussed in Almlundet al. (2011).
35

minimum wage worker. People in the experimental group worked about 30% more hours
than those in the control group. After 36 months, those who received the subsidy were more
likely to have an improved locus of control.
3.5 Additional Evidence
Studies that account for the endogeneity of investment and education provide further ev-
idence of the causal effect of education and cognitive and personality traits on outcomes.
Heckman et al. (2011b) estimate a sequential model of education to study the effects of
education on a variety of outcomes. Correcting for selection into education, they find that
early cognitive and personality traits affect schooling choices, labor market outcomes, adult
health, and social outcomes and that increasing education promotes beneficial labor market,
health, and social outcomes.
Heckman et al. (2006b) estimate a version of Equation (3) to analyze the effects of
increases in education on measured cognition and personality measures.60 Controlling for
the problem of reverse causality that schooling may be caused by traits, they find that
schooling improves both personality and cognitive traits and that these traits, in turn, boost
outcomes.61
Cunha et al. (2010) estimate a model of the technology of skill formation using longitudi-
nal data on the development of children with rich measures of parental investment and child
traits. They control for the endogeneity of investment using shocks to family income along
with other instruments. Their model is a version of Equation (3). Traits are self-productive
and exhibit dynamic complementarity – current values of traits affect the evolution of future
traits through direct and cross effects. A leading example of a cross effect is that more
motivated children are more likely to learn. They estimate parameters that summarize how
60They estimate the effect of schooling on self-esteem and locus of control, personality traits related toNeuroticism. The Rosenberg Self-Esteem Scale attempts to assess the degree of approval or disapproval ofoneself (Rosenberg, 1965). The relationship between these measures and the Big Five traits of Neuroticismis discussed in Almlund et al. (2011).
61Both Heckman et al. (2011b) and Heckman et al. (2006b) use an identification strategy based on matchingon proxies for unobserved traits that corrects for measurement error and the endogeneity of schooling.
36

past personality traits affect future cognitive traits.
They find that self-productivity becomes stronger as children become older, for both
cognitive and personality traits. The elasticity of substitution for cognitive inputs is smaller
later in life. This means that it is more difficult to compensate for the effects of adverse
environments on cognitive endowments at later ages than it is at earlier ages. This finding
is consistent with the high rank stability of cognition over ages past 10-12 reported in the
literature. It also helps to explain the evidence on the ineffectiveness of cognitive remediation
strategies for disadvantaged adolescents documented in Cunha et al. (2006); Knudsen et al.
(2006) and Cunha and Heckman (2007).
Personality traits foster the development of cognition but not vice versa. It is equally
easy at all stages of the child’s life cycle to compensate for early disadvantage in endow-
ments using personality traits. (Elasticities of substitution for these traits are essentially the
same at different stages of the life cycle.) The most effective adolescent interventions target
personality traits.62
4 Summary
This paper reviews recent evidence on the importance of personality in economic and social
life. It shows that success in life depends on many traits, not just those measured by IQ,
grades, and standardized achievements tests. Personality traits predict and cause outcomes.
All psychological traits are measured by performance on tasks. Psychological traits have
different productivities in different tasks. Performance on tasks depends on incentives and
multiple traits, giving rise to a fundamental identification problem when measuring any single
trait. This identification problem is empirically important even for measures of cognitive
traits.
The importance of cognitive ability increases with the complexity of the task. Given their
62Cunha et al. (2006) report that 16% of the variation in educational attainment is explained by adolescentcognitive traits, 12% is due to adolescent personality (socioemotional traits), and 15% is due to measuredparental investments.
37
endowments of traits and the incentives they face, people sort into tasks in life in pursuit of
their comparative advantage.
Traits are stable across situations, but their manifestation depends on incentives to apply
effort in the situations where they are measured and also depends on other traits and skills.
However, traits are not set in stone. They change over the life cycle and can be enhanced
by education, parenting, and environment to different degrees at different ages.
Scores on achievement tests capture both cognitive and personality traits. Children who
are more academically motivated and more curious learn more and have higher test scores.
More motivated children also try harder on achievement tests.
The evidence in this paper should give pause to analysts and policy makers who rely
solely on achievement tests to monitor school performance and school systems. Standardized
achievement tests do not adequately capture many skills that matter in life. GED recipients
perform about as well as high school graduates on achievement tests but perform much
worse in many aspects of life because they lack important personality traits. Categorizing
GED recipients as high school graduates misrepresents national statistics on educational
attainment.63 The Perry Preschool Program improved the lives of its participants without
increasing their IQ scores, demonstrating why it is problematic to focus curricula exclusively
on improving cognitive test scores.
Monitoring school progress and creating programs to enhance skills requires a broader
framework of measurement. Interventions that promote beneficial changes in personality
have an important place in a portfolio of public policies to foster human development.
63See Heckman and LaFontaine (2010).
38
References
Ackerman, Phillip L., and Eric D. Heggestad. “Intelligence, personality, and interests: Evi-
dence for overlapping traits.” Psychological Bulletin 121: (1997) 219–245.
ACT, Inc. The ACT Technical Manual. Iowa City, IA: ACT, Inc., 2007.
Almlund, Mathilde, Angela Duckworth, James J. Heckman, and Tim Kautz. “Personality
Psychology and Economics.” In Handbook of the Economics of Education, edited by E. A.
Hanushek, S. Machin, and L. Woßmann, Amsterdam: Elsevier, 2011, volume 4, 1–181.
Ayllon, Teodoro, and Kathy Kelly. “Effects of reinforcement on standardized test perfor-
mance.” Journal of Applied Behavior Analysis 5, 4: (1972) 477–484.
Baldwin, Janet. Who Took the GED? GED 1994 Statistical Report. Washington, D.C.:
American Council on Education, GED Testing Service, Center for Adult Learning, 1995.
Barnett, W. Steven, Kwanghee Jung, Donald J. Yarosz, Jessica Thomas, Amy Hornbeck,
Robert Stechuk, and Susan Burns. “Educational Effects of the Tools of the Mind Curricu-
lum: A Randomized Trial.” Early Childhood Research Quarterly 23, 3: (2008) 299–313.
Barnett, W. Steven, Donald J. Yarosz, Jessica Thomas, and Amy Hornbeck. “Educational
effectiveness of a Vygotskian approach to preschool education: A randomized trial.” Tech-
nical report, National Institute for Early Education Research, Rutgers, The State Univer-
sity of New Jersey, 2006.
Barrick, Murray R., and Michael K. Mount. “The Big Five personality dimensions and job
performance: A meta-analysis.” Personnel Psychology 44, 1: (1991) 1–26.
Baumeister, Roy F., and John (John Marion) Tierney. Willpower : rediscovering the greatest
human strength. New York: Penguin Press, 2011.
39

Benjamin, Daniel J., Sebastian A. Brown, and Jesse M. Shapiro. “Who is ‘Behavioral’? Cog-
nitive Ability and Anomalous Preferences.” Unpublished manuscript, Cornell University,
Ithaca, NY, 2006.
Bierman, Karen L., John D. Coie, Kenneth A. Dodge, Mark T. Greenberg, John E. Lochman,
Robert J. McMahon, and Ellen Pinderhughes. “The effects of a multiyear universal social-
emotional learning program: The role of student and school characteristics.” Journal of
Consulting and Clinical Psychology 78, 2: (2010) 156–168.
Binet, Alfred, and Theodore Simon. The development of intelligence in children (The Binet-
Simon Scale). Psychological Science. Baltimore, MD: Williams & Wilkins Co, 1916.
Bodrova, Elena, and Deborah J. Leong. Tools of the Mind: A case study of implementing
the Vygotskian approach in American early childhood and primary classrooms. Geneva:
International Bureau of Education, UNESCO, 2001.
. Tools of the Mind: The Vygotskian Approach to Early Childhood Education. Upper
Saddle River: Pearson Education, Inc, 2007.
Borghans, Lex, Angela L. Duckworth, James J. Heckman, and Bas ter Weel. “The Economics
and Psychology of Personality Traits.” Journal of Human Resources 43, 4: (2008a) 972–
1059.
Borghans, Lex, Bart H. H. Golsteyn, James J. Heckman, and John Eric Humphries. “Identi-
fication Problems in Personality Psychology.” Personality and Individual Differences 51,
Special Issue on Personality and Economics: (2011a) 315–320. E. Ferguson, J.J. Heckman,
and P. Corr, editors.
. “Reinterpreting Estimated Effects of Cognition on Social Outcomes.” Unpublished
manuscript, Department of Economics, University of Chicago, 2011b.
40

Borghans, Lex, Huub Meijers, and Bas ter Weel. “The Role of Noncognitive Skills in Ex-
plaining Cognitive Test Scores.” Economic Inquiry 46, 1: (2008b) 2–12.
Bouchard, Thomas J., and John C. Loehlin. “Genes, Evolution and Personality.” Behavior
Genetics 31, 3: (2001) 243–273.
Bound, John, Charles Brown, and Nancy Mathiowetz. “Measurement Error in Survey Data.”
In Handbook of Econometrics, edited by James J. Heckman, and Edward Leamer, Ams-
terdam: Elsevier Science, 2001, volume 5 of Handbooks in Economics, 3705–3843.
Bowen, William G., Matthew M. Chingos, and Michael S. McPherson. “Test scores and high
school grades as predictors.” In Crossing the finish line: Completing college at America’s
public universities, Princeton, NJ: Princeton University Press, 2009, 112–133.
Bowles, Samuel, and Herbert Gintis. Schooling in Capitalist America: Educational Reform
and the Contradictions of Economic Life. New York: Basic Books, 1976.
Bowles, Samuel, Herbert Gintis, and Melissa Osborne. “The Determinants of Earnings: A
Behavioral Approach.” Journal of Economic Literature 39, 4: (2001) 1137–1176.
Breuning, Stephen E., and William F. Zella. “Effects of individualized incentives on norm-
referenced IQ test performance of high school students in special education classes.” Jour-
nal of School Psychology 16, 3: (1978) 220.
Canli, Turhan. Biology of Personality and Individual Differences. New York: Guilford Press,
2006.
Carroll, Christopher D. “How Does Future Income Affect Current Consumption?” Quarterly
Journal of Economics 109, 1: (1994) 111–147.
Carroll, John B. Human Cognitive Abilities: A Survey of Factor-Analytic Studies. New
York: Cambridge University Press, 1993.
41

Cattan, Sarah. “Heterogeneity and Selection in the Labor Market.” PhD Thesis, Economics
Department, University of Chicago, 2012.
Chetty, Raj, John N. Friedman, Nathaniel Hilger, Emmanuel Saez, Schanzenbach Whitmore
Diane, and Danny Yagan. “How Does Your Kindergarten Classroom Affect Your Earnings?
Evidence from Project STAR.” Quarterly Journal of Economics 126, 4: (2011) 1593–1660.
Clingman, Joy, and Robert L. Fowler. “The effects of primary reward on the I.Q. performance
of grade-school children as a function of initial I.Q. level.” Journal of Applied Behavior
Analysis 9, 1: (1976) 19–23.
Cloninger, C. Robert, Dragan M. Svrakic, Carmen Bayon, and Thomas R. Przybeck. “Mea-
surement of psychopathology as variants of personality.” In Personality and psychopathol-
ogy, edited by C. Robert Cloninger, Arlington, VA: American Psychiatric Publishing, Inc.,
1999.
Costa, Paul T., and Robert R. McCrae. “Four Ways Five Factors are Basic.” Personality
and Individual Difference 13, 6: (1992a) 653–665.
. Revised NEO Personality Inventory (NEO PI-R) and the NEO Five-Factor Inven-
tory (NEO-FFI) professional manual. Odessa, FL: Psychological Assessment Resources,
1992b.
Cunha, Flavio, and James J. Heckman. “The Technology of Skill Formation.” American
Economic Review 97, 2: (2007) 31–47.
Cunha, Flavio, James J. Heckman, Lance J. Lochner, and Dimitriy V. Masterov. “Inter-
preting the Evidence on Life Cycle Skill Formation.” In Handbook of the Economics of
Education, edited by Eric A. Hanushek, and Frank Welch, Amsterdam: North-Holland,
2006, chapter 12, 697–812.
42
Cunha, Flavio, James J. Heckman, and Susanne M. Schennach. “Estimating the Technology
of Cognitive and Noncognitive Skill Formation.” Econometrica 78, 3: (2010) 883–931.
Damasio, Hanna, Thomas Grabowski, Randall Frank, Albert M. Galaburda, and Antonio R.
Damasio. “The return of Phineas Gage: Clues about the brain from the skull of a famous
patient.” In Social neuroscience: Key readings, edited by John T. Cacioppo, and Gary G.
Berntson, New York, NY: Psychology Press, 2005, 21–28.
Dee, Thomas S., and Martin R. West. “The Non-Cognitive Returns to Class Size.” Educa-
tional Evaluation and Policy Analysis 33, 1: (2011) 23–46.
DeLong, J. Bradford, and Konstantin Magin. “The U.S. Equity Return Premium: Past,
Present and Future.” Journal of Economic Perspectives 23, 1: (2009) 193–208.
Devlin, Bernie, Michael Daniels, and Kathryn Roeder. “The heritability of IQ.” Nature 388,
6641: (1997) 468–471.
DeYoung, Colin G., Jacob B. Hirsh, Matthew S. Shane, Xenophon Papademetris, Nal-
lakkandi Rajeevan, and Jeremy R. Gray. “Testing Predictions From Personality Neuro-
science: Brain Structure and the Big Five.” Psychological Science 21, 6: (2010) 820–828.
Diamond, Adele, Steven Barnett, Jessica Thomas, and Sarah Munro. “Preschool Program
Improves Cognitive Control.” Science 318, 5855: (2007) 1387–1388.
Duckworth, Angela L., Christopher Peterson, Michael D. Matthews, and Dennis R. Kelly.
“Grit: Perseverance and Passion for Long-Term Goals.” Journal of Personality and Social
Psychology 92, 6: (2007) 1087–1101.
Durlak, Joseph A., Roger P. Weissberg, Allison B. Dymnicki, Rebecca D. Taylor, and Kris-
ton B. Schellinger. “The Impact of Enhancing Students Social and Emotional Learning:
A Meta-Analysis of School-Based Universal Interventions.” Child Development 82, 1:
(2011) 405–432.
43

Edlund, Calvin V. “The effect on the behavior of children, as reflected in the IQ scores,
when reinforced after each correct response.” Journal of Applied Behavior Analysis 5, 3:
(1972) 317–319.
Epstein, Seymore. “The Stability of Behavior: I. On Predicting Most of the People Much of
the Time.” Journal of Personality and Social Psychology 37, 7: (1979) 1097–1126.
Farran, Dale C., Mark W. Lipsey, and Sandra Wilson. “Experimental Evaluation of the Tools
of the Mind Pre-K Curriculum.” Technical report, Peabody Research Institute Report,
2011.
Feingold, Alan. “The validity of the information and vocabulary subtests of the WAIS.”
Journal of Clinical Psychology 38, 1: (1982) 169–174.
Figner, Bernd, Daria Knoch, Eric J. Johnson, Amy R. Krosch, Sarah H. Lisanby, Ernst Fehr,
and Elke U. Weber. “Lateral prefrontal cortex and self-control in intertemporal choice.”
Nature Neuroscience 13, 5: (2010) 538–539.
Flynn, James R. What is Intelligence?: Beyond the Flynn Effect. New York: Cambridge
University Press, 2007.
Friedman, David, and Arline H. Streicher. “Reliability of Scores for Fiscal Year 1981 Army
Applicants: Armed Services Vocational Aptitude Battery Forms 8, 9, and 10.” Technical
report, Defense Technical Information Center, 1985.
GED Testing Service. “The Technical Manual: 2002 Series GED Tests.” Tech-
nical manual, American Council on Education and GED Testing Service, Wash-
ington, DC, 2009. http://www.acenet.edu/Content/NavigationMenu/ged/pubs/
TechnicalManual_2002SeriesGEDTests.pdf.
Gensowski, Miriam. “Personality, IQ, and Lifetime Earnings.” Unpublished manuscript,
University of Chicago, Department of Economics, 2012.
44

Gottfredson, Linda S. “Why g Matters: The Complexity of Everyday Life.” Intelligence 24,
1: (1997) 79–132.
Gottschalk, Peter. “Can work alter welfare recipients’ beliefs?” Journal of Policy Analysis
and Management 24, 3: (2005) 485–498.
Gough, Harrison G., and Alfred B. Heilbrun. The Adjective Check List Manual. Palo Alto,
CA: Consulting Psychologists Press, 1983.
Greene, Anthony C., Gary L. Sapp, and Brad Chissom. “Validation of the Stanford-Binet
Intelligence Scale: Fourth Edition With Exceptional Black Male Students.” Psychology in
the Schools 27, 1: (1990) 35–41.
Grek, S. “Governing by numbers: the PISA ‘effect’ in Europe.” Journal of Education Policy
24, 1: (2009) 23–37.
Hansen, Karsten T., James J. Heckman, and Kathleen J. Mullen. “The Effect of Schooling
and Ability on Achievement Test Scores.” Journal of Econometrics 121, 1-2: (2004) 39–98.
Hartlage, Lawrence C., and Carol T. Steele. “WISC and WISC-R correlates of academic
achievement.” Psychology in the Schools 14, 1: (1977) 15–18.
Heckman, James J., John Eric Humphries, and Tim Kautz. “The GED and the Role of
Character in American Life.” Unpublished book manuscript, University of Chicago, De-
partment of Economics, 2012a.
Heckman, James J., John Eric Humphries, and Nicholas Mader. “The GED.” In Handbook
of the Economics of Education, edited by Eric A. Hanushek, Stephen Machin, and Ludger
Woßmann, Amsterdam: North Holland, Elsevier, 2011a, volume 3, chapter 9, 423–484.
Heckman, James J., John Eric Humphries, Sergio Urzua, and Gregory Veramendi. “The
Effects of Educational Choices on Labor Market, Health, and Social Outcomes.” Unpub-
lished manuscript, University of Chicago, Department of Economics, 2011b.
45

Heckman, James J., and Paul A. LaFontaine. “The American High School Graduation Rate:
Trends and Levels.” Review of Economics and Statistics 92, 2: (2010) 244–262.
Heckman, James J., Lena Malofeeva, Rodrigo Pinto, and Peter A. Savelyev. “Understanding
the Mechanisms Through Which an Influential Early Childhood Program Boosted Adult
Outcomes.” Unpublished manuscript, University of Chicago, Department of Economics
(first draft, 2008). Under revision, American Economic Review, 2012b.
Heckman, James J., and Dimitriy V. Masterov. “The Productivity Argument for Investing
in Young Children.” Review of Agricultural Economics 29, 3: (2007) 446–493.
Heckman, James J., Seong Hyeok Moon, Rodrigo Pinto, Peter A. Savelyev, Azeem Shaikh,
and Adam Q. Yavitz. “The Perry Preschool Project: A Reanalysis.” Unpublished
manuscript, University of Chicago, Department of Economics, 2006a.
Heckman, James J., Seong Hyeok Moon, Rodrigo Pinto, Peter A. Savelyev, and Adam Q.
Yavitz. “Analyzing Social Experiments as Implemented: A Reexamination of the Evidence
From the HighScope Perry Preschool Program.” Quantitative Economics 1, 1: (2010a)
1–46. First draft, September, 2006.
. “The Rate of Return to the HighScope Perry Preschool Program.” Journal of Public
Economics 94, 1-2: (2010b) 114–128.
Heckman, James J., Jora Stixrud, and Sergio Urzua. “The Effects of Cognitive and Noncog-
nitive Abilities on Labor Market Outcomes and Social Behavior.” Journal of Labor Eco-
nomics 24, 3: (2006b) 411–482.
Herrnstein, Richard J., and Charles A. Murray. The Bell Curve: Intelligence and Class
Structure in American Life. New York: Free Press, 1994.
Holt, Michael M., and Tom R. Hobbs. “The effects of token reinforcement, feedback and
46

response cost on standardized test performance.” Behaviour Research and Therapy 17, 1:
(1979) 81–83.
Jencks, Christopher. Who Gets Ahead? The Determinants of Economic Success in America.
New York: Basic Books, 1979.
John, Oliver P., and Sanjay Srivastava. “The Big Five Trait Taxonomy: History, Measure-
ment and Theoretical Perspectives.” In Handbook of Personality: Theory and Research,
edited by L. A. Pervin, and O. P. John, New York: The Guilford Press, 1999, chapter 4,
102–138.
Kettner, Norman. “Armed Services Vocational Aptitude Battery (ASVAB Form 5): Com-
parison with GATB and DAT Tests: Final Report for Period May 1975–October 1976.”
Technical report, DTIC Document: Department of Defense, Department of the Air Force,
Air Force Systems Command, Air Force Human Resources Laboratory, 1976.
Knudsen, Eric I., James J. Heckman, Judy Cameron, and Jack P. Shonkoff. “Economic,
Neurobiological, and Behavioral Perspectives on Building America’s Future Workforce.”
Proceedings of the National Academy of Sciences 103, 27: (2006) 10,155–10,162.
Kobrin, Jennifer L., Brian F. Patterson, Emily J. Shaw, Krista D. Mattern, and Sandra M.
Barbuti. “Validity of the SAT for predicting first-year college grade point average.” The
College Board 5: (2008) 1–10.
Kosfeld, Michael, Markus Heinrichs, Paul J. Zak, Urs Fischbacher, and Ernst Fehr. “Oxy-
tocin increases trust in humans.” Nature 435, 7042: (2005) 673–676.
Larson, Gerald E., Dennis P. Saccuzzo, and James Brown. “Motivation: Cause or confound
in information processing/intelligence correlations?” Acta Psychologica 85, 1: (1994)
25–37.
47
Lemann, Nicholas. The Big Test: The Secret History of the American Meritocracy. New
York: Farrar, Straus and Giroux, 1999.
Lillard, Angeline, and Nicole Else-Quest. “The Early Years: Evaluating Montessori.” Science
313, 5795: (2006) 1893–1894.
Lindquist, Everet Franklin. “Preliminary Considerations in Objective Test Construction.” In
Educational Measurement, edited by E. F. Lindquist, Washington, DC: American Council
on Education, 1951, 119–184.
Martins, Pedro S. “Can Targeted, Non-Cognitive Skills Programs Improve Achievement?”
Discussion Paper 5266, IZA, 2010.
McAdams, Dan P., and Jennifer L. Pals. “A New Big Five: Fundamental Principles for an
Integrative Science of Personality.” American Psychologist 61, 3: (2006) 204–217.
McArdle, John J., Fumiaki Hamagami, William Meredith, and Katherine P. Bradway. “Mod-
eling the dynamic hypotheses of Gf-Gc theory using longitudinal life-span data.” Learning
and Individual Differences 12, 1: (2000) 53–79.
Means, B., and Janice H. Laurence. “Characteristics and Performance of Recruits Enlisted
with General Educational Development (GED) Credentials.” Technical Report FR-PRD-
84-6, Human Resources Research Organization, Alexandria, VA, 1984.
Michalko, K. T., and D. H. Saklofske. “A Psychometric Investigation of the Wechsler In-
dividual Achievement Test with a Sample of Saskatchewan Schoolchildren.” Canadian
Journal of School Psychology 12, 1: (1996) 44–54.
Mischel, Walter. Personality and Assessment. New York: Wiley, 1968.
Murray, Henry Alexander. Explorations in personality: a clinical and experimental study of
fifty men of college age. New York: Oxford University Press, 1938.
48

National Center for Education Statistics. “Digest of Education Statistics.” Institute of
Education Sciences, U.S. Department of Education. Washington, DC., Various.
Niolon, Richard. “Introduction to the WAIS III.” Available at http://www.psychpage.
com/learning/library/intell/wais_history.html, posted August, 2005, 2005.
Nisbett, Richard E. Intelligence and How to Get It: Why Schools and Cultures Count. New
York, NY: W. W. Norton and Company, 2009.
Nisbett, Richard E., Joshua Aronson, Clancy Blair, William Dickens, James Flynn, Diane F.
Halpern, and Eric Turkheimer. “Intelligence: New findings and theoretical developments.”
American Psychologist 67, 2: (2012) 130–159.
O’Leary, Una-Marie, Kathleen M. Rusch, and Stephen J. Guastello. “Estimating Age-
Stratified WAIS-R IQs from scores on the Raven’s Standard Progressive Matrices.” Journal
of Clinical Psychology 47, 2: (1991) 277–284.
Omizo, Michael M. “The Differential Aptitude Tests as Predictors of Success in a High
School for Engineering Program.” Educational and Psychological Measurement 40, 1:
(1980) 197–203.
R. R. Bowker Publishing. “The Bowker Annual: Library and Book Trade Almanac.”, Vari-
ous.
Raven, J., J. C. Raven, and J.H. Court. Manual for Raven’s progressive matrices and vocab-
ulary scales. San Antonio, TX: Harcourt Assessment, 1988.
Raven, John C. Advanced progressive matrices: Sets I and II. London: H.K. Lewis, 1962,
revised edition.
Roberts, B. W., N. R. Kuncel, R. L. Shiner, A. Caspi, and L. R. Goldberg. “The power
of personality: The comparative validity of personality traits, socioeconomic status, and
49
cognitive ability for predicting important life outcomes.” Perspectives in Psychological
Science 2, 4: (2007) 313–345.
Roberts, Brent W. “Back to the Future: Personality and Assessment and Personality De-
velopment.” Journal of Research in Personality 43, 2: (2009) 137–145.
Roberts, Brent W., and Daniel Mroczek. “Personality Trait Change in Adulthood.” Current
Directions in Psychological Science 17, 1: (2008) 31–35.
Roberts, Brent W., Kate E. Walton, and Wolfgang Viechtbauer. “Patterns of mean-level
change in personality traits across the life course: A meta-analysis of longitudinal studies.”
Psychological Bulletin 132, 1: (2006) 1–25.
Roberts, Richard D., Ginger Nelson Goff, Fadi Anjoul, P. C. Kyllonen, Gerry Pallier, and
Lazar Stankov. “The Armed Services Vocational Aptitude Battery (ASVAB): Little more
than acculturated learning (Gc)!?” Learning and Individual Differences 12, 1: (2000)
81–103.
Rosenberg, Morris. Society and the Adolescent Self-Image. Princeton, NJ: Princeton Uni-
versity Press, 1965.
Rothlisberg, Barbara. “Comparing the Stanford-Binet, Fourth Edition to the WISC-R: A
Concurrent Validity Study.” Journal of School Psychology 25, 2: (1987) 193–196.
Rotter, Julian B. Generalized Expectancies for Internal versus External Control of Rein-
forcement. Washington DC: American Psychological Association, 1966.
Rueda, M. Rosario, Mary K. Rothbart, Bruce D. McCandliss, Lisa Saccomanno, and
Michael I. Posner. “Training, maturation, and genetic influences on the development
of executive attention.” Proceedings of the National Academy of Sciences 102, 41: (2005)
14,931–14,936.
50
Rutter, Michael. “Implications of Resilience Concepts for Scientific Understanding.” Annals
of the New York Academy of Sciences 1094, 1: (2006) 1–12.
Samuel, Douglas B., and Thomas A. Widiger. “A meta-analytic review of the relation-
ships between the five-factor model and DSM-IV-TR personality disorders: A facet level
analysis.” Clinical Psychology Review 28, 8: (2008) 1326–1342.
Savelyev, Peter. “Conscientiousness, Education, and Longevity of High-Ability Individuals.”
Unpublished manuscript, University of Chicago, Department of Economics, 2011.
Schmidt, Frank L., and John Hunter. “General Mental Ability in the World of Work: Occu-
pational Attainment and Job Performance.” Journal of Personality and Social Psychology
86, 1: (2004) 162–173.
Segal, Carmit. “Motivation, Test Scores, and Economic Success.” Economics working papers,
Department of Economics and Business, Universitat Pompeu Fabra, Barcelona, Spain,
2008.
Social and Character Development Research Consortium. “Efficacy of Schoolwide Programs
to Promote Social and Character Development and Reduce Problem Behavior in Elemen-
tary School Children.” Research Report NCER 20112001, National Center for Education
Research, Institute of Education Sciences, U.S. Department of Education, 2010.
Stevens, Courtney, Jessica Fanning, Donna Coch, Lisa Sanders, and Helen Neville. “Neu-
ral mechanisms of selective auditory attention are enhanced by computerized training:
Electrophysiological evidence from language-impaired and typically developing children.”
Brain Research 1205: (2008) 55–69.
Sylva, Kathy. “The Quest for Quality in Curriculum.” In Lasting Differences: The
High/Scope Preschool Curriculum Comparison Study through Age 23, edited by L. J.
Schweinhart, and D. P. Weikart, Ypsilanti: High/Scope Press, 1997, 89–93.
51
Terman, Lewis M., Bird T. Baldwin, Edith Bronson, James C. DeVoss, Florence Fuller,
Truman Lee Kelley, Margaret Lima, Helen Marshall, Albert H. Moore, A. S. Rauben-
heimer, G. M. Ruch, Raymond L. Willoughby, Jennie Benson Wyman, and Dorothy Hazel-
tine Yates. Genetic Studies of Genius: Mental and Physical Traits of a Thousand Gifted
Children, volume 1. Stanford University, CA: Stanford University Press, 1925.
Terman, Lewis M., Melita H. Oden, Nancy Bayley, Helen Marshall, Quinn McNemar, and
Ellen B. Sullivan. Genetic Studies of Genius: The Gifted Child Grows Up: Twenty-Five
Years’ Follow-Up of a Superior Group, volume 4. Stanford University, CA: Stanford
University Press, 1947.
Terman, Lewis Madison, and Maud A. Merrill. Stanford-Binet Intelligence Scale: Manual
for the Third Revision Form L-M. Boston: Houghton Mifflin, 1960.
Thaler, Richard H. “A Short Course in Behavioral Economics.” http://www.edge.org/
3rd_culture/thaler_sendhil08/thaler_sendhil_index.html. Edge Master Class,
Sonoma, CA, July 25-27, 2008., 2008.
52