harvesting€technology€of forest€residues€for€fuel in€the
TRANSCRIPT

VTT RESEA
RCH N
OTES 2229
Harvesting technology of forest residues for fuel in the U
SA and Finland
Tätä julkaisua myy Denna publikation säljs av This publication is available from
VTT TIETOPALVELU VTT INFORMATIONSTJÄNST VTT INFORMATION SERVICEPL 1000 PB 1000 P.O.Box 1000
02044 VTT 02044 VTT FIN–02044 VTT, FinlandPuh. 020 722 4404 Tel. 020 722 4404 Phone internat. + 358 20 722 4404Faksi 020 722 4374 Fax 020 722 4374 Fax + 358 20 722 4374
ESPOO 2004 VTT RESEARCH NOTES 2229
The main focus of the work was to collect and assemble information on themethods and economics associated with collection of wood residues forbioenergy from natural forest systems and from shortrotation fiberproduction systems. Additionally, information on bioenergy cropdevelopment approaches and projected economics has been collected andsummarized. Comparisons have been made between the USA and Finnishbiomass production and collection technologies to evaluate possibletechnology transfer opportunities.
The work was carried out in Biomass Feedstock Development Programin Oak Ridge National Laboratory (ORNL) in Tennessee during 1.9.2001–31.8.2002. It was based on literature from the USA and Finland andcompleted with the help of the study tours for the forest residue chipharvesting in California, Maine, Vermont and New Hampshire. The workand the final report were made by Dr. Arvo Leinonen who was workingas a visiting research scientist for ORNL.
Arvo Leinonen
Harvesting technology offorest residues for fuelin the USA and Finland
ISBN 951– 38– 6212– 7 (soft back ed.) ISBN 951– 38– 6761– 7 (URL: http://www.vtt.fi/inf/pdf/)ISSN 1235– 0605 (soft back ed.) ISSN 1455– 0865 (URL: http://www.vtt.fi/inf/pdf/)


VTT TIEDOTTEITA � RESEARCH NOTES 2229
Harvesting Technology of Forest residues for fuel in the
USA and Finland
Arvo Leinonen VTT Processes

ISBN 951�38�6212�7 (soft back ed.) ISSN 1235�0605 (soft back ed.) ISBN 951�38�6761�7 (URL: http://www.vtt.fi/inf/pdf/) ISSN 1455�0865 (URL: http://www.vtt.fi/inf/pdf/)
Copyright © VTT 2004
JULKAISIJA � UTGIVARE � PUBLISHER
VTT, Vuorimiehentie 5, PL 2000, 02044 VTT puh. vaihde (09) 4561, faksi (09) 456 4374
VTT, Bergsmansvägen 5, PB 2000, 02044 VTT tel. växel (09) 4561, fax (09) 456 4374
VTT Technical Research Centre of Finland, Vuorimiehentie 5, P.O.Box 2000, FIN�02044 VTT, Finland phone internat. + 358 9 4561, fax + 358 9 456 4374
VTT Prosessit, Koivurannantie 1, PL 1603, 40101 JYVÄSKYLÄ puh. vaihde (014) 672 611, faksi (014) 672 598 VTT Processer, Koivurannantie 1, PB 1603, 40101 JYVÄSKYLÄ tel. växel (014) 672 611, fax (014) 672 598 VTT Processes, Koivurannantie 1, P.O.Box 1603, FIN�40101 JYVÄSKYLÄ, Finland phone internat. + 358 14 672 611, fax + 358 14 672 598
Technical editing Leena Ukskoski Valopaino Oy, Helsinki 2004

3
Leinonen, Arvo. Harvesting Technology of Forest residues for fuel in the USA and Finland. Espoo 2004. VTT Tiedotteita � Research Notes 2229. 132 p. + app. 10 p.
Keywords wood fuels, harvesting, wood chips, forest residues, thinnings, Finland, USA, production costs, environmental impacts, competitiveness
Abstract This work has been carried out in Biomass Feedstock Development Program in Oak Ridge National Laboratory (ORNL) during 1.9.2001�31.08.2002. The work and the final report has been made by Dr. Arvo Leinonen who has been working as a visiting research scientist for ORNL.
The main focus of this work has been to collect and assemble information on the methods and economics associated with collection of wood residues for bioenergy from natural forest systems and from short-rotation fiber production systems. Additionally, information on bioenergy crop development approaches and projected economics has been collected and summarized. Comparisons have been made between the USA and Finnish biomass production and collection technologies to evaluate possible technology transfer opportunities.
In the USA currently 3.5�4.5 million dry tons (15.3�19.6 TWh in 50 % moisture content) of whole tree chips utilized for fuel annually at the moment. Forest residues are mainly utilized in the electricity power sector. There are no subsidies for utilizing wood for fuel. The use of forest residues has an important social and economical impact on the rural areas offering industrial jobs which in general are decreasing in these regions. There is a huge forest residue potential to increase the use of forest residues for fuel, 23.8�44.8 million dry short tons (103.8�195.3 TWh). Also smallwood, if harvested for fuel, has a potential of 17.0�65.0 million dry short tons (74.1�283.4 TWh in 50 % moisture content). The biggest possibility to utilize forest residues for fuel is co-firing in coal fired power plants. Small municipal cogeneration (20 MWth) power plants in the Northern areas would also be economical and possible users for forest residues. The harvesting technologies in the USA are effective, but there is still potential to intensify them. It would be justified to start a R&D program to intensify the use of forest residues for fuel for different end users.
In Finland the use of forest residues in 2000 was only 0.46 million dry short ton (2.0 TWh in 50 moisture content), which was only about 2.5 % of the total wood fuel use. In Finland there are also lots of forest residue resources to be utilized for fuel, 6.5�7.4 million dry short tons (25.8�31.6 TWh, 50 w-%). The target is to increase the use of forest residues up to 2.3 million dry short tons (10 million MWh, 50 w-%) by the year

4
2010. The aim is supported by intensive R&D work on forest residues harvesting and use. The use of forest residues for fuel has been competitive with other fuels because of investment aids for constructing wood fired power plants, subsidies for harvesting wood from thinnings and excise taxes for fossil fuels. The production costs of forest residues are higher in Finland than in the USA. To intensify the harvesting of forest residues the whole-tree technology using feller bunchers and skidders should be tested in Finnish conditions especially from thinnings on hard lands. The environmental impacts of forest residues for fuel are low and do not hinder utilizing them. The use of forest residues from final felling areas helps to reforest the stand.

5
Preface This work has been carried out in Biomass Feedstock Development Program in Oak Ridge National Laboratory (ORNL) during 1.9.2001�31.08.2002. The work and the final report has been made by Dr. Arvo Leinonen who was working as a visiting research scientist for ORNL.
The Bioenergy Feedstock Development Program (BFDP) supports the efforts of the USA Department of Energy�s two main programs, which focus on bioenergy technology development in the USA. The programs are the Biomass Power Program and the Biofuels Program. The aim of the BFDP is to develop new crops as biomass resources for bioenergy and bioproducts.
The main focus of this work has been to collect and assemble information on the methods and economics associated with collection of wood residues for bioenergy from natural forest systems and from short-rotation fiber production systems. Additionally, information on bioenergy crop development approaches and projected economics has been collected and summarized. Comparisons have been made between the US and Finnish biomass production and collection technologies to evaluate possible technology transfer opportunities.
The work has been carried out based on literature from the USA and Finland and with the help of the study tours for the forest residue chip harvesting in California, Maine, Vermont and New Hampshire.
Program leader Lynn Wright from ORNL has been the supervisor of the work and I would like to thank her for her support on my work in ORNL. I would also like to thank fuel manager Steve Jolley from Wheelabrator Shasta Energy Company, project manager Mark Downing from ORNL, project leader Bob Rummer from USDA Forest Service, professor Bruce Hartsough from University of California and chief forrester William Bropelin from McNeil Generating station for their help in my work. I would also thank all biomass group members in ORNL for helping me in my work. I would also like to thank my wife Suoma and my children Antero and Irene for their support on my work.
Arvo Leinonen

6
Contents
Abstract..............................................................................................................................3
Preface ...............................................................................................................................5
1. Introduction................................................................................................................11
2. Wood harvesting methods in the USA and Finland...................................................14 2.1 Logging methods ..............................................................................................14 2.2 Whole-tree method ...........................................................................................15 2.3 Tree-length method ..........................................................................................17 2.4 Cut-to-length method .......................................................................................17 2.5 Summary of timber harvesting technologies....................................................19
3. Forest residues for fuel in the USA............................................................................20 3.1 Wood resources for fuel in the USA ................................................................20
3.1.1 Wood resources in the USA ....................................................................20 3.1.2 Forest residues potential for fuel .............................................................22 3.1.3 Short rotation woody crop potential ........................................................24 3.1.4 Summary of forest fuel potential.............................................................26
3.2 Forest residue consumption in the USA...........................................................27 3.2.1 Energy consumption................................................................................27 3.2.2 Consumption of wood fuel ......................................................................28 3.2.3 End users of wood fuel ............................................................................29 3.2.4 Consumption of forest residues for fuel ..................................................31 3.2.5 Wood fuel chips quality properties .........................................................34
3.3 Harvesting technology of forest residues for fuel from natural stands ............36 3.3.1 Wood yield in harvesting ........................................................................36 3.3.2 Forest residue harvesting methods for thinning and clearcutting............39 3.3.3 The whole tree harvesting chain..............................................................39
3.3.3.1 Felling ......................................................................................40 3.3.3.2 Skidding ...................................................................................42 3.3.3.3 Chipping...................................................................................44 3.3.3.4 Transport ..................................................................................47 3.3.3.5 Drying ......................................................................................49
3.3.4 Cut-to-length method ..............................................................................50 3.4 Harvesting of short rotation woody crops (SRWC) for fuel ............................51
3.4.1 Harvesting yield ......................................................................................51 3.4.2 Whole tree harvesting � chain .................................................................52
3.4.2.1 Felling ......................................................................................53

7
3.4.2.2 Skidding ...................................................................................54 3.4.2.3 Chipping...................................................................................56 3.4.2.4 Road transport ..........................................................................56
3.4.3 Comparison between harvesting of forest residues and SRW for fuel....56 3.5 Production costs of forest residues and SRWC chips for fuel..........................57
3.5.1 Production costs of forest residue chips from natural stands using whole-tree harvesting chain ............................................................................57
3.5.2 Production costs of wood fuel in the cut-to-length method ....................58 3.5.3 Harvesting costs of short rotation woody crops ......................................59
3.6 Social, economical and other impacts of harvesting forest residues ................60 3.6.1 Social and economical impacts ...............................................................60 3.6.2 Other impacts ..........................................................................................61
3.7 Competitiveness of forest residues for fuel ......................................................62 3.8 Future trends in the use of wood for fuel .........................................................64
3.8.1 Combustion technology development .....................................................64 3.8.2 The use of forest residues in 2020...........................................................65
4. Forest residues for fuel in Finland .............................................................................67 4.1 Forest residue potential ....................................................................................67 4.2 Consumption of forest residues as fuel ............................................................68
4.2.1 Energy consumption in Finland ..............................................................68 4.2.2 Forest residues as fuel .............................................................................69 4.2.2 End users of wood for fuel in Finland.....................................................71 4.2.3 Consumption of forest chips for fuel.......................................................72
4.3 R&D on forest residue harvesting technology for fuel ....................................73 4.4 Harvesting chains for forest residues for fuel...................................................74
4.4.1 Timber harvesting operations ..................................................................74 4.4.2 Chipping at the roadside landing.............................................................75
4.4.2.1 Terrain haulage.........................................................................76 4.4.2.2 Storing and drying....................................................................77 4.4.2.3 Chipping or crushing................................................................78 4.4.2.4 Loading and long-distance transport........................................80
4.4.3 Chipping at the terminal � harvesting chain............................................80 4.4.3.1 Harvesting chain.......................................................................80 4.4.3.2 Fuel terminal ............................................................................81 4.4.3.3 Storing of forest residue chips..................................................82 4.4.3.4 Advantages of fuel terminal � harvesting chain.......................83
4.4.3 Chipping at stand � harvesting chain.......................................................83 4.4.4 Chipping at power plant ..........................................................................84 4.4.5 Bundling technology ...............................................................................85
4.5 Forest residues from thinnings .........................................................................87 4.5.1 Thinning stands ....................................................................................87

8
4.5.2 Small tree chips as a fuel......................................................................88 4.5.3 Harvesting technology for young stands..............................................89
4.5.3.1 Harvesting technology for pre-commercial thinning ............89 4.5.3.2 Harvesting technology for first commercial thinning ...........91
4.6 Production costs of forest residues for fuel ......................................................91 4.6.1 Production costs of forest residue chips from final cutting.....................91 4.6.2 Production costs of forest residues from thinnings .................................92
4.7 Social and economical impacts of forest fuels .................................................94 4.8 Environmental impacts of harvesting logging residues ...................................95 4.9 The competitiveness of forest residues as a fuel ..............................................96
4.9.1 Fuel prices ............................................................................................96 4.9.2 Production costs of heat and electricity ...............................................97
4.10 Use of forest residues in the future...................................................................98
5. Comparison of USA and Finnish forest residue chips harvesting and consumption.99 5.1 Forest residue potential ....................................................................................99
5.1.1 Forest resources .......................................................................................99 5.1.2 Forest residue potential for fuel.............................................................100
5.2 Use of forest residue as fuel ...........................................................................101 5.2.1 Energy use in the United States and Finland .....................................101 5.2.2 Wood energy consumption ................................................................101 5.2.5 Consumption of forest residues for fuel ................................................102
5.3 Harvesting of forest residue for fuel...............................................................103 5.3.1 Harvesting technologies of forest residues for fuel............................103 5.3.2 Harvesting yield .................................................................................104 5.3.3 Harvesting machines ..........................................................................105 5.3.4 Harvesting costs of forest residues.....................................................106
5.4 Competitiveness of forest residue for fuel......................................................108 5.5 Subsidies.........................................................................................................109 5.6 Forest residue chip quality..............................................................................110 5.7 Impacts of forest residue use ..........................................................................110
5.7.1 Effect on the employment ..................................................................110 5.7.2 Other impacts .....................................................................................111 5.7.3 Environmental impacts.......................................................................111
5.8 Future trends in the use of forest residues for fuel .........................................112 5.9 R&D on forest residues for fuel .....................................................................112
6. Need for the forest residues harvesting technology development and research in the USA and Finland ...........................................................................................................114
6.1 The United Sates.............................................................................................114 6.2 Finland............................................................................................................116

9
7. Conclusions..............................................................................................................117
8. Summary ..................................................................................................................119
Literature .......................................................................................................................125
Appendices
Appendix 1: Definitions Appendix 2: Coefficients and measures Appendix 3: Properties and quality table of forest residue chips in Finland Appendix 4: Basic information for calculation of forest residue chips harvesting costs Appendix 5: Green and dry weights per volume of wood and bark for Eastwide Data Base species group Appendix 6: Logging residue removals, logging residues harvesting potential, electric power capacity and electricity production by using wood

10

11
1. Introduction
The United States
During the 1980s the biomass power capacity rapidly expanded in the US. At that time the price of natural gas was high. The high gas prices served to make biomass energy attractive. At the beginning of 1990s the price of natural gas dropped to historical low level and the use of biomass for fuel were decreased (Jolley 2001). During the 1990s the capacity has been stable and has started to rise during the recent years.
At present, the grid-connected wood biomass electric capacity in the United States is about 7 GW. This is about one percent of the total domestic capacity and about eight percent of the non-utility generation capacity. Wood accounts for about 90 percent of all biomass used at the moment. The USA biopower industry is located primarily where forest residues are plentiful (Energy Efficiency and Renewable Energy Network 2000).
Forest residues constitute a major source of biomass fuels in the United States. Timber harvesting operations produce forest residues in the forms of slash (tops, limbs, bark, broken pieces) and cull trees from thinnings and final fellings. There are many advantages to utilize the forest residues for fuel: benefitting the forest growth, decreasing the forest fire risk, reducing environmental impacts in energy production and rural economic development.
The residues left in the forest impede forest regeneration, increase the risk of forest fire and hinder the area for recreation use. Increasingly, harvesting plans on public and private lands require some form of residue management, which usually means either piling and burning, or removal and use as fuel (Morris 1999a).
In addition to logging residues, forest treatment (thinning) residues comprise an important source of fuel for the biomass energy industry. Because of past forestry practices and aggressive fire-fighting efforts during the past 80�100 years, vast areas of American forests are overstocked with biomass material, which represents an increased risk of destructive wildfires and a generally degraded functioning of the forest ecosystems. These forest benefit greatly from thinning (Morris 1999a). There is a good opportunity with the need for brush disposal and thinning of forest stands, particularly in the West, to use more of the smaller diameter material for fuel and other purposes. Removal of this material by mechanical means is more costly than broadcast burning in place, but air emissions and loss of control of prescribed fires are reasons to spend extra money to remove the material by means other than burning. Besides environmental considerations, conservation of energy and the forest resource also should lead to a higher degree of utilization.
12
Wood fuel has several environmental advantages compared with fossil fuel: renewability, carbon emissions, heavy metals and sulfur and minimal ash. There is little net production of carbon dioxide (CO2), the major greenhouse gas, from wood combustion because the CO2 generated during combustion of the wood equals the CO2 consumed during the lifecycle of the tree. Wood fuel does not contain sulfur or heavy metals: wood fuel does not cause acid rain pollution. Usually ash content is less than 1 % of the weight of the wood, and sometimes ash may be used as fertilizer (Bergman & Zerbe 2001).
Use of biomass for fuel creates also new markets for farmers and foresters, many of whom currently face economic hardship. It can establish new processing, distribution and service industries in rural communities.
Utilization of forest residues for fuel in the USA is sporadic. There is much biomass available from logging operations and silvicultural treatment that could be effectively used for fuel, but the high cost of removal from the forest to the point of utilization is a deterrent.
There is a good possibility to increase the use of wood fuel in the future because there are a lot of wood residue resources in the USA and at the moment there are several technologies that enable more efficient and economical use of forest residues.
Finland
In Finland the use of forest residues in 2000 was only 0.46 million dry short ton, which was only about 2.5 % of the total wood use. The target is to increase the use of renewable energy at least by 50 % (119 MBtu, 34.9 million MWh) by the year 2010 from the level of 1995 (240 MBtu, 70.4 million MWh) (Ministry of Trade and Industry 2000, Alakangas 2000). The target is to increase the use of forest residues up to 2.3 million dry short tons (10 million MWh) by the year 2010. The reasons for increasing the use of forest residues for fuel are related to environmental and economical issues. Also the harvesting and use of forest residues offers work for the people on rural areas where the possibilities to achieve work is not so good. The use of forest residue is one of the main means to get this target. At the moment in Finland there is lot of R&D work related to the forest residue harvesting technology. That is why the harvesting technology is developing rapidly and new harvesting technologies are introduced.
Target
The target of this work was to collect and assemble information on the methods and economics associated with collection of wood residues for bioenergy from natural forest

13
systems and from short-rotation crop production systems. Comparisons will be made between the USA and Finnish biomass production and collection technologies to evaluate possible technology transfer opportunities.
About research methods
The properties of wood differ from each other in Finland and in the US. Some typical figures have been gathered from the literature for these properties. These figures have been used when converting the units to be equal. In the report the English and metric units have been used. The main unit that has been used in the report to express different kind of measures of forest residues in the USA is oven dry short ton (Odt). Together with Odt ton unit also MWh is used for the Finnish. In the USA wood potential and consumption are presented on dry basis but in Finland these parameters are presented on wet basis in 50 % moisture content. The main average properties of wood and units which have been used in the research are presented in App. 2.

14
2. Wood harvesting methods in the USA and Finland
2.1 Logging methods
There are three main logging methods in the USA and in Finland. These are whole-tree, tree-length and cut-to-length logging methods. In the USA the main method is whole-tree method and the share of whole-tree harvesting method is 80 %. The share of cut-to-length method is 15 % and the share of tree-length method is 5 %. In Finland the cut-to-length method is used in timber harvesting (Fig. 1).
In the whole-tree logging method the trees are felled at the stump and skidded beside the road for delimbing and/or processing and stocking. In tree-length logging method trees are felled and delimbed at the stump and the stems are transported to the landing or roadside. In both methods the cross-cutting of the stems takes place at the landing or at the mill. In cut-to-length logging method the trees are felled, delimbed and cross-cut at the stump and the products are hauled to the roadside where they are stocked.
Also there is used in the US partially mechanized short-wood system. It is a combination of whole-tree and cut-to-length harvesting chain.
Figure 1. Cut-to-length, partially mechanized short-wood system and whole-tree harvesting chains (Partek 2003).

15
2.2 Whole-tree method
The whole-tree method, sometimes called full-tree method, is used for the most in the USA. In the whole-tree logging system feller bunchers fell and bunch timber, which is then transported to landing or roadside for delimbing and stocking. The whole-tree harvesting method consists of feller bunchers, skidders (Fig. 2), processing equipment such as delimbers, slashers and whole tree chippers (Blinn et al. 2000).
Feller buncher
Feller bunchers fell trees with either a saw or shear and then place the trees in bunches along the skid roads for further handling. By accumulating felled trees in piles, the feller buncher makes the subsequent skidding process more productive. The feller bunchers can be equipped with rubber tires or tracks. Rubber-tired felling machines move generally faster and have lower initial and operating costs than other alternatives. These machines generally have fixed heads that require them be driven to each tree to be felled. Excavators have also commonly been adapted for use as feller buncher. The stability of tracked excavators, the long reach of the boom that minimizes the need of movements, and low ground pressure s exerted by these machines greatly reduce their impacts on a site (Blinn et al. 2000).
With most feller buncher methods, the wood is skidded in tree lengths to either a landing or a processing area for delimbing. Grapple skidders grasp a tree bunch with a large pincer on the back of the machine and pull the bunch to the landing. The most common skidder types are rubber-tired grapple skidders because of their proven flexibility, performance, productivity and lower purchase price and operating costs. However, these skidders tend to cause frequent rutting and site damage. Also cable skidders are used for skidding on difficult sites by winching the wood to the machine (machine (USDA Forest Service�s Southern Research Station 2002).
Figure 2. Whole-tree harvesting chain � drive-to-tree feller buncher Timberjack 740 feller buncher (left) (photo by Timberjack) and grapple skidder (right) (photo by Arvo Leinonen).

16
Processing at the landing
At a landing or a processing area the whole trees are delimbed. There are different kind of delimbers in use like grate delimbers, stroke delimbers, loader mounted pull-through delimbers and flail delimbers. Grate delimbers are large steel grates that are set in the woods at some distance from the landing. By backing the load of trees through the grate with the skidder, most pine limbs can be broken off (machine (USDA Forest Service�s Southern Research Station 2002).
If the stems are cross-cut for certain lengths at the landing using either chainsaw or slasher higher value products can be got from the stems. Slasher is constructed on the truck chassis (Fig. 2). There is a rotating blade disc in the slasher by which the stems are cross-cut to the certain lengths (machine (USDA Forest Service�s Southern Research Station 2002).
In-woods chipping is an extension of the feller buncher and grapple skidder system. In these operations, a flail-chipper (Fig. 3) is added at the landing to produce pulp-quality chips from tree-length stems. A spinning chain flail removes bark and limbs, and the clean stem is chipped and blown into a waiting truck (USDA Forest Service�s Southern Research Station 2002).
A typical feller buncher and grapple skidder system includes one feller buncher, two grapple skidders, a grate delimber and a knuckleboom log loader. These systems are best suitable for even-aged stands with trees of uniform size and high pulpwood volumes (USDA Forest Service�s Southern Research Station 2002).
Advantages
General advantages of whole-tree harvesting systems are (Blinn et al. 2000):
- It is suitable for thinning and regeneration fellings,
- it can efficiently handle a variety of tree sizes,
- it is well suited for operations on steep slopes,
- the individual machines are mechanically simpler, which leads to less down time and higher mechanical availability, requires less skilled operators, less training and quicker attainment of maximum productivity,
- investment and operating costs are generally lowest on a per unit basis and
- because less labor is required per unit of production, overall production levels are high.

17
Figure 3. Some processing equipments of whole trees at road site or landing � slasher (photo by Arvo Leinonen) and Morbark 2755 Flail Chipharvestor (Morbark 2002).
2.3 Tree-length method
In tree-length logging trees are felled and delimbed at the stump, and the stems are transported to the landing or roadside. The slash is distributed over the harvesting site. In softwoods, trees can be topped down to 2 in (5 cm) top. However, topping generally occurs at a 2.8 in (7 cm) to 3.9 in (10 cm) top. Trees are most often skidded to roadside with grapple skidders. The tree-lengths are bucked to pulpwood and logs at roadside, or can be left as tree-lengths for tree-length hauling to the mill. The tree-length method is most applicable to final felling, and can be used in partial cutting (Pulkki 2002). The tree-length system consists of chain saw fellers or feller bunchers, delimbers/toppers, skidders and slashers.
General advantages of this method are much the same as for full-tree systems with the following additional advantages (Blinn et al. 2000):
- Limbs and tops are left in the stump area, reducing nutrient removal,
- it is well-suited to clearcutting and
- it may be applied during partial cutting where skid trails are wide and straight enough because trees are delimbed and topped at the stump.
2.4 Cut-to-length method
Cut-to-length (CTL) system produces different product form at roadside. It is a ground-based system in which felled trees are processed at the stump into defined log lengths. Characteristically, the CTL wood is transported to roadside on a forwarder, a machine that carries rather than drags wood (Fig. 4). CTL technology is advanced in

18
Scandinavia, where it is the state-of-the-art system for forest harvesting. Harvesters fell trees and process them through computerized harvester heads which delimb and buck trees to optimum product lengths. Eight-wheeled forwarders accumulate, sort and transport wood to the landing. In the studies the productivity and production costs have been practically equivalent with CTL and full-tree logging methods in a pine thinning site (USDA Forest Service�s Southern Research Station 2002).
General advantage of the CTL system are (Blinn et al. 2000):
- It is suitable for thinning and generation fellings,
- it can work efficiently in small tracts because there are only two machines to move between stands,
- minimal landing space is required,
- it is well-suited to thinning because it processes the harvested trees to shortwood lengths at the stump, minimizing damage to the residual stand and reducing nutrient removal,
- skid trails do not have to be created and the trails used can be narrow and meandering,
- the equipment work well in wet areas and on sensitive sites because of its capability to work on a slash mat it produces as it moves through the stand,
- forwarders can work economically over longer distances because of the longer loads they can carry, reducing the needed road network, and
- the system facilitates product sorting and merchandising.
Figure 4. Harvesting chain of cut-to-length system � harvester (left) and forwarder (right) (Timberjack 2002).

19
2.5 Summary of timber harvesting technologies
There are three main logging methods in the USA and Finland. In the USA the main methods are whole-tree and tree-length methods. In Finland the exclusive method is cut-to-length logging method.
In the whole-tree logging method trees are felled at the stump and skidded to roadside for delimbing and/or processing and stocking. In tree-length logging method trees are felled and delimbed at the stump and the stems are transported to the landing or roadside. In both of these methods the cross-cutting of the stems takes place at the landing or at the mill. In cut-to-length method the trees are felled, delimbed and cross-cut at the stump and the products are hauled to the roadside where they are stocked.

20
3. Forest residues for fuel in the USA
3.1 Wood resources for fuel in the USA
3.1.1 Wood resources in the USA
Forest and timber land
About 33 % of the USA land area, or 747 million acres (302 million hectares), is forest land. About 52 million acres (21 million hectares) (about 7 percent of all USA forest land) is reserved from commercial timber harvesting. About 504 million acres (204 million hectares) of forest land (67 % of all forest) is classified as timberland � forest land capable of producing in excess of 20 cubic feet per acre per year and not legally withdrawn from timber utilization (Smith et al. 2002). About 54 million acres (11 % of timberland) are planted origin. About 58 percent of the volume of growing stock is softwoods, and the remaining 42 % is hardwoods (Smith et al. 2002).
For the USA as a whole, private individuals and firms own 71 % of all timberland. Federal, State and other public owners account for the remaining 29 %. Private lands are concentrated in the eastern part of the country and public lands are mainly in the West (Smith et al. 2002).
The forests of the USA are very diverse in composition and distribution � from the oak-hickory and maple-beech-birch forests that dominate the North to the expansive pine forests of the South and ponderosa pine forests of the West (USDA Forest Service 2002).
Forestland is widely distributed. The timberland area in North region is 159 million acres (64 million ha), in South region it is 201 million acres (81 million ha) and in West region it is 143 million acres (58 million ha) (USDA Forest Service 2002). Seventy-two percent of the total Nation�s timberland is in the Eastern United States. In the West, timberland is a smaller segment of the total forest area than in the East. The greatest percentage of forest cover is in Maine (90 %) and the lowest in North Dakota (1 %) (Smith et al. 2002) (Fig. 5).

21
Figure 5. The forest regions in USA (left) and forestland area and class by region (right). North region: Connecticut, Delaware, Maine, Maryland, Massachusetts, New Hampshire, New Jersey, New York, Pennsylvania, Rhode Island, Vermont, West Virginia, Illinois, Indiana, Iowa, Michigan, Minnesota, Missouri, Ohio and Wisconsin. South region: Florida, Georgia, North Carolina, South Carolina and Virginia, Alabama, Arkansas, Kentucky, Lousiana, Mississippi, Oklahoma, Tennessee and Texas. West region: Montana, Idaho, Wyoming, Utah, Colorado, Arizona and New Mexico, North Dakota, South Dakota, Nevada, Kansas, California, Hawaii, Washington, Oregon and Alaska (USDA Forest Service 2002).
Roundwood and forest residue removals
The removals from the timberland area are classified into three categories: products from growing stock and other sources (1), logging residues from growing stock and other sources (2) and other removals (3).
According to recent reports, harvesting area in the United States is approximately 10 million acres (4 million ha) per year and approximately 62 % of the area is selective cutting and 38 % final felling (USDA Forest Service 2002).
The total removals from the timberland in the USA was 21 190 million cubic feet (602 million m3) in 1996. The share of roundwood was 16 430 million cubic feet (467 million m3), logging residues 3 373 million cubic feet (96 million m3) and other removals 1 390 million cubic feet (39 million m3). The share of saw logs was 43 % and pulpwood 33 % of the roundwood products. 24 % of the roundwood was used for other products (Smith et al. 2002).

22
Logging residue are materials removed from growing stock and from other sources in the process of timber harvesting, which are left unutilized at the harvesting site. Logging residues from growing stock consist mainly of the limbs. Logging residues from other sources consist of downed dead and cull trees, tops above the 4-inch growing-stock top and smaller than 5 inches (12.7 cm) dbh, but excludes limbs and stumps (Smith et al. 2002).
Other removals from timberland area consist of growing stock cut and are burned or otherwise destroyed in the process of converting forest land to nonforest uses (Smith et al. 2002).
3.1.2 Forest residues potential for fuel
Forest residue resources
Figure 6 presents how different parts of a tree can be utilized for different purposes. The biggest and best sawlogs go to sawmills, the small logs go to pulp and paper industry and the branches can be used for fuel in power plants.
Logging residues are divided into two categories: forest residues from harvesting sites and forest residues from timberland converting into nonforest use. Logging residues are divided into growing and non-growing residues. Growing residues consist mainly of the limbs. Non-growing residues consist of tops of the trees, trees smaller than 5 inches dbh (12.7 cm) and the dead and cull trees (Smith et al. 2002).
The total amount of logging residue, from timber harvesting in the USA was 71.5 million dry short tons (311.7 TWh, 50 w-%) in 1996 (Table 1 & App. 5). This figure includes all the logging residues from harvesting sites and on timberland areas converted to other use (Smith et al. 2002). The share of logging residues from the timberland areas converted to other use is greatest in the South region. The share of logging residues from harvesting sites is 71 %, the rest 29 % is forest residues from timberland converted to other use.
The biggest logging residue volume built up in the South region (40.4 million dry short tons) and in the North region (23.5 million dry short tons). Also a lot of forest residue volume (7.6 million dry short tons) were built in the West region and there especially in the West coast (Smith et al. 2002).

23
Figure 6. Using all the parts of a tree; tops, limbs and small and cull trees are utilized for fuel (Marker & Penny 1999).
Forest residue potential
The whole logging residue volume is not possible to be utilized for fuel because of the harvesting costs constraints. Harvesting costs depend among other things on the volume yield of the stand, terrain conditions, harvesting equipment and long distance transport. The annual potential of forest residues available in subregions and regions for three price scenarios are presented in Table 1. The prices include all working phases of forest residue chips from the stand to the power plant and are in 1995 dollars. The polewood from thinnings is not included in the potential (Walsh et al. 2000).
The highest potential of forest residues is naturally in the South and North regions. There is also potential for forest residue in the West region�s coast. The price of forest residue fuel chips at power plants is at the moment less than 30 $/dry ton (6.9 $/MWh, 50 w-%). It is estimated that 23.8 million dry short ton (103.8 TWh, 50 w-%) of forest residues per year is available for fuel at delivery price of less than 30 $/dry short ton. The potential is distributed for the regions as follows: 10.1 million dry short tons for the South Region, 7.7 million dry short tons for the North region and 6.0 for the West region. The total forest residue potential is 34.7 and 44.8 million dry short tons (151.3 and 195.3 TWh, 50 w-%) per year at the price of less than 40 and 50 dollars per dry short ton respectively (Smith et al. 2002, Walsh et al. 2000).

24
Table 1. Total logging residue removals and forest residue potential in the USA (Smith et al. 2002, Walsh et al. 2000). Removals with TWh and cost with $/MWh are presented in 50 w-% moisture content.
Region Total logging
residue removals
(1996)
Million Odt1
(TWh, 50 w-%)
Forest residue potential
Million Odt (TWh)
Cost < 30 $/Odt
(<6.9 $/MWh)
Forest residue potential
Million Odt (TWh)
Cost < 40 $/Odt
(<9.2 $/MWh)
Forest residue potential
Million Odt (TWh)
Cost < 50 $/Odt
(<10 $/MWh)
North
South
West
23.5 (102.5)
40.4 (176.1)
7.6 (33.1)
7.7 (33.6)
10.1 (44.0)
6.0 (26.2)
11.1 (48.4)
14.7 (64.1)
8.9 (38.8)
14.3 (62.3)
18.9 (82.4)
11.6 (50.6)
USA total 71.5 (311.7) 23. 8 (103.8) 34.7 (151.3) 44.8 (195.3)
1 Odt = dry short ton
Polewood potential
Polewood has also a great potential for bioenergy. Pole tree is a young tree that is not suitable for sawlog. Pole tree is at least 4 inches (10.2 cm) and less than 8 in (20.3cm ) to 12 inches (30.5 cm) in d.b.h. After removal of the bark it is suitable for power poles or for simple building work. Polewood has not been included in the potential presented above due to the fact that it could potentially be left to grow to be used for higher value. It is doubtful if these trees will be harvested for energy use. However, if harvested, they could add another 17.0 million dry short tons (74.1, 50 w-% TWh) at less than 30 $ per dry short ton delivered; 37.7 million dry short tons (164.4 TWh, 50 w-%) at less than 40 $ per dry short ton delivered and 65.0 million dry short tons (283.4 TWh, 50 w-%) at less than 50 $ per dry short ton delivered (Walsh et al. 2000).
3.1.3 Short rotation woody crop potential
SRWC crops
Short rotation woody crops (SRWC) are fast growing trees. Short-rotation woody crop plantations are, in essence, large tree farms. They consist of a file of trees to be cared and harvested like any other crop. The research and development work with SRWC has started in the early 1970s by the USA Department of Agriculture Forest Service. The target of the R&D work has been to grow SRWC for the production of bioenergy (heat, power and transportation fuels, etc.), fiber (paper, pulp, etc.) and other biobased products. With the help of SRWC it is possible to increase the feedstock available for these purposes.

25
Poplar
The most common SRWC species is hybrid poplar. With the exception of the more arid regions, hybrid poplars can be produced throughout most of the continental USA. Hybrid poplar is a member of the willow family and is closely related to cottonwood and aspens.
Hybrid poplar stands are typically planted at wide spacings ranging from 300�700 trees per acre (750�1750 trees/ha), depending on geographical location, soil type, and end-use needs. The time to achieve the harvestable size at 8 inch (20.3 cm) d.b.h. is 6�7 years (De La Torre Ugarte et al. 2000). Hybrid poplars, when grown under short-rotation silviculture, can produce between 4 and 10 dry short tons of wood per acre per year (10�25 dry short ton per hectare). Although hybrid poplars are capable of resprouting from their rootstocks after the harvest, reestablishment is recommended. In 1996, the planted area of hybrid poplars and cottonwoods in the USA was about 90 000 acres (36 400 ha) (Oak Ridge National laboratory 2001). The total SRWC area in North America was 117 575 acres (47 600 ha) in 1996. In 2002 the SRWC area in North America is about 151 000 acres (Wright 2002). Commercial plantings, aimed mainly to produce pulpwood, have been established in the Pacific Northwest, the Midwest, the Lakes States and the Southeastern USA (Oak Ridge National laboratory 2001).
Eucalyptus
Eucalyptus as SRWC is commonly grown in California. Harvesting rotation in California for eucalyptus trees is 6�12 years. The annual yield in an eucalyptus stand in regeneration felling is 4�10 dry short tons of wood per acre (9�22 dry metric ton per hectare) (ORNL 2001).
Potential
It has been calculated that the potential growing area of hybrid poplar in the USA would be 7.1 million acres (2.9 million ha) at the farmgate crop price of 32.90 $ per dry short ton (7.5 $/MWh, 50 w-%). This is equal to 35.5 million dry short tons (154.8 TWh, 50 w-%). The production costs consist of growing harvesting costs at the plantation site. This estimation is based on the wildlife management scenario in order to achieve high wildlife diversity. In the study the production of hydrid poplar is assumed to occur in agricultural croplands. Thus hybrid poplar must compete economically with other bioenergy crops and with traditional crops. In the production management scenario hybrid poplar is not economical in order to achieve high biomass yield. The harvesting costs of eucalyptus consist of cultivation and harvesting costs at the plantation site (De La Torre Ugarte et al. 2000).

26
3.1.4 Summary of forest fuel potential
Forest fuel potential consists of logging residues, small wood and short rotation woody crops. In 1996, roundwood products from all domestic sources in the USA totalled 16 430 million ft3 (467 million m3). In timber harvesting it was 71.5 million dry short ton of forest residues.
The forest residue potential in the USA is 23.8 million dry short tons (103.8 TWh, 50 w-%) of forest residues per year at delivery price of less than 30 $/dry short ton (6.9 $/MWh in 50 % moisture content) (Table 2). The total forest residue potential is 34.7 and 44.8 million dry short tons (151.3 and 195.3 TWh, 50 w-%) per year at the price of less than 40 $ (9.2 $/MWh) and 50 $ per dry short ton (11.5 $/MWh) respectively in the USA. The highest potential of forest residues is naturally in the South and in the North regions. There is also potential for forest residues in the West region�s coast.
Smallwood (polewood), if harvested for fuel, has a potential of 17.0 million dry short tons (74.1 TWh, 50 w-%) at less than 30 $ per dry short ton delivered; 37.7 million dry short tons (164.4 TWh, 50 w-%) at less than 40 $ per dry tons delivered and 65.0 million dry tons (283.4 TWh, 50 w-%) at less than 50 $ per dry ton delivered.
It has been calculated that the potential growing area of hybrid poplar in the USA would be 7.1 million hectares (2.9 million ha) at the price of 32.90 $ per dry short ton (7.5 $/MWh). This is equal to 35.5 million dry short tons (154.8 TWh).
Altogether the forest residue and SRWC potential for fuel would be 76.3�145.3 dry short ton per year depending on the price of the chips at the plant (30�50 $/dry short ton).
Table 2. Forest fuel potential in the USA (Walsh et al. 2000 & De La Torre Ugarte et al. 2000). Forest fuel potential in TWh and price in $/MWh are presented in 50 % moisture content.
Wood fuel potential, Million dry short tons per year (TWh)
Delivered price
< 30 $/Odt
(<6 $/MWh, 50 w-%)
Delivered price
< 40 $/Odt
(<8 $/MWh, 50 w-%)
Delivered price
< 50 $/Odt
(<10 $/MWh,50 w-%)
Logging residues
Smallwood
SRWC
23.8 (103.8)
17.0 (74.1)
35.51 (154.8)
34.7 (151.3)
37.7 (164.4)
35.51 (154.8)
44.8 (195.3)
65.0 (283.4)
35.51 (154.8)
Total 76.3 (332.7) 107.9 (470.5) 145.3 (633.5) 1 Delivery price 32.9 $ per dry short ton.
27
3.2 Forest residue consumption in the USA
3.2.1 Energy consumption
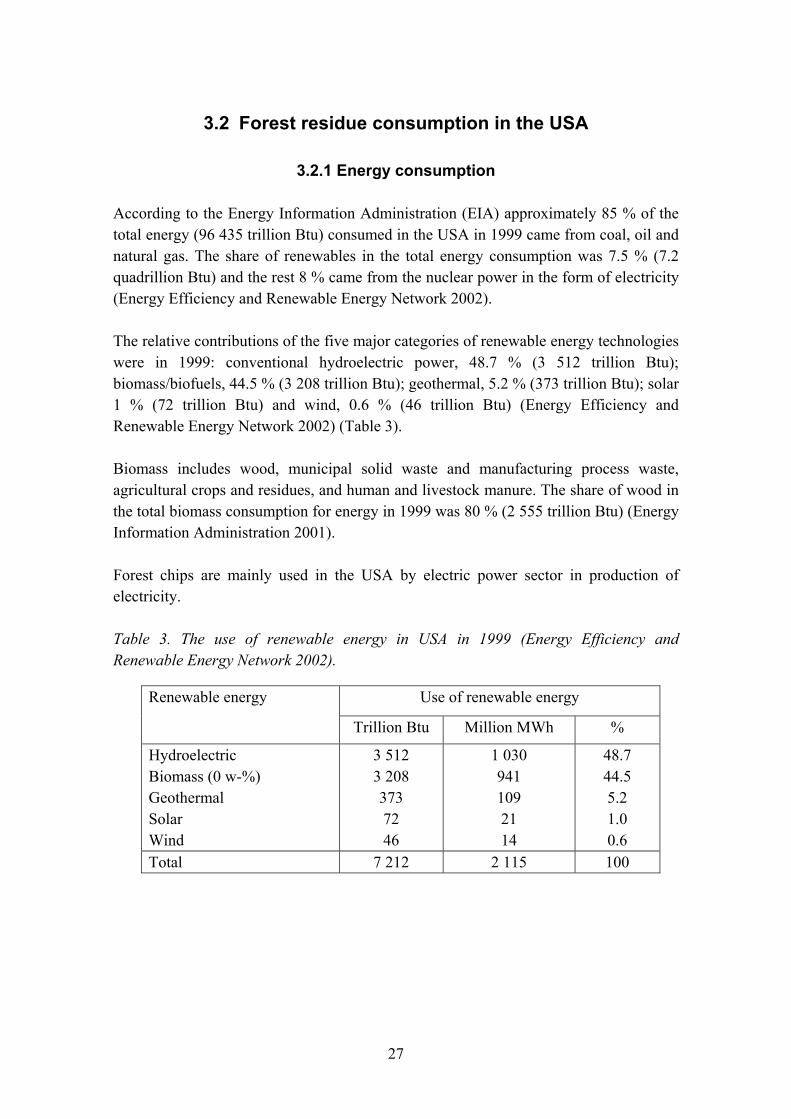
According to the Energy Information Administration (EIA) approximately 85 % of the total energy (96 435 trillion Btu) consumed in the USA in 1999 came from coal, oil and natural gas. The share of renewables in the total energy consumption was 7.5 % (7.2 quadrillion Btu) and the rest 8 % came from the nuclear power in the form of electricity (Energy Efficiency and Renewable Energy Network 2002).
The relative contributions of the five major categories of renewable energy technologies were in 1999: conventional hydroelectric power, 48.7 % (3 512 trillion Btu); biomass/biofuels, 44.5 % (3 208 trillion Btu); geothermal, 5.2 % (373 trillion Btu); solar 1 % (72 trillion Btu) and wind, 0.6 % (46 trillion Btu) (Energy Efficiency and Renewable Energy Network 2002) (Table 3).
Biomass includes wood, municipal solid waste and manufacturing process waste, agricultural crops and residues, and human and livestock manure. The share of wood in the total biomass consumption for energy in 1999 was 80 % (2 555 trillion Btu) (Energy Information Administration 2001).
Forest chips are mainly used in the USA by electric power sector in production of electricity.
Table 3. The use of renewable energy in USA in 1999 (Energy Efficiency and Renewable Energy Network 2002).
Use of renewable energy Renewable energy
Trillion Btu Million MWh %
Hydroelectric Biomass (0 w-%) Geothermal Solar Wind
3 512 3 208 373 72 46
1 030 941 109 21 14
48.7 44.5 5.2 1.0 0.6
Total 7 212 2 115 100
28
3.2.2 Consumption of wood fuel
Wood use for energy
Wood biomass includes fuel chips from forestry operations (forest chips), residues from sawmills and furniture mills, residues from pulp and paper mills (black liquor) and firewood for residential and commercial space heating.
The wood electricity generating capacity in the USA was about 7 500 MW in 1999 (Bain & Overend 2002).
In the USA the use of wood-derived fuels has increased slightly during the last few years. The energy content of wood-derived fuels production was 2 314 trillion Btu in 1994, 2 350 trillion Btu in 1997 and 2 555 trillion Btu in 1999 (Energy Information Administration 2001). The share of wood was 80 % of the biomass consumption and 2.7 % of the total energy consumption in the USA in 1999.
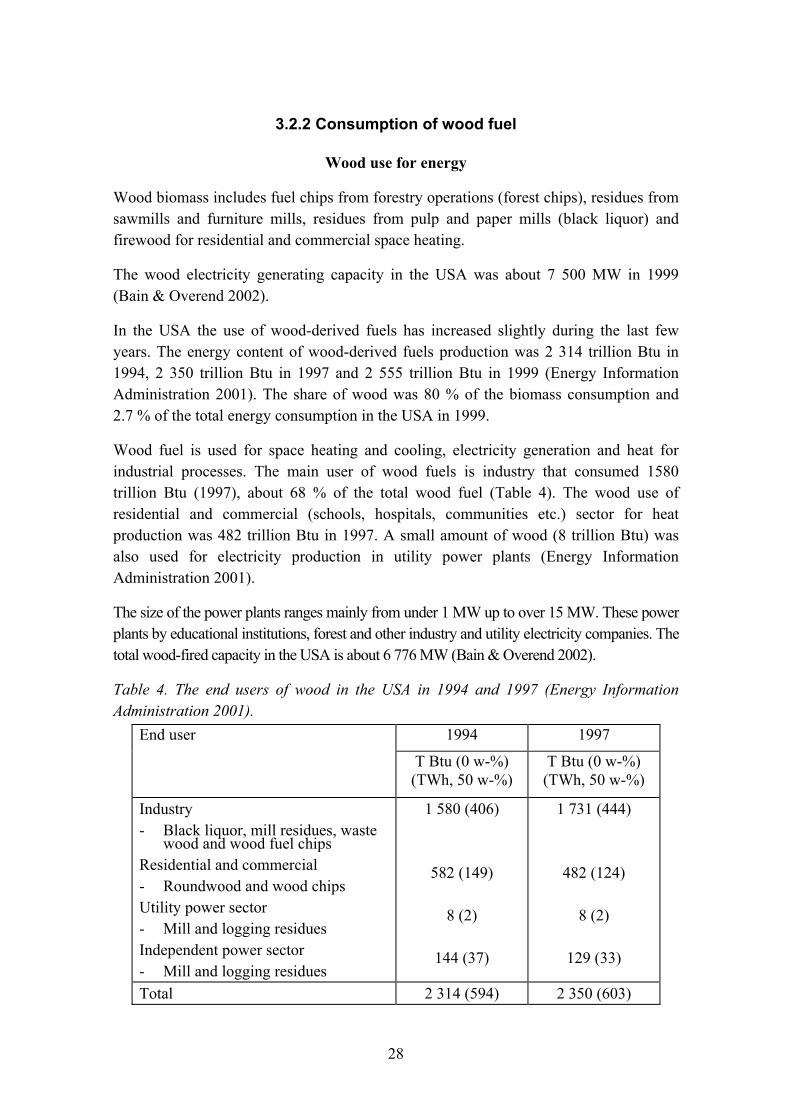
Wood fuel is used for space heating and cooling, electricity generation and heat for industrial processes. The main user of wood fuels is industry that consumed 1580 trillion Btu (1997), about 68 % of the total wood fuel (Table 4). The wood use of residential and commercial (schools, hospitals, communities etc.) sector for heat production was 482 trillion Btu in 1997. A small amount of wood (8 trillion Btu) was also used for electricity production in utility power plants (Energy Information Administration 2001).
The size of the power plants ranges mainly from under 1 MW up to over 15 MW. These power plants by educational institutions, forest and other industry and utility electricity companies. The total wood-fired capacity in the USA is about 6 776 MW (Bain & Overend 2002).
Table 4. The end users of wood in the USA in 1994 and 1997 (Energy Information Administration 2001).
1994 1997 End user
T Btu (0 w-%) (TWh, 50 w-%)
T Btu (0 w-%) (TWh, 50 w-%)
Industry - Black liquor, mill residues, waste
wood and wood fuel chips Residential and commercial - Roundwood and wood chips Utility power sector - Mill and logging residues Independent power sector - Mill and logging residues
1 580 (406)
582 (149)
8 (2)
144 (37)
1 731 (444)
482 (124)
8 (2)
129 (33)
Total 2 314 (594) 2 350 (603)

29
3.2.3 End users of wood fuel
Forest industry
Forest industry is the main user of the forest fuel in the USA. Wood used for energy in forest industry can be divided into black liquor, residues from mill processing, waste wood and wood harvested directly from forest. Black liquor contains also pulping liquor. Wood residues and byproducts from mill processing contains sawdust, shavings, slabs and bark. Wood harvested directly from forest contains roundwood and wood chips. Wood waste consists of scrap, wastepaper, wood pallets, and packing materials.
The most recent accurate data of wood fuels consumption is from 1994. At that time over one third (40 %) of the wood-derived fuels was waste liquors (882 trillion Btu) from pulping industry. Black and pulping liquors are utilized for energy in pulp and paper and paperboard mills. The processing residues amounted 503 trillion Btu (29.6 million dry short tons). They are utilized in sawmills and wood products companies. The use of wood harvested directly from forest was also quite high in 1994, 189 trillion Btu (11.1 million dry short tons). It was mainly used in paper and pulp mills (80 %) and the rest was used in sawmills and wood products companies. The share of wood waste for energy was 37.0 trillion Btu (2.2 million dry short tons) (Energy Information Administration 2002d). The black liquors and industrial wood waste from forest industry are at the moment totally utilized mainly for fuel (Walsh 2000) (Table 5).
The majority of the wood fuelled power plants in forest industry are cogeneration plants, which produce both heat and electricity. The power-to-heat production ratio for a conventional back-pressure turbine cogeneration system ranges from 42�63 kWh/293 kWh, which is relatively matched to the steam and electricity needs at older craft mills (Nilsson 2002). The wood electricity production capacity in the pulp and paper industry is about 5000 MW. There are also a lot of power plants in forest industry producing only heat and process steam without electricity production. The number of boilers is about 2 393 in pulp and paper industry (U.S. Pulp and Paper Industry 1997). Most of them are wood fired power boilers.
The leading States for wood nonutility net generation and net summer capacity are Maine (725 MW), California (669 MW), Alabama (694 MW), Lousiana (449 MW), Florida (421 MW) and Virginia (443 MW) (Energy Information Administration 2001).

30
Table 5. Wood energy consumption in industry by source in the USA in 1994 (Walsh 2002, Energy Information Administration 2002d).
Source 1994 Million
Dry short ton Trillion Btu
0 w-% TWh
50 w-% Black and pulping liquor Residues from mill processing - Sawdust, shavings, slabs and bark Waste wood - Scrap, wood pallets etc. Wood harvested directly from trees - Roundwood, wood chips and bark
29.6
2.23
11.1
882.0 503.2
37.43
188.7
226.4 129.2
9.6
48.4
Total 1 611.31 413.6 1 Differs from the figure (1 580 trillion Btu) presented in the reference by Energy Information Administration 2001.
Electric power sector
Wood fuel use in electric power sector was 8.1 million dry short tons in 1997 (Table 6). Types of wood fuels used in electric power sector are mill processing and forest residues. Electric power sector is the main user of forest residues for fuel.
The wood electricity generating capacity in the USA was about 7 500 MW in 1999 (Bain & Overend 2002). In 1999 wood fuelled electric net summer power capacity was 6 795 MW(Energy Information Administration 2003). The number of the wood fuelled power plants is more than 350 in the USA. The commercial and industrial sector had the greatest electric net summer capacity (4 957 MW) in 1999. The electric net summer capacity at the electric power sector was 1 838 MW (Energy Information Administration 2003).
The capacity of electric power plants is between 15 and 75 MWe. The average of the boiler size is 20 MWe, they are direct-fired systems and normally equipped with travelling grate spreader stoker boiler. The efficiency is relatively low, 20�25 % (Bain & Overend 2002).
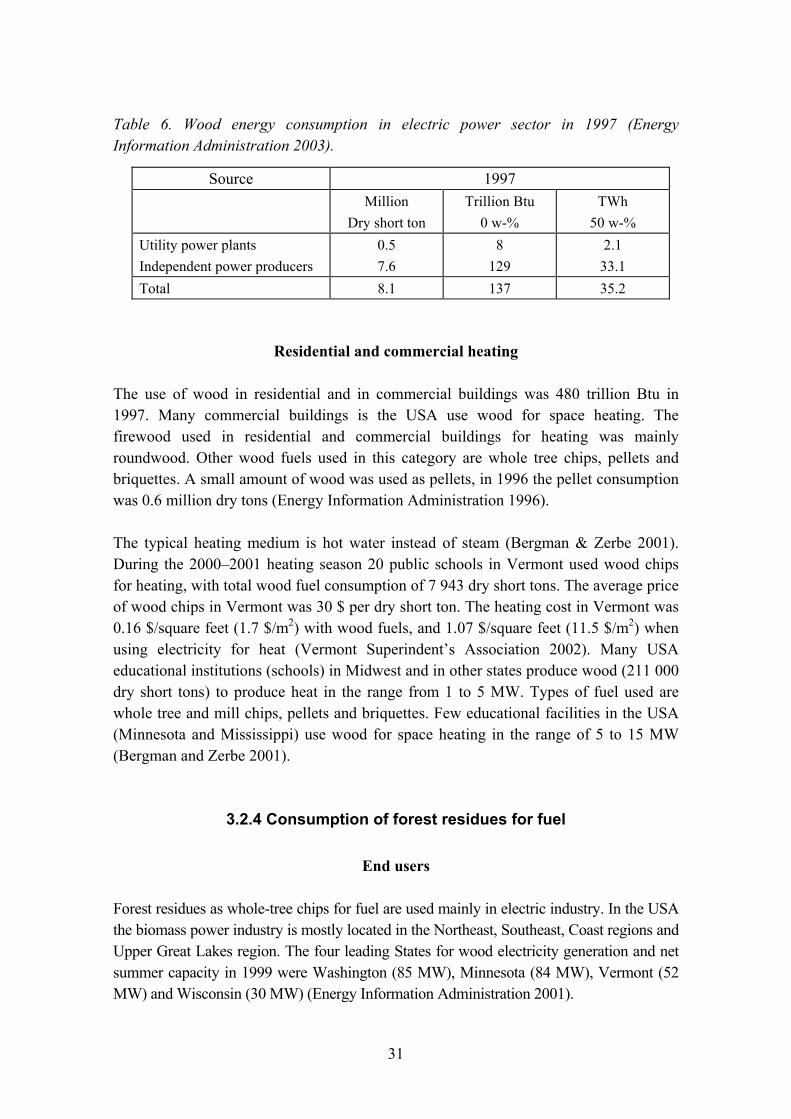
31
Table 6. Wood energy consumption in electric power sector in 1997 (Energy Information Administration 2003).
Source 1997 Million
Dry short ton Trillion Btu
0 w-% TWh
50 w-% Utility power plants Independent power producers
0.5 7.6
8 129
2.1 33.1
Total 8.1 137 35.2
Residential and commercial heating
The use of wood in residential and in commercial buildings was 480 trillion Btu in 1997. Many commercial buildings is the USA use wood for space heating. The firewood used in residential and commercial buildings for heating was mainly roundwood. Other wood fuels used in this category are whole tree chips, pellets and briquettes. A small amount of wood was used as pellets, in 1996 the pellet consumption was 0.6 million dry tons (Energy Information Administration 1996).
The typical heating medium is hot water instead of steam (Bergman & Zerbe 2001). During the 2000�2001 heating season 20 public schools in Vermont used wood chips for heating, with total wood fuel consumption of 7 943 dry short tons. The average price of wood chips in Vermont was 30 $ per dry short ton. The heating cost in Vermont was 0.16 $/square feet (1.7 $/m2) with wood fuels, and 1.07 $/square feet (11.5 $/m2) when using electricity for heat (Vermont Superindent�s Association 2002). Many USA educational institutions (schools) in Midwest and in other states produce wood (211 000 dry short tons) to produce heat in the range from 1 to 5 MW. Types of fuel used are whole tree and mill chips, pellets and briquettes. Few educational facilities in the USA (Minnesota and Mississippi) use wood for space heating in the range of 5 to 15 MW (Bergman and Zerbe 2001).
3.2.4 Consumption of forest residues for fuel
End users
Forest residues as whole-tree chips for fuel are used mainly in electric industry. In the USA the biomass power industry is mostly located in the Northeast, Southeast, Coast regions and Upper Great Lakes region. The four leading States for wood electricity generation and net summer capacity in 1999 were Washington (85 MW), Minnesota (84 MW), Vermont (52 MW) and Wisconsin (30 MW) (Energy Information Administration 2001).

32
In the Table 7 it is presented some electric power plants that use forest residues for fuel. The consumption of these power plants of forest chips for fuel is 2.5�3.5 million dry short tons. If we take into account all these kind of power plants the consumption of forest chips is bigger.
Forest residues are used for fuel at the most in Pacific coast, Northeast and in Greatlakes areas. Forest residues are used for fuel among other things in California in Pacific coast, in Montana in Rocky Mountain, in Vermont, Maine, New Hampshire, New York in Northeast and in Michigan in Great lakes (Table 7).
California is one of the leading states where wood is used for fuel. Biomass energy production has become an important component of the State�s environmental infrastructure, diverting solid wastes from open burning and disposal in landfills to a beneficial-use application.
California�s biomass energy industry currently consists of 29 operating power plants located throughout the state, representing a total 600 MW of generating capacity. This is nearly 10 percent of the total electric capacity in USA. These facilities are converting more than 6.4 million tons per year of biomass into electricity. The use of forest residues for fuel in California is estimated to be 2�3 million dry short tons per year. The operating facilities and their fuel supply infrastructure directly employ about 2 000 people, providing valuable rural employment and economic development opportunities across the state (Morris 1999a).
One of the power plants in California that use forest residues for fuel is Shasta Energy Company in Anderson (Energy Information Administration 1997). The plant has three boilers. The plant became operational in 1987. The net electric production capacity is 50 MW. The plant processes about 750 000 green tons of mill waste and forest residues from Shasta County and surrounding areas (about 375 000 dry short tons). The use of forest residues is 150 000 dry short tons per year. It comes from thinnings and clear cutting stands.
There are 48 facilities that are permitted to use wood waste, hog fuel and forest residues as fuel in Montana. Approximately 25 to 30 of these are larger wood products facilities such plywood plants, particle board plants, a paper mill and pellet plants. For year 2001 there were 350 000 dry short tons used of wood residues in Montana for industrial use. A portion of 10 to 15 % of this was forest residues (Haines 2002).
There are currently 19 wood-fired power plants in operation in the Northeast. The facilities range from 7.5 MW to 50 MW and have combined capacity 374 MW. Sixteen of the plants are located in Maine, New Hampshire and Vermont. One plant is located in
33
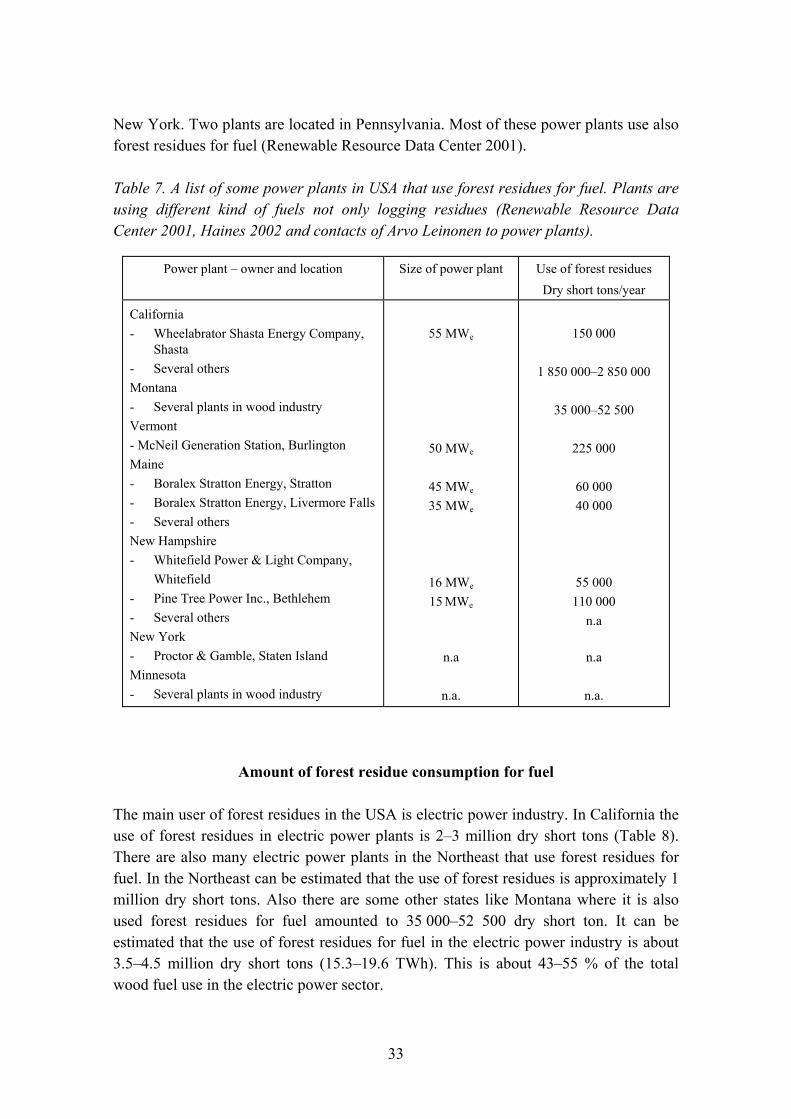
New York. Two plants are located in Pennsylvania. Most of these power plants use also forest residues for fuel (Renewable Resource Data Center 2001).
Table 7. A list of some power plants in USA that use forest residues for fuel. Plants are using different kind of fuels not only logging residues (Renewable Resource Data Center 2001, Haines 2002 and contacts of Arvo Leinonen to power plants).
Power plant � owner and location Size of power plant Use of forest residues Dry short tons/year
California - Wheelabrator Shasta Energy Company,
Shasta - Several others Montana - Several plants in wood industry Vermont - McNeil Generation Station, Burlington Maine - Boralex Stratton Energy, Stratton - Boralex Stratton Energy, Livermore Falls - Several others New Hampshire - Whitefield Power & Light Company,
Whitefield - Pine Tree Power Inc., Bethlehem - Several others New York - Proctor & Gamble, Staten Island Minnesota - Several plants in wood industry
55 MWe
50 MWe
45 MWe 35 MWe
16 MWe
15 MWe
n.a
n.a.
150 000
1 850 000�2 850 000
35 000�52 500
225 000
60 000 40 000
55 000 110 000
n.a
n.a
n.a.
Amount of forest residue consumption for fuel
The main user of forest residues in the USA is electric power industry. In California the use of forest residues in electric power plants is 2�3 million dry short tons (Table 8). There are also many electric power plants in the Northeast that use forest residues for fuel. In the Northeast can be estimated that the use of forest residues is approximately 1 million dry short tons. Also there are some other states like Montana where it is also used forest residues for fuel amounted to 35 000�52 500 dry short ton. It can be estimated that the use of forest residues for fuel in the electric power industry is about 3.5�4.5 million dry short tons (15.3�19.6 TWh). This is about 43�55 % of the total wood fuel use in the electric power sector.

34
Several commercial buildings use forest residues for fuel for heat production. However it is quite small compared to the use of forest residues in electric power sector.
In forest industry there is not any information about the use of forest residues for fuel. They use wood chips that are made directly from wood (11.1 million dry short tons). Wood harvested directly from forest contains roundwood, wood chips and bark. These wood chips are not read directly as forest residue chips.
Table 8. Forest residue consumption for fuel in the USA.
1999 User Trillion Btu
(0 w-%) Million dry short tons
TWh (50 w-%)
Forest industry Electric power plant Residential and commercial
n.a 59.4�76.4
n.a.
n.a. 3.5�4.5
n.a.
n.a 15.3�19.6
n.a. All together 59.4�76.4 3.5�4.5 15.3�19.6
3.2.5 Wood fuel chips quality properties
There are two kind of fuel chips in USA: whole-tree chips and round-wood chips. Whole-tree chips are made in the forest from the entire tree. Round-wood chips are made from tree trunks. The whole-tree chips are mainly used in large scale. Round-wood chips are used in small scale for instance in municipal buildings for heat.
The main operational quality criteria of logging residue chips are:
- moisture content
- heating value
- density and
- particle size distribution.
Moisture content
The moisture of green wood varies from 39 to 53w-% (wet basis) (Cheremisinoff 1980). Sycamore has the highest moisture content (53 w-%) in green wood and beech has the lowest moisture content (35 w-%). The moisture content of wood fuel chips ranges from 40 to 60 w-% (Badger 2002) (Table 9).

35
Heating value
The effective heating value of different wood species varies from 16.0 million Btu (18.6 MJ/kg) to 17.2 million Btu (20 MJ/kg) per dry short ton (Cheremisinoff 1980). Loblolly pine has the highest effective heating value and red maple has the lowest. The average effective heating value of wood chips is 17.0 million Btu per dry short ton (19.8 MJ/kg) (Energy Information Administration 2001d). When the moisture content increases from 40 w-% to 60 w-% the average energy content of wood chips decreases from 9.3 million Btu/short ton (10.8 MJ/kg) to 6.0 million Btu/short ton (6.9 MJ/kg). The net heating value of whole tree chips in 50 % moisture content is 7.5 Mbtu/dry short ton (8.7 MJ/kg). The energy density of whole tree chips is 0.06�0.09 Mbtu/loose-ft3 (0.6�0.9 MWh/loose-m3).
Particle size of wood chips
The target size of whole-tree and round-wood chips is 1 x 1 x 0.3 in (25 x 25 x 8 mm). In the production of whole-tree chips, small branches and limbs are not reduced to sizes comparable with standard chips. Round-wood chips are more consistent in size (Badger 2002).
Density
The dry density of wood and bark for eastside USA varies from 23 (368 kg/m3) to 36 lb/cubic feet (575 kg/m3) and average dry basic density is 29.6 lb/ft3 (473 kg/m3). The green density varies from 43 lb/ft3 (687 kg/m3) to 65 lb/ft3 (1039 kg/m3) and average green density is 54.3 lb/ft3 (868 kg/m3) (USDA Forest Service 1997). The density of hardwood is higher than softwood.
The bulk density of green chips varies with species. It is reported that the results of a series of trials measuring the density of a number whole-tree chipped species, with moisture content from 41 to 52 %. The bulk density of these chips ranges from 15.5 lb/loose-ft3 (248) kg/loose-m3) to 22.7 lb/loose-ft3 (363 kg/loose-m3) (Angus-Hankin et al. 1995).
Ash content
The ash content of wood of different tree species varies from 0.1 to 2.0 %. Cedar has the highest ash content and Douglas Fir has the lowest. Bark contains more ash than wood (Cheremisinoff 1980). The ash content of whole-tree chips is in the range of one percent (Badger 2002). The skidding harvesting technology increases the ash content of whole tree chips.

36
Table 9. Some properties of wood and wood fuel chips in the USA (Badger 2002, Angus-Hankin et al. 1995, USDA Forest Service 1997).
Range for wood Average or interval for whole tree chips
Moisture content, % Effective heating value, - MBtu/dry short ton, MJ/kg Net heating value (mc. 50 w-%), - MBtu/dry short ton (MJ/kg) Ash content, % Wood dry density, lb/ft3 (kg/m3) Wood green density, lb/ft3 (kg/m3) Green bulk density (mc. 41�52 %) - lb/loose-ft3 (kg/loose-m3) Energy density (mc. 40�50 w-%), - MBtu/loose-ft3 (MWh/m3)
39�53 16.0�17.2 (18.6�20.0)
6.9�7.6 (8.0�8.8)
0.1�2.0
23�36 (368�575) 43�65 (687�1039)
40�60 17.0 (19.8)
7.5 (8.7)
1
54.3 (868) 15.5�22.7 (248�363)
0.06�0.09 (0.6�0.9)
3.3 Harvesting technology of forest residues for fuel from natural stands
3.3.1 Wood yield in harvesting
Harvesting costs of timber and also of forest residues depend largely on the stand conditions, and equipment used for harvesting. The stand condition consists of stand size, tree size, yield per acre and terrain. Yield per hectare is an important factor and depends on the number and the size of the trees per acre and the tree species.
Forest cutting
Wood is harvested in the USA using either selective cutting (thinning) or clearcutting. Thinning is a process in which a certain number of trees is removed from a stand to increase the growing space for the rest of the timber. The reaction of trees to thinning depends on the species, age and condition of a tree. In general, young trees respond to thinning more than older trees. Pine trees respond well to thinning. Thinning is divided into pre-commercial and commercial thinnings. Trees cut in pre-commercial thinning have no commercial value. In commercial thinning it is possible to get timber from the wood that is removed. Commercial thinning is needed several times before clearcutting.

37
In clearcutting all merchantable timber is removed at one time (The University of Georgia College of Agricultural & Environmental Sciences. 2002). The annual average harvest area in the USA is about 10 million acres. The share of selective felling is 62 % of harvesting area and the share of clearcutting is 38 %. In South the share of final felling is bigger than in East and West (USDA Forest Service 2002) (Fig. 7, Table 10).
Average wood volume on timberland
Wood volume on timberland varies from about 1 250 cubic feet per acre (88 m3/ha) in South region to about 2 500 cubic feet per acre (175 m3/ha) in the West region. In the North region the volume is about 1 400 cubic feet per acre (98 m3/ha). If we assume that the average dry wood density (29.6 lb/cubic feet, 473 kg/m3) is valid, the volume (stem mass) on timberland varies from 18.5 dry short tons per acre (South) to 37 dry short tons per acre (West) (USDA Forest Service 2002).
Timber and forest residue yield
The yield achieved in harvesting varies largely depending on the stand characteristics, geographical location of the stand and how the stand is cut. The roundwood products, logging residues and other removals from growing stock and other sources in the USA was 21 190 million cubic feet (chapter 3.1.2) and annual harvest area 10 million acres. The average removal per acre from timberland in the USA in 1996 was so 2 120 cubic feet (148.8 m3/ha, 31.4 dry short tons/acre). This consisted of the average roundwood removal of 1 640 cubic feet per acre (115.1 m3/ha, 24.3 dry short ton/acre), the forest residue removal of 340 cubic feet per acre (23.9 m3/ha, 7.1 dry short ton/acre) and other removals 140 cubic feet per acre (9.8 m3/ha, 2.1 dry short ton/acre). The average percentage of forest residues was 23 % of the total removals in the USA in 1996 (Smith et al. 2002, USDA Forest Service 2002).
Stokes (1998) has measured the yield in loblolly pine thinnings and clearcutting. The total wood yield in a loblolly pine early thinning stand (13�15 years old) was 10.8 dry short tons per acre (51.2 m3/ha). Of this the share of roundwood was 71 % (7.7 dry short ton/acre) and the rest 29 % (3.1 dry short ton/acre) was logging residues. The total wood yield in a loblolly pine late thinning stand (16�18 years old) was 12.4 dry short tons per acre (58.8 m3/ha). The share of roundwood from this stand was 72 % (8.9 dry short ton/acre) and the share of logging residues the rest 28 % (3.5 dry short ton/acre). The total wood yield in a loblolly pine clearcutting satnd (23 years old) was 39.8 dry short tons per acre (188.8 m3/ha). The share of roundwood on this stand was 77 % (30.6 dry short tons/acre) and the rest 23 % (9.2 dry short tons/acre) was logging residues (Stokes 1998).

38
Hartsough et al. (1997) has measured the yield from thinning of a 35 years old ponderosa pine plantation and a 75�100 years old mixed conifer natural stand. The total average yield in thinning from the natural stand was 22.7 dry short tons per acre and from the plantation 22.2 dry short ton per acre using whole tree harvesting chain. The average amount of sawlog from the natural stand was 8.7 dry short tons per acre (38 %) and from the plantation 12.0 dry short ton per acre (54 %). The average amount of logging residues from the natural stand was 14.0 dry short ton per acre and from the plantation 10.2 dry short ton per acre. In this research the logging residues consisted mainly of stems of the non-merchantable small trees and trunks of the sawlog tops (Hartsough et al. 1997).
Timber and forest residue yield in practice
Bergman presents (Bergman & Zerbe 2001) that the total wood biomass may vary from 23.7�47.4 dry short tons per acre (112.3�224.8 m3/ha) depending on species, stocking and past harvest practices. Harvested tonnage could be third to half of the total amount or more.
The average wood biomass yield in commercial ponderosa pine thinning by Shasta Energy Company in California is about 22.5 dry short tons per acre (106.7 m3/ha) (Jolley 2002). The wood harvested from the stand by using whole tree harvesting technology were mainly chipped for fuel. A small amount of timber was made from the trees. The average wood biomass yield in commercial thinning made by McNeil Station in Maine varies from 10 to 25 dry short tons per acre (47�119 m3/ha). The share of timber and biomass for fuel vary (Bropelin 2002).
Figure 7. Average annual harvest area by method of harvest and the volume per acre on timberland in the USA (USDA Forest Service 2002).

39
Table 10. Total, timber and logging residues yields in different fellings in the USA (Hartsough et al. 1997, Stokes 1998, Bolding & Lanford 2001).
Stand Total removal Odt/acre (m3/ha)
Timber Odt/acre (m3/ha)
Forest residues Odt/acre (m3/ha)
(For. Res./total,%)
Whole timberland � thinning and clearcutting in the USA 1996
Typical natural Southern pine in the Southeastern USA with dense non-merchantable undergrowth4
Loblolly pine thinning (13�15 years)2 Loblolly pine thinning (16�18 years)2 Loblolly pine clearcutting (23 years)2 Mixed conifer thinning (75�100 years) Ponderosa pine thinning (35 years) Shasta energy company � thinnings3
McNeil Power plant � thinnings3
31.4 (148.8)
15.7 (74.5)
10.8 (51.2)
12.4 (58.8) 39.8 (188.8) 22.7 (107.7) 22.2 (105.3)
< 22.5 (106.7) 10�25 (47�119)
24.3 (115.1)
11.5 (54.6)
7.7 (36.5)
8.9 (42.2) 30.6 (145.2) 8.7 (41.3)
12.0 (56.9) n.a. n.a.
9.2 (33.7) (23)1
4.2 (19.9) (27)
3.1 (14.7) (29)
3.5 (16.6) (28) 9.2 (43.6) (23)
14.0 (66.4) (62) 10.2 (48.4) (46)
n.a. n.a.
1 Does not include other removals , 2 Stokes 1998, 3 Bropelin 2002 and 4 Bolding & Lanford 2001.
3.3.2 Forest residue harvesting methods for thinning and clearcutting
In the USA, three main methods are used for timber harvesting. They are whole-tree, tree-length and cut-to-length harvesting methods. The primary method is whole-tree method. The cut-to-length method is coming more widely used.
In the whole tree method, forest residues are left at the roadside landing, where they can easily be utilized at the landing for fuel. In tree-length and cut-to-length method the logging residues are left at the harvesting site. In these methods the logging residues must be hauled to the roadside landing before can be utilized for fuel.
3.3.3 The whole tree harvesting chain
The whole-tree harvesting chain consists of feller buncher, skidder, chipper and truck. Trees are cut using a feller buncher. It cuts and collects several small trees into the bunch with an accumulating head. Then the feller buncher hauls the tree bunch to the strip

40
roadside and compile bunches into a pile. Skidders are used to haul the whole trees to the landing at the roadside. At the landing, the trees are delimbed using e.g. stroke delimber. The logging residues are chipped and hauled to power plants using trucks (Fig. 8).
One whole tree thinning harvesting chain consists of one feller buncher, two skidders, one delimber/processor, a loader, a chipper and a chip trailer.
Figure 8. Principle of the whole tree � fuel chip harvesting chain (Arola & Miyata 1981).
3.3.3.1 Felling
Principle
Feller bunchers fell trees with felling head. There is so called accumulator pocket in the felling head, into which it is possible to gather several small trees to produce a bunch. After the felling, the feller buncher hauls the bunches to the roadside and puts them into a pile. The felling head is equipped with a shear or disc saw cutting device.
There are both rubber wheel and track feller bunchers (Fig. 9�10). Rubber wheel feller bunchers are also called drive-to-tree because these machines has fixed felling head and they must be driven to each tree to be felled. Track feller bunchers have the felling head at the end of a knuckle boom. Rubber wheel feller bunchers are generally faster than track feller bunchers. On the other hand track feller bunchers have better stability, longer reach of the boom which minimizes the need to move in the forest, and lower ground pressure than rubber wheel feller bunchers (Table 11).

41
Figure 9. Rubber wheeled feller buncher (left) and a ponderosa pine bunch at the roadside (right) at ponderosa pine thinning stand in New Mexico (photos by Arvo Leinonen).
Figure 10. Crawler feller buncher (left) and a bunch beside the striproad at the thinning site in Vermont (photos by Arvo Leinonen).
Manufacturers
There are several feller buncher manufactures in the world, e.g. John Deere, Volvo, Caterpillar, Timberjack, Timbco Hydraulics Inc., Tigercat, Barko Hydraulics and Blount.
Productivity
The productivity of a feller buncher depends largely on the stand conditions like the size and number of the trees, the hauling distance to the strip road and the terrain conditions like the slope. The average capacity of the Timbco T420 track feller buncher with shear was 12.8 dry short tons per productive hour (PH) and 8.3 dry short tons per scheduled hour when harvesting wood fuel in natural mixed conifer thinning stand (Hartsough et al. 1997). Timbco T420 is an older model which is not produced anymore. The new properties of the substitutive feller buncher Timbco T415-D are presented in the Table 11. More information of the natural mixed conifor stand in the study can be found in the chapter 3.3.1.

42
USDA Forest Service (USDA Forest Service 2000c) has measured an average productivity of 134 merchantable green tons per productive hour (PH) for a Tigercat 726B feller buncher. The productivity was 67 dry short tons per productive hour assuming that the moisture content of wood was 50 %. The productivity per scheduled hour can be calculated using the utilization degree. Hartsough (Hartsough et al. 1997) has used the utilization degree of 65 % in his calculation.
Table 11. Some information of the Timbco 415-D track, Timberjack 740 wheel and Tigercat 726 B wheel feller bunchers.
Timbco T415-D1 Timberjack 7403 Tigercat 726 B4 Manufacturer Type Weight, short ton (metric ton) Width, inch (m) Lift capacity, short ton (m ton) Felling head Suitable for Ground pressure, psi (kPa) Productivity, dry short ton/PH (m3/PH) Price ($)
Timbco Track
20.6�21.1 (18.7�19.2) 110 (2.8 m)
3.8�11.6 (3.5�10.6) Shear or saw Small logging
4.3�6.3 (29.5�43.2) 12.8 (24.6)2
240 0002
Timberjack Wheel
13�16 (11.8�14.5) 118 (2.9 m)
Saw or shear
Thinning 8.6 (59.0)
Tigercat Wheel
13.4 (12.4) 118 (2.9 m)
Saw or shear Final felling
67 (128.6)
185 0005
1 Timbco 2002, 2 Hartsough et al. 1997 (Timbco T420 feller buncher), 3 Timberjack 2002, 4 Tigercat 2002 and 5 Ronald 2002.
3.3.3.2 Skidding
Principle
After felling the whole trees are skidded to either a landing or a processing area. Grapple skidders grasp a tree bunch with a large grapple on the back of the machine and pull the bunch to the landing (Fig. 11). The grapple skidders can be equipped with tracks or wheels. The wheel skidders are faster and cheaper than track skidders. On the other hand track skidders can haul heavier loads than wheel skidders and they cause smaller site damage. In addition, track skidders are suitable also for slope terrain.
Manufacturers
There are many skidder manufactures in North America like Timberjack, Tigercat, Timbco Hydraulics Inc., Caterpillar and John Deere. There is a wide range of different size skidders.

43
Productivity
The productivity of a grapple skidder depends on harvesting method, stand, tree size, the haulage distance, terrain conditions, season and the size and type of the skidder. The most important parameter is the haulage distance. The productivity of Timberjack 450B and Caterpillar 528 grapple skidders in thinning of mixed conifer stand (more information chapter 3.3.1) was 14.1 dry short tons per productive hour (PH) and 9.2 dry short tons per scheduled hour. The skidding distance in the study was up to 1000 ft (0.31 km) (Hartsough et al. 1997). Timberjack 450B and Caterpillar 528 grapple skidders are older models and they are not manufactured anymore. The new models which are almost similar as the older ones are Timberjack 460D and Caterpillar 525B grapple. Information of these machines is presented in Table 12.
In the study made by USDA, the average productivity of Timberjack 450C grapple skidder varied from 36.1 to 46.8 green tons per productive hour (18.1 to 23.4 dry short tons per PH) (Brinker at al. 1996). The study investigated the impact of tire size to the productivity of a skidder. The study sites were a loblolly pine stand and a mixed pine and hard wood stand. Both of them were final felling stands. The average dbh of trees varied from 6.5 in (16.6 cm) to 7.9 in (20.0 cm). The skidding distance in the study was up to 0.63 mile (1.0 km).
Figure 11. Grapple skidder (John Deere) and bunches at a landing in Vermont (photos by Arvo Leinonen).

44
Table 12. Some information on Timberjack 460D wheel and Caterpillar 525B wheel skidders.
Timberjack 460D1 Caterpillar 525B2
Manufacturer Type Gross power, kW Grapple capacity, sq.ft. (sq.m) Max. speed, mph (km/h) Weight, short ton (metric ton) Width, feet (m) Ground pressure, Psi (kPa) Productivity, dry short ton/PH (m3/PH) Price ($)
Timberjack Dual arch grapple 114 (Small size)
11.7 (1.09) 14.3 (23.0) 14.1 (12.8)
9.5�10.6 (3.0�3.2) 6.8�8.2 (47.0�56.7)
14.1 (27.1)3 18.1�23.4 (34.8�44.9)5
160 0003
Caterpillar Single/Dual Grapple
134 (Middle size) 12.5 (1.16) 17.1 (27.5) 17.9 (16.3) 10.9 (3.3)
13�16 (11.8�14.5) 14.1 (27.1)4
1 Timberjack 2002, 2 Caterpillar 2002, 3 Hartsough et al. 1997 (Timberjack 450B grapple skidder), 4Hartsough et al. 1997 (Caterpillar 528 grapple skidder) and 5Brinker et al. 1996 (Timberjack 450C ).
3.3.3.3 Chipping
Comminution of logging residues and whole trees for fuel is based on chipping or crushing. In chipping wood is comminuted with sharp cutting blades. In crushing wood is comminuted with moving or constant dull hammers or plates. In the market there are many kind of chippers and crushers available.
Chippers
Chippers are divided into disc and drum chippers. Disc chipper consists of a rotating disc with rectangular holes in which chipper knives are mounted. Drum chipper consists of a rotating drum, the curving of which has 2�4 longitudinal holes equipped with knives. The material to be chipped is loaded by a crane on a horizontal feeding table which feeds the material into an infeed opening with hydraulic rollers that push the logs into the chipper. The biggest chippers have their own engine and their on crane equipment. Smallest chippers can be driven by a vehicle like a tractor or a truck with a mounted loader. Chippers can also be towed by a tractor or a truck. They can be constructed also on the truck chassis. The disc chipper is suitable only for whole tree chipping because of the small feeding opening. The drum chipper with bigger feeding opening is suitable for chipping of both whole trees and forest residues. All chippers are

45
equipped with a fan to blow the chips out of the chipper housing through a chute into the truck trailer (Fig. 12).
Crushers
Crushers are normally big enough to be equipped with their own engines and knuckle-boom loaders. Crushers can also be towed or constructed on a truck chassis. The crushers can be equipped with tube or horizontal feeding system. The horizontal feeding system is better for whole trees because of the longer feeding table. Crushers tolerate impurities like stones and metal much better than chippers.
The discharge systems of chippers are normally designed so that they can blow the chips directly into a trailer. Grinders discharge the chips on the ground with a conveyor.
Manufacturers
There are many chipper and crusher manufactures in the world for instance Morbark Inc. and Peterson Pacific Corp. in the USA, Jenz in Germany, Bruks in Sweden and Heinolan Sahakoneet Oy and Kotimaiset Energiat Ky in Finland.
Productivity
High efficiency is required from the chippers and crushers. Normally chips are blown directly from the chipper into the truck trailer. The productivity of chipping is influenced by the raw material, the storage and working arrangements and the specifications of the chipper. The productivity of the Morbark 60/36 drum chipper was in a study 27.7 dry short tons per PH (53.2 m3/PH). The material in the study were mixed conifor small trees from thinnings. The drum diameter of the chipper in the study was 36 inches (91 cm) and the width was 60 inches (152 cm) (Hartsough et al. 1997) (Table 13).
The productivity of the Morbark 30 disc chipper has been measured to be 57 green delivered short tons per productive hour. This is about 28.5 dry short tons per productive hour (PH) assuming 50 % moisture content of green chips. The trees in the study were sycamore hardwood species and dbh was from 1 inches (2.5 cm) to 5 inches (15 cm). The disc in the studied Morbark 30 disc chipper was 30 inches (76 cm) (McDonald & Stokes 1994).
The grinders are used also for comminution of whole trees and forest residues. The manufacturer has informed a capacity of 100�200 cubic yards per hour for Morbark 3600 Wood hog grinder (Morbark 2002). This is approximately 40�80 dry short tons per hour assuming a 29.6 lb/ft3 (473 kg/m3) dry density for wood.

46
The power demand for drum chippers varies from 215 hp (160 kW) to 860 hp (640 kW), while the power demand for the disc chippers varies from 425 hp (320 kW) to 1000 hp (750 kW) and power demand of grinders equipped with horizontal feeding system from 250 hp (190 kW) to 1000 hp (750 kW) (Morbark 2002).
Chipper prices vary from 170 000 $ to 360 000 $ depending on the chipper size and type. The price of grinders with horizontal feeding system varies from 200 000 to 500 000 $ depending on the model (Yuncker 2002).
Figure 12. Tops and small tree pile for fuel (left) and Morbrak M 30 drum chipper chipping into the trailer (right) at a landing in Vermont (photos by Arvo Leinonen).
Table 13. Some information on the Morbark 30/36 drum chipper, Morbark 23 Chiparvestor and Morbark 3600 Wood hog grinder (Morbark 2002).
Morbark 30/36 23 Chiparvestor 3600 Wood hog
Manufacturer Type Power, kW (size) Feeding system Infeed opening, in.x in (m x m) Feed rate, ft/min Drum/disc diameter, in (m) Gross weight, short ton (metric ton) Loader Productivity - Manuf. Informed, green short ton/h - Measured, dry ton/PH (m3/PH) - Manufact. Informed, yard3/h (m3/h) Price ($)
Morbark Drum chipper 245�340(middle) Horizontal 30 x 33 (0.8 x 0.8) 110�115 36 (0.9) 13.5 (12.3) Knuckleboom Up to 50 27.7 (53.2)1 170 0003
Morbark Disc chipper 488�645(middle) Four wheel 23 (0.6) 29 (26) Knuckleboom Up to 500 tons/shift 28.5 (54.7)2 210 0003
Morbark Grinder 188�375 (small) Horiz. Conveyor 37 x 57 (0.9 x 1.5) 24.9 (27.4) No loader 100�200 (76�152) 250 0003
1Hartsough et al. 1997 (Morbark 60/36 drum chipper), 2McDonald & Stokes 1994 (Morbark 60/30 disc chipper) and 3Yuncker 2002.

47
3.3.3.4 Transport
Normally chips are transported to the power plant using truck trailers. In Vermont at McNeil Generating Station also train wagons are used for transport of chips because of the location of power plant near the Burlington city.
Loading from chippers is commonly done with a blower which blows the chips into trailer from the chipper rear. In this system there is a potential for extended loading times in the forest. If the trailer must wait to be loaded while material is being chipped then delays in the chipping process are transferred to the loading. Discharge of the chips onto the ground can be used, but is generally not preferred. Some chips become unrecoverable from the ground and additional equipment is required to load from the ground into the trailer (Angus-Hankin et al. 1995).
Trailers
The trucks that are used for road transport of chips are normally tractor-semitrailer combinations (Fig. 13 & Table 14). The tractor-semitrailer combinations account for more than 82 % of all combination trucks in the USA. It consists of a tractor towing unit and a semitrailer. In the semitrailer there can be two or more axles (USA Department of Transportation 1997).
Figure 13. Different kind of tractor-semitrailers (USA Department of Transportation 1997).
Regulations
The federal and state regulations define the weight and dimension limits into which loaded trucks must fit. Gross vehicle weight (GVW) is the total weight of a vehicle or combination of vehicles and load. The federal GVW limit is 80 000 pounds (36 000 kg). The federal axle limit is 20 000 pounds (9 000 kg) for a single axle and 34 000 pounds (15 000 kg) for tandem axles. The federal limit for the semitrailer length is 48 feet (14.6 m) and the trailer length limit is 28 feet (8.5 m). Several states have the a 96-inch-

48
width-limit for commercial vehicles. The Most Westerns States limit vehicle and load heights to 14 feet (4.3 m) (USA Department of Transportation 1997).
The state limits vary from the federal limits. For instance in Vermont the axle limit is 45 short tons (41 metric tons) for tandem axle trailer combinations and 49.5 short tons (45 metric tons) for tridem axle trailer combination.
Practice
The maximum economical transport distance for wood fuel chips is 50 miles (80 km). The volume of semitrailer varies from 95 to 150 cubic yards (Fig. 14). The weight of the towing tractor and trailer is 14�15 short tons in a semitrailer combination (USA Department of Transportation 1997). The payload in a semitrailer can be 25�26 short tons assuming that GVW is 40 short tons. The payload 25�26 short tons is achieved in the volume of 100 cubic yards (76 m3), assuming that the bulk density of whole tree chips is 19.1 lb/cubic ft3 (306 kg/m3).
In Vermont the GVW limit is 45�49.5 short tons, so payload can be 30�35 short tons. This payload is achieved with the volume of 116�136 cubic yards (88�103 m3). In Vermont the general trailer volume is 95 cubic yards (72 m3) (Bropelin 2002).
Knight Trailer Company Inc. in the USA manufactures different kind of trailers for wood chips transport. Some information of one trailer made by Knight Trailer Company Inc. is presented in Table 12.
Figure 14. Chipper is blowing the chips into a truck trailer at a landing (left) and a truck is under unloading station at a power plant (right) (photos by Arvo Leinonen).

49
Table 14. Information on the Knight KC320 Trailer (Cail 2002).
Knight KC320 semitrailer Manufacturer Model Volume, cubic yard (m3) Price, $
Knight Trailer Company Inc. KC320
150 (114) 43 750
3.3.3.5 Drying
One of the most important quality factor of forest residue chips is the effective heating value. Heating value depends highly on the moisture content. The moisture content of fresh whole tree chips is between 41�52 w-%. The moisture content of forest residues can be decreased with the help of solar drying.
At present forest residues are chipped without drying at the landing. The reason is that if the residues are dried at the landing it is necessary to come back afterwards for the chipping and transport of the chips to power plant. That increases production costs. On the other hand the heating value and also the price for the chips increases.
There has been some research dealing with the transpirational drying of whole trees at the landing in the USA. The drying depends on the tree species and weather conditions. In the study paper birch trees had a significant decrease in moisture content while red oaks had no significant change in moisture after 3 weeks. Also loblolly pine and sweetgum whole trees have been left to dry for three months in eastern Texas during winter. The net fuel value increased even though there appeared to be an effect of rainfall on wood drying rates. Based on this research it was recommended to allow residues to lie in the woods during winter 10�12 weeks to reduce the moisture content. Virginia study has reported that in all cases, the highest drying rate occured immediately after felling. Season of felling, tree species and diameter were the variables that had most influence on the drying rates in this study. The developed drying models for hardwood and softwood trees show that number of days since felling, temperature, and rainfall were significant in addition to species and season. Weight loss of pine stems stabilised after 50 days. Hardwood species dried in about 40 days during the summer (Angus-Hankin et al. 1995).

50
3.3.4 Cut-to-length method
Study
The share of cut-to-length method in wood harvesting in the USA is about 15 %. Hartsough (Hartsough et al. 1997) has measured the capacity of the cut-to-length system in biomass fuel harvesting connected with the harvesting of sawlogs and pulpwood. The study compared the cut-to-length and whole-tree methods in thinning of a 75�100 years old mixed conifer stand and a 35 years old ponderosa pine plantation. The capacity of different machines was measured of a natural stand. The total average yield in thinning from the natural stand was 22.7 dry tons per acre using whole tree harvesting chain and 23.1 dry short tons per acre using cut-to-length harvesting chain. The results of the whole tree harvesting method were presented in the preceding chapter.
In the study (Hartsough et al. 1997) the cut-to-length method included a Timberjack 1270 harvester, Timberjack 1010 forwarder, loader and chipper (Table 15). The harvester cut, delimbed and crosscut sawlogs from merchantable trees, and also biomass trees and the tops of the merchantable trees, down to 2 inches in diameter. The average amount of logging residues from the natural mixed conifer stand using cut-to-length method was 11.1 dry short tons per acre (52.7 m3/ha) which is 48 % of the total yield of the stand. The average logging residue from the stand in the study was 13.9 dry short tons per acre (65.9 m3/ha) using whole tree harvesting chain. In the cut-to-length harvesting chain skidder was used to move biomass from the decks to the chipper. More information of the natural mixed conifer stand in the study can be found in the chapter 3.3.1.
Productivity
In the study the productivity of the Timberjack 1270 harvester with 762B felling head was 9.2 dry short tons per productive hour (PH). The productivity of the Timberjack 1010 forwarder was 7.8 dry short tons per productive hour (PH). The forwarding distance was up to 1000 ft (0.31 km) (Hartsough et al. 1997). The productivity of the harvester and forwarder depends on the stand conditions and the presented results are specific for the conditions in the study. In the study also small biomass trees were delimbed which decreased the productivity.
Comparison between cut-to-length and whole tree harvesting method
Whole tree harvesting method is more productive than the cut-to-length method. The productivity of Timbco T420 feller buncher in a natural mixed conifer thinning stand was 12.8 dry short tons per productive hour (PH) and the productivity of the Timberjack 450B and Caterpillar 528 grapple skidders was 14.1 dry short tons per PH. The productivity of

51
the Timberjack 1270 harvester in the same stand was 9.2 dry short tons per PH and the productivity of the Timberjack 1010 forwarder 7.8 dry short tons per PH.
In the cut-to-length method stem chips were produced, while in the whole tree method whole tree chips were made. This improves the productivity of the machines in the whole tree method.
Table 15. Some information of the Timberjack 1270C harvester and Timberjack 1010B forwarder.
Timberjack 1270C1 Timberjack 1010B1 Machine type Manufacturer Suitable for Power, hp (kW) Width, in (m) Weight, lb (metric ton) Max. load, lb (kg) Maximum reach, ft (m) - TJ61F telescope boom and harvester head 762C Delimbing diameter, in(cm) - Harvester head 762C Capacity, Odt/PH (m3/PH) Price
Harvester Timberjack
Regeneration 218 (163) 112 (2.8)
36 375 (16.6)
28.2 (8.6)
25.6 (65)
9.2 (17.7)2
460 0002
Forwarder Timberjack
Regeneration 110 (82) 106 (2.7)
26 450�27 560 (12�15 ) 22 000 (10 000)
23 (7.0)
7.8 (15.0)2 290 0002
1Timberjack 2002 and 2 Hartsough et al. 1997.
3.4 Harvesting of short rotation woody crops (SRWC) for fuel
3.4.1 Harvesting yield
The average annual yield for hybrid poplar in the USA is estimated to be 5 dry short tons per acre (11.2 metric ton per ha) (De La Torre Ugarte et al. 2000). The yield in clearcutting would be 40�50 dry short tons per acre (189.8�237.2 m3/ha, density of dry wood 473 kg/m3) assuming that harvest is realized every 8�10 years.
In practice the yield in eucalyptus clearfelling stand has been 60.8�73.7 dry short tons per acre (288.5�349.7 m3/ha) (Spinelli et al. 2002). This is a little more than the average yield for hybrid poplar. The yield in clearfelling of 5 years� old sycamore stand has been

52
32.3 green short tons per acre (16.2 dry short tons per acre, 76.9 m3/ha) (McDonald & Stokes 1994) (Table 16). Green tons are converted to dry tons assuming 50 % moisture content and yield in dry tons per acre is converted to m3/ha assuming dry wood density 473 kg/m3.
To maximize the profit of the SRWC, the clean wood chips should be utilized in pulp and paper industry. The share of forest residues in SRWC is about 30 % of the total biomass when using the flail delimbing-debarking�chipping combination equipment (Spinelli et al. 2002).
Table 16. Growth and harvesting yield in clearcutting of SRWC (De La Torre Ugarte et al. 2000, Spinelli et al. 2002 and McDonald & Stokes 1994). Yield in dry tons per acre is converted to m3/ha assuming dry wood density 473 kg/m3.
SRWC Growth Short dry ton/acre/year
(m3/ha/year)
Yield in clearcutting Short dry ton/acre
(m3/ha) Hydrid poplar1 (8�10 years) Eucalyptus (7 years)2 Eucalyptus (8 years)2 Sycamore (5 years)3
5 (23.7) 10.5 (49.8) 7.6 (36.1) 3.2 (15.2)
40�50 (189.8�237.2) 73.7 (349.7) 60.8 (288.5) 16.2 (76.9)
1 De La Torre Ugarte 2001, 2 Spinelli et al. 2002 and 3 McDonald & Stokes 1994.
3.4.2 Whole tree harvesting � chain
Short rotation woody crops like eucalyptus, poplar and sycamore are mainly grown for pulp and paper industry. Eucalyptus trees are grown also for mulch in California. The forest residues as tops and branches can be utilized as fuel. If there is no market for the SRWC it is utilized as whole trees for fuel.
The normal whole tree harvesting chain is suitable also for SRWC. The harvesting chain consists of cutting using feller bunchers, skidding, possibly delimbing and crosscut of pulpwood, chipping of tops and branches and transport of fuel chips to power plant by tractor towing trailers. In harvesting of SRWC there is a possibility to utilize a front-end loader instead of a skidder for terrain haulage. Front-end loader carries the trees to the landing area. Forwarding produces lower contamination than skidding.

53
3.4.2.1 Felling
The normal feller bunchers are suitable also for the cutting of short rotation woody crops (Fig. 15). The productivity of feller buncher depends largely on the size of the trees of the stand. The productivity is significantly higher when harvesting larger diameter trees. In a study, the productivity of a rubber wheeled feller buncher (Barko 775) was 45.4 dry short tons in hour and the productivity of a crawler feller buncher (Jhon Deere 493D) 26.2 dry short tons per hour in a cottonwood stand where the average diameter of the trees (dbh) were 7.8 in (19.8 cm). The number of trees in the study was 670 trees per acre (1655 trees/ha) (Oak Ridge National laboratory 2002).
Spinelli et al. (2002) have measured the capacity of drive-to-tree and swing�to-tree feller bunchers in an euclayptus stand. The production rates in the study varied from 11.7 to 15.6 dry short tons per PH. The age of the trees was 7�10 years. The tree size was between 191 and 349 green lb (87�158 green kg) and the yield in clearfelling was 60.8�73.7 dry short tons per acre (chapter 3.4.1). Three feller bunchers were studied: Hydro-Ax 411 EX and Morbark Wolverine 6300 drive-to-tree rubber tired feller bunchers and Timbco 445B swing-to-tree feller buncher. The best productivity was achieved with the Morbark Wolverine feller buncher (15.6 dry short tons per PH). This feller buncher is not manufactured any more. The productivity of the tracked Timbco 445B feller buncher was 13.7 dry short tons per PH. It was higher than the productivity of the wheeled feller buncher Hydro-Ax which achieved 11.6 dry short tons per PH (22.3 m3/PH) (Spinelli et al. 2002). Green tons in the study are converted to dry tons assuming 50 % moisture content.
Under easy terrain conditions, trees should be felled with wheel feller bunchers. However, the wheeled feller bunchers have limited mobility in steep or soft terrain. In these cases, they should be replaced by tracked feller bunchers (Spinelli et al. 2002).
McDonald & Stokes (1994) have measured the productivity of the Hydro-Ax 411B wheeled feller buncher, resulting 9.1 dry short tons per PH (17.5m3/PH). In this study the stand was sycamore plantation and the age of the trees was 5 years. In the stand average diameter at breast height (dbh) was 3.0 in (7.5 cm) and the yield was about 19.2 dry short tons per acre (91.1m3/ha) (McDonald & Stokes 1994). Green tons used in the study were converted to dry tons assuming 50 % moisture content and yield in dry short tons per acre converted to m3/ha assuming dry wood density 473 kg/m3.

54
Figure 15. Ten years� old eucalyptus stand (left) and the feller buncher at the eucalyptus stand (right) in California (photos by Arvo Leinonen).
Table 17. Information on the feller bunchers used for SRWC harvesting. Parameter Hydro-Ax
411 EX1,2 Timbco T445-D4
Barko 785B6
Manufacturer Configuration Power, hp (kW)
Approximate weight, short ton(metric ton) Travel speed, m/h (km/h) Width, feet (m) Ground pressure, psi Cutting device Productivity, Odt/PH (m3/PH) - Eucalyptus stand (age 7�8 years) - Sycamore (av. dbh 3 in (7.5 cm)) - Cottonwood (av. dbh 7.8 in(19.8 cm))
Blount 4-wheel
138 (103)
13.6 (12.4)
9.3 (2.8)
Saw or shear
11.6 (22.3) 9.1 (17.5)3
Timbco Tracked
260 (193)
28�30 (26�27)
10.3 (3.15) 5.4�7.7
Saw or shear
13.7 (26.3)5
Barko 4-wheel
168 (125)
0�4.6 (0�7.4) 9.3 (2.84)
Saw or shear
45.4 (87.2)7 1Blount 2002, 2 Spinelli et al. 2002, 3 McDonald & Stokes 1994 (HydroAx 411B feller buncher), 4 Timbco 2002, 5Spinelli et al. 2002 (Timbco 445B feller buncher), 6 Barko Hydraulics 2002 and 7ORNL 2002 (Barko 775 feller buncher).
3.4.2.2 Skidding
In SRWC plantations grapple skidders and front-end loaders are used for extraction of the trees to the landing. Skidding may cause dirt into the bark and foliage residues that

55
can be used for fuel. Therefor also front-end loaders are used for extraction of whole trees. They lift one or more bunches of trees to the landing (Fig. 16).
Spinelli & Hartsough (2001) have compared Caterpillar 528 grapple skidder and Caterpillar 950F front-end loader in extraction of whole trees in a 7�8 years old the eucalyptus stand. The harvesting method in the stand was clearcutting. Information on the studied is presented in chapter 3.4.2.1. In the study the average production rate of the front-end loader 74.2 green short tons per PH (37.1 dry short tons per PH) was 40�60 % more than with the grapple skidder 43.7 green short tons per PH (21.9 dry short tons per PH). The hauling distance was 220�275 yards (200�250 m) (Table 18). Even though the conditions for the skidder and the loader were identical, the difference between the capacities of the two machines were striking. The loader is slower than the grapple skidder, but it can move loads that are more than twice as large. This is the main reason for the high production rate of the front-end loader.
McDonald (1994) has measured production rates of 39.4 green short tons per PH (19.7 dry short tons per PH) for the Timberjack 450B grapple skidder. The stand in this study was a 5 years old sycamore short rotation plantation (McDonald & Stokes 1994). This production rate is lower than the one measured by Spinelli et al. (2002). The reason for this is the smaller size of the harvested trees.
Figure 16. Front-end loader (left) and whole trees in a storage (right) (photos by Arvo Leinonen).

56
Table 18. Information on the skidder and loader used for SRWC harvesting (Spinelli & Hartsough 1999).
Machine Skidder Caterpillar 528
Loader Caterpillar 950F
Configuration Approximate weight, short ton (metric ton) Power, hp (kW) Transmission Width, feet (m) Grapple/fork Productivity, Odt/PH (m3/PH) Price, $
Rubber-tired 16.5 (15) 130 (175)
3 speed powershift 9.7 (2.9)
Single arch 21.9 (42.0)
175 000
Rubber-tired 19 (17.3) 119 (160)
4 speed powershift 9.0 (2.7)
37.1 (71.2)
210 000
3.4.2.3 Chipping
The drum and disc chippers which are used for chipping whole trees from natural stands are suitable also for the chipping of SRWC whole trees. McDonald & Stokes (1994) have measured a capacity of 62.7 green short tons per PH for Morbark 30 disc chipper with sycamore SRWC. This is equal to 31.4 dry short tons per PH assuming that the moisture content is 50 w-%. Currently the chipper production rate is probably higher in general due to technology development.
3.4.2.4 Road transport
The same tractor-semitrailer combinations can be used for road transport of SRWC chips as for chips harvested from the natural stands.
3.4.3 Comparison between harvesting of forest residues and SRW for fuel
The yield in harvesting forest residue chips from SRWC plantation is about 10�20 dry short tons per acre assuming that the share of forest residues in clearfelling is 30 % of the total biomass. This is quite the same as the yield of forest residues from 23 years� loblolly pine clearfelling stand, which is approximately 15 dry short tons per acre.
The machines that are used in harvesting fuel chips from SRWC stands and natural stands are quite the same. However, for harvesting wood chips on SRWC stand front�

57
end loader are used in skidding instead of grapple skidders, because front-end loaders can be used only in clearfelling stands. The felling capacity is nearly the same on natural stand (12.8 dry short ton/PH) as on SRWC stand (10�14 dry short ton/PH) using the basic felling machines. In skidding the productivity of front-end loader (37 dry short ton/PH) on SRWC stand is higher than when using grapple skidders (14�23 dry short ton/PH) on natural stand.
3.5 Production costs of forest residues and SRWC chips for fuel
3.5.1 Production costs of forest residue chips from natural stands using whole-tree harvesting chain
Production costs depend on the stand conditions, and the equipment used for harvesting. The stand condition consists of stand size, yield per acre, tree size and terrain.
The average production costs of forest residue chips for fuel in the USA are approximately 30 $ per dry ton (6.9 $/MWh, moisture content 50 %). This can be seen as a maximum limit for economical use of wood residues for energy production. The harvesting costs have been quite the same for the last 15 years.
Bergman & Zerbe (2001) present that the average production costs of whole-tree chips are 26�40 $ per short dry ton (6.0�9.2 $/MWh, 50 w-%). The costs of harvesting phases (cutting and skidding) are about 14�20 $ per dry short ton (3.2�4.6 $/MWh), stumpage costs are 2 $ per short dry ton (0.5 $/MWh) and chipping costs about 8 $ per dry short ton (1.8 $/MWh). The road transportation costs are the highest variable cost due the distances to power plants, 2�10 $ per short dry ton (0.5�2.3 $/MWh). It is estimated that the transportation costs are 0.20 $/dry ton/mile (0.125 $/dry ton/km) (Reardon 2002) (Table 19).
Hartsough et al. (1997) have investigated the harvesting cost of logging residues for fuel. The harvesting costs in this study are quite the same as in practice, 30�33.5 $ per dry short ton (6.9�7.7 $/MWh, 50 w-%) (Table 19). In the study there were a 35 years old ponderosa pine plantation and a 40�100 years old conifer stand. The harvesting was made as thinning operation. The logging residue yield from the pine plantation was 10.2 dry short tons per acre (109.9 MWh/ha, 50 w-%) which was 46 % of the total removal from the stand. The yield from the natural conifer stand was 13.9 dry short tons per acre (64.9 MWh/ha, 50 w-%) which was 61 % of the total removal from the stand. When using whole tree harvesting method for production of logging residue chips, the production costs were about 30 $ per dry short ton (6.9 $/MWh) in the pine plantation

58
and 33.5 $ per dry short ton (7.7 $/MWh) in the natural stand. In this study the felling costs in the natural stand were about 57 % (8.5 $ per dry short ton) and the skidding costs were the rest 43 % (6.5 $ per dry short ton) of the total harvesting costs. In the plantation stand the harvesting costs consisted of the skidding costs. The felling costs of tops in this stand were assigned to the harvesting costs of timber.
Table 19. Harvesting costs of forest residue chips from thinnings (Bergman & Zerbe 2001, Harstough et al. 1997). Information from practice is based on the power plants that use wood for fuel. Harvesting chain is based on the use of whole tree harvesting chain � cutting, skidding, piling, chipping and truck transport phases.
Working phase Practice
$/Odt
Practice
$/MWh (50 w-%)
Bergman & Zerbe
$/Odt
Bergman & Zerbe $/MWh
(50 w-%)
Hartsough et al. $/Odt
Hartsough et al.
$/MWh (50 w-%)
Stumpage Harvesting Chipping Transport
2.0�4.0 10.0�12.0 6.0�8.0
8.0�12.0
0.5�0.9 2.3�2.8 1.4�1.8 1.8�2.8
2.0 14.0�20.0
8.0 2.0�10.0
0.5 3.2�4.6
1.8 0.5�2.3
- 0�15 5�8 14
- 0�3.4
1.1�1.8 3.2
Total 26.0�36.0 6.0�8.3 26.0�40.0 6.0�9.2 30�33.5 6.9�7.7
3.5.2 Production costs of wood fuel in the cut-to-length method
Hartsough et al. (1997) have measured considerably higher wood fuel chips harvesting costs for cut-to-length method than for the whole tree harvesting method. In the same natural and plantation stands the production costs (gate price) for biomass fuel chips in the cut-to-length method were 48�66 $ per dry short ton (11.0�15.1 $/MWh, 50 w-%) and in the whole tree harvesting method only 30�33.5 $ per dry short ton (6.9�7.7 $/MWh, 50 w-%) (chapter 3.5.1). The production costs were from 50 % up to 100 % higher in the cut-to-length method than in the whole tree harvesting method.
The main reason for the higher production costs are the higher harvesting costs of wood fuel from the stand to the landing area in the cut-to-length method. In cut-to-length method the harvesting and forwarding costs without reskidding are 23�43 $ per dry short ton (5.3�9.9 $/MWh) and respectively in the whole tree harvesting method 0�15 $ per dry short ton (0�3.4 $/MWh).
In the study small trees and tops were delimbed in the cut-to-length method to produce delimbed stem fuel chips. The delimbing of small trees is very time consuming. This is

59
one reason for the high harvesting costs of the cut-to-length method. Production costs in the cut-to-length can be decreased by not delimbing the small trees and tops, thus utilizing them for fuel with needles and branches.
3.5.3 Harvesting costs of short rotation woody crops
Short rotation woody crops are mainly used as raw material for pulp and paper industry, but also as fuel for power production.
Spinelli et al. (2002) have investigated the harvesting costs of clean eucalyptus chips for pulp and paper industry and for fuel by using whole tree harvesting system (Table 20). In the study trees were felled by normal feller bunchers equipped with wheels or tracks. Bunches were collected by either a skidder or a front-end loader, which carried the bunches to the landing. At the landing the trees were processed by delimbing-debarking-chipping combinations (DDC). Clean chips were blown directly into chip trucks. In the study, the clean wood chip recovery rate was about 70 %. The logging residues from delimbing-debarking-chipping operation were planned to be used as fuel. The harvesting costs were calculated for the all of the eucalyptus chips including raw material and fuel chips. More information of the stand and the equipment in the study is presented in the chapters 1.4.1.1 and 1.4.1.2 (Spinelli et al. 2002).
The conclusion of the study was that in easy terrain conditions, trees should be felled by using wheeled feller bunchers and extracted to the landing by front-end loaders. This combination (feller buncher and front-end loader) offers the lowest harvesting costs 7.3�9.3 $ per dry short ton (1.7�2.1 $/MWh, 50 w-%). The costs of felling and bunching are 4.9�6.9 $ per dry short ton (1.1�1.6 $/MWh) and the cost of extracting using front-end loader is about 2.4 $ per dry short ton (0.6 $/MWh. The costs of delimbing-debarking-chipping are 9.1�12.7 $ per dry ton (2.1�2.9 $/MWh). The total production costs of eucalyptus pulp chips are 14.6�20.0 $ per dry short ton (3.3�4.6 $/MWh) (Spinelli et al. 2002). The total costs of wood chips at the plant would be 22.5�30 $ per dry short ton (5.2�6.9 $/MWh, 50 w-%) including the transport costs (8�10 $ per dry short ton) (Table 20).
Assuming that all eucalyptus tree biomass is utilized for fuel, the production costs would be less than when producing it for pulp chips. The harvesting system for production of fuel chips would consist of a four-wheeled feller buncher, a front-end loader, a disc or drum chipper and truck transport. In this case the harvesting costs are assumed to be the same as when producing eucalyptus pulp chips, 7.3�9.3 $ per dry short ton. The chipping costs are assumed to be the same as when chipping trees from natural stands, 6.0�8.0 $ per dry short ton. The road transport cost is

60
assumed to be 8.0�10.0 $ per dry short ton with 50 miles transport distance. The total production costs in harvesting eucalyptus wood for fuel would be 21.3�27.3 $ per dry short ton (4.9�6.3 $/MWh, 50 w-%).
It is estimated that the fraction of harvesting, handling and transportation costs are 50�60 % of the total SRWC costs at the plant. The rest consists of establishment, maintenance and annual fixed costs of the plantation site (Volk et al. 2000).
Table 20. Harvesting costs of eucalyptus pulp chips (Spinelli et al. 2002).
$/Dry short ton $/MWh1 Felling, feller bunchers equipped with wheels Extracting by front-end loader DDC
4.9�6.9 2.4
9.1�12.7
1.1�1.6 0.6
2.1�2.9 Total harvesting cost 14.6�20.0 3.3�4.6
1 The calorific heating value is assumed to be 4.98 MWh/dry short ton.
3.6 Social, economical and other impacts of harvesting forest residues
3.6.1 Social and economical impacts
Most biomass facilities are situated in rural areas dominated by resource-based economics. Biomass power facilities provide jobs with comparatively good wages. Power plant employees receive attractive benefit packages, and in many cases supporting workers engaged in fuel production operations do as well. Supporting jobs are generated at a ratio of almost 2:1 to plant employment, with total employment equal to 4.9 fulltime jobs per each megawatt of net plant generating capacity. The long-term nature of this employment provides durable improvement and added stability to the local and regional economics surrounding the plants (Morris 1999b).
Biomass power plants also make important contributions to the tax base of many rural communities. In many cases biomass power plants are the largest single property tax payers in their respective jurisdictions. The facilities also generate income taxes and sale taxes from their activities and employees and from the workers that support them (Morris 1999b).
The biomass electricity generating capacity at the moment in the USA is about 7 500 MW. This capacity means 36 750 full-time jobs using assuming the presented figure above (4.9 full time jobs per one net MW).

61
In Finland it has been calculated that the total (direct and indirect) effect of harvesting and road transport of forest chips and use in medium size co-generation plant (17�40 MW) on employment is about 2 910 man-years per 1 million dry short ton (4.28 TWh, 50 w-%) (Mäenpää, & Männistö 1995). Based on this Finnish data the total effect of the use of forest residues (15.3�19.6 million TWh) on employment in the USA would be 10 000�13 000 man-years.
The total biomass electric capacity in California is 600 MW. The operating facilities and their fuel supply infrastructure directly employ about 2 000 people, providing valuable rural employment and economic development opportunities across the state (Morris 1999 a).
3.6.2 Other impacts
Typically, these overstocked stands have very large numbers of stems per acre and the growth has stagnated before the trees have reached a size of sufficient marketable material by conventional standards. Besides being a utilization problem, these stands are very vulnerable to fire or insect attack. In the summer of 2000, fire destroyed million of acres of forest across the United States. The fire control and exclusion combined with forestry practices have led to a long-term and extensive buildup of biomass in the forests. Large wildfires can have major ecological impacts on soil, fish, wildlife, water resources etc. (Bolding & Lanford 2001, Morris 1999a).
The only methods available to reduce fuel loading in the forests are prescribed burning and thinning combined with fuel extraction. Prescribed burning causes heavy pollution, and entails a risk of uncontrolled fire breakout. The result is that the amount of prescribed burning is very limited. In California, open burning is used as a method to reduce the forest fire risks associated with the logging residues at the landing. Open burning is a quick but dirty way to get rid of the logging residues. Massive amounts of smoke and other pollutants are emitted (Morris 1999a).
The best possible management for the overstocked forest is thinning combined with the use of small trees and logging residues for fuel. By this way it is possible to reduce the fire risk by decreasing the fuel amount in the forest. Thinning enables to restart the growth of the trees in the overstocked stand. It is an efficient way to get good quality timber for the sawmills in the future (Fig. 16). By utilizing the logging residues for fuel it is also possible to get rid of the polluting open burning.

62
Figure 17. Ponderosa pine forest before thinning (left) and after thinning (right) in New Mexico in April 2002 (photos by Arvo Leinonen).
3.7 Competitiveness of forest residues for fuel
The costs of generating electricity from biomass depend on the type of technology used, the size of the power plant, and the cost of the biomass fuel supply. Wood-fired power plants range in size from 10 up to 50 MW.
Electricity production costs
In California the main biomass is wood-derived fuel. The costs of generating energy from biomass in California are in the range of 6.0�7.5 cents per kWh, while biomass generators with standard offer power purchase agreements earn revenues of approximately 5.0 cent/kWh (Morris 1999 a). Taylor & VanDoren (2002) present that the production costs using biomass as fuel are 7.3�8.7 cents per kWh in the USA. The electricity production cost using fossil fuel is 2.5 cent per kWh.
The electricity production costs in a wood fired power plant are higher than in a coal or gas fired power plant. The fuel is more expensive and also the capital, maintenance and operating costs of wood burning are higher. The capital costs of biomass fired power plants are 1 732 $ per installed kW capacity. This is about four times higher than in gas/oil combined cycle power plant (445 $ per installed kW) and 37 % higher than in coal fired electricity plant (1 092 $ per installed kW capacity) (Taylor & VanDoren 2002).
The average price of forest residues at the power plant is at the moment approximately 30 $/dry tons (6.9 $/MWh, moisture content 50 %). If we assume that the energy density of wood is 17 000 million Btu per short dry ton (4.36 MWh, 50 w-%) and the efficiency coefficient of the power production is 25 %, the fuel costs of producing electricity are

63
2.75 cents per kWh. The share of fuel costs of the total electricity production costs (6.0�7.5 cents per kWh) is 37�46 %. The rest 54�63 % consists of capital, operating and maintenance costs. The capital, operating and maintenance costs depend on the size of the power plant. In bigger power plant they are smaller than in smaller one.
Electricity price
State level retail electricity prices vary considerably across the United States. Generally, states in New England have the highest average retail electricity prices, while states in the Northwest have the lowest. Industrial customers pay lower electricity prices than residential and commercial customers. In 1999, industrial customers paid an average of 3.9 cents per kWh, while residential and commercial customers paid an average of 8.1 cents per kWh (Energy Information Administration 2002a & b) (Table 21).
Subsidies
There are some subsidies available for using biomass as fuel. The impact of preferences varies by fuel source and facility, but they reduce the true cost of renewable energy production by at least 2 cents per kWh (Taylor & VanDoren 2002). There are not subsidies for the use of logging residues for fuel. A 1.5 cent/kWh subsidy is available for short rotation woody crop chips that are used for electricity production. In California the support for the use of biomass for electricity production was 1.5 cent per kWh in 1998 and 1999 (Morris 1999a). At the moment this subsidy is not any more available.
Table 21. The price of electricity, coal and natural gas excluding taxes in The USA in 1999 (Energy Information Administration 2002a, b, c & e).
Electricity Coal Gas Wood Cent/kWh $/MBtu $/MWh $/MBtu $/MWh $/MBtu $/MWh
Electricity production Household Industry
8.1 3.9
1.26 4.31 2.57 8.77 1.77 6.04

64
3.8 Future trends in the use of wood for fuel
3.8.1 Combustion technology development
Several technologies are under development, which enable to increase the use of wood fuel and also to improve the economy of wood fuel usage. The new technologies include co-firing, gasification and modular systems. Also the use of wood in residential and commercial buildings has possibilities to increase.
One short-term low-cost option for the use of biomass is cofiring with coal in existing boilers. Extensive demonstrations and trials have shown that effective substitution of biomass to existing stations can be made up to about 15 percent of the total energy input with little modifications to existing stations. The studies show that biomass cofiring has a potential to supplement available capacity with at least 8 GW of the nation�s coal-fired capacity by 2010, and as much as 26 GW by 2020 (Energy Efficiency and Renewable Energy Network 2000).
Another potentially attractive biopower option is based on gasification. Gasification for power production involves conversion of biomass to produce medium- or low-calorific gas. The gas is then used as fuel in combined cycle power generation (IGCC) involving a gas turbine topping cycle and a steam turbine bottoming cycle. IGCC technology provides the potential to double electricity generation efficiencies of biomass production facilities (20 up to 30�40 %), which lowers biomass power costs. The technology is very near to commercial availability (Energy Efficiency and Renewable Energy Network 2000).
Direct-fired combustion technologies are another option, especially with retrofits of existing facilities to improve process efficiency. The addition of dryers and incorporation of more rigorous steam cycles are expected to raise the efficiency of a direct combustion system by about 10 percent from the current level and to lower the capital investment costs (Bain & Overend 2002).
One biomass use option in the future is small modular power system. In a modular power system electricity is generated near the points of consumption with or without connection to existing power grid. On example of these modular power systems is Community Power Corporation�s system in which wood chips are converted into electricity and heat (Fig. 18). The capacity of these systems ranges from 15 to 25 kW (Bain & Overend 2002).
Wood is also used for heating in residential, public and commercial buildings. Schools in many states in the USA use wood for heat. In central heating or district heating for
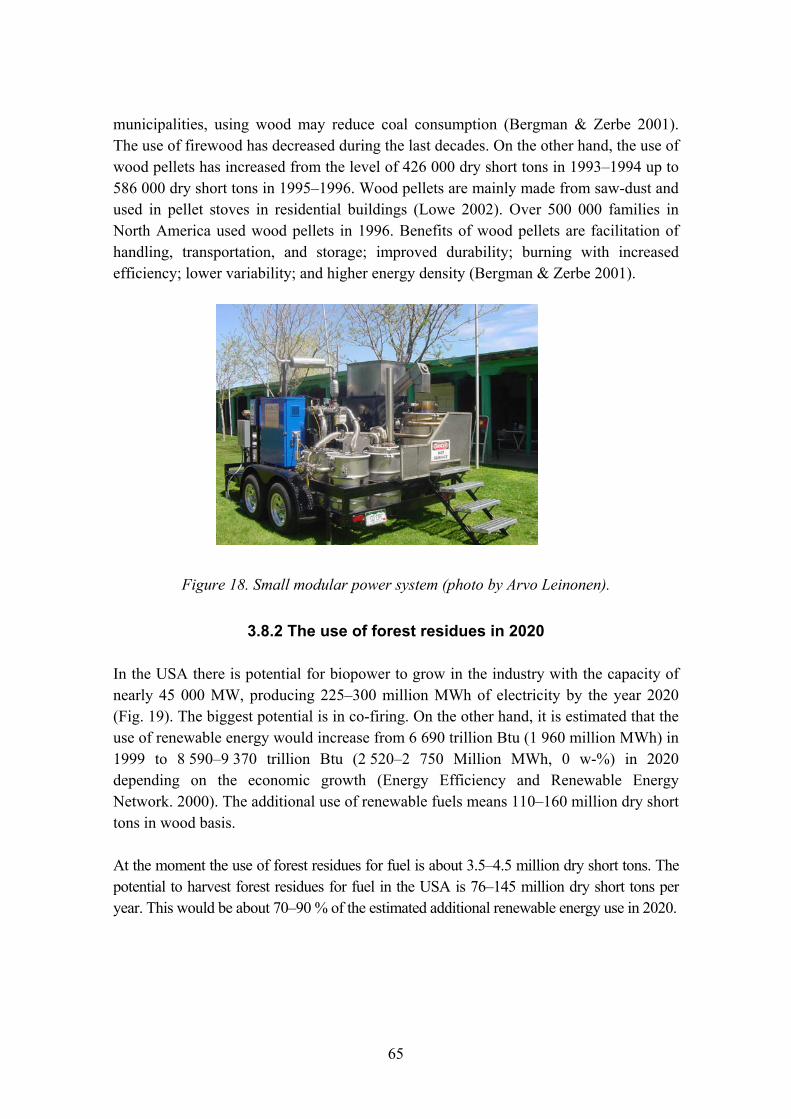
65
municipalities, using wood may reduce coal consumption (Bergman & Zerbe 2001). The use of firewood has decreased during the last decades. On the other hand, the use of wood pellets has increased from the level of 426 000 dry short tons in 1993�1994 up to 586 000 dry short tons in 1995�1996. Wood pellets are mainly made from saw-dust and used in pellet stoves in residential buildings (Lowe 2002). Over 500 000 families in North America used wood pellets in 1996. Benefits of wood pellets are facilitation of handling, transportation, and storage; improved durability; burning with increased efficiency; lower variability; and higher energy density (Bergman & Zerbe 2001).
Figure 18. Small modular power system (photo by Arvo Leinonen).
3.8.2 The use of forest residues in 2020
In the USA there is potential for biopower to grow in the industry with the capacity of nearly 45 000 MW, producing 225�300 million MWh of electricity by the year 2020 (Fig. 19). The biggest potential is in co-firing. On the other hand, it is estimated that the use of renewable energy would increase from 6 690 trillion Btu (1 960 million MWh) in 1999 to 8 590�9 370 trillion Btu (2 520�2 750 Million MWh, 0 w-%) in 2020 depending on the economic growth (Energy Efficiency and Renewable Energy Network. 2000). The additional use of renewable fuels means 110�160 million dry short tons in wood basis.
At the moment the use of forest residues for fuel is about 3.5�4.5 million dry short tons. The potential to harvest forest residues for fuel in the USA is 76�145 million dry short tons per year. This would be about 70�90 % of the estimated additional renewable energy use in 2020.
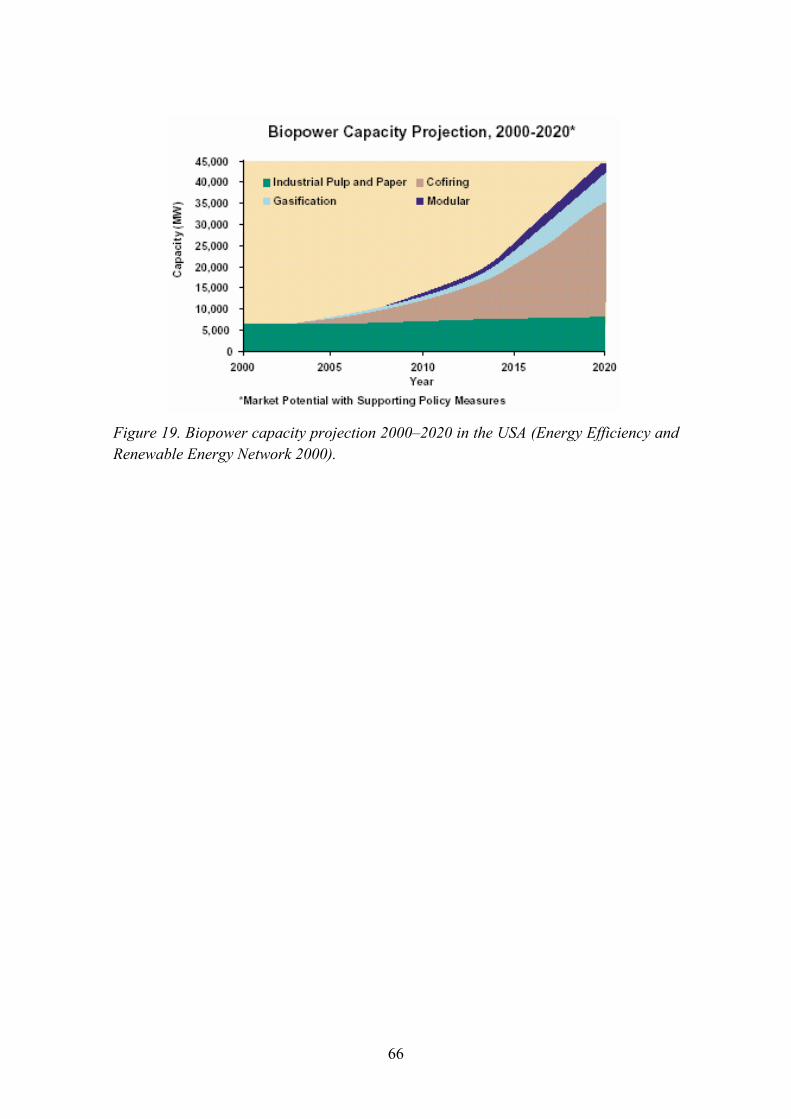
66
Figure 19. Biopower capacity projection 2000�2020 in the USA (Energy Efficiency and Renewable Energy Network 2000).

67
4. Forest residues for fuel in Finland
4.1 Forest residue potential
About 72 % of Finland�s land area, or 54.1 million acres (21.9 million hectares), is forest land. Forest area suitable for wood supply is 51.1 million acres (20.7 million hectares). Of this, the share of coniferous forest is about 82 %. The total harvested area in Finland in 1999 was 1.30 million acres (525 000 ha) and the share of clearcutting was 25 % of the total harvesting. From the harvested area 2 148 million cubic ft (61.0 million m3) of wood was produced in 1999. The timber yield was 1650 cubic ft per acre (116.2 m3/ha) (Finnish Forest Research Institute 2001).
Finland has a significant wood fuel potential. It is possible to produce forest residues in the form of logging residue chips from final felling and in the form of chipped small-diameter wood from young forests, i.e. from young stand management and thinning areas.
The amount of logging residues generated at the felling stands varies greatly site by site. Logging residue chips generated at final felling of spruce stands have the best potential among forest biomass for producing energy at the competitive price in Finland. For spruce stands, the yield of logging residues is more than twice much as for pine and birch stands (Alakangas et al. 1999).
Logging residues can be harvested either immediately after felling as fresh with needles, or as dry after the summer season, in which case a significant portion of the needles and a small amount of bark and thin branches are left in the felling area. On a typical final felling site of spruce, approximately 18.9 dry short tons of logging residue per acre (100 m3 per hectare, 50 w-%) accumulate while 37.8 to 47.3 dry short tons per acre (200 to 250 solid m3 per hectare) of merchantable wood per hectare is harvested. The recovery of the forest residues in harvesting the forest residues as fresh is 70 w-% and as dry 50 w-% (Alakangas et al. 1999).
The annual cutting of merchandise wood was 2 148 million ft3 (61 million m3) in 1997. With this felling amount 1 020 million ft3 (29 million m3, 13.6 million dry short tons) of logging residue is left in the forest. The total felling area in Finland was 1.30 million acres (525 000 ha). The Finnish Forest Research Institute estimates that the amount of fresh logging residue that can be harvested annually at the final felling of spruce and pine stands is up to 4.2 million dry short tons (9.1 million m3, 18.1 million MWh, 50 w-%). If the logging residues were harvested dry, ie. without needles, the annual recovery rate would be 2.9 million dry short tons (6.2 million m3, 12.3 million MWh, 50 w-%) (Table 22) (Alakangas et al. 1999).

68
The potential of small-diameter wood chips from pre-commercial thinnings is about 0.5 million dry short tons (2.3 million MWh, 50 w-%). The forest residue potential (whole-tree chips) from the first commercial thinnings is 2.3 million dry short tons (9.6 million MWh, 50 w-%). The forest residues (whole-tree chips) potential from unproductive stands is 0.4 million dry short tons (1.6 million MWh, 50 w-%) (Alakangas et al. 1999).
The total potential of forest chips in Finland is 6.1�7.4 million dry short tons (25.8�31.6 million MWh) per year (Alakangas et al. 1999).
Table 22. Main potential of forest residues in Finland (Alakangas et al. 1999).
Source Million dry short ton
Trillion Btu 50 w-%
Million MWh 50 w-%
Slash from regeneration areas - Dry - Fresh Slash from first commercial thinnings Whole-tree chips from pre-commercialThinnings Whole-tree chips from unproductive stands
2.9 4.2 2.3 0.5
0.4
42.0 61.8 32.8 7.8
5.5
12.3 18.1 9.6 2.3
1.6
Total 6.1�7.4 88.1�107.9 25.8�31.6
4.2 Consumption of forest residues as fuel
4.2.1 Energy consumption in Finland
The total energy consumption in Finland in 1999 was 1246.8 trillion Btu (365.3 TWh). Renewable energy sources accounted for 23 per cent of the total, which was 291.1 trillion Btu (85.3 TWh) (Table 23) (Ministry of Trade and Industry 2001).

69
Table 23. Total energy consumption by source in Finland 1999 (Ministry of Trade and Industry 2001).
Fuel Consumption Trillion Btu (TWh)
Fossil fuels (oil, gas and coal) Nuclear power Net imports of electricity Hydro and wind power Wood (moisture content 50 %) Other (including peat)
615.7 (180.4) 228.0 (66.8) 37.9 (11.1) 43.0 (12.6)
248.1 (72.7)1
74.1 (21.7) 1 246.8 (365.3)
1 Included consumption of forest residues.
4.2.2 Forest residues as fuel
The main operational quality criteria of logging residue chips are
- moisture content
- heating value
- density and
- particle size distribution.
Moisture content and heating value
One of the most important quality property of forest residue chips is the effective heating value. Heating value depends highly on the moisture content. The moisture content of fresh forest residues is between 50�60 w-% depending on the time of the year. The moisture content of forest residues can be decreased down to 30�40 w-% with the help of solar drying.(Leinonen et al. 1999). Moist logging residues are well suited for use in large multi-fuel power plants throughout the year. In smaller heating plants chips can sometimes be used only in spring and autumn when the plant is operating at reduced heat load (Alakangas et al. 1999).
The average net calorific value of forest residues chips is 19.25 MJ/kg. The effective heating value decreases linearly from 10.9 to 5.9 million Btu/short ton (from 3.5 to 1.9 MWh/metric ton) when the moisture content increases from 30 up to 60 w-% (Table 24). Research has shown that the density of forest residues increases from 1135 to 1600 lb/cubic yard (680 to 960 kg/m3) when the moisture content increases from 30 to 60 w-%. The heating value in volume basis decreases from 6.2 to 4.7 million Btu/cubic

70
yard (2.4 to 1.8 MWh/m3) with the same moisture content increase. The reduction is very significant, so the moisture content should be in control when harvesting forest residues.
Particle size
The particle size achieved with different chippers and crushers is very good for the use at power plant. In one study the share of particles that were less than 1.8 in (45 mm) was 95 % (Korpilahti 2000).
Nutrient concentrations
The nutrient concentrations, which are important for the growth of trees, are as their highest in needles and leaves. They lower the melting point of the ash from logging residue chips, compared to the ash from bark and peat. In addition, chlorine (Cl) may cause thermal corrosion in steam boiler superheaters when steam temperature exceeds 480 ºC. In fresh logging residues the Cl content (250�350 mg/kg) is higher than in the dry logging residues (50�150 mg/kg) because of the higher content of needles (Alakangas et al. 1999, Hillebrand & Nurmi 2001). Chips which contain green material may lead to increased slagging because of their higher alkaline content: for example potassium and sodium are problematic in burning. The potassium concentration in needles is 0.017�0.035 % (Alakangas et al. 1999).
More information of the properties of forest residues is presented in Appendix 3. The Finnish quality classification of forest residues is presented also in Appendix 3.
Table 24. Heating value and density of forest residue chips depending on the moisture content (Korpilahti 2000).
Property/Moisture content 30 w-% 40 w-% 50 w-% 60 w-% Heating value, MWh/m3 (solid) Heating value, million btu/cubic yard (solid)1 Density, kg/m3 (solid) Density, lb/cubic yard (solid)1
Heating value, MWh/metric ton1 Heating value, million btu/short ton1
2.4 6.2 680 1138 3.5 10.9
2.2 5.7 775 1297 2.8 8.7
2.0 5.2 870 1456 2.3 7.1
1.8 4.7 960 1607 1.9 5.9
1 Calculated
71
4.2.2 End users of wood for fuel in Finland
Cogenerated heat and power
A typical feature of Finland�s energy production is the large proportion of cogenerated heat and power (CHP) both in the district heating of communities and within industry. CHP�s advantages in relation to separate heat and power production is that it is efficient, a total efficiency being 80 to 90 %. The share of CHP heat is more than 70 % of the total heat production. District heating covers about 50 % of total Finnish space heating demand. Approximately one third of the total electricity consumed is cogenerated in connection with district heating and industrial processes (Tekes 2002).
Forest chips are mainly used in municipal heating plants, municipal combined heat and power (CHP) plants and industrial CHP plants. The total number of power plants that used different wood fuels for heat or/and electricity in 2000 was 375 (Ylitalo 2001).
District heating plants
The district heating plants are situated in small towns and municipalities. The number of the municipal heating plants that used forest fuel chips in 2000 was 215 (Ylitalo 2000). The average heat output of the new municipal heating plants is 3.2 MWth (Tekes 2002). The heating plants use also peat besides wood and especially during the winter time in order to increase the fuel quality.
Municipal cogeneration plants
The municipal cogeneration plants are situated in the big cities where they generate electricity and provide steam for industrial processes or district heat for the network of a nearby town. The number of municipal CHP plants that use currently wood fuels is 29 and their total heat capacity is 2420 MW heat and 1225 MW electricity (Flyktman 2002). The biggest CHP plant is the Pietarsaari plant with total boiler capacity of 550 MW. It produces 240 MW electricity, 100 MW process steam and 60 MW district heating. The main fuel of the municipal CHP is normally peat. The combustion technology is based on FBC technology (Tekes 2002).
Forest industry
The main user of wood fuels is forest industry. The number of industrial CHP plants is 40 and the total boiler capacity is 7 860 MW. The number of plants that produce only process steam is 8 and the total boiler capacity is 100 MW (Flyktman 2002). Also these power plants use peat for fuel beside the use of different wood residues.
72
Condensing power plants
There is only one condensing power plant that use wood for fuel. The total thermal boiler out output is 585 MW (Tekes 2002).
4.2.3 Consumption of forest chips for fuel
In Finland the proportion of wood in overall energy usage in currently the highest among all industrialised countries. The energy content of wood-derived fuels was 248.1trillion Btu (72.7 million MWh) in 1999. It is 20 % of the total energy consumption in Finland which was 1246 trillion Btu (365 million MWh) in 1999. More than half of the wood-derived fuels was waste liquors from pulping industry 135.2 trillion Btu (39.6 million MWh), and the rest was waste wood from forest industry 63.8 trillion Btu (18.7 million MWh), firewood, 44.0 trillion Btu (12.9 million MWh) and forest residues 5.5 trillion Btu (1.6 million MWh). The waste liquors and wood wastes from forest industry are at the moment totally utilized, mainly for fuel (Ministry of Trade and Indutsry 2001). The main potential to increase the use of wood fuels is related to the forest residues (Table 25).
Table 25. Wood energy consumption by source in Finland in 1999 (Ministry of Trade and Industry 2001, Hakkila 2000).
Source Million dry short tons
Trillion Btu 50 w-%
Million MWh 50 w-%
Black and other liquors Industrial forest residues Firewood Forest residues
4.4 3.0 0.4
135.2 63.8 44.0 5.1
39.6 18.7 12.9 1.5
Total 248.1 72.7
In 1995 the utilisation of forest chips for fuel in Finland was only 121 000 dry short tons (258 000 million solid m3), since then it has increased being 349 000 dry short tons (747 000 solid m3) in 1999 and 458 000 dry short tons (980 000 solid m3) in 2000.
On the raw material for forest residue chips in 1999 the share of whole trees was 96 000 dry short tons (206 000 solid m3), the share of delimbed stem chips 39 000 dry short tons (84 000 solid m3), the share of felling residues 176 000 dry short tons (376 000 million solid m3) and the share of other fuelwood 59 000 dry short tons (127 000 million solid m3 ) (Hakkila 2001) (Table 26).

73
Table 26. Raw material for forest residue fuel chips in Finland in 1999 (Hakkila 2000).
Source Dry short tons
Trillion Btu (50 w-%)
MWh (50 w-%)
m3
Small tree from thinnings - Whole trees - Delimbed stems Forest residues Other fuelwood (dead trees etc.)
96 000 39 000 176 000 59 000
1.4 0.6 2.6 0.9
410 000 167 000 748 000 253 000
206 000 84 000 376 000 127 000
Total 370 000 5.5 1 578 000 793 000
Forest residues are used for heat production (residential and district heating plants) and for combined heat and power production (municipal and forest industry). Use of forest residues in heating plants was 0.15 million dry short tons, in forest industry 0.05 million dry short tons and in municipal cogeneration 0.09 million dry short tons in 1999. Also a small amount of forest residues were used in residential buildings, about 0.07 million dry short tons in 1999. The biggest raise of forest residue use has been in combined heat and power production in Finland during the recent year (Table 27) (Hakkila 2001).
Table 27. End users of forest residues in Finland in 1999 (Hakkila 2001).
Dry short tons Trillion Btu (50 w-%)
Solid m3
Residential Heating plants Forest industry Cogeneration plants
65 000 146 000 51 000 86 000
1.0 2.1 0.7 1.3
140 000 313 000 109 000 185 000
Total 348 000 5.1 747 000
4.3 R&D on forest residue harvesting technology for fuel
The systematic R&D work relating to the harvesting and use of forest chips started in Finland in 1993 when the six years� national Bioenergy Research Program was started. The aim of the program was to increase the use of economically profitable and environmentally sound bioenergy by improving the competitiveness of existing peat and wood fuels. The total budget in 1993�1998 was 36 million $ (40 million Euro) (Asplund 2000). New machines and methods for wood fuel harvesting were developed. This work has been continued in the national Wood Energy Technology Program. The latter

74
program started in 1999 and it will last until the end of 2003. The budget for the years 1999�2003 is expected to be 36 million $ (40 million Euro).
The concrete target of the Wood Energy Technology Program is to create techno-economic conditions for increasing the annual use forest chips from 0.23 million dry short tons (0.5 million m3) in 1998 up to 1.2 million dry short tons (2.6 million cubic meters) by the year of 2003. The program has seven research areas: harvesting planning, chipping and crushing, harvesting systems, quality handling and storage, fuel receiving and handling, use of wood chips for fuel and environmental impacts (Hakkila 2001).
As a result of these R&D activities, the production cost of fuels from forest residues has been reduced considerably, resulting in a rapid increase in the use of forest chips in recent years. In addition to machine development, the focus has been in reducing harvesting and transportation costs by technology development work. Machines and methods developed in conjunction with these two national programs are presented in the following chapters on this report.
4.4 Harvesting chains for forest residues for fuel
4.4.1 Timber harvesting operations
Different systems are used in Finland for production of forest chips. The methods can be classified on the basis of the phase in which the chipping is carried out. The main methods used in Finland for production of forest chips are chipping at the terrain, at the roadside, at the terminal and at the mill. There is also a new harvesting technology which is based on bundling of forest residues. Each method can be divided into different working phases like terrain haulage, storage and drying, chipping or crushing and road transport to power plant (Fig. 20).
The dominating tree harvesting method in Finland is the cut-to-length system. It is used both in final felling and thinning sites. In this method the trees are felled, delimbed and sawn into logs of 3.3�6.5 yards (3�6 m) with the help of a harvester. The logs are then hauled to the roadside from where they are transported to the sawmills and paper mills.
In order to make the collecting of forest residues easier and more efficient, the working techniques of the harvester need to be changed a little. Normally the harvester cuts the trees on either one or both sides of the strip road. Processing of the stems takes place in front of the harvesting machine. In the traditional way of logging, the logging residues remain on the strip road and get trampled under the tires of the moving harvester. Forwarders use the same tracks for timber haulage. This means that logging residues are

75
difficult to collect and often contain harmful stones, soil and humus material. Therefore the working methods have to be modified so that the logging residues are piled up on the one or both sides of the harvester. This helps the loading of the forest residues from the ground and reduces stones coming with forest residues, being harmful for chippers and also for chip users (Savolainen & Bergren 2000).
Figure 20. Two main forest residues harvesting chains � chipping at roadside and bundling technology chain (picture from VTT Energy).
4.4.2 Chipping at the roadside landing
The production phases of the forest residues harvesting chain based on the chipping at the roadside landing are terrain haulage, storage and drying, chipping or crushing and road transport of forest residue chips to power plant (Fig. 21).
Logging residues are hauled to the roadside landing all year round from the surroundings of the terminal. Residues are stored at the terminal and dried there over the next summer, so it is possible to improve the quality of the fuel. Chipping of residues is carried out in all-year round, and chips are delivered by common solid fuel transportation vehicles. The objective is that logging residues are chipped directly to the long distance transport trailers without any storage of forest residue chips at the landing.

76
Figure 21. The forest residues harvesting chain based on chipping at the roadside landing � terrain haulage (left above), storage (right above), chipping into truck trailer (left below) and truck trailer road transport (right below) (photographs by VTT Energy).
4.4.2.1 Terrain haulage
The terrain haulage of forest residues is usually carried out with a conventional forwarder (Fig. 22). The productivity of a forwarder with regular equipment remains low for hauling logging residues because of a small load space. The load space needs to be enlarged to achieve better hauling productivity. The load space can be extended backwards, sideways and upwards. A medium-size forwarder with a regular load space can carry a load of approximately 5.3�6.6 cubic yards (4�5 m3) of fresh logging residue. By extending the load space backwards and by installing extra bolsters, a load size from 10.6 to 18.5 cubic yards (8 to 14 m3) can be attained (Savolainen & Bergren 2000). Since the bulk green density of logging residues is low, 134�251 lb per loose cubic yard (80�150 kg/loose m3), the mass of the load will remains below the limits of the machine capacity.
The regular timber grapple of the forwarder is not suitable for the loading of forest residues. The best grapple model for forest residue harvesting is fingered grapple. This grapple is like the timber grapple but the frontblade has been taken away (Alakangas et al. 1999).

77
The productivity of a normal forwarder is 4.7�9.3 dry short tons (10�20 m3) per hour depending on the haulage distance and load size (Fig. 22). For instance, if the load size is 9.2 cubic yard (7 m3) the productivity of the forwarder is about 8.4 dry short tons (18 m3) per hour with a haulage distance is 109 yards (100 m). If the distance is 545 yards (500 m) the productivity is about 3.7 dry short tons (8 m3) per hour. When the load size is 15.3 cubic yards (11.6 m3) the productivities using the same haulage distances are about 10.5 dry short tons (22.5 m3) and 5.8 dry short tons (12.4 m3) per hour (Alakangas et al. 1999).
Figure 22. Haulage of forest residues with forwarder (left) and with Havu-Hukka-trailer (right).
Vapo Oy Energy has introduced a Havu-Hukka logging residues trailer (Fig. 22). Logging residues are collected with the tractor�s loader into the trailer. The trailer is equipped with compressing sides, with which it is possible to compress the load into smaller volume. With the sides compressed, the trailer of approximately 59 cubic yard (45 m3) carries about 11 short tons (10 metric tons) of fresh logging residues, double the amount carried by a regularly equipped forwarder (Leinonen et al. 2000).
When the trailer is filled the compression sides are closed to road transport width and to keep the logging residues inside the trailer. When the sides are closed the trailer is suitable for road transport so the logging residues can be transported directly from the lot to the terminal. The maximum transportation distance is about 6.2 miles (10 km). Collection of logging residues can be done all-year round (Leinonen et al. 2000).
4.4.2.2 Storing and drying
Storing is an essential part of the forest residues harvesting chain. When planning the storage of forest residues the location of the storage and also the timing of the storage compared to the other working phases of the harvesting chain must be taken into

78
account. Forest residues are stored in heaps on the stand, in big stockpiles beside the road, or in central stockpiles at a special fuel terminal.
When building a residue pile, a few bundles of whole trees or treetops should be placed transversely on the bottom of the pile, in order to prevent the undermost logging residues from becoming contaminated with sand and from freezing to the ground in wintertime. Logging residues should be placed so that the butts of trees face to the road (Savolainen & Bergren 2000).
According the research results the stockpile dries effectively during the summer (Fig. 23), from the initial moisture content of 50�60 w-%, at the last even to less than 30 w-%. The best possible place for drying a logging residue stockpile is an as open and windy site as possible located in south-north direction. The stockpiles shall not, however, be placed too close to each other because this slows down the drying process. The stockpiles can be made as high as possible because it has been noticed that making the stockpile 5.5 yard (5 m) high did not slow down the drying compared to the drying of 3.3 yard (3 m) stockpiles. The tops of the stockpiles should be covered already during the stockpiling, or latest in August before the autumn rain season (Leinonen et al. 2000).
The forest residues on the stand dries as fast as in the stockpiles. So the forest residues that come out during spring and summer should be left for drying before forwarding them to the stockpile (Leinonen et al. 2000).
Figure 23. A forest residue stockpile (left) beside the road ) (photo by Arvo Leinonen) and a graph of forest residues drying in a stockpile (right).
4.4.2.3 Chipping or crushing
Tractor-driven, lorry-based and mobile crushers are used for chipping logging residues at the terminal (Fig. 24).
0
10
20
30
40
50
60
1.5. 1.6. 2.7. 2.8. 2.9. 3.10. 3.11.
Moi
stur
e co
nten
t, %
uncovered pilecovered pileat stand
1.5. 1.6. 1.7. 1.8. 1.9. 1.10. 1.11.
+ 55 mm +76 mm -33 mm
0
50
100
150
200
Moi
stur
e co
nten
t, kg
(H2O
)/loo
se m
3
evaporation - precipitation

79
Fundamental feature of the tractor-driven equipment is the agility and mobility even in hard conditions and on a ground with poor loadbearing capacity. The present tractor-operated chippers are equipped with turntable outlet pipe, which makes it possible to place the chip stockpile on a clean surface by the side of the machine combination. Jenz HEM 25Z and TT-97RMT drum chippers have been tested. The average output of these tractor chippers is 9.8 Odt (50 loose m3) of chips per productive hour, and the power demand of the tractor is 100 kW (Tiihonen et al. 2000).
Lorry-based chipping device can also be used in terminal chipping. The advantage of this is the large momentary chipping output. The limitations in operation are caused by the high total weight of the lorry-based chipping equipment as well as the high axle loads, which make the operation on the areas with low load-bearing capacity difficult or even impossible. The lorry-based JENZ chipper, equipped with 380 kW chipper, was tested at a terminal. The outlet pipe of the chipper can be turned sideward so it is possible to chip the logging residues either to the ground or directly into the long-distance transportation vehicle. The output of the chipper has been low, being only same as with a tractor chipper (Tiihonen et al. 2000).
Mobile crushers, equipped with own power sources, have also been tested in terminal chipping. Morbark 1100 bucket-crusher and Jenz 55 hammer-crusher, equipped with moving hammers, have been tested. Both of the crusher units are relatively large and the axle loads are high so they only can be used on areas with high load-bearing capacity. The maximum output of these equipment have been 19.6 dry short tons (100 bulk-m3) per productive hour. The power demand of the crusher is 225�275 kW (Tiihonen et al. 2000).
When chipping in winter, special attention has to be paid to snow removal from the top of the logging residue stockpile. Additionally, operators have to be protected against the moulds in the chips.
Figure 24. A mobile chipper on a truck chassis (left), a mobile tractor chipper (in the middle) and a crusher (right) (photos by VTT Processes).

80
4.4.2.4 Loading and long-distance transport
Normally logging residues are chipped directly into the chip trailer lorries. Chip lorry can be a full trailer lorry or a lorry without a trailer. Chip lorries used for long-distance transport are equipped either with bottom discharging devices or by a tipping gear. The load volume of a full trailer lorry is usually 118�158 cubic yard (90�120 m3). Dead load of a chip-trailer is 25.3 short tons (23 metric tons) and the maximum allowable total load is 66 short tons (60 metric tons), so the maximum payload is 40.7 short tons (37 metric tons). Devices which enable the load to be discharged from the back of the trailer make it possible to deliver chips to more plants at a time unlike with trailers capable for dipping by the side or to the back of the trailer. Depending on the chipper or crusher type the container of the chip truck must be loaded either from the back of the trailer or from above it (Leinonen et al. 2000).
The capacity of long-distance transport depends directly on the transport distance and on the number of the chip lorries used for the transport. Attaining a satisfactory annual output of 13 000�14 000 dry short tons (65 000 to 70 000 loose-m3) for a logging residues chipper on a lorry chassis, two full trailer lorries or three lorries without trailers are required for a long-distance transportation range of 50 miles (80 km.). Two lorries without trailers are sufficient for distances below 25 miles (40 km) (Alakangas et al. 1999).
4.4.3 Chipping at the terminal � harvesting chain
4.4.3.1 Harvesting chain
The production phases of the forest residues harvesting chain of forest residues for fuel based on the chipping at fuel terminal are terrain haulage, storage and drying, chipping or crushing of forest residues and road transport of forest residue chips to power plant. The working phases are the same as in the harvesting chain as in the chipping at the roadside.
In the method the forest residues are hauled from the surroundings to the fuel terminal. The haulage distance is about 109�545 yard (100�500 m) to roadside landing while it is less than 6 miles (10 km) to fuel terminal. For the terrain haulage of forest residues e.g. the Havu-Hukka forest residue trailer is used. It is more effective than the normal forwarder and also is allowed to be used for road transport (Fig. 25).
When Chipping at the fuel terminal, it is possible to chip forest residues either onto the ground or directly to the truck trailer. With chipping onto the ground it is possible to get

81
rid of the so called hot chain, provided the amount of forest residues is big enough and the chip storages become large enough.
Figure 25. Forest residue harvesting chain based on chipping at the fuel terminal � terrain haulage with Havu-Hukka trailer (left above), storage and chipping (right above), truck loading (left below) and truck trailer road transport (right below) (photos by VTT Processes) (Leinonen et al. 2000).
4.4.3.2 Fuel terminal
The main factors affecting the selection of the location for a mixed fuel terminal are the sufficient fuel reserves, sufficient space for storage piles of both raw material and the chips, roads with sufficient load bearing capacity and proper condition, open and windy location of the terminal area, and flat and load bearing ground with no extra impurities. Stockpile areas of peat production sites, gravel pits, storage field, etc. are proper locations for the terminals (Fig. 26) (Leinonen et al. 2000).
In the studies, the size of the terminal varied on the basis of the working site conditions and raw material stocks, being 6 600�26 300 loose cubic yard (5 000�20 000 loose m3) of logging residues. If the height of the storage is 5.5 yards (5.0 m), the corresponding

82
amount of chips is 2 630�10 500 loose cubic yards (2 000�8 000 loose m3). A circular terminal, dimensioned for logging residues, is presented in the Fig. 26. The volume of the terminal is about 6 600 loose cubic yards (5 000 loose m3) of logging residues. The height and the width of the logging residue stockpile in this model is 5.5 yards (5 m), so the volume of terminal chips produced from this amount is about 2 630 loose cubic yard (2 000 loose m3).
The ground of the fuel terminal area, especially the raw material and chips stockpile area, has to be load bearing and flat, and it must not contain stones. If operated on unpaved areas, the stockpile areas have to be backed in order to prevent the impurities such as stones from getting into the logging residues and chips. Additionally, the backing of the areas makes the terminals flat, which ease the loading of the chips. Peat, bark, saw dust or ash can be used as backing material for the stockpile areas.
Figure 26. A schematic picture of a circular terminal (left), chipping at circular terminal (in the middle) and storage of forest residue chips at terminal (right) (Leinonen et al. 2000).
4.4.3.3 Storing of forest residue chips
Chips have to be stored for several months before the use in order to ensure constant delivery of chips to the plant throughout the year. The storage problems include dry substance (ds) losses, wetting and freezing of the chips. Biological and chemical reactions, as well as the activity of wood decaying fungi cause ds-losses. Wetting of the chips in stockpiles is caused by rainfall and chemical reactions in the wood (Leinonen et al. 2000).
The main factor affecting the stockpiling of logging residue chips is the initial moisture content of the chips. The highr the initial moisture content is the greater are also the ds-losses. In long-term storage it is possible to prevent ds-losses by covering the stockpiles (Leinonen et al. 2000).

83
Long-term storage of the chips is not recommended due to high moisture and ds-losses. If long-term storing is necessary the initial moisture content of the chips has to be less than 30 w-% and the stockpile has to be covered, so that the ds-losses remain under 5 w-%. Long-term storing of chips is reasonable if the deliveries are to be ensured under all circumstances (Leinonen et al. 2000).
It is usually profitable to store the chips only for short-term to keep the moisture and ds-losses as low as possible. In short-term storing the ds-losses are low (< 1.0 %) if the storage time is less than two weeks. Short-term chip-stockpile does not need to be covered, but the stockpile has to be made as large as possible. The initial moisture content should also be as low as possible (< 30 w-%) (Leinonen et al. 2000).
4.4.3.4 Advantages of fuel terminal � harvesting chain
Forest residues dry very well at open fuel terminals. Also the harmful impurities like stones are easily avoided in this harvesting chain. By using terminal chipping of logging residues it is possible to produce high quality chips, the properties of which include homogenous chip size and low moisture content. These high quality chips are excellent fuels for communal scale heating plants.
4.4.3 Chipping at stand � harvesting chain
Terrain chipping is based on a single machine so called terrain chipper, which chips forest residues into a container at the stand and haul the chips in the container to the landing or to the roadside (Fig. 27). The container is emptied by tipping the chips into exchangeable containers at the roadside. The truck picks up the exchangeable container and transport it to the power plant and return the emptied container to the landing.
For terrain chipping the forest residues need to be piled along the logging track or strip road from where they can easily be loaded to the chipper feeding table of the chip harvester. Chip harvesters are typically built on a forwarder chassis. There are several machine sizes available on the market. The terrain chipper made by the Finnish S. Pinomaki is equipped with 26 cubic yard (20 m3) container (Savolainen & Bergren 2000).
For terrain chipping the productivity of forest haulage and chipping of 218 yard (200 m) is 3.0 to 4.0 dry short tons (15 to 20 loose m3) per schedule hour (Alakangas et al. 1999). In terrain chipping the logging residues are mostly processed when they are still fresh. Consequently, the resulting logging residue chips can have lower moisture content than fresh logging residue only in the summer season (Alakangas et al. 1999).

84
The advantage of terrain chipping, compared to roadside chipping, is that less machinery is required for harvesting, which makes the organization of the work remarkably easier. Additionally, less landing space is required for terrain chipping than for roadside chipping, and the chipping and lorry transportation do not function as a hot chain, as in the case of roadside chipping (Alakangas et al. 1999).
The disadvantages of terrain chipping include a fairly poor off-road capability and difficulties in achieving a satisfactory chip quality because of snow moistening the chips during the winter time (Alakangas et al. 1999).
Figure 27. Harvesting chain of forest residues based on the terrain chipper � harvester (left), loading of chips into the exchangeable container (in the middle) and loading of the container for truck transport to power plant (right) (photos by Arvo Leinonen and Biowatti Oy).
4.4.4 Chipping at power plant
The fourth major chain of processing logging residues for fuel is chipping or crushing them at the end use facility, which normally can be implemented more economically than in terrain or at the roadside (Fig. 28). Also processing at the plant avoids the problems of the hot chain, and chipping/crushing can be implemented more economically than at the stand, landing or roadside (Savolainen & Bergren 2000, Alakangas et al. 1999).
With chipping at the power plant, the terrain haulage is made by the same equipment as in roadside chipping. Also the chipping or crushing can be made by similar mobile machines as when chipping at roadside. In some power plants the chipping or crushing machine is stationary.
The main challenges of this chain are related to the long distance transportation of logging residues. At the moment normal peat and wood chip lorries are used for transportation of forest residues to power plant. The bulk density of forest residues varies between 218�301 lb/loose cubic yard (130�180 kg/loose m3), depending on the moisture content (30�50 w-%). Forest residues must be compacted while loading them
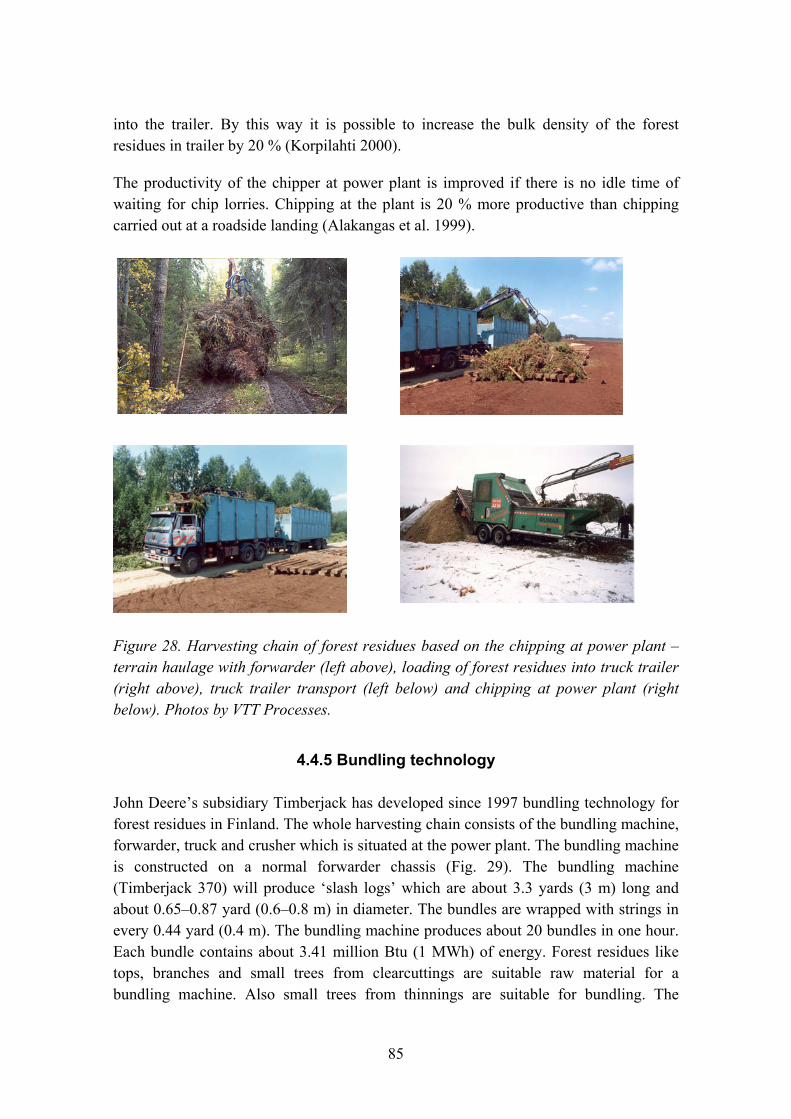
85
into the trailer. By this way it is possible to increase the bulk density of the forest residues in trailer by 20 % (Korpilahti 2000).
The productivity of the chipper at power plant is improved if there is no idle time of waiting for chip lorries. Chipping at the plant is 20 % more productive than chipping carried out at a roadside landing (Alakangas et al. 1999).
Figure 28. Harvesting chain of forest residues based on the chipping at power plant � terrain haulage with forwarder (left above), loading of forest residues into truck trailer (right above), truck trailer transport (left below) and chipping at power plant (right below). Photos by VTT Processes.
4.4.5 Bundling technology
John Deere�s subsidiary Timberjack has developed since 1997 bundling technology for forest residues in Finland. The whole harvesting chain consists of the bundling machine, forwarder, truck and crusher which is situated at the power plant. The bundling machine is constructed on a normal forwarder chassis (Fig. 29). The bundling machine (Timberjack 370) will produce �slash logs� which are about 3.3 yards (3 m) long and about 0.65�0.87 yard (0.6�0.8 m) in diameter. The bundles are wrapped with strings in every 0.44 yard (0.4 m). The bundling machine produces about 20 bundles in one hour. Each bundle contains about 3.41 million Btu (1 MWh) of energy. Forest residues like tops, branches and small trees from clearcuttings are suitable raw material for a bundling machine. Also small trees from thinnings are suitable for bundling. The

86
bundler is developed to be used together with the cut-to-length felling method. In this method the trees are delimbed on cutting site and the forest residues are left there (Timperi 2000).
The bundles are hauled with a standard forwarder to the road side. The bundles are handled like other assortments and the bundles form their own stacks at the roadside landing. The bundles are transported to the power plant with standard on-road trucks. Crushing or chipping is done at the power plant. The power demand of the crushers is 665�1330 hp (500�1000 kW). The capacity of the crushers is between 26�39 dry short tons per hour (130�200 bulk-m3/h) (Timperi 2000).
In Finland there are currently nine bundling units that produce bundles for fuel. The biggest consumer of forest residue bundles is Pietarsaari power plant which consumes about 300 000 bundles per year. The use of bundles for fuel in Finland is increasing (Timperi 2000). There are several chippers and crushers which are suitable for end use chipping. The power demand of these chippers and crushers are 265�400 hp (200�300 kW). The capacity of these machines is 30�87 dry short tons (150�445 bulk-m3) of chips per effective hour.
Figure 29. The bundling technology chain � bundling (left above), terrain hauling (right above), storage (left below) and road transport (right below).

87
4.5 Forest residues from thinnings
4.5.1 Thinning stands
Forest cycle
The Nordic forest management imitates the natural cycle of forest succession. Therefore stands are treated with repeated selective thinnings and finally with a regeneration or final cutting. The commercial thinnings (3) are preceded by a pre-commercial thinning, where timber is not recovered because of its small size. Pre-commercial thinning is made when the age of the trees is 10�20 years. The first commercial thinning is carried out when the trees are 25�40 years, the second when the trees are 40�55 years and the third when they are 55�70 years old. The final cutting is done when the trees are 70�120 years old (Mielikäinen & Hakkila 1998) (Table 28).
Forest residue potential from commercial and pre-commercial thinnings
The stands that are in the age of pre-commercial or first thinnings are called young stands. The annual potential of small-diameter wood chips from pre-commercial thinnings is about 0.5 million dry short tons (2.3 TWh, 50 w-%). The forest residue potential (whole-tree chips) from the first commercial thinnings is 2.3 million dry tons (9.6 TWh) per year. The total annual potential of wood fuel chips from young stands is 2.8 million dry short tons (11.9 TWh, 50 w-%) (Alakangas et al. 1999).
The pre-commercial thinnings that are made in time are not suitable for wood fuel harvesting because of the small amount of wood biomass. Suitable targets for energy wood harvesting are those areas that suffer from delayed pre-commercial thinnings. At the moment the need of pre-commercial and first thinnings substantially exceeds the actual cutting level. Due to the high nutrient contents of leaves and needles, it is recommended that energy wood harvested as whole-trees should be left at the site to dry so long that the needles/leaves fall (Savolainen & Bergren 2000).
Forest residue yield
Biomass yield from pre-commercial thinnings should be at least 3.8 dry short tons per acre (20 m3 per ha) for the harvesting of biomass for fuel to be economical. It is estimated that one third of the pre-commercial stands would meet this requirement (Mielikäinen & Hakkila 1998).
Because of the larger tree size, the biomass potential from the first commercial thinnings is considerably greater than from pre-commercial thinnings. The share of

88
forest residues of the total biomass on a first commercial stand is about 45 %. The typical timber yield from first commercial thinnings in Southern Finland is 5.7�9.5 dry short tons per acre (Savolainen & Bergren 2000). The rest 55 % (7.0�11.6 dry short tons/acre) consists of forest residue (Mielikäinen & Hakkila 1998).
Table 28. An example of forest management regime in southern Finland (Savolainen & Bergren 2000).
Treatment
Stand age Years
Stem volume ft3 (m3)
Timber yield Dry short ton/acre
(m3/ha)
Pre-commercial thinning 1st commercial thinning 2nd commercial thinning 3rd commercial thinning Final cutting for regeneration
10�20 25�40 40�55 55�70
0.7 (0.02) 1.1�2.8 (0.03�0.08) 3.2�5.3 (0.09�0.15) 5.3�8.8 (0.15�0.25) 7.0�24.6 (0.2�0.70)
� 5.7�9.5 (30�50)
7.6�15.2 (40�80) 11.3�17.0 (60�90)
37.8�56.79 (200�300)
4.5.2 Small tree chips as a fuel
Small tree chips from pre-commercial and first thinnings are made from whole trees (whole tree chips) or from delimbed stems (log chips). Farms and small-houses excluded, the use of small tree chips is very small in Finland because of the higher price of the chips compared to the forest residue chips. The reason for the higher prize of small tree chips is the small tree volume and the small total yield of wood biomass that is possible to be collected from the stands. Small tree chips are mainly used by heating plants. They are able to pay for the fuel more than power plants.
The total production of small tree chips was 0.14 million dry tons in Finland in 1999. Of this the share of whole tree chips was 0.096 million dry short tons and the share of log chips was 0.039 million dry short tons.
At the moment the target is to decrease the production costs of small tree chips by developing harvesting technology, management and logistics. This R&D work is done in a national Wood energy technology -research program.
89
4.5.3 Harvesting technology for young stands
4.5.3.1 Harvesting technology for pre-commercial thinning
From pre-commercial thinnings it is possible to harvest only wood chips for fuel because of the small size of the trees. The most common harvesting chain is based on the roadside chipping method in which the trees are harvested as whole trees to the landing where they are chipped.
At the moment the felling is made manually with a chainsaw, using a felling-piling technique (Fig. 30). In this method the trees are cut and piled beside the striproad as whole trees or as 5.5�7.7 yards (5�7 m) long tree sections. The performance of chainsaw felling varies between 0.7 and 1.9 dry short tons (1.5�4 m3) of delimbed trees per hour, depending on tree size, tree species, undergrowth, terrain, snow cover etc. (Mielikäinen & Hakkila 1998). In a another study the performance of chainsaw felling has varied from (0.1�0.3 dry short ton/h (0.24�0.64 m3/h) (Hämäläinen et al. 1998 a).
After felling the tree bunches are transported with the forwarder to the landing beside the road. At the landing site the trees are piled. During the heating season the trees are chipped and hauled by truck to the consumers. The capacity of the forwarder has been 1.9�2.6 dry short tons per productive hour (4.1�5.5 m3) at the first commercial stand (Hämäläinen at al. 1998 b).
Timberjack has developed a mechanized method for restoring and managing young forests (Fig. 31). The basis of this method is a multifunctioning accumulative harvester head, which collects the cleared trunks quickly and efficiently. The automatically controlled harvester head collects up to 10 trunks at a time. The bundle of trees is then stacked at the striproadside. After cutting, the trees are hauled to the landing area with the forwarder (Timperi 2000).

90
Figure 30. Whole-tree chip harvesting chain from pre-commercial thinnings and first commercial thinnings when only wood fuel chips are produced (Tekes 2002).
Figure 31. Thinning harvester (left) and small trees for wood fuel in a storage (right) (photos by Arto Timperi, Timberjack and Kari Hillebrand, VTT).
The chipping at the terrain method is used also for harvesting small tree chips for fuel in Finland. In this method the trees are felled manually with a chainsaw using the felling-piling technique. The harvesting of the trees is made by a terrain chipper which chips forest residues into the container at the stand and haul the chips in the container to the landing or roadside. The container is unloaded by tipping the chips to exchangeable containers at the roadside. A truck picks up the exchangeable container and haul it to the power plant and return the container to the landing. The capacity of the terrain chipper is about 3.7 dry short tons (8 m3) per hour (Mielikäinen & Hakkila 1998).

91
4.5.3.2 Harvesting technology for first commercial thinning
From first commercial thinnings it is possible to produce puplwood and wood chips for fuel. The pulpwood is harvested using the cut-to-length method. In this method the trees are cut, delimbed and crosscut to certain length with a harvester. The timber logs are hauled to the roadside with a forwarder.
The fuelwood is harvested at the same time as timber. It can be harvested as whole trees, tree sections or stems. When harvesting whole trees or tree sections, small trees are cut with a harvester. They are piled together with tops and branches from pulpwood beside the striproad using harvester. When producing stems for fuel, small trees and tops from pulpwood are delimbed and piled beside the striproad using a harvester. From the striproadside the fuelwood is hauled with the forwarder to the roadside. The fuel is chipped at the landing and transported with trucks to consumer.
The small trees at first commercial thinning stand can be cut also manually using the chain saw felling/piling technique. Hauling, piling and chipping phases are carried out by the same way as in mechanized cutting.
Also so-called integrated harvesting of pulp and fuel wood has been used in small extent in Finland. In this method, a mobile chain flail-delimber/debarker equipped with a hammer crusher for wood fuel is used. The stems are cut and transported as whole trees to the landing where the trees are delimbed and debarked by flailing them with rotating steel chains (Asplund 2000).
4.6 Production costs of forest residues for fuel
4.6.1 Production costs of forest residue chips from final cutting
Korpilahti (2000) has calculated the harvesting costs of forest residue chips for four main methods used in Finland. The calculations are based on research data (Table 29). The data which are used in the calculations are presented in Appendix 6.
The most economical harvesting chain of forest residue chips was chipping at the power plant. The production costs of the chips at the power plant using this method was 31.1$/dry short ton, when the road transport distance was 50 miles (80 km). This method is used in a few plants in Finland. The road transport costs in this method can be decreased by increasing the net load of the trucks. This is possible by compressing the forest residues in the truck (Korpilahti 2000).

92
Production costs of forest residue chips using chipping at the roadside chain was 32.4 $/dry short ton. This is only 4 % more than using chipping at the power plant chain. This chain is the primary production chain in Finland (Korpilahti 2000).
Production costs using bundling technology chain was 35.0 $/dry short ton. This is 13 % more than when chipping at the power plant. The bundling technology has just recently been developed and it has been in use in Finland for only some years. Therefore there are lots of possibilities to develop it further, especially associated with the bundler efficiency and truck transport (Korpilahti 2000).
The most expensive harvesting chain of forest residues was chipping at the terrain. The harvesting costs using this method were 37 % more than using the chipping at the power plant chain, being 42.6 $/dry short ton (Korpilahti 2000). This method is used in some extent in Finland.
Table 29. The costs of the four harvesting chain of forest residues (Korpilahti 2001). Bundle means bundling harvesting chain, Terrain chip is chipping at terrain chain, Road chip is chipping at roadside chain and Plant chip is chipping at the plant harvesting chain.
Work phase Bundle
$/Odt
Terrain chip
$/Odt
Road Chip
$/Odt
Plant chip
$/Odt
Bundle $/MWh
50 w-%
Terrain chip
$/MWh
50 w-%
Road chip
$/MWh
50 w-%
Plant chip
$/MWh
50 w-%
Bundling Forest haulage � 300 m
Chipping at stand or roadside Road transport � 80 km Chipping at power plant Total
12.8 6.0
-
13.2 3.0
35.0
�-
26.81
15.82
�42.6
�9.89.8
12.8�
32.4
�9.8
�
18.33.0
31.1
3.01.4
�
3.10.78.2
� �
6.31
3.72 �
10.0
� 2.3 2.3
3.0 �
7.6
�2.3
�
4.30.77.4
1 Includes forest residue chipping and terrain haulage of chips 2 Road transport is carried out by using exchangeable containers
4.6.2 Production costs of forest residues from thinnings
Harvesting costs of small tree chips from pre-commercial and first commercial thinning stands are higher than the costs of forest residue chips from regeneration areas. The reason for that is the small tree volume and thus the small wood yield per acre from thinning stands.

93
The harvesting cost of wood chips from pre-commercial and first commcercial thinnings is presented in Table 31. Because the harvesting costs depend largely on the properties of the sites, the presented data are only trendsetting.
Pre-commercial thinnings
At the pre-commercial thinning stand only whole tree chips were harvested. In the study the harvesting chain was based on the chipping at the terrain. The felling was made manually. On the study site the amount of trees cut was 5 300�22 000 trees/ha, mean height 3.3�5.5 yards (3�5 m) and the total harvested biomass amounted to 4.9�14.2 dry short tons per acre (26�75 m3/ha). The total costs of whole-tree chips from the pre-commercial stand was 36.6�47.7 $/dry short ton (8.6�11.2 $/MWh) (Hämäläinen et al. 1998a). This is 18�53 % more than the costs from the final felling areas (31.1 $/dry short ton).
First commercial thinnings
In the study made at the first commercial stands two methods were used for wood fuel harvesting. One was the combined timber and fuel chips harvesting method. In the other one, all cut trees at the stands were chipped for fuel. In the study the initial stand-density was 2630 trees per acre (6 500 trees per ha). The two stands were thinned to a density of about 405 trees per acre (1 000 trees per ha). Harvesting yield at the stands was 6�21 dry short tons per acre (30�110 m3/ha). The trees were cut with a multi-tree handling felling device. Whole-trees were hauled by a forwarder to the landing. In the combined harvesting method the whole-trees were processed with a flail-debarking chipper. The yield of the pulp chips was 50�66 %. In the combined harvesting method the residues were used for fuel chips and the harvesting costs of fuel chips at the power plant were 52.8 $ per dry short ton (12.4 $/MWh, 50 w-%). The harvesting costs were 61.8 $ per dry short ton (14.5 $/MWh, 50 w-%) when all whole-trees were made for fuel at the landing (Table 30) (Hämäläinen et al. 1998b). In this method the harvesting costs were higher than in the combined harvesting method.
Subsidies to harvest wood fuel from young stands
In Finland it is currently possible to get subsidies to harvest wood fuel from young stands. These subsidies are about 8.9 $/dry short ton (2.1 $/MWh) (Alakangas & Flyktman 2001). There are some rules for these subsidies. It is also possible to get support for chipping wood residues and small wood from young stands. These chipping subsidies are about 7.7 $/dry short tons (1.8 $/MWh). Altogether these subsidies are 16.6 $/dry short tons (3.9 $/MWh). With these subsidies the use of whole tree chips from thinnings is competitive with using forest residue chips from final fellings.

94
Table 30. Harvesting costs of wood fuel from pre-commercial and first commercial thinning (Hämäläinen et al.1998a, Hämäläinen et al. 1998b). In the first commmercial thinning stand all harvested trees were made for fuel.
Pre-commercial thinning Terrain chipping chain
$/Odt ($/MWh, 50 w-%)
First commercial thinning Chipping at the roadside $/Odt ($/MWh, 50 w-%)
Manual felling/piling Terrain chipping and Haulage (250 m)
Mechanical felling and terrain haulage Chipping at the roadside
Road transport and organization Organization
8.5�22.6 (2.0�5.3) 13.6�28.1 (3.2�6.6)
10.7 (2.5)
37.9 (8.9)
7.7 (1.8)
13.6 (3.2)
2.6 (0.6) Total 36.6�47.7 (8.6�11.2) 61.8 (14.5)
4.7 Social and economical impacts of forest fuels
Compared with imported fuels, the use of forest chips creates more long-term jobs. In small countryside communities, forest residue production offers one of the few industrial jobs. It also creates additional job opportunities and livelihood, thus supporting the traditional agriculture and forestry.
The University of Oulu (Mäenpää & Männistö 1995) has assessed direct and indirect effects of forest residue production, transport and use on employment in Finland. The study presented the employment effects as man-years per produced MWh of forest residue chips. The total (direct and indirect) effect of harvesting and road transport of forest chips and use in medium size co-generation plant (17/40 MWe/MWh) on employment is about 2 910 man-years per 1 million dry short ton (4.28 TWh, 50 w-%). Based on these calculations, the total employment effect of forest residue chip production (0.35 dry short tons, 1.5 million TWh) on employment in Finland in 1999 has been estimated (Table 31). According to the results, the direct and indirect effects of forest fuel production and use were in total about 1000 man-years. Of this amount the share of production and transport 350, and the share of use 650 man-years.

95
Table 31. The direct and indirect impact of forest fuel production and use (0.35 million dry short tons) on employment in Finland in 1999.
Working phase Effect on employment Man-years
Harvesting and transport Use
350 650
Total 1 000
4.8 Environmental impacts of harvesting logging residues
In Finland the following disadvantages of harvesting logging residues from regeneration sites have been indentified:
- organic material is removed from the nutrient cycle,
- the amount of humus protecting the soil is decreased,
- some nutrients are removed from the ecosystem,
- Increased risk of acidification, and
- danger of growth losses.
On the other hand the following advantages can be named:
- nutrient leaching to waterways is decreased,
- soil preparation can be accomplished with less radical means,
- more natural development in regeneration areas,
- planting can be done earlier regeneration areas are not covered with grass and there
is less need for fighting against grass,
- planting is easier and it is often possible to use smaller plans,
- aesthetic and recreational value of involved areas is enhanced,
- forest regeneration cost are remarkably decreased, and
- forest regeneration is faster and the results are expected to be better.
Removal of logging residues reduces both organic material and nutrients. It is inadvisable to harvest logging residues, particularly fresh with needle mass, from nutrient-poor soils and peatlands. Finnish research indicates, that logging residues influence on the acidity of the humus layer, but not significantly. Whole tree logging causes increase of 0.2 to 0.4 pH units in the soil (Alakangas et al. 1999).

96
Nutrients released from logging residue are partially leached from the felling area. Final felling can double the nutrient release from the logging areas. Harvesting logging residues seems to decrease the leaching of most nutrients during the first years after regeneration felling (Alakangas et al. 1999).
In the spruce regeneration tests carried out by the Finnish Forest Research Institute, complete harvesting of logging residues (fresh) was not found to slow down the height increment. The nutrient requirements of trees are greatest at the crown closure stage, or at the age of 30 to 50 years, depending on the fertility of the biotope. Removal of nutrients of the ecosystem therefore manifests itself more pronouncedly in connection with thinning than with regeneration felling (Alakangas et al. 1999).
More mineral soil is exposed and more favorable planting points are available in regeneration areas where logging residues have been harvested. Soil machinery in these areas can be carried out with lighter machinery, which results in cleaner outcome (Alakangas et al. 1999).
If logging residues have been harvested, the actual regeneration work can be carried out sooner than in the regular regeneration schedule. An area felled in spring can be planted during the same summer. The accelerated regeneration schedule is particularly beneficial in grassy areas (Alakangas et al. 1999).
The more fertile the soil is, the larger the piles left in the felling area will be. Efficient removal of logging residue exerts a favorable influence on the aesthetic and recreational value of the area. All kinds of movement in the area are improved by harvesting logging residue (Alakangas et al. 1999).
4.9 The competitiveness of forest residues as a fuel
4.9.1 Fuel prices
Forest residues chips are mostly used at the power plants which are situated inland of Finland. The fuels that are possible to use inland beside wood are peat, coal and in some cases also natural gas.
In heat production there is excise tax for different fuels. The tax depends on the fuel type. There is a also certain precautionary stock fee for fuels, but it is very low and abandoned in this analysis. For wood there is no excise tax because it is considered to be renewable fuel. For peat the excise tax was 0.4 $/MBtu (1.4 $/MWh), 1.6 $/MBtu (5.4 $/MWh for coal and 0.5 $/MBtu (1.6 $/MWh) for natural gas in June 2001. There

97
is excise tax also for the use of electricity in Finland. It does not depend on the fuel by which electricity is produced. For households the electricity tax was 0.64 cent/kWh in June 2001, for industry it was 0.39 cent/kWh.
Wood chips are at the moment competitive in heat and in electricity production. The price of wood, peat and natural gas was nearly the same (2.1 $/MBtu) in electricity production in 2001. Only the price of coal was little bit higher, 2.3 $/MBtu. The prices of different fuels differ from each other in heat production because of the excise tax. The most expensive fuel in heat production is coal (3.9 $/MBtu) and the cheapest is wood (2.1 $/MBtu) (Table 32).
The price of electricity for households was in June 2001 from 5.0 to 8.9 cent/kWh depending on the household type. The electricity price for industry was 4.6�5.8 cent/kWh depending on the size of the industry facility.
Table 32. Fuel prices in heat and electricity production at power plant (road transport distance with solid fuels 100 km) in Finland in June 2001 (Ministry of Trade and Industry 2001). Prices exclude the VAT (value added tax).
Heat Electricity Fuel $/MBtu $/MWh $/MBtu $/MWh
Wood Peat Coal
Natural gas
2.1 2.5 3.9 2.6
7.0 8.4 13.3 9.0
2.1 2.1 2.3 2.1
7.0 7.0 7.9 7.3
4.9.2 Production costs of heat and electricity
Production costs of heat and electricity
Biomass cogeneration (CHP) power plants are built in Finland for financial gain. Cogeneration must be cheaper than the acquisition of corresponding amounts of power and heat with other methods. It is normally more costly to build but cheaper to operate a CHP plant than a plant employing other production methods (Alakangas & Flyktman 2001).
In Table 34, the production costs of electricity and heat in CHP power plants are presented. The production costs of heat in the calculation is fixed to be the same for different fuels. The bigger the power plant is, the smaller are the production costs of electricity. Wood is most economical fuel (1.1�1.6 cent $/kWh) compared to natural gas (1.8�2.3 cent/kWh) and coal (2.1�3.0 cent/kWh) (Alakangas & Flyktman 2001).

98
Subsidies
In Finland there are different subsidies for wood fuel. There is 30 % investment aid for constructing the wood fired power plant. The investment aid is about 0.3�0.6 $/MBtu (0.9�2.1 $/MWh) depending on the type of the power plant. In addition there are no environmental taxes for wood in heat production. In 2001 the environmental tax for coal was 1.6 $/Mbtu (5.4 $/MWh). Support in wood electricity production is 0.2�0.4 $/MBtu (0.8�1.5 $/MWh) depending whether the power plant is municipal or industrial CHP or condensing power plant. There are also subsidies worth 1.1 $/MBtu (3.9 $/MWh) to harvesting and chipping wood from thinnings. The subsidies for the use wood for fuel can totally be 1.5�1.8 $/MBtu (5.2�6.1 $/MWh) in heat production and 1.7�2.0 $/Mbtu (5.7�6.7 $/MWh) in conbined heat and power production (Alakangas & Flyktman 2001).
Table 33. Production costs of electricity and heat in Finland in some CHP plants in 199 (Alakangas & Flyktman 2001).
CHP Power plant MWe/MWheat
Fuel Production costs of heat
$/MWh (Euro/MWh)
Production costs of Electricity
cent/kWh (Euro/MWh)
17/40 MW
60/120 MW 20/24 MW 55/65 MW 17/40 MW 60/120 MW
Coal Coal
Natural gas Natural gas
Wood Wood
18 (20) 18 (20) 19 (21) 18 (20) 18 (20) 18(20)
3.0 (33) 2.1 (23) 2.3 (25) 1.8 (20) 1.6 (18) 1.1 (12)
4.10 Use of forest residues in the future
The target for the future is to increase the use of forest residues as fuel. The objective set by the Finnish Ministry of Trade and Industry is to increase the use of renewable energy sources from the level of 1995 by 10.0 trillion Btu (34 million MWh) by the year 2010. 90 % of this increase is expected to be covered by bioenergy. The objective is to increase the utilisation of forest chips from the level of 0.13 million dry tons (0.58 TWh) in 1995 to 2.3 million dry short tons (10 million MWh) by the year 2010 (Alakangas 2002).

99
5. Comparison of USA and Finnish forest residue chips harvesting and consumption
5.1 Forest residue potential
5.1.1 Forest resources
The total forest land area in the USA (747 million acres) is 13.8 times higher than in Finland (54.1 million acres). However the whole forestland is not available for timber harvesting. The forest land area available for timber supply is in the United States 504 million acres, about 10 times more than in Finland (51.1 million acres). At the moment the annual cutting area in the USA is 2.0 % (10.0 million acres) of the timberland area and in Finland is 2.6 % (1.30 million acre). The annual roundwood production in the USA (16 430 million ft3) is approximately 7.5 times bigger than in Finland (2 148 million ft3). The roundwood yield per acre in the USA and in Finland is quite the same 1 640 ft3 per acre (115 m3 per ha).
The annual amount of logging residues including other removals generated at the felling stands was 71.5 million dry short tons in the USA and 13.6 million dry short tons in Finland.
Table 34. Forest resources and their annual utilization in the United States and in Finland.
The United States (1996)
Finland
(1999) Total forest land, million acre (million ha) Timberland area, million acre (million ha) Cutting area, million acre (million ha) - The share of clear cutting, % Roundwood production, million ft3 (million m3) Logging residues, million Odt (million m3) Logging residues + other removals, million Odt (million m3)
747 (302) 504 (204)
About 10.0 (4.0) About 38
16 430 (467)
71.5 (137)
54.1 (21.9) 51.1 (20.7) 1.30 (0.53)2
25 2 148 (61)
13.6 (29)

100
5.1.2 Forest residue potential for fuel
In the USA the forest residue potential consists of logging residues (23.8�44.8 million dry short tons), polewood from thinnings (17.0�65.0 million dry short tons) and wood from short rotation woody crop plantations (35.5 million dry short tons). The total forest residue potential from clearcuttings and thinnings in the USA is 40.8�109.8 million dry short tons (177.9�478.7 million MWh). If SRWC is included the potential is 76.3�145.3 million dry short tons (332.7�633.5 million MWh).
In Finland the forest residue potential consists mainly of forest residues from final felling and thinning areas and is in total 6.1�7.4 million dry short tons (25.8�31.6 million MWh).
The forest residue and smallwood potential in the USA (40.8 million dry short ton at the price less than 30 $/dry short ton delivered at the power plant) is 6�7 times bigger than the forest residue potential from final cuttings and thinnings (6.1�7.4 million dry short ton) in Finland. The difference is greater if the forest residue potential at the higher price than 30 $/dry short ton in the USA is considered.
Table 35. Forest residue and SRWC potential in the United States and Finland.
United States
Million dry short tons
(million MWh,50 %)
Finland
Million dry short tons
(million MWh, 50 %)
Logging residues from final fellings
Logging residues
- Cost below 30�50 $/dry short ton
Smallwood from thinnings
- Cost below 30�50 $/dry short ton
Forest residues from pre-commercial and commercial thinnings
SRWC
- Cost below 32.9 $/dry short ton
Whole-tree chips from unproductive stands and pre-commercial stands
23.8�44.8 (103.8-195.3)
17.0�65.0 (74.1�283.4)
35.5 (154.8)
2.9�4.2 (12.3�18.1)
2.8 (11.9)
0.4 (1.6)
Total 76.3�145.3 (332.7�633.5) 6.1�7.4 (25.8�31.6)

101
5.2 Use of forest residue as fuel
5.2.1 Energy use in the United States and Finland
The share of renewable energy use in Finland (23 %) is higher than in the USA (7.5 %). The share of wood in the total energy consumption in Finland is about 20.0 %, in the USA it is only about 2.6 %. The use of forest residues for fuel in the USA was 59.5�76.5 trillion Btu (15.3�19.6 TWh, 50 w-%) and in Finland it was 5.1 trillion Btu (1.5 TWh) in 1999.
Table 36. Energy use in the United States and in Finland.
United States (1999) Trillion Btu
(TWh)
Finland (1999) Trillion Btu
(TWh)
Total energy consumption Total renewable energy consumption Total biomass use for fuel Total wood use for fuel Total use of forest residues
96 435 (28 260) 7 212 (2 115)
3 208 (941) (0 w-%) 2 555 (749) (0 w-%)
59.4�76.4 (15.3�19.6) (0 w-%)
1 247 (365) 291 (85)
248(73) (50 w-%) 248 (73) (50 w-%) 5.1 (1.5) (50 w-%)
5.2.2 Wood energy consumption
Wood derived fuel in the USA is mainly (69 %) used in the forest industry in CHP plants, in 1994 the use was 1611 trillion Btu (414 TWh, 50 w-%). In forest industry wood derived fuels includes black liquor, residues from sawmills, waste wood and wood harvested directly from trees. Wood fuel use in residential and commercial buildings was 25 % of the total wood fuel use and amounted 582 trillion Btu (149 TWh). In residential and commercial buildings wood is used as firewood but also a small amount of wood is used as whole-tree chips in commercial buildings. The rest 6 % of wood fuel were used in independent and utility electric power sector was 152 trillion Btu (39 TWh) in the USA in 1994. This wood fuel includes whole-tree chips and also wood chips made from different wood resources.
Also in Finland the main user of wood fuel is forest industry which was 199 trillion Btu (58 TWh) in 1999. It was about 81 % of the total consumption of wood fuel and consists of black liquor, residues from sawmills and forest residues. 18 % of the wood fuel consumption is used in residential buildings as firewood amounted 44.0 trillion Btu (12.9 TWh) and as forest residue chips, 1.0 trillion Btu (0.3 million MWh). The rest of

102
the wood fuel (1 %) was used in municipal CHP and heating plants power. It includes industrial wood residues (unknown) and forest residues amounted 3.4 trillion Btu (1.0 million MWh).
Table 37. The use of wood derived fuels in the United States and Finland. The consumption of wood in industry in the USA is based on the reference Walsh 2002 and Energy Information Adiministration 2002d.
United States (1994)1,2 Finland (1999)
Trillion Btu 0 w-%
TWh 50 w-%
Trillion Btu 50 w-%
TWh 50 w-%
Industry - Black liquor
- Industrial wood residues and by-products
- Waste wood - Wood harvested directly
from trees - Forest residues Residential and commercial - Firewood - Forest residues Other(electric power sector)
Municipal CHP and heating plants - Industrial wood residues - Forest residues
882.0
503.2
37.4 188.7
582.0
152.0
226.4
129.2
9.6 48.4
149.4
39.0
135.2
63.83
0.7
44.0 1.0
3.4
39.6
18.73
0.2
12.9 0.3
1.0 All together 2345.3 602.0 248.1 72.7 1 Walsh 2002, 2 Energy Information Administration 2002d and 3 Including use of industrial wood residues and by-products in municipal CHP and heating plants.
5.2.5 Consumption of forest residues for fuel
At the moment the use of forest residues in the USA for fuel is 3.5�4.5 million dry short tons (15.3�19.6 TWh). In the USA the forest residue chips are harvested from thinnings and final felling stands. The main user of forest residues is electricity power industry. The main user of forest residues in the USA is electric power industry. The electricity power plants are mainly situated in California, in the Northwest and Northeast. Forest
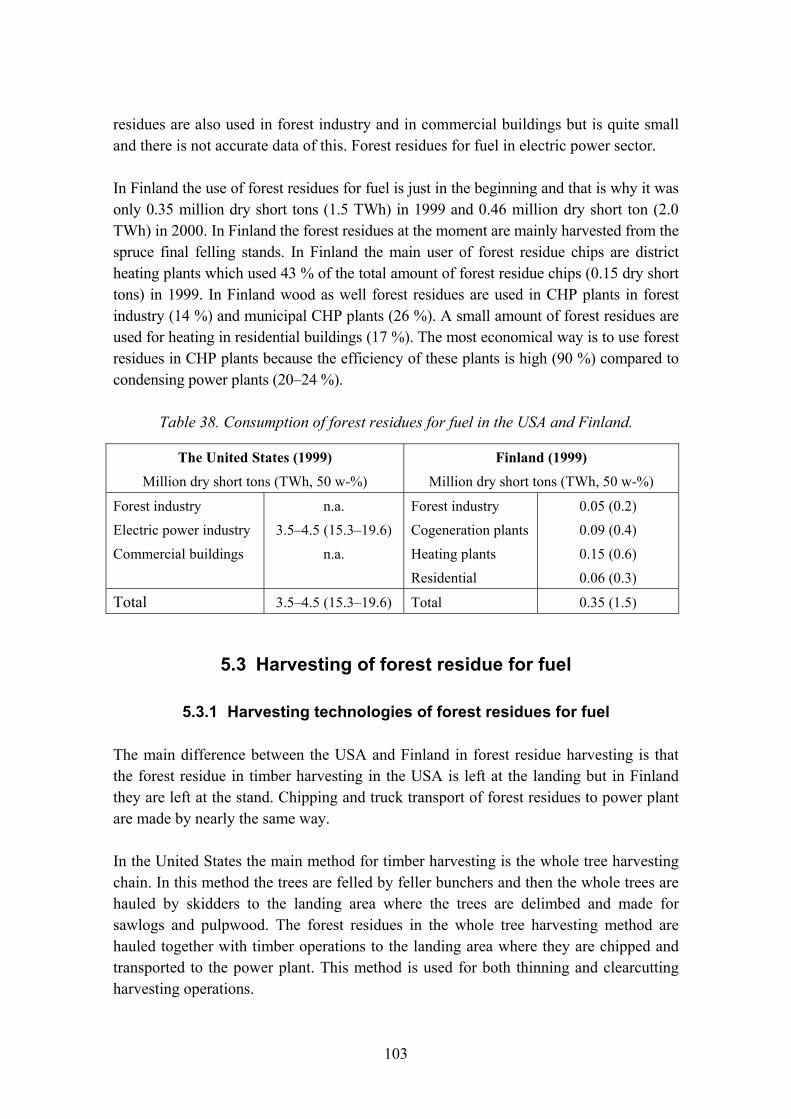
103
residues are also used in forest industry and in commercial buildings but is quite small and there is not accurate data of this. Forest residues for fuel in electric power sector.
In Finland the use of forest residues for fuel is just in the beginning and that is why it was only 0.35 million dry short tons (1.5 TWh) in 1999 and 0.46 million dry short ton (2.0 TWh) in 2000. In Finland the forest residues at the moment are mainly harvested from the spruce final felling stands. In Finland the main user of forest residue chips are district heating plants which used 43 % of the total amount of forest residue chips (0.15 dry short tons) in 1999. In Finland wood as well forest residues are used in CHP plants in forest industry (14 %) and municipal CHP plants (26 %). A small amount of forest residues are used for heating in residential buildings (17 %). The most economical way is to use forest residues in CHP plants because the efficiency of these plants is high (90 %) compared to condensing power plants (20�24 %).
Table 38. Consumption of forest residues for fuel in the USA and Finland.
The United States (1999) Million dry short tons (TWh, 50 w-%)
Finland (1999) Million dry short tons (TWh, 50 w-%)
Forest industry Electric power industry Commercial buildings
n.a. 3.5�4.5 (15.3�19.6)
n.a.
Forest industry Cogeneration plants Heating plants Residential
0.05 (0.2) 0.09 (0.4) 0.15 (0.6) 0.06 (0.3)
Total 3.5�4.5 (15.3�19.6) Total 0.35 (1.5)
5.3 Harvesting of forest residue for fuel
5.3.1 Harvesting technologies of forest residues for fuel
The main difference between the USA and Finland in forest residue harvesting is that the forest residue in timber harvesting in the USA is left at the landing but in Finland they are left at the stand. Chipping and truck transport of forest residues to power plant are made by nearly the same way.
In the United States the main method for timber harvesting is the whole tree harvesting chain. In this method the trees are felled by feller bunchers and then the whole trees are hauled by skidders to the landing area where the trees are delimbed and made for sawlogs and pulpwood. The forest residues in the whole tree harvesting method are hauled together with timber operations to the landing area where they are chipped and transported to the power plant. This method is used for both thinning and clearcutting harvesting operations.

104
In Finland the main method in timber harvesting is the cut-to-length method in which the trees are cut, delimbed and crosscut at the stand. The logs and pulpwood are hauled to the landing with forwarders. The cut-to-length method is used for both thinning and final felling harvesting operations. At the moment forest residues from final felling areas can be utilized for fuel because of the low enough harvesting costs.
In the cut-to-length harvesting method the forest residues are left on the stand. Harvesting of forest residues for fuel is carried out as much as possible integrated with timber harvesting. There are many alternatives to gather them from there to the power plant:
- chipping at the roadside method,
- terrain chipping method,
- chipping at the power plant, and - Bundling technology.
In Finland many different forest residues harvesting methods are in use. The most common harvesting method is the so-called chipping at the roadside method. In this method the forest residues are collected by a forwarder to the landing, where they are chipped and transported to the power plant as in the United States. The newest method in Finland however is the bundling technology. In this method the forest residues are bundled and hauled by the forwarders to the roadside. From the landing area the forest residue logs are hauled to the power plant by the same trucks as sawlogs and pulpwood.
5.3.2 Harvesting yield
Harvesting yield has a great effect on the harvesting costs of forest residues. The average harvesting yield of timber is a little bit higher in the USA (24.3 dry short ton/acre) than in Finland (22.0 dry short ton/acre). However the average yield of forest residues is higher in Finland (10.4 dry short ton/acre) than in the USA (9.2 dry short ton/acre). In the USA the forest residue yield from final felling stands (loblolly pine � 23 years old) has been measured 9.2 dry short tons per acre. In Finland the forest residue harvesting has been focused at the moment on the spruce final felling stands where the forest residue yield is high, 9.5�13.2 dry short tons per acre.
The yield of forest residues from thinnings varies in the USA from 3.5 to 14.0 dry short tons per acre. In Finland the yield of forest residues from first commercial thinning is 7.0�11.6 dry short tons per acre. Biomass yield from pre-commercial thinnings should be at least 3.8 dry short ton per acre (20 m3 per ha) for the harvesting of biomass for fuel to be economical.
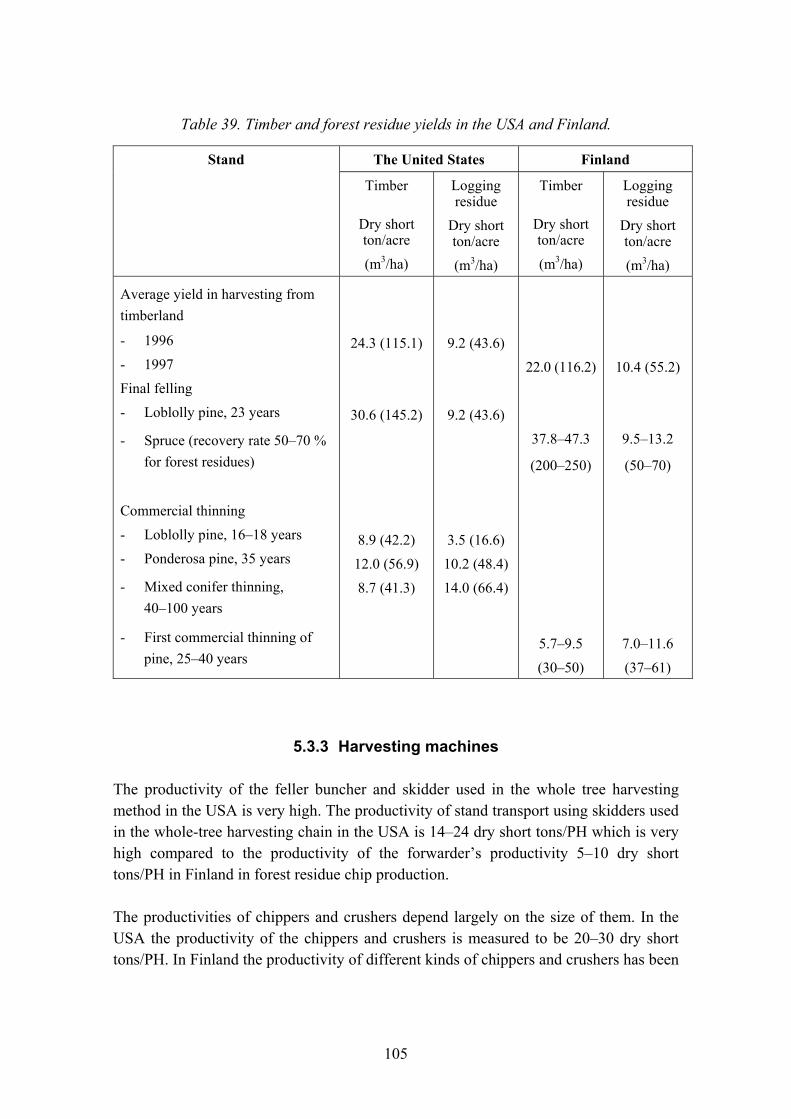
105
Table 39. Timber and forest residue yields in the USA and Finland.
The United States Finland Stand
Timber
Dry short ton/acre
(m3/ha)
Logging residue
Dry short ton/acre (m3/ha)
Timber
Dry short ton/acre
(m3/ha)
Logging residue
Dry short ton/acre (m3/ha)
Average yield in harvesting from timberland
- 1996 - 1997 Final felling - Loblolly pine, 23 years
- Spruce (recovery rate 50�70 % for forest residues)
Commercial thinning - Loblolly pine, 16�18 years - Ponderosa pine, 35 years
- Mixed conifer thinning, 40�100 years
- First commercial thinning of pine, 25�40 years
24.3 (115.1)
30.6 (145.2)
8.9 (42.2) 12.0 (56.9) 8.7 (41.3)
9.2 (43.6)
9.2 (43.6)
3.5 (16.6) 10.2 (48.4) 14.0 (66.4)
22.0 (116.2)
37.8�47.3
(200�250)
5.7�9.5
(30�50)
10.4 (55.2)
9.5�13.2
(50�70)
7.0�11.6
(37�61)
5.3.3 Harvesting machines
The productivity of the feller buncher and skidder used in the whole tree harvesting method in the USA is very high. The productivity of stand transport using skidders used in the whole-tree harvesting chain in the USA is 14�24 dry short tons/PH which is very high compared to the productivity of the forwarder�s productivity 5�10 dry short tons/PH in Finland in forest residue chip production.
The productivities of chippers and crushers depend largely on the size of them. In the USA the productivity of the chippers and crushers is measured to be 20�30 dry short tons/PH. In Finland the productivity of different kinds of chippers and crushers has been

106
measured to be 10�20 dry short tons/PH. The higher productivity in the USA is due to the chipping of whole trees which is more efficient than the chipping of forest residues.
In Finland full trailers are used for truck transport, in the USA semitrailers. Therefore the payload (41 short tons) in Finland is higher than in the USA (30�35 short tons).
Table 40. Information on the machines used in whole-tree fuel chip production from thinnings in the USA and information on the machines used in forest residue fuel chip production from final fellings (chipping at the roadside landing harvesting chain) in Finland.
Chain and machine Approximate price $
Output Short dry ton/PH
(m3/PH)
Whole tree harvesting chain (the USA) - Feller buncher - Skidder - Chipper or crusher - Truck transport Chipping at the stand chain (Finland) - Forwarder (haulage < 100 m) - Chipping - Truck transport
185 000�240 000
160 000 170 000�250 000
45 000
290 000 120 000�225 000
45 000
13�67 (25�129) 14�24 (27�45) 20�30 (40�60)
Payload 30�35 short ton
5�10 (10�20) 10�20 (20�40)
Payload 41short ton
5.3.4 Harvesting costs of forest residues
The harvesting costs of forest chips in the USA are a bit lower than in Finland. In the USA the average production costs of whole tree chips are about 30.0 $/dry short ton (6.9 $ per MWh). In Finland the typical harvesting costs of forest residue chips are about 32.4 $ per dry short ton (7.6 $/MWh).
In the USA the stumpage for the landowner is about 2.0�4.0 $/dry short ton (0.5�0.9 $/MWh). In Finland no stumpage is normally paid for the forest residues. Only one wood fuel chip producer in Finland pays only 0.35 $ per dry short ton (0.08 $/MWh) as stumpage price for harvesting logging residues from final felling.
The harvesting costs (felling and forest haulage) of whole tree chips in the USA are higher (10.0�12.0 $ per dry short ton) than in Finland (9.8 $/dry short ton). In Finland no felling costs taken into account when harvesting forest residues for fuel. In the USA

107
the costs of felling are calculated also for the forest residues from thinnings. That is why the harvesting costs in the USA are higher than in Finland. The average chipping costs of forest residue are lower in the USA (6.0�8.0 $ per dry short ton) than in Finland (9.8 $ per dry short ton). The chipper productivity in whole tree chipping is higher than in the forest residues chipping and that is why the chipping costs in the USA are lower than in Finland. The transport costs in the USA (8.0�12.0 $/dry short ton) are also lower than in Finland (12.8 $/dry short ton). This is very difficult to explain because in Finland the truck payload is higher, so the costs in Finland should be lower.
In Finland the harvesting costs of forest residue from precommercial thinnings are 36.6�47.7 $/dry short ton (8.6�11.2 $/MWh) and from first commercial thinnings 52.8�61.8 $/dry short ton (12.4 $/MWh�14.5 $/MWh). The harvesting costs are more higher than from final felling (32.4 $/dry short ton). The reason for this is the smaller yield from thinnings. At the moment there are subsidies in Finland for harvesting fuel chips from thinnings.
Table 41. Typical harvesting costs of whole-tree chips for fuel from thinnings in the USA and harvesting costs of forest residue chips from final fellings (chipping at the roadside landing harvesting chain) in Finland.
The United States Finland
$/Odt1 $/MWh $/Odt1 $/MWh
Stumpage price Harvesting Chipping Road transport (50 miles)
2.0�4.0 10.0�12.0 6.0�8.0 8.0�12.0
0.5�0.9 2.3�2.8 1.4�1.8 1.8�2.8
� 9.8 9.8 12.8
� 2.3 2.3 3.0
Total 26.0�36.0 6.0�8.3 32.4 7.6 1 Dry short ton
108
5.4 Competitiveness of forest residue for fuel
The fuel prices are changing especially in the USA. In general the fuel prices in electricity production are cheaper in the USA than in Finland. The price of coal in the USA in electricity production was in 1999 1.3 $/MBtu (4.3 $/MWh), in Finland it was in 2001 2.3 $/MBtu (7.9 $/MWh). In Finland there are environmental taxes for the fuel in heat production, so the price of coal in heat production is 3.9 cent/MBtu (13.3 $/MWh). The price of natural gas in electricity production in 1999 was higher in the USA (2.6 $/MBtu) than in Finland (2.1 $/MBtu). The price of wood in the USA (1.8 $/MBtu) was a bit cheaper than in Finland (2.0 $/MBtu). The price of wood in Finland is the same in both electricity and heat production because there are no excise taxes for wood.
In the USA the electricity production costs are in the range of 6.0�7.5 cents per kWh, while the electricity production cost using fossil fuel is 2.5 cent per kWh. In Finland in CHP plants the production costs of electricity wood is most economical fuel (1.1�1.6 cent $/kWh) compared to natural gas (1.8�2.3 cent/kWh) and coal (2.1�3.0 cent/kWh).
The electricity price for the consumers in the USA and Finland differs from each other. For industry the electricity price in the USA (3.9 cent/kWh) is lower than in Finland (4.6�5.8 cent/kWh). For the households the average electricity price without sales taxes is higher in the USA (8.1 cent/kWh) than in Finland (5.0�8.9 cent/kWh). In Finland the electricity tax for the consumer in 1999 was 0.6 cent/kWh for households and 0.38 cent/kWh for industry.

109
Table 42. Fuel prices in electricity and heat production, electricity production costs with fossil and wood fuels and energy prices in the USA and Finland.
United States (1999) Finland (June 2001)
$/MBtu $/MWh $/MBtu $/MWh Fuel prices in electricity and heat production - Coal - Natural gas - Wood
Electricity
1.3 2.6 1.8
Electricity
4.3 8.8 6.0
Elect. (Heat)
2.3 (3.9) 2.1 (2.6) 2.1 (2.1)
Elect. (Heat)
7.9 (13.3) 7.3 (9.0) 7.0 (7.0)
Electricity production cost - Coal - Wood Heat production cost - Coal - Wood
Cent/kWh 2.5
6.0�7.5
Cent/kWh 2.1�3.0 1.1�1.6
18 18
Energy prices - Electricity
-- Household -- Industry - District heat
Cent/kWh
8.1 3.9
Cent/kWh
5.0�8.9 4.6�5.8 3.1�3.7
5.5 Subsidies
In the USA there is not any subsidies for the harvesting and use of forest residues for fuel. In Finland there are different subsidies for wood fuel. There is 30 % investment aid for constructing the wood fired power plant. The investment aid is about 0.3�0.6 $/MBtu (0.9�2.1 $/MWh) depending on the type of the power plant. In addition there are no environmental taxes for wood in heat production. For the coal the environmental tax in 2001 was 1.6 $/Mbtu (5.4 $/MWh). There are also subsidies worth of 1.1 $/MBtu (3.9 $/MWh) to harvest and chipping small wood from thinnings. The subsidies for the use wood for fuel can totally be 1.5�1.8 $/MBtu (5.2�6.1 $/MWh) in heat production and 1.7�2.0 $/Mbtu (5.7�6.7 $/MWh) in conbined heat and power production.

110
5.6 Forest residue chip quality
The properties of whole tree chips and forest residue chips are quite the same in the USA and in Finland. The energy density per dry volume is higher in the USA because of the higher density of the wood.
In the USA the moisture content of whole tree chips (40�60 w-%) is a bit smaller than in Finland (50�60 w-%). In Finland the target is to dry the forest residues before chipping. This is not the practice everywhere, which is the reason for the higher moisture content. The energy content per volume is quite the same in the USA (0.06�0.09 MBtu/loose-ft3) and in Finland (0.07�0.09 MBtu/loose-ft3).
It is necessary to increase the heating value both in the USA and in Finland. The only way is to dry forest residues before chipping.
Table 43. Some properties of forest residue chips.
The United states Whole tree chips
Finland Forest residue chips
Moisture content, w-% Average effective heating value, - MBtu/dry short ton (MJ/kg) Average net heating value (50 w-%), - Mbtu/dry short ton (MJ/kg) Green bulk density (40�50 w-%), - lb/ft3 (kg/m3) Energy density (40�50 w-%), MBtu/loose-ft3 (MWh/loose-m3) Ash content, %
40�60 w-% 17.0 (19.8)
7.5 (8.7)
15.5�22.7 (248�363)
0.06�0.09 (0.6�0.9) Around 1
50�60 w-% 16.4 (19.25)
7.2 (8.4)
15.6�25.0 (250�400)
0.07�0.09 (0.7�0.9) 1�3
5.7 Impacts of forest residue use
5.7.1 Effect on the employment
Compared with imported fuels, the use of forest residue chips has proved to create more long-term jobs. In small countryside communities, forest residue production offers one of the few industrial jobs. It also creates additional jobs and livelihood and supports the traditional agriculture and forestry.

111
In Finland it has been calculated that the effect of harvesting, road transport and use of forest residue chips on employment is about 2 910 man-years per produced one million Odt (4.28 TWh, 50 w-%). The total effect of the harvesting and use of forest residues (3.5�4.5 million dry short tons) on employment in the USA in 1997 would have been 10 000�13 000 man-years based on the Finnish data. In Finland the total effect of forest residue harvesting and use of 0.35 million dry short tons in 1999 was 1 000 man-years.
5.7.2 Other impacts
The use of forest residues for fuel offers work for the people in rural areas. There are also other advantages when using the forest residues for fuel: benefitting the forest growth, decreasing the forest fire risk and reducing greenhouse gases in the energy production.
The residues left in the forest impede forest regeneration, increase the risk of forest fire and hinder the recreation use of the area. Increasing harvesting plans on public lands in the USA require some form of residue management, which usually means either piling and burning, or removal and use as fuel.
Both in the USA and in Finland there is big need for thinning of young forests. These forests are overstocked and in the USA there is also a big risk for the fires especially in the West. The best solution for these overstocked young stands is thinning and utilizing the residues as fuel. These forest benefit greatly from the mechanical thinning operations. Thinning increases the growth of the trees and also the size of the trees becomes more suitable for the sawmills.
5.7.3 Environmental impacts
In Finland the environmental impacts of forest residues as fuel has largely been evaluated. Based on the studies, if the harvesting of forest residues is focused on the fresh spruce final felling stands, there are no obstacle for utilizing the forest residues for fuel.
The main disadvantage of forest residue harvesting is that it reduces both organic material and nutrients in the soil. In a study, complete logging residues harvesting was not found to slow down the height of plants, because the nutrient requirements of trees are greatest at the age of 30 to 50 years.
The forest residue removal from the stands facilitates forest regeneration. When there are no forest residues left, the soil preparation can be accomplished with less radical

112
means. Also planting is easier and also it is often possible to use smaller plants. When harvesting the forest residues from thinnings, it is recommended not to harvest all the forest residues. The forest residues should be harvested as stems, then leaving the branches and needles at the stand. This kind of forest residues harvesting does not decrease the nutrient level too much.
5.8 Future trends in the use of forest residues for fuel
In the USA and in Finland there are possibilities to increase the use of forest residues as fuel. In the USA there are no target for the renewable fuels. It is estimated that the use of all renewable energy would increase from 6 690 trillion Btu (1 960 million MWh) in 1999 to 8 590�9 370 trillion Btu (2 520�2 750 million MWh) in 2020 depending on the economic growth. The additional use of renewables means 110�160 million dry short tons in wood basis. The biggest potential is in co-firing.
The Finnish target for the future is to increase the use of forest residues as fuel. The objective set by the Finnish Ministry of Trade and Industry is to increase the use of renewable energy sources from the level of 1995 by 119 million Btu (34.9 million MWh) by the year 2010 from the level of 1995 (240 Mbtu, 70.4 million MWh). 90 % of this increase is expected to be covered by bioenergy. The objective is to increase the utilisation of forest chips from the level of 0.12 million dry tons (0.5 TWh) in 1995 up to 2.3 million dry tons (10 million MWh) by the year 2010 (Alakangas 1998).
5.9 R&D on forest residues for fuel
In the USA a lot of R&D work was carried out related to the forest residues harvesting technology in the 1980�s. After that the R&D has decreased dramatically as the prices of fossil fuels have dropped and the use of wood fuel has decreased. Some R&D projects dealing with forest residue production are going on mainly at the University of California in Davis, coordinated by professor Bruce Hartsough. Short Rotation Woody Crops Production Group coordinates the research on SRWC production and use.
Based on this R&D work, a workable harvesting system exists in the USA for the forest residues harvesting from natural stands and also from plantations.
In Finland, the systematic R&D work related to the harvesting and use of forest chips started in 1993 when the six years� national Bioenergy research program started. The aim of the program was to increase the use of economically profitable and environmentally sound bioenergy by improving the competitiveness of existing peat and

113
wood fuels. The total budget in 1993�1998 was 40 million euros. In the program new machines and methods were developed for wood fuel harvesting. This work has been continued in the national Wood energy technology program. This program started in 1999 and it will last up to the end of 2003. The total budget for the years 1999�2003 is expected to amount of 36 million $ (40 million euro).
The concrete target of the Wood energy technology program is to create techno-economic conditions for increasing the annual use of forest chips from 0.5 million m3 in 2010 up to 2.5 million cubic meters by the year of 2003. The program has seven research areas: harvesting planning, chipping and crushing, harvesting systems, quality handling and storage, fuel receiving and handling, use of wood chips for fuel and environmental impacts.
As a result of these R&D activities, the production costs of fuels from forest residues have been reduced considerably, resulting in a rapid increase in the use of forest chips in recent years. In addition to machine development, the focus has been in reducing harvesting and transportation costs by technology development work.

114
6. Need for the forest residues harvesting technology development and research in the USA
and Finland
6.1 The United Sates
Background
There are significant possibilities to increase the use of logging residues from natural forests in the USA and by this way to enhance the use of renewable energy. However, this is possible only with the help of intensive R&D work. In Finland the target is to increase the use of logging residues. To achieve this target intensive and long-term R&D work for harvesting and combustion technology of forest residues has been supported since 1993. Also in the USA it would be justified to start a program to enhance the harvesting and use of logging residues for fuel.
In the USA the main potential of forest residues for fuel is cofiring in coal fired power plants. At the moment the price of forest residues and other wood fuel is too high for coal fired power plants. The only way to decrease the production cost is to develop harvesting technology on the stand and handling technology at the power plants.
Also the possibilities to construct small (less than 20 MW thermal) municipal cogeneration plants especially in the North areas should be studied. The competitive size of the cogeneration plants has decreased during the last years remarkably. Several such CHP plants have been constructed in Finland.
In the following chapter some ideas of the R&D work (program) for harvesting of forest residues for fuel has been presented.
Contents
The work would be divided into the following research areas: production planning and logistics, harvesting technology, quality management, fuel receiving and handling technology and environmental impacts.
In the production planning and logistics research area the main target would be to develop the planning of wood fuel production. In this research area more precise information will be provided about the wood resources from thinnings and from final fellings to form the basis of the production planning. This information is not available at the moment, even though it is very important when planning the use of forest residues

115
for fuel. Also a production planning system for the supply of forest residues would be developed by using the new GPS-technology. With the help of this system it is easy to intensify the supply of wood fuel from small cutting sites to power plant.
The target of the harvesting technology research area would be to decrease the production costs of forest residues for fuel. The main phases of the harvesting chain are felling, skidding, storing, chipping and truck transport. There is potential to intensify all these working phases. In the earlier tests high productivities have been measured for the feller bunchers and these machines should be developed further and their productivity verified in larger scale. In skidding one possibility to intensify the productivity would be to haul the trees as tree sections. In chipping of forest residues the main problem is caused by the contaminants which break the chipping blades. A system should be developed to detect and remove the contaminants before they cause any harm for the chipper or crusher. For truck transport, a truck equipped with own unloading system should be developed. These trucks are used in Finland. This system does not require as big unloading system at the power plant as the prevailing system. In Finland totally new harvesting methods have been developed for forest residues. One of them is bundling technology which should also be tested in the USA.
The target at the quality management research area would be to improve the wood fuel quality as delivered to power plant, and by this way to decrease production costs. One important factor in wood chip quality is the moisture content. The moisture content can be decreased by drying the wood residues in a storage before chipping. In Finland very good results have gained from drying. In many parts of the USA the weather conditions for drying are much better than in Finland.
The target of the fuel handling technology research area would be to develop receiving and handling technology for wood chips at power plant. The main problems at the power plant are dust in the unloading phase and high dry substance losses during the storage of wood chips in the winter time. It would be important to find the ways to decrease them. In Finland a lot of work has been done a lot of work on these matters.
The target of the environment research area would be to investigate the environmental impacts of wood fuel harvesting. This area includes research related to the lifecycle analysis of wood fuels. Also the effect of the wood residues removal on the reforestation should be studied.
The target of the demonstration research area would be to demonstrate new harvesting technologies for forest residues, but also the whole chain from the stump to power plants would be demonstrated.

116
6.2 Finland
In Finland, the Wood energy technology program is currently going on. In this program the harvesting technology of forest residues is being developed to be more effective. The program will end in 2003.
In Finland the main timber harvesting method is cut-to-length method. The whole tree harvesting method, which is the main method in the USA is not used at all. In the Wood energy technology program the whole tree harvesting chain should be demonstrated in Finnish condition. The advantage of this method is the high productivity. Especially this chain would be suitable for wood fuel harvesting from pre-commercial and first commercial thinning.

117
7. Conclusions
The United States
There are lot of forest residues utilized as fuel especially in the electricity power sector.
There are no subsidies for utilizing wood fuels.
The use of forest residues has an important social and economical effect on the rural areas offering industrial jobs which are in general decreasing in these areas.
There is a lot of potential to increase the use of forest residues as fuel.
The best possibility to utilize forest residues as fuel is co-firing in coal fired power plants.
Small municipal cogeneration (less than 20 MW thermal) power plants in the Northern areas would be economical and possible users of forest residues.
The harvesting technology in the USA is efficient, but there is still potential to intensify it.
It would be justified to start a R&D program to intensify the use of forest residues as fuel by different end users.
Finland
There are lot of forest residue resources to be utilized as fuel.
At the moment the use of forest residues is low but the target is to increase it significantly.
The increased use of forest residues is supported by intensive R&D work on forest residues harvesting and use.
The competitiveness forest fuels has been gained by giving investment aid for constructing wood fired plants, by giving subsidies for harvesting wood from thinnings, and by laying excise taxes for fossil fuels.
The production costs of forest residues are higher in Finland than in the USA.

118
To intensify the harvesting of forest residues the whole-tree technology using feller bunchers and skidders should be tested in the Finnish conditions, especially in thinnings on hard lands.
The use of forest residues has an important social and economical effect on the rural areas offering industrial jobs which are in general decreasing in these areas.
The environmental impacts of harvesting forest residues for fuel are low and do not hinder increased use of forest fuels.
The use of forest residues from final fellings helps to reforest the stand.

119
8. Summary
Project Target
The main focus of this work has been to collect and assemble information on the methods and economics associated with collection of wood residues for bioenergy from natural forest systems and from short-rotation fiber production systems. Additionally, information on bioenergy crop development approaches and projected economics have been collected and summarized. Comparisons have been made between the USA and Finnish biomass production and collection technologies to evaluate possible technology transfer opportunities.
Project implementation
This work has been carried in Biomass Feedstock Development Program in Oak Ridge National Laboratory (ORNL) during 1.9.2001�31.08.2002. The work has been carried out by Dr. Arvo Leinonen who has been working as a visiting research scientist for ORNL. He comes from Technical Research Centre of Finland. The work was carried out based on literature from the USA and Finland and with the help of the study tours for the forest residue chip harvesting sites in California, Maine, Vermont and New Hampshire.
Forest resources
The total forest land area in the US (747 million acres) is 13.8 times higher than in Finland (54.1 million acres). The forest land area available for timber supply in the United States (504 million acres) and about 10 times more than in Finland (51.1 million acres). The annual cutting area in the USA is 2.0 % (10 million acres) of the timberland area and in Finland it is 2.6 % (1.30 million acre). The annual roundwood production in the USA is approximately 7.5 times bigger than in Finland.
Forest residue potential
In the USA the forest residue potential consists of logging residues (23.8�44.8 million dry short tons) and polewood from thinnings (17.0�65.0 million dry short tons). Also it is calculated that from short rotation woody crops (SRWC) plantation it would be possible to harvest 35.5 million dry short tons of wood chips. In Finland the forest residues potential consists of mainly forest residues from final felling and thinning and is altogether 6.1�7.4 million dry short tons (25.8�31.6 TWh, 50 w-%). The potential of forest residues from final fellings and thinnings in the USA (40.8�109.8 million dry short tons) is many times higher than in Finland. If the potential of SRWC is included, then the potential of forest residues and SRWC in the USA is altogether 76.3�145.3 million dry short tons.
120
Renewable energy use
The share of renewable energy use in Finland (23 %) is at the moment higher than in the USA (7.5 %) (1999). The share of wood in the total energy consumption in Finland is about 20.0 % and in the USA it is only about 2.7 %.
Forest residue use
At the moment the use of forest residues for fuel in the USA is 3.5�4.5 million dry short tons (15.3�19.6 TWh, 50 w-%). This is much more than in Finland (0.46 million dry short ton in 2000) where the use of forest residues for fuel is just in the beginning. In the United States the forest residue chips are coming from thinnings and final felling stands. In Finland the forest residues at the moment are mainly coming from the spruce clearcutting stands.
Forest residue chips as fuel
The properties of whole tree chips and forest residue chips are quite similar in the USA and Finland. In the USA the moisture content of whole tree chips (40�60 w-%) is a little bit smaller than in Finland (50�60 w-%). The energy content per volume is nearly the same in the USA (0.06�0.09 MBtu/loose-ft3) and in Finland (0.07�0.09 MBtu/loose-ft3).
End users of forest residues for fuel
Forest residue chips in the USA are mainly used in electric power sector. Also a small amount of whole tree chips are used for heating public buildings. In Finland the main users of forest residues chips are district heating plants which used 42 % of the total forest residue chips (0.15 million dry short tons) in 2000. Also in Finland wood, including forest residues, is used in CHP plants in forest industry (15 %) and municipalities (25 %). A small amount of forest residues are also used for heating in residential buildings (18 %).
Harvesting technology
The main difference between the USA and Finland in forest residue harvesting is that the forest residue in timber harvesting in the USA are left at the landing but in Finland they are left at the stand. Chipping and truck transport of forest residues to power plant are carried out nearly the same way.
In the United States the main method that is used for timber harvesting is whole tree harvesting chain. In this method the trees are felled with feller bunchers, after which the

121
whole trees are hauled with skidders to the landing area where the trees are delimbed and made for sawlogs and pulpwood. The forest residues in the whole tree harvesting method are hauled together with timber operations to the landing area where they are chipped and transported to the power plant. This method is used for both thinning and final cutting harvesting operations.
In Finland the main method in timber harvesting is the cut-to-length method where the trees are cut, delimbed and crosscut at the stand. The logs and pulpwood are hauled to the landing with forwarders. The cut-to-length method is used for thinning and final felling operations. At the moment, forest residues from final felling areas are utilized for fuel because the harvesting costs are low enough.
In the cut-to-length harvesting method the forest residues are left at the stand. Harvesting of forest residues for fuel is done as much as possible integrated with timber harvesting.
In Finland, the most common harvesting method of forest residue for fuel is so called chipping at the roadside method. In this method the forest residues are collected by a forwarder to the landing, where they are chipped and transported to the power plant, as in the United States.
Harvesting costs of forest residues for fuel
The harvesting costs of forest chips in the USA are lower than in Finland. In the USA the average production costs of whole tree chips are about 30.0 $/dry short ton (6.9 $ per MWh). In Finland the average production costs of forest residue chips from final felling are about 32.4 $ per dry short ton (7.6 $/MWh). In Finland the production costs of forest residue from thinnings are 52.8�61.8 $/dry short ton.
Competitiveness of forest residue chips
The fuel prices are varying especially in the USA. In general the fuel prices in electricity production are cheaper in the USA than in Finland. The price of coal in the USA in electricity production was in 1999 1.3 $/Mbtu (4.3 $/MWh) and in Finland it was in 2001 2.3 $/Mbtu (7.9 $/MWh). In Finland, the environmental taxes for the fuel in heat production are the reason why the price of coal in heat production is 3.9 $/MBtu. The price of natural gas in 1999 in electricity production in the USA (2.6 $/MBtu) was higher than in Finland (2.1 $/Mbtu). The price of wood in electricity production in the USA was 1.8 $/Mbtu (6.0 $/MWh, 50 w-%) and in Finland 2.1 $/Mbtu (7.3 $/MWh, 50 w-%).

122
The electricity prices for the consumers in the USA and Finland differ from each other. For industry, the electricity price in the USA (3.9 cent/kWh) is lower than in Finland (4.6�5.8 cent/kWh). For the households the electricity price (8.1 cent/kWh) in the USA is higher than in Finland (5.0�8.9 cent/kWh). In Finland the electricity tax for the consumer in 1999 was for the households 0.6 cent/kWh and for the industry 0.38 cent/kWh.
Subsidies
In the USA there are no subsidies for the harvesting and use of forest residues for fuel. In Finland there are different kinds of subsidies for wood fuel use. Altogether the subsidies for the use of wood fuels can be 1.7�2.0 $/Mbtu (5.7�6.7 $/MWh) in combined heat and power production. This is nearly 100 % of the harvesting costs of forest residues for fuel from thinnings.
Use of forest residues in the future
In both the USA and Finland there are possibilities to increase the use of forest residues for fuel. In the USA there is no special target for any certain renewable fuel. It is estimated that the use of all renewable energy sources would increase in the USA from 6 690 trillion Btu (1 960 million MWh) in 1999 to 8 590�9 370 trillion Btu (2 520�2 750 million MWh, 0 w-%) in 2020 depending on the economical growth. The additional use of renewables means 110�160 million dry short tons in wood basis. The greatest potential is in co-firing wood together with coal.
The objective set by the Finnish Ministry of Trade and Industry is to increase the use of renewable energy sources from the level of 1995 by 119 million Btu (34.9 million MWh) by the year 2010. 90 % of this increase is expected be covered by bioenergy. The objective is to increase the utilisation of forest chips from the level of 0.12 million dry short tons (0.5 TWh, 50 w-%) in 1995 up to 2.3 million dry short tons (10 million MWh) by the year 2010.
Impacts of forest residue use for fuel
Finnish studies have shown that compared with imported fuels, the use of forest residue chips has proved to create more long-term jobs. In small countryside communities, forest residue production offers one of the few industrial job opportunities. It also creates additional jobs and livelihood, and supports the traditional agriculture and forestry. The total impact of the use of forest residues (3.5�4.5 million dry short tons) in the USA would mean employment of about 10 000�13 000 man-years, based on the

123
Finnish data. The total impact of forest residue harvesting and use of 0.35 dry short tons in Finland in 1999 was 1 000 man-years.
The use of forest residues for fuel offers work for the people in rural areas. There are also other advantages to utilize the forest residues for fuel: benefitting the forest growth, decreasing the forest fire risk, reducing greenhouse gases in the energy production.
In Finland the environmental impacts of forest residues for fuel have been estimated. According to the studies, if the harvesting of forest residues is focused on the fresh spruce final felling stands there are no obstacles for utilizing the forest residues for fuel.
Research and development
In the USA lot of research and development work on harvesting of forest residues for fuel has been done in 1980s. After that, the R&D decreased dramatically as the prices of fossil fuels dropped and the use of wood fuels decreased. There are some R&D projects dealing with forest residue production going on mainly in the University of California in Davis coordinated by professor Bruce Hartsough. There is also so-called short rotation woody production group which coordinates the R&D related to the SRWC production and use.
Based on this R&D work there is currently a working harvesting system for forest residue harvesting from natural stands and also from plantations in the USA.
In Finland the systematic R&D work related to the harvesting and use of forest chips started in 1993 when the six years� national Bioenergy research program was launched. The aim of the program was to increase the use of economically profitable and environmentally sound bioenergy by improving the competitiveness of existing peat and wood fuels. The total budget in 1993�1998 was 44 million $ (40 million Euros). In the program, new machines and methods for wood fuel harvesting were developed. This work has been continued in the national Wood energy technology -research program. The program started in 1999 and it will last until the end of 2003. The total budget for the years 1999�2003 is expected to be 36 million $ (40 million Euro). Based on these programs the competitiveness of wood fuels has improved as a result of more effective harvesting technologies.
Conclusions
In the USA there are lots of forest residues utilized for fuel especially in the forest industry. There are no subsidies for utilizing wood for fuel. he use of forest residues has an important social and economical impact on the rural areas offering industrial jobs

124
which in general are decreasing in these areas. There is a huge of forest residue potential to increase the use of forest residues for fuel. The biggest possibility to utilize forest residues for fuel is co-firing in coal fired power plants. Small municipal cogeneration (20 MW) power plants in the Northern areas would also be economical and possible users for forest residues. The harvesting technologies in the USA are effective, but there is still potential to intensify them. It would be justified to start a R&D program to intensify the use of forest residues for fuel for different end users.
In Finland there are lots of forest residue resources to be utilized for fuel. At the moment the use of forest residues is low but the target is to increase it remarkably. The aim is supported by intensive R&D work on forest residues harvesting and use. The use of forest residues for fuel has been competitive with other fuels because of investment aids for constructing wood fired power plants, subsidies for harvesting wood from thinnings and excise taxes for fossil fuels. The production costs of forest residues are higher in Finland than in the USA. To intensify the harvesting of forest residues the whole-tree technology using feller bunchers and skidders should be tested in Finnish conditions especially from thinnings on hard lands. The use of forest residues has an important social and economical impact on the rural areas offering industrial jobs which in general are decreasing in these areas. The environmental impacts of forest residues for fuel are low and do not hinder utilizing them. The use of forest residues from final felling areas helps to reforest the stand.

125
Literature
Alakangas, E. 2000. Finland. In: Recent developments in bioenergy sector in Europe. AFBnet. In: http://afbnet.vtt.fi.
Alakangas, E. 2002. Renewable energy sources in Finland 2002. VTT Processes, OPET Report 9. 51 p. + app. 20 p.
Alakangas, E., Sauranen, T. & Vesisenaho, T. 1999. Production techniques of logging residue chips in Finland. VTT Energy, AFB-NET IV and Benet, ENE39/T0039/99. 83 p.
Alakangas, E., & Flyktman, M. 2001. The future of the CHP in the European market � The European Cogeneration Study. VTT Energy, VTT Energy Reports 7/2001. 54 p. + app. 8 p.
Angus-Hankin, C., Stokes, B. & Twaddle, A. 1995. The Transportation of Fuel Wood from Forest to Facility. Biomass and Bioenergy, Vol. 9, Nos 1�5, pp. 191�203.
Arola, R. & Miyata, E. 1981. Harvesting wood for energy. USDA Forest Service, North Central Forest Experiment Station, Research paper NC-200. 25 p.
Asplund, D. 2000. Bioenergy research programme in Finland � Successful approach to manage large R&D programme with good results. In: Proceedings of the conference held in Seville, Spain, 5�9 June 200. Energia & WIP. Pp. 1283�1284.
Badger, P. 2002. Processing Cost Analysis for Biomass feedstocks. General Bioenergy, Inc. Prepared for the USA Department of Energy. 39 p.
Bain, R. & Overend, R. 2002. Biomass for heat and power. Forest Projects Journal, Vol. 52, pp. 12�19.
Barko Hydraulics 2002. Product information of Barko Hydraulics, LLC. In: http://www.timbcohyd.com. Referred 5.22.2002.
Bergman, R. & Zerbe, J. 2001. Primer on Wood Biomass for Energy. USDA Forest Service. Wisconsin. 15 p.
Blinn, R., Dahlman, R., Mattson, & Thompson, M. 2000. Overview of approaches to sustain forest productivity during forest road development and timber harvesting activities. In: http://www.cnr.umn.edu/FR/conferenceinfo/proceedings/papers/Blinn. Referred 04.01.2002.

126
Bolding, C. & Lanford, B. 2001. Forest fuel reduction through energy wood production using a small chipper/CTL harvesting system. In: Appalachian hardwoods: Manging change, The 24th annual meeting, Snowshoe, West Virginia, July 15�19, 2001. USDA Forest Service, Northeastern Research Station. 5 p.
Blount 2002. Product information of Blount. In: http://www.blount-tied.com. Referred 5.22.2002.
Brinker, R., Klepac, J., Stokes, B. & Robertson, J. 1996. Effect of Tire size on Skidder Productivity. USDA Forest Service. 5 p.
Bropelin, B. 2002. Oral information. McNeil Generating Station.
Cail, S. 2002. Oral information. Knight Trailer Company Inc, Lengley, B.C.
Caterpillar 2002. Product information of Caterpillar. In: http://www.timberjack.com. Referred 4.5.2002.
Cheremisinoff, N. 1980. Wood for energy production. Ann Arbor Science Publishers, Inc. 152 p.
De La Torre Ugarte, D., Walsh, M., Shapouri, H. & Slinsky, S. 2000. The Economic Impacts of Bioenergy Crop Production on USA Agriculture. University of Tennessee, Agricultural Policy Analysis Center, Oak Ridge National Laboratory and The Office of Energy Policy and New Uses. 40 p.
Energy Efficinecy and Renewable Energy Network 2000. DOE Biopower Program. In: http://www.eren.doe.gov/biopower. Referred 1.4.2002.
Energy Efficinecy and Renewable Energy Network 2002. Consumer Energy Information: EREC Reference Briefs. In: http://www.eere.doe.gov/consumerinfo/refbriefs/da8.html. Energy Efficiency and Renewable Energy Network (Eren), USA Department of Energy. Referred 4.1.2002. 8 p.
Energy Information Adminstration 1996. Biomass profile: Wood and ethanol. In: http://www.eia.doe.gov/emeu/aer/pdf/pages/sec10_7.pdf. Referred 2.12.2002. EIA. 12 p.
Energy Information Administration 1997. Wheelabrator Shasta Energy Company, Anderson, California. EIA. In: http://www.eia.doe.gov/emeu/aer/pdf/pages/sec10_7.pdf. Referred 4.8.2002. 9 p.

127
Energy Information Administration 2001. Renewable Energy Annual 2000 with Data for 1999. In: http://www.eia.doe.gov/fuelrenewable.html Energy Information Administration, USA Department of Energy. Referred 4.1.2002. 53 p.
Energy Information Administration 2002a. Electricity prices for households. In: http:/www.eia.doe.gov/ emeu/international/elecprih.html. Referred 4.23.2002. 2 p.
Energy Information Administration 2002b. Electricity prices for industry. In: http:/www.eia.doe.gov/ emeu/international/elecprii.html. Referred 4.23.2002. 2 p.
Energy Information Administration 2002c. Natural gas prices for electricity production. In: http://www.eia.doe.gov/emeu/international/ngasprie.html. Referred 4.23.2002. 1 p.
Energy Information Administration 2002d. Selected wood and wood-related products in fuel consumption, 1998. In: http://www.eia.doe.gov/emeu/mecs/mecs98/datatables/d98n5_2.pdf. Energy Information Administration, USA Department of Energy. Referred 4.3.2002. 3 p.
Energy Information Administration 2002e. Steam coal prices for electricity production. In: http://www.eia.doe.gov/emeu/international/stmforelec.html. Referred 4.23.2002. 2 p.
Energy Information Administration 2003. Renewable energy annual 2001 with preliminary data annual for 2001. In:http://www.eia.doe.gov/cneaf/solar.renewables/ rpage/rea_data/rea_sum.html. Referred 20.1.2003
Finnish Forest Research Institute 2001. Forest Finland in brief. Finnish Forest Research Institute. 2001. 48 p.
Flyktman, M. 2002. List of municipal and industrial CHP and steam power plants in Finalnd. Not published. 6 p.
Haines, H. 2002. Oral information. State of Montana.
Hakkila, P. & Alakangas, E. 2000. Overview of Wood Energy Technology Programme 1999�2000 (Puuenergian teknologiaohjelman katsaus 1999�2000. Yearbook 2000 of Wood Energy Technology Research Programme (Puuenergian teknologiaohjelman vuosikirja 2000). Espoo: Technical Research Centre of Finland, VTT Symposium 205. Pp. 11�30. In Finnish.
Hakkila, P. 2001. Overview of Wood Energy Technology Programme 1999�2001 (Puuenergian teknologiaohjelman katsaus 1999�2001. Yearbook 2001 of Wood Energy

128
Technology Programme (Puuenergian teknologiaohjelman vuosikirja 2001). Espoo: Technical Research Centre of Finland, VTT Symposium 216. Pp. 11�34. In Finnish.
Hartsough, B., Drews, E., McNeel, J., Durston, T. & Stokes, B. 1997. Comparison of mechanized systems for thinning ponderosa pine and mixed conifer stands. Forest Products Journal, Vol. 47, No. 11/12, pp. 59�68.
Hillebrand, K. & Nurmi, J. 2001. The control of forest residues quality (Hakkuutähteiden laadunhallinta � PUUT09). In: Yearbook 2001 of Wood Energy Technology Programme (Puuenergian teknologiaohjelman vuosikirja 2001). Espoo: Technical Research Centre of Finland, VTT Symposium 216. Pp. 285�295. In Finnish.
Hämäläinen, J., Lilleberg, R., Poikela, A. & Rieppo, K. 1998a. Harvesting energy wood in connection to young stand treatment (Energiapuun korjuu taimikon harvennukseen). Jyväskylä Science Park, Project book 1993�1998, Part 1, Production of wood fuels. Pp. 179�186. In Finnish, English abstract.
Hämäläinen, J., Lilleberg, R., Poikela, A., Rieppo, K. & Kalaja, H. 1998b. Harvesting of energy wood and pulp wood in combined cleaning and first thinning (Energia- ja ainespuun korjuu taimikonhoidon ja ensiharvennuksen yhdistelmässä). Jyväskylä Science Park, Project book 1993�1998, Part 1, Production of wood fuels. Pp. 187�196. In Finnish, English abstract.
Jolley, S. 2001. A California Biomass-to-Energy Retrospective: We�re over the learning curve. In: The Fourth Biennial Residual Wood Conference, Residue-To-Revenue. Richmond B.C., November 4�6, 2001.
Jolley, S. 2002. Oral information. Wheelabrator Shasta Energy Company.
Korpilahti, A. 2000. Forest residues harvesting chain based on chipping at the end use (Käyttöpaikalla haketukseen perustuva puupolttoaineen tuotanto � PUUY02). In: Yearbook 2000 of Wood Energy Technology Programme (Puuenergian teknologiaohjelman vuosikirja 2000). Espoo: Technical Research Centre of Finland, VTT Symposium 205. Pp 137�143. In Finnish.
Leinonen, A., Hillebrand, K., Tiihonen, I. & Marttila, M. 2000. Developement of forest residues production at the terminal (Hakkuutähteiden terminaalituotannon kehittäminen). VTT Energia, Tutkimusselostus ENE32/T0055/2000. 37 p. + app. 1 p. In Finnish.
Lowe 2002. Biomass Profile: Wood and Ethanol.

129
In: http://www.eia.doe.gov/cneaf/solarrenewable.energy.annual/chap02.html. Referred 02.12.2002.
Marker, T. & Penny, J. 1999. Heating Communities with Renewable Fuel. The Municipal Guide to Biomass District Energy. Public Technology Inc. 52 p.
McDonald, T. & Stokes, B. 1994. Harvesting costs and utilization of hardwood plantations. In: Mechanization in short rotation, Intensive culture forestry conference. Mobile. Alabama, March 1�3, 1994. Southern forest experimental station. 8 p.
Mielikäinen, K. & Hakkila, P. 1998. Review of wood fuel from pre-commercial thinning and plantation cleaning in Finland. In: Wood fuel from early thinning and plantation cleaning, An international review. Finnish Forest Research Institute, Research papers 667.
Ministry of Trade and Industry 2000. Action Plan for Renewable Energy Sources. Ministry of Trade and Industry, Publications 1/2000. 38 p.
Ministry of Trade and Industry 2001. Energy review. Publications 1/2000. 41 p.
Morbark 2002. Product information of Morbark. In: http://www.morbark.com/ equipment_specs/equip_specs.htm#Forestry. Referred 4.5.2002.
Morris, G. 1999a. Biomass energy production in California: The case for a mass policy initiative. Future Resources Associates Inc. and Green Power Institute. Not published. 7 p.
Morris, G. 1999b. The value of the Benefits of USA Biomass Power. Green Power Institute, California & NREL. 25 p.
Mäenpää, I. & Männistö, J. 1995. The social and economical effects of bioenergy (Bioenergian yhteiskuntataloudelliset vaikutukset). The Ministry of Trade and Industry Reports 111/1995 (Kauppa- ja teollisuusministeriön tukimuksia ja raportteja 111/1995).
Nilsson 2002. Energy Efficiency and the Pulp and Paper Industry. In: http://www.aceee.org/pubs/ie962.htm. Referred 04.24.2002.
ORNL 2001. Popular poplars � Trees for many purposes. In: http://www.bioenergy.ornl.gov/misc/poplars.html. Referred 10.18.2001. 4 p.
ORNL 2002. Use of plantation-grown biomass for power generation. In: http://www.bioenergy.ornl.gov/reports/fuelwood/chap3.html. Referred 5.21.2002.

130
Partek 2003. Product information of Partek. In: http://www.partekforestusa.com. Referred 26.5.2003.
Pulkki, R. 2002. Cut-to-length, tree-length or full tree harvesting ? In: http://lakeaheadu.ca/~repulkki/ctl-ft.html. Referred 05.10.2002. 9 p.
Reardon, L. 2002. Biomass Conversion to Electricity. Tennessee Information Workshop. March 6, 2002, Oak Ridge. Oak Ridge National Laboratory. 6 p.
Renewable Resource Data Center 2001. Section III: Woodfuel markets in New England. In: http://rredc.nrel.gov/biomass/doe/rbep/ct_wood/three.html. Referred 12.4.2001.
Ronald, D. 2002. Oral information. Tigercat Industries Inc.
Savolainen, V. & Bergren, H. 2000. Wood fuels basic information pack. Benet, Energi Dalen & Jyväskylä Polytechnic. 191 p.
Smith, B., Vissage, J., Darr, R & Sfheffield, R. 2002. Forest resources of the United States, 1997. In: http://www.ncrs.fs.fed.us/pubs/gtr/gtr_nc219.pdf. Referred 03.15.2002. USA Department of Agriculture, Forest Service. 190 p.
Spinelli, R., Hartsough, B., Owende, P. & Ward, S. 2002. Mechanical full-tree harvesting of fast-growing Eucalyptus sp. stands. 20 p. (Not published).
Spinelli, R. & Harstough, B. 2001. Extracting whole short rotation trees with a skidder znd a front-end loader. Biomass and bioenergy 21 (2001). Pp. 425�431.
Stokes, B. 1998. Harvesting systems for multiple products � an update for the United States. In: Wood fuels from conventional forestry. The Finnish Forest Research Institute. Research Papers 680. Vantaa. Pp. 49�56.
Taylor, J. & VanDoren, P. 2002. Evaluating the Case for Renewable Energy, Is Government Support Warranted? Policy Analysis, January, No. 422. 16 p.
The University of Georgia College of Agricultural & Environmental Sciences 2002. Thinning Your timber for profit. In: http://www.ces.uga.edu/pubcd/C781-w.htm. The University of Georgia College of Agricultural & Environmental Sciences. Referred 4.22.2002. 7 p.
Tekes 2002. Growing power � Advanced solutions for bioenergy technology from Finland. Tekes, The National Technology Agency. 34 p.

131
Tigercat 2002. Product information of Tigercat. In: http://www.timberjack.com. Referred 7.8.2002.
Tiihonen, I., Marttila, M. & Hillebrand, K. 2000. The use of peat production area for the terminal of biomass mixfuel handling (Turvetuotantoalueen käyttö seospolttoaineen käsittelyterminaalina). VTT Energy, Research reports ENE 32/T0019/2000. In Finnish. 77 p. + app. 18 p.
Timbco 2002. Product information of Timbco hydraulics Inc. In: http://www.timbcohyd. com. Referred 7.8.2002.
Timberjack 2002. Product information of Timberjack. In: http://www.timberjack.com. Referred 7.8.2002.
Timperi, A. 2000. Forest biomass � Our natural resource. In: Nordic Japan Environmental Conference 2000, November 14�15, 2000, Nagano City, Japan. 55 p.
USDA Forest Service Anon. 1997. National RPA Forest Data base, Biomass Conversions. USDA Forest Service. 1 p.
USDA Forest Service 2000. Performance of a Tigercat 726B feller buncher. USDA Forest Service. 1 p.
USDA Forest Service 2002. USA forest facts and historic trends. USA Department of Agriculture Forest Service. In: http://fia.fs.fed.us/library/ForestFacts.pdf. Referred 5.1.2002. 20 p.
USDA Forest Service�s Southern Research Station 2002. Description of forest operations technology. Southern forest resource assessment. In: http://www.srsfs.fed.us/sustain/report/timb3/timb3-06.htm.7. Referred 1.4.2002. 7 p.
USA Department of Transportation 1997. Comprehensive truck, size and weight study. USA Department of Transportation, Volume II issues and Background.
U.S. Pulp and paper industry 1997. Evaluation of the existing boiler population within the U.S. pulp and paper industry. The Cadmus Group Inc, Contract No. 68-W6-0050, Task 3, Final report, prepared for Atmospheric Prevention Division U.S. Environmental protection agency. 13 p.

132
Vermont Superindent�s Association 2002. Wood Chip Usage in Vermont Schools, 2000�2001 Heating Season, Summary of Usage Patterns. Vermont Superindent�s Association, School Energy Management Program. 3 p.
Walsh, M. 2000. Economic Analyses to Support the Bioenergy and Biobased Products Initiative. In: http://bioenergy.ornl.gov/resourcedata/3xresources1/sld001.htm. Bioenergy Feedstock Developemnt Program, Oak Ridge National laboratory. Referred 04.03.2002. 30 p.
Walsh, M. 2002. Selected wood and wood-related products for heat, power, and electricity generation for selected industries for 1994. (Food & kindred products, Lumber and wood products, Furniture and fixtures, Paper and allied products and Other manufacturing). 1 p.
Walsh, M., Perlack, R., Turhollow, A., De La Torre Ugarte, D., Becker, D., Graham, R., Slinsky, S. & Ray, D. 2000. Biomass Feedstock Availability in the United States: 1999 State Level Analysis. Oak Ridge National laboratory. 18 p.
Volk, T., Abrahamson, L. & Ballard, J. 2000. SRWC Cost and potential. In: Proceedings of the Short-Rotation Woody Crop. Third Conference, October 10�13, 2000, Syracuse, New York, USA. State University of New York. 66 p.
Wright, L. 2002. Oral information. Oak Ridge National Laboratory, Oak Ridge, Tennessee.
Ylitalo, E. 2001. The use of wood fuels in energy production in 2000 (Puupolttoaineen tuotanto energiantuotannossa vuonna 2000). The Finnish Forest Research Institute (Metla), Official statistics of Finland, Agriculture, forestry and fishing industry, 2001:16. 7 p. In Finnish.
Yuncker, K. 2002. Oral information. Morbark Inc, Winn, Michigan.

1/1
Appendix 1: Definitions Roundwood Logs, bolts and other round sections cut from trees for industrial or consumer use.
Mill residues Wood residues from pulp and paper manufacturing and sawmills.
Sawdust Dust formed in sawing.
Bark Bark residue formed from merchantable wood with different debarking techniques.
Urban wood residues Post-consumer wood products, broken wood pallets and crates, untreated clean construction and demolition wood, etc.
Tree trimming Tree limbs and branches generated from right-of-way trimming near roads, railways, and utility systems such as power lines.
Forest residues Forest residues include underutilized logging residues, imperfect commercial trees, dead wood, and other non-commercial trees that need to be thinned from crowded, unhealthy, fire-prone forests.
Fuel chips General term used for chips or crush prepared by different techniques for combustion.
Forest chips General term for chips made from harvested wood raw
material.
Log chips Chips made of delimbed stem wood.
Whole-tree chips Chips made of the whole superterranean biomass of a tree (stem, branches, needles).
Logging residue chips Chips made of branches and tops, after harvesting merchantable wood.
Stump chips Chips made of stumps or snags.

1/2
Wood residue chips Chips made of untreated industrial wood residues (ribs, ends, etc.).
Sawing residue chips Chips made as a by-product of saw industry, with or without bark residue.
Cutter chips Wood residues formed in timber planing.
Grinding dust Dust-like wood residue formed in grinding timber and wood boards (shall not contain harmful amounts of adhesives).

2/1
Appendix 2: Coefficients and measures Measures
- 1 $ = 1.1 euro 1 EUR = 5.95 FIM - 1 ft = 0.305 m 1 m = 3.28 ft - 1 mile = 1.609 km 1 km = 0.622 mile - 1 acre = 0.4047 ha 1 ha = 2.47 acre - 1 yard = 0.9144 m 1 m = 1.09 yard - 1 cubic yard = 0.76 m3 1 m3 = 1.32 cubic yard - 1 ft3 = 0.0284 m3 1 m3 = 35.21 ft3 - 1 toe = 11.63 MWh = 41.68 GJ - 1 ton (short) = 2000 lb = 0.91 metric ton 1 ton (metric) = 2205 lb = 1.10 short ton
- 1 lb = 0.454 kg 1 kg = 2.20 lb - 1 Btu = 0.000293 kWh - 1 million Btu = 0.293 MWh = 1054.8 MJ
Wood properties in the USA
- Average density of dry wood1 - 29.6 lb/ft3 = 0.0148 short ton/ft3 = 473 kg/m3
- 1 Odt (short) of dry wood is 1.92 m3
- Effective heating value of dry wood fuel2 - 1 Odt (short) = 17 million Btu = 4.98 MWh = 17931.6 MJ - 1 Odt (metric) = 5.48 MWh - 1 lb = 8.97 MJ, 1 kg = 19.78 MJ
- Effective heating value of wet wood fuel (50 % moisture content)4
- 1 lb = 3.93 MJ, 1 short ton = 7860 MJ, 1 kg = 8.68 MJ - 1 short wet ton = 2.18 MWh, 1 metric ton = 2.40 MWh
Wood properties in Finland
- Average density of dry forest residue chips (spruce with needles)3,5 - 425 kg/m3 = 26.6 lb/ft
- 1 dry metric ton of forest residue chips = 2.35 m3 - 1 dry short ton of forest residue chips = 2.14 m3 - Effective heating value of dry forest residues chips4
- 1 kg = 20.0 MJ/kg 6

2/2
- Effective heating value of dry forest residues chips (continued)5,6
- 1 Odt (oven dry ton, metric) = 19 250 MJ = 5.35 MWh - 1 Odt (oven dry ton, short) = 18 200 = 4.87 MWh - Effective heating value of wet forest residues chips (moisture content 50 w-%)5
- 1 kg = 8.41 MJ, 1 metric ton = 8410 MJ = 2.34 MWh - 1 short ton = 2.13 MWh
- Others5,6
- 1 m3 of logging residues chips averages 2.38 bulk-m3 of logging residue chips
- bulk m3 of logging residue chips averages 0.87 MWh (3.00 MBtu) (moisture content 50 %)
1 Anon. Green-to-dry weight conversion factors, approximate green and dry weights per cubic foot of wood and bark for Eastwide Data Base species group. 1 p.
2 Reardon, 2002. Biomass Conversion to Electricity. In: The Bionergy Infornation Workshop. Cumberland Mountain RC&D, Oak Ridge, Tennessee. 2 p.
3 Alakangas, E., Sauranen, T. & Vesisenaho, T, 1999. Production techniques of logging residue chips in Finland. VTT Energy, AFB-NET IV and Benet, ENE39/T0039/99. 83 p.
4 Calculated
5 Avergae energy densities of forest residues and bark chips. Wood energy -technology program. 1 p. (In Finnish).
6 Alakangas, E. 2000. Properties of fuels used in Finland (Suomessa käytettävien polttoaineiden ominaisuuksia. Espoo: Technical Research Centre of Finland, VTT Research Notes 2045. 172 p. + app. 17 p. (In Finnish).
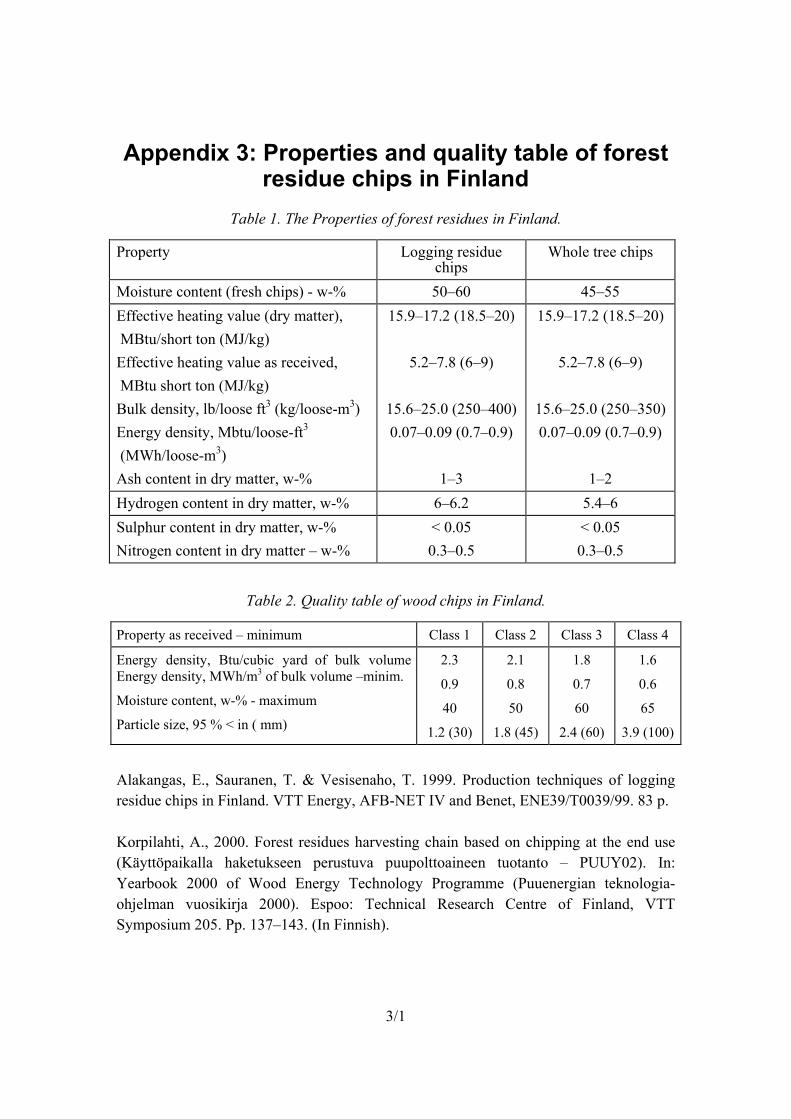
3/1
Appendix 3: Properties and quality table of forest residue chips in Finland
Table 1. The Properties of forest residues in Finland.
Property Logging residue chips
Whole tree chips
Moisture content (fresh chips) - w-% 50�60 45�55 Effective heating value (dry matter), MBtu/short ton (MJ/kg) Effective heating value as received, MBtu short ton (MJ/kg) Bulk density, lb/loose ft3 (kg/loose-m3) Energy density, Mbtu/loose-ft3 (MWh/loose-m3) Ash content in dry matter, w-%
15.9�17.2 (18.5�20)
5.2�7.8 (6�9)
15.6�25.0 (250�400) 0.07�0.09 (0.7�0.9)
1�3
15.9�17.2 (18.5�20)
5.2�7.8 (6�9)
15.6�25.0 (250�350) 0.07�0.09 (0.7�0.9)
1�2
Hydrogen content in dry matter, w-% 6�6.2 5.4�6 Sulphur content in dry matter, w-% Nitrogen content in dry matter � w-%
< 0.05 0.3�0.5
< 0.05 0.3�0.5
Table 2. Quality table of wood chips in Finland.
Property as received � minimum Class 1 Class 2 Class 3 Class 4
Energy density, Btu/cubic yard of bulk volume Energy density, MWh/m3 of bulk volume �minim.
Moisture content, w-% - maximum
Particle size, 95 % < in ( mm)
2.3
0.9
40
1.2 (30)
2.1
0.8
50
1.8 (45)
1.8
0.7
60
2.4 (60)
1.6
0.6
65
3.9 (100)
Alakangas, E., Sauranen, T. & Vesisenaho, T. 1999. Production techniques of logging residue chips in Finland. VTT Energy, AFB-NET IV and Benet, ENE39/T0039/99. 83 p.
Korpilahti, A., 2000. Forest residues harvesting chain based on chipping at the end use (Käyttöpaikalla haketukseen perustuva puupolttoaineen tuotanto � PUUY02). In: Yearbook 2000 of Wood Energy Technology Programme (Puuenergian teknologia-ohjelman vuosikirja 2000). Espoo: Technical Research Centre of Finland, VTT Symposium 205. Pp. 137�143. (In Finnish).

4/1
Appendix 4: Basic information for calculation of forest residue chips harvesting costs
Table 1. Basic information on the machines used in the calculation of forest residue harvesting costs of four harvesting chains in Finland. The capacity (Odt/h), the annual operating time (h/a & Odt/a) and operating costs ($/h)1.
Odt/h h/a Odt/a $/h (m3/h) (m3/h)
Bundler 4.6 (9.7) 2.520 11 660 (24 500) 5.9
Terrain haulage of bundles (300 m) 7.2 (15.2) 2.865 20 620 (43 300) 2.9
Road transport of bundles (80 km) 2.0 (4.22) 3.200 13 570 (28 500) 6.2
Terrain haulage of forest residues, 328 4.4 (9.3) 2.855 12 620 (26 500) 4.6
yards (300 m)
Road transport of forest residues, 50 mile 2.2 (4.55) 3.200 9 570 (20 100) 8.6
(80 km)
Crushing of bundles 47.6 (100) 2.350 111 900 (235 000) 1.3
Crushing of forest residues at power plant 40.4 (85) 2.350 95 240 (200 000) 1.8
Chipping at the roadside 8.8 (18.4) 2.000 17 520 (36 800) 4.5
Road transport of chips by truck , 50 mile 2.7 (5.77) 3.240 11 760 (24 700) 5.9
(80 km)
Terrain chipping, terrain haulage, 328 m 2.7 (5.7) 2.520 6 860 (14 400) 12.7
(300 m)
Trasnport using containers, 50 mile 2.4 (5.0) 3.180 11 140 (23 400) 7.5
(80 km)
1 Korpilahti, A. 2000. Forest residues harvesting chain based on chipping at the end use (Käyttöpaikalla haketukseen perustuva puupolttoaineen tuotanto � PUUY02). In: Yearbook 2000 of Wood Energy Technology Programme (Puuenergian teknologia-ohjelman vuosikirja 2000). Espoo: Technical Research Centre of Finland, VTT Symposium 205. Pp. 137�143. (In Finnish.).

5/1
Appendix 5: Green and dry weights per volume of wood and bark for Eastwide Data Base species
group Table 1. Green-to-dry weight conversion factors, approximate green and dry weights per cubic foot of wood and bark for Eastwide Data Base species group.
Factor to convert Approx. green Approx. dry Green weight weight of weight of Grp Species group name to dry weight* wood + bark wood + bark (lb per cu.ft.) (lb per cu.ft.)
==========================================================================
1 Longleaf and slash pine 0.50 55 28 2 Loblolly and shortleaf pine 0.50 55 28 3 Other yellow pines 0.56 45 25 4 Eastern white and red pine 0.54 45 24 5 Jack pine 0.55 43 24 6 Spruce and balsam fir 0.54 43 23 7 Eastern hemlock 0.48 51 24 8 Cypress 0.48 57 26 9 Other softwoods 0.56 44 25 10 Select white oaks 0.63 58 36 11 Select red oaks 0.56 65 36 12 Other white oaks 0.63 58 36 13 Other red oaks 0.56 65 36 14 Hickory 0.61 62 38 15 Yellow birch 0.56 61 34 16 Hard maple 0.56 63 35 17 Soft maple 0.56 55 31 18 Beech 0.59 59 35 19 Sweetgum 0.48 60 29 20 Tupelo and black gum 0.50 58 29 21 Ash 0.60 52 31 22 Cottonwood and aspen 0.49 51 25 23 Basswood 0.50 43 21 24 Yellow-poplar 0.48 52 25 25 Black walnut 0.56 53 30 26 Other soft hardwoods 0.56 55 31 27 Other hard hardwoods 0.56 63 35 28 Noncommercial species 0.56 50 28 =============================================================== * Multiply green weight times this number to derive approximate dry weight per cubic foot.
Smith, W. Brad. 1991. Assessing Removals for North Central Forest Inventories. USDA Forest Service. North Central Forest Experiment Station, Research Paper NC-299. 48 p.

6/1
App
endi
x 6:
Log
ging
resi
due
rem
oval
s, lo
ggin
g re
sidu
es h
arve
stin
g po
tent
ial,
elec
tric
pow
er c
apac
ity a
nd e
lect
ricity
pr
oduc
tion
by u
sing
woo
d Ta
ble
1. L
oggi
ng re
sidu
e re
mov
als (
1996
), lo
ggin
g re
sidu
es h
arve
stin
g po
tent
ial b
y de
liver
ed p
rice
, ele
ctri
c po
wer
cap
acity
(199
8) a
nd e
lect
rici
ty p
rodu
ctio
n by
usi
ng w
ood
(199
9).
Reg
ion
Subr
egio
n St
ate
Logg
ing
resi
due
rem
oval
s Ft3
Lo
ggin
g re
sidu
e re
mov
als
D
ry sh
ort t
on
Lo
ggin
g re
sidu
e ha
rves
ting
pote
ntia
l <
30$/
Odt
D
ry sh
ort t
on
Logg
ing
resi
due
harv
estin
g po
tent
ial
< 40
$/O
dt
Dry
shor
t ton
Lo
ggin
g re
sidu
e ha
rves
ting
po
tent
ial
< 50
$/O
dt
Dry
shor
t ton
Woo
d el
ectri
city
ca
paci
ty
M
W
W
ood
elec
trici
ty
prod
uctio
n
KW
h N
orth
/Nor
thea
st
- C
onne
ctic
ut
- D
elaw
are
- M
aine
-
Mar
ylan
d -
Mas
sach
uset
ts
- N
ew H
amps
hire
-
New
Jers
ey
- N
ew Y
ork
- Pe
nnsy
lvan
ia
- R
hode
Isla
nd
- V
erm
ont
- W
est V
irgin
ia
Subt
otal
N
orth
/Nor
th C
entr
al
- Ill
inoi
s -
Indi
ana
- Io
wa
- M
ichi
gan
- M
inne
sota
-
Mis
sour
i -
Ohi
o -
Wis
cons
in
Subt
otal
N
orth
tota
l
72
4 17
7 00
0 83
6 71
8 00
0 1
560
895
000
10
882
000
12
573
000
23
455
000
10
9 00
0 26
000
80
6 00
0 18
9 00
0 19
6 00
0 29
9 00
0 70
000
93
3 00
0 94
8 00
0 20
000
26
5 00
0 72
7 00
0 4
588
000
228
000
253
000
72 0
00
710
000
468
000
505
000
232
000
609
000
3 07
7 00
0 7
665
000
159
000
37 0
00
1 18
2 00
0 27
3 00
0 28
4 00
0 43
8 00
0 10
2 00
0 1
360
000
1 37
7 00
0 27
000
38
6 00
0 1
056
000
6 68
1 10
0 33
0 00
0 36
7 00
0 10
5 00
0 1
034
000
682
000
733
000
335
000
886
000
4 47
2 00
0 11
153
100
204
100
48 4
00
1 52
9 10
0 35
1 20
0 36
6 20
0 56
4 40
0 13
0 70
0 1
746
400
1 76
3 00
0 35
900
49
7 20
0 1
352
500
8 58
9 10
0 42
3 30
0 47
0 10
0 13
5 00
0 1
327
900
874
900
938
700
430
100
1 13
8 40
0 5
738
400
14 3
27 5
00
- - 72
5 3 38
104 -
109 29 -
77 -
1085
- - - 26
8 20
2 - 16
74
56
0 16
45
- -
2 56
8 52
7 17
7 63
8 10
0 46
3 81
0 89
1 - 71
7 55
2 54
4 37
6 - 39
7 36
2 - 5
316
809
201
876 -
11
1 77
3 93
3 54
6 56
9 - 63
6 75
2 85
1 57
2 4
010
713
9 32
7 52
2
6/1

6/2
Tabl
e 1
(con
t.). L
oggi
ng r
esid
ue r
emov
als
(199
6), l
oggi
ng r
esid
ues
harv
estin
g po
tent
ial b
y de
liver
ed p
rice
, ele
ctri
c po
wer
cap
acity
(199
8)
and
elec
tric
ity p
rodu
ctio
n by
usi
ng w
ood
(199
9).
Reg
ion
Subr
egio
n St
ate
Lo
ggin
g re
sidu
es
rem
oval
s Ft3
Lo
ggin
g re
sidu
e re
mov
als
O
dt
Lo
ggin
g re
sidu
e ha
rves
ting
pote
ntia
l <
30$/
Odt
D
ry sh
ort t
on
Lo
ggin
g re
sidu
e ha
rves
ting
Pote
ntia
l <
40 $
/Odt
D
ry sh
ort t
on
Lo
ggin
g re
sidu
e ha
rves
ting
po
tent
ial
< 50
$/O
dt
Dry
shor
t ton
Woo
d el
ectri
city
ca
paci
ty
M
W
W
ood
elec
trici
ty
prod
uctio
n
KW
h So
uth/
Sout
heas
t -
Flor
ida
- G
eorg
ia
- N
orth
Car
olin
a -
Sout
h C
arol
ina
- V
irgin
ia
Subt
otal
Sout
h/So
uthC
entr
al
- A
laba
ma
- A
rkan
sas
- K
entu
cky
- Lo
usia
na
- M
issi
ssip
pi
- O
klah
oma
- Te
nnes
see
- Te
xas
Subt
otal
So
uth
tota
l
1
127
170
000
1 5
59 6
70 0
00
2 68
6 84
0 00
0
16
938
000
23
437
000
40
375
000
51
5 00
0 1
041
000
1 06
8 00
0 61
3 00
0 95
9 00
0 4
196
000
1 00
9 00
92
8 00
0 47
5 00
0 87
2 00
0 94
6 00
0 15
6 00
0 93
0 00
0 55
7 00
0 5
873
000
10 0
69 0
00
75
5 00
0 1
525
000
1
557
000
898
000
1 39
7 00
0 6
132
000
1 47
5 00
0 1
352
000
690
000
1 27
5 00
0 1
380
000
228
000
1 35
1 00
0 81
4 00
0 8
565
000
14 6
97 0
00
97
5 70
0 1
967
800
2 00
4 90
0 1
158
400
1 79
3 60
0 7
900
400
1 89
9 00
0 1
737
800
883
500
1 64
1 80
0 1
774
600
292
200
1 73
2 60
0 1
050
700
11 0
12 2
00
18 9
12 6
00
42
1 71
9 18
6 19
7 44
3 19
66
694
261 4
449
272 63
11
93
1
847
3 81
3
1
745
341
3
002
399
1 48
3 17
1 1
484
583
1 67
8 12
7 9
393
621
3
904
945
1 30
6 24
7 12
409
2
458
967
1 45
0 41
8 16
6 59
9 61
6 42
4 69
2 80
0 10
608
809
20
002
430
6/2

6/3
Tabl
e 1
(con
t.). L
oggi
ng r
esid
ues
rem
oval
s (1
996)
, log
ging
res
idue
s ha
rves
ting
pote
ntia
l by
deliv
ered
pri
ce a
nd e
lect
ric
pow
er c
apab
ility
(1
999)
and
ele
ctri
city
pro
duct
ion
by u
sing
woo
d (1
999)
. R
egio
n Su
breg
ion
Stat
e
Logg
ing
resi
dues
re
mov
als Ft
3
Lo
ggin
g re
sidu
e re
mov
als
D
ry sh
ort t
on
Lo
ggin
g re
sidu
e ha
rves
ting
pote
ntia
l <
30$/
Odt
D
ry sh
ort t
on
Lo
ggin
g re
sidu
e ha
rves
ting
pote
ntia
l <
40 $
/Odt
D
ry sh
ort t
on
Lo
ggin
g r
esid
ue
harv
estin
g
pote
ntia
l <
50 $
/Odt
D
ry sh
ort t
on
W
ood
elec
trici
ty
Pow
er c
apac
ity
M
W
W
ood
elec
trici
ty
prod
uctio
n
KW
h W
est/R
ocky
Mou
ntai
n -
Kan
sas
- N
ebra
ska
- N
orth
Dak
ota
- So
uth
Dak
ota
- A
rizon
a -
Col
orad
o -
Idah
o -
Mon
tana
-
Nev
ada
- N
ew M
exic
o -
Uta
h -
Wyo
min
g
S
ubto
tal
W
est/P
acifi
c oc
ean
- A
lask
a -
Ore
gon
- W
ashi
ngto
n -
Cal
iforn
ia
- H
awai
ji Su
btot
al
Wes
t tot
al
U
SA to
tal
17
8 93
0 00
0
333
248
000
512
178
000
4 75
9 91
3 00
0
2
688
000
5 00
7 00
0 7
695
000
71 5
25 0
00
47
000
19
000
11
000
33
000
13
4 00
0 37
3 00
0 60
5 00
0 67
6 00
0 8
000
125
000
90 0
00
132
000
2 25
3 00
0 n.
a 1
299
000
1 23
0 00
0 1
231
000
n.a
3 76
0 00
0 6
013
000
23 7
47 0
00
68
000
27
000
17
000
49
000
20
0 00
0 55
4 00
0 90
2 00
0 1
007
000
11 0
00
185
000
133
000
196
000
3 34
9 00
0 n.
a.
1 92
8 00
0 1
825
000
1 81
9 00
0 n.
a.
5 57
2 00
0 8
921
000
34 7
71 0
00
88
100
34
400
21
700
64
300
26
1 40
0 72
0 30
0 1
179
500
1 31
6 70
0 14
400
24
1 90
0 17
3 00
0 25
6 10
0 4
371
800
n.a.
2
515
900
2 37
9 00
0 2
364
400
n.a.
7
259
900
11 6
31 7
00
44 8
71 8
00
- - - - - - 13
5 11 - - - -
146 -
136
318
669 -
1 12
3 1
269
6 72
6
- - - - - - 48
6 75
6 51
491
- - - - 53
8 24
7 -
358
554
1 09
5 87
8 3
322
930 -
4 77
7 36
2 5
315
609
34 6
45 5
61
6/3

Published by
Series title, number and report code of publication
VTT Research Notes 2229VTT�TIED�2229
Author(s) Leinonen, Arvo Title Harvesting Technology of Forest residues for fuel in the USA and Finland
Abstract This work has been carried out in Biomass Feedstock Development Program in Oak Ridge National Laboratory (ORNL) during 1.9.2001�31.08.2002. The work and the final report has been made by Dr. Arvo Leinonen who has been working as a visiting research scientist for ORNL. Arvo Leinonen comes from Technical Research Centre of Finland. The main focus of this work has been to collect and assemble information on the methods and economics associated with collection of wood residues for bioenergy from natural forest systems and from short-rotation fiber production systems. Additionally, information on bioenergy crop development approaches and projected economics has been collected and summarized. Comparisons have been made between the USA and Finnish biomass production and collection technologies to evaluate possible technology transfer opportunities. In the USA currently 3.5�4.5 million dry tons (15.3�19.6 TWh in 50 % moisture content) of whole tree chips utilized for fuel annually at the moment. Forest residues are mainly utilized in the electricity power sector. There are no subsidies for utilizing wood for fuel. The use of forest residues has an important social and economical impact on the rural areas offering industrial jobs which in general are decreasing in these regions. There is a huge forest residue potential to increase the use of forest residues for fuel, 23.8�44.8 million dry short tons (103.8�195.3 TWh). Also smallwood, if harvested for fuel, has a potential of 17.0�65.0 million dry short tons (74.1�283.4 TWh in 50 % moisture content). The biggest possibility to utilize forest residues for fuel is co-firing in coal fired power plants. Small municipal cogeneration (20 MWth) power plants in the Northern areas would also be economical and possible users for forest residues. The harvesting technologies in the USA are effective, but there is still potential to intensify them. It would be justified to start a R&D program to intensify the use of forest residues for fuel for different end users. In Finland the use of forest residues in 2000 was only 0.46 million dry short ton (2.0 TWh in 50 moisture content), which was only about 2.5 % of the total wood fuel use. In Finland there are also lots of forest residue resources to be utilized for fuel, 6.1�7.4 million dry short tons (25.8�31.6 TWh, 50 w-%). The target is to increase the use of forest residues up to 2.3 million dry short tons (10 million MWh, 50 w-%) by the year 2010. The aim is supported by intensive R&D work on forest residues harvesting and use. The use of forest residues for fuel has been competitive with other fuels because of investment aids for constructing wood fired power plants, subsidies for harvesting wood from thinnings and excise taxes for fossil fuels. The production costs of forest residues are higher in Finland than in the USA. To intensify the harvesting of forest residues the whole-tree technology using feller bunchers and skidders should be tested in Finnish conditions especially from thinnings on hard lands. The environmental impacts of forest residues for fuel are low and do not hinder utilizing them. The use of forest residues from final felling areas helps to reforest the stand. Keywords wood fuels, harvesting, wood chips, forest residues, thinnings, Finland, USA, production costs, environmental impacts, competitiveness Activity unit VTT Processes, Koivurannantie 1, P.O.Box 1603, FIN�40101 JYVÄSKYLÄ, Finland ISBN Project number 951�38�6212�7 (soft back ed.) 951�38�6761�7 (URL: http://www.vtt.fi/inf/pdf/)
C1SU00293
Date Language Pages Price March 2004 English 132 p.+ app. 10 p. C Name of project Commissioned by Teknologiasiirto biopolttoaineiden tuotannossa USA:n ja Suomen välillä
National Technology Agency of Finland Tekes
Series title and ISSN Sold by VTT Tiedotteita � Research Notes 1235�0605 (soft back edition) 1455�0865 (URL: http://www.vtt.fi/inf/pdf/)
VTT Information Service P.O.Box 1000, FIN�02044 VTT, Finland Phone internat. +358 20 722 4404 Fax +358 20 722 4374

VTT RESEA
RCH N
OTES 2229
Harvesting technology of forest residues for fuel in the U
SA and Finland
Tätä julkaisua myy Denna publikation säljs av This publication is available from
VTT TIETOPALVELU VTT INFORMATIONSTJÄNST VTT INFORMATION SERVICEPL 1000 PB 1000 P.O.Box 1000
02044 VTT 02044 VTT FIN–02044 VTT, FinlandPuh. 020 722 4404 Tel. 020 722 4404 Phone internat. + 358 20 722 4404Faksi 020 722 4374 Fax 020 722 4374 Fax + 358 20 722 4374
ESPOO 2004 VTT RESEARCH NOTES 2229
The main focus of the work was to collect and assemble information on themethods and economics associated with collection of wood residues forbioenergy from natural forest systems and from shortrotation fiberproduction systems. Additionally, information on bioenergy cropdevelopment approaches and projected economics has been collected andsummarized. Comparisons have been made between the USA and Finnishbiomass production and collection technologies to evaluate possibletechnology transfer opportunities.
The work was carried out in Biomass Feedstock Development Programin Oak Ridge National Laboratory (ORNL) in Tennessee during 1.9.2001–31.8.2002. It was based on literature from the USA and Finland andcompleted with the help of the study tours for the forest residue chipharvesting in California, Maine, Vermont and New Hampshire. The workand the final report were made by Dr. Arvo Leinonen who was workingas a visiting research scientist for ORNL.
Arvo Leinonen
Harvesting technology offorest residues for fuelin the USA and Finland
ISBN 951– 38– 6212– 7 (soft back ed.) ISBN 951– 38– 6761– 7 (URL: http://www.vtt.fi/inf/pdf/)ISSN 1235– 0605 (soft back ed.) ISSN 1455– 0865 (URL: http://www.vtt.fi/inf/pdf/)