hasan kalyoncu university faculty of engineeringcompe.hku.edu.tr/dosyalar/files/come213 lab...
TRANSCRIPT

EEE201 – CIRCUIT ANALYSIS LABORATORY
Res. Asst. Ali Emre ÖZTÜRK
1
HASAN KALYONCU UNIVERSITY
FACULTY OF ENGINEERING
DEPARTMENT OF ELECTRICAL & ELECTRONICS
ENGINEERING
EEE201
CIRCUIT ANALYSIS LABORATORY MANUEL
Version 1.0

EEE201 – CIRCUIT ANALYSIS LABORATORY
Res. Asst. Ali Emre ÖZTÜRK
2
Contents
1. Using oscilloscope and Function Generator 2. Using Multimeter (Ampermeter, Voltmeter) 3. Voltage Divider design and verification of Kirchhoff’s law 4. Current divider design and verification of Kirchhoff’s law 5. Mesh Analysis 6. Superposition Theorem 7. Op-amp--- thevenin 8. Transient Analysis of RC circuit norton 9. Measurement of Power factor in R, RL and RC circuit 10. Verification of Kirchhoff’s Law in Frequency domain 11. 12.
Experiment: 01
Using oscilloscope and Function Generator
Objective:
To familiarize with the use Oscilloscope and Function generator for Measurement and Testing
purposes.
Equipments and Components:
Oscilloscope
Function Generator
Theory:
Oscilloscope is used for voltage measurement. Unlike a voltmeter, an oscilloscope does not display
a single number. An oscilloscope displays signals - voltages that are functions of time. Oscilloscopes
can measure signal parameters - like frequency, peak-to-peak voltages, RMS values of signals

EEE201 – CIRCUIT ANALYSIS LABORATORY
Res. Asst. Ali Emre ÖZTÜRK
3
A function generator generates defined signals for test roles. These are sinusoidal signals, triangles,
square wave signals and even random signals.
Measuring:
Connect the probe of oscilloscope to voltage measuring point.
Be sure that, the two grounds connected together and selected in the active channel
Press the auto scale button to see the graph, or use manual setting (Change the value of horizontal
and vertical setting)
Generator:
Set the frequency of signal generator output to 5 kHz.
Set the amplitude of signal generator output voltage to 3 V peak – to – peak.
Procedure:
Generate the Square wave for 2 kHz, 3 volt peak to peak and measure the frequency utilizing from
screen.
Generate the Sine wave for 0.05 kHz, 2.5 volt peak to peak and measure the frequency utilizing from
screen.
Generate the Triangular wave for 1500 Hz, 3 volt peak to peak and measure the frequency utilizing from
screen.
EEE201 – CIRCUIT ANALYSIS LABORATORY
Res. Asst. Ali Emre ÖZTÜRK
4
Experiment: 02
Using Multimeter (Ampermeter, Voltmeter)
Objective:
To learn measuring voltage and current by using multi meter. To verify results between
experimental and theoretical results.
Equipments and Components:
Multimeter
Resistors
Variable voltage generator
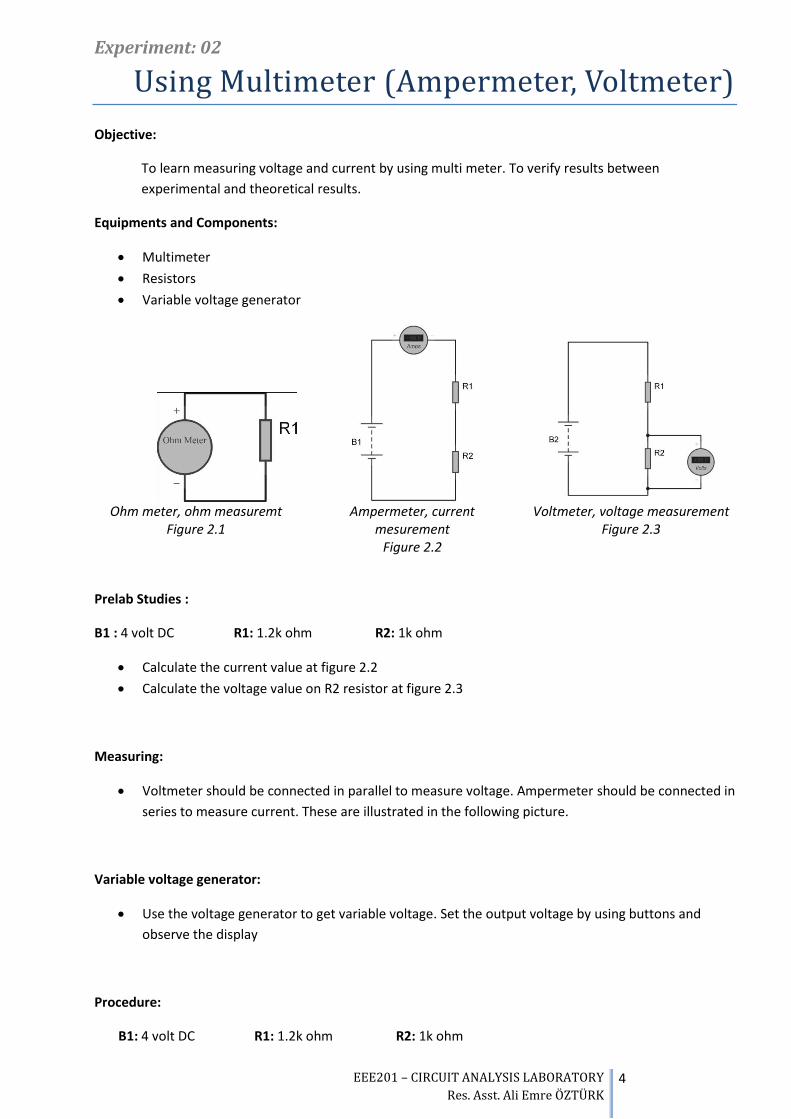
Ohm meter, ohm measuremt
Figure 2.1 Ampermeter, current
mesurement Figure 2.2
Voltmeter, voltage measurement Figure 2.3
Prelab Studies :
B1 : 4 volt DC R1: 1.2k ohm R2: 1k ohm
Calculate the current value at figure 2.2
Calculate the voltage value on R2 resistor at figure 2.3
Measuring:
Voltmeter should be connected in parallel to measure voltage. Ampermeter should be connected in
series to measure current. These are illustrated in the following picture.
Variable voltage generator:
Use the voltage generator to get variable voltage. Set the output voltage by using buttons and
observe the display
Procedure:
B1: 4 volt DC R1: 1.2k ohm R2: 1k ohm

EEE201 – CIRCUIT ANALYSIS LABORATORY
Res. Asst. Ali Emre ÖZTÜRK
5
Set up the circuit that have been shown figure 2.2 on the breadboard and measure the current.
Set up the circuit that have been shown figure 2.3 on the breadboard and measure the voltage.
Conclusion:
Compare the experimental and theoretical results. If there are difference between results, Please
explain the reason.
EEE201 – CIRCUIT ANALYSIS LABORATORY
Res. Asst. Ali Emre ÖZTÜRK
6
Experiment: 03
Voltage Divider design and verification of Kirchhoff ’s law
Objective:
To design Voltage Divider circuit using the given resistor and verify Kirchhoff’s voltage law
theoretically, Set up the circuit have been shown figure 3.1
Equipments and Components:
Multimeter
Resistors
Variable voltage generator
Prelab Studies :
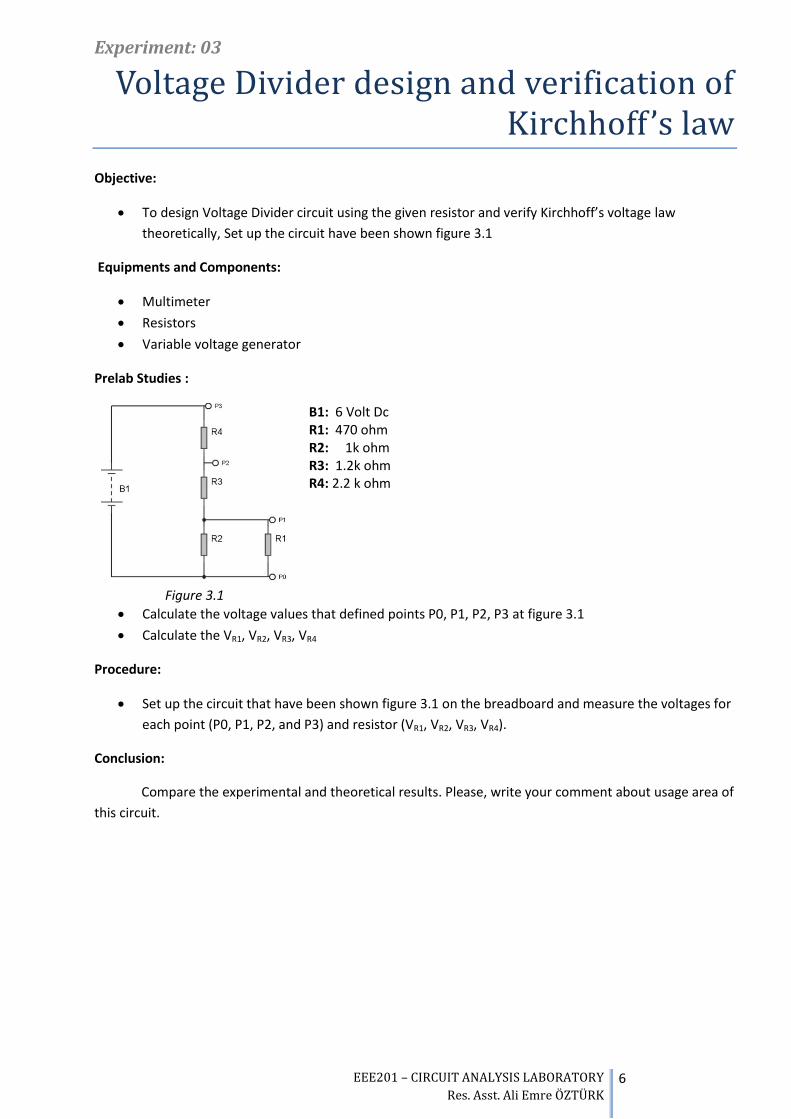
B1: 6 Volt Dc R1: 470 ohm R2: 1k ohm R3: 1.2k ohm R4: 2.2 k ohm
Figure 3.1
Calculate the voltage values that defined points P0, P1, P2, P3 at figure 3.1
Calculate the VR1, VR2, VR3, VR4
Procedure:
Set up the circuit that have been shown figure 3.1 on the breadboard and measure the voltages for
each point (P0, P1, P2, and P3) and resistor (VR1, VR2, VR3, VR4).
Conclusion:
Compare the experimental and theoretical results. Please, write your comment about usage area of
this circuit.

EEE201 – CIRCUIT ANALYSIS LABORATORY
Res. Asst. Ali Emre ÖZTÜRK
7
Experiment: 04
Current divider design and verification of Kirchhoff ’s law
Objective:
To design current Divider circuit using the given resistor and verify Kirchhoff’s voltage law
theoretically, Set up the circuit have been shown figure 3.1
Equipments and Components:
Multimeter
Resistors
Variable voltage generator
Prelab Studies:
B1: 7 volt DC R1: 470 ohm R2: 1k ohm R3: 2.2k ohm
Figure 4.1
Calculate the current values that defined lines I1, I2, I3 at figure 4.1.
Calculate the power lost for each resistor WR1, WR2, WR3.
Procedure:
Set up the circuit that have been shown figure 4.1 on the breadboard and measure the voltages for
each point (I1, I2, and I3). And power lost for each resistor (WR1, WR2, WR3).
Conclusion:
Compare the experimental and theoretical results. Write your comment about results. and write
your comment about usage area of this circuit.

EEE201 – CIRCUIT ANALYSIS LABORATORY
Res. Asst. Ali Emre ÖZTÜRK
8
Experiment: 05
Mesh Analysis
Objective:
Use mesh analysis method to find current values
Equipments and Components:
Multimeter
Resistors
Variable voltage generator
Prelab Studies:
B1: 12 volt DC R1: 470 Ohm R2: 330 Ohm R3: 220 Ohm R4: 330 Ohm
Figure 5.1
Calculate the all currents (I1, I2, and I3) that have shown figure 5.1 by using mesh analysis method.
Find the direction of current.
Procedure:
Set up the circuit that have been shown figure 5.1 on the breadboard and measure the currents for
each line (I1, I2, and I3).
Find the direction of current.
Conclusion:
Compare the experimental and theoretical results. If there are difference between results, Please
explain the reason.

EEE201 – CIRCUIT ANALYSIS LABORATORY
Res. Asst. Ali Emre ÖZTÜRK
9
Experiment: 06
Superposition Theorem
Objective:
To analyze the given circuit theoretically using superposition theorem
To verify results found by theoretical solutions with hardware
Equipments and Components:
Multimeter
Resistors
Variable voltage generator
Prelab Studies:
B1: 6 volt DC F1: 3mA R1: 500 Ohm R2: 330 Ohm R3: 220 Ohm
Figure 6.1
B1: 12 volt DC B3: 8 volt DC R1: 220 Ohm R2: 1k Ohm R3: 470 Ohm
Figure 6.2
Calculate the VR1, VR2 and VR3 for the given circuit (figure 6.1) using superposition technique
theoretically.
Calculate the VR1, VR2 and VR3 for the given circuit (figure 6.2) using superposition technique
theoretically.
Procedure:
Set up the circuit given above (figure 6.2).
Apply the super position technique.
Measure the voltage value of R1 using

EEE201 – CIRCUIT ANALYSIS LABORATORY
Res. Asst. Ali Emre ÖZTÜRK
10
Experiment: 07
Op-Amp
Objective:
Analyses the op-amp circuits.
Equipments and Components:
Multimeter
Resistors
LM741
Variable voltage generator
!! Vin POT ile voltaj ver max +5 volt
Prelab Studies:
R1: 1.2 k ohm R2: 10 k Ohm
Figure7.1
Find the equation between input-output. Vo / Vin =?
Define the type of circuit.( write your comment about the input-output equation)
Procedure:
Figure 7.2

EEE201 – CIRCUIT ANALYSIS LABORATORY
Res. Asst. Ali Emre ÖZTÜRK
11
Set up the circuit given above (figure 7.1).
Measure the output voltage and fill the blanks for each input voltage given that table 7.1
INPUT voltage Output voltage
1 V Dc
3 V Dc
4 V Dc
5 V Dc
3sin(2xpi*4000)
Table 7.1
Conclusion:
Explain the relationship between input and output voltage.
If there is different result according to input output relationship that found by you, Please explain
the cause of these results.
Experiment: 08
Transient Analysis of RC Circuit
Objective:
Design RC – circuit and analysis.
Equipments and Components:
Multimeter
Resistors
Capacitors
Variable voltage generator
Prelab Studies:
B1: 12 volt – DC R1: 10 k ohm R2: 1.2 k Ohm R3: 2.2 k Ohm C1: 10 mF
Figure8.1
Switch(button) is closing at t =0sec. Find the voltage of capacitor at t=6sec.
Procedure:

EEE201 – CIRCUIT ANALYSIS LABORATORY
Res. Asst. Ali Emre ÖZTÜRK
12
Plot the voltage - time graph of capacitor. Get 10 voltage samples from output between 0 sec. and
22 sec at intervals 2 sec. ( t:0:2:22 )
Set up the circuit that have been shown on figure 8.1 at the breadboard and measure the capacitor
voltage at t=6sec.
Conclusion:
How does the voltage of capacitor change? If the value of R3 is increased.
Experiment: 09
Measurement of Power factor in R, RL and RC circuit
Objective:
To analyze the given circuits theoretically and find the power factor.
Equipments and Components:
Multimeter
Resistors
Capacitors
Variable voltage generator
Prelab Studies:
Procedure:
Conclusion:
Experiment: 10
Verification of Kirchhoff ’s Law in Frequency domain
Objective:
To analyze the given circuit theoretically and find voltage v(t) and current i(t) using kirchhoff’s law
Equipments and Components:
Multimeter
Resistors

EEE201 – CIRCUIT ANALYSIS LABORATORY
Res. Asst. Ali Emre ÖZTÜRK
13
Capacitors
Variable voltage generator
Prelab Studies:
Procedure:
Conclusion:
1R - 2,2R - 3,3R - 4,7R - 10R - 22R - 33R - 47R - 56R - 68R - 100R - 120R - 150R - 220R - 270R - 330R - 470R - 560R - 680R - 820R 1K - 1,2K - 1,5K - 2,2K - 2,7K - 3,3K - 3,9K - 4,7K - 5,6K - 10K - 15K - 18K - 22K - 27K - 33K - 47K - 56K - 68K - 100K - 150K - 220K - 270K - 330K - 470K - 560K - 680K 1M