haulogy - economie
TRANSCRIPT

9 February 2021
HaulogyCRM Cost Assessment

Page 2
9 February 2021
DISCLAIMER
The present study has been carried out between 1st December 2020 and 28th January 2021independently by haulogy S.A., contracted by the FPS Economy to calculate the costs of themechanism as requested by the Parliament and the Minister
The aim is to provide a detailed CRM cost estimate, basing calculations on (i.) a targetvolume to be auctioned and (ii.) expected bid prices for each technology category:
• Target volume calculation is based inter alia on currently available methodology andparameters provided by ELIA in the framework of the Y-4 auction preparation fordelivery in 2025 (report published in November 2020).
• Expected bid prices are based on technology-specific costs data. However, the consultantdid not have individual data at its disposal and cannot assess the business cases andfinancing modalities of the different parties over the course of years. The cost estimate wasmade based on basic data available to the consultant. In case no usable data was available,the consultant made additional assumptions.
Page 3
9 February 2021
Agenda
I Introduction: CRM Cost impacting design elements 4
II Auction volumes targets 5
III CRM Gross Cost calculation methodology 8
IV CRM Gross Cost Results and sensitivities 12
V CRM Net Cost: Payback Obligations & Unavailability Penalties 18
VI CRM Total Cost: Associated (organisation) costs 20
VII Conclusions 21

Page 4
9 February 2021
Cost impacting elements of CRM design
Most impacting elements
➢ Volumes to contract through auctions
➢ Clearing mechanism: Pay-as bid (possibly Pay-as-Clear approach based on an evaluation after the first 2 years)
➢ Price caps : defined by the Parliament’s resolution:
➢ 20 EUR/kW/year (inflated) for 1 year contracts
➢ 75 EUR/kW/year (inflated) for multiple (3, 8 or 15) years contracts
➢ Program duration: 10 delivery years (+ possibly delivery years from remaining multiple years contracts)
➢ 20 auctions:
➢ 10 * T-4 auctions
➢ 10 * T-1 auctions
2021 2022 2023 2024 2025 2026 2027 2028 2029 2030 2031 2032 2033 2034
1 2025 T-4 T-1
2 2026 T-4 T-1
3 2027 T-4 T-1
4 2028 T-4 T-1
5 2029 T-4 T-1
6 2030 T-4 T-1
7 2031 T-4 T-1
8 2032 T-4 T-1
9 2033 T-4 T-1
10 2034 T-4 T-1
Auction to conduct in year
Del
iver
y y
ear

Page 5
9 February 2021
Auction volumes targets
Source:[1] ELIA, Préparation de l'enchère CRM Y-4 pour la période de livraison 2025-26, November 2020[2] ELIA, Adequacy and Flexibility study for Belgium 2020-2030, June 2019[3] ENTSOE, Mid-term adequacy forecast 2020, November 2020
1. Average load (scarcity period)
2. Balancing needs
3. Average Energy Not Served (ENS)
+
-
= 4. Target Volume
Based on ELIA’s report providing information for auction volume determination
5. Non participatingcapacities
-
= 6. Auction Volumes
5.1 Non eligible: C1 Criteria (Subsidies)
5.2 Non eligible: C2 Criteria (Threshold)
5.3 Non participating (Implicit foreign, Opt-out)
Y-1
Y-4
8. Reserved capacities
Explicit participation Foreign capacitiesY-1 for 2024 – 2027 delivery yearsY-4 as of the 2028 delivery year
7. Max entry capacity
Evolution until 2034 based on “Adequacy-Flexibility” study peak load growth rate (0,57% on the 2025-2030 period)
Non participating capacities and max entry capacity are assumed constant on the 2025-2034 period
Evolution until 2034 based on “Mid Term Adequacy Forecast 2020” study capacity growth rate (10% for C1 criteria ; 5% for C2 criteria)
PO
INT
«B
» Volume for 2025 delivery: 11.808 MW
• Y-4: 9.277 MW
• Y-1: 2.531 MW
CRM auction volumes forecast leads to aslightly decreasing volume over time
11,8 11,8 11,8 11,7 11,7 11,6 11,6 11,5 11,4 11,3
0
2
4
6
8
10
12
14
2025
2026
2027
2028
2029
2030
2031
2032
2033
2034
GW
Delivery period
CRM target remunerated volumes
forecast
Average decrease -0,5% p.a.
Non-eligible capacities’ growth (notably RES) prevails over the peak load evolution growth!

Page 6
9 February 2021
Thermal 6.746 Thermal 5.894
Nuclear - Nuclear -
CCGT 3.968 91% CCGT 3.611
OCGT 294 90% OCGT 265
CHP 1.368 93% CHP 1.272
Turbojets 158 96% Turbojets 152
Profiled thermal non renewable generation 958 62% Profiled thermal non renewable generation 594
Renewable 822 Renewable 640
Wind onshore - Wind onshore -
Wind offshore - Wind offshore -
Solar - Solar -
Hydro-run 134 34% Hydro-run 46
Biomass - individually modelled 273 93% Biomass - individually modelled 254
Biomass - profiled 112 62% Biomass - profiled 69
Waste - individually modelled 268 93% Waste - individually modelled 249
Waste - profiled 35 62% Waste - profiled 22
Storage 2.305 Storage 473
PSP 1.305 19% PSP 248
Batteries 1.000 23% Batteries 225
Market response 1.460 Market response 669
Market response 1.460 46% Market response 669
Cross Border participation 1.064 Cross Border participation 1.064
France 4 N/A France 4
Germany 461 N/A Germany 461
The Netherlands 599 N/A The Netherlands 599
Great Britain - N/A Great Britain -
Grand total 12.397 Grand total 8.740
Thermal 7.465
Nuclear 433
CCGT 3.968
OCGT 294
CHP 1.368
Turbojets 158
Profiled thermal non renewable generation 1.244
Renewable 14.866
Wind onshore 3.747
Wind offshore 2.253
Solar 8.000
Hydro-run 134
Biomass - individually modelled 273
Biomass - profiled 145
Waste - individually modelled 268
Waste - profiled 46
Storage 2.305
PSP 1.305
Batteries 1.000
Market response 1.460
Market response 1.460
Cross Border participation 1.935
France 4
Germany 461
The Netherlands 599
Great Britain 871
Grand total 28.031
Source:[1] ELIA, Préparation de l'enchère CRM Y-4 pour la période de livraison 2025-26, November 2020[2] ELIA, Strategic Reserve 2021-22 - input data_final_EN, November 2020[3] http://transparency.engie.com/REM_REMIT/UMMDetail.aspx?CommodityId=3&IsUMM=False&IsDefault=True
Absent (11/12) for the delivery period
100% not eligible(Subsidy criteria)
23% not eligible(Threshold criteria)
23% not eligible(Threshold criteria)
23% not eligible(Threshold criteria)
Auctions eligible capacities (delivery 2025)
Auctions eligible (derated) capacities (delivery 2025)
Projected capacities (delivery 2025)
Der
atin
g
fact
ors
Auction volumes: projected derated capacities

Page 7
9 February 2021
2. New capacities
Auction volume targets
Source:[1] ELIA, Préparation de l'enchère CRM Y-4 pour la période de livraison 2025-26, November 2020
Note: By design, Volume(B) = Volume (C)
Auctions involve:
1. Already existing capacities (whenrunning the auction)
2. Planned/expected capacities that donot exist yet when running the auction
3. New, additional capacities (possibly
required to meet the target volume)
1. Identified capacities
1.1. Existing capacities2 types of auction participants 1.2. Expected capacities
Applying [1] methodology and considering only eligible capacities
Auction Volume Point A [MW] Point B [MW]
Y-4 Auction 8.305 9.277
Y-1 Auction 2.531 2.531
Total auctions 10.836 11.808
Expected on the market 8.740 8.740
GAP (Additional capacities) 2.096 3.068
Auction Target
Identified capacities
New capacities
Based on available cost data, Contract Durations and Bid Prices are calculated
Known mix
Mix to be defined
Page 8
9 February 2021
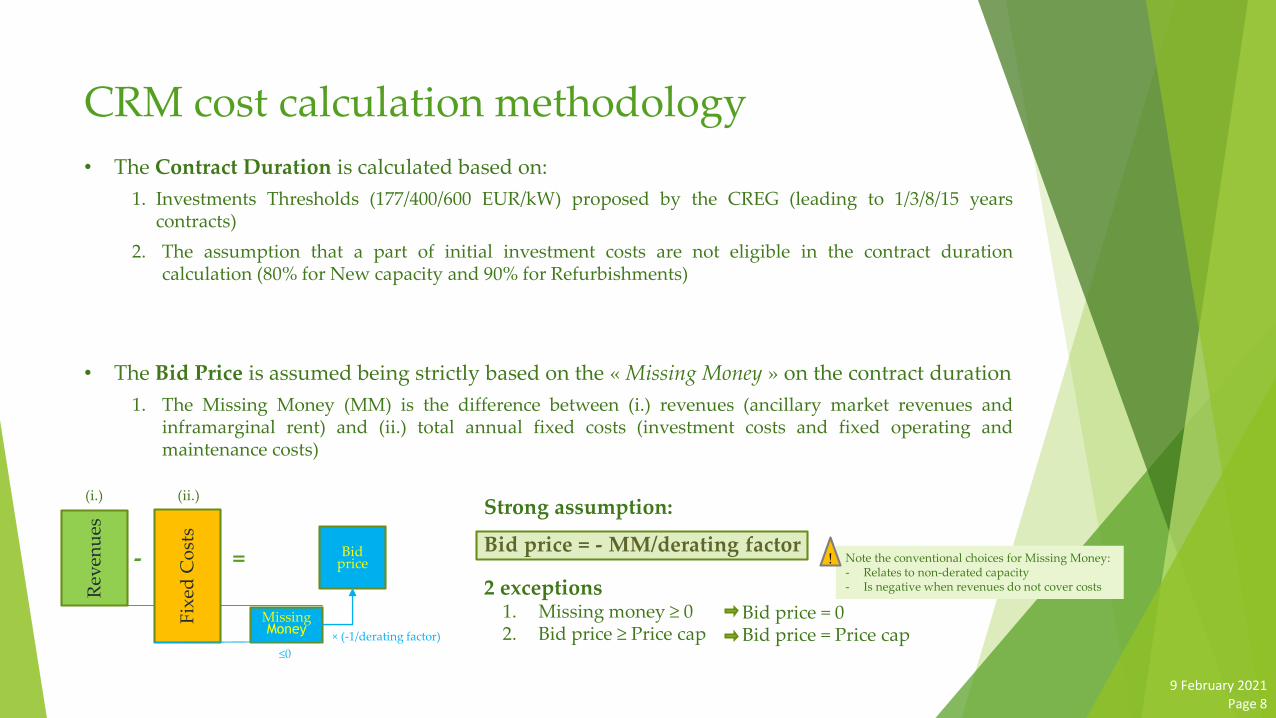
• The Contract Duration is calculated based on:
1. Investments Thresholds (177/400/600 EUR/kW) proposed by the CREG (leading to 1/3/8/15 yearscontracts)
2. The assumption that a part of initial investment costs are not eligible in the contract durationcalculation (80% for New capacity and 90% for Refurbishments)
• The Bid Price is assumed being strictly based on the « Missing Money » on the contract duration
1. The Missing Money (MM) is the difference between (i.) revenues (ancillary market revenues andinframarginal rent) and (ii.) total annual fixed costs (investment costs and fixed operating andmaintenance costs)
CRM cost calculation methodology
Strong assumption:
Bid price = - MM/derating factor
2 exceptions1. Missing money ≥ 02. Bid price ≥ Price cap
Bid price = 0Bid price = Price cap
Note the conventional choices for Missing Money:- Relates to non-derated capacity- Is negative when revenues do not cover costs
!= Bidprice
Fix
ed C
ost
s
Rev
enu
es
MissingMoney
-
≤0
× (-1/derating factor)
(i.) (ii.)

Page 9
9 February 2021
2. By assumption, the bid price exclusively covers the missing money over the CRM contract duration,e.g.:
➢ An investment project eligible to a 15 periods CRM contract will bid based on the missing money encounteredduring this contract, even if other missing money years, outside that contract duration, are expected.
➢ An existing CMU being granted a 1-year contract will only include the “money missed” during this one year
3. It is assumed that CMUs will bid on the strict basis of their Missing Money. Therefore, no strategicbidding of any kind is considered:
➢ CMUs will not bid more than what they strictly need to cover their missing money.Bidding more than the exact missing money amount could possibly constitute a bidding behaviour in a low-competitioncontext. Such a context is considered in scenario 2 and 2bis (cf. page 28 and 30), where it is assumed that all existingcapacities bid at the intermediate price cap level in all auctions.
➢ CMUs will not bid less than what they strictly need to cover their missing money.Bidding less than the exact missing money amount could possibly constitute a bidding behaviour in a highly competitivecontext that is not considered in the present analysis. For instance, in such a context, existing capacities might forego apart of their fixed costs (e.g.: past CAPEX) to ensure their selection in the CRM auction.
CRM cost calculation methodology

Page 10
9 February 2021
Detailed costs and revenues data are not (consistently) available for all technologies
➢ 8 categories
1. CCGT
2. OCGT
3. CHP
4. PSP
5. Batteries
6. Market Response
7. Cross-Border participation
8. Others*
Detailed data for all considered power generation or power market responses technologies arerequired to assess contract duration and bid prices:
CRM cost calculation methodology
➢ Costs data:
1. Initial investment data for new, existing and refurbishment of capacities
2. Fixed operating and maintenance (FOM)
➢ Revenues data:
1. Ancillary services net revenues
2. Infra-marginal rent data
The main sources used are:➢ CREG, Consultation publique
(PRD)2086 relative au Projet deproposition relative au coût brutd’un nouvel entrant et au facteurde correction X, June 2020
➢ ELIA, Préparation de l'enchèreCRM Y-4 pour la période delivraison 2025-26, November 2020
In case of lack of data in the latter two, othersources and/or assumptions are used
*Turbojets, Profiled thermal non-renewable generation, Hydro-run, Biomass, Waste
Derated MW
Data available 5.148
Substantiated Assumptions 2.207
Estimated/Parametrisation 1.386
Total 8.740

Page 11
9 February 2021
Essential assumptions made by the consultant:
➢ In 2025, 42% of identified CCGTs will undergo a refurbishment (0% for OCGTs and 42% for CHPs)
➢ 70% of the CCGTs that are not undergoing a refurbishment are still within their economic lifetime (100% forOCGTs and 70% for CHPs)
➢ 20% of CHPs are opting-out
➢ The new capacity-mix is made of 70% CCGT, 5% OCGT and 25% CHP in 2025
➢ The decreasing demand as of 2026 is impacted on the existing capacities bidding at the Intermediate Price Cap
Results are computed for several scenarios around the base case:
CRM cost calculation methodology
Scenario 1-year contracts
bidding at the
Intermediate Price Cap
New CCGT Efficiency New CCGT CAPEX
[EUR/kW]
Existing CCGT CAPEX
[EUR/kW]
1 = base case No 60% 750 527
2 Yes 60% 750 527
1bis No 63% 633 445
2bis Yes 63% 633 445

Page 12
9 February 2021
CRM gross cost results and sensitivitiesBase case scenario:
(bidders offer based on Missing Money
levels, including when this leads to
bidding at 0 EUR/kW/y)
CRM parameters
➢ WACC = 7,5% ; Inflation = 1,58%
➢ CAPEX new CCGT = 750 EUR/kW
➢ CAPEX existing CCGT = 527 EUR/kW
➢ Competitive market : Bid Price = MissingMoney/derating factor (if Missing Money ≥ 0,Bid Price = 0)
➢ Existing capacities: 20% opt-out for CHP
➢ 2025 refurbishment share: 42% for CCGT, 0%OCGT and 42% for CHP
➢ New Capacity is made of 70% CCGT, 5%OCGT and 25% CHP
Scenario 1
0
50
100
150
200
250
300
350
MIL
LIO
NS
CRM nominal cost (bidders [capped] offering based on their actual
missing money levels)
Y-1
Y-4
Previously Auctioned
Average nominal value:
• Complete period (15 years): 238 MEUR
• First 10 years : 300 MEURCRM nominal Gross Cost in MEUR
CRM delivery year 2025 2026 2027 2028 2029 2030 2031 2032 2033 2034 2035 2036 2037 2038 2039
Y-4 271 74 75 83 83 83 83 82 119 118 0 0 0 0 0
Y-1 37 38 39 27 28 28 29 30 30 31 0 0 0 0 0
Previously auctioned 0 197 197 197 197 197 197 197 113 113 113 113 113 113 113
SUM 308 310 311 308 308 309 309 309 263 263 113 113 113 113 113

Page 13
9 February 2021
CRM gross cost results and sensitivitiesMixed situation :
Multi-annual contracts bidders offer
based on their missing money and 1-year
contract bidders offer at the Intermediate
Price Cap in every CRM auction
CRM parameters
➢ WACC = 7,5% ; Inflation = 1,58%
➢ CAPEX new CCGT = 750 EUR/kW
➢ CAPEX existing CCGT = 527 EUR/kW
➢ Hybrid Market : (3-8-15 years contracts : BidPrice = Missing Money/derating factor; 1-yearcontracts : Bid Price = Price cap)
➢ Existing capacities : 20% opt-out for CHP
➢ 2025 refurbishment share: 42% for CCGT, 0%OCGT and 42% for CHP
➢ New Capacity is made of 70% CCGT, 5%OCGT and 25% CHP
Scenario 2
0
50
100
150
200
250
300
350
MIL
LIO
NS
CRM nominal cost (bidders [capped] offering based on their actual
missing money levels except 1-year contracts bidding at the Intermediate
Price Cap for every delivery year)
Y-1
Y-4
Previously Auctioned
CRM nominal Gross Cost in MEUR
Average nominal value:
• Complete period (15 years): 253 MEUR
• First 10 years : 322 MEUR
CRM delivery year 2025 2026 2027 2028 2029 2030 2031 2032 2033 2034 2035 2036 2037 2038 2039
Y-4 283 86 87 105 105 105 105 105 142 142 0 0 0 0 0
Y-1 48 49 50 27 28 28 29 30 30 31 0 0 0 0 0
Previously auctioned 0 197 197 197 197 197 197 197 113 113 113 113 113 113 113
SUM 330 332 334 329 330 331 332 332 286 286 113 113 113 113 113

Page 14
9 February 2021
CRM gross cost results and sensitivities
Variation of the base case scenario
CRM parameters
➢ WACC = 7,5% ; Inflation = 1,58%
➢ CAPEX new CCGT = 633 EUR/kW*
➢ CAPEX existing CCGT = 445 EUR/kW
➢ Competitive market : Bid Price = MissingMoney/derating factor (if Missing Money ≥ 0,Bid Price = 0)
➢ Existing capacities: 20% opt-out for CHP
➢ 2025 refurbishment share: 42% for CCGT, 0%OCGT and 42% for CHP
➢ New Capacity is made of 70% CCGT, 5%OCGT and 25% CHP
Scenario 1bis
0
50
100
150
200
250
300
350
MIL
LIO
NS
CRM nominal cost (Base case variation with CAPEX
new CCGT = 633EUR/kW & CAPEX existing CCGT = 445EUR/kW)
Y-1
Y-4
Previously Auctioned
Compared with the base case scenario (scenario 1), thedifference is consequent because the new CCGTscontracts [here 8 years compared to 15 years in thereference scenario 1] are not carried along after 2032.
CRM nominal Gross Cost in MEUR
Average nominal value:
• Complete period (15 years): 188 MEUR
• First 10 years : 282 MEUR
CRM delivery year 2025 2026 2027 2028 2029 2030 2031 2032 2033 2034 2035 2036 2037 2038 2039
Y-4 265 74 75 83 83 83 83 82 168 168 0 0 0 0 0
Y-1 37 38 39 27 28 28 29 30 30 31 0 0 0 0 0
Previously auctioned 0 192 192 192 192 192 192 192 0 0 0 0 0 0 0
SUM 303 304 305 302 303 303 304 304 198 199 0 0 0 0 0
*600 EUR/kW EPC [GTW, Handbook Gas Turbine, Jan 2019]+ 5,5% grid connection costs [Fichtner]

Page 15
9 February 2021
CRM gross cost results and sensitivities
Variation of the “Mixed situation”
CRM parameters
➢ WACC = 7,5% ; Inflation = 1,58%
➢ CAPEX new CCGT = 633 EUR/kW*
➢ CAPEX existing CCGT = 445 EUR/kW
➢ Hybrid Market : (3-8-15 years contracts : BidPrice = Missing Money/derating factor; 1-yearcontracts : Bid Price = Price cap)
➢ Existing capacities: 20% opt-out for CHP
➢ 2025 refurbishment share: 42% for CCGT, 0%OCGT and 42% for CHP
➢ New Capacity is made of 70% CCGT, 5%OCGT and 25% CHP
Scenario 2bis
0
50
100
150
200
250
300
350
MIL
LIO
NS
CRM nominal cost (Scenario n°2 variation with CAPEX new CCGT = 633EUR/kW
& CAPEX existing CCGT = 445EUR/kW)
Y-1
Y-4
Previously Auctioned
CRM nominal Gross Cost in MEUR
Average nominal value:
• Complete period (15 years): 203 MEUR
• First 10 years : 305 MEUR
Compared with the mixed situation scenario (scenario2), the difference is consequent because the newCCGTs contracts [here 8 years compared to 15 years inreference scenario 2] are not carried along after 2032.
CRM delivery year 2025 2026 2027 2028 2029 2030 2031 2032 2033 2034 2035 2036 2037 2038 2039
Y-4 277 86 87 105 105 105 105 105 191 191 0 0 0 0 0
Y-1 48 49 50 27 28 28 29 30 30 31 0 0 0 0 0
Previously auctioned 0 192 192 192 192 192 192 192 0 0 0 0 0 0 0
SUM 325 326 328 323 324 325 326 326 221 222 0 0 0 0 0
*600 EUR/kW EPC [GTW, Handbook Gas Turbine, Jan 2019]+ 5,5% grid connection costs [Fichtner]

Page 16
9 February 2021
Scenario comparison (Average nominal value 15/10 years):
Base case scenario leads to a Gross Cost Estimate of:
CRM gross cost results and sensitivities
Scenario Average
nominal value
(15 years)
[MEUR]
Average
nominal value
(10 years)
[MEUR]
1 = base case 238 300
2 253 322
1bis 188 282
2bis 203 305
CRM nominal Gross Cost in MEUR
CRM delivery year 2025 2026 2027 2028 2029 2030 2031 2032 2033 2034 2035 2036 2037 2038 2039
Y-4 271 74 75 83 83 83 83 82 119 118 0 0 0 0 0
Y-1 37 38 39 27 28 28 29 30 30 31 0 0 0 0 0
Previously auctioned 0 197 197 197 197 197 197 197 113 113 113 113 113 113 113
SUM 308 310 311 308 308 309 309 309 263 263 113 113 113 113 113

Page 17
9 February 2021
Comparison costs assessments 2018 & 2021
Design elements PwC (2018): Preliminary CRM design haulogy (2021): Detailed CRM design
Delivery Duration Unknown => 15 years 10 years
Auction Volume Unknown => Peak load (13,6 GW) Estimated need (11,8 GW)
Volume growth Unknown => Peak load based : +0,5% p.a. Supply/demand Forecast based -0,5% p.a.
Clearing Unknown => Pay-As-Clear (no caps) Pay-As-Bid (with price caps)
Price caps Undefined (benchmark based)
▪ New: 83 EUR/kW/y (inflated 2%)
▪ Existing: 19,6 EUR/kW/y (inflated 2%)
Defined (Proposition based)
▪ MY-contracts: 75 EUR/kW/y (inflated 1,6%)
▪ 1Y-contracts: 20 EUR/kW/y (inflated 1,6%)
Capacities split Not detailed:
▪ New : 3,6 GW
▪ Existing : 10 GW (2025)
Forecasted/ scenarios
▪ New: ~3 GW (2025)
▪ Refurbished
▪ Existing
Gross cost Average (15 years) : 625 MEUR/y
Average (10 years): 612 MEUR/y
Average (15 years) : 238 MEUR/y
Average (10 years): 300 MEUR/y

Page 18
9 February 2021
Comparison costs assessments 2018 & 2021
1. Pay-As-Clear (with no price caps) => Pay-As-Bid (with price caps)
2. 15 delivery years=> 10 delivery years
3. Auction volume: peak (13,6 GW in 2025) => scarcity assessment need and non participating capacities assessment: 11,8 GW
4. Volume: growth (+0,5% p.a.)=> market evolution based (-0,5%)
Page 19
9 February 2021
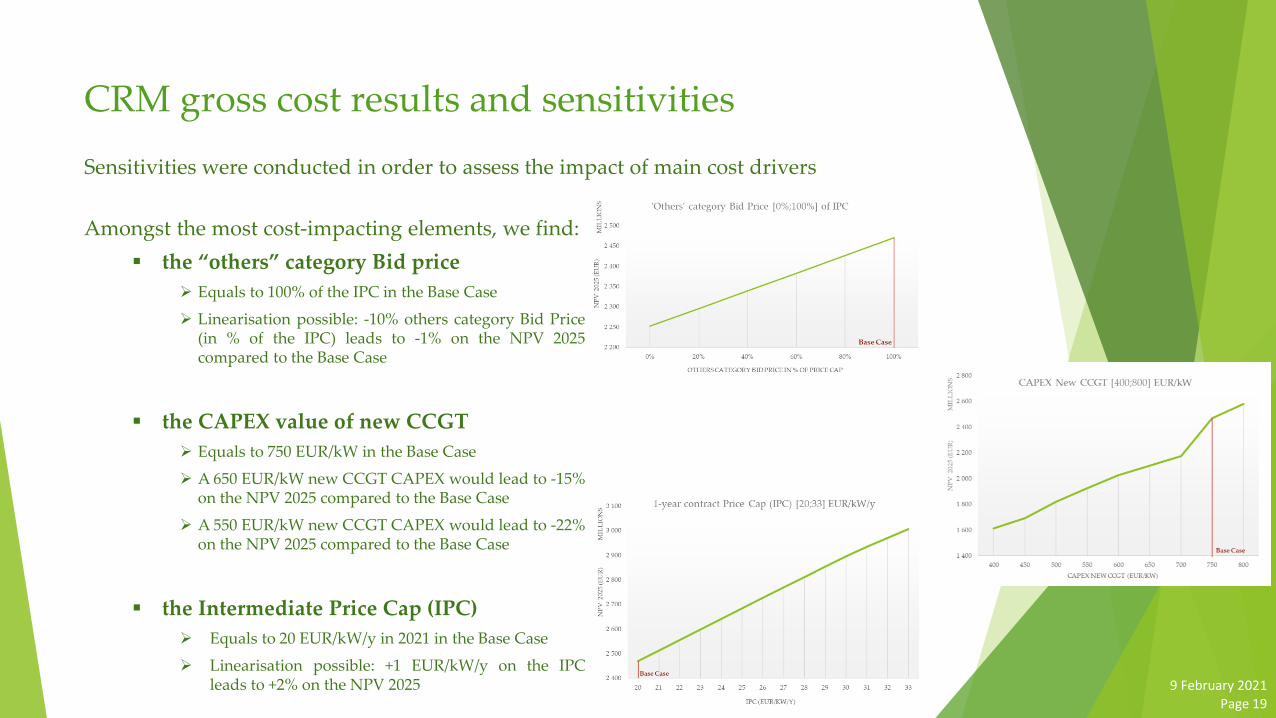
CRM gross cost results and sensitivities
Sensitivities were conducted in order to assess the impact of main cost drivers
Amongst the most cost-impacting elements, we find:
▪ the “others” category Bid price
➢ Equals to 100% of the IPC in the Base Case
➢ Linearisation possible: -10% others category Bid Price(in % of the IPC) leads to -1% on the NPV 2025compared to the Base Case
▪ the CAPEX value of new CCGT
➢ Equals to 750 EUR/kW in the Base Case
➢ A 650 EUR/kW new CCGT CAPEX would lead to -15%on the NPV 2025 compared to the Base Case
➢ A 550 EUR/kW new CCGT CAPEX would lead to -22%on the NPV 2025 compared to the Base Case
▪ the Intermediate Price Cap (IPC)
➢ Equals to 20 EUR/kW/y in 2021 in the Base Case
➢ Linearisation possible: +1 EUR/kW/y on the IPCleads to +2% on the NPV 2025

Page 20
9 February 2021
CRM Net Cost - Payback Obligations
2025 2026 2027 2028 2029 2030 2031 2032 2033 2034 2035 2036 2037 2038 2039
2,3 2,3 2,3 2,3 2,3 2,3 2,3 2,2 2,2 2,2 0,5 0,5 0,5 0,5 0,5
Payback [MEUR/y]
Base Case
+10 EUR/MWh +0,4 MEUR/y
Average CRM Gross Cost (15 years):▪ Payback Obligations = 2 MEUR/y▪ CRM Gross Cost = 238 MEUR/y
➢ Limited impact of the PaybackObligations on the CRM Net Cost
Sources:[1] Elia, November 2020, Proposition de règles de fonctionnement CRM[2] ELIA, Préparation de l'enchère CRM Y-4 pour la période de livraison 2025-26, November 2020[3] PwC, Détermination du mécanisme de rémunération de la capacité belge et préparation du cadre législatif
The Belgian CRM design includes a Reliability Option System (Payback Obligations)
PrincipleA contracted CMU shall pay back the difference between the Reference Price and the Strike Price (assumed at 300 EUR/MWh[2]) when the Reference Price exceeds the Strike Price
Estimation of Yearly Payback Obligations[3]
202𝑋 𝑃𝑎𝑦𝑏𝑎𝑐𝑘 𝑂𝑏𝑙𝑖𝑔𝑎𝑡𝑖𝑜𝑛𝑠≈ 𝐴𝑣𝑒𝑟𝑎𝑔𝑒 𝑛𝑏 𝑜𝑓 𝑜𝑐𝑐𝑢𝑟𝑒𝑛𝑐𝑒𝑠 𝑝𝑒𝑟 𝑦𝑒𝑎𝑟 × 𝐴𝑣𝑒𝑟𝑎𝑔𝑒 𝑅𝑒𝑓𝑒𝑟𝑒𝑛𝑐𝑒 𝑃𝑟𝑖𝑐𝑒 𝑤ℎ𝑒𝑛 𝑒𝑥𝑐𝑒𝑒𝑑𝑖𝑛𝑔 𝑆𝑡𝑟𝑖𝑘𝑒 𝑃𝑟𝑖𝑐𝑒 − 𝑆𝑡𝑟𝑖𝑘𝑒 𝑃𝑟𝑖𝑐𝑒 × 𝑃𝑎𝑦𝑏𝑎𝑐𝑘 𝑜𝑏𝑙𝑖𝑔𝑎𝑡𝑒𝑑 𝑐𝑎𝑝𝑎𝑐𝑖𝑡𝑦
Assumption: ~350 EUR/kW

Page 21
9 February 2021
Definition[1]
The availability of a contracted CMU can be tested by Elia. In case of missing capacity, an Unavailability Penalty fee isapplied to the CMU. It is proportional to:
➢ the volume of missing capacity➢ the remuneration contract value➢ a penalty factor, that depends on
▪ whether the outage is announced (Announce Outage, AO) or not (Forced Outage, FO)▪ the time of the year for Announced Outages (01/04 – 31/10 vs 01/11 – 31/03)
Estimation of 2025 Unavailability Penalties➢ Using 2018-2019 outage data[2] from ENTSOE (Unit name, FO/AO, Start, End, Installed Capacity, Available Capacity)➢ Assuming the length of tests is 15 Availability Monitoring Trigger (AMT) moments (quarter-hours)➢ Extrapolating to align on 2025 technology-mix➢ Adapting New and Refurbished yearly contract values by weighting with 2025 Bid Prices
2025 Unavailability Penalties results:
CRM Net Cost - Unavailability Penalties
Sources:[1] Elia, November 2020, Proposition de règles de fonctionnement CRM[2] https://transparency.entsoe.eu/outage-domain/r2/unavailabilityOfProductionAndGenerationUnits/show
Total 2025 Unavailability Penalties = 4,7 MEUR/y≈ 2025-2039 Yearly Unavailability Penalty estimation (maximumbecause of Secondary Market possibilities for CMUs)
Average CRM Gross Cost (15 years):▪ Unavailability Penalties = 4,7 MEUR/y▪ CRM Gross Cost = 238 MEUR/y
➢ Limited impact of the Unavailability Penalties on the CRM Net Cost
Penalty [EUR/y] FO 01/01 - 31/12 AO 01/11 - 31/03 AO 01/04 - 31/10
CCGT 413.824 609.360 350.106
PSP Coo 13.622 4.408 9.744
CHP 0 0 0
Penalty [EUR/y] FO 01/01 - 31/12 AO 01/11 - 31/03 AO 01/04 - 31/10
CCGT 648.640 955.130 548.767
PSP Coo 0 0 0
CHP 0 0 0
Penalty [EUR/y] FO 01/01 - 31/12 AO 01/11 - 31/03 AO 01/04 - 31/10
CCGT 446.220 657.063 57.275
PSP Coo 0 0 0
CHP 0 0 0
Existing
New
Refurbished

Page 22
9 February 2021
Associated Costs are the Investments, Human Resources and “Other costs” borne by Elia, the FPS Economy and the CREG.
Only the Associated Costs borne by Elia are taken into account in the present study
1. Investments: Digital auction platform ~2 MEUR (0,23 MEUR/y), plus 25% maintenance charges per year (0,06 MEUR), based on haulogy’s (digital solution editing) experience
2. Human resources: Assuming 10 FTEs and a 58.400 EUR[1]+[2] total yearly salary cost for the employer, the Human resources cost item represents 0,6 MEUR/y
3. Other costs (Financing and foreign TSOs): According a preliminary estimate available to the consultant, the Other costs item represents 0,5 MEUR/y
It can be concluded that the Associated Costs represent 1,4 MEUR/y➢ Not significant compared to the CRM Net Cost
CRM Total Cost - Associated Costs
Sources:[1] Statbel, overview of Belgian wages and salaries (updated on 3 September 2020); 2018 value [2] https://www.onssrszlss.fgov.be/fr/employeurs-et-onss/paiements

Page 23
9 February 2021
CRM delivery year 2025 2026 2027 2028 2029 2030 2031 2032 2033 2034 2035 2036 2037 2038 2039
Y-4 271 74 75 83 83 83 83 82 119 118 0 0 0 0 0
Y-1 37 38 39 27 28 28 29 30 30 31 0 0 0 0 0
Previously auctioned 0 197 197 197 197 197 197 197 113 113 113 113 113 113 113
CRM Gross Cost 308 310 311 308 308 309 309 309 263 263 113 113 113 113 113
Payback -2 -2 -2 -2 -2 -2 -2 -2 -2 -2 -1 -1 -1 -1 -1
Unavailability Penalties -5 -5 -5 -5 -5 -5 -5 -5 -5 -5 -5 -5 -5 -5 -5
CRM Net Cost 301 302 304 301 301 302 302 302 256 255 108 108 108 108 108
Associated Costs 1 1 1 1 1 1 1 1 1 1 1 1 1 1 1
CRM Total Cost 302 303 305 302 302 303 303 303 257 256 109 109 109 109 109
Conclusion
▪ Payback Obligations▪ Unavailability Penalties▪ Associated costs
Based on the scenarios and sensitivities made around the base case, it can be concluded that the base case scenario is a reasonable estimate for the CRM total cost assessment.
CRM nominal Cost in MEUR
have a limited impact on the CRM Cost result
Cost Type
Average
nominal value
(15 years)
[MEUR]
Average
nominal value
(10 years)
[MEUR]
Gross Cost 238 300Net Cost 231 293
Total Cost 232 294

Thank you - Contacts
Luc Vercruyssen
Consulting Department Manager
+32 (0)479 913 180
Aymeric Durand
Consultant
+32 (0)490 647 900
Charles Delhaye
Chief Executive Officer
+32 (0)499 058 584