hawaii transportation energy analysis: marine efficiency ... · pdf filehawaii transportation...
TRANSCRIPT

Hawaii Transportation Energy
Analysis: Marine Efficiency Options
Haifeng Wang, Ph.D.
Dan Rutherford, Ph.D.
11 February 2015

Outline
About the ICCT
Project background
Baseline marine energy consumption
Unique characteristics of shipping
energy use
Energy-saving tactics evaluated
2

ICCT mission and activities
The mission of ICCT is to
dramatically improve the
environmental
performance and efficiency
of cars, trucks, buses and
transportation systems in
order to protect and
improve public health, the
environment, and quality of
life.
Non-profit research institute
Air pollution and climate impacts
Focus on regulatory policies and fiscal incentives
Activity across modes including aviation and marine
Global outreach, with special focus on largest markets
Slide 3

Disclaimer
The International Council on Clean Transportation
(ICCT) is a consultant to the Department of Business,
Economic Development, and Tourism (DBEDT) under
contract number 63188: Professional Services for
Transportation Industry Analyst.
The views and opinions expressed in this presentation
are that of the ICCT, and may not necessarily
represent the position of the DBEDT.
4

HCEI 2011 roadmap established an aggressive goal
Goal: Reduce the use of petroleum in ground
transportation by 70% or ~ 385 MGY by 2030
Strategy with 2010 baseline 2015 target 2020 target 2030 target
Reduce vehicle miles traveled
(VMT)
2% VMT
reduction
4% VMT
reduction
8% VMT
reduction
Incorporate renewable fuels
into transportation sector
E10 and biodiesel consumption
at 2010 level (~45 million
gallons)
150 million
gallons
Improve standard vehicle
efficiency of fleet
25 mpg cars
18 mpg LT
30 mpg cars
22 mpg LT
35 mpg cars
28 mpg LT
Accelerate the deployment of
electric vehicles (EVs) and
related infrastructure
4K EV sales
(10K on road)
10K EV sales
(40K on road)
30K EV sales
MGY: million gallons per year 5

Comparing 2015/2020 goals with 2013 status
Strategy with 2010 baseline 2015 target 2020 target 2013/2014
Actual
Reduce vehicle miles traveled
(VMT)
2% VMT
reduction
4% VMT
reduction
19% increase
in VMT
Incorporate renewable fuels
into transportation sector
E10 and biodiesel consumption
at 2010 level (~45 gallon)
52 million
gallons
Improve standard vehicle
efficiency of fleet
25 mpg cars
18 mpg LT
30 mpg cars
22 mpg LT
25 mpg for cars
& LT combined
Accelerate the deployment of
electric vehicles (EVs) and
related infrastructure
4K EV sales
(10K on road)
10K EV sales
(40K on road)
1K EV sales
(~3K on road)
On-road fuel use of 525 MGY in 2013 as compared
with 496 MGY in 2010; a 6% increase.
6

Core strategies under consideration for
transportation energy roadmap
Light- as well as heavy-duty vehicle efficiency
improvements
Transition to electric drive vehicles (EVs and
FCVs)
Alternative fuels including biofuels and natural gas
Vehicle demand management/promotion of transit
and non-motorized transport
Improving aviation efficiency
Improving marine efficiency
7

Timeline for transportation energy analysis
• Stakeholder workshop: November 2014 http://energy.hawaii.gov/wp-content/uploads/2011/09/TransWorkshop_Summary.pdf
• Vehicle Efficiency Options, January 8, 2015 (webinar) • http://energy.hawaii.gov/wp-content/uploads/2011/09/VehicleOptionsWebinar_1.08.15.pdf
• Continued stakeholder engagement
• Workshop on Electric drive vehicles: January 13-14, 2014
• Web-meetings on aviation and marine tactics: early February 2015
• Qualitative and quantitative evaluation of tactics (January/February 2015)
• Assess complementarity with existing Hawaii policies/plans and budgets
(February/March 2015)
• Seek broad agreement on plan and implementation steps (April/May
2015)
• Final report (June 2015)
______________
• Late 2015: Actual work begins on implementing an integrated
transportation energy strategy with shared roles and responsibilities
8

Baseline marine energy consumption
9

Fuel sales to ocean-going vessels in
Hawaii
Bunker sales to ocean-going vessels (OGVs) fluctuate widely around
110 million gallons per year, 2.5% of total U.S. bunker sales, 10% of
total liquid fuel sales in Hawaii
Data Source: EIA (2014), Bunker sales to ships in Hawaii 10

Fuel sales to small boats in Hawaii
Fuel sales to small boats vary even more over time, with
increasing gasoline sales
Data provided by Hawaii DBEDT 11

Combined fuel sales to shipping in Hawaii
0
10
20
30
2006 2007 2008 2009 2010 2011 2012 2013
Shipenergyconsump
on(TrillionBTU
)
SmallBoatGasoline
SmallBoatDiesel
OGVDis llate
OGVResidualOil
Bunker sales to ocean-going vessels (OGVs) dominate total
energy use
Baseline in 2020: 122 MGY (OGVs) and 3 MGY (small boats)
12

Unique characteristics of shipping
energy use
13

Not all oil is the same
ExxonMobile: A simple guide to oil refining
14

Regulatory changes in the coming years
Global bunker demand will undergo a sea change in the next few
years
Ship operators have to store multiple fuels in tanks, leading to
changes in demand for different marine fuels in Hawaii
Source: Dieselnet https://www.dieselnet.com/standards/inter/imo.php
http://transportpolicy.net/index.php?title=International:_Fuels:_ISO_Petroleum_Marine_Fuels
15

Marine fuel is much cheaper
EIA (2013) Hawaii price differences from U.S. average
http://www.eia.gov/state/?sid=HI#tabs-5 ICCT (2013) “Assessment of the fuel cycle impact of LNG as used in
international shipping
Cheap fuel may damp the implementation of alternative fuels
(i.e. LNG)
16

Market situation in shipping market
Unlike aircraft, OGVs usually purchase
fuels in markets where they are cheaper
and carry them during other voyages
Consequently, raising the energy
efficiency of OGVs does necessarily
mean reduced demand for marine fuels at
a given port
- For analysis purpose, we assume energy
savings will translate to lower energy demand
in shipping in Hawaii 17

Energy-saving tactics evaluated
18

Marginal abatement cost curve
A marginal abatement cost curve was applied to assess tactics
to reduce energy consumption from shipping in Hawaii
ICCT (2011) Reducing Greenhouse Gas from shipping
19

Marine fuel efficiency improvement tactics
considered
Slow steaming when ships approach 40 nautical miles of Port of Honolulu
Fuel surcharge for shipping fuels sold in Hawaii
Hull cleaning for OGVs and small boats
Propeller polishing for OGVs and small boats
Onshore power for OGVs visiting Port of Honolulu
20

Slow steaming
Fij = [MFk ´sik
s0k
æ
èç
ö
ø÷
3
i, j,k
å + AFk ]´dij
24´ sik´ l
Main engine fuel consumption scales with the cube of operational speed
Encouraging OGVs to reduce speeds outside ports would reduce fuel consumption and air emissions
Port of Los Angles and Port of Long Beach (POLB) both applied this method
POLB (2012) Port of Long Beach inventory 21

Effectiveness
Assumptions
- Estimated energy consumption at Port of Honolulu using
PoLB inventory and relative cargo throughput
- Cargo growth increases 5% annually between 2011 and
2020
- Speed reduced to 12 knots into the speed limit zone
Effectiveness
- 0.8 MGY
- $0.5 million incentive in discounted port dues
- $0.61 per gallon (excluding cost or gains from fuels from
shipping companies)
Policy implication: voluntary slow steaming program
with incentives such as discounted port dues 22

Marine fuel efficiency improvement tactics
considered
Slow steaming when ships approach 40 nautical miles of Port of Honolulu
Fuel surcharge for shipping fuels sold in Hawaii
Hull cleaning for OGVs and small boats
Propeller polishing for OGVs and small boats
Onshore power for OGVs visiting Port of Honolulu
23

State and local sales taxes on
transportation fuels
Jurisdiction
Tax (cents/gallon)
Gasoline Highway
Diesel
Highway
LPG
Non-
highway
Diesel
Non-
highway
LPG
Aviation Marine
bunkers
State 17 17 5.2 2.0 2.0 2.0 -----
Count
y
Honolulu 16.5 16.5 5.4 ----- ----- ----- -----
Maui 16.0 16.0 4.3 ----- ----- ----- -----
Hawaii 8.8 8.8 2.9 ----- ----- ----- -----
Kauai 17.0 17.0 5.6 ----- ----- ----- -----
http://www.tfhawaii.org/taxes/fuel.html 24
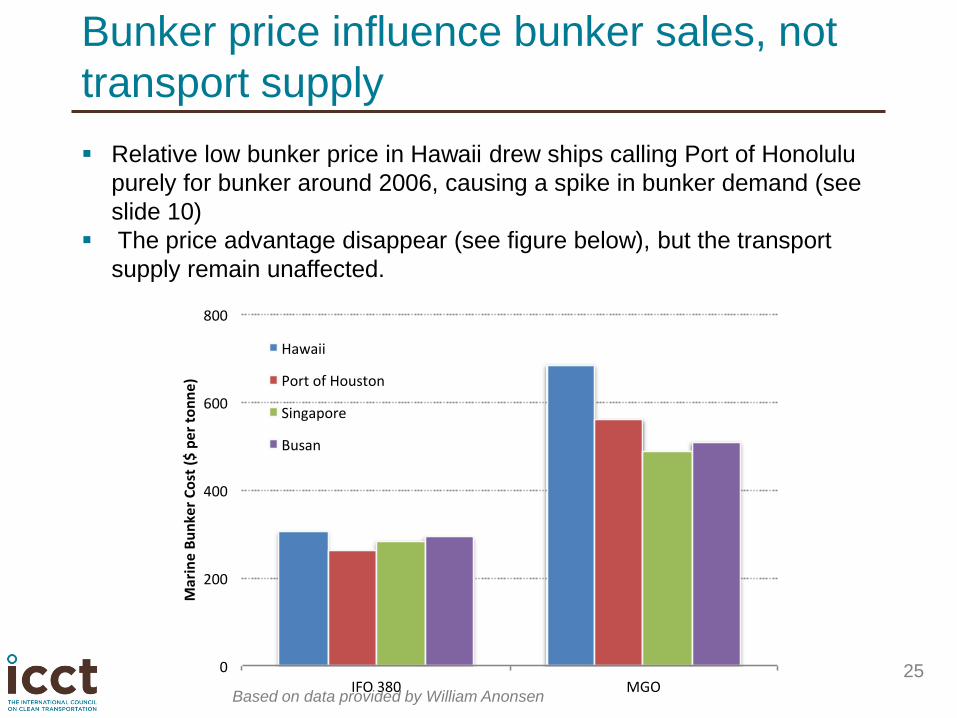
Bunker price influence bunker sales, not
transport supply
0
200
400
600
800
IFO380 MGO
MarineBunkerCost($pertonne)
Hawaii
PortofHouston
Singapore
Busan
Relative low bunker price in Hawaii drew ships calling Port of Honolulu
purely for bunker around 2006, causing a spike in bunker demand (see
slide 10)
The price advantage disappear (see figure below), but the transport
supply remain unaffected.
Based on data provided by William Anonsen
25

Effectiveness
No fuel tax exists for ships; a fee surcharge could be
viable
Assumptions
- 1% increase of fuel price will reduce fuel sales by 0.15%
(average figure from ISL, 2013; Swedish shipping
association, 2011; CE Delft, 2010)
- Baseline fuel cost by 2020: $700 per tonne
- $20 surcharge (4%)
Effectiveness
- 0.9 MGY
- -$0.10 per gallon
Policy implication: Consider a fuel surcharge for shipping
fuels to encourage hull and propeller polishing business
26

Marine fuel efficiency improvement tactics
considered
Slow steaming when ships approach 40 nautical miles of Port of Honolulu
Fuel surcharge for shipping fuels sold in Hawaii
Hull cleaning for OGVs and small boats
Propeller polishing for OGVs and small boats
Onshore power for OGVs visiting Port of Honolulu
27

Hull cleaning and propeller polishing
Hull and propellers should be regularly
cleaned and polished to reduce resistance
in operation
Literature shows some shipowners do not
follow the maintenance schedule
Real savings depend on the penetration
rates of both tactics in Hawaii
28

Assumptions
Hull cleaning: 1%-10% energy reduction; $75K – 112K cost for OGVs
Propeller polishing: 3%-8% energy reduction; $80K - $90K cost for OGVs
Market penetration rate: 60% (we examined the effect between 60% to 90% penetration rates)
Both hull cleaning and propeller polishing can be applied to OGVs and small boats
29

Effectiveness
Hull cleaning: 3.1 MGY; -$0.47 per gallon
Propeller polishing: 2.9 MGY; -$0.67 per gallon
Policy implications: fiscal policies such as tax credit and
state subsidies to encourage hull cleaning and propeller
polishing business
30
Marine fuel efficiency improvement tactics
considered
Slow steaming when ships approach 40 nautical miles of Port of Honolulu
Fuel surcharge for shipping fuels sold in Hawaii
Hull cleaning for OGVs and small boats
Propeller polishing for OGVs and small boats
Onshore power for OGVs visiting Port of Honolulu
31

Onshore power
Substitute fuel oil consumption from auxiliary engines for electricity onshore
Assumption: - Capacity factor of utilities in Hawaii: 60%
- Renewables in the generation mix by 2020: 25%
- Onshore power share: 80%
- Fuel consumption in Port of Honolulu is proportional to the cargo throughput between it and Port of Long Beach
Effectiveness - 0.1 MGY
- $1,300 per gallon
32

Effectiveness
Onshore power is a less feasible option - Exchanging oil use at port for oil use in power
generation
- Baseline electricity price is relatively high
- Overall reduction potential is small
DBEDT (2014) Hawaii Energy Facts and Figures 33

Fuel savings by fully implementing the
four tactics
Slowsteaming
Propellerpolishing
Hullcleaning
Fuelsurcharge
Energyconsump on
The four tactics could reduce energy
consumption from shipping by 5.1%, or 10.4
MGY, by 2020 and 14.0 MGY by 2030
34

Summary on fuel savings and cost
effectiveness
Tactics Fuel savings Cost effectiveness
Slow steaming 0.8 MGY $0.61 per gallon
Fuel surcharge 0.9 MGY - $0.10 per gallon
Hull cleaning 3.1 MGY - $0.47 per gallon
Propeller polishing 2.9 MGY - $0.67 per gallon
Shore power 0.1 MGY $1300 per gallon
35

For more information…
Hawaii State Energy Office Facebook page:
https://www.facebook.com/HawaiiStateEnergyOffice
Hawaii Clean Energy Initiative Website: http://www.hawaiicleanenergyinitiative.org/
Two question HCEI survey: http://tinyurl.com/HCEI-trans
ICCT website: http://www.theicct.org/
Contact Information: - Haifeng Wang: [email protected]
- Dan Rutherford: [email protected]
Slide 36