haywood’s junior mining universe
TRANSCRIPT

Haywood’s Junior Mining UniverseChris Thompson, P.Geo. (604-697-7433, [email protected])
Ben Asuncion (604-697-6149, [email protected])
-15%
-10%
-5%
0%
5%
10%
Au Ag Pt Pd Cu Ni Zn U
-15%
-10%
-5%
0%HDI HJEI HJPI HJBI HJDI HJUI
Leaked information from the Democratic Republic of Congo earlier this month, concerning a review of mining contracts, created turmoil for DRC-exposed companies. A number of these companies are included in Haywood’s Developer and Junior Exploration Indices, including Anvil Mining Limited, Banro Corporation, Moto Goldmines Limited, and Tiger Resources Limited. Since the initial leak, the government has tried to rebuild the bridges with the mining companies, and the recommendations are expected later this month.
Haywood developer & Junior exploration indices*
commodities
Stefan Ioannou, 416-507-2309
Andrew Kaip, 416-507-2417
Kerrry Smith, 416-507-2306
Chris Thompson, 604-697-7433
Eric Zaunscherb, 604-697-6089
Ben Asuncion, 604-697-6149
Josh Clelland, 416-507-2437
Nick Coutoulakis, 416-507-2435
Jungle Telegraph geTs Wrong number in The Congo Junior mining universe team
Haywood Junior commodity indices* performance
Vol. 2, No. 4; November 14, 2007
hayWood’s developer index (hdi): oCT 29 To nov 12, 2007Performance
Highlights The HDI lost 40 points, or 9%, to close at 438 for the period ending November 12, 2007, on the back of softening metals prices. Only four companies recorded percentage gains during the period; namely, Moto Goldmines, Inca Pacific Resources, Katanga Mining, and Detour Gold.
Gold (US$ /oz)Silver (US$ /oz)Platinum (US$ /oz)Palladium (US$ /oz)Copper (US$ /lb)Nickel (US$ /lb)Zinc (US$ /lb)Uranium (US$ /lb)
$832.00 6%$15.47 9%$1,433.00 -2%$373.00 0%$3.49 -11%$16.72 6%$1.37 -5%$92.00 8%
October 29 - November 12, 2007
P Metals (HJPI) B Metals (HJBI) Diamond (HJDI) Uranium (HJUI)*Note: Base: 100 (1/1/05)
Gain/Loss Close -47 676 -60 484 -12 197 -3 1366
Frontera Copper Corp (FCC–T)First Quantum Minerals (FM–T) Alamos Gold Inc. (AGI–T )Aquiline Resources Inc. (AQI–T )TEAL Exploration (TL–T) Detour Gold Corp (DGC–T)
Please see rating structure, important disclosure, risk profile parameters, disclaimers, and notes on pages 105 - 109
CommodiTies & CommodiTy-FoCused indiCes: oCT 29 To nov 12, 2007Poor base metals performance this period was amplified in base metals-focused equities, where a 4% drop in average base metals prices translated into an 11% drop in Haywood’s Junior Base Metals Index (HJBI). Conversely, the overall positive performance of precious metals was not reflected in Haywood’s Junior Precious Metals Index (HJPI). Similarly, recent appreciation in uranium prices did not translate into performance gains for junior uranium explorers, as reflected by Haywood’s Junior Uranium Index (HJUI). Wrapping up this period, Haywood’s Junior Diamond Index (HJDI) closed down 12 points, to finish at 197.
October 29 - November 12, 2007 HDI HJEI*Note: Base: 100 (1/1/05)
Gain/Loss Close -40 438 -23 833
Company updaTe: exeTer resourCe
South American precious metals explorer Exeter Resource has switched gears from Don Sixto to Caspiche and Cerro Moro. With Don Sixto shelved for the time being, Exeter’s attention is now squarely focused on advancing its flagship Cerro Moro gold project in Argentina and testing the gold porphyry potential of its Caspiche project in Chile. With increased activity at Cerro Moro triggered by a back-in agreement that was not exercised, results for over 60 holes pending, and an aggressive drill program planned for Caspiche, Exeter is primed to deliver in Q4/07 through to H1/08.
recently publisHed 2- Week index perFormanCe 2- Week meTal priCe perFormanCe
hayWood’s Junior exploraTion index (hJei): oCT 29 To nov 12, 2007Performance
Highlights The HJEI lost 23 points to close at an indexed value of 833. Out of the seven companies to record notable gains were two uranium explorers, Xemplar Energy and Forum Uranium, and Canadian diamond explorer Diamondex Resources, with returns of 26%, 19%, and 10% respectively.

Haywood’s Junior Mining Universe
Chris Thompson, P.Geo. (604-697-7433, [email protected]) Vol. 2, No. 4, November 14, 2007 — 1 Ben Asuncion (604-697-6149, [email protected])
TABLE OF CONTENTS
HAYWOOD’S DEVELOPER INDEX (HDI) .........................................................................................................................3 PERFORMANCE: OCTOBER 29 TO NOVEMBER 12, 2007 ............................................................................................................3 COMPANIES OFFICIALLY COVERED BY HAYWOOD...................................................................................................................3 HDI COMPANIES – PERFORMANCE: OCTOBER 29 TO NOVEMBER 12, 2007 ..............................................................................4 HIGHLIGHTS .............................................................................................................................................................................4
Moto Goldmines Ltd. ...........................................................................................................................................................4 Inca Pacific Resources Inc...................................................................................................................................................5 Australian Solomons Gold Ltd.............................................................................................................................................6
HDI COMPANIES: Q4/07 INVESTMENT HIGHLIGHTS AND CATALYSTS .....................................................................................7 HAYWOOD’S JUNIOR EXPLORATION INDEX (HJEI) ................................................................................................13
PERFORMANCE: OCTOBER 29 TO NOVEMBER 12, 2007 ..........................................................................................................13 HJEI COMPANIES – PERFORMANCE: OCTOBER 29 TO NOVEMBER 12, 2007 ...........................................................................14 HIGHLIGHTS ...........................................................................................................................................................................14
Xemplar Energy Corp........................................................................................................................................................14 Forum Uranium Corp........................................................................................................................................................15 Diamondex Resources Ltd. ................................................................................................................................................15 Premium Exploration Inc...................................................................................................................................................16 Crosshair Exploration & Mining Corp..............................................................................................................................16 Extract Resources Corp. ....................................................................................................................................................16
INVESTMENT HIGHLIGHTS. .....................................................................................................................................................18 HJEI COMPANIES: Q4/07 SCHEDULE OF NEWS FLOW ............................................................................................................19
COUNTRY UPDATE: DEMOCRATIC REPUBLIC OF CONGO ...................................................................................22 HAYWOOD UNIVERSE COMPANIES AFFECTED........................................................................................................................23 OUTLOOK ...............................................................................................................................................................................27
COMPANY UPDATE: EXETER RESOURCE CORP. (XRC–V) .....................................................................................29 COMPANY BACKGROUND .......................................................................................................................................................29 CAPITAL STRUCTURE .............................................................................................................................................................30 MARICUNGA-CASPICHE PROJECT, CHILE ...............................................................................................................................30 CERRO MORO PROJECT, ARGENTINA .....................................................................................................................................32 DON SIXTO, ARGENTINA ........................................................................................................................................................34 NEWS FLOW ...........................................................................................................................................................................34 KEY CATALYSTS ....................................................................................................................................................................35
COMMODITIES .....................................................................................................................................................................37 PRECIOUS AND BASE METALS PERFORMANCE: OCTOBER 29 TO NOVEMBER 12, 2007...........................................................37 BASE METALS: LME INVENTORY AND PRICE PERFORMANCE................................................................................................39 DIAMOND PERFORMANCE ......................................................................................................................................................41 URANIUM PERFORMANCE.......................................................................................................................................................41
APPENDIX: COMPANY TEAR SHEETS ...........................................................................................................................43 DISTRIBUTION ..........................................................................................................................................................................104 ANALYST CERTIFICATION ........................................................................................................................................................104 IMPORTANT DISCLOSURES........................................................................................................................................................104 RATING STRUCTURE.................................................................................................................................................................106 RISK PROFILE PARAMETERS .....................................................................................................................................................107 DISCLAIMERS ...........................................................................................................................................................................108
Haywood’s Junior Mining Universe
Chris Thompson, P.Geo. (604-697-7433, [email protected]) Vol. 2, No. 4, November 14, 2007 — 2 Ben Asuncion (604-697-6149, [email protected])
LIST OF INDICES
Index Title HDI Haywood's Developer Index HJBI Haywood's Junior Base Index HJDI Haywood's Junior Diamond Index HJEI Haywood's Junior Exploration Index HJPI Haywood's Junior Precious Index HJUI Haywood's Junior Uranium Index HUDI Haywood's Uranium Developer Index HUEI Haywood's Uranium Explorer Index HUPI Haywood's Uranium Producer Index
Haywood’s Junior Mining Universe
Chris Thompson, P.Geo. (604-697-7433, [email protected]) Vol. 2, No. 4, November 14, 2007 — 3 Ben Asuncion (604-697-6149, [email protected])
HAYWOOD’S DEVELOPER INDEX (HDI)
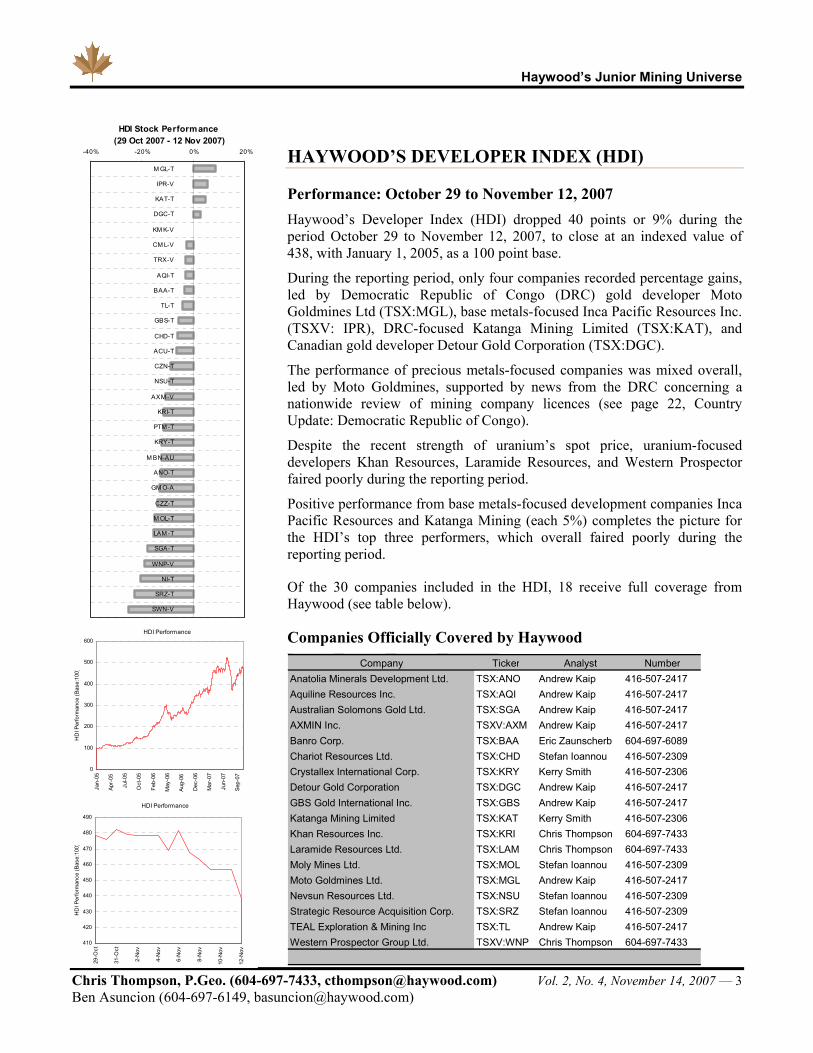
Performance: October 29 to November 12, 2007 Haywood’s Developer Index (HDI) dropped 40 points or 9% during the period October 29 to November 12, 2007, to close at an indexed value of 438, with January 1, 2005, as a 100 point base.
During the reporting period, only four companies recorded percentage gains, led by Democratic Republic of Congo (DRC) gold developer Moto Goldmines Ltd (TSX:MGL), base metals-focused Inca Pacific Resources Inc. (TSXV: IPR), DRC-focused Katanga Mining Limited (TSX:KAT), and Canadian gold developer Detour Gold Corporation (TSX:DGC).
The performance of precious metals-focused companies was mixed overall, led by Moto Goldmines, supported by news from the DRC concerning a nationwide review of mining company licences (see page 22, Country Update: Democratic Republic of Congo).
Despite the recent strength of uranium’s spot price, uranium-focused developers Khan Resources, Laramide Resources, and Western Prospector faired poorly during the reporting period.
Positive performance from base metals-focused development companies Inca Pacific Resources and Katanga Mining (each 5%) completes the picture for the HDI’s top three performers, which overall faired poorly during the reporting period.
Of the 30 companies included in the HDI, 18 receive full coverage from Haywood (see table below).
Companies Officially Covered by Haywood Company Ticker Analyst Number
Anatolia Minerals Development Ltd. TSX:ANO Andrew Kaip 416-507-2417Aquiline Resources Inc. TSX:AQI Andrew Kaip 416-507-2417Australian Solomons Gold Ltd. TSX:SGA Andrew Kaip 416-507-2417AXMIN Inc. TSXV:AXM Andrew Kaip 416-507-2417Banro Corp. TSX:BAA Eric Zaunscherb 604-697-6089Chariot Resources Ltd. TSX:CHD Stefan Ioannou 416-507-2309Crystallex International Corp. TSX:KRY Kerry Smith 416-507-2306Detour Gold Corporation TSX:DGC Andrew Kaip 416-507-2417GBS Gold International Inc. TSX:GBS Andrew Kaip 416-507-2417Katanga Mining Limited TSX:KAT Kerry Smith 416-507-2306Khan Resources Inc. TSX:KRI Chris Thompson 604-697-7433Laramide Resources Ltd. TSX:LAM Chris Thompson 604-697-7433Moly Mines Ltd. TSX:MOL Stefan Ioannou 416-507-2309Moto Goldmines Ltd. TSX:MGL Andrew Kaip 416-507-2417Nevsun Resources Ltd. TSX:NSU Stefan Ioannou 416-507-2309Strategic Resource Acquisition Corp. TSX:SRZ Stefan Ioannou 416-507-2309TEAL Exploration & Mining Inc TSX:TL Andrew Kaip 416-507-2417Western Prospector Group Ltd. TSXV:WNP Chris Thompson 604-697-7433
HDI Stock Performance (29 Oct 2007 - 12 Nov 2007)
-40% -20% 0% 20%
M GL-T
IPR-V
KAT-T
DGC-T
KM K-V
CM L-V
TRX-V
AQI-T
BAA-T
TL-T
GBS-T
CHD-T
ACU-T
CZN-T
NSU-T
AXM -V
KRI-T
PTM -T
KRY-T
M BN-AU
ANO-T
GM O-A
CZZ-T
M OL-T
LAM -T
SGA-T
WNP-V
NI-T
SRZ-T
SWN-V
HDI Performance
0
100
200
300
400
500
600
Jan-
05
Apr-
05
Jul-0
5
Oct
-05
Feb-
06
May
-06
Aug-
06
Dec
-06
Mar
-07
Jun-
07
Sep-
07
HD
I Per
form
ance
(Bas
e:10
0)
HDI Performance
410
420
430
440
450
460
470
480
490
29-O
ct
31-O
ct
2-N
ov
4-N
ov
6-N
ov
8-N
ov
10-N
ov
12-N
ov
HD
I Per
form
ance
(Bas
e:10
0 )
Haywood’s Junior Mining Universe
Chris Thompson, P.Geo. (604-697-7433, [email protected]) Vol. 2, No. 4, November 14, 2007 — 4 Ben Asuncion (604-697-6149, [email protected])
HDI Companies – Performance: October 29 to November 12, 2007 Company Ticker Commodity Focus Area Focus 10/29/2007 11/12/2007 %
• Moto Goldmines Ltd. MGL-T Precious Metals Democratic Republic of the Congo 3.04$ 3.30$ 9%Inca Pacif ic Resources Inc. IPR-V Base Metals Peru 1.85$ 1.95$ 5%
• Katanga Mining Limited KAT-T Base Metals Democratic Republic of the Congo 15.77$ 16.52$ 5%• Detour Gold Corporation DGC-T Precious Metals Canada 9.05$ 9.29$ 3%
Continental Minerals Corp. KMK-V Precious, Base Metals China 1.41$ 1.41$ 0%Crow f light Minerals Inc. CML-V Base Metals Canada 0.80$ 0.78$ -3%Terrane Metals Corp. TRX-V Precious, Base Metals Canada 0.51$ 0.50$ -3%
• Aquiline Resources Inc. AQI-T Precious Metals Argentina 10.77$ 10.43$ -3%• Banro Corp. BAA-T Precious Metals Democratic Republic of the Congo 12.45$ 12.01$ -4%• TEAL Exploration & Mining Inc TL-T Base Metals DRC, Namibia, Zambia 5.15$ 4.95$ -4%• GBS Gold International Inc. GBS-T Precious Metals Australia 1.51$ 1.42$ -6%• Chariot Resources Ltd. CHD-T Base Metals Peru 1.15$ 1.08$ -6%
African Copper plc ACU-T Base Metals Botsw ana 1.82$ 1.68$ -8%Canadian Zinc Corp. CZN-T Base Metals Canada 0.89$ 0.81$ -9%
• Nevsun Resources Ltd. NSU-T Precious, Base Metals Af rica 2.08$ 1.89$ -9%• AXMIN Inc. AXM-V Precious Metals Af rica 0.94$ 0.84$ -11%• Khan Resources Inc. KRI-T Uranium Mongolia 2.74$ 2.43$ -11%
Platinum Group Metals Ltd. PTM-T Precious Metals Af rica, Canada 4.40$ 3.88$ -12%• Crystallex International Corp. KRY-T Precious Metals Venezuela 3.14$ 2.75$ -12%
Mirabela Nickel Ltd. MBN-AU Base Metals Brazil 6.26$ 5.48$ -12%• Anatolia Minerals Development Ltd. ANO-T Precious Metals Turkey 6.25$ 5.46$ -13%
General Moly, Inc. GMO-A Precious, Base Metals Nevada 9.80$ 8.50$ -13%Canadian Royalties Inc. CZZ-T Precious. Base Metals Canada 3.79$ 3.27$ -14%
• Moly Mines Ltd. MOL-T Precious, Base Metals Australia 4.11$ 3.49$ -15%• Laramide Resources Ltd. LAM-T Uranium Australia, USA 9.25$ 7.84$ -15%• Australian Solomons Gold Ltd. SGA-T Precious Metals Solomon Islands 0.90$ 0.74$ -18%• Western Prospector Group Ltd. WNP-V Uranium Mongolia 2.04$ 1.65$ -19%
Victory Nickel, Inc. NI-T Base Metals Canada 0.64$ 0.51$ -20%• Strategic Resource Acquisition Corp. SRZ-T Base Metals USA 5.05$ 3.90$ -23%
Selw yn Resources Ltd. SWN-V Base Metals Canada 0.52$ 0.39$ -25%
• Company is under formal coverage
Highlights
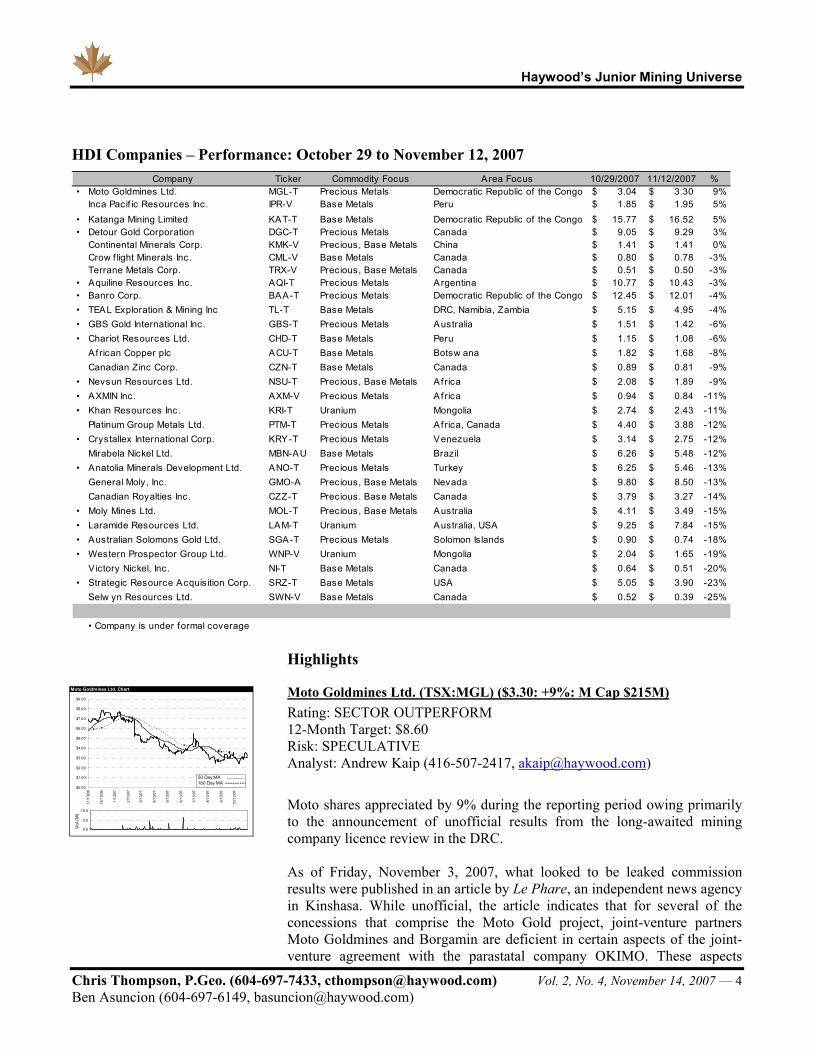
Moto Goldmines Ltd. (TSX:MGL) ($3.30: +9%: M Cap $215M) Rating: SECTOR OUTPERFORM 12-Month Target: $8.60 Risk: SPECULATIVE Analyst: Andrew Kaip (416-507-2417, [email protected])
Moto shares appreciated by 9% during the reporting period owing primarily to the announcement of unofficial results from the long-awaited mining company licence review in the DRC. As of Friday, November 3, 2007, what looked to be leaked commission results were published in an article by Le Phare, an independent news agency in Kinshasa. While unofficial, the article indicates that for several of the concessions that comprise the Moto Gold project, joint-venture partners Moto Goldmines and Borgamin are deficient in certain aspects of the joint-venture agreement with the parastatal company OKIMO. These aspects
Moto Goldmines Ltd. Chart
$0.00
$1.00
$2.00
$3.00
$4.00
$5.00
$6.00
$7.00
$8.00
$9.00
11/1
3/06
12/1
3/06
1/13
/07
2/13
/07
3/13
/07
4/13
/07
5/13
/07
6/13
/07
7/13
/07
8/13
/07
9/13
/07
10/1
3/07
0.0
5.0
10.0
1
Vol
(M)
50 Day MA100 Day MA
Haywood’s Junior Mining Universe
Chris Thompson, P.Geo. (604-697-7433, [email protected]) Vol. 2, No. 4, November 14, 2007 — 5 Ben Asuncion (604-697-6149, [email protected])
include the non-payment of surface rights since the project was placed under force majeure in 2003, errors in geographical coordinates of the prospects, failure to submit a feasibility study, and arbitrary fixing of joint-venture partner interest prior to completion of feasibility. Nonetheless, we view resolution of these deficiencies as achievable, considering that most will likely be addressed through the revised licensing agreement outlined in November 2006 and currently on hold pending the completion of the review. Consistent with our previous comments (July 17, 2007), we remain confident that the review will establish relative compliance with the existing mining licences covering the Moto project. We expect most of the commission’s concerns will be addressed through the completion of a revised licensing agreement and release of the Moto project feasibility as early as the end of Q4/07.
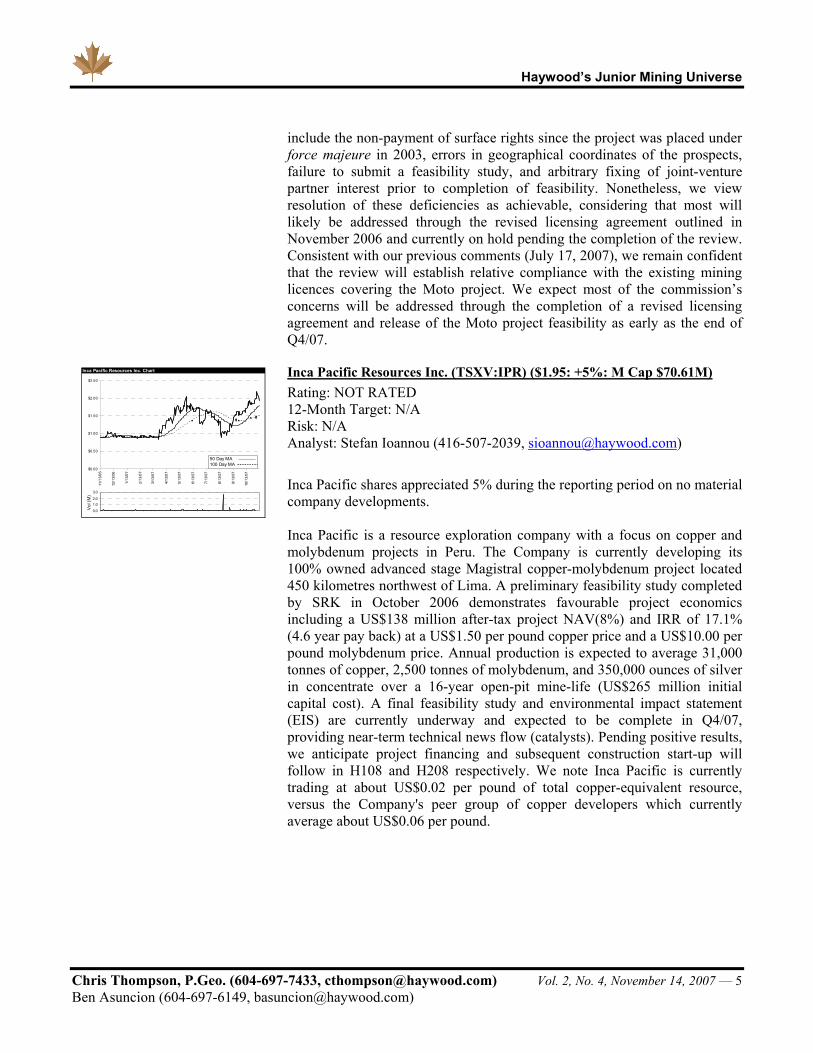
Inca Pacific Resources Inc. (TSXV:IPR) ($1.95: +5%: M Cap $70.61M) Rating: NOT RATED 12-Month Target: N/A Risk: N/A Analyst: Stefan Ioannou (416-507-2039, [email protected])
Inca Pacific shares appreciated 5% during the reporting period on no material company developments. Inca Pacific is a resource exploration company with a focus on copper and molybdenum projects in Peru. The Company is currently developing its 100% owned advanced stage Magistral copper-molybdenum project located 450 kilometres northwest of Lima. A preliminary feasibility study completed by SRK in October 2006 demonstrates favourable project economics including a US$138 million after-tax project NAV(8%) and IRR of 17.1% (4.6 year pay back) at a US$1.50 per pound copper price and a US$10.00 per pound molybdenum price. Annual production is expected to average 31,000 tonnes of copper, 2,500 tonnes of molybdenum, and 350,000 ounces of silver in concentrate over a 16-year open-pit mine-life (US$265 million initial capital cost). A final feasibility study and environmental impact statement (EIS) are currently underway and expected to be complete in Q4/07, providing near-term technical news flow (catalysts). Pending positive results, we anticipate project financing and subsequent construction start-up will follow in H108 and H208 respectively. We note Inca Pacific is currently trading at about US$0.02 per pound of total copper-equivalent resource, versus the Company's peer group of copper developers which currently average about US$0.06 per pound.
Inca Pacific Resources Inc. Chart
$0.00
$0.50
$1.00
$1.50
$2.00
$2.50
11/1
3/06
12/1
3/06
1/13
/07
2/13
/07
3/13
/07
4/13
/07
5/13
/07
6/13
/07
7/13
/07
8/13
/07
9/13
/07
10/1
3/07
0.0
1.02.0
3.0
1
Vol
(M)
50 Day MA100 Day MA
Haywood’s Junior Mining Universe
Chris Thompson, P.Geo. (604-697-7433, [email protected]) Vol. 2, No. 4, November 14, 2007 — 6 Ben Asuncion (604-697-6149, [email protected])
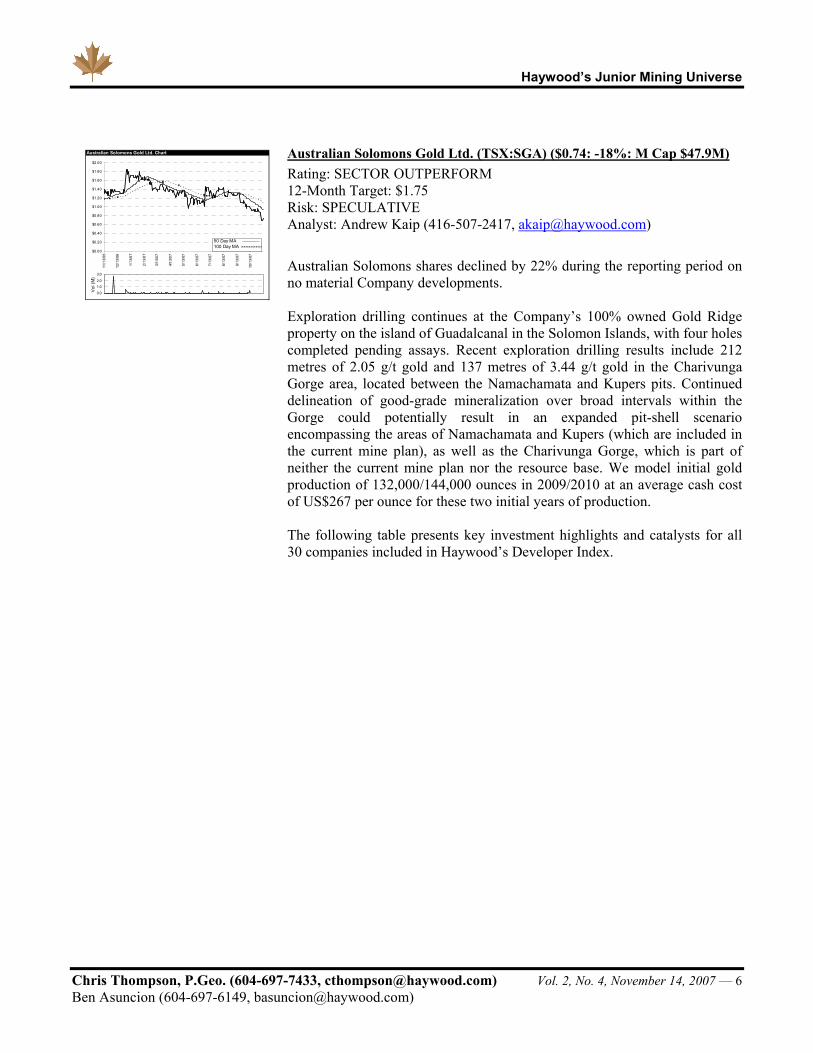
Australian Solomons Gold Ltd. (TSX:SGA) ($0.74: -18%: M Cap $47.9M) Rating: SECTOR OUTPERFORM 12-Month Target: $1.75 Risk: SPECULATIVE Analyst: Andrew Kaip (416-507-2417, [email protected])
Australian Solomons shares declined by 22% during the reporting period on no material Company developments. Exploration drilling continues at the Company’s 100% owned Gold Ridge property on the island of Guadalcanal in the Solomon Islands, with four holes completed pending assays. Recent exploration drilling results include 212 metres of 2.05 g/t gold and 137 metres of 3.44 g/t gold in the Charivunga Gorge area, located between the Namachamata and Kupers pits. Continued delineation of good-grade mineralization over broad intervals within the Gorge could potentially result in an expanded pit-shell scenario encompassing the areas of Namachamata and Kupers (which are included in the current mine plan), as well as the Charivunga Gorge, which is part of neither the current mine plan nor the resource base. We model initial gold production of 132,000/144,000 ounces in 2009/2010 at an average cash cost of US$267 per ounce for these two initial years of production. The following table presents key investment highlights and catalysts for all 30 companies included in Haywood’s Developer Index.
Australian Solomons Gold Ltd. Chart
$0.00
$0.20
$0.40
$0.60
$0.80
$1.00
$1.20
$1.40
$1.60
$1.80
$2.00
11/1
3/06
12/1
3/06
1/13
/07
2/13
/07
3/13
/07
4/13
/07
5/13
/07
6/13
/07
7/13
/07
8/13
/07
9/13
/07
10/1
3/07
0.0
1.02.0
3.0
1
Vol
(M)
50 Day MA100 Day MA
Haywood’s Junior Mining Universe
Chris Thompson, P.Geo. (604-697-7433, [email protected]) Vol. 2, No. 4, November 14, 2007 — 7 Ben Asuncion (604-697-6149, [email protected])
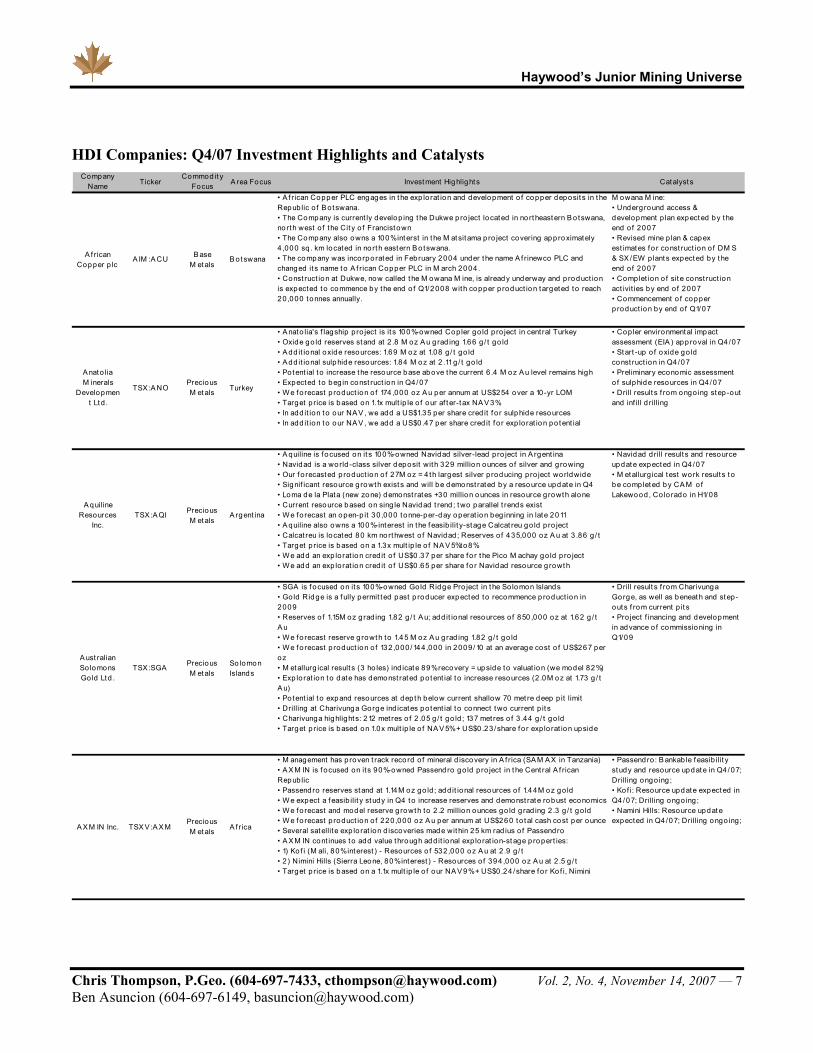
HDI Companies: Q4/07 Investment Highlights and Catalysts Company
Name TickerCommod it y
Focus A rea Focus Investment Highlight s Catalyst s
A f rican Copper p lc
A IM :A CU B ase M etals
B otswana
• A f rican Copper PLC engages in t he exp lorat ion and development o f copper deposit s in t he Republic o f B otswana. • The Company is current ly develop ing t he Dukwe p ro ject located in no rtheastern B o tswana, no rth west o f the Cit y o f Francistown• The Company also owns a 100% interst in t he M atsitama p ro ject covering approximately 4 ,000 sq . km located in no rth eastern B o tswana. • The company was incorporated in February 2004 under the name A f rinewco PLC and changed it s name to A f rican Copper PLC in M arch 2004 .• Const ruct ion at Dukwe, now called t he M owana M ine, is already underway and p roduct ion is expected to commence by the end o f Q1/2008 with copper p roduct ion targeted to reach 20,000 tonnes annually.
M owana M ine:• Underground access & development p lan expected by the end o f 2007• Revised mine p lan & capex est imates fo r const ruct ion o f DM S & SX /EW p lants expected by t he end o f 2007• Complet ion o f sit e const ruct ion act ivit ies by end o f 2007• Commencement o f copper p roduct ion by end o f Q1/07
A nato lia M inerals
Development Ltd .
TSX :A NOPrecious M etals Turkey
• A nato lia's f lagship pro ject is it s 100%-owned Copler go ld p ro ject in cent ral Turkey• Oxide go ld reserves stand at 2 .8 M oz A u g rad ing 1.66 g / t go ld• A dd it ional oxide resources: 1.69 M oz at 1.08 g / t go ld• A dd it ional sulphide resources: 1.84 M oz at 2 .11 g / t go ld• Po tent ial t o increase the resource base above the current 6 .4 M oz A u level remains high• Expected to beg in const ruct ion in Q4/07• W e fo recast p roduct ion o f 174 ,000 oz A u per annum at US$254 over a 10-yr LOM• Target p rice is based on 1.1x mult ip le o f our af t er-t ax NA V 3%• In add it ion t o our NA V , we add a US$1.35 per share cred it f o r sulphide resources• In add it ion t o our NA V , we add a US$0.47 per share cred it f o r exp lorat ion potent ial
• Cop ler environmental impact assessment (EIA ) approval in Q4 /07• Start -up o f oxide go ld const ruct ion in Q4 /07• Preliminary economic assessment o f sulphide resources in Q4/07• Drill result s f rom ongo ing step -out and inf ill d rilling
A quiline Resources
Inc.TSX :A QI Precious
M etalsA rgent ina
• A quiline is focused on it s 100%-owned Navidad silver-lead pro ject in A rgent ina• Navidad is a world -class silver deposit with 329 million ounces o f silver and g rowing• Our f o recasted p roduct ion o f 27M oz = 4 th largest silver producing pro ject worldwide• Signif icant resource g rowth exist s and will be demonst rated by a resource update in Q4• Loma de la Plata (new zone) demonst rates +30 million ounces in resource growth alone• Current resource based on sing le Navidad t rend ; two parallel t rends exist• W e fo recast an open-p it 30 ,000 tonne-per-day operat ion beg inning in late 2011• A quiline also owns a 100%-interest in the f easib ilit y-stage Calcat reu go ld pro ject• Calcat reu is located 80 km northwest o f Navidad ; Reserves o f 435,000 oz A u at 3 .86 g / t• Target p rice is based on a 1.3x mult ip le o f NA V 5%to8%• W e add an exp lorat ion cred it o f US$0.37 per share fo r t he Pico M achay go ld p ro ject• W e add an exp lorat ion cred it o f US$0.65 per share fo r Navidad resource g rowth
• Navidad d rill results and resource update expected in Q4/07• M etallurg ical test work results t o be comp leted by CA M o f Lakewood , Co lorado in H1/08
A ust ralian So lomons Gold Ltd .
TSX :SGA Precious M etals
So lomon Islands
• SGA is f ocused on it s 100%-owned Gold Ridge Pro ject in t he So lomon Islands• Gold Ridge is a f ully permit ted past p roducer expected to recommence p roduct ion in 2009• Reserves o f 1.15M oz g rad ing 1.82 g / t A u; add it ional resources o f 850 ,000 oz at 1.62 g / t A u• W e fo recast reserve g rowth to 1.45 M oz A u grad ing 1.82 g / t go ld• W e fo recast p roduct ion o f 132,000 /144,000 in 2009/10 at an average cost o f US$267 per oz• M etallurg ical result s (3 ho les) ind icate 89% recovery = upside to valuat ion (we model 82%)• Exp lorat ion t o date has demonst rated potent ial t o increase resources (2 .0M oz at 1.73 g / t A u)• Po tent ial t o expand resources at depth below current shallow 70 met re deep p it limit• Drilling at Charivunga Gorge ind icates potent ial t o connect two current p it s• Charivunga highlight s: 212 met res o f 2 .05 g / t go ld ; 137 met res o f 3 .44 g / t go ld• Target p rice is based on 1.0x mult ip le o f NA V 5% + US$0.23 /share f or exp lo rat ion upside
• Drill result s f rom Charivunga Gorge, as well as beneath and step-outs f rom current p it s• Pro ject f inancing and development in advance o f commissioning in Q1/09
A X M IN Inc. TSX V :A X MPrecious M etals A f rica
• M anagement has p roven t rack record o f mineral d iscovery in A f rica (SA M A X in Tanzania)• A X M IN is f ocused on it s 90%-owned Passendro go ld pro ject in t he Cent ral A f rican Republic• Passendro reserves stand at 1.14M oz go ld ; add it ional resources o f 1.44M oz go ld• W e expect a f easib ilit y study in Q4 to increase reserves and demonst rate robust economics• W e fo recast and model reserve g rowth to 2 .2 million ounces go ld g rad ing 2 .3 g / t go ld• W e fo recast p roduct ion o f 220,000 oz A u per annum at US$260 to tal cash cost per ounce• Several satellite exp lo rat ion d iscoveries made wit hin 25 km rad ius o f Passendro• A X M IN cont inues t o add value through add it ional exp lo rat ion-stage p ropert ies:• 1) Ko f i (M ali, 80% interest ) - Resources o f 532,000 oz A u at 2 .9 g / t• 2 ) Nimini Hills (Sierra Leone, 80% interest ) - Resources o f 394 ,000 oz A u at 2 .5 g / t• Target p rice is based on a 1.1x mult ip le o f our NA V 9% + US$0.24 /share fo r Ko f i, Nimini
• Passendro: B ankab le f easib ilit y study and resource update in Q4/07; Drilling ongo ing ;• Ko f i: Resource update expected in Q4 /07; Drilling ongo ing ;• Namini Hills: Resource update expected in Q4 /07; Drilling ongo ing;
Haywood’s Junior Mining Universe
Chris Thompson, P.Geo. (604-697-7433, [email protected]) Vol. 2, No. 4, November 14, 2007 — 8 Ben Asuncion (604-697-6149, [email protected])
Company Name Ticker
Commodit y Focus A rea Focus Investment Highlights Catalysts
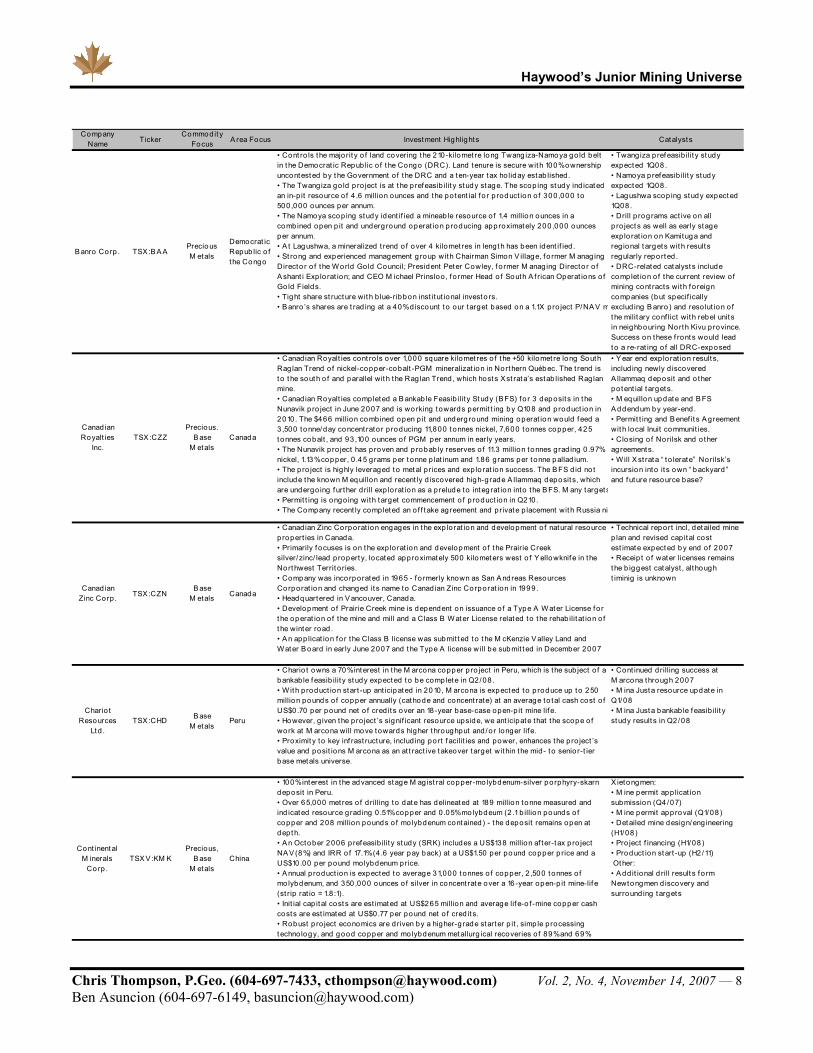
Banro Corp . TSX :B A APrecious M etals
Democrat ic Repub lic o f the Congo
• Cont ro ls the majorit y o f land covering the 210-kilomet re long Twang iza-Namoya go ld belt in t he Democrat ic Repub lic o f t he Congo (DRC). Land tenure is secure wit h 100% ownership uncontested by t he Government o f the DRC and a t en-year tax ho liday estab lished.• The Twangiza go ld p ro ject is at t he prefeasib ilit y study stage. The scop ing study ind icated an in-p it resource o f 4 .6 million ounces and the po tent ial fo r p roduct ion o f 300,000 to 500,000 ounces per annum.• The Namoya scop ing study ident if ied a mineab le resource o f 1.4 million ounces in a combined open p it and underg round operat ion p roducing approximately 200,000 ounces per annum.• A t Lagushwa, a mineralized t rend o f over 4 kilomet res in length has been ident if ied .• St rong and experienced management g roup with Chairman Simon V illage, fo rmer M anag ing Directo r o f the W orld Gold Council; President Peter Cowley, f o rmer M anaging Directo r o f A shant i Exp lo rat ion; and CEO M ichael Prinsloo, f o rmer Head o f South A f rican Operat ions o f Go ld Fields.• Tight share st ructure wit h b lue-ribbon inst itut ional investo rs.• B anro ’s shares are t rad ing at a 40% d iscount to our target based on a 1.1X pro ject P/NA V m
• Twangiza p refeasib ilit y study expected 1Q08.• Namoya prefeasib ilit y study expected 1Q08.• Lagushwa scop ing study expected 1Q08.• Drill p rog rams act ive on all p ro ject s as well as early stage exp lo rat ion on Kamituga and reg ional t argets wit h result s regularly reported.• DRC-related catalyst s include comp let ion o f the current review o f mining cont racts wit h f o reign companies (but specif ically exclud ing B anro ) and reso lut ion o f t he milit ary conf lict wit h rebel unit s in neighbouring North Kivu province. Success on these f ront s would lead t o a re-rat ing o f all DRC-exposed
Canadian Royalt ies
Inc.TSX :CZZ
Precious. B ase
M etalsCanada
• Canadian Royalt ies cont ro ls over 1,000 square kilomet res o f t he +50 kilomet re long South Rag lan Trend o f nickel-copper-cobalt -PGM mineralizat ion in Northern Québec. The t rend is t o t he south o f and parallel wit h the Rag lan Trend , which host s Xst rata’s estab lished Raglan mine. • Canad ian Royalt ies comp leted a B ankab le Feasib ilit y Study (BFS) fo r 3 deposits in t he Nunavik p ro ject in June 2007 and is working towards permit t ing by Q108 and product ion in 2010. The $466 million combined open p it and underg round mining operat ion would f eed a 3 ,500 tonne/day concent rator producing 11,800 tonnes nickel, 7,600 tonnes copper, 425 tonnes cobalt , and 93 ,100 ounces o f PGM per annum in early years.• The Nunavik pro ject has proven and p robab ly reserves o f 11.3 million tonnes grad ing 0 .97% nickel, 1.13% copper, 0 .45 grams per t onne p lat inum and 1.86 grams per t onne pallad ium.• The p ro ject is highly leveraged to metal p rices and exp lo rat ion success. The B FS d id not include the known M equillon and recent ly d iscovered high-grade A llammaq deposit s, which are undergo ing further drill exp lorat ion as a prelude to integ rat ion into the B FS. M any target s• Permit t ing is ongo ing with target commencement o f p roduct ion in Q210.• The Company recent ly completed an o f f take agreement and private p lacement wit h Russia ni
• Y ear end exp lorat ion result s, includ ing newly d iscovered A llammaq deposit and o ther potent ial target s.• M equillon update and B FS A ddendum by year-end .• Permit t ing and B enef it s A greement wit h local Inuit communit ies.• Closing o f Norilsk and o ther ag reements.• W ill X st rata “ to lerate” Norilsk’s incursion into it s own “ backyard ” and future resource base?
Canadian Zinc Corp. TSX :CZN
B ase M etals Canada
• Canadian Zinc Corporat ion engages in t he exp lorat ion and development o f natural resource p ropert ies in Canada. • Primarily f ocuses is on t he exp lorat ion and development o f the Prairie Creek silver/zinc/ lead propert y, located approximately 500 kilometers west o f Y ellowknif e in the Northwest Territ o ries. • Company was inco rporated in 1965 - f o rmerly known as San A ndreas Resources Corporat ion and changed it s name to Canadian Zinc Corporat ion in 1999. • Headquartered in V ancouver, Canada. • Development o f Prairie Creek mine is dependent on issuance o f a Type A W ater License for t he operat ion o f the mine and mill and a Class B W ater License related t o t he rehab ilit at ion o f t he winter road . • A n app licat ion f or the Class B license was submit t ed t o t he M cKenzie V alley Land and W ater B oard in early June 2007 and the Type A license will be submit t ed in December 2007
• Technical report incl, detailed mine p lan and revised cap ital cost est imate expected by end o f 2007• Receip t o f water licenses remains t he b iggest catalyst , although t iminig is unknown
Chario t Resources
Ltd .TSX :CHD B ase
M etalsPeru
• Chario t owns a 70% interest in t he M arcona copper p ro ject in Peru, which is the sub ject o f a bankab le f easib ilit y study expected t o be complete in Q2/08 . • W ith p roduct ion start -up ant icipated in 2010, M arcona is expected t o p roduce up t o 250 million pounds o f copper annually (cathode and concent rate) at an average to tal cash cost o f US$0.70 per pound net o f cred it s over an 18-year base-case open-p it mine life. • However, g iven t he pro ject ’s signif icant resource upside, we ant icipate that the scope o f work at M arcona will move towards higher t hroughput and/or longer lif e. • Proximit y to key inf rast ructure, includ ing po rt f acilit ies and power, enhances the pro ject ’s value and posit ions M arcona as an at t ract ive takeover target within the mid - t o senior-t ier base metals universe.
• Cont inued drilling success at M arcona through 2007• M ina Justa resource update in Q1/08• M ina Justa bankab le f easib ilit y study result s in Q2/08
Cont inental M inerals
Corp .TSX V :KM K
Precious, B ase
M etalsChina
• 100% interest in the advanced stage M agist ral copper-mo lybdenum-silver porphyry-skarn deposit in Peru.• Over 65,000 met res o f d rilling to date has delineated at 189 million tonne measured and ind icated resource grad ing 0 .51% copper and 0 .05% mo lybdeum (2 .1 b illion pounds o f copper and 208 million pounds o f mo lybdenum contained) - the deposit remains open at depth.• A n October 2006 p refeasib ilit y study (SRK) includes a US$138 million af ter-t ax p ro ject NA V (8%) and IRR o f 17.1% (4 .6 year pay back) at a US$1.50 per pound copper p rice and a US$10 .00 per pound molybdenum price.• A nnual product ion is expected t o average 31,000 tonnes o f copper, 2 ,500 tonnes o f mo lybdenum, and 350 ,000 ounces o f silver in concent rate over a 16 -year open-p it mine-lif e (st rip rat io = 1.8 :1).• Init ial cap ital cost s are est imated at US$265 million and average lif e-o f -mine copper cash costs are est imated at US$0.77 per pound net o f cred it s.• Robust p ro ject economics are driven by a higher-g rade starter p it , simp le processing t echno logy, and good copper and mo lybdenum metallurg ical recoveries o f 89% and 69%
X ietongmen:• M ine permit app licat ion submission (Q4 /07)• M ine permit approval (Q1/08)• Detailed mine design/eng ineering (H1/08)• Pro ject f inancing (H1/08)• Product ion start -up (H2 /11) Other:• A dd it ional d rill result s fo rm Newtongmen d iscovery and surround ing t argets
Haywood’s Junior Mining Universe
Chris Thompson, P.Geo. (604-697-7433, [email protected]) Vol. 2, No. 4, November 14, 2007 — 9 Ben Asuncion (604-697-6149, [email protected])
Company Name Ticker
Commodit y Focus A rea Focus Investment Highlight s Catalysts
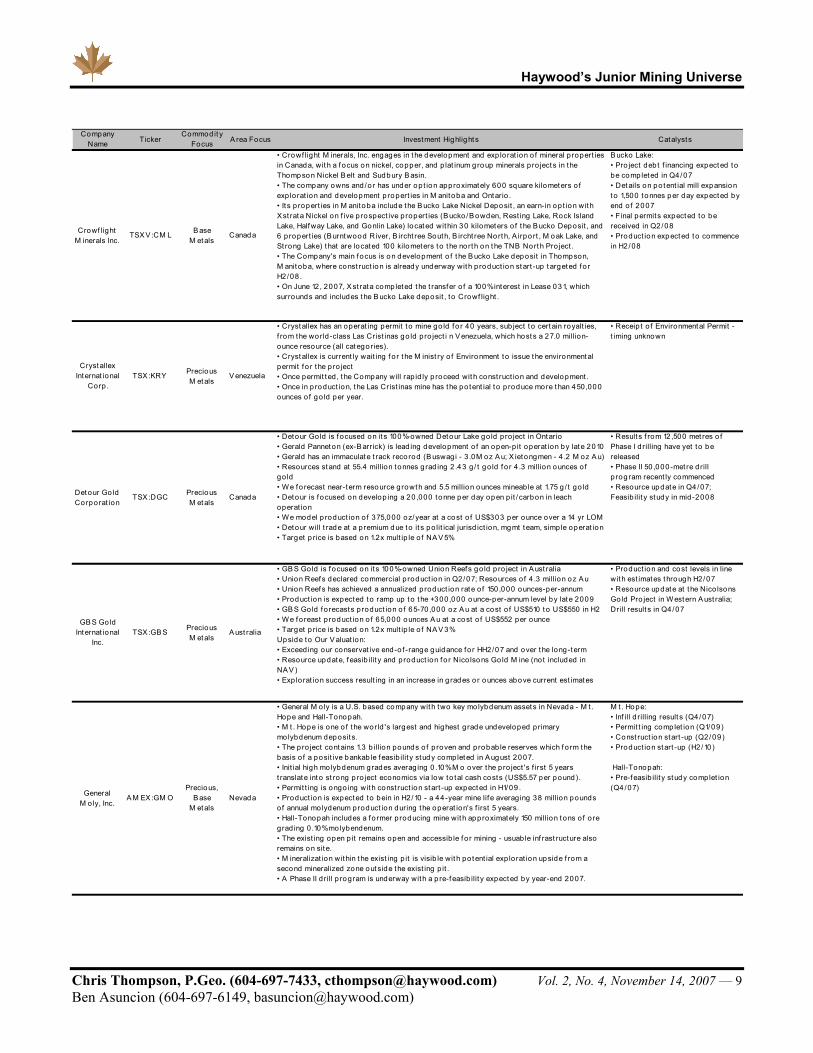
Crowf light M inerals Inc.
TSXV :CM L B ase M etals
Canada
• Crowf light M inerals, Inc. engages in t he development and exp lorat ion o f mineral p ropert ies in Canada, wit h a f ocus on nickel, copper, and p lat inum g roup minerals pro jects in the Thompson Nickel B elt and Sudbury B asin. • The company owns and /o r has under opt ion approximately 600 square kilometers o f exp lorat ion and development p ropert ies in M anitoba and Ontario . • It s p ropert ies in M anitoba include the B ucko Lake Nickel Deposit , an earn-in opt ion wit h Xst rata Nickel on f ive p rospect ive propert ies (Bucko /B owden, Rest ing Lake, Rock Island Lake, Halfway Lake, and Gonlin Lake) located within 30 kilometers o f t he Bucko Deposit , and 6 propert ies (Burntwood River, B ircht ree South, B ircht ree North, A irpo rt , M oak Lake, and St rong Lake) that are located 100 kilometers t o the north on t he TNB North Pro ject . • The Company's main focus is on development o f t he B ucko Lake deposit in Thompson, M anit oba, where const ruct ion is already underway with p roduct ion start -up t argeted fo r H2/08 . • On June 12, 2007, X st rata comp leted t he t ransfer o f a 100% interest in Lease 031, which surrounds and includes the B ucko Lake deposit , to Crowf light .
B ucko Lake:• Pro ject debt f inancing expected to be comp leted in Q4/07• Details on potent ial mill expansion to 1,500 tonnes per day expected by end o f 2007• Final permits expected to be received in Q2/08• Product ion expected t o commence in H2 /08
Crystallex Internat ional
Corp .TSX :KRY Precious
M etalsV enezuela
• Crystallex has an operat ing permit t o mine go ld fo r 40 years, sub ject t o certain royalt ies, f rom the world-class Las Crist inas go ld pro ject i n V enezuela, which host s a 27.0 million-ounce resource (all categories). • Crystallex is current ly wait ing f o r t he M inist ry o f Environment to issue the environmental permit fo r the pro ject • Once permit ted , t he Company will rap id ly p roceed wit h const ruct ion and development . • Once in p roduct ion, t he Las Crist inas mine has the potent ial t o p roduce more t han 450,000 ounces o f go ld per year.
• Receip t o f Environmental Permit - t iming unknown
Detour Go ld Corporat ion
TSX :DGC Precious M etals
Canada
• Detour Gold is f ocused on it s 100%-owned Detour Lake go ld pro ject in Ontario• Gerald Panneton (ex-B arrick) is lead ing development o f an open-p it operat ion by late 2010• Gerald has an immaculate t rack recorod (B uswagi - 3 .0M oz A u; X ietongmen - 4 .2 M oz A u)• Resources stand at 55.4 million tonnes grad ing 2 .43 g / t go ld f o r 4 .3 million ounces o f go ld• W e fo recast near-term resource growth and 5.5 million ounces mineab le at 1.75 g / t go ld• Detour is focused on develop ing a 20 ,000 tonne per day open p it / carbon in leach operat ion• W e model p roduct ion o f 375,000 oz/year at a cost o f US$303 per ounce over a 14 yr LOM• Detour will t rade at a premium due to it s po lit ical jurisd ict ion, mgmt team, simple operat ion• Target p rice is based on 1.2x mult ip le o f NA V 5%
• Results f rom 12,500 met res o f Phase I d rilling have yet to be released• Phase II 50 ,000-met re drill p rog ram recent ly commenced• Resource update in Q4 /07; Feasib ilit y study in mid-2008
GB S Gold Internat ional
Inc.TSX :GB S Precious
M etalsA ust ralia
• GB S Gold is f ocused on it s 100%-owned Union Reefs go ld p ro ject in A ust ralia• Union Reefs declared commercial p roduct ion in Q2/07; Resources o f 4 .3 million oz Au• Union Reefs has achieved a annualized product ion rate o f 150,000 ounces-per-annum• Product ion is expected to ramp up t o t he +300,000 ounce-per-annum level by late 2009• GB S Gold fo recasts product ion o f 65-70 ,000 oz A u at a cost o f US$510 to US$550 in H2• W e fo reast product ion o f 65,000 ounces A u at a cost o f US$552 per ounce• Target p rice is based on 1.2x mult ip le o f NA V 3%Upside to Our V aluat ion:• Exceed ing our conservat ive end-o f -range guidance for HH2/07 and over t he long-term• Resource update, f easib ilit y and product ion f or Nico lsons Go ld M ine (not included in NA V )• Exp lorat ion success result ing in an increase in g rades o r ounces above current est imates
• Product ion and cost levels in line with est imates t hrough H2/07• Resource update at the Nico lsons Gold Pro ject in W estern A ust ralia; Drill result s in Q4 /07
General M oly, Inc.
A M EX :GM OPrecious,
B ase M etals
Nevada
• General M oly is a U.S. based company wit h two key molybdenum assets in Nevada - M t . Hope and Hall-Tonopah.• M t . Hope is one o f the world 's largest and highest grade undeveloped primary mo lybdenum deposits.• The p ro ject contains 1.3 b illion pounds o f p roven and probab le reserves which f orm the basis o f a posit ive bankab le f easib ilit y study completed in August 2007.• Init ial high molybdenum grades averag ing 0 .10% M o over the pro ject 's f irst 5 years t ranslate into st rong p ro ject economics via low to tal cash costs (US$5.57 per pound).• Permit t ing is ongo ing with const ruct ion start -up expected in H1/09 .• Product ion is expected to bein in H2/10 - a 44-year mine life averag ing 38 million pounds o f annual molydenum product ion during the operat ion's f irst 5 years.• Hall-Tonopah includes a fo rmer producing mine wit h approximately 150 million t ons o f o re grad ing 0 .10% mo lybendenum.• The exist ing open p it remains open and accessib le f o r mining - usuab le inf rast ructure also remains on site.• M ineralizat ion wit hin t he exist ing p it is visib le wit h potent ial exp lorat ion upside f rom a second mineralized zone outside the exist ing p it .• A Phase II d rill p rogram is underway with a p re-feasib ilit y expected by year-end 2007.
M t . Hope:• Inf ill d rilling result s (Q4/07)• Permit t ing comp let ion (Q1/09)• Const ruct ion start -up (Q2/09)• Product ion start -up (H2/10)
Hall-Tonopah:• Pre-feasib ilit y study complet ion (Q4 /07)
Haywood’s Junior Mining Universe
Chris Thompson, P.Geo. (604-697-7433, [email protected]) Vol. 2, No. 4, November 14, 2007 — 10 Ben Asuncion (604-697-6149, [email protected])
Company Name Ticker
Commodit y Focus A rea Focus Investment Highlight s Catalysts
Inca Pacif ic Resources
Inc.TSXV :IPR B ase
M etalsPeru
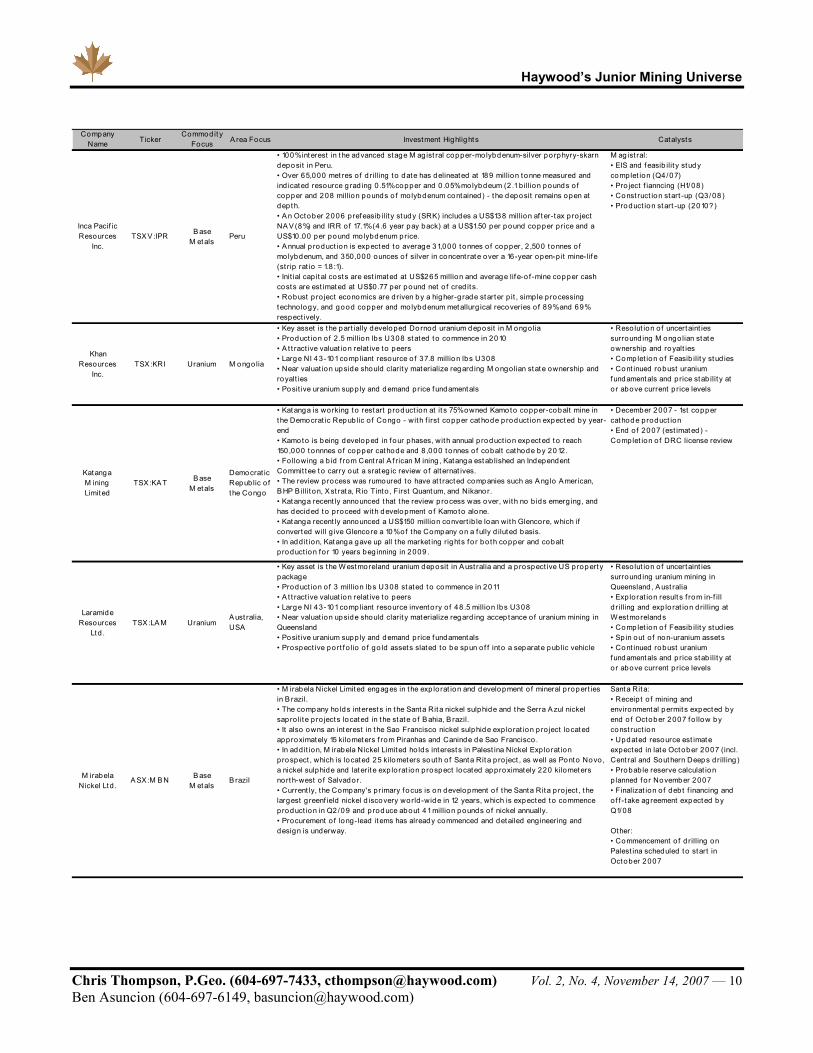
• 100% interest in t he advanced stage M agist ral copper-molybdenum-silver po rphyry-skarn deposit in Peru.• Over 65,000 met res o f drilling to date has delineated at 189 million tonne measured and ind icated resource g rad ing 0 .51% copper and 0 .05% molybdeum (2 .1 b illion pounds o f copper and 208 million pounds o f molybdenum contained) - the deposit remains open at depth.• A n October 2006 prefeasib ilit y study (SRK) includes a US$138 million af t er-tax pro ject NA V (8%) and IRR of 17.1% (4 .6 year pay back) at a US$1.50 per pound copper price and a US$10 .00 per pound molybdenum price.• A nnual p roduct ion is expected to average 31,000 tonnes o f copper, 2 ,500 tonnes o f mo lybdenum, and 350,000 ounces o f silver in concent rate over a 16-year open-p it mine-lif e (st rip rat io = 1.8 :1).• Init ial cap it al costs are est imated at US$265 million and average lif e-o f -mine copper cash costs are est imated at US$0.77 per pound net o f cred its.• Robust pro ject economics are driven by a higher-g rade starter p it , simple p rocessing techno logy, and good copper and molybdenum metallurg ical recoveries o f 89% and 69% respect ively.
M agist ral:• EIS and feasib ilit y study complet ion (Q4/07) • Pro ject f ianncing (H1/08)• Const ruct ion start -up (Q3/08)• Product ion start -up (2010?)
Khan Resources
Inc.TSX :KRI Uranium M ongo lia
• Key asset is the part ially developed Dornod uranium deposit in M ongo lia• Product ion o f 2 .5 million lbs U308 stated t o commence in 2010• A t t ract ive valuat ion relat ive to peers• Large NI 43-101 compliant resource o f 37.8 million lbs U308 • Near valuat ion upside should clarit y materialize regard ing M ongolian state ownership and royalt ies• Posit ive uranium supp ly and demand price f undamentals
• Reso lut ion o f uncertaint ies surround ing M ongolian state ownership and royalt ies • Comp let ion o f Feasib ilit y stud ies• Cont inued robust uranium fundamentals and price stab ilit y at o r above current price levels
Katanga M ining Limited
TSX:KA T B ase M etals
Democrat ic Republic o f the Congo
• Katanga is working t o restart p roduct ion at it s 75% owned Kamoto copper-cobalt mine in the Democrat ic Repub lic o f Congo - with f irst copper cathode p roduct ion expected by year-end• Kamoto is being developed in four phases, with annual p roduct ion expected to reach 150,000 tonnnes o f copper cathode and 8 ,000 tonnes o f cobalt cathode by 2012. • Fo llowing a b id f rom Cent ral A f rican M ining , Katanga estab lished an Independent Commit tee t o carry out a srateg ic review of alternat ives. • The review p rocess was rumoured to have at t racted companies such as Ang lo A merican, BHP B illit on, Xst rata, Rio Tinto , First Quantum, and Nikanor. • Katanga recent ly announced that the review p rocess was over, with no b ids emerg ing, and has decided to proceed with development o f Kamoto alone. • Katanga recent ly announced a US$150 million convert ib le loan wit h Glencore, which if converted will g ive Glencore a 10% of the Company on a f ully d iluted basis. • In add it ion, Katanga gave up all the market ing rights fo r both copper and cobalt p roduct ion fo r 10 years beg inning in 2009 .
• December 2007 - 1st copper cathode product ion• End o f 2007 (est imated) - Complet ion o f DRC license review
Laramide Resources
Ltd .TSX :LA M Uranium
A ust ralia, USA
• Key asset is the W estmoreland uranium deposit in A ust ralia and a p rospect ive US p ropert y package• Product ion o f 3 million lbs U308 stated t o commence in 2011• A t t ract ive valuat ion relat ive to peers• Large NI 43-101 compliant resource invento ry o f 48 .5 million lbs U308 • Near valuat ion upside should clarit y materialize regard ing accep tance o f uranium mining in Queensland• Posit ive uranium supp ly and demand price f undamentals• Prospect ive port f o lio o f go ld assets slated to be spun o f f into a separate pub lic vehicle
• Reso lut ion o f uncertaint ies surround ing uranium mining in Queensland , A ust ralia• Exp lorat ion result s f rom in-f ill d rilling and exp lo rat ion drilling at W estmorelands• Complet ion o f Feasib ilit y stud ies• Sp in out o f non-uranium assets• Cont inued robust uranium fundamentals and price stab ilit y at o r above current price levels
M irabela Nickel Ltd .
A SX:M B N B ase M etals
B razil
• M irabela Nickel Limited engages in t he exp lorat ion and development o f mineral p ropert ies in B razil. • The company ho lds interest s in the Santa Rit a nickel sulphide and the Serra A zul nickel sapro lite pro jects located in the state o f B ahia, B razil. • It also owns an interest in the Sao Francisco nickel sulphide exp lorat ion pro ject located approximately 15 kilometers f rom Piranhas and Caninde de Sao Francisco. • In add it ion, M irabela Nickel Limited ho lds interest s in Palest ina Nickel Exp lorat ion prospect , which is located 25 kilometers south o f Santa Rit a p ro ject , as well as Ponto Novo, a nickel sulphide and laterit e exp lorat ion prospect located approximately 220 kilometers north-west o f Salvador. • Current ly, the Company's primary focus is on development o f t he Santa Rita p ro ject , t he largest greenf ield nickel d iscovery world-wide in 12 years, which is expected to commence product ion in Q2 /09 and p roduce about 41 million pounds o f nickel annually. • Procurement o f long-lead it ems has already commenced and detailed eng ineering and design is underway.
Santa Rit a:• Receip t o f mining and environmental permits expected by end o f October 2007 fo llow by const ruct ion• Updated resource est imate expected in late October 2007 (incl. Cent ral and Southern Deeps drilling )• Probab le reserve calculat ion p lanned for November 2007• Finalizat ion o f debt f inancing and o f f -take agreement expected by Q1/08
Other:• Commencement o f drilling on Palest ina scheduled t o start in October 2007
Haywood’s Junior Mining Universe
Chris Thompson, P.Geo. (604-697-7433, [email protected]) Vol. 2, No. 4, November 14, 2007 — 11 Ben Asuncion (604-697-6149, [email protected])
Company Name Ticker
Commodit y Focus A rea Focus Investment Highlight s Catalysts
M oly M ines Ltd .
TSX :M OLPrecious,
B ase M etals
A ust ralia
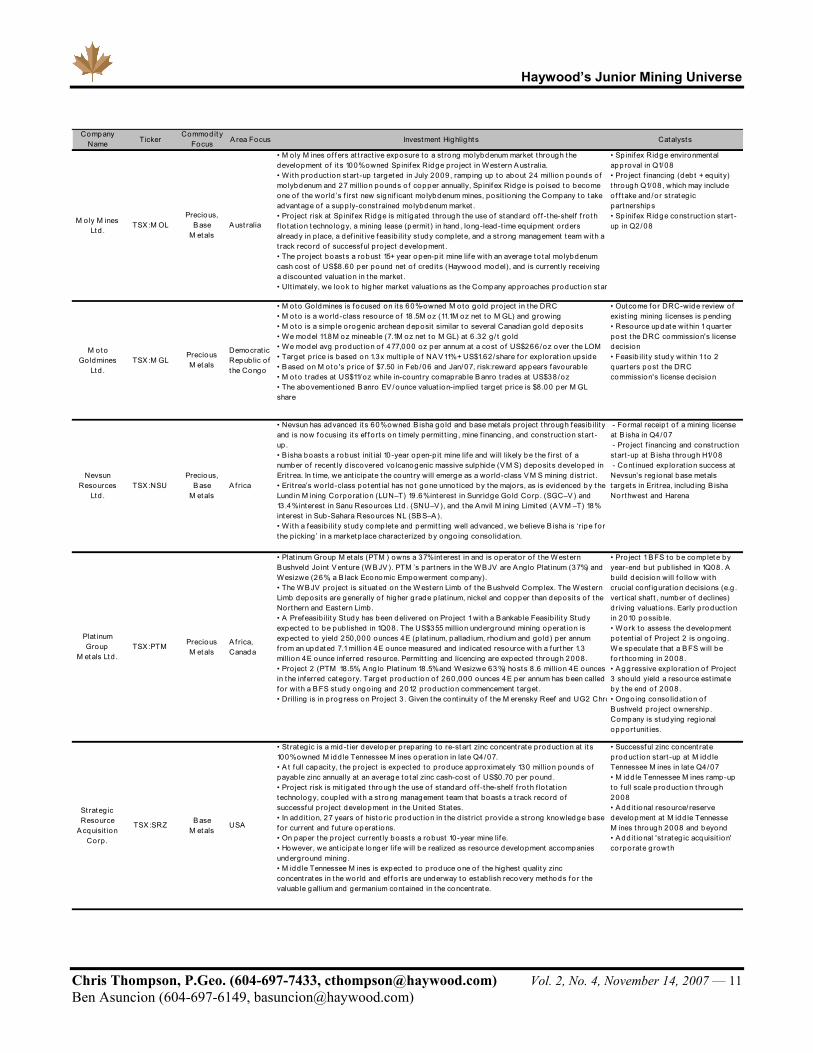
• M oly M ines o f f ers at t ract ive exposure to a st rong molybdenum market through the development o f it s 100% owned Sp inif ex Ridge pro ject in W estern A ust ralia. • W ith product ion start -up targeted in July 2009 , ramping up to about 24 million pounds o f mo lybdenum and 27 million pounds o f copper annually, Sp inif ex Ridge is po ised to become one o f the world ’s f irst new signif icant molybdenum mines, posit ioning the Company to take advantage o f a supp ly-const rained molybdenum market . • Pro ject risk at Sp inif ex Ridge is mit igated t hrough the use o f standard o f f -t he-shelf f ro th f lo tat ion t echno logy, a mining lease (permit ) in hand , long-lead-t ime equipment orders already in p lace, a def init ive f easib ilit y study complete, and a st rong management team with a t rack record o f successful p ro ject development . • The p ro ject boasts a robust 15+ year open-p it mine lif e with an average to tal molybdenum cash cost o f US$8.60 per pound net o f cred it s (Haywood model), and is current ly receiving a d iscounted valuat ion in the market . • Ult imately, we look t o higher market valuat ions as t he Company approaches product ion star
• Sp inifex Ridge environmental approval in Q1/08• Pro ject f inancing (debt + equity) through Q1/08 , which may include o f f t ake and /or st rateg ic partnerships• Sp inifex Ridge const ruct ion start -up in Q2/08
M oto Go ldmines
Ltd .TSX :M GL
Precious M etals
Democrat ic Republic o f the Congo
• M oto Goldmines is focused on it s 60%-owned M oto go ld p ro ject in the DRC• M oto is a world -class resource o f 18.5M oz (11.1M oz net t o M GL) and growing• M oto is a simp le orogenic archean deposit similar t o several Canad ian go ld deposits• W e model 11.8M oz mineab le (7.1M oz net t o M GL) at 6 .32 g / t go ld• W e model avg p roduct ion o f 477,000 oz per annum at a cost o f US$266/oz over t he LOM• Target p rice is based on 1.3x mult ip le o f NA V 11% + US$1.62/share fo r exp lo rat ion upside• B ased on M oto 's price o f $7.50 in Feb/06 and Jan/07, risk:reward appears favourab le• M oto t rades at US$11/oz while in-count ry comaprab le B anro t rades at US$38 /oz• The abovement ioned B anro EV /ounce valuat ion-imp lied target p rice is $8 .00 per M GL share
• Outcome for DRC-wide review o f exist ing mining licenses is pend ing• Resource update wit hin 1 quarter post the DRC commission's license decision• Feasib ilit y study wit hin 1 to 2 quarters post t he DRC commission's license decision
Nevsun Resources
Ltd .TSX :NSU
Precious, B ase
M etalsA f rica
• Nevsun has advanced it s 60% owned B isha go ld and base metals pro ject t hrough feasib ilit y and is now focusing it s ef f o rt s on t imely permit t ing , mine f inancing , and const ruct ion start -up. • B isha boasts a robust init ial 10 -year open-p it mine life and will likely be the f irst o f a number o f recent ly d iscovered vo lcanogenic massive sulphide (V M S) deposit s developed in Erit rea. In t ime, we ant icipate t he count ry will emerge as a world-class V M S mining d ist rict .• Erit rea’s world-class potent ial has no t gone unno t iced by the majors, as is evidenced by t he Lund in M ining Corporat ion (LUN–T) 19 .6% interest in Sunridge Go ld Corp. (SGC–V ) and 13.4% interest in Sanu Resources Ltd . (SNU–V ), and the A nvil M ining Limited (A V M –T) 18% interest in Sub-Sahara Resources NL (SBS–A ). • W ith a feasib ilit y study comp lete and permit t ing well advanced , we believe B isha is ‘ripe f or the p icking ’ in a marketp lace characterized by ongo ing conso lidat ion.
- Formal receip t o f a mining license at B isha in Q4 /07 - Pro ject f inancing and const ruct ion start -up at B isha through H1/08 - Cont inued exp lorat ion success at Nevsun’s reg ional base metals targets in Erit rea, includ ing B isha Northwest and Harena
Plat inum Group
M etals Ltd .TSX :PTM Precious
M etalsA f rica, Canada
• Plat inum Group M etals (PTM ) owns a 37% interest in and is operato r o f the W estern Bushveld Jo int V enture (W BJV ). PTM ’s partners in t he W B JV are A ng lo Plat inum (37%) and Wesizwe (26%, a B lack Economic Empowerment company).• The W B JV pro ject is situated on the W estern Limb o f t he Bushveld Complex. The W estern Limb deposits are generally o f higher grade p lat inum, nickel and copper t han deposit s o f t he Northern and Eastern Limb.• A Prefeasib ilit y Study has been delivered on Pro ject 1 with a B ankab le Feasib ilit y Study expected t o be pub lished in 1Q08. The US$355 million underground mining operat ion is expected t o yield 250,000 ounces 4E (p lat inum, pallad ium, rhod ium and go ld ) per annum f rom an updated 7.1 million 4E ounce measured and ind icated resource with a furt her 1.3 million 4E ounce inferred resource. Permit t ing and licencing are expected through 2008.• Pro ject 2 (PTM 18 .5%, A ng lo Plat inum 18.5% and W esizwe 63%) hosts 8 .6 million 4E ounces in t he inferred category. Target product ion o f 260 ,000 ounces 4E per annum has been called for with a B FS study ongo ing and 2012 product ion commencement target .• Drilling is in progress on Pro ject 3 . Given the cont inuit y o f the M erensky Reef and UG2 Chro
• Pro ject 1 B FS to be complete by year-end but pub lished in 1Q08. A build decision will f o llow wit h crucial conf igurat ion decisions (e.g . vert ical shaf t , number o f declines) driving valuat ions. Early product ion in 2010 possib le.• W ork to assess the development po tent ial o f Pro ject 2 is ongo ing. W e speculate that a B FS will be fo rt hcoming in 2008.• A ggressive exp lorat ion o f Pro ject 3 should yield a resource est imate by t he end o f 2008.• Ongo ing conso lidat ion o f B ushveld pro ject ownership . Company is studying reg ional opportunit ies.
St rateg ic Resource
A cquisit ion Corp.
TSX:SRZ B ase M etals
USA
• St rateg ic is a mid -t ier developer preparing to re-start zinc concent rate product ion at it s 100% owned M idd le Tennessee M ines operat ion in late Q4/07. • A t f ull capacit y, the pro ject is expected to produce approximately 130 million pounds o f payab le zinc annually at an average to tal zinc cash-cost o f US$0.70 per pound. • Pro ject risk is mit igated through the use o f standard o f f -the-shelf f ro th f lo tat ion techno logy, coup led wit h a st rong management team that boasts a t rack record o f successful p ro ject development in t he Unit ed States. • In add it ion, 27 years o f histo ric product ion in the d ist rict p rovide a st rong knowledge base for current and future operat ions. • On paper the pro ject current ly boasts a robust 10-year mine lif e. • However, we ant icipate longer life will be realized as resource development accompanies underg round mining . • M idd le Tennessee M ines is expected t o produce one o f t he highest qualit y zinc concent rates in t he world and ef f ort s are underway to estab lish recovery methods fo r the valuab le gallium and germanium contained in t he concent rate.
• Successful zinc concent rate product ion start -up at M idd le Tennessee M ines in late Q4/07• M idd le Tennessee M ines ramp-up to full scale p roduct ion through 2008• A dd it ional resource/ reserve development at M idd le Tennesse M ines t hrough 2008 and beyond• A dd it ional 'st rateg ic acquisit ion' corporate growth

Haywood’s Junior Mining Universe
Chris Thompson, P.Geo. (604-697-7433, [email protected]) Vol. 2, No. 4, November 14, 2007 — 12 Ben Asuncion (604-697-6149, [email protected])
Company Name Ticker
Commodit y Focus A rea Focus Investment Highlights Catalyst s
Selwyn Resources
Ltd .TSX V :SW N
B ase M etals Canada
• Selwyn Resources Ltd . is a Canad ian based-precious metals exp lo rat ion and development company. • The Company was formed on M ay 31, 2007 through a reo rganizat ion o f Pacif ica Resources t o Selwyn Resources Ltd . and Savant Exp lorat ions Ltd . (TSX V :SV T).• Selwyn owns 7.4 million common shares o f Savant and warrants fo r an add it ional 3 .7M shares.• The company's co re p ro ject is t he world class Selwyn p ro ject , located in eastern Y ukon, and is comprised o f 9 deposits wit h a combined ind icated & inferred resource o f 215.4 million tonnes grad ing 4 .71% zinc and 1.48% lead : X Y , X Y Nose, B rodel, HC, HC W est , Don, Don East , A nniv East , and A nniv Cent ral.• A C$25 million 2007 budget has been alocated fo r a minimum o f 40,000 met res o f d iamond drilling , environmental baseline, and sit e eng ineering stud ies. • Focus is current ly on an 8 .0 kmilomet re length o f the 'A ct ive M ember' which host s a bulk o f t he base metal mineralizat ion between the Don and HC deposit s, where Selwyn is working to expand the mineral potent ial o f exist ing open p it and underg round mineral resources.• Results o f a Preliminary A ssessment on t he pro ject were announced in January 2007 and ind i• Drilling at Don V alley is expected t o cont inue through November 2007.
• A dd it ional assay results f o r 31 ho les already d rilled (Q4 /07)• Result s o f eng ineering and environmental baseline stud ies (Q4/07)• Prefeasib ilit y study comp let ion (early 2009?)• Permit approval (early 2011?)• B ankab le feasib ilit y study comp let ion (early 2011?)• Product ion start -up (late 2012?)
TEA L Exp lo rat ion & M ining Inc
TSX :TLB ase
M etals
DRC, Namib ia, Zambia
• TEA L is focused on the last remaining undeveloped sect ion o f t he pro lif ic Zamb ian copper belt• Feasib ilit y-stage Konko la North (Zamb ia) is t he f lagship asset (represents 50% o f our NA V )• Konko la North resources stand at 3 .37 b illion pounds o f copper at 2 .11% copper • Konko la North A rea 'A ' add it ional histo ric resources stand at 10.8 b illion pounds at 2 .89%• Feasib ilit y study at Konko la North expected in Q4/07• W e fo recast Konko la North product ion o f 36.5/44 .9M lbs copper in 2009 /10• The Kalumines copper pro ject (DRC) represents near-t erm copper p roduct ion and cash f low• W e fo recast Kalumines p roduct ion o f 11.6 /20 .5 M lbs o f copper in 2008/09• Ot jiko to go ld p ro ject (Namib ia) has reached the pre-feasib ilit y stage• Ot jiko to resources stand at 1.76M oz go ld g rad ing 1.2 g / t go ld• Target is based on 1.0x mult ip le o f NA V 5%to18% + exp lo rat ion cred it o f US$0 .53/share
• Konko la North Copper Pro ject (Zambia): Feasib ilit y study in Q4 /07• Kalumines Copper Pro ject (DRC): Exp lorat ion and p roduct ion ramp-up in Q4 /07• Ot jiko to Go ld Pro ject (Namib ia): Pre-feasib ilit y study in Q4/07
Terrane M etals Corp .
TSX V :TRXPrecious,
B ase M etals
Canada
• 100% interest in t he advanced stage M t . M illigan copper-go ld porphyry deposit in B rit ish Co lumbia (1.9 b illion pounds o f copper and 5.5 million ounces o f go ld contained). • A n October 2007 p reliminary economic assessment (W ardrop) includes a C$580 million p re-tax p ro ject NA V (8%) and IRR of 20.6% (3 .9 year pay back) at a US$2.50 per pound copper p rice and a US$550 per ounce go ld p rice.• A nnual product ion is expected t o average 90 million pounds o f copper and 221,530 ounces o f go ld over a 14.5-year open-p it mine-life (st rip rat io = 0 .8 :1).• Init ial cap ital costs are est imated at C$827 million and average lif e-o f -mine operat ing cost s are est imated at C$7.12 per tonne milled .• The p ro ject sit s within t he M cKenzie land use p lan, an area zoned for mine (and related inf rast ructure) development .• Terran'e p ro ject port f o lio extends beyond M t M illigan and includes a 100% interest in the advanced stage B erg copper-moly-silver pro ject in B rit ish Columb ia. In late June 2007, Terrane announced that it had commenced a 12,000 meter drilling p rogram at B erg and W ardrop Eng ineering has been cont racted t o deliver a NI 43-101 compliant resource est imate • Terrane's management t eam consist s o f t op notch geo log ists wit h an int imate knowledge o f • Global M ajor Pro ject s who was o rig inally responsib le f o r d iscovering the sit e.
M ount M illigan:• Full feasib ilit y study complet ion (Q1/08)• Environmental A ssessment Complet ion (mid -2008)• Const ruct ion Start -up (mid -20008)• Product ion Start -up (2011) B erg :• NI 43-101 compliant resource est imate (Q4/07)• Def init ion drilling results (H1/08)• Scop ing study complet ion (Q2/08)• Feasib ilit y study comp let ion (mid -2010)
V ictory Nickel, Inc.
TSX :NI B ase M etals
Canada
• V icto ry Nickel Inc is a Canad ian focused Nickel exp lo rer with a st rateg ic port f o lio o f p ropert ies In t he Thompson M ineral B elt In M anit oba and Quebec.• Recent ly f o rmed f rom the Nickel assets o f Nunisco Resources Ltd (TSX :NW I)• M inago Pro ject : advanced stage pro ject wit h a NI 43 -101 comp liant measured and ind icated resource o f 558 million lbs - resource is near surface with open p it po tent ial• Scop ing stud ies show economic potent ial; bankab le feasib ilit y study and metallurg ical t est ing underway with results expected by year end (2007).• Po tent ial fo r expansion t hrough North Limb deposit (1.5 km north o f p rimary deposit ); historical d rilling intersected 338m of 0 .33% Ni wit h similar p ropert ies; f o llow-up drill p rogram p lanned fo r Q407/Q108• Lac Rocher: near t erm p roduct ion potent ial with d irect -ship mining o f high grade zone; permit t ing & p reliminary economic stud ies underway wit h result s expected late Q407• M el: V icto ry has met ob ligat ions under JV agreement wit h CV RD Inco - await ing decision o f back-in ag reement in Q407
M inago Pro ject• B ankab le feasib ilit y (B FS) & permit t ing underway wit h metallurg ical t est results expected by end o f Q4/07 & B FS in H1/08
Lac Rocher Pro ject• Permit t ing underway; preliminary economic stud ies expected mid Dec 07
M el Resource• A wait ing decision f rom CV RD Inco to back in fo r 51% - expected by end o f Q407
W estern Prospector Group Ltd .
TSX V :W NP Uranium M ongo lia
• Key asset is the part ially developed Gurvanbulag uranium deposit in M ongo lia• Product ion o f 3 million lbs U308 stated to commence in 2011• A t t ract ive valuat ion relat ive to peers• Large NI 43 -101 comp liant and histo rical resource o f 45.4 million lbs U308 • Near valuat ion upside should clarit y materialize regard ing M ongo lian state ownership and royalt ies• Posit ive uranium supp ly and demand price fundamentals
• Reso lut ion o f uncertaint ies surround ing M ongo lian state ownership and royalt ies • A micab le reso lut ion o f legal despute wit h M aximum V entures • Exp lo rat ion results aimed at add ing historical resources t o NI 43-101 compliant resource base• Complet ion o f Feasib ilit y stud ies• Cont inued robust uranium fundamentals and price stab ilit y at o r above current p rice levels
Haywood’s Junior Mining Universe
Chris Thompson, P.Geo. (604-697-7433, [email protected]) Vol. 2, No. 4, November 14, 2007 — 13 Ben Asuncion (604-697-6149, [email protected])
HAYWOOD’S JUNIOR EXPLORATION INDEX (HJEI)
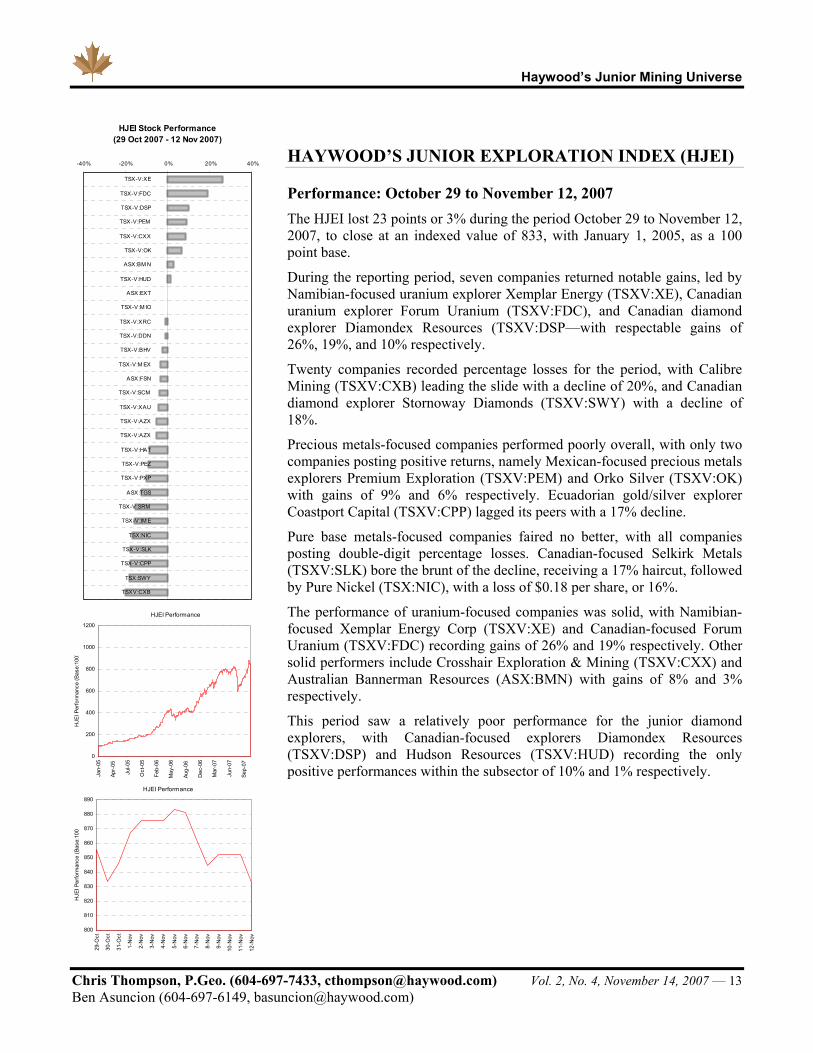
Performance: October 29 to November 12, 2007 The HJEI lost 23 points or 3% during the period October 29 to November 12, 2007, to close at an indexed value of 833, with January 1, 2005, as a 100 point base.
During the reporting period, seven companies returned notable gains, led by Namibian-focused uranium explorer Xemplar Energy (TSXV:XE), Canadian uranium explorer Forum Uranium (TSXV:FDC), and Canadian diamond explorer Diamondex Resources (TSXV:DSP—with respectable gains of 26%, 19%, and 10% respectively.
Twenty companies recorded percentage losses for the period, with Calibre Mining (TSXV:CXB) leading the slide with a decline of 20%, and Canadian diamond explorer Stornoway Diamonds (TSXV:SWY) with a decline of 18%.
Precious metals-focused companies performed poorly overall, with only two companies posting positive returns, namely Mexican-focused precious metals explorers Premium Exploration (TSXV:PEM) and Orko Silver (TSXV:OK) with gains of 9% and 6% respectively. Ecuadorian gold/silver explorer Coastport Capital (TSXV:CPP) lagged its peers with a 17% decline.
Pure base metals-focused companies faired no better, with all companies posting double-digit percentage losses. Canadian-focused Selkirk Metals (TSXV:SLK) bore the brunt of the decline, receiving a 17% haircut, followed by Pure Nickel (TSX:NIC), with a loss of $0.18 per share, or 16%.
The performance of uranium-focused companies was solid, with Namibian-focused Xemplar Energy Corp (TSXV:XE) and Canadian-focused Forum Uranium (TSXV:FDC) recording gains of 26% and 19% respectively. Other solid performers include Crosshair Exploration & Mining (TSXV:CXX) and Australian Bannerman Resources (ASX:BMN) with gains of 8% and 3% respectively.
This period saw a relatively poor performance for the junior diamond explorers, with Canadian-focused explorers Diamondex Resources (TSXV:DSP) and Hudson Resources (TSXV:HUD) recording the only positive performances within the subsector of 10% and 1% respectively.
HJEI Stock Performance (29 Oct 2007 - 12 Nov 2007)
-40% -20% 0% 20% 40%
TSX-V:XE
TSX-V:FDC
TSX-V:DSP
TSX-V:PEM
TSX-V:CXX
TSX-V:OK
ASX:BM N
TSX-V:HUD
ASX:EXT
TSX-V:M IO
TSX-V:XRC
TSX-V:DDN
TSX-V:BHV
TSX-V:M EX
ASX:FSN
TSX-V:SCM
TSX-V:XAU
TSX-V:AZX
TSX-V:AZX
TSX-V:HAT
TSX-V:PEZ
TSX-V:PXP
ASX:TGS
TSX-V:SRM
TSX-V:IM E
TSX:NIC
TSX-V:SLK
TSX-V:CPP
TSX:SWY
TSXV:CXB
HJEI Performance
0
200
400
600
800
1000
1200
Jan-
05
Apr-
05
Jul-0
5
Oct
-05
Feb-
06
May
-06
Aug-
06
Dec
-06
Mar
-07
Jun-
07
Sep-
07
HJE
I Per
form
ance
(Bas
e:10
0)
HJEI Performance
800
810
820
830
840
850
860
870
880
890
29-O
ct
30-O
ct
31-O
ct
1-N
ov
2-N
ov
3-N
ov
4-N
ov
5-N
ov
6-N
ov
7-N
ov
8-N
ov
9-N
ov
10-N
ov
11-N
ov
12-N
ov
HJE
I Per
form
ance
(Bas
e:10
0 )

Haywood’s Junior Mining Universe
Chris Thompson, P.Geo. (604-697-7433, [email protected]) Vol. 2, No. 4, November 14, 2007 — 14 Ben Asuncion (604-697-6149, [email protected])
HJEI Companies – Performance: October 29 to November 12, 2007 Company Ticker Com m odity Focus Area Focus 10/29/2007 11/12/2007 %
Xemplar Energy Corp. TSX-V:XE Uranium Namibia 4.10$ 5.17$ 26%Forum Uranium Corp. TSX-V:FDC Uranium Canada 0.43$ 0.51$ 19%Diamondex Resources Ltd. TSX-V:DSP Diamond NW Territories, A lberta, Saskatchew an, Nunavut 0.31$ 0.34$ 10%Premium Exploration Inc. TSX-V:PEM Precious Metals USA, Mexico 0.54$ 0.59$ 9%Crosshair Exploration & Mining Corp. TSX-V:CXX Uranium, Gold New foundland, Labrador 2.27$ 2.46$ 8%Orko Silver Corp. TSX-V:OK Precious Metals Mexico 1.70$ 1.81$ 6%Bannerman Resources Limited ASX:BMN Uranium Namibia, Botsw ana, Australia 2.85$ 2.93$ 3%Hudson Resources Inc. TSX-V:HUD Diamond Greenland 0.67$ 0.68$ 1%Extract Resources Ltd. ASX:EXT Uranium Namibia 0.85$ 0.85$ 0%Mindoro Resources Ltd. TSX-V:MIO Precious, Base Metals Philippines 0.65$ 0.65$ 0%Exeter Resource Corp. TSX-V:XRC Precious, Base Metals Argentina, Chile 4.25$ 4.22$ -1%Diamonds North Resources Ltd. TSX-V:DDN Diamond NW Territories, Nunavut 0.85$ 0.84$ -1%Bellhaven Copper & Gold Inc. TSX-V:BHV Precious Metals Panama 0.89$ 0.87$ -2%Midlands Minerals Corporation TSX-V:MEX Precious Metals Ghana, Tanzania 0.31$ 0.30$ -3%Fusion Resources Limited ASX:FSN Uranium Australia 0.97$ 0.94$ -3%Sacre-Coeur Minerals Ltd. TSX-V:SCM Diamonds, Precious South America 2.03$ 1.95$ -4%AuEx Ventures Inc. TSX-V:XAU Precious Metals Nevada 2.60$ 2.48$ -5%Alexandria Minerals Corporation TSX-V:AZX Precious Metals Quebec 0.30$ 0.29$ -5%Alexandria Minerals Corporation TSX-V:AZX Precious Metals Quebec 0.30$ 0.29$ -5%Hathor Exploration Ltd. TSX-V:HAT Uranium Saskatchew an, British Columbia 0.83$ 0.76$ -8%Pediment Exploration Ltd. TSX-V:PEZ Precious Metals Mexico 3.16$ 2.87$ -9%Pitchstone Exploration Ltd. TSX-V:PXP Uranium Canada, Gabon 2.84$ 2.55$ -10%Tiger Resources Ltd. ASX:TGS Base Metals DRC 0.38$ 0.33$ -12%Shear Minerals Ltd. TSX-V:SRM Diamond Nunavut, NW Territories 0.59$ 0.50$ -15%Indicator Minerals Inc. TSX-V:IME Diamond Nunavut 0.26$ 0.22$ -15%Pure Nickel Inc. TSX:NIC Base Metals Canada, USA 1.10$ 0.92$ -16%Selkirk Metals Corp. TSX-V:SLK Base Metals British Columbia, Ontario 0.92$ 0.76$ -17%Coastport Capital, Inc. TSX-V:CPP Precious Metals Ecuador 0.32$ 0.26$ -17%Stornow ay Diamond Corp. TSX:SWY Diamond Quebec,Ontario, Nunavut, A lberta, Botsw ana 0.89$ 0.73$ -18%Calibre Mining Corp. TSXV:CXB Precious Metals Australia, New foundland 0.47$ 0.38$ -20%
Highlights
Xemplar Energy Corp. (TSXV:XE) ($5.17: +26%: M Cap $556.0M) Xemplar had another exemplary 2-week period ending November 12, 2007, with a gain of 26%. Xemplar has embarked on a multi-rig drill program on the wholly owned Warmbad property. The market is up dramatically on speculation that surface uranium mineralization in alaskites will extend to depth. Samples taken to date are out for assay.
Xemplar provided an update on exploration of the wholly owned Warmbad uranium project in south-central Namibia last week. The Company is targeting alaskite-hosted uranium mineralization similar to that found at the Rössing mine and nearby Valencia, Goanikontes, and Husab projects in a separate mineralized intrusive cluster to the north.
Xemplar has found more than 14 alaskite bodies outcropping in an area 40 kilometres by 28 kilometres. Three reverse circulation (RC) drill holes have been completed, and one diamond drill hole is progressing, all on the Big Yellow target body. All samples are out for assay in Johannesburg, but geologists have seen indications of uranium mineralization and will likely have scanned the core and chips with a scintillometer at minimum. Two
Xemplar Energy Corp. Chart
Price $5.17 $11.0MMarket Cap $556.0M $06.5MQ407-Q308 Burn Rate
Cash
$0.00
$1.00
$2.00
$3.00
$4.00
$5.00
$6.00
$7.00
11/1
3/06
12/1
3/06
1/13
/07
2/13
/07
3/13
/07
4/13
/07
5/13
/07
6/13
/07
7/13
/07
8/13
/07
9/13
/07
10/1
3/07
0.0
5.0
10.0
1
Vol
(M)
50 Day MA100 Day MA
Haywood’s Junior Mining Universe
Chris Thompson, P.Geo. (604-697-7433, [email protected]) Vol. 2, No. 4, November 14, 2007 — 15 Ben Asuncion (604-697-6149, [email protected])
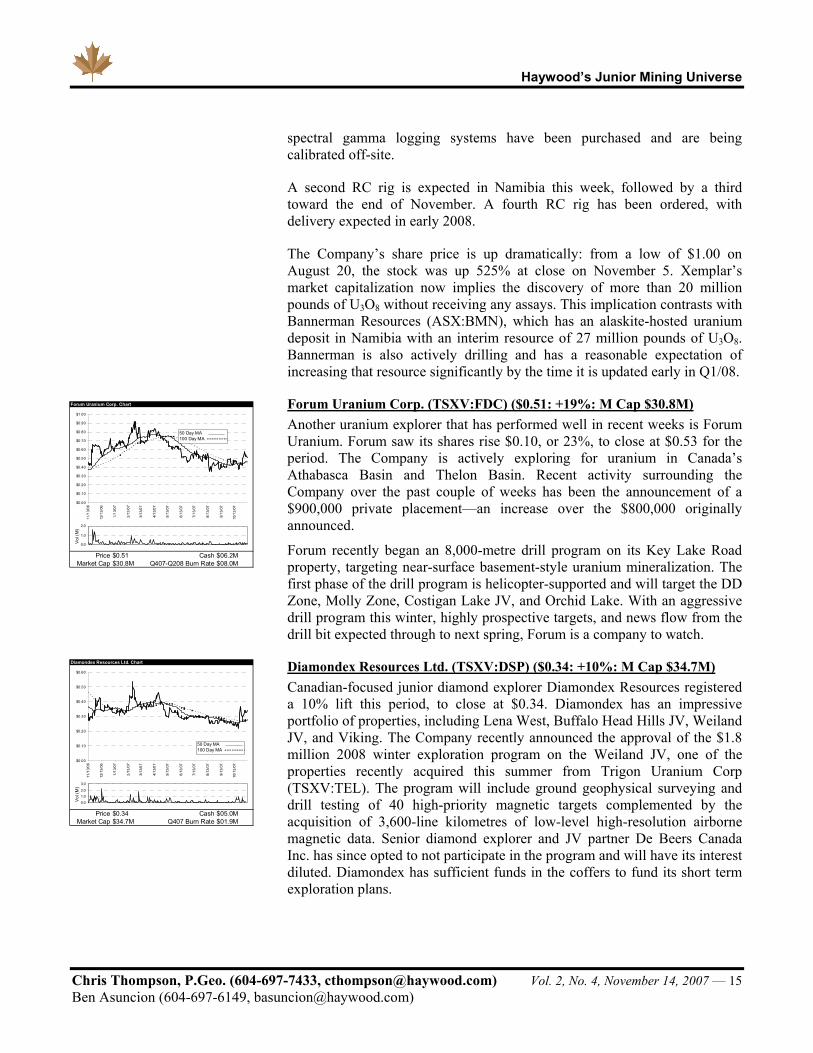
spectral gamma logging systems have been purchased and are being calibrated off-site.
A second RC rig is expected in Namibia this week, followed by a third toward the end of November. A fourth RC rig has been ordered, with delivery expected in early 2008.
The Company’s share price is up dramatically: from a low of $1.00 on August 20, the stock was up 525% at close on November 5. Xemplar’s market capitalization now implies the discovery of more than 20 million pounds of U3O8 without receiving any assays. This implication contrasts with Bannerman Resources (ASX:BMN), which has an alaskite-hosted uranium deposit in Namibia with an interim resource of 27 million pounds of U3O8. Bannerman is also actively drilling and has a reasonable expectation of increasing that resource significantly by the time it is updated early in Q1/08.
Forum Uranium Corp. (TSXV:FDC) ($0.51: +19%: M Cap $30.8M) Another uranium explorer that has performed well in recent weeks is Forum Uranium. Forum saw its shares rise $0.10, or 23%, to close at $0.53 for the period. The Company is actively exploring for uranium in Canada’s Athabasca Basin and Thelon Basin. Recent activity surrounding the Company over the past couple of weeks has been the announcement of a $900,000 private placement—an increase over the $800,000 originally announced.
Forum recently began an 8,000-metre drill program on its Key Lake Road property, targeting near-surface basement-style uranium mineralization. The first phase of the drill program is helicopter-supported and will target the DD Zone, Molly Zone, Costigan Lake JV, and Orchid Lake. With an aggressive drill program this winter, highly prospective targets, and news flow from the drill bit expected through to next spring, Forum is a company to watch.
Diamondex Resources Ltd. (TSXV:DSP) ($0.34: +10%: M Cap $34.7M) Canadian-focused junior diamond explorer Diamondex Resources registered a 10% lift this period, to close at $0.34. Diamondex has an impressive portfolio of properties, including Lena West, Buffalo Head Hills JV, Weiland JV, and Viking. The Company recently announced the approval of the $1.8 million 2008 winter exploration program on the Weiland JV, one of the properties recently acquired this summer from Trigon Uranium Corp (TSXV:TEL). The program will include ground geophysical surveying and drill testing of 40 high-priority magnetic targets complemented by the acquisition of 3,600-line kilometres of low-level high-resolution airborne magnetic data. Senior diamond explorer and JV partner De Beers Canada Inc. has since opted to not participate in the program and will have its interest diluted. Diamondex has sufficient funds in the coffers to fund its short term exploration plans.
Forum Uranium Corp. Chart
Price $0.51 $06.2MMarket Cap $30.8M $08.0MQ407-Q208 Burn Rate
Cash
$0.00
$0.10
$0.20
$0.30
$0.40
$0.50
$0.60
$0.70
$0.80
$0.90
$1.00
11/1
3/06
12/1
3/06
1/13
/07
2/13
/07
3/13
/07
4/13
/07
5/13
/07
6/13
/07
7/13
/07
8/13
/07
9/13
/07
10/1
3/07
0.0
1.0
2.0
1
Vol
(M)
50 Day MA100 Day MA
Diamondex Resources Ltd. Chart
Price $0.34 $05.0MMarket Cap $34.7M $01.9MQ407 Burn Rate
Cash
$0.00
$0.10
$0.20
$0.30
$0.40
$0.50
$0.60
11/1
3/06
12/1
3/06
1/13
/07
2/13
/07
3/13
/07
4/13
/07
5/13
/07
6/13
/07
7/13
/07
8/13
/07
9/13
/07
10/1
3/07
0.0
1.02.0
3.0
1
Vol
(M)
50 Day MA100 Day MA
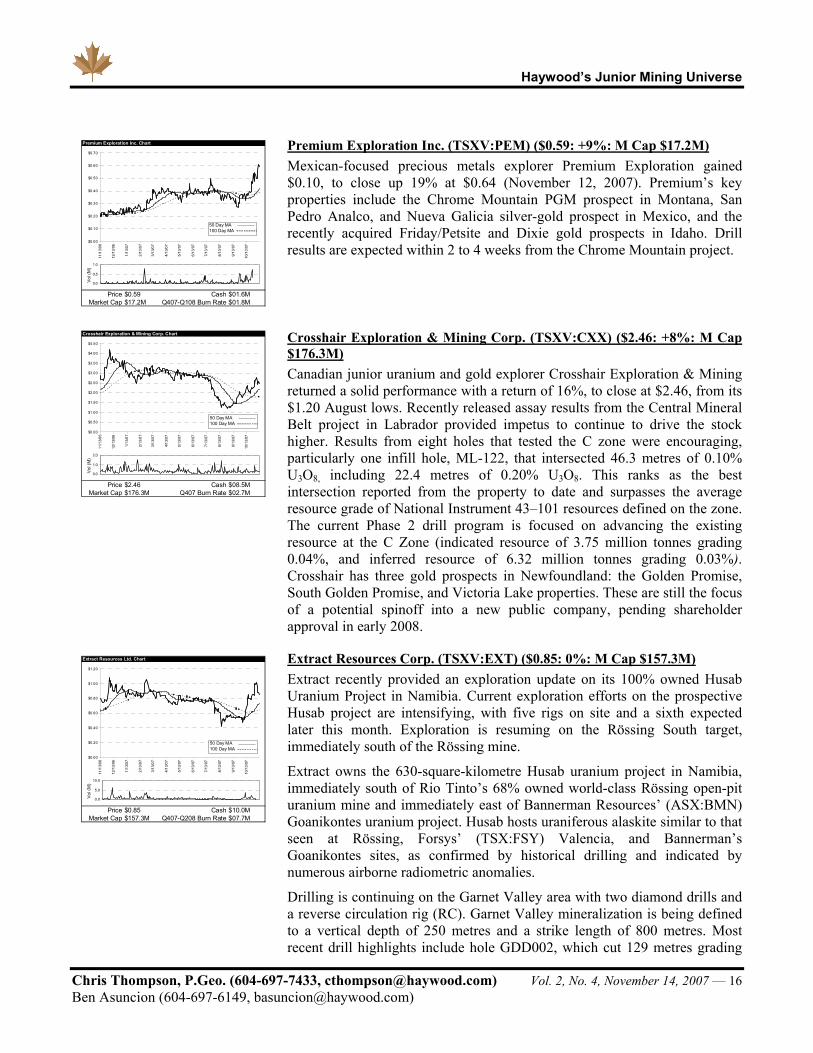
Haywood’s Junior Mining Universe
Chris Thompson, P.Geo. (604-697-7433, [email protected]) Vol. 2, No. 4, November 14, 2007 — 16 Ben Asuncion (604-697-6149, [email protected])
Premium Exploration Inc. (TSXV:PEM) ($0.59: +9%: M Cap $17.2M) Mexican-focused precious metals explorer Premium Exploration gained $0.10, to close up 19% at $0.64 (November 12, 2007). Premium’s key properties include the Chrome Mountain PGM prospect in Montana, San Pedro Analco, and Nueva Galicia silver-gold prospect in Mexico, and the recently acquired Friday/Petsite and Dixie gold prospects in Idaho. Drill results are expected within 2 to 4 weeks from the Chrome Mountain project.
Crosshair Exploration & Mining Corp. (TSXV:CXX) ($2.46: +8%: M Cap $176.3M) Canadian junior uranium and gold explorer Crosshair Exploration & Mining returned a solid performance with a return of 16%, to close at $2.46, from its $1.20 August lows. Recently released assay results from the Central Mineral Belt project in Labrador provided impetus to continue to drive the stock higher. Results from eight holes that tested the C zone were encouraging, particularly one infill hole, ML-122, that intersected 46.3 metres of 0.10% U3O8, including 22.4 metres of 0.20% U3O8. This ranks as the best intersection reported from the property to date and surpasses the average resource grade of National Instrument 43–101 resources defined on the zone. The current Phase 2 drill program is focused on advancing the existing resource at the C Zone (indicated resource of 3.75 million tonnes grading 0.04%, and inferred resource of 6.32 million tonnes grading 0.03%). Crosshair has three gold prospects in Newfoundland: the Golden Promise, South Golden Promise, and Victoria Lake properties. These are still the focus of a potential spinoff into a new public company, pending shareholder approval in early 2008.
Extract Resources Corp. (TSXV:EXT) ($0.85: 0%: M Cap $157.3M) Extract recently provided an exploration update on its 100% owned Husab Uranium Project in Namibia. Current exploration efforts on the prospective Husab project are intensifying, with five rigs on site and a sixth expected later this month. Exploration is resuming on the Rössing South target, immediately south of the Rössing mine.
Extract owns the 630-square-kilometre Husab uranium project in Namibia, immediately south of Rio Tinto’s 68% owned world-class Rössing open-pit uranium mine and immediately east of Bannerman Resources’ (ASX:BMN) Goanikontes uranium project. Husab hosts uraniferous alaskite similar to that seen at Rössing, Forsys’ (TSX:FSY) Valencia, and Bannerman’s Goanikontes sites, as confirmed by historical drilling and indicated by numerous airborne radiometric anomalies.
Drilling is continuing on the Garnet Valley area with two diamond drills and a reverse circulation rig (RC). Garnet Valley mineralization is being defined to a vertical depth of 250 metres and a strike length of 800 metres. Most recent drill highlights include hole GDD002, which cut 129 metres grading
Premium Exploration Inc. Chart
Price $0.59 $01.6MMarket Cap $17.2M $01.8MQ407-Q108 Burn Rate
Cash
$0.00
$0.10
$0.20
$0.30
$0.40
$0.50
$0.60
$0.70
11/1
3/06
12/1
3/06
1/13
/07
2/13
/07
3/13
/07
4/13
/07
5/13
/07
6/13
/07
7/13
/07
8/13
/07
9/13
/07
10/1
3/07
0.0
0.5
1.0
1
Vol
(M)
50 Day MA100 Day MA
Crosshair Exploration & Mining Corp. Chart
Price $2.46 $08.5MMarket Cap $176.3M $02.7MQ407 Burn Rate
Cash
$0.00
$0.50
$1.00
$1.50
$2.00
$2.50
$3.00
$3.50
$4.00
$4.50
11/1
3/06
12/1
3/06
1/13
/07
2/13
/07
3/13
/07
4/13
/07
5/13
/07
6/13
/07
7/13
/07
8/13
/07
9/13
/07
10/1
3/07
0.0
1.0
2.0
1
Vol
(M)
50 Day MA100 Day MA
Extract Resources Ltd. Chart
Price $0.85 $10.0MMarket Cap $157.3M $07.7MQ407-Q208 Burn Rate
Cash
$0.00
$0.20
$0.40
$0.60
$0.80
$1.00
$1.20
11/1
3/06
12/1
3/06
1/13
/07
2/13
/07
3/13
/07
4/13
/07
5/13
/07
6/13
/07
7/13
/07
8/13
/07
9/13
/07
10/1
3/07
0.0
5.0
10.0
1
Vol
(M)
50 Day MA100 Day MA

Haywood’s Junior Mining Universe
Chris Thompson, P.Geo. (604-697-7433, [email protected]) Vol. 2, No. 4, November 14, 2007 — 17 Ben Asuncion (604-697-6149, [email protected])
159 ppm (0.016%) U3O8, including 20 metres grading 448 ppm (0.045%) U3O8. A light diamond drill is operating at Ida Central (3 kilometres to the north), and a second RC rig is testing the New Camp area. An RC rig is heading to the Rössing South target, where anomalous uranium-bearing alaskititic rock, similar to that seen at the Rössing mine, has been identified with a width up to 160 metres.
A Preliminary Scoping Study was completed by well-regarded GRD Minproc South Africa in mid-October. A 6.0 million-tonne-per-annum operation was studied, with an estimated head grade of 260 ppm (0.026%) U3O8, similar to Rössing. Assuming a recovery rate of 85%, such a project costing an estimated US$211 million would yield 2.9 Mlb U3O8 per annum at approximately US$29/lb U3O8. The exploration target on which the study is based amounts to 54 million to 63 million tonnes grading 200 to 300 ppm U3O8, or 24.7 Mlb to 41.2 Mlb U3O8. These amounts are derived from surface work as well as from modern and historical drilling and are limited to a maximum depth of 100 metres. Based on our site visit, we consider that this a reasonable target, and that the property’s potential to exceed the target is good (e.g., mineralization extends to depth below 100 metres in many locales).
Namibia is a preferred location for uranium exploration and extraction owing to its excellent geology, stable government, pro-development track record (e.g. Rössing and Langer Heinrich), and pro-development, forward-looking initiatives (e.g., to provide water and power specifically for the uranium industry).
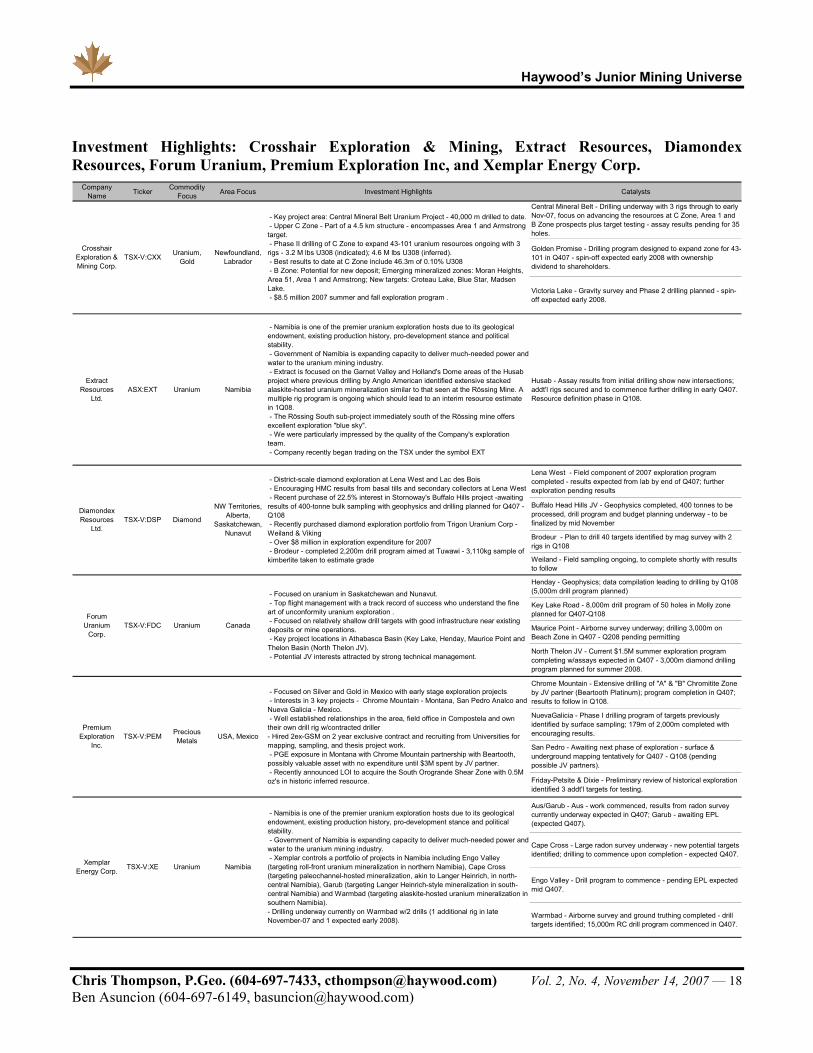
Haywood’s Junior Mining Universe
Chris Thompson, P.Geo. (604-697-7433, [email protected]) Vol. 2, No. 4, November 14, 2007 — 18 Ben Asuncion (604-697-6149, [email protected])
Investment Highlights: Crosshair Exploration & Mining, Extract Resources, Diamondex Resources, Forum Uranium, Premium Exploration Inc, and Xemplar Energy Corp.
Company Name Ticker Commodity
Focus Area Focus Investment Highlights Catalysts
Central Mineral Belt - Drilling underway with 3 rigs through to early Nov-07, focus on advancing the resources at C Zone, Area 1 and B Zone prospects plus target testing - assay results pending for 35 holes.
Golden Promise - Drilling program designed to expand zone for 43-101 in Q407 - spin-off expected early 2008 with ownership dividend to shareholders.
Victoria Lake - Gravity survey and Phase 2 drilling planned - spin-off expected early 2008.
Extract Resources
Ltd.ASX:EXT Uranium Namibia
- Namibia is one of the premier uranium exploration hosts due to its geological endowment, existing production history, pro-development stance and political stability. - Government of Namibia is expanding capacity to deliver much-needed power and water to the uranium mining industry. - Extract is focused on the Garnet Valley and Holland's Dome areas of the Husab project where previous drilling by Anglo American identified extensive stacked alaskite-hosted uranium mineralization similar to that seen at the Rössing Mine. A multiple rig program is ongoing which should lead to an interim resource estimate in 1Q08. - The Rössing South sub-project immediately south of the Rössing mine offers excellent exploration "blue sky". - We were particularly impressed by the quality of the Company's exploration team. - Company recently began trading on the TSX under the symbol EXT
Husab - Assay results from initial drilling show new intersections; addt'l rigs secured and to commence further drilling in early Q407. Resource definition phase in Q108.
Lena West - Field component of 2007 exploration program completed - results expected from lab by end of Q407; further exploration pending results
Buffalo Head Hills JV - Geophysics completed, 400 tonnes to be processed, drill program and budget planning underway - to be finalized by mid November
Brodeur - Plan to drill 40 targets identified by mag survey with 2 rigs in Q108
Weiland - Field sampling ongoing, to complete shortly with results to follow
Henday - Geophysics; data compilation leading to drilling by Q108 (5,000m drill program planned)
Key Lake Road - 8,000m drill program of 50 holes in Molly zone planned for Q407-Q108
Maurice Point - Airborne survey underway; drilling 3,000m on Beach Zone in Q407 - Q208 pending permitting
North Thelon JV - Current $1.5M summer exploration program completing w/assays expected in Q407 - 3,000m diamond drilling program planned for summer 2008.
Chrome Mountain - Extensive drilling of "A" & "B" Chromitite Zone by JV partner (Beartooth Platinum); program completion in Q407; results to follow in Q108.
NuevaGalicia - Phase I drilling program of targets previously identified by surface sampling; 179m of 2,000m completed with encouraging results.
San Pedro - Awaiting next phase of exploration - surface & underground mapping tentatively for Q407 - Q108 (pending possible JV partners).
Friday-Petsite & Dixie - Preliminary review of historical exploration identified 3 addt'l targets for testing.
Aus/Garub - Aus - work commenced, results from radon survey currently underway expected in Q407; Garub - awaiting EPL (expected Q407).
Cape Cross - Large radon survey underway - new potential targets identified; drilling to commence upon completion - expected Q407.
Engo Valley - Drill program to commence - pending EPL expected mid Q407.
Warmbad - Airborne survey and ground truthing completed - drill targets identified; 15,000m RC drill program commenced in Q407.
- Focused on uranium in Saskatchewan and Nunavut. - Top flight management with a track record of success who understand the fine art of unconformity uranium exploration . - Focused on relatively shallow drill targets with good infrastructure near existing deposits or mine operations. - Key project locations in Athabasca Basin (Key Lake, Henday, Maurice Point and Thelon Basin (North Thelon JV). - Potential JV interests attracted by strong technical management.
Diamondex Resources
Ltd.TSX-V:DSP Diamond
NW Territories, Alberta,
Saskatchewan, Nunavut
- District-scale diamond exploration at Lena West and Lac des Bois - Encouraging HMC results from basal tills and secondary collectors at Lena West - Recent purchase of 22.5% interest in Stornoway's Buffalo Hills project -awaiting results of 400-tonne bulk sampling with geophysics and drilling planned for Q407 - Q108 - Recently purchased diamond exploration portfolio from Trigon Uranium Corp - Weiland & Viking - Over $8 million in exploration expenditure for 2007 - Brodeur - completed 2,200m drill program aimed at Tuwawi - 3,110kg sample of kimberlite taken to estimate grade
Uranium, GoldTSX-V:CXX
Crosshair Exploration & Mining Corp.
Forum Uranium
Corp.TSX-V:FDC Uranium
Newfoundland, Labrador
Canada
- Namibia is one of the premier uranium exploration hosts due to its geological endowment, existing production history, pro-development stance and political stability. - Government of Namibia is expanding capacity to deliver much-needed power and water to the uranium mining industry. - Xemplar controls a portfolio of projects in Namibia including Engo Valley (targeting roll-front uranium mineralization in northern Namibia), Cape Cross (targeting paleochannel-hosted mineralization, akin to Langer Heinrich, in north-central Namibia), Garub (targeting Langer Heinrich-style mineralization in south-central Namibia) and Warmbad (targeting alaskite-hosted uranium mineralization in southern Namibia).- Drilling underway currently on Warmbad w/2 drills (1 additional rig in late November-07 and 1 expected early 2008).
- Key project area: Central Mineral Belt Uranium Project - 40,000 m drilled to date. - Upper C Zone - Part of a 4.5 km structure - encompasses Area 1 and Armstrong target. - Phase II drilling of C Zone to expand 43-101 uranium resources ongoing with 3 rigs - 3.2 M lbs U308 (indicated); 4.6 M lbs U308 (inferred). - Best results to date at C Zone include 46.3m of 0.10% U308 - B Zone: Potential for new deposit; Emerging mineralized zones: Moran Heights, Area 51, Area 1 and Armstrong; New targets: Croteau Lake, Blue Star, Madsen Lake. - $8.5 million 2007 summer and fall exploration program .
- Focused on Silver and Gold in Mexico with early stage exploration projects - Interests in 3 key projects - Chrome Mountain - Montana, San Pedro Analco and Nueva Galicia - Mexico. - Well established relationships in the area, field office in Compostela and own their own drill rig w/contracted driller- Hired 2ex-GSM on 2 year exclusive contract and recruiting from Universities for mapping, sampling, and thesis project work. - PGE exposure in Montana with Chrome Mountain partnership with Beartooth, possibly valuable asset with no expenditure until $3M spent by JV partner. - Recently announced LOI to acquire the South Orogrande Shear Zone with 0.5M oz's in historic inferred resource.
Xemplar Energy Corp. TSX-V:XE Uranium Namibia
USA, MexicoPremium
Exploration Inc.
TSX-V:PEM Precious Metals

Haywood’s Junior Mining Universe
Chris Thompson, P.Geo. (604-697-7433, [email protected]) Vol. 2, No. 4, November 14, 2007 — 19 Ben Asuncion (604-697-6149, [email protected])
HJEI Companies: Q4/07 Schedule of News Flow Company Ticker Property Commodities Key Regions
Q407
Cadillac Break Properties Gold Quebec
Ongoing drilling at Orenada w ith 2 drill rigs (~12,800m in 2007) - assay's to follow ; focus on expanding and def ining 43-101 compliant resources; results f rom Titan Survey pending D/RP
Siscoe East / Matachew an Gold Quebec2,500m drilling program planned for Q407 through to 2008 - drill results pending D/RP
Gold Varied - Auex Au Nevada Southern Argentina - Spain. -
Long Canyon Au Nevada
Preliminary assay results beginning to arrive - expect announcements starting in Q407; Phase I drilling to complete in late Sept; Phase II drilling to commence in October D
Nevada Varied - Auex Au NevadaResults f rom Sw iss Bank, Gypsum Valley, and Fireball Ridge to come in Q407 D
West Pequop Au Nevada Ongoing drilling; additional assay results & holes to follow in Q407 DGoanikontes Uranium Namibia 0 SSSw akop River Uranium Namibia Further exploration underw ay - aw aiting results S
Azuero Au Panama
Analysis of past drilling and trenching complete, targets for future drilling and expansion of 43-101 resource pending outcome at other projects D
Cerro Chorcha Cu,Au Panama
Phase I drilling (3,300m) focused on expansion of resource underw ay; estimated completion Q407-Q108. Results f rom f rist tw o holes are promising, aw aiting results f rom holes 5 holes D
Cerro Quema Au, Ag Panama Potential production w ithin 2 years, 60,000oz per year operation -
Cerro Pelado / Rio Liri Au PanamaQ108 drilling program focused on expansion of existing resource estimate - drill ready and targets identif ied -
V iento Frío Au, Ag, Cu PanamaTargets identif ied f rom previous exploration ef forts, drilling to commence in Q108 -
Cargo Cu,Au Australia Phase II of drill program currently underw ay - results pending D/RP
Point Leamington Zn, Au, Cu, Ag New foundlandPlanning additional exploration w hich w ould include diamond drilling, dow n-hole geophysics and metallurgical investigations Q407-Q108. GP/D
Coastport Capital, Inc. TSX-V:CPP Shyri Au, Ag Ecuador Planned 15,000m drilling pending permitting D
Central Mineral Belt Uranium Labrador
Drilling underw ay w ith 3 rigs through to early Nov-07, focus on advancing the resources at C Zone, Area 1 and B Zone prospects plus target testing - assay results pending for 35 holes. D/RP
Golden Promise Au New foundlandDrilling program designed to expand zone for 43-101 in Q407 - spin-of f expected early 2008 w ith ow nership div idend to shareholders. D/CD
Victoria Lake Au New foundlandGravity survey and Phase 2 drilling planned - spin-of f expected early 2008. GP/D/CD
Lena West Diamonds NW TerritoriesField component of 2007 exploration program completed - results expected f rom lab by end of Q407; further exploration pending results RP
Buf falo Head Hills JV Diamonds A lbertaGeophysics completed, 400 tonnes to be processed, drill program and budget planning underw ay - to be f inalized by mid November BS/RP
Brodeur Diamonds Nunavut Plan to drill 40 targets identif ied by mag survey w ith 2 rigs in Q108 RPWeiland Diamonds Ontario Field sampling ongoing, to complete shortly w ith results to follow S/RP
Viking Diamonds OntarioGeophysics planned through Q407 - Q108 w ith drilling to commence in Q108 GP/D
Amaruk Diamonds Nunavut
Diamond results f rom 17 new kimberlites pending; bulk sampling underw ay - results pending (Q407-Q108); Phase II drill results pending BS/RP
Banks Is land Diamonds NW Territories 60 anomalies identif ied for drill testing. Detailed ground magnetics planned. Evaluation of airborne geophysics for potential drill targets. GP
Hepburn Diamonds NW Territories Geophysics and sampling continuing; results pending GP/S
Caspiche Au, Cu ChileUp to 10,000m diamond drilling planned for Q407-Q208 to test porphry gold mineralisation discovery D/RP
Cerro Moro Au, Ag ArgentinaResults f rom f irst 10,000m of drilling encouraging project; drilling 27 targets in Q407 CD/D
Don Sixto (La Cabeza) Ag, Au Argentina
Currently conducting in-house scoping study; all activity on property ceased due to gov't legislation TBD in prov. elections in Oct (Oct 28-07) -
Extract Resources Ltd. ASX:EXT Husab Uranium Nambia
Assay results f rom initial drilling show new intersections; addt'l rigs secured and to commence further drilling in early Q407. Resource def inition phase in Q108. D/RU
Henday Uranium Saskatchew anGeophysics; data compilation leading to drilling by Q108 (5,000m drill program planned) GP
Key Lake Road Uranium Saskatchew an 8,000m drill program of 50 holes in Molly zone planned for Q407-Q108 D
Maurice Point Uranium Saskatchew anAirborne survey underw ay; drilling 3,000m on Beach Zone in Q407 - Q208 pending permitting GP
North Thelon JV Uranium Nunavut
Current $1.5M summer exploration program completing w /assays expected in Q407 - 3,000m diamond drilling program planned for summer 2008. GP
Andersons South Uranium Queensland, Australia A irborne radiometric survey completed; f ield w ork about to commence GP
Mary Kathleen South Uranium Queensland, AustraliaRecent w ork included detailed radiometric airborne surveys w ith follow up f ield w ork to commence shortly GP
Valhalla North Uranium Queensland, Australia First phase drilling of up to 10,000m underw ay D/GPYeelirrie South Project Uranium Queensland, Australia High-res radiometric survey completed GP/RP
Diamonds North Resources Ltd.
Forum Uranium Corp.
Fusion Resources Limited
Exeter Resource Corp.
Bellhaven Copper & Gold Inc.
Calibre Mining Corp.
Crosshair Exploration & Mining Corp.
Diamondex Resources Ltd.
Catalysts
A lexandria Minerals Corporation
AuEx Ventures Inc.Bannerman Resources Limited ASX:BMN
TSX-V:XAU
TSX-V:AZX
ASX:FSN
TSX-V:FDC
TSX-V:DDN
TSX-V:XRC
TSX-V:DSP
TSX-V:CXX
TSXV:CXB
TSX-V:BHV

Haywood’s Junior Mining Universe
Chris Thompson, P.Geo. (604-697-7433, [email protected]) Vol. 2, No. 4, November 14, 2007 — 20 Ben Asuncion (604-697-6149, [email protected])
Company Ticker Property Commodities Key RegionsQ407
Athabasca Basin Uranium Saskatchew an
Lake sediment geochemical completed; aw aiting results; preliminary results indicate some samples that contain highly-anomalous uranium values. S/RP
Russell Lake Uranium Saskatchew an
Summer drill program completed (3,554m) focusing on the extended vicinity of the Grayling Zone - to be focus of Q407-Q108 drill program. Plans for other exploration target areas are being prepared & w ill be released shortly. RP
Eskay Creek Au British Columbia Planned divestiture by end of year. CDHudson Resources Inc. TSX-V:HUD Greenland Licenses Diamonds Greenland
Seismic surveys completed, deliniation drilling results pending. Processing of bulk sampling underw ay - results pending. GP/D/BS
Barrow Diamonds Nunavut12 targets f rom ground geophysics. Phase II drilling to commence in Q407 (7-8 targets for Q407 and 5 for Q108). GP /D
Darby Diamonds Nunavut 4,000m drilling program to complete in October 2007; results pending. D
Grail Diamonds NunavutA irborne and ground geophysics completed; analyzing results of potential targets for further exploration. RP
Goias, Para and Tocantins Ni Brazil
Goias regional properties: Sampling carried out - airborne electromagnetics planned. Damolandia: A irborne VTEM and drilling planned. GP/S/D
Santa Fé - Iporá Ni Brazil
2007 drill program completed & revised resource model underw ay; environmental baseline study initiated; f inal option paymnet due mid-November 07 -
Itilima Au, Diamonds Tanzania Soil sampling and geochemical analysis underw ay. S
Sian/Kw ahu Praso Au GhanaPhase 2 drilling program to complete in Q407, resource update in Q108 follow ed by feasibility. D
Agata Ni PhilippinesAw aiting def inition of resource, enviro impact stmt nearing completion, mine planning at adv stage, company has target production for H108 SS/RP
Archangel / Kay Tanda Ag, Au PhilippinesDrilling on property completed and NI 43-101 expected in Q407; Scoping study and economic evaluation planned for Q407-Q108 RU
Calo / El Paso Cu, Au PhilippinesContinued exploration and drilling of targets identif ied f rom preliminary surveying D
San Juan Ag MexicoDrilling w /1 rig currently underw ay - preliminary results expected late Q407 D/RP
La Preciosa Ag Mexico
Signif icant silver-gold mineralization intersected; 3 rigs continuously drilling; aw aiting results f rom 30 holes (17,000m of drilling) in Q407 w ith another new resource estimate expected by Q108 RU/D
Santa Monica Ag MexicoDrilling targets identif ied f rom geochemical analysis; drilling w ith 1 rig expected to commence late Q407 D
Caborca Au, Cu MexicoInduced polarization survey underw ay of previously identif ied targets; 2,000m drill program to underw ay (6-holes). GP/D
Daniel Au, Cu MexicoCurrent w ork program includes sampling, trenching, and geophysics; potential for drilling in Q407. S/GP/D
San Antonio Au MexicoOngoing drilling throughout Q407 w ith 3 rigs on site; steady new s f low of results in Q407. D
La Colorada Au MexicoCurrently evaluating historical data; plan to test high-grade vein potential using parameters for epithermal gold-silver systems. -
Darby-Candle Uranium Saskatchew an
Aggressive program planned for 2008 w /includes follow -up on intersection @ Candle (CD-14 = 3.2 m core length that averaged 0.31% U3O8 including 0.9 m that contained 0.76% U3O8) D
Gabon Uranium Botsw ana
13,352-line-km helicopter-borne horizontal gradient magnetic and radiometric survey completed. Field w ork initiated. Results expected by year end. GP
Horby Bay Basin Properties Uranium NunavutDrilling and surface exploration program completed - results to follow in Q407; further targets yet to be drill tested. D/RP
Nambia Uranium Africa Sampling and ground geophysics underw ay. S/GPWaterfound Uranium Saskatchew an Five holes (2,750m) to be drilled in Q407 - results pending D
Chrome Mountain Au, PGE South-Central Montana
Extensive drilling of "A" & "B" Chromitite Zone by JV partner (Beartooth Platinum); program completion in Q407; results to follow in Q108. D
NuevaGalicia Ag, Au MexicoPhase I drilling program of targets previously identif ied by surface sampling; 179m of 2,000m completed w ith encouraging results. D
San Pedro Ag, Au Mexico, Jalisco StateAw aiting next phase of exploration - surface & underground mapping tentatively for Q407 - Q108 (pending possible JV partners). GP
Friday-Petsite & Dixie Au MexicoPreliminary review of historical exploration identif ied 3 addt'l targets for testing. -
Fond du Lac Ni Saskatchew an
Results f rom remaining 8 holes of drill program promising -indicates the horizon extends further east & w estern portion is at least 2-3 times as thick as the central and eastern counterparts D
Fox River Ni, Cu ManitobaExploration ef forts discontinued to focus ef forts on other higher-potential targets. D
MAN Ni, Cu, PGE Alaska4,000m exploration drilling program commenced on Aug 1st ($4.0 M budget fully funded); drill results expected in Q407. D
Salt Chuck Cu, Au, PGE AlaskaDrill targets identif ied, aw aiting f inal permitting, drill rig & crew secured for Q108 drilling. -
William Lake Cu, Zn, Au ManitobaStarted tech report and exploration plan; 3,000m diamond drill program underw ay w ith results expected in Q108. D
Catalysts
TSX-V:PXP
TSX-V:PEZ
TSX-V:OK
TSX-V:MIO
TSX-V:MEX
TSX:INV
TSX-V:IME
TSX-V:HAT
TSX:NIC
TSX-V:PEMPremium Exploration Inc.
Pure Nickel Inc.
Mindoro Resources Ltd.
Orko Silver Corp.
Pediment Exploration Ltd.
Pitchstone Exploration Ltd.
Hathor Exploration Ltd.
Indicator Minerals Inc.
International Nickel Ventures Corp.
Midlands Minerals Corporation

Haywood’s Junior Mining Universe
Chris Thompson, P.Geo. (604-697-7433, [email protected]) Vol. 2, No. 4, November 14, 2007 — 21 Ben Asuncion (604-697-6149, [email protected])
Company Ticker Property Commodities Key RegionsQ407
Million Mountain Au South AmericaCurrent drill program of step-out & inf ill drilling focused on resource def inition - 43-101 expected by end of 2007 D/RU
Northw estern Project Au South America
Analysis of past trenching and chip/f ield samples have identif ied three preliminary targets for drilling - expected to commence in Q407 through Q108 D
Other (Kartuni) Au, Diamonds South AmericaFieldw ork and sampling started; announcement of results expected by end of 2007 GP
LJ Zn British ColumbiaRecently completed 2,600m drill program focused on def ining mineralization horizon - assay results pending. D/RP
Ruddock Creek Zn British ColumbiaPlanning for the development of an underground decline - (1.1 km) plus 10,000 m of underground diamond drilling planned for 2007. D
Sheraton Timmins Zn OntarioWaiting for optionee to decide if they w ill earn-in - deadline end of Q407. RU/CD
Afridi Lake Diamonds MW Territories
A irborne gravity surveying done w /positive results - follow ed up by ground geophysics; preliminary results expected Q407 w ith potential drilling in Q108. RP
Churchill - Shear Diamonds NunavutPartial results f rom Kahuna kimberlite promising; results f rom complete 400-tonne bulk sample pending. BS/RP
Sakari - Shear Diamonds Nunavut, NW TerritoriesFinished airborne surveying (completed by JV partner DDN); results pending and expected in Q407. GP/RP
Aviat Diamonds NunavutField component of 2007 exploration program complete - aw aiting results; intersected kimberlite in 36 of 45 holes drilled. RP
Churchill Diamonds NunavutPartial results released f rom bulk sampling of Kahuna - 93.5 carats recovered f rom 107 dry tons (out of 400-ton bulk sample). BS/RP
Foxtrot Diamonds Quebec
Diamond valuations results released for 10,000 tonne (6,500 carat) bulk sample f rom Renard 2,3 and 4 (avg $91 $US/carat). Tw o phase pre-feasibility study underw ay. BS/FS
Qilalugaq Diamonds NunavutFour new kimberlites discovered - Naujaat 3 - 6; aw aiting results of 26.9 tonnes for DMS. BS/RP
Sua Pan Diamonds Botsw anaDrilling program of 10 - 15 targets to commence in Q407 w ith results expected by end of 2007. D
Timiskaming Diamonds OntarioAggressive exploration program of KIM sampling, geophysics & drilling (Baby kimberlite) planned for Q407 - Q108. S/GP/D
Aurum JV Cu Dem Rep of Congo (DRC)
RC and additional air core drilling is planned for Q407 to follow up on targets identif ied f rom previous drilling and exploration ef forts. Large regional soil sampling program of 9,200 samples planned for Q407. S/GP/D
Kipoi Co, Cu Dem Rep of Congo (DRC)
Preliminary feasibility expected early Q407 w ith resource estimate to follow by end of Q407; w orking tow ards f inal resource and full feasibility by early 2009 FS/RU
Aus/Garub Uranium NambiaAus - w ork commenced, results f rom radon survey currently underw ay expected in Q407; Garub - aw aiting EPL (expected Q407). GP
Cape Cross Uranium NambiaLarge radon survey underw ay - new potential targets identif ied; drilling to commence upon completion - expected Q407. GP/D
Engo Valley Uranium Nambia Drill program to commence - pending EPL expected mid Q407. D
Warmbad Uranium NambiaA irborne survey and ground truthing completed - drill targets identif ied; 15,000m RC drill program commenced in Q407. D
Le gendGPDS
BSRUCDSSFSRP
Catalysts
TSX-V:SLK
TSX-V:SCM
TSX-V:XE
ASX:TGS
TSX:SWY
TSX-V:SRMShear Minerals Ltd.
Stornow ay Diamond Corp.
Tiger Resources Ltd.
Xemplar Energy Corp.
Sacre-Coeur Minerals Ltd.
Selkirk Metals Corp.
Geophysics DrillingSamplingBulk Sampling
Results Pending
Resource Update PendingCorporate Development PendingScoping StudyFeasibility Study
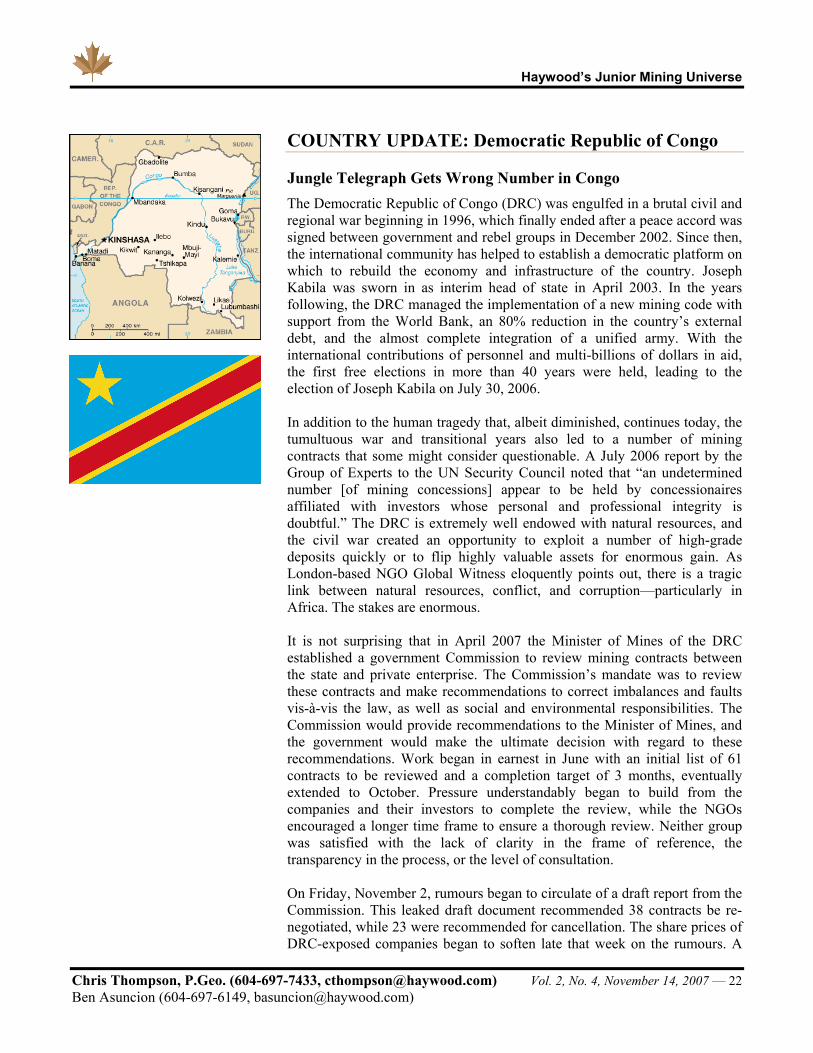
Haywood’s Junior Mining Universe
Chris Thompson, P.Geo. (604-697-7433, [email protected]) Vol. 2, No. 4, November 14, 2007 — 22 Ben Asuncion (604-697-6149, [email protected])
COUNTRY UPDATE: Democratic Republic of Congo
Jungle Telegraph Gets Wrong Number in Congo The Democratic Republic of Congo (DRC) was engulfed in a brutal civil and regional war beginning in 1996, which finally ended after a peace accord was signed between government and rebel groups in December 2002. Since then, the international community has helped to establish a democratic platform on which to rebuild the economy and infrastructure of the country. Joseph Kabila was sworn in as interim head of state in April 2003. In the years following, the DRC managed the implementation of a new mining code with support from the World Bank, an 80% reduction in the country’s external debt, and the almost complete integration of a unified army. With the international contributions of personnel and multi-billions of dollars in aid, the first free elections in more than 40 years were held, leading to the election of Joseph Kabila on July 30, 2006. In addition to the human tragedy that, albeit diminished, continues today, the tumultuous war and transitional years also led to a number of mining contracts that some might consider questionable. A July 2006 report by the Group of Experts to the UN Security Council noted that “an undetermined number [of mining concessions] appear to be held by concessionaires affiliated with investors whose personal and professional integrity is doubtful.” The DRC is extremely well endowed with natural resources, and the civil war created an opportunity to exploit a number of high-grade deposits quickly or to flip highly valuable assets for enormous gain. As London-based NGO Global Witness eloquently points out, there is a tragic link between natural resources, conflict, and corruption—particularly in Africa. The stakes are enormous. It is not surprising that in April 2007 the Minister of Mines of the DRC established a government Commission to review mining contracts between the state and private enterprise. The Commission’s mandate was to review these contracts and make recommendations to correct imbalances and faults vis-à-vis the law, as well as social and environmental responsibilities. The Commission would provide recommendations to the Minister of Mines, and the government would make the ultimate decision with regard to these recommendations. Work began in earnest in June with an initial list of 61 contracts to be reviewed and a completion target of 3 months, eventually extended to October. Pressure understandably began to build from the companies and their investors to complete the review, while the NGOs encouraged a longer time frame to ensure a thorough review. Neither group was satisfied with the lack of clarity in the frame of reference, the transparency in the process, or the level of consultation. On Friday, November 2, rumours began to circulate of a draft report from the Commission. This leaked draft document recommended 38 contracts be re-negotiated, while 23 were recommended for cancellation. The share prices of DRC-exposed companies began to soften late that week on the rumours. A
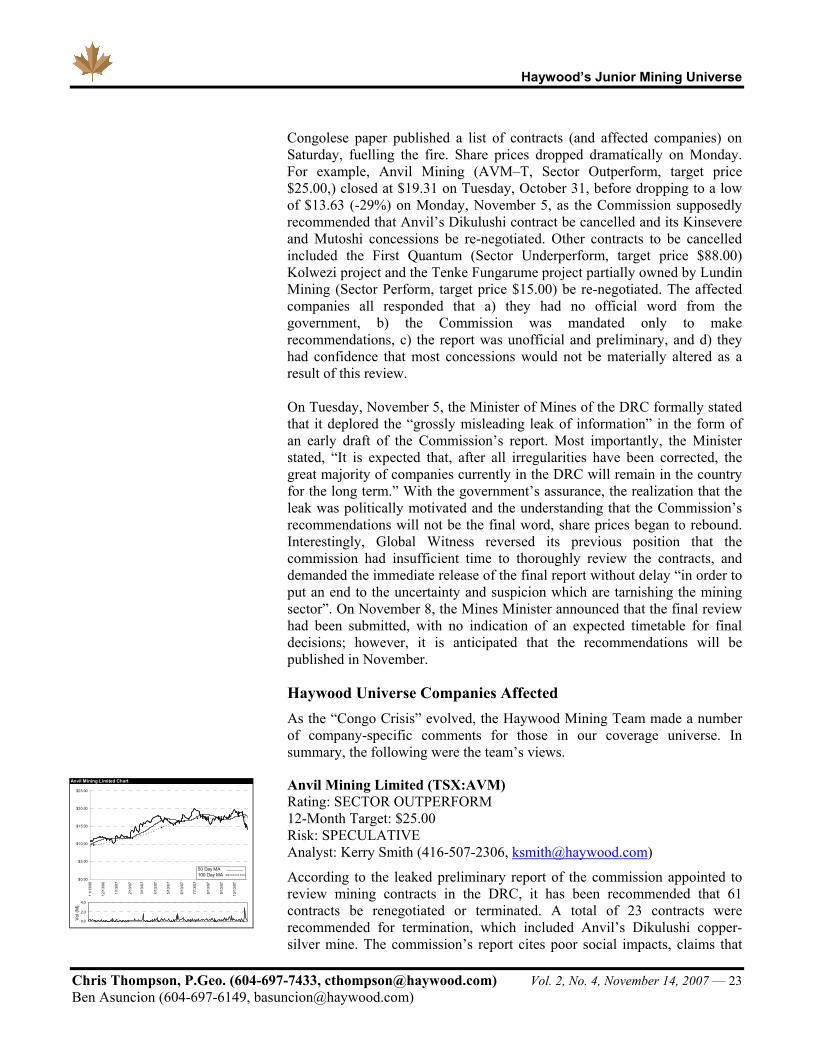
Haywood’s Junior Mining Universe
Chris Thompson, P.Geo. (604-697-7433, [email protected]) Vol. 2, No. 4, November 14, 2007 — 23 Ben Asuncion (604-697-6149, [email protected])
Congolese paper published a list of contracts (and affected companies) on Saturday, fuelling the fire. Share prices dropped dramatically on Monday. For example, Anvil Mining (AVM–T, Sector Outperform, target price $25.00,) closed at $19.31 on Tuesday, October 31, before dropping to a low of $13.63 (-29%) on Monday, November 5, as the Commission supposedly recommended that Anvil’s Dikulushi contract be cancelled and its Kinsevere and Mutoshi concessions be re-negotiated. Other contracts to be cancelled included the First Quantum (Sector Underperform, target price $88.00) Kolwezi project and the Tenke Fungarume project partially owned by Lundin Mining (Sector Perform, target price $15.00) be re-negotiated. The affected companies all responded that a) they had no official word from the government, b) the Commission was mandated only to make recommendations, c) the report was unofficial and preliminary, and d) they had confidence that most concessions would not be materially altered as a result of this review. On Tuesday, November 5, the Minister of Mines of the DRC formally stated that it deplored the “grossly misleading leak of information” in the form of an early draft of the Commission’s report. Most importantly, the Minister stated, “It is expected that, after all irregularities have been corrected, the great majority of companies currently in the DRC will remain in the country for the long term.” With the government’s assurance, the realization that the leak was politically motivated and the understanding that the Commission’s recommendations will not be the final word, share prices began to rebound. Interestingly, Global Witness reversed its previous position that the commission had insufficient time to thoroughly review the contracts, and demanded the immediate release of the final report without delay “in order to put an end to the uncertainty and suspicion which are tarnishing the mining sector”. On November 8, the Mines Minister announced that the final review had been submitted, with no indication of an expected timetable for final decisions; however, it is anticipated that the recommendations will be published in November.
Haywood Universe Companies Affected As the “Congo Crisis” evolved, the Haywood Mining Team made a number of company-specific comments for those in our coverage universe. In summary, the following were the team’s views.
Anvil Mining Limited (TSX:AVM) Rating: SECTOR OUTPERFORM 12-Month Target: $25.00 Risk: SPECULATIVE Analyst: Kerry Smith (416-507-2306, [email protected])
According to the leaked preliminary report of the commission appointed to review mining contracts in the DRC, it has been recommended that 61 contracts be renegotiated or terminated. A total of 23 contracts were recommended for termination, which included Anvil’s Dikulushi copper-silver mine. The commission’s report cites poor social impacts, claims that
Anvil Mining Limited Chart
$0.00
$5.00
$10.00
$15.00
$20.00
$25.00
11/1
3/06
12/1
3/06
1/13
/07
2/13
/07
3/13
/07
4/13
/07
5/13
/07
6/13
/07
7/13
/07
8/13
/07
9/13
/07
10/1
3/07
0.0
2.0
4.0
1
Vol
(M)
50 Day MA100 Day MA
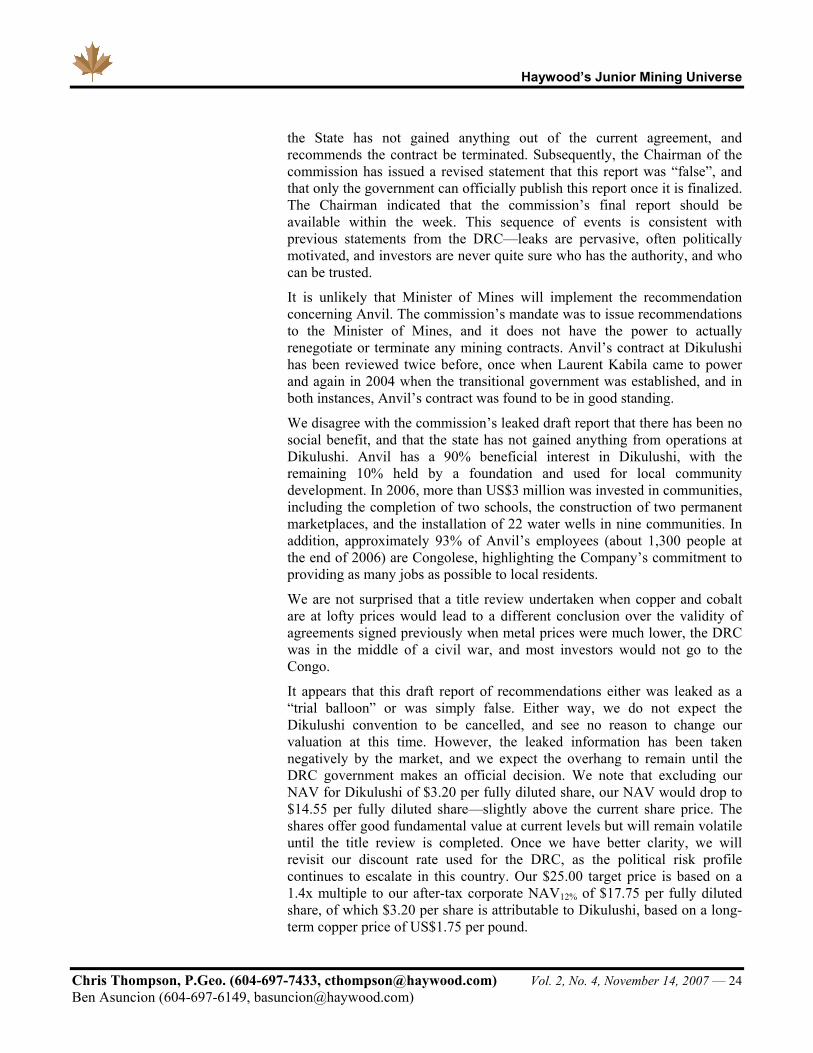
Haywood’s Junior Mining Universe
Chris Thompson, P.Geo. (604-697-7433, [email protected]) Vol. 2, No. 4, November 14, 2007 — 24 Ben Asuncion (604-697-6149, [email protected])
the State has not gained anything out of the current agreement, and recommends the contract be terminated. Subsequently, the Chairman of the commission has issued a revised statement that this report was “false”, and that only the government can officially publish this report once it is finalized. The Chairman indicated that the commission’s final report should be available within the week. This sequence of events is consistent with previous statements from the DRC—leaks are pervasive, often politically motivated, and investors are never quite sure who has the authority, and who can be trusted.
It is unlikely that Minister of Mines will implement the recommendation concerning Anvil. The commission’s mandate was to issue recommendations to the Minister of Mines, and it does not have the power to actually renegotiate or terminate any mining contracts. Anvil’s contract at Dikulushi has been reviewed twice before, once when Laurent Kabila came to power and again in 2004 when the transitional government was established, and in both instances, Anvil’s contract was found to be in good standing.
We disagree with the commission’s leaked draft report that there has been no social benefit, and that the state has not gained anything from operations at Dikulushi. Anvil has a 90% beneficial interest in Dikulushi, with the remaining 10% held by a foundation and used for local community development. In 2006, more than US$3 million was invested in communities, including the completion of two schools, the construction of two permanent marketplaces, and the installation of 22 water wells in nine communities. In addition, approximately 93% of Anvil’s employees (about 1,300 people at the end of 2006) are Congolese, highlighting the Company’s commitment to providing as many jobs as possible to local residents.
We are not surprised that a title review undertaken when copper and cobalt are at lofty prices would lead to a different conclusion over the validity of agreements signed previously when metal prices were much lower, the DRC was in the middle of a civil war, and most investors would not go to the Congo.
It appears that this draft report of recommendations either was leaked as a “trial balloon” or was simply false. Either way, we do not expect the Dikulushi convention to be cancelled, and see no reason to change our valuation at this time. However, the leaked information has been taken negatively by the market, and we expect the overhang to remain until the DRC government makes an official decision. We note that excluding our NAV for Dikulushi of $3.20 per fully diluted share, our NAV would drop to $14.55 per fully diluted share—slightly above the current share price. The shares offer good fundamental value at current levels but will remain volatile until the title review is completed. Once we have better clarity, we will revisit our discount rate used for the DRC, as the political risk profile continues to escalate in this country. Our $25.00 target price is based on a 1.4x multiple to our after-tax corporate NAV12% of $17.75 per fully diluted share, of which $3.20 per share is attributable to Dikulushi, based on a long-term copper price of US$1.75 per pound.
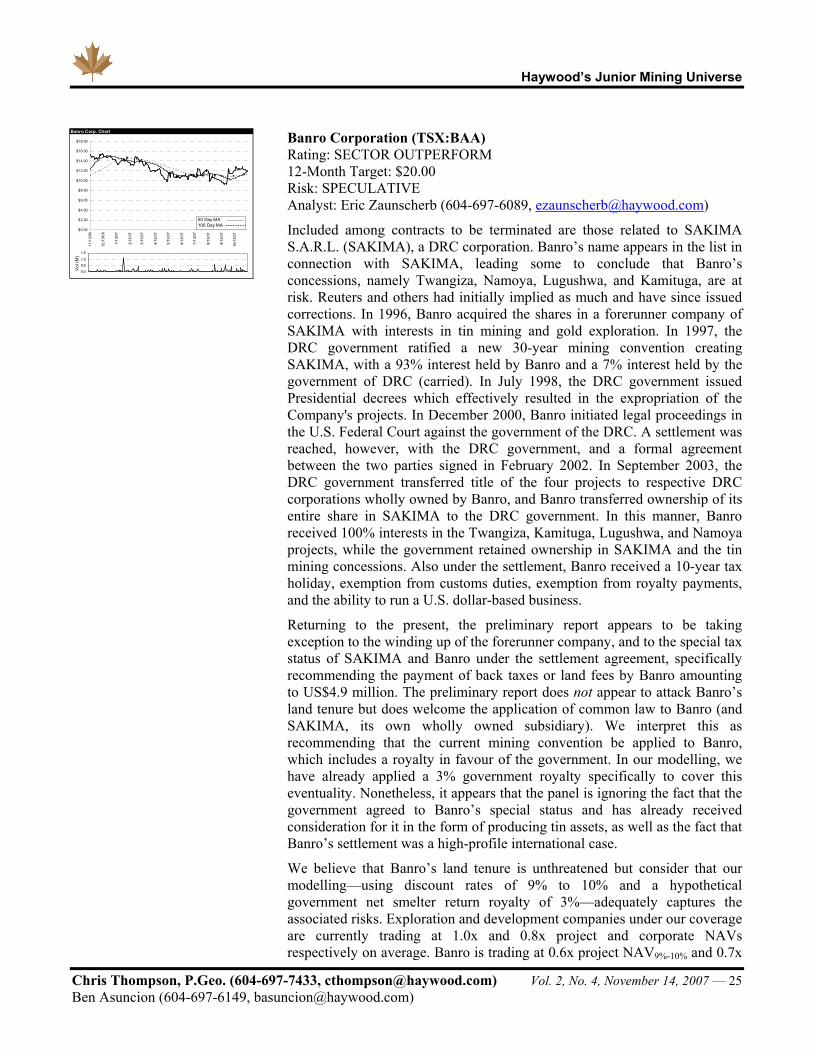
Haywood’s Junior Mining Universe
Chris Thompson, P.Geo. (604-697-7433, [email protected]) Vol. 2, No. 4, November 14, 2007 — 25 Ben Asuncion (604-697-6149, [email protected])
Banro Corporation (TSX:BAA) Rating: SECTOR OUTPERFORM 12-Month Target: $20.00 Risk: SPECULATIVE Analyst: Eric Zaunscherb (604-697-6089, [email protected])
Included among contracts to be terminated are those related to SAKIMA S.A.R.L. (SAKIMA), a DRC corporation. Banro’s name appears in the list in connection with SAKIMA, leading some to conclude that Banro’s concessions, namely Twangiza, Namoya, Lugushwa, and Kamituga, are at risk. Reuters and others had initially implied as much and have since issued corrections. In 1996, Banro acquired the shares in a forerunner company of SAKIMA with interests in tin mining and gold exploration. In 1997, the DRC government ratified a new 30-year mining convention creating SAKIMA, with a 93% interest held by Banro and a 7% interest held by the government of DRC (carried). In July 1998, the DRC government issued Presidential decrees which effectively resulted in the expropriation of the Company's projects. In December 2000, Banro initiated legal proceedings in the U.S. Federal Court against the government of the DRC. A settlement was reached, however, with the DRC government, and a formal agreement between the two parties signed in February 2002. In September 2003, the DRC government transferred title of the four projects to respective DRC corporations wholly owned by Banro, and Banro transferred ownership of its entire share in SAKIMA to the DRC government. In this manner, Banro received 100% interests in the Twangiza, Kamituga, Lugushwa, and Namoya projects, while the government retained ownership in SAKIMA and the tin mining concessions. Also under the settlement, Banro received a 10-year tax holiday, exemption from customs duties, exemption from royalty payments, and the ability to run a U.S. dollar-based business.
Returning to the present, the preliminary report appears to be taking exception to the winding up of the forerunner company, and to the special tax status of SAKIMA and Banro under the settlement agreement, specifically recommending the payment of back taxes or land fees by Banro amounting to US$4.9 million. The preliminary report does not appear to attack Banro’s land tenure but does welcome the application of common law to Banro (and SAKIMA, its own wholly owned subsidiary). We interpret this as recommending that the current mining convention be applied to Banro, which includes a royalty in favour of the government. In our modelling, we have already applied a 3% government royalty specifically to cover this eventuality. Nonetheless, it appears that the panel is ignoring the fact that the government agreed to Banro’s special status and has already received consideration for it in the form of producing tin assets, as well as the fact that Banro’s settlement was a high-profile international case.
We believe that Banro’s land tenure is unthreatened but consider that our modelling—using discount rates of 9% to 10% and a hypothetical government net smelter return royalty of 3%—adequately captures the associated risks. Exploration and development companies under our coverage are currently trading at 1.0x and 0.8x project and corporate NAVs respectively on average. Banro is trading at 0.6x project NAV9%-10% and 0.7x
Banro Corp. Chart
$0.00
$2.00
$4.00
$6.00
$8.00
$10.00
$12.00
$14.00
$16.00
$18.00
11/1
3/06
12/1
3/06
1/13
/07
2/13
/07
3/13
/07
4/13
/07
5/13
/07
6/13
/07
7/13
/07
8/13
/07
9/13
/07
10/1
3/07
0.0
0.51.0
1.5
1
Vol
(M)
50 Day MA100 Day MA

Haywood’s Junior Mining Universe
Chris Thompson, P.Geo. (604-697-7433, [email protected]) Vol. 2, No. 4, November 14, 2007 — 26 Ben Asuncion (604-697-6149, [email protected])
corporate NAV, well below peer averages. In addition, peer companies are trading at an average US$72 enterprise value per ounce, which is considerably above Banro at US$41 on this basis. Our $20.00 target price is based on a conservative 1.1x target multiple on a $637 project NAV9%-10% estimate. We emphasize the first-class nature of Banro’s project portfolio, with two potential gold mines, Twangiza and Namoya, advancing into the prefeasibility stage, and a preliminary economic assessment in the pipeline for a third, Lugushwa. Confusion will likely have provided excellent entry points for risk-tolerant investors interested in gaining exposure to this strong project portfolio being advanced by highly experienced industry professionals. Final resolution of the DRC land tenure review should result in a re-rating for all DRC companies.
Moto Goldmines Limited (TSX:MGL) Rating: SECTOR OUTPERFORM 12-Month Target: $8.60 Risk: SPECULATIVE Analyst: Andrew Kaip (416-507-2417, [email protected])
More than 6 months after the DRC government announced that it would convene a parliamentary commission to review licence agreements between mining and exploration companies and DRC parastatal organizations, unofficial results of the review are beginning to be disseminated. As of Friday, November 3, 2007, what looked to be leaked commission results were published in an article in an independent news agency in Kinshasa. While unofficial, the article indicated that for several of the concessions that comprise the Moto Gold project, joint-venture partners Moto Goldmines and Borgamin are deficient in certain aspects of the joint-venture agreement with the parastatal company OKIMO. These aspects include the non-payment of surface rights since the project was placed under force majeure in 2003, errors in geographical coordinates of the prospects, failure to submit a feasibility study, and arbitrary fixing of joint-venture partner interest prior to completion of feasibility We view resolution of these deficiencies as achievable, considering that most will likely be addressed through the revised licensing agreement outlined in November 2006 and currently on hold pending the completion of the review.
Consistent with our previous comments (July 17, 2007), we remain confident that the review will establish relative compliance with the existing mining licences covering the Moto project. We expect most of the commission’s concerns will be addressed through the completion of a revised licensing agreement and release of the Moto project feasibility, which could be as early as the end of Q4/07.
Our 12-month target price of $8.60 per share is based on a 1.3x base-case project NAV11% of US$486 million or US$5.84 per share. Moto trades at 0.35x project NAV11%, while peers in our coverage universe trade between 0.6x and 1.4x (average of 0.8x) project NAV at discount rates between 3% and 9%. This represents a 38% discount to peers in our coverage universe. On the basis of enterprise value per ounce of gold in resource, Moto trades at US$12 per ounce, representing a 70% discount to comparable in-country
Moto Goldmines Ltd. Chart
$0.00
$1.00
$2.00
$3.00
$4.00
$5.00
$6.00
$7.00
$8.00
$9.00
11/1
3/06
12/1
3/06
1/13
/07
2/13
/07
3/13
/07
4/13
/07
5/13
/07
6/13
/07
7/13
/07
8/13
/07
9/13
/07
10/1
3/07
0.0
5.0
10.0
1
Vol
(M)
50 Day MA100 Day MA
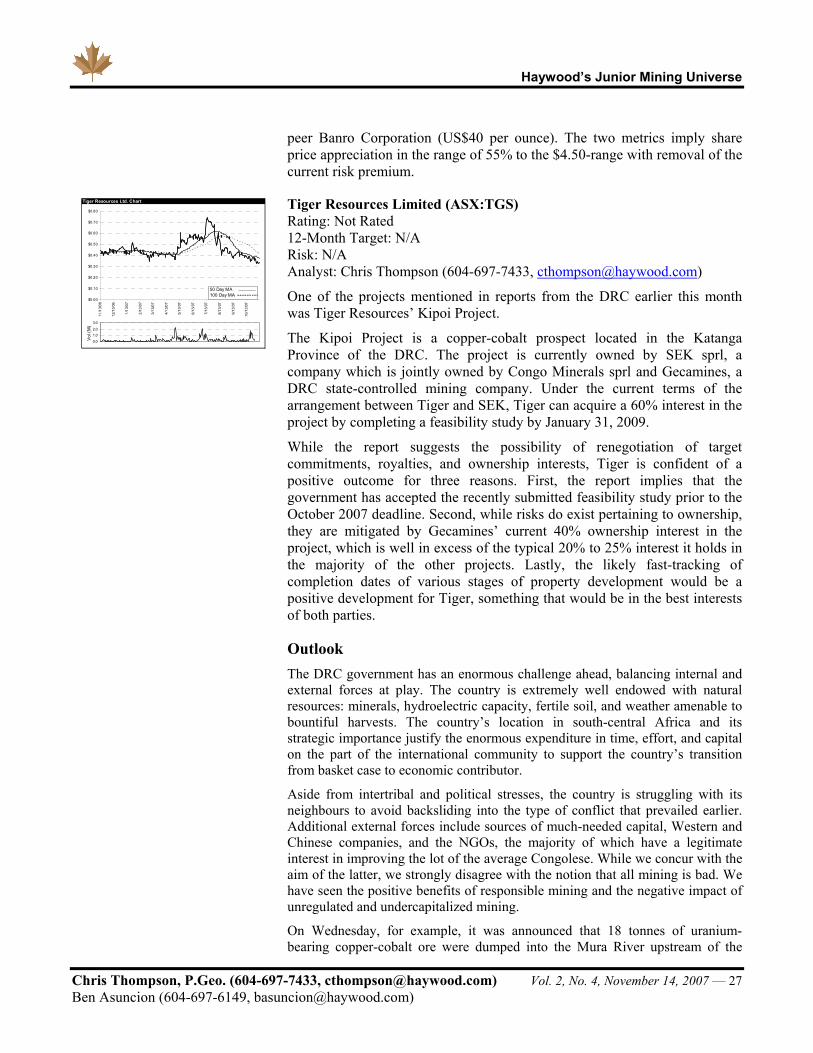
Haywood’s Junior Mining Universe
Chris Thompson, P.Geo. (604-697-7433, [email protected]) Vol. 2, No. 4, November 14, 2007 — 27 Ben Asuncion (604-697-6149, [email protected])
peer Banro Corporation (US$40 per ounce). The two metrics imply share price appreciation in the range of 55% to the $4.50-range with removal of the current risk premium.
Tiger Resources Limited (ASX:TGS) Rating: Not Rated 12-Month Target: N/A Risk: N/A Analyst: Chris Thompson (604-697-7433, [email protected])
One of the projects mentioned in reports from the DRC earlier this month was Tiger Resources’ Kipoi Project.
The Kipoi Project is a copper-cobalt prospect located in the Katanga Province of the DRC. The project is currently owned by SEK sprl, a company which is jointly owned by Congo Minerals sprl and Gecamines, a DRC state-controlled mining company. Under the current terms of the arrangement between Tiger and SEK, Tiger can acquire a 60% interest in the project by completing a feasibility study by January 31, 2009.
While the report suggests the possibility of renegotiation of target commitments, royalties, and ownership interests, Tiger is confident of a positive outcome for three reasons. First, the report implies that the government has accepted the recently submitted feasibility study prior to the October 2007 deadline. Second, while risks do exist pertaining to ownership, they are mitigated by Gecamines’ current 40% ownership interest in the project, which is well in excess of the typical 20% to 25% interest it holds in the majority of the other projects. Lastly, the likely fast-tracking of completion dates of various stages of property development would be a positive development for Tiger, something that would be in the best interests of both parties.
Outlook The DRC government has an enormous challenge ahead, balancing internal and external forces at play. The country is extremely well endowed with natural resources: minerals, hydroelectric capacity, fertile soil, and weather amenable to bountiful harvests. The country’s location in south-central Africa and its strategic importance justify the enormous expenditure in time, effort, and capital on the part of the international community to support the country’s transition from basket case to economic contributor.
Aside from intertribal and political stresses, the country is struggling with its neighbours to avoid backsliding into the type of conflict that prevailed earlier. Additional external forces include sources of much-needed capital, Western and Chinese companies, and the NGOs, the majority of which have a legitimate interest in improving the lot of the average Congolese. While we concur with the aim of the latter, we strongly disagree with the notion that all mining is bad. We have seen the positive benefits of responsible mining and the negative impact of unregulated and undercapitalized mining.
On Wednesday, for example, it was announced that 18 tonnes of uranium-bearing copper-cobalt ore were dumped into the Mura River upstream of the
Tiger Resources Ltd. Chart
$0.00
$0.10
$0.20
$0.30
$0.40
$0.50
$0.60
$0.70
$0.80
11/1
3/06
12/1
3/06
1/13
/07
2/13
/07
3/13
/07
4/13
/07
5/13
/07
6/13
/07
7/13
/07
8/13
/07
9/13
/07
10/1
3/07
0.0
1.02.0
3.0
1
Vol
(M)
50 Day MA100 Day MA
Haywood’s Junior Mining Universe
Chris Thompson, P.Geo. (604-697-7433, [email protected]) Vol. 2, No. 4, November 14, 2007 — 28 Ben Asuncion (604-697-6149, [email protected])
water intake for the town of Likasi, Katanga Province. There is now an understandable concern over levels of radioactivity in the river in general, and more importantly, in the town’s drinking water. The ore, largely owned by Chinese firm Magma-Lubumbashi, was seized before export, as the DRC is barred from exporting uranium. The ore was to have been dumped at a closed uranium mine but preliminary reports suggest that the road to the closed mine was blocked, and the truckers simply decided to dump the material off a bridge into the river. This type of behaviour does not happen in the larger scale, regulated, and monitored Western approach. Many of the companies already active in the DRC are making important contributions to their local stakeholder societies by funding schools, hospitals, and marketplaces, in addition to providing employment and tax revenues.
Billions of dollars are being budgeted for development in the DRC. BHP Billiton and the DRC government signed an agreement at the end of October to invest US$8 billion in an 800,000-tonne-per-annum aluminium smelter and 4,000-megawatt hydroelectric power facility. China has budgeted US$2 billion for infrastructure development and a further $3 billion for undetermined resource projects in the DRC. The budget has aroused the suspicions of Western mining companies, which fear that their contracts will be cancelled only to see the assets scooped up by Chinese corporations.
The government of the DRC must be cognizant that the world is watching the degree to which legally binding agreements are honoured in the DRC, before providing the capital highly needed to bring the country out of the mire of its past. With that inflow of capital, under the watchful eyes of industry initiatives like the World Business Council for Sustainable Development and NGOs like Global Witness, significant improvements can be made in the country’s economy, the quality of its mining industry performance (including social and environmental), and the quality of life of its citizens. With its enormous natural wealth and strategic importance, the DRC has too bright a future to risk. We expect that the government will see most if not all of the companies currently active there, remaining active there for some time to come.
Kerry Smith (416-507-2306, [email protected]) Eric Zaunscherb (604-697-6089, [email protected]) Andrew Kaip (416-507-2417, [email protected]) Chris Thompson (604-697-7433, [email protected])
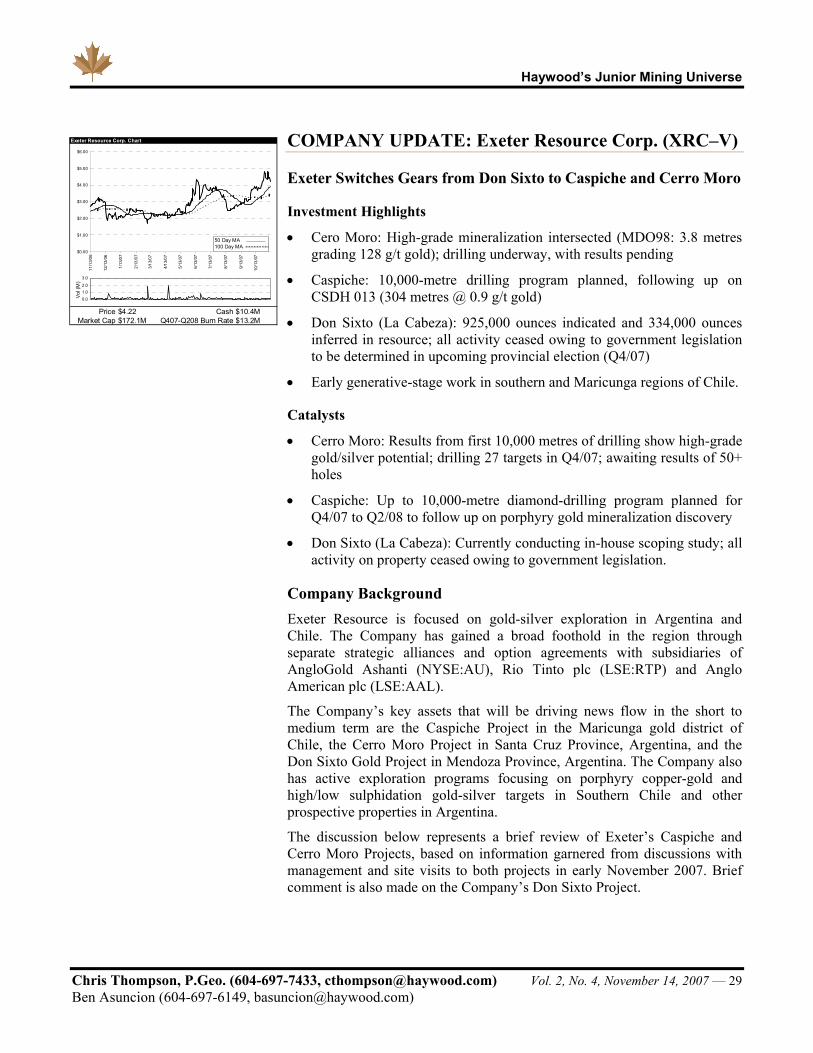
Haywood’s Junior Mining Universe
Chris Thompson, P.Geo. (604-697-7433, [email protected]) Vol. 2, No. 4, November 14, 2007 — 29 Ben Asuncion (604-697-6149, [email protected])
COMPANY UPDATE: Exeter Resource Corp. (XRC–V)
Exeter Switches Gears from Don Sixto to Caspiche and Cerro Moro
Investment Highlights
• Cero Moro: High-grade mineralization intersected (MDO98: 3.8 metres grading 128 g/t gold); drilling underway, with results pending
• Caspiche: 10,000-metre drilling program planned, following up on CSDH 013 (304 metres @ 0.9 g/t gold)
• Don Sixto (La Cabeza): 925,000 ounces indicated and 334,000 ounces inferred in resource; all activity ceased owing to government legislation to be determined in upcoming provincial election (Q4/07)
• Early generative-stage work in southern and Maricunga regions of Chile.
Catalysts
• Cerro Moro: Results from first 10,000 metres of drilling show high-grade gold/silver potential; drilling 27 targets in Q4/07; awaiting results of 50+ holes
• Caspiche: Up to 10,000-metre diamond-drilling program planned for Q4/07 to Q2/08 to follow up on porphyry gold mineralization discovery
• Don Sixto (La Cabeza): Currently conducting in-house scoping study; all activity on property ceased owing to government legislation.
Company Background Exeter Resource is focused on gold-silver exploration in Argentina and Chile. The Company has gained a broad foothold in the region through separate strategic alliances and option agreements with subsidiaries of AngloGold Ashanti (NYSE:AU), Rio Tinto plc (LSE:RTP) and Anglo American plc (LSE:AAL).
The Company’s key assets that will be driving news flow in the short to medium term are the Caspiche Project in the Maricunga gold district of Chile, the Cerro Moro Project in Santa Cruz Province, Argentina, and the Don Sixto Gold Project in Mendoza Province, Argentina. The Company also has active exploration programs focusing on porphyry copper-gold and high/low sulphidation gold-silver targets in Southern Chile and other prospective properties in Argentina.
The discussion below represents a brief review of Exeter’s Caspiche and Cerro Moro Projects, based on information garnered from discussions with management and site visits to both projects in early November 2007. Brief comment is also made on the Company’s Don Sixto Project.
Exeter Resource Corp. Chart
Price $4.22 $10.4MMarket Cap $172.1M $13.2MQ407-Q208 Burn Rate
Cash
$0.00
$1.00
$2.00
$3.00
$4.00
$5.00
$6.00
11/1
3/06
12/1
3/06
1/13
/07
2/13
/07
3/13
/07
4/13
/07
5/13
/07
6/13
/07
7/13
/07
8/13
/07
9/13
/07
10/1
3/07
0.0
1.02.0
3.0
1
Vol
(M)
50 Day MA100 Day MA

Haywood’s Junior Mining Universe
Chris Thompson, P.Geo. (604-697-7433, [email protected]) Vol. 2, No. 4, November 14, 2007 — 30 Ben Asuncion (604-697-6149, [email protected])
Capital Structure • The Company has $10 million in cash—approximately 41 million shares
O/S, 48 million shares fully diluted, implying an O/S market cap of $180 million.
• Management and insider ownership currently stands at 25%. Institutional ownership currently stands at 35%, with retail at 40%.
• The Company has close to $15 million in in-the-money warrants and options.
Maricunga-Caspiche Project, Chile Exeter’s last drill campaign on the Caspiche Project in the Maricunga gold district of Chile wrapped up on a high note with the intersection of 304 metres of mineralization averaging 0.9 g/t gold from a downhole depth of 40 metres (hole CSDH-013). The hole bottomed in 2 metres grading 0.8 g/t gold.
Exploration at Caspiche was focused on the 5 kilometre-long Caspiche epithermal system, located on the northern margin of a large geophysical anomaly. Twelve reverse circulation (RC) holes (3,697 metres) focused on high-sulphidation epithermal gold mineralization. Highlights included 24 metres at a grade of 1.1 g/t gold and 23 g/t silver from a downhole depth of 52 metres (hole CSDH-002). Hole CSDH-013 was the last hole drilled in the program and also was the only hole that targeted a pronounced induced polarization (IP) chargeability anomaly in the Caspiche Central Zone, approximately 2.5 kilometres to the south. Preliminary metallurgical testing has been performed on CSDH-013, and results have been encouraging.
The Caspiche Project was explored by Anglo American from 1986 to 1990 and by Newcrest Mining from 1996 to 1998. Exploration programs included airborne magnetic and IP surveys, geochemistry, mapping, and drilling. The IP survey was limited to widely spaced lines at various orientations. The anomaly was partly tested by two earlier drill holes, CDH-2b and CDH-3, drilled by previous operators.
The Caspiche property is held under option from Minera Anglo American Chile Limitada and Empresa Minera Mantos Blancos S.A. (Anglo American). The option agreement provides Exeter with the right to acquire a 100% ownership interest in the property, once it has spent US$2.55 million on exploration, subject to a 3% net smelter return royalty. Exeter has spent $2 million to date in Chile, including the Caspiche Project, and plans to spend more than $3 million through to June 2008 at Caspiche.
Key in recognizing the exploration potential of the Caspiche Project, besides drill results released to date, is its location in a prolific region of gold porphyry deposits, 11 kilometres southeast of the Kinross Gold Corp. (TSX:K) Refugio Mine and 15 kilometres north of the Kinross 49% owned and the Arizona Star Resource Corp. 51% owned (TSXV:AZS) Cerro Casale project. The future of Cerro Casale as a 1 million-ounce gold and
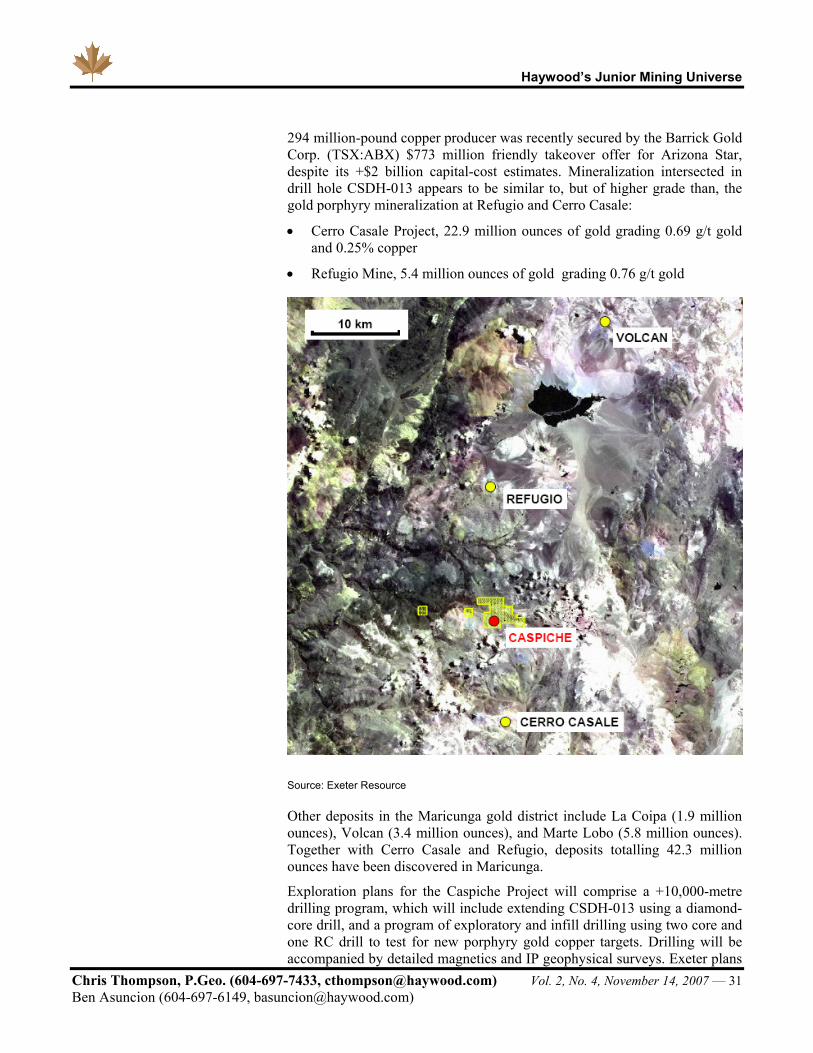
Haywood’s Junior Mining Universe
Chris Thompson, P.Geo. (604-697-7433, [email protected]) Vol. 2, No. 4, November 14, 2007 — 31 Ben Asuncion (604-697-6149, [email protected])
294 million-pound copper producer was recently secured by the Barrick Gold Corp. (TSX:ABX) $773 million friendly takeover offer for Arizona Star, despite its +$2 billion capital-cost estimates. Mineralization intersected in drill hole CSDH-013 appears to be similar to, but of higher grade than, the gold porphyry mineralization at Refugio and Cerro Casale:
• Cerro Casale Project, 22.9 million ounces of gold grading 0.69 g/t gold and 0.25% copper
• Refugio Mine, 5.4 million ounces of gold grading 0.76 g/t gold
Source: Exeter Resource
Other deposits in the Maricunga gold district include La Coipa (1.9 million ounces), Volcan (3.4 million ounces), and Marte Lobo (5.8 million ounces). Together with Cerro Casale and Refugio, deposits totalling 42.3 million ounces have been discovered in Maricunga.
Exploration plans for the Caspiche Project will comprise a +10,000-metre drilling program, which will include extending CSDH-013 using a diamond-core drill, and a program of exploratory and infill drilling using two core and one RC drill to test for new porphyry gold copper targets. Drilling will be accompanied by detailed magnetics and IP geophysical surveys. Exeter plans
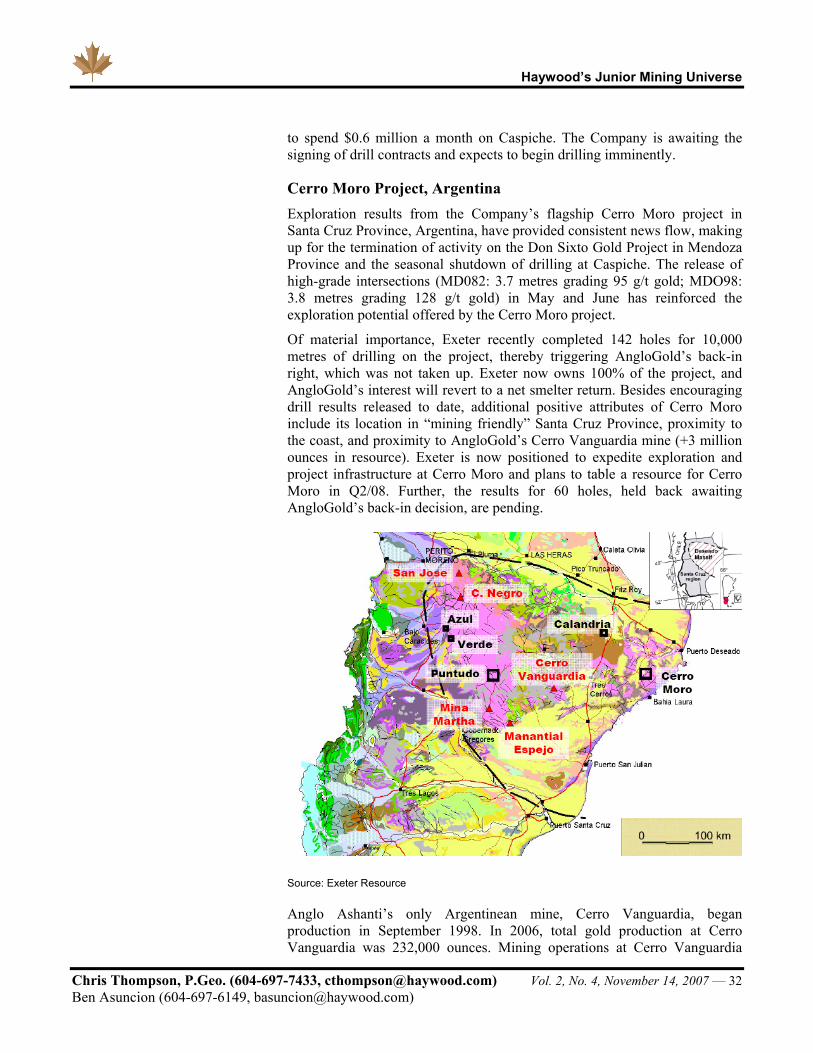
Haywood’s Junior Mining Universe
Chris Thompson, P.Geo. (604-697-7433, [email protected]) Vol. 2, No. 4, November 14, 2007 — 32 Ben Asuncion (604-697-6149, [email protected])
to spend $0.6 million a month on Caspiche. The Company is awaiting the signing of drill contracts and expects to begin drilling imminently.
Cerro Moro Project, Argentina Exploration results from the Company’s flagship Cerro Moro project in Santa Cruz Province, Argentina, have provided consistent news flow, making up for the termination of activity on the Don Sixto Gold Project in Mendoza Province and the seasonal shutdown of drilling at Caspiche. The release of high-grade intersections (MD082: 3.7 metres grading 95 g/t gold; MDO98: 3.8 metres grading 128 g/t gold) in May and June has reinforced the exploration potential offered by the Cerro Moro project.
Of material importance, Exeter recently completed 142 holes for 10,000 metres of drilling on the project, thereby triggering AngloGold’s back-in right, which was not taken up. Exeter now owns 100% of the project, and AngloGold’s interest will revert to a net smelter return. Besides encouraging drill results released to date, additional positive attributes of Cerro Moro include its location in “mining friendly” Santa Cruz Province, proximity to the coast, and proximity to AngloGold’s Cerro Vanguardia mine (+3 million ounces in resource). Exeter is now positioned to expedite exploration and project infrastructure at Cerro Moro and plans to table a resource for Cerro Moro in Q2/08. Further, the results for 60 holes, held back awaiting AngloGold’s back-in decision, are pending.
Source: Exeter Resource
Anglo Ashanti’s only Argentinean mine, Cerro Vanguardia, began production in September 1998. In 2006, total gold production at Cerro Vanguardia was 232,000 ounces. Mining operations at Cerro Vanguardia
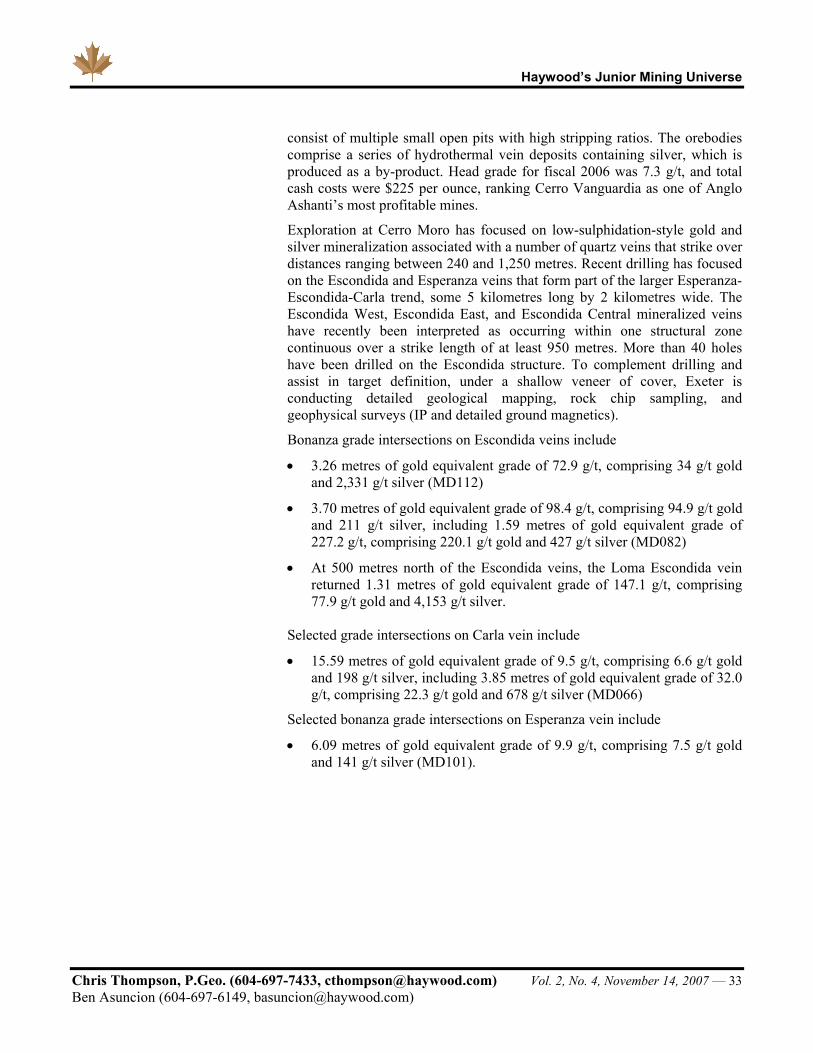
Haywood’s Junior Mining Universe
Chris Thompson, P.Geo. (604-697-7433, [email protected]) Vol. 2, No. 4, November 14, 2007 — 33 Ben Asuncion (604-697-6149, [email protected])
consist of multiple small open pits with high stripping ratios. The orebodies comprise a series of hydrothermal vein deposits containing silver, which is produced as a by-product. Head grade for fiscal 2006 was 7.3 g/t, and total cash costs were $225 per ounce, ranking Cerro Vanguardia as one of Anglo Ashanti’s most profitable mines.
Exploration at Cerro Moro has focused on low-sulphidation-style gold and silver mineralization associated with a number of quartz veins that strike over distances ranging between 240 and 1,250 metres. Recent drilling has focused on the Escondida and Esperanza veins that form part of the larger Esperanza-Escondida-Carla trend, some 5 kilometres long by 2 kilometres wide. The Escondida West, Escondida East, and Escondida Central mineralized veins have recently been interpreted as occurring within one structural zone continuous over a strike length of at least 950 metres. More than 40 holes have been drilled on the Escondida structure. To complement drilling and assist in target definition, under a shallow veneer of cover, Exeter is conducting detailed geological mapping, rock chip sampling, and geophysical surveys (IP and detailed ground magnetics).
Bonanza grade intersections on Escondida veins include
• 3.26 metres of gold equivalent grade of 72.9 g/t, comprising 34 g/t gold and 2,331 g/t silver (MD112)
• 3.70 metres of gold equivalent grade of 98.4 g/t, comprising 94.9 g/t gold and 211 g/t silver, including 1.59 metres of gold equivalent grade of 227.2 g/t, comprising 220.1 g/t gold and 427 g/t silver (MD082)
• At 500 metres north of the Escondida veins, the Loma Escondida vein returned 1.31 metres of gold equivalent grade of 147.1 g/t, comprising 77.9 g/t gold and 4,153 g/t silver.
Selected grade intersections on Carla vein include
• 15.59 metres of gold equivalent grade of 9.5 g/t, comprising 6.6 g/t gold and 198 g/t silver, including 3.85 metres of gold equivalent grade of 32.0 g/t, comprising 22.3 g/t gold and 678 g/t silver (MD066)
Selected bonanza grade intersections on Esperanza vein include
• 6.09 metres of gold equivalent grade of 9.9 g/t, comprising 7.5 g/t gold and 141 g/t silver (MD101).

Haywood’s Junior Mining Universe
Chris Thompson, P.Geo. (604-697-7433, [email protected]) Vol. 2, No. 4, November 14, 2007 — 34 Ben Asuncion (604-697-6149, [email protected])
Source: Exeter Resource
Exploration plans for the Cerro Moro Project will comprise an aggressive drilling program targeting high-grade Escondida/Esperanza-type quartz veins using four rigs (two core and two multipurpose RC rigs), accompanied by prefeasibility level metallurgical testing. Exeter plans to table a resource estimate for Cerro Morro by Q2/08 and a revised resource estimate by Q4/08, culminating in feasibility studies and a production decision in Q1/09. News flow from Cerro Moro will be intense, with the release of results from 60 holes held back pending the outcome of AngloGold’s backing decision. The potential of Cerro Moro is supported by its location in the mining-friendly Province of Santa Cruz.
Don Sixto, Argentina The Don Sixto Project in the Malargüe District of Mendoza province hosts a National Instrument 43-101 compliant Measured and Indicated resource of 925,000 ounces of gold at 1.4 g/t gold and an Inferred resource of 334,000 ounces of gold at 1.1 g/t gold. Development of the project was put on hold in June as a result of legislation passed by the Mendoza government banning the use of chemicals in mining. Internal development/scoping studies are progressing, and it is hoped that, in time, amendments will be filed approving the use of chemicals in mining for projects in pro-mining districts such as Malargüe.
News Flow With $10 million in cash, Exeter has adequate funds to finance its near-term exploration goals through to mid-2008 at the Caspiche and Cerro Morro projects, budgeted with corporate overhead costs at $1.3 million a month. Additional funds may be garnered from $15 million in in-the-money warrants and options.
Haywood’s Junior Mining Universe
Chris Thompson, P.Geo. (604-697-7433, [email protected]) Vol. 2, No. 4, November 14, 2007 — 35 Ben Asuncion (604-697-6149, [email protected])
News flow will focus on aggressive infill and exploration drill programs at Caspiche (three rigs) and Cerro Moro (four rigs), leading to resource updates and the consideration of development options at Cerro Moro. If results are positive, the start of feasibility studies at Cerro Moro in Q3/08 is envisaged.
Key Catalysts The release of positive drill results from the Caspiche and Cerro Moro Projects and other properties, as well as positive news concerning the future acceptance of mining in Mendoza province should provide impetus to drive Exeter’s share price higher. For Caspiche, drill results from the planned 10,000-metre drill campaign will qualify its potential as a Cerro Casale/Refugio analogy. For Cerro Moro, results from Exeter’s aggressive drill campaign, accompanied by continued refinement in understanding the mineralogical controls of high-grade gold and silver mineralization hosted within Escondida/Esperanza-type quartz veins will benchmark the project’s progression through to a potential production decision in Q1/09.
Chris Thompson (604-697-7433, [email protected])
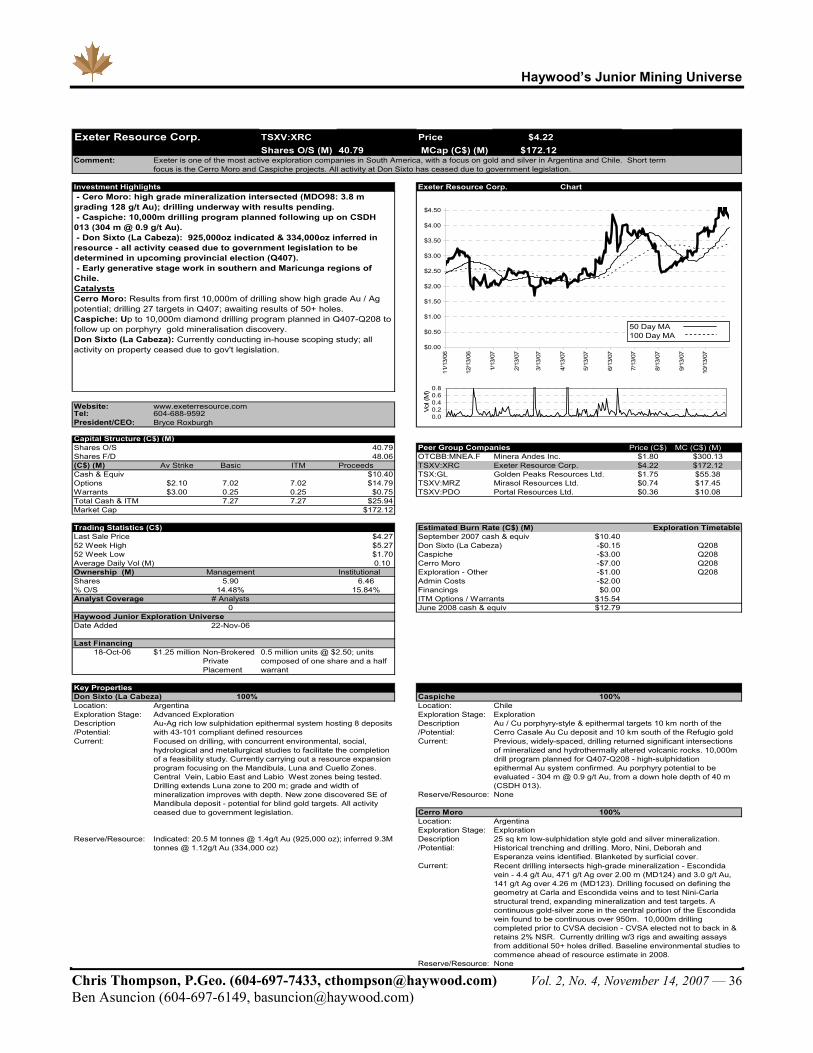
Haywood’s Junior Mining Universe
Chris Thompson, P.Geo. (604-697-7433, [email protected]) Vol. 2, No. 4, November 14, 2007 — 36 Ben Asuncion (604-697-6149, [email protected])
TSXV:XRC Price $4.22 Shares O/S (M) 40.79 MCap (C$) (M) $172.12
Comment:
11/12/2007Investment Highlights Exeter Resource Corp. Chart
Website: www.exeterresource.comTel:President/CEO:
Capital Structure (C$) (M)Shares O/S 40.79 Peer Group Companies Price (C$) MC (C$) (M)Shares F/D 48.06 OTCBB:MNEA.F $1.80 $300.13(C$) (M) Av Strike Basic ITM Proceeds TSXV:XRC $4.22 $172.12Cash & Equiv $10.40 TSX:GL $1.75 $55.38Options $2.10 7.02 7.02 $14.79 TSXV:MRZ $0.74 $17.45Warrants $3.00 0.25 0.25 $0.75 TSXV:PDO $0.36 $10.08Total Cash & ITM 7.27 7.27 $25.94Market Cap $172.12
Trading Statistics (C$) Estimated Burn Rate (C$) (M)Last Sale Price $4.27 September 2007 cash & equiv $10.40 52 Week High $5.27 Don Sixto (La Cabeza) -$0.15 Q20852 Week Low $1.70 Caspiche -$3.00 Q208Average Daily Vol (M) 0.10 Cerro Moro -$7.00 Q208Ownership (M) Management Institutional Exploration - Other -$1.00 Q208Shares 5.90 6.46 Admin Costs -$2.00 % O/S 14.48% 15.84% Financings $0.00 Analyst Coverage # Analysts ITM Options / Warrants $15.54
0 June 2008 cash & equiv $12.79 Haywood Junior Exploration UniverseDate Added 22-Nov-06
Last Financing18-Oct-06 $1.25 million
Key PropertiesDon Sixto (La Cabeza) 100% Caspiche 100%Location: Argentina Location: ChileExploration Stage: Advanced Exploration Exploration Stage: ExplorationDescription Description/Potential: /Potential:Current: Current:
Reserve/Resource: None
Cerro Moro 100%Location: ArgentinaExploration Stage: Exploration
Reserve/Resource: Description/Potential:
Current:
Reserve/Resource: None
Mirasol Resources Ltd.
Recent drilling intersects high-grade mineralization - Escondida vein - 4.4 g/t Au, 471 g/t Ag over 2.00 m (MD124) and 3.0 g/t Au, 141 g/t Ag over 4.26 m (MD123). Drilling focused on defining the geometry at Carla and Escondida veins and to test Nini-Carla structural trend, expanding mineralization and test targets. A continuous gold-silver zone in the central portion of the Escondida vein found to be continuous over 950m. 10,000m drilling completed prior to CVSA decision - CVSA elected not to back in & retains 2% NSR. Currently drilling w/3 rigs and awaiting assays from additional 50+ holes drilled. Baseline environmental studies to commence ahead of resource estimate in 2008.
Previous, widely-spaced, drilling returned significant intersections of mineralized and hydrothermally altered volcanic rocks. 10,000m drill program planned for Q407-Q208 - high-sulphidation epithermal Au system confirmed. Au porphyry potential to be evaluated - 304 m @ 0.9 g/t Au, from a down hole depth of 40 m (CSDH 013).
Indicated: 20.5 M tonnes @ 1.4g/t Au (925,000 oz); inferred 9.3M tonnes @ 1.12g/t Au (334,000 oz)
25 sq km low-sulphidation style gold and silver mineralization. Historical trenching and drilling. Moro, Nini, Deborah and Esperanza veins identified. Blanketed by surficial cover.
Exeter Resource Corp.
Focused on drilling, with concurrent environmental, social, hydrological and metallurgical studies to facilitate the completion of a feasibility study. Currently carrying out a resource expansion program focusing on the Mandibula, Luna and Cuello Zones. Central Vein, Labio East and Labio West zones being tested. Drilling extends Luna zone to 200 m; grade and width of mineralization improves with depth. New zone discovered SE of Mandibula deposit - potential for blind gold targets. All activity ceased due to government legislation.
604-688-9592
0.5 million units @ $2.50; units composed of one share and a half warrant
Bryce Roxburgh
Non-Brokered Private Placement
Au-Ag rich low sulphidation epithermal system hosting 8 deposits with 43-101 compliant defined resources
Minera Andes Inc.
Au / Cu porphyry-style & epithermal targets 10 km north of the Cerro Casale Au Cu deposit and 10 km south of the Refugio gold
Exeter Resource Corp.
Exeter is one of the most active exploration companies in South America, with a focus on gold and silver in Argentina and Chile. Short term focus is the Cerro Moro and Caspiche projects. All activity at Don Sixto has ceased due to government legislation.
- Cero Moro: high grade mineralization intersected (MDO98: 3.8 m grading 128 g/t Au); drilling underway with results pending. - Caspiche: 10,000m drilling program planned following up on CSDH 013 (304 m @ 0.9 g/t Au). - Don Sixto (La Cabeza): 925,000oz indicated & 334,000oz inferred in resource - all activity ceased due to government legislation to be determined in upcoming provincial election (Q407). - Early generative stage work in southern and Maricunga regions of Chile.CatalystsCerro Moro: Results from first 10,000m of drilling show high grade Au / Ag potential; drilling 27 targets in Q407; awaiting results of 50+ holes.Caspiche: Up to 10,000m diamond drilling program planned in Q407-Q208 to follow up on porphyry gold mineralisation discovery.Don Sixto (La Cabeza): Currently conducting in-house scoping study; all activity on property ceased due to gov't legislation.
Golden Peaks Resources Ltd.
Portal Resources Ltd.
Exploration Timetable
$0.00
$0.50
$1.00
$1.50
$2.00
$2.50
$3.00
$3.50
$4.00
$4.50
11/1
3/06
12/1
3/06
1/13
/07
2/13
/07
3/13
/07
4/13
/07
5/13
/07
6/13
/07
7/13
/07
8/13
/07
9/13
/07
10/1
3/07
0.00.20.40.60.8
1
Vol (
M)
50 Day MA100 Day MA
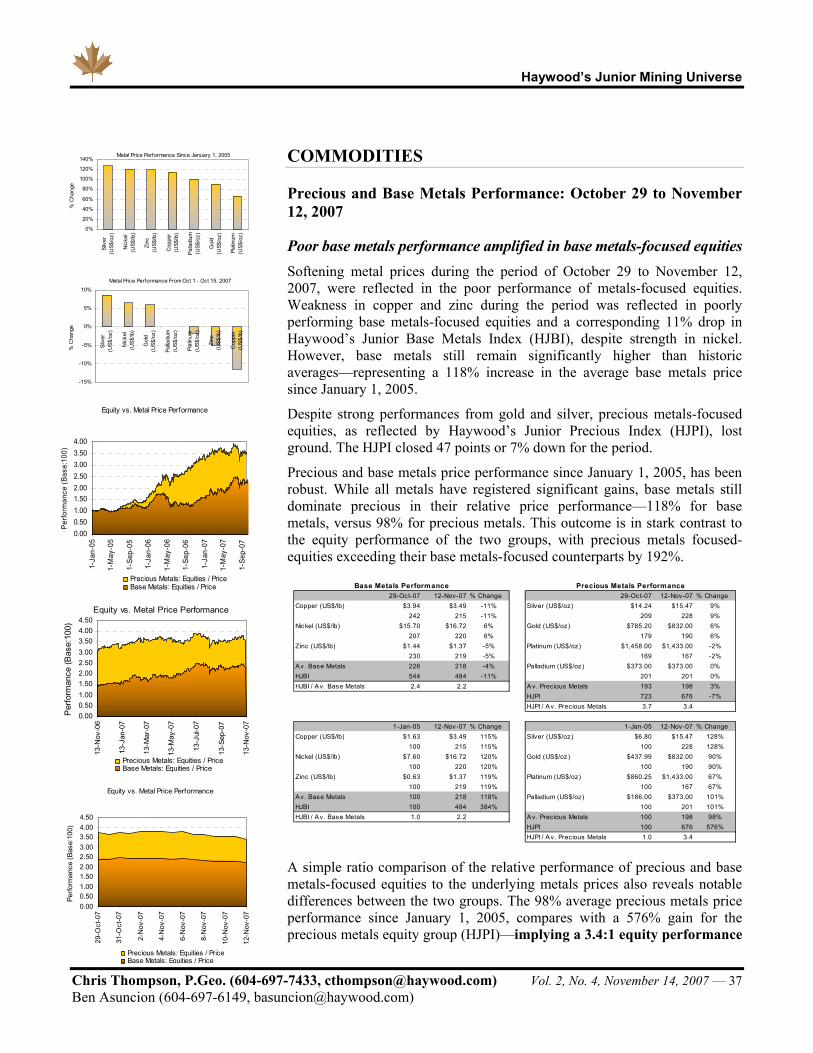
Haywood’s Junior Mining Universe
Chris Thompson, P.Geo. (604-697-7433, [email protected]) Vol. 2, No. 4, November 14, 2007 — 37 Ben Asuncion (604-697-6149, [email protected])
COMMODITIES
Precious and Base Metals Performance: October 29 to November 12, 2007
Poor base metals performance amplified in base metals-focused equities Softening metal prices during the period of October 29 to November 12, 2007, were reflected in the poor performance of metals-focused equities. Weakness in copper and zinc during the period was reflected in poorly performing base metals-focused equities and a corresponding 11% drop in Haywood’s Junior Base Metals Index (HJBI), despite strength in nickel. However, base metals still remain significantly higher than historic averages—representing a 118% increase in the average base metals price since January 1, 2005.
Despite strong performances from gold and silver, precious metals-focused equities, as reflected by Haywood’s Junior Precious Index (HJPI), lost ground. The HJPI closed 47 points or 7% down for the period.
Precious and base metals price performance since January 1, 2005, has been robust. While all metals have registered significant gains, base metals still dominate precious in their relative price performance—118% for base metals, versus 98% for precious metals. This outcome is in stark contrast to the equity performance of the two groups, with precious metals focused-equities exceeding their base metals-focused counterparts by 192%.
29-Oct-07 12-Nov-07 % Change 29-Oct-07 12-Nov-07 % ChangeCopper (US$/lb) $3.94 $3.49 -11% Silver (US$/oz) $14.24 $15.47 9%
242 215 -11% 209 228 9%Nickel (US$/lb) $15.70 $16.72 6% Gold (US$/oz) $785.20 $832.00 6%
207 220 6% 179 190 6%Zinc (US$/lb) $1.44 $1.37 -5% Platinum (US$/oz) $1,458.00 $1,433.00 -2%
230 219 -5% 169 167 -2%Av. Base Metals 226 218 -4% Palladium (US$/oz) $373.00 $373.00 0%HJBI 544 484 -11% 201 201 0%HJBI / Av. Base Metals 2.4 2.2 Av. Precious Metals 193 198 3%
HJPI 723 676 -7%HJPI / Av. Precious Metals 3.7 3.4
1-Jan-05 12-Nov-07 % Change 1-Jan-05 12-Nov-07 % ChangeCopper (US$/lb) $1.63 $3.49 115% Silver (US$/oz) $6.80 $15.47 128%
100 215 115% 100 228 128%Nickel (US$/lb) $7.60 $16.72 120% Gold (US$/oz) $437.99 $832.00 90%
100 220 120% 100 190 90%Zinc (US$/lb) $0.63 $1.37 119% Platinum (US$/oz) $860.25 $1,433.00 67%
100 219 119% 100 167 67%Av. Base Metals 100 218 118% Palladium (US$/oz) $186.00 $373.00 101%HJBI 100 484 384% 100 201 101%HJBI / Av. Base Metals 1.0 2.2 Av. Precious Metals 100 198 98%
HJPI 100 676 576%HJPI / Av. Precious Metals 1.0 3.4
Base Metals Performance Precious Metals Performance
A simple ratio comparison of the relative performance of precious and base metals-focused equities to the underlying metals prices also reveals notable differences between the two groups. The 98% average precious metals price performance since January 1, 2005, compares with a 576% gain for the precious metals equity group (HJPI)—implying a 3.4:1 equity performance
Metal Price Performance Since January 1, 2005
0%
20%
40%
60%
80%
100%
120%
140%
Silv
er(U
S$/o
z)
Nic
kel
(US$
/lb)
Zinc
(US$
/lb)
Cop
per
(US$
/lb)
Palla
dium
(US$
/oz)
Gol
d(U
S$/o
z)
Plat
inum
(US$
/oz)
% C
hang
e
Metal Price Performance From Oct 1 - Oct 15, 2007
-15%
-10%
-5%
0%
5%
10%
Silv
er(U
S$/o
z)
Nic
kel
(US$
/lb)
Gol
d(U
S$/o
z)
Palla
dium
(US$
/oz)
Plat
inum
(US$
/oz)
Zinc
(US$
/lb)
Cop
per
(US$
/lb)
% C
hang
e
Equity vs. Metal Price Performance
0.000.501.001.502.002.503.003.504.00
1-Ja
n-05
1-M
ay-0
5
1-Se
p-05
1-Ja
n-06
1-M
ay-0
6
1-Se
p-06
1-Ja
n-07
1-M
ay-0
7
1-Se
p-07
Perfo
rman
ce (B
ase:
100)
Precious Metals: Equities / PriceBase Metals: Equities / Price
Equity vs. Metal Price Performance
0.000.501.001.502.002.503.003.504.004.50
13-N
ov-0
6
13-J
an-0
7
13-M
ar-0
7
13-M
ay-0
7
13-J
ul-0
7
13-S
ep-0
7
13-N
ov-0
7
Per
form
ance
(Bas
e:10
0)
Precious Metals: Equities / PriceBase Metals: Equities / Price
Equity vs. Metal Price Performance
0.000.501.001.502.002.503.003.504.004.50
29-O
ct-0
7
31-O
ct-0
7
2-N
ov-0
7
4-N
ov-0
7
6-N
ov-0
7
8-N
ov-0
7
10-N
ov-0
7
12-N
ov-0
7
Perfo
rman
ce (B
ase:
100)
Precious Metals: Equities / PriceBase Metals: Equities / Price
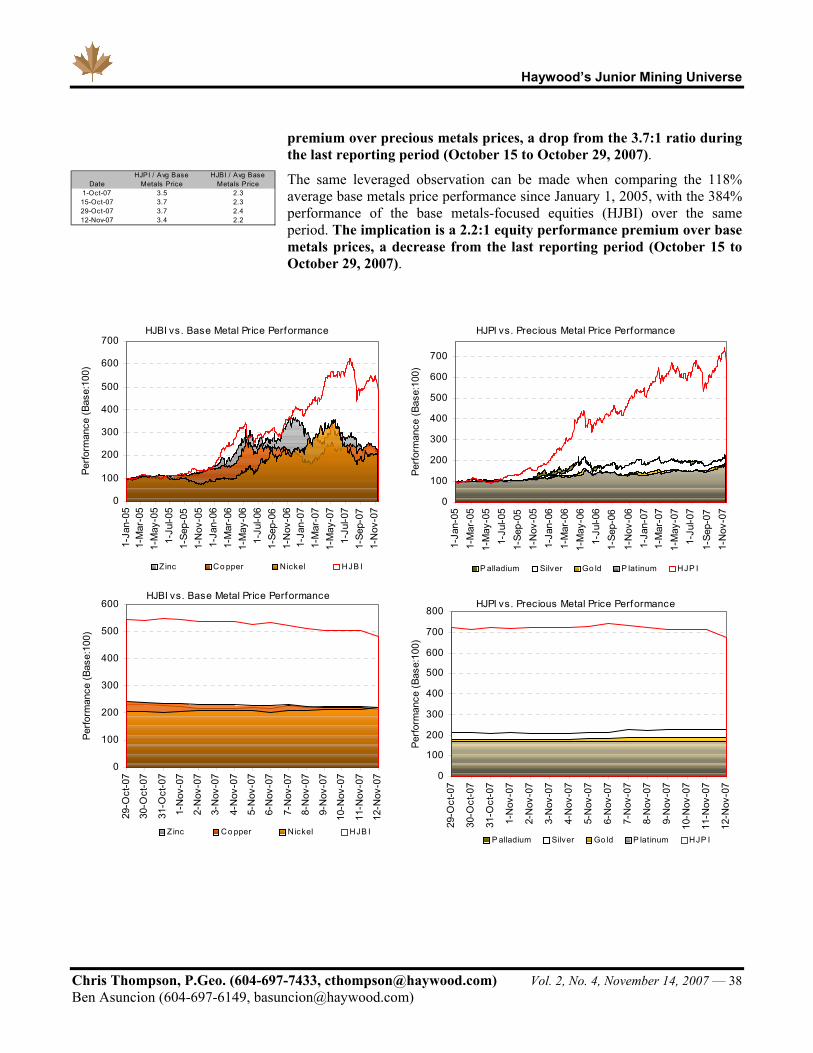
Haywood’s Junior Mining Universe
Chris Thompson, P.Geo. (604-697-7433, [email protected]) Vol. 2, No. 4, November 14, 2007 — 38 Ben Asuncion (604-697-6149, [email protected])
premium over precious metals prices, a drop from the 3.7:1 ratio during the last reporting period (October 15 to October 29, 2007).
The same leveraged observation can be made when comparing the 118% average base metals price performance since January 1, 2005, with the 384% performance of the base metals-focused equities (HJBI) over the same period. The implication is a 2.2:1 equity performance premium over base metals prices, a decrease from the last reporting period (October 15 to October 29, 2007).
HJBI vs. Base Metal Price Performance
0
100
200
300
400
500
600
700
1-Ja
n-05
1-M
ar-0
51-
May
-05
1-Ju
l-05
1-Se
p-05
1-N
ov-0
51-
Jan-
061-
Mar
-06
1-M
ay-0
61-
Jul-0
61-
Sep-
061-
Nov
-06
1-Ja
n-07
1-M
ar-0
71-
May
-07
1-Ju
l-07
1-Se
p-07
1-N
ov-0
7
Perfo
rman
ce (B
ase:
100)
Z inc Co pper Nickel HJB I
HJPI vs. Precious Metal Price Performance
0
100
200
300
400
500
600
700
1-Ja
n-05
1-M
ar-0
51-
May
-05
1-Ju
l-05
1-Se
p-05
1-N
ov-0
51-
Jan-
061-
Mar
-06
1-M
ay-0
61-
Jul-0
61-
Sep-
06
1-N
ov-0
61-
Jan-
071-
Mar
-07
1-M
ay-0
71-
Jul-0
7
1-Se
p-07
1-N
ov-0
7
Perfo
rman
ce (B
ase:
100)
P alladium Silver Go ld P latinum HJP I
HJBI vs. Base Metal Price Performance
0
100
200
300
400
500
600
29-O
ct-0
7
30-O
ct-0
7
31-O
ct-0
7
1-N
ov-0
7
2-N
ov-0
7
3-N
ov-0
7
4-N
ov-0
7
5-N
ov-0
7
6-N
ov-0
7
7-N
ov-0
7
8-N
ov-0
7
9-N
ov-0
7
10-N
ov-0
7
11-N
ov-0
7
12-N
ov-0
7
Perfo
rman
ce (B
ase:
100)
Z inc Co pper Nickel HJB I
HJPI vs. Precious Metal Price Performance
0
100
200
300
400
500
600
700
800
29-O
ct-0
7
30-O
ct-0
7
31-O
ct-0
7
1-N
ov-0
7
2-N
ov-0
7
3-N
ov-0
7
4-N
ov-0
7
5-N
ov-0
7
6-N
ov-0
7
7-N
ov-0
7
8-N
ov-0
7
9-N
ov-0
7
10-N
ov-0
7
11-N
ov-0
7
12-N
ov-0
7
Perfo
rman
ce (B
ase:
100)
P alladium Silver Go ld P latinum HJP I
12-Nov-07 3.4 2.2
HJPI / Avg Base Metals Price
HJBI / Avg Base Metals Price Date
1-Oct-0715-Oct-0729-Oct-07
3.53.73.7
2.32.32.4
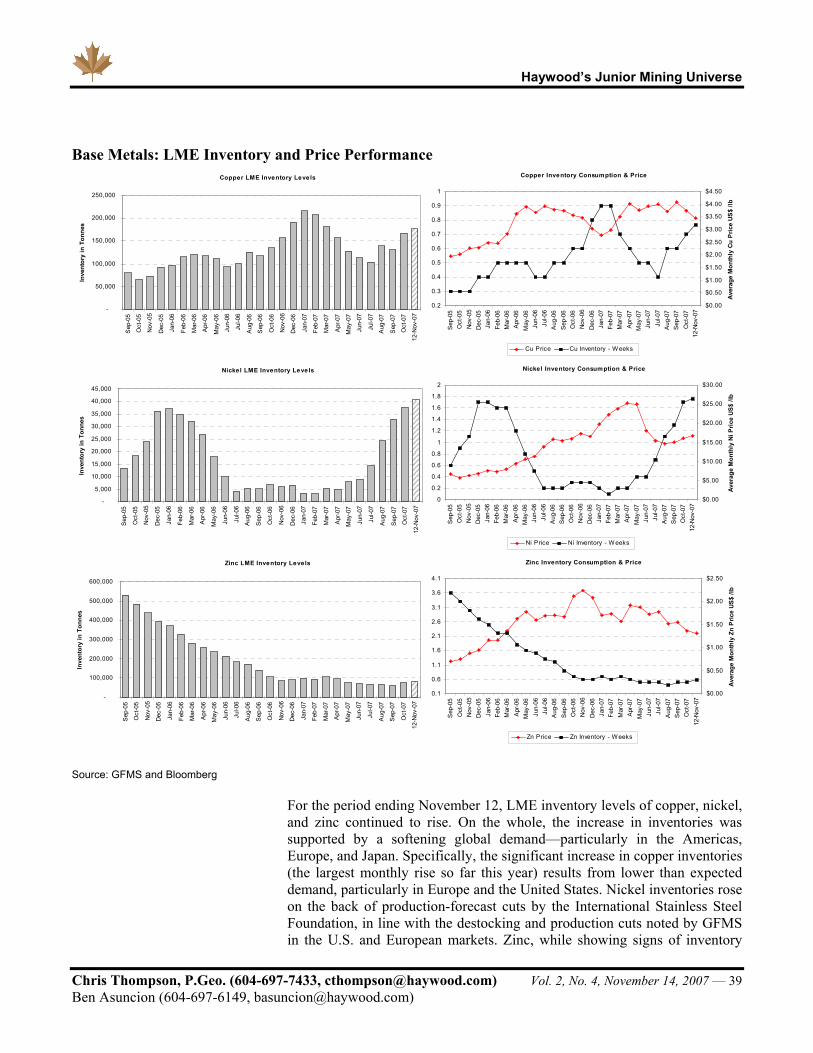
Haywood’s Junior Mining Universe
Chris Thompson, P.Geo. (604-697-7433, [email protected]) Vol. 2, No. 4, November 14, 2007 — 39 Ben Asuncion (604-697-6149, [email protected])
Base Metals: LME Inventory and Price Performance Copper LME Inventory Levels
Nickel LME Inventory Levels
Zinc LME Inventory Levels
-
5,000
10,000
15,000
20,000
25,000
30,000
35,000
40,000
45,000
Sep
-05
Oct
-05
Nov
-05
Dec
-05
Jan-
06
Feb-
06
Mar
-06
Apr
-06
May
-06
Jun-
06
Jul-0
6
Aug
-06
Sep
-06
Oct
-06
Nov
-06
Dec
-06
Jan-
07
Feb-
07
Mar
-07
Apr
-07
May
-07
Jun-
07
Jul-0
7
Aug
-07
Sep
-07
Oct
-07
12-N
ov-0
7
Inve
ntor
y in
Ton
nes
-
100,000
200,000
300,000
400,000
500,000
600,000
Sep
-05
Oct
-05
Nov
-05
Dec
-05
Jan-
06
Feb-
06
Mar
-06
Apr
-06
May
-06
Jun-
06
Jul-0
6
Aug
-06
Sep
-06
Oct
-06
Nov
-06
Dec
-06
Jan-
07
Feb-
07
Mar
-07
Apr
-07
May
-07
Jun-
07
Jul-0
7
Aug
-07
Sep
-07
Oct
-07
12-N
ov-0
7
Inve
ntor
y in
Ton
nes
-
50,000
100,000
150,000
200,000
250,000
Sep
-05
Oct
-05
Nov
-05
Dec
-05
Jan-
06
Feb-
06
Mar
-06
Apr
-06
May
-06
Jun-
06
Jul-0
6
Aug
-06
Sep
-06
Oct
-06
Nov
-06
Dec
-06
Jan-
07
Feb-
07
Mar
-07
Apr
-07
May
-07
Jun-
07
Jul-0
7
Aug
-07
Sep
-07
Oct
-07
12-N
ov-0
7
Inve
ntor
y in
Ton
nes
.
Copper Inventory Consumption & Price
Nickel Inventory Consumption & Price
Zinc Inventory Consumption & Price
0.2
0.3
0.4
0.5
0.6
0.7
0.8
0.9
1
Sep
-05
Oct
-05
Nov
-05
Dec
-05
Jan-
06Fe
b-06
Mar
-06
Apr
-06
May
-06
Jun-
06Ju
l-06
Aug
-06
Sep
-06
Oct
-06
Nov
-06
Dec
-06
Jan-
07Fe
b-07
Mar
-07
Apr
-07
May
-07
Jun-
07Ju
l-07
Aug
-07
Sep
-07
Oct
-07
12-N
ov-0
7
$0.00
$0.50
$1.00
$1.50
$2.00
$2.50
$3.00
$3.50
$4.00
$4.50
Ave
rage
Mon
thly
Cu
Pric
e U
S$
/lb
Cu Price Cu Inventory - W eeks
0
0.2
0.4
0.6
0.8
1
1.2
1.4
1.6
1.8
2
Sep
-05
Oct
-05
Nov
-05
Dec
-05
Jan-
06Fe
b-06
Mar
-06
Apr
-06
May
-06
Jun-
06Ju
l-06
Aug
-06
Sep
-06
Oct
-06
Nov
-06
Dec
-06
Jan-
07Fe
b-07
Mar
-07
Apr
-07
May
-07
Jun-
07Ju
l-07
Aug
-07
Sep
-07
Oct
-07
12-N
ov-0
7
$0.00
$5.00
$10.00
$15.00
$20.00
$25.00
$30.00
Aver
age
Mon
thly
Ni P
rice
US$
/lb
Ni Price Ni Inventory - W eeks
0.1
0.6
1.1
1.6
2.1
2.6
3.1
3.6
4.1
Sep
-05
Oct
-05
Nov
-05
Dec
-05
Jan-
06Fe
b-06
Mar
-06
Apr
-06
May
-06
Jun-
06Ju
l-06
Aug
-06
Sep
-06
Oct
-06
Nov
-06
Dec
-06
Jan-
07Fe
b-07
Mar
-07
Apr
-07
May
-07
Jun-
07Ju
l-07
Aug
-07
Sep
-07
Oct
-07
12-N
ov-0
7$0.00
$0.50
$1.00
$1.50
$2.00
$2.50
Ave
rage
Mon
thly
Zn
Pric
e US
$ /lb
Zn Price Zn Inventory - W eeks
Source: GFMS and Bloomberg
For the period ending November 12, LME inventory levels of copper, nickel, and zinc continued to rise. On the whole, the increase in inventories was supported by a softening global demand—particularly in the Americas, Europe, and Japan. Specifically, the significant increase in copper inventories (the largest monthly rise so far this year) results from lower than expected demand, particularly in Europe and the United States. Nickel inventories rose on the back of production-forecast cuts by the International Stainless Steel Foundation, in line with the destocking and production cuts noted by GFMS in the U.S. and European markets. Zinc, while showing signs of inventory

Haywood’s Junior Mining Universe
Chris Thompson, P.Geo. (604-697-7433, [email protected]) Vol. 2, No. 4, November 14, 2007 — 40 Ben Asuncion (604-697-6149, [email protected])
growth in recent weeks, still remains at relative historical lows of approximately 0.6 weeks of concentrate in inventory.
Copper’s LME cash price declined during the period, prompted by a cut in the U.S. central bank rate. The decline, along with rising global stocks, provoked a rash of fund liquidity within the market. In spite of rising inventory levels, nickel’s LME cash price has surpassed US$16 a pound. The recent weakness in zinc prices, as noted by metals consultancy GFMS, results from the expectation that higher mine production will filter through to an increase in refined output.
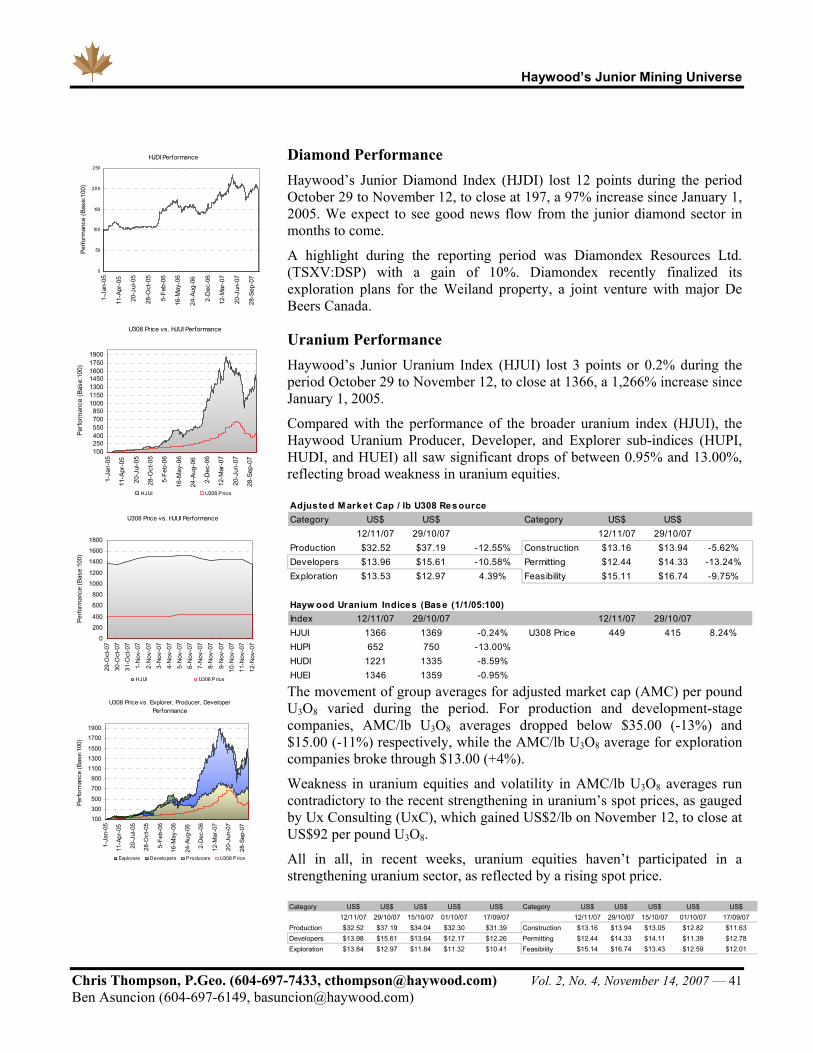
Haywood’s Junior Mining Universe
Chris Thompson, P.Geo. (604-697-7433, [email protected]) Vol. 2, No. 4, November 14, 2007 — 41 Ben Asuncion (604-697-6149, [email protected])
Diamond Performance Haywood’s Junior Diamond Index (HJDI) lost 12 points during the period October 29 to November 12, to close at 197, a 97% increase since January 1, 2005. We expect to see good news flow from the junior diamond sector in months to come.
A highlight during the reporting period was Diamondex Resources Ltd. (TSXV:DSP) with a gain of 10%. Diamondex recently finalized its exploration plans for the Weiland property, a joint venture with major De Beers Canada.
Uranium Performance Haywood’s Junior Uranium Index (HJUI) lost 3 points or 0.2% during the period October 29 to November 12, to close at 1366, a 1,266% increase since January 1, 2005.
Compared with the performance of the broader uranium index (HJUI), the Haywood Uranium Producer, Developer, and Explorer sub-indices (HUPI, HUDI, and HUEI) all saw significant drops of between 0.95% and 13.00%, reflecting broad weakness in uranium equities.
Adjusted M arke t Cap / lb U308 Res ource Category US$ US$ Category US$ US$
12/11/07 29/10/07 12/11/07 29/10/07Production $32.52 $37.19 -12.55% Construction $13.16 $13.94 -5.62%Developers $13.96 $15.61 -10.58% Permitting $12.44 $14.33 -13.24%Exploration $13.53 $12.97 4.39% Feasibility $15.11 $16.74 -9.75%
Hayw ood Uranium Indices (Base (1/1/05:100)Index 12/11/07 29/10/07 12/11/07 29/10/07HJUI 1366 1369 -0.24% U308 Price 449 415 8.24%HUPI 652 750 -13.00%HUDI 1221 1335 -8.59%HUEI 1346 1359 -0.95% The movement of group averages for adjusted market cap (AMC) per pound U3O8 varied during the period. For production and development-stage companies, AMC/lb U3O8 averages dropped below $35.00 (-13%) and $15.00 (-11%) respectively, while the AMC/lb U3O8 average for exploration companies broke through $13.00 (+4%).
Weakness in uranium equities and volatility in AMC/lb U3O8 averages run contradictory to the recent strengthening in uranium’s spot prices, as gauged by Ux Consulting (UxC), which gained US$2/lb on November 12, to close at US$92 per pound U3O8.
All in all, in recent weeks, uranium equities haven’t participated in a strengthening uranium sector, as reflected by a rising spot price. Category US$ US$ US$ US$ US$ Category US$ US$ US$ US$ US$
12/11/07 29/10/07 15/10/07 01/10/07 17/09/07 12/11/07 29/10/07 15/10/07 01/10/07 17/09/07Production $32.52 $37.19 $34.04 $32.30 $31.39 Construction $13.16 $13.94 $13.05 $12.82 $11.63Developers $13.98 $15.61 $13.64 $12.17 $12.26 Permitting $12.44 $14.33 $14.11 $11.39 $12.78Exploration $13.84 $12.97 $11.84 $11.32 $10.41 Feasibility $15.14 $16.74 $13.43 $12.59 $12.01
HJDI Performance
0
50
100
150
200
250
1-Ja
n-05
11-A
pr-0
5
20-J
ul-0
5
28-O
ct-0
5
5-Fe
b-06
16-M
ay-0
6
24-A
ug-0
6
2-D
ec-0
6
12-M
ar-0
7
20-J
un-0
7
28-S
ep-0
7
Perfo
rman
ce (B
ase:
100)
U308 Price vs. HJUI Performance
100250400550700850
1000115013001450160017501900
1-Ja
n-05
11-A
pr-0
5
20-J
ul-0
5
28-O
ct-0
5
5-Fe
b-06
16-M
ay-0
6
24-A
ug-0
6
2-D
ec-0
6
12-M
ar-0
7
20-J
un-0
7
28-S
ep-0
7
Perfo
rman
ce (B
ase:
100)
HJUI U308 Price
U308 Price vs. HJUI Performance
0
200
400
600
800
1000
1200
1400
1600
1800
29-O
ct-0
730
-Oct
-07
31-O
ct-0
71-
Nov
-07
2-N
ov-0
73-
Nov
-07
4-N
ov-0
75-
Nov
-07
6-N
ov-0
77-
Nov
-07
8-N
ov-0
7
9-N
ov-0
710
-Nov
-07
11-N
ov-0
712
-Nov
-07
Perfo
rman
ce (B
ase:
100)
HJUI U308 Price
U308 Price vs. Explorer, Producer, Developer Performance
100300500
700900
110013001500
17001900
1-Ja
n-05
11-A
pr-0
5
20-J
ul-0
5
28-O
ct-0
5
5-Fe
b-06
16-M
ay-0
6
24-A
ug-0
6
2-D
ec-0
6
12-M
ar-0
7
20-J
un-0
7
28-S
ep-0
7
Perfo
rman
ce (B
ase:
100)
Explorers Developers Producers U308 Price

Haywood’s Junior Mining Universe
Chris Thompson, P.Geo. (604-697-7433, [email protected]) Vol. 2, No. 4, November 14, 2007 — 42 Ben Asuncion (604-697-6149, [email protected])
Group Averages Production $32.52 $13.16 Exploration $13.53
$12.44 $15.11
$13.96Company Ticker $AM C lb U308 $AM C/lb 12/11/07 29/10/07 %
(US$) (M ) U308
Uranium Participation Corp. TSX:U - $707 7.1 $99.26 $11.49 $13.20 -12.95%
A reva SA FP:CEI P roduction $41,145 660.1 $62.33 $1,045.68 $1,053.44 -0.74%
Denison M ines Corp. TSX:DM L Production $1,847 61.7 $29.95 $10.37 $13.33 -22.21%
Cameco Co rp. TSX:CCO Production $15,312 807.1 $18.97 $41.63 $49.20 -15.39%
Energy Resources o f Australia LtdASX:ERA Production $3,694 640.4 $5.77 $18.71 $19.29 -3.04%
Uranium One Inc. TSX:SXR Production $3,971 694.4 $5.72 $8.47 $12.95 -34.59%
Uranium Resources, Inc. OTCBB:URRE Production $631 111.7 $5.65 $11.93 $12.00 -0.58%
Heathgate Resources P roduction $0 39.2 $0.00
$32.52
P aladin Resources Ltd. TSX:PDN Construction $3,532 268.4 $13.16 $6.69 $7.10 -5.77%
$13.16
Energy Fuels Inc. TSX-V:EFR Permitting $60 1.5 $40.92 $1.77 $1.94 -8.76%
UR-Energy Inc. TSX:URE Permitting $266 72.1 $3.69 $3.75 $3.76 -0.27%
Uranium Power Corp. TSX-V:UPC Permitting $53 15.6 $3.38 $0.53 $0.73 -27.40%
Strathmore M inerals Co rp. TSX-V:STM Permitting $210 120.2 $1.75 $2.82 $2.86 -1.40%
$12.44
UEX Corp. TSX:UEX Feasibility $1,394 24.2 $57.56 $7.74 $8.76 -11.64%
Summit Resources Ltd. ASX:SM M Feasibility $586 38.7 $15.13 $2.74 $2.71 1.05%
Laramide Resources Ltd. TSX:LAM Feasibility $462 61.7 $7.48 $7.84 $9.25 -15.24%
B annerman Resources Limited ASX:BM N Feasibility $188 26.6 $7.09 $2.93 $2.85 2.92%
Forsys M etals Co rp. TSX:FSY Feasibility $257 93.1 $2.76 $4.03 $4.68 -13.89%
Khan Resources Inc. TSX:KRI Feasibility $99 38.7 $2.56 $2.43 $2.74 -11.31%
P ele M ountain Resources Inc. CDNX:GEM Feasibility $35 42.5 $0.82 $0.53 $0.57 -7.02%
Western P rospector Group Ltd. TSX-V:WNP Feasibility $37 45.4 $0.82 $1.65 $2.04 -19.12%
$15.11
Xemplar Energy Co rp. TSX-V:XE Adv Explo ration $565 5.3 $106.73 $5.17 $4.10 26.10%
CanA laska Uranium Ltd. TSX-V:CVV Adv Explo ration $48 0.5 $98.32 $0.49 $0.45 8.89%
Strateco Resources Inc. TSX-V:RSC Adv Explo ration $338 4.1 $82.47 $2.97 $2.78 6.83%
P rime M inerals Ltd. ASX:P IM Adv Explo ration $21 0.4 $56.00 $0.66 $0.62 7.70%
Yamiri Go ld and Energy, Inc. TSX-V:YGI Adv Explo ration $15 0.3 $49.02 $0.26 $0.21 23.81%
Target Exploration & M ining Co rp. TSX-V:TEM Adv Explo ration $8 0.3 $27.11 $0.71 $0.68 4.41%
Crosshair Explo ration & M ining CoTSX-V:CXX Adv Explo ration $171 7.8 $22.04 $2.46 $2.27 8.37%
Toro Energy, Ltd. ASX:TOE Adv Explo ration $253 12.3 $20.58 $0.53 $0.63 -16.77%
RPT Uranium Corp. TSX-V:RPT Adv Explo ration $19 1.0 $19.03 $0.33 $0.28 17.86%
B ayswater Uranium Corp. TSX-V:BAY Adv Explo ration $125 7.1 $17.68 $0.99 $1.20 -17.50%
Forum Uranium Corp. TSX-V:FDC Adv Explo ration $22 1.3 $16.65 $0.51 $0.43 18.60%
P itchstone Explo ration Ltd. TSX-V:PXP Adv Explo ration $68 4.1 $16.49 $2.55 $2.84 -10.21%
El Nino Ventures Inc. TSX-V:ELN Adv Explo ration $21 1.6 $13.25 $1.08 $1.27 -14.96% M ega Uranium Ltd. TSX:M GA Adv Explo ration $763 69.7 $10.95 $4.30 $5.05 -14.85%
Triex M inerals Co rp. TSX-V:TXM Adv Explo ration $44 4.1 $10.76 $3.16 $3.45 -8.41%
A uro ra Energy Resources Inc. TSX:AXU Adv Explo ration $1,004 95.9 $10.47 $15.50 $16.37 -5.31%
Nova Energy Limited ASX:NEL Adv Explo ration $173 19.8 $8.71 $2.88 $3.17 -8.98%
Energy M etals Limited ASX:EM E Adv Explo ration $113 13.8 $8.14 $3.89 $3.74 4.16%
Uranium King Limited ASX:UKL Adv Explo ration $44 6.1 $7.18 $0.55 $0.55 0.52%
Deep Yellow Ltd. ASX:DYL Adv Explo ration $379 52.9 $7.16 $0.35 $0.40 -11.94%
P epinnini M inerals Limited ASX:PNN Adv Explo ration $35 5.9 $5.89 $0.96 $0.95 0.68%
P owertech Uranium Corp. TSX:PWE Adv Explo ration $100 17.2 $5.83 $2.18 $2.42 -9.92%
A lliance Resources Ltd. ASX:AGS Adv Explo ration $400 73.5 $5.44 $1.43 $1.27 12.76%
Uranex NL ASX:UNX Adv Explo ration $71 13.2 $5.39 $1.00 $1.00 0.49%
M arathon Resources Limited ASX:M TN Adv Explo ration $141 26.9 $5.26 $2.28 $2.23 2.38%
A ldersho t Resources Ltd. TSX-V:ALZ Adv Explo ration $11 2.1 $5.10 $0.18 $0.18 -2.78% M ax Resource Co rp. TSX-V:M XR Adv Explo ration $15 3.1 $5.00 $0.71 $0.97 -26.80%
Uranium Energy Co rp. AM EX:UEC Adv Explo ration $170 38.0 $4.47 $4.63 $3.71 24.76%
Trigon Uranium Corp. TSX-V:TEL Adv Explo ration $18 4.1 $4.42 $0.35 $0.47 -25.53%
Tournigan Go ld Co rp. TSX-V:TVC Adv Explo ration $207 55.8 $3.72 $1.96 $2.31 -15.15%
B oss Power Co rp. TSX-V:BPU Adv Explo ration $38 10.4 $3.63 $0.56 $0.60 -6.67%
Ursa M ajo r International Inc. TSX:UM J Adv Explo ration $20 6.0 $3.31 $0.61 $0.75 -18.67%
Western Uranium Corpo ration TSX-V:WUC Adv Explo ration $95 31.0 $3.05 $2.46 $2.35 4.68% U308 Limited ASX:UTO Adv Explo ration $25 10.5 $2.43 $0.40 $0.45 -10.85% M awson Resources Ltd. TSX-V:M AW Adv Explo ration $36 20.3 $1.79 $1.53 $1.54 -0.65% Rodinia M inerals Inc. TSX-V:RM Adv Explo ration $8 5.5 $1.36 $0.52 $0.60 -13.33%
Glen Hawk M inerals Ltd. TSX-V:GHM Adv Explo ration $1 1.6 $0.90 $0.08 $0.08 6.67%
Fission Energy Co rp. TSX-V:FIS Adv Explo ration $20 25.3 $0.77 $0.80 $0.76 5.26%
B luerock Resources Ltd. TSX-V:BRD Adv Explo ration $24 33.1 $0.74 $0.71 $0.65 9.23%
M agnum Uranium Corp. TSX-V:M M Adv Explo ration $4 7.5 $0.57 $0.44 $0.45 -3.33%
$13.53
No te: Used to determine group average
$AMC/lb U308
Construction
Perm ittingFeasibility
Developers
October 29 to November 12
Adv
Exp
lora
tion
Per
mitt
ing
Feas
ibili
ty
Group Average
Share Price Performance
Group Average
Group Average
Group Average
Group Average
Pro
duct
ion
-75%
-50%
-25%
0% 25%
50%
75%
FP:CEI
TSX:DM L
TSX:CCO
ASX:ERA
TSX:SXR
OTCBB:URRE
TSX:PDN
TSX-V:EFR
TSX:URE
TSX-V:UPC
TSX-V:STM
TSX:UEX
ASX:SM M
TSX:LAM
ASX:BM N
TSX:FSY
TSX:KRI
CDNX:GEM
TSX-V:XE
TSX-V:CVV
TSX-V:RSC
ASX:PIM
TSX-V:YGI
TSX-V:TEM
TSX-V:CXX
ASX:TOE
TSX-V:RPT
TSX-V:BAY
TSX-V:FDC
TSX-V:PXP
TSX-V:ELN
TSX:M GA
TSX-V:TXM
TSX:AXU
ASX:NEL
ASX:EM E
ASX:UKL
ASX:DYL
ASX:PNN
TSX:PWE
ASX:AGS
ASX:UNX
ASX:M TN
TSX-V:ALZ
TSX-V:M XR
AM EX:UEC
TSX-V:TEL
TSX-V:TVC
TSX-V:BPU
TSX:UM J
TSX-V:WUC
ASX:UTO
TSX-V:M AW
TSX-V:RM
TSX-V:GHM
TSX-V:FIS
TSX-V:BRD
TSX-V:M M
$0 $20
$40
$60
$80
$100
$120
FP :CEI
TSX:DM L
TSX:CCO
ASX:ERA
TSX:SXR
OTCBB:URRE
TSX:PDN
TSX-V:EFR
TSX:URE
TSX-V:UPC
TSX-V:STM
TSX:UEX
ASX:SM M
TSX:LAM
ASX:B M N
TSX:FSY
TSX:KRI
CDNX:GEM
TSX-V:WNP
TSX-V:XE
TSX-V:CVV
TSX-V:RSC
ASX:P IM
TSX-V:YGI
TSX-V:TEM
TSX-V:CXX
ASX:TOE
TSX-V:RPT
TSX-V:B AY
TSX-V:FDC
TSX-V:P XP
TSX-V:ELN
TSX:M GA
TSX-V:TXM
TSX:AXU
ASX:NEL
ASX:EM E
ASX:UKL
ASX:DYL
ASX:PNN
TSX:PWE
ASX:A GS
ASX:UNX
ASX:M TN
TSX-V:ALZ
TSX-V:M XR
AM EX:UEC
TSX-V:TEL
TSX-V:TVC
TSX-V:B PU
TSX:UM J
TSX-V:WUC
ASX:UTO
TSX-V:M AW
TSX-V:RM
TSX-V:GHM
TSX-V:FIS
TSX-V:BRD
TSX-V:M M
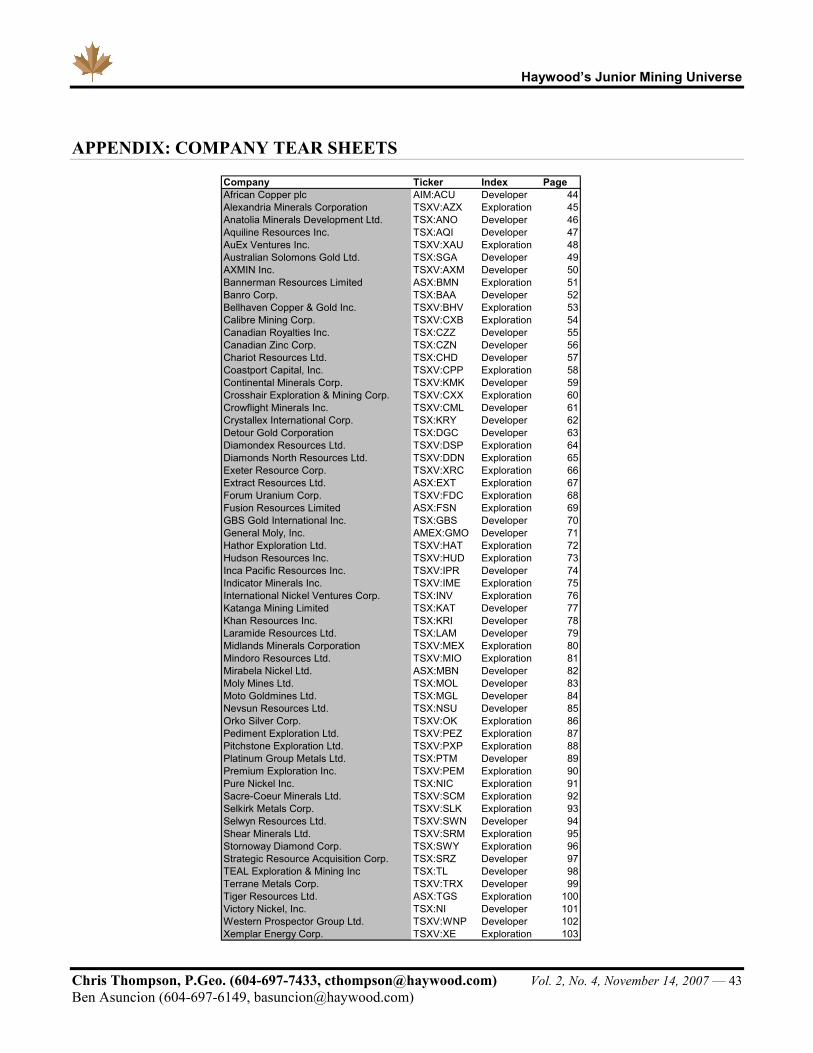
Haywood’s Junior Mining Universe
Chris Thompson, P.Geo. (604-697-7433, [email protected]) Vol. 2, No. 4, November 14, 2007 — 43 Ben Asuncion (604-697-6149, [email protected])
APPENDIX: COMPANY TEAR SHEETS
Company Ticker Index PageAfrican Copper plc AIM:ACU Developer 44Alexandria Minerals Corporation TSXV:AZX Exploration 45Anatolia Minerals Development Ltd. TSX:ANO Developer 46Aquiline Resources Inc. TSX:AQI Developer 47AuEx Ventures Inc. TSXV:XAU Exploration 48Australian Solomons Gold Ltd. TSX:SGA Developer 49AXMIN Inc. TSXV:AXM Developer 50Bannerman Resources Limited ASX:BMN Exploration 51Banro Corp. TSX:BAA Developer 52Bellhaven Copper & Gold Inc. TSXV:BHV Exploration 53Calibre Mining Corp. TSXV:CXB Exploration 54Canadian Royalties Inc. TSX:CZZ Developer 55Canadian Zinc Corp. TSX:CZN Developer 56Chariot Resources Ltd. TSX:CHD Developer 57Coastport Capital, Inc. TSXV:CPP Exploration 58Continental Minerals Corp. TSXV:KMK Developer 59Crosshair Exploration & Mining Corp. TSXV:CXX Exploration 60Crowflight Minerals Inc. TSXV:CML Developer 61Crystallex International Corp. TSX:KRY Developer 62Detour Gold Corporation TSX:DGC Developer 63Diamondex Resources Ltd. TSXV:DSP Exploration 64Diamonds North Resources Ltd. TSXV:DDN Exploration 65Exeter Resource Corp. TSXV:XRC Exploration 66Extract Resources Ltd. ASX:EXT Exploration 67Forum Uranium Corp. TSXV:FDC Exploration 68Fusion Resources Limited ASX:FSN Exploration 69GBS Gold International Inc. TSX:GBS Developer 70General Moly, Inc. AMEX:GMO Developer 71Hathor Exploration Ltd. TSXV:HAT Exploration 72Hudson Resources Inc. TSXV:HUD Exploration 73Inca Pacific Resources Inc. TSXV:IPR Developer 74Indicator Minerals Inc. TSXV:IME Exploration 75International Nickel Ventures Corp. TSX:INV Exploration 76Katanga Mining Limited TSX:KAT Developer 77Khan Resources Inc. TSX:KRI Developer 78Laramide Resources Ltd. TSX:LAM Developer 79Midlands Minerals Corporation TSXV:MEX Exploration 80Mindoro Resources Ltd. TSXV:MIO Exploration 81Mirabela Nickel Ltd. ASX:MBN Developer 82Moly Mines Ltd. TSX:MOL Developer 83Moto Goldmines Ltd. TSX:MGL Developer 84Nevsun Resources Ltd. TSX:NSU Developer 85Orko Silver Corp. TSXV:OK Exploration 86Pediment Exploration Ltd. TSXV:PEZ Exploration 87Pitchstone Exploration Ltd. TSXV:PXP Exploration 88Platinum Group Metals Ltd. TSX:PTM Developer 89Premium Exploration Inc. TSXV:PEM Exploration 90Pure Nickel Inc. TSX:NIC Exploration 91Sacre-Coeur Minerals Ltd. TSXV:SCM Exploration 92Selkirk Metals Corp. TSXV:SLK Exploration 93Selwyn Resources Ltd. TSXV:SWN Developer 94Shear Minerals Ltd. TSXV:SRM Exploration 95Stornoway Diamond Corp. TSX:SWY Exploration 96Strategic Resource Acquisition Corp. TSX:SRZ Developer 97TEAL Exploration & Mining Inc TSX:TL Developer 98Terrane Metals Corp. TSXV:TRX Developer 99Tiger Resources Ltd. ASX:TGS Exploration 100Victory Nickel, Inc. TSX:NI Developer 101Western Prospector Group Ltd. TSXV:WNP Developer 102Xemplar Energy Corp. TSXV:XE Exploration 103

Haywood’s Junior Mining Universe
Chris Thompson, P.Geo. (604-697-7433, [email protected]) Vol. 2, No. 4, November 14, 2007 — 44 Ben Asuncion (604-697-6149, [email protected])
Target Price, C$ N/A Shares O/S, million
Current Price, C$ $1.70 Shares F/D, million
Rating: N/A 52-Week High, C$ $2.23 Market Capitalization, C$M
Target Price: N/A 52-Week Low, C$ $1.25 Company CEO
TSX:ACU Average Daily Vol (M) 0.03 Company Web Site
Investment Highlights Haywood Developer Index (base=100) Date Added:
Performance at Oct Jan 01/05 100 Performance at Nov 11/07 438
Share Capital Dilution
Number Price
Warrants 0.0M -
Options 11.7M C$1.56
Warrants + Options 11.7M C$1.56
Recent Financing
News Flow / Catalysts
Mowana Mine: Major Shareholders
- Underground access & development plan expected by the end of 2007 O/S (%) F/D (%)
- Revised mine plan & capex estimates for construction of DMS & SX/EW plants expected by the end of 2007 Geologic Resource Partners LLC 9% 9%
- Completion of site construction activities by end of 2007 Goldman Sachs & Company, Inc. 9% 9%
- Commencement of copper production by end of Q1/07 Goldman Sachs Asset Management Intl. 9% 8%
I.A. Michael Investment Counsel, Ltd. 8% 8%
JPMorgan Asset Management U.K. 7% 6%
Other 57% 60%Balance Sheet and Capitalization Total 100% 100%
US$M C$MMarket Capitalization $228.2 $237.3 Estimated Burn RateCurrent Cash $95.3 $99.1F/D Cash Adds $18.2 $19.0 June 2007 cash & equivWorking Capital $92.9 $96.6 Mowana MineLong-term Debt $0.0 $0.0 Exploration - OtherBook Value $147.2 $153.1 Admin CostsEnterprise Value (EV) $135.2 $140.7 Financings
EV = Market Capitalization - Working Capital + Long-term Debt ITM Options / WarrantsC$/US$ FX Rate: 1.04 Year-end 2007 cash & equiv
Key PropertiesMowana Mine Thakadu
Ownership: 100% Ownership: 100%Location: Botswana Location: Botswana
Stage: Construction / Development Exploration Stage: ScopingCapex: US$61.4 million (as of June 30, 2007) Description/Potential:
Description/Potential:Current:
Current:
Tonnes Cu Grade CopperMowana Mine (100%) (000's) (%) (Mlbs)Measured & Indicated Resource 57,905 1.00% 1,276.6Inferred Resource 30,560 0.88% 592.9Total Resource 88,464 0.96% 1,869.5
African Copper plc Consensus Estimate Summary (Reuters data sourced via Capital IQ)Analysts
2007 Consensus Estimate 02008 Consensus Estimate 02009 Consensus Estimate 0
Analysts Buy Rating Hold Rating Sell Rating Mean Target High LowConsensus Valuation 0 - - - - - -
Peer Group Comparables (Haywood Securities estimates)P / NAV
African Copper plc N/AAnvil Mining Itd (AVM-T) N/AFirst Quantum Minerals Ltd. (FM-T) N/AKatanga Mining Ltd. (KAT-T) N/APeer Group Average NA
$0.00$1.05
$1.63$0.68$0.13$0.67
Mowana, formerlly named the Dukwe Mining Project, is located in Botswana. Currently, the Company is constructing a 1 Mtpa concentrator and is targeting initial copper production by Q1/2008. Average annual production is estimated at 20,000 tonnes per year of copper contained in concentrates over a 6 to 8 year mine life from the open-pit followed by a projected 15-20 year underground mine life from sulphides.
US$0.00US$0.00
Mean NAVUS$0.00
May 9, 2006 - C$120 million equity issue (75M shares @ C$1.60)
Advanced stage copper-silver exploration project.
C$14.15C$88.66
C$1.70Mrkt Cap
C$1,082C$6,362
11.8
C$16.52
79.1
11.8
9.6
Price NAV Consensus Est
LowUS$0.00US$0.00US$0.00
$0.00
$0.14
$1.10
December 2014 - November 2016
90.8
US$18.2M
June 26, 2007 - C$15.9 million private placement (8.37M shares @ C$1.89)
O/S (millions) F/D (millions)
13.2
US$18.2M
African Copper plc (TSX:ACU)
US$ / O/S Share C$ / O/S Share
- African Copper PLC engages in the exploration and development of copper deposits in the Republic of Botswana. - The Company is currently developing the Dukwe project located in northeastern Botswana, north west of the City of Francistown- The Company also owns a 100% interst in the Matsitama project covering approximately 4,000 sq. km located in north eastern Botswana. - The company was incorporated in February 2004 under the name Afrinewco PLC and changed its name to African Copper PLC in March 2004.- Construction at Dukwe, now called the Mowana Mine, is already underway and production is expected to commence by the end of Q1/2008 with copper production targeted to reach 20,000 tonnes annually.
$0.71
$0.69
13.1
13.2
$1.70
9.6
139.6
151.3
-
$237.3
October 29, 2007
Joseph Hamilton
www.africancopper.com
ExpiryProceeds
US$0.0M
US$0.00US$0.00
US$0.00
C$237
C$1,340
$0.00$0.00
$0.00
$0.00
High
(C$)(M)C$99.12
(C$35.00)(C$5.00)
Exploration Timetable
The Company is proceeding with open-pit optimisation studies at Mowana in preparation for exploitation studies. Open-pit studies will test the possibility of integrating Thakadu into the Mowana mine plane. Current resources at Thakadu total 4.72 million tonnes grading 1.72% copper in the Indicated category and 0.96 million tonnes grading 1.29% copper.
Currently in construction with first copper production is expected by Q1/2008. Annual copper production is expected to be 20,000 tonnes once at full production.
n/aC$0.00
C$18.25$0.97
C$77.37
$1.01
151.3139.6
13.1
12.8 12.8
$0.00
$0.50
$1.00
$1.50
$2.00
$2.50
$3.00
$3.50
$4.00
$4.50
11/1
3/20
06
12/2
7/20
06
02/0
9/20
07
03/2
7/20
07
05/1
1/20
07
06/2
5/20
07
08/0
8/20
07
09/2
0/20
07
11/0
2/20
07
0.0
0.5
1.0
1.5
2.0
1
Vol (
M)
50 Day MA100 Day MA
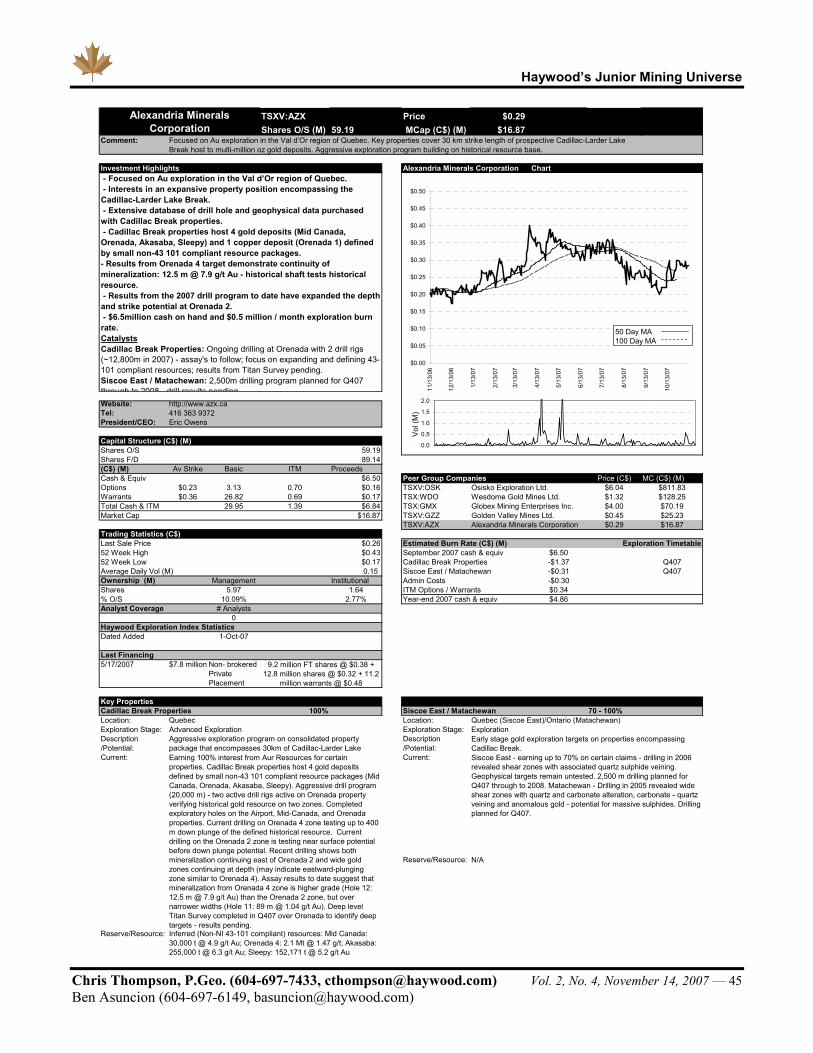
Haywood’s Junior Mining Universe
Chris Thompson, P.Geo. (604-697-7433, [email protected]) Vol. 2, No. 4, November 14, 2007 — 45 Ben Asuncion (604-697-6149, [email protected])
TSXV:AZX Price $0.29 Shares O/S (M) 59.19 MCap (C$) (M) $16.87
Comment:
11/12/2007Investment Highlights Alexandria Minerals Corporation Chart
39,399
Website: http://www.azx.caTel:President/CEO:
Capital Structure (C$) (M)Shares O/S 59.19Shares F/D 89.14(C$) (M) Av Strike Basic ITM ProceedsCash & Equiv $6.50 Peer Group Companies Price (C$) MC (C$) (M)Options $0.23 3.13 0.70 $0.16 TSXV:OSK $6.04 $811.83Warrants $0.36 26.82 0.69 $0.17 TSX:WDO $1.32 $128.25Total Cash & ITM 29.95 1.39 $6.84 TSX:GMX $4.00 $70.19Market Cap $16.87 TSXV:GZZ $0.45 $25.23
TSXV:AZX $0.29 $16.87Trading Statistics (C$) Last Sale Price $0.26 Estimated Burn Rate (C$) (M)52 Week High $0.43 September 2007 cash & equiv $6.50 52 Week Low $0.17 Cadillac Break Properties -$1.37 Q407Average Daily Vol (M) 0.15 Siscoe East / Matachewan -$0.31 Q407Ownership (M) Management Institutional Admin Costs -$0.30 Shares 5.97 1.64 ITM Options / Warrants $0.34 % O/S 10.09% 2.77% Year-end 2007 cash & equiv $4.86 Analyst Coverage # Analysts
0 Haywood Exploration Index StatisticsDated Added 1-Oct-07
Last Financing5/17/2007 $7.8 million
Key PropertiesCadillac Break Properties 100% Siscoe East / MatachewanLocation: Quebec Location: Quebec (Siscoe East)/Ontario (Matachewan)Exploration Stage: Advanced Exploration Exploration Stage: ExplorationDescription Description/Potential: /Potential:Current: Current:
Reserve/Resource:
Reserve/Resource:
Alexandria Minerals Corporation
416 363 9372
- Focused on Au exploration in the Val d’Or region of Quebec. - Interests in an expansive property position encompassing the Cadillac-Larder Lake Break. - Extensive database of drill hole and geophysical data purchased with Cadillac Break properties. - Cadillac Break properties host 4 gold deposits (Mid Canada, Orenada, Akasaba, Sleepy) and 1 copper deposit (Orenada 1) defined by small non-43 101 compliant resource packages.- Results from Orenada 4 target demonstrate continuity of mineralization: 12.5 m @ 7.9 g/t Au - historical shaft tests historical resource. - Results from the 2007 drill program to date have expanded the depth and strike potential at Orenada 2. - $6.5million cash on hand and $0.5 million / month exploration burn rate.CatalystsCadillac Break Properties: Ongoing drilling at Orenada with 2 drill rigs (~12,800m in 2007) - assay's to follow; focus on expanding and defining 43-101 compliant resources; results from Titan Survey pending.Siscoe East / Matachewan: 2,500m drilling program planned for Q407 through to 2008 - drill results pending
Inferred (Non-NI 43-101 compliant) resources: Mid Canada: 30,000 t @ 4.9 g/t Au; Orenada 4: 2.1 Mt @ 1.47 g/t; Akasaba: 255,000 t @ 6.3 g/t Au; Sleepy: 152,171 t @ 5.2 g/t Au
Osisko Exploration Ltd.
Earning 100% interest from Aur Resources for certain properties. Cadillac Break properties host 4 gold deposits defined by small non-43 101 compliant resource packages (Mid Canada, Orenada, Akasaba, Sleepy). Aggressive drill program (20,000 m) - two active drill rigs active on Orenada property verifying historical gold resource on two zones. Completed exploratory holes on the Airport, Mid-Canada, and Orenada properties. Current drilling on Orenada 4 zone testing up to 400 m down plunge of the defined historical resource. Current drilling on the Orenada 2 zone is testing near surface potential before down plunge potential. Recent drilling shows both mineralization continuing east of Orenada 2 and wide gold zones continuing at depth (may indicate eastward-plunging zone similar to Orenada 4). Assay results to date suggest that mineralization from Orenada 4 zone is higher grade (Hole 12: 12.5 m @ 7.9 g/t Au) than the Orenada 2 zone, but over narrower widths (Hole 11: 89 m @ 1.04 g/t Au). Deep level Titan Survey completed in Q407 over Orenada to identify deep targets - results pending.
Early stage gold exploration targets on properties encompassing Cadillac Break. Siscoe East - earning up to 70% on certain claims - drilling in 2006 revealed shear zones with associated quartz sulphide veining. Geophysical targets remain untested. 2,500 m drilling planned for Q407 through to 2008. Matachewan - Drilling in 2005 revealed wide shear zones with quartz and carbonate alteration, carbonate - quartz veining and anomalous gold - potential for massive sulphides. Drilling planned for Q407.
N/A
70 - 100%
Golden Valley Mines Ltd.
9.2 million FT shares @ $0.38 + 12.8 million shares @ $0.32 + 11.2
million warrants @ $0.48
Aggressive exploration program on consolidated property package that encompasses 30km of Cadillac-Larder Lake
Globex Mining Enterprises Inc.
Focused on Au exploration in the Val d’Or region of Quebec. Key properties cover 30 km strike length of prospective Cadillac-Larder Lake Break host to multi-million oz gold deposits. Aggressive exploration program building on historical resource base.
Eric Owens
Non- brokered Private Placement
Alexandria Minerals Corporation
Exploration Timetable
Wesdome Gold Mines Ltd.
$0.00
$0.05
$0.10
$0.15
$0.20
$0.25
$0.30
$0.35
$0.40
$0.45
$0.50
11/1
3/06
12/1
3/06
1/13
/07
2/13
/07
3/13
/07
4/13
/07
5/13
/07
6/13
/07
7/13
/07
8/13
/07
9/13
/07
10/1
3/07
0.0
0.5
1.0
1.5
2.0
1
Vol
(M)
50 Day MA100 Day MA
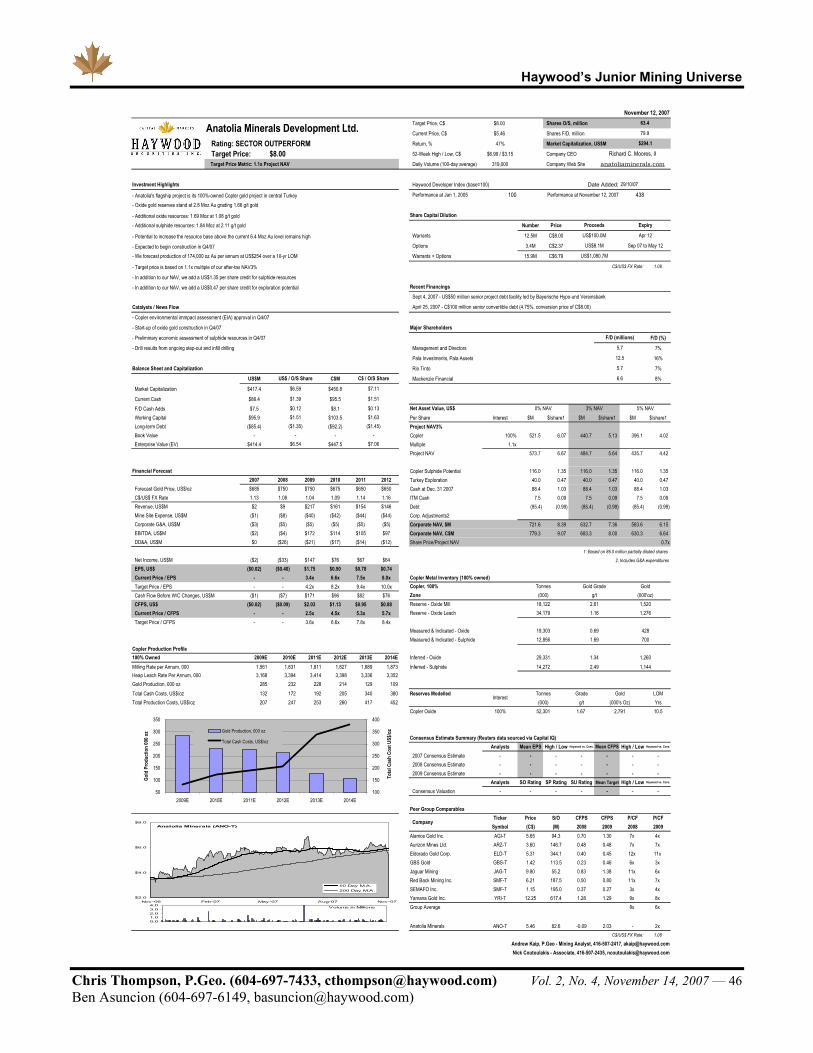
Haywood’s Junior Mining Universe
Chris Thompson, P.Geo. (604-697-7433, [email protected]) Vol. 2, No. 4, November 14, 2007 — 46 Ben Asuncion (604-697-6149, [email protected])
Target Price, C$ $8.00 Shares O/S, million
Current Price, C$ $5.46 Shares F/D, million
Rating: SECTOR OUTPERFORM Return, % 47% Market Capitalization, US$M
Target Price: $8.00 52-Week High / Low, C$ $6.99 / $3.15 Company CEO
Target Price Metric: 1.1x Project NAV Daily Volume (100-day average) 319,000 Company Web Site
Investment Highlights Haywood Developer Index (base=100) Date Added:
- Anatolia's flagship project is its 100%-owned Copler gold project in central Turkey Performance at Jan 1, 2005 100 Performance at November 12, 2007 438- Oxide gold reserves stand at 2.8 Moz Au grading 1.66 g/t gold
- Additional oxide resources: 1.69 Moz at 1.08 g/t gold Share Capital Dilution
- Additional sulphide resources: 1.84 Moz at 2.11 g/t gold Number Price
- Potential to increase the resource base above the current 6.4 Moz Au level remains high Warrants 12.5M C$8.00
- Expected to begin construction in Q4/07 Options 3.4M C$2.37
- We forecast production of 174,000 oz Au per annum at US$254 over a 10-yr LOM Warrants + Options 15.9M C$6.79
- Target price is based on 1.1x multiple of our after-tax NAV3% C$/US$ FX Rate: 1.08
- In addition to our NAV, we add a US$1.35 per share credit for sulphide resources
- In addition to our NAV, we add a US$0.47 per share credit for exploration potential Recent Financings
Catalysts / News Flow
- Copler environmental immpact assessment (EIA) approval in Q4/07
- Start-up of oxide gold construction in Q4/07 Major Shareholders
- Preliminary economic assessment of sulphide resources in Q4/07 F/D (%)
- Drill results from ongoing step-out and infill drilling Management and Directors 7%
Pala Investments, Pala Assets 16%
Balance Sheet and Capitalization Rio Tinto 7%
US$M C$M Mackenzie Financial 8%
Market Capitalization $417.4 $450.8
Current Cash $88.4 $95.5F/D Cash Adds $7.5 $8.1 Net Asset Value, US$Working Capital $95.9 $103.5 Per Share Interest $M $/share1 $M $/share1 $M $/share1Long-term Debt ($85.4) ($92.2) Project NAV3%Book Value - - Copler 100% 521.5 6.07 440.7 5.13 396.1 4.02 Enterprise Value (EV) $414.4 $447.5 Multiple 1.1x
Project NAV 573.7 6.67 484.7 5.64 435.7 4.42
Financial Forecast Copler Sulphide Potential 116.0 1.35 116.0 1.35 116.0 1.35 2007 2008 2009 2010 2011 2012 Turkey Exploration 40.0 0.47 40.0 0.47 40.0 0.47
Forecast Gold Price, US$/oz $685 $750 $750 $675 $650 $650 Cash at Dec. 31 2007 88.4 1.03 88.4 1.03 88.4 1.03 C$/US$ FX Rate 1.13 1.08 1.04 1.09 1.14 1.16 ITM Cash 7.5 0.09 7.5 0.09 7.5 0.09 Revenue, US$M $2 $9 $217 $161 $154 $146 Debt (85.4) (0.99) (85.4) (0.99) (85.4) (0.99) Mine Site Expense, US$M ($1) ($8) ($40) ($42) ($44) ($44) Corp. Adjustments2Corporate G&A, US$M ($3) ($5) ($5) ($5) ($5) ($5) Corporate NAV, $M 721.6 8.39 632.7 7.36 583.6 6.15 EBITDA, US$M ($2) ($4) $172 $114 $105 $97 Corporate NAV, C$M 779.3 9.07 683.3 8.00 630.3 6.64 DD&A, US$M $0 ($26) ($21) ($17) ($14) ($12) Share Price/Project NAV 0.7x
1. Based on 86.0 million partially diluted shares
Net Income, US$M ($2) ($33) $147 $76 $67 $64 2. Includes G&A expenditures
EPS, US$ ($0.02) ($0.40) $1.75 $0.90 $0.78 $0.74Current Price / EPS - - 3.4x 6.6x 7.5x 8.0x Copler Metal Inventory (100% owned)Target Price / EPS - - 4.2x 8.2x 9.4x 10.0x Copler, 100%Cash Flow Before W/C Changes, US$M ($1) ($7) $171 $96 $82 $76 ZoneCFPS, US$ ($0.02) ($0.09) $2.03 $1.13 $0.95 $0.88 Reserve - Oxide MillCurrent Price / CFPS - - 2.5x 4.5x 5.3x 5.7x Reserve - Oxide LeachTarget Price / CFPS - - 3.6x 6.6x 7.8x 8.4x
Measured & Indicated - OxideMeasured & Indicated - Sulphide
Copler Production Profile100% Owned 2009E 2010E 2011E 2012E 2013E 2014E Inferred - OxideMilling Rate per Annum, 000 1,561 1,831 1,811 1,827 1,889 1,873 Inferred - SulphideHeap Leach Rate Per Annum, 000 3,168 3,394 3,414 3,398 3,336 3,352Gold Production, 000 oz 285 232 228 214 129 109Total Cash Costs, US$/oz 132 172 192 205 340 380 Reserves Modelled Grade LOMTotal Production Costs, US$/oz 207 247 253 260 417 452 g/t Yrs
Copler Oxide 100% 1.67 10.5
Consensus Estimate Summary (Reuters data sourced via Capital IQ)Analysts Mean EPS High / Low Haywood vs. Cons. Mean CFPS High / Low Haywood vs. Cons.
2007 Consensus Estimate - - - - - - -2008 Consensus Estimate - - - - - - -2009 Consensus Estimate - - - - - - -
Analysts SO Rating SP Rating SU Rating Mean Target High / Low Haywood vs. Cons.
Consensus Valuation - - - - - - -
Peer Group ComparablesTicker Price S/O CFPS CFPS P/CF P/CF
Symbol (C$) (M) 2008 2009 2008 2009Alamos Gold Inc. AGI-T 5.65 94.3 0.70 1.30 7x 4xAurizon Mines Ltd. ARZ-T 3.60 146.7 0.48 0.48 7x 7xEldorado Gold Corp. ELD-T 5.31 344.1 0.40 0.45 12x 11xGBS Gold GBS-T 1.42 113.5 0.23 0.46 6x 3xJaguar Mining JAG-T 9.80 55.2 0.83 1.38 11x 6xRed Back Mining Inc. SMF-T 6.21 187.5 0.50 0.80 11x 7xSEMAFO Inc. SMF-T 1.15 195.0 0.37 0.27 3x 4xYamana Gold Inc. YRI-T 12.25 617.4 1.28 1.29 9x 8xGroup Average 8x 6x
Anatolia Minerals ANO-T 5.46 82.6 -0.09 2.03 - 2xC$/US$ FX Rate: 1.08
Andrew Kaip, P.Geo - Mining Analyst, 416-507-2417, [email protected] Coutoulakis - Associate, 416-507-2435, [email protected]
Interest
52,301 2,791
Company
Tonnes Gold(000) (000's Oz)
Tonnes Gold Grade Gold(000) g/t (000'oz)
18,122 2.61 1,52034,179 1.16 1,276
1.34 1,260
19,303 0.69 428
Richard C. Moores, II
0% NAV 3% NAV 5% NAV
Sep 07 to May 12
US$1,080.7M
US$8.1M
F/D (millions)
April 25, 2007 - C$100 million senior convertible debt (4.75%, conversion price of C$8.00)
14,272 2.49 1,144
12.5
5.7
12,856 1.69 700
29,331
November 12, 200763.4
79.9
Apr 12
$294.1
US$100.0M
Proceeds
anatoliaminerals.com
Expiry
29/10/07
-
$1.39 $1.51$0.12 $0.13$1.51 $1.63
($1.35) ($1.45)
Anatolia Minerals Development Ltd.
US$ / O/S Share C$ / O/S Share
$6.59 $7.11
$6.54 $7.06
Sept 4, 2007 - US$50 million senior project debt facility led by Bayerische Hypo-und Vereinsbank
5.7
6.6
-
50
100
150
200
250
300
350
2009E 2010E 2011E 2012E 2013E 2014E
Gold
Pro
duct
ion
000 o
z
100
150
200
250
300
350
400
Tota
l Cas
h Co
st U
S$/o
zGold Production, 000 oz
Total Cash Costs, US$/oz
Anatolia Minerals (ANO-T)
$2.0
$4.0
$6.0
$8.0
Nov-06 Feb-07 May-07 Aug-07 Nov-07
50 Day M.A.
200 Day M.A.
Volume in Millions
0.01.02.03.04.0
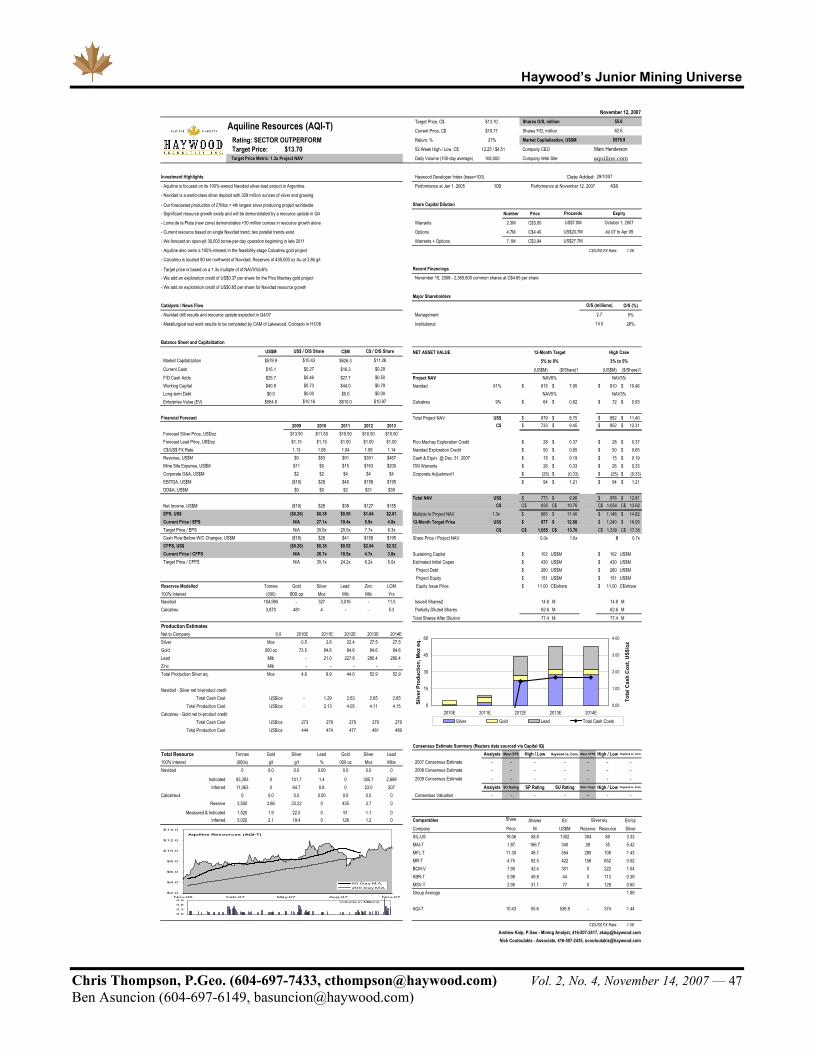
Haywood’s Junior Mining Universe
Chris Thompson, P.Geo. (604-697-7433, [email protected]) Vol. 2, No. 4, November 14, 2007 — 47 Ben Asuncion (604-697-6149, [email protected])
Target Price, C$ $13.70 Shares O/S, million
Current Price, C$ $10.77 Shares F/D, million
Rating: SECTOR OUTPERFORM Return, % 27% Market Capitalization, US$M
Target Price: $13.70 52-Week High / Low, C$ 12.25 / $4.51 Company CEO
Target Price Metric: 1.3x Project NAV Daily Volume (100-day average) 108,000 Company Web Site
Investment Highlights Haywood Developer Index (base=100) Date Added:
- Aquiline is focused on its 100%-owned Navidad silver-lead project in Argentina Performance at Jan 1, 2005 100 Performance at November 12, 2007 438- Navidad is a world-class silver deposit with 329 million ounces of silver and growing
- Our forecasted production of 27Moz = 4th largest silver producing project worldwide Share Capital Dilution
- Significant resource growth exists and will be demonstrated by a resource update in Q4 Number Price
- Loma de la Plata (new zone) demonstrates +30 million ounces in resource growth alone Warrants 2.3M C$3.00
- Current resource based on single Navidad trend; two parallel trends exist Options 4.7M C$4.40
- We forecast an open-pit 30,000 tonne-per-day operation beginning in late 2011 Warrants + Options 7.1M C$3.94
- Aquiline also owns a 100%-interest in the feasibility-stage Calcatreu gold project C$/US$ FX Rate: 1.08
- Calcatreu is located 80 km northwest of Navidad; Reserves of 435,000 oz Au at 3.86 g/t
- Target price is based on a 1.3x multiple of of NAV5%to8% Recent Financings
- We add an exploration credit of US$0.37 per share for the Pico Machay gold project
- We add an exploration credit of US$0.65 per share for Navidad resource growth
Major Shareholders
Catalysts / News Flow O/S (%)
- Navidad drill results and resource update expected in Q4/07 Management 5%
- Metallurgical test work results to be completed by CAM of Lakewood, Colorado in H1/08 Institutional 26%
Balance Sheet and Capitalization
US$M C$M NET ASSET VALUEMarket Capitalization $579.9 $626.3
Current Cash $15.1 $16.3 (US$M) ($/Share)1 (US$M) ($/Share)1F/D Cash Adds $25.7 $27.7 Project NAVWorking Capital $40.8 $44.0 Navidad 91% 615$ 7.95$ 810$ 10.46$ Long-term Debt $0.0 $0.0Enterprise Value (EV) $564.8 $610.0 Calcatreu 9% 64$ 0.82$ 72$ 0.93$
Financial Forecast Total Project NAV US$ 679$ 8.75$ 882$ 11.40$ 2009 2010 2011 2012 2013 C$ 733$ 9.45$ 952$ 12.31$
Forecast Silver Price, US$/oz $13.50 $11.50 $10.50 $10.50 $10.50Forecast Lead Price, US$/oz $1.15 $1.15 $1.00 $1.00 $1.00 Pico Machay Exploration Credit 28$ 0.37$ 28$ 0.37$ C$/US$ FX Rate 1.13 1.08 1.04 1.09 1.14 Navidad Exploration Credit 50$ 0.65$ 50$ 0.65$ Revenue, US$M $0 $53 $91 $391 $467 Cash & Equiv. @ Dec. 31, 2007 15$ 0.19$ 15$ 0.19$ Mine Site Expense, US$M $11 $0 $15 $163 $200 ITM Warrants 26$ 0.33$ 26$ 0.33$ Corporate G&A, US$M $2 $2 $4 $4 $4 Corporate Adjustment1 (25)$ (0.33)$ (25)$ (0.33)$ EBITDA, US$M ($19) $28 $40 $158 $195 94$ 1.21$ 94$ 1.21$ DD&A, US$M $0 $0 $2 $31 $39
Total NAV US$ 773$ 9.96$ 976$ 12.61$ Net Income, US$M ($19) $28 $38 $127 $155 C$ 835C$ 10.76C$ 1,054C$ 13.62C$ EPS, US$ ($0.26) $0.36 $0.50 $1.64 $2.01 Multiple to Project NAV 1.3x 883$ 11.40$ 1,146$ 14.82$ Current Price / EPS N/A 27.1x 19.4x 5.9x 4.8x 12-Month Target Price US$ 977$ 12.60$ 1,240$ 16.05$ Target Price / EPS N/A 35.6x 25.5x 7.7x 6.3x C$ 1,055C$ 13.70C$ 1,339C$ 17.35C$ Cash Flow Before W/C Changes, US$M ($18) $28 $41 $158 $195 Share Price / Project NAV 0.0x 1.0x 0 0.7x CFPS, US$ ($0.26) $0.36 $0.52 $2.04 $2.52Current Price / CFPS N/A 26.7x 18.5x 4.7x 3.8x Sustaining Capital 102$ US$M 102$ US$MTarget Price / CFPS N/A 35.1x 24.2x 6.2x 5.0x Estimated Initial Capex 430$ US$M 430$ US$M
Project Debt 280$ US$M 280$ US$M Project Equity 151$ US$M 151$ US$M
Reserves Modelled Tonnes Gold Silver Lead Zinc LOM Equity Issue Price 11.00$ C$/share 11.00$ C$/share100% Interest (000) 000 oz Moz Mlb Mlb YrsNavidad 104,985 - 327 3,016 - 11.0 Issued Shares2 14.8 M 14.8 MCalcatreu 3,870 481 4 - - 5.3 Partially Diluted Shares 62.6 M 62.6 M
Total Shares After Dilution 77.4 M 77.4 MProduction EstimatesNet to Company 0.0 2010E 2011E 2012E 2013E 2014ESilver Moz 0.5 2.6 22.4 27.5 27.5 Gold 000 oz 73.5 84.6 84.6 84.6 84.6 Lead Mlb - 21.0 227.8 280.4 280.4 Zinc Mlb - - - - - Total Production Silver eq. Moz 4.6 8.9 44.0 52.9 52.9
Navidad - Silver net bi-product creditTotal Cash Cost US$/oz - 1.29 2.63 2.65 2.65
Total Production Cost US$/oz - 2.13 4.05 4.11 4.15 Calcatreu - Gold net bi-product credit
Total Cash Cost US$/oz 273 279 279 279 279Total Production Cost US$/oz 444 474 477 481 489
Consensus Estimate Summary (Reuters data sourced via Capital IQ)Total Resource Tonnes Gold Silver Lead Gold Silver Lead Analysts Mean EPS High / Low Haywood vs. Cons. Mean CFPS High / Low Haywood vs. Cons.
100% interest (000s) g/t g/t % 000 oz Moz Mlbs 2007 Consensus Estimate - - - - - - -Navidad 0 0.0 0.0 0.00 0.0 0.0 0 2008 Consensus Estimate - - - - - - -
Indicated 93,393 0 101.7 1.4 0 305.7 2,899 2009 Consensus Estimate - - - - - - -Inferred 11,063 0 64.7 0.8 0 23.0 207 Analysts SO Rating SP Rating SU Rating Mean Target High / Low Haywood vs. Cons.
Calcatreu4 0 0.0 0.0 0.00 0.0 0.0 0 Consensus Valuation - - - - - - -Reserve 3,500 3.86 33.22 0 435 3.7 0
Measured & Indicated 1,520 1.9 22.5 0 91 1.1 0Inferred 5,020 2.1 19.4 0 126 1.2 0 Comparables Share Shares EV EV/oz
Company Price M US$M Reserve Resource SilverSIL-US 18.06 58.8 1302 304 88 3.33MAI-T 1.87 166.7 340 28 35 5.42MFL-T 11.30 48.7 554 280 108 1.43MR-T 4.75 92.5 422 156 652 0.52BCM-V 7.90 42.4 301 0 222 1.54KBR-T 0.98 49.8 44 0 113 0.39MSV-T 2.95 31.1 77 0 128 0.60Group Average 1.89
AQI-T 10.43 55.6 536.9 - 374 1.44
C$/US$ FX Rate: 1.08
Andrew Kaip, P.Geo - Mining Analyst, 416-507-2417, [email protected] Coutoulakis - Associate, 416-507-2435, [email protected]
Silver eq.
3% to 5%
$0.79NAV5% NAV3%
$0.46
O/S (millions)
2.7
14.5
$0.50
12-Month Target5% to 8%
NAV8% NAV5%
Jul 07 to Apr 09
$0.27 $0.29
October 1, 2007US$7.0M
November 15, 2006 - 2,365,600 common shares at C$4.65 per share
US$20.7M
High Case
US$27.7M
November 12, 200755.6
62.6
Expiry
29/10/07
$579.9
aquiline.com
Marc Henderson
Proceeds
Aquiline Resources (AQI-T)
US$ / O/S Share C$ / O/S Share
$10.43 $11.26
$0.73
$10.16 $10.97$0.00 $0.00
0
15
30
45
60
2010E 2011E 2012E 2013E 2014E
Silv
er P
rodu
ctio
n, M
oz e
q.
0.00
1.00
2.00
3.00
4.00
Tota
l Cas
h C
ost,
US$
/oz
Silver Gold Lead Total Cash Costs
Aquiline Resources (AQI-T)
$2.0
$4.0
$6.0
$8.0
$10.0
$12.0
$14.0
Nov-06 Feb-07 May-07 Aug-07 Nov-07
50 Day M.A.
200 Day M.A.
Volume in Millions
0.0
0.3
0.6
0.9

Haywood’s Junior Mining Universe
Chris Thompson, P.Geo. (604-697-7433, [email protected]) Vol. 2, No. 4, November 14, 2007 — 48 Ben Asuncion (604-697-6149, [email protected])
TSXV:XAU Price $2.48 Shares O/S (M) 24.91 MCap (C$) (M) $61.77
Comment:
11/12/2007Investment Highlights AuEx Ventures Inc. Chart
Website: www.auexventures.comTel:President/CEO:
Capital Structure (C$) (M)Shares O/S * 24.91Shares F/D 28.21(C$) (M) Av Strike Basic ITM ProceedsCash & Equiv $5.25Options $1.47 3.01 3.01 $4.42 Peer Group Companies Price (C$) MC (C$) (M)Warrants $2.12 0.29 0.09 $0.01 TSXV:WKR $1.67 $99.26Total Cash & ITM 3.30 3.10 $9.68 TSXV:BVG $1.14 $85.12Market Cap $61.77 TSXV:XAU $2.48 $61.77Note:* Included exchangable shares TSX:KDX $2.40 $54.86
TSXV:VIT $0.82 $54.15Trading Statistics (C$) TSXV:MAD $1.15 $43.16Last Sale Price $2.6552 Week High $2.7552 Week Low $1.60 Estimated Burn Rate (C$) (M)Average Daily Vol (M) 0.05 September 2007 cash & equiv $5.25 - Ownership (M) Management Institutional Long Canyon* -$0.42 Q407Shares 4.03 0.04 West Pequop* -$0.50 Q407% O/S 16.20% 0.15% Nevada* -$0.47 Q407Analyst Coverage # Analysts Admin Costs -$1.00 -
0 Financings $0.00 - Haywood Exploration Index Statistics ITM Options / Warrants $4.43 - Dated Added 22-Nov-06 Year-end 2007 cash & equiv $8.68
Last Financing2/13/2007
Key Properties Key PropertiesLong Canyon 35% (subject to 65% earn in) West PequopLocation: Nevada Location: NevadaExploration Stage: Exploration; Follow-up drilling planned Exploration Stage: Early to Advanced ExplorationDescription Description/Potential: /Potential:Current:
Current:
Reserve/Resource: None Reserve/Resource: Mineralized zones outlined at Acrobat and JugglerNevada Varied Spain & Argentina Varied Location: Nevada Location: Spain & ArgentinaExploration Stage: Exploration Exploration Stage: ExplorationDescription Description/Potential: /Potential:Current: Current:
Reserve/Resource: None Reserve/Resource: None
Baza Spain property reporesents new IOCG district in SE Spain; Aregentina & Chile - actively seeking acquisitionsCurrently looking for properties in Argentina under a JV agreement with Agnico Eagle. Property package in Spain, Baza project, is udnergoing extensive soil sampling and geochemical analysis - initial results encouraging. Property was historically a iron mine with Au & Cu potential - previously unexplored district. Baza is under JV with a subsidiary of Longview Capital.
0.4 million unit @ $2.40 plus 1/2 wt sold to Agnico-Eagle
NewWest Gold Corp. (NWG.T) can earn up to 65% in Long Canyon by spending $5 million over 5 years & completing a feasibility study. Mineralization is hosted in shelf carbonates of Cambro-Ordovician age. Both high angle and low angle structures control the mineralization. Recent drill results from a 14 hole RC program include: 45 feet grading 0.585 oz/t Au, 85 feet grading & 80 feet grading 0.074 oz/ t Au. Surface trench data in road cuts indicates widespread Au in areas not drilled. Recently completed drilling (22 holes) focused on testing for additional gold-bearing zones and to test for extensions of gold-bearing zones down dip and along strike - results pending. Next phase of drilling to resume in mid-Q407 with a core rig that will conduct step-out drilling and grade verification by twinning of previously drilled reverse-circulation drill holes.
Private Placement
$0.96 million
Numerous primary gold targets exist that include both drilled and undrilled surface mineralization with multigram gold samples. The most advanced drilling is at Acrobat and Juggler Undrilled targets include Mountain Top and SW Section 34. Numerous lower level anomalies with less than 1 gram gold and good Carlin style geochemistry need to be followed up over many square miles. Agnico-Eagle can earn up to a 70% interest by spending US$5 M and completing a feasibility. Extensive areas of untested Au geochem. Discovery of new high-grade gold mineralization (Hole WN-080 - 30 ft grading 0.469 opt in the Section 34 target area). RC drilling underway - focusing on 34 target area. 19 RC holes drilled to date. Drilling is also planned for Acrobat and Juggler targets. RC and diamond drilling planned through to end of Q407 with assay results to follow.
Ronald L. Parratt
Carlin style Au mineralization in altered carbonates. Adoins the Long Canyon property with similar geolog. Joint venture with Agnico-Eagle
Victoria Resource Corp.Miranda Gold Corp.
White Knight Resources Ltd.Bravo Venture Group Inc.AuEx Ventures Inc.Klondex Mines Ltd.
AuEx Ventures Inc.
Nevada-focused gold exploration company with an extensive portfolio of 17 properties - 11 joint ventured. A levered exploration approach hinged to JV partners funding properties to achieve exploration success.
100% (subject to a 70% earn in)
Bunce (North Range JV), Trinity Silver (Piedmont Mining JV), Leonid (Nevada Superior JV), Fireball Ridge (Tournigan JV), Gypsum Valley (Tournigan JV), JPW (Tournigan JV), Swiss Bank (Hawkeye Gold and Diamond Inc JV), North Klondike and Green Monster. Drilling planned at Bunce, Trinity Silver, Fireball Ridge and Swiss Bank over the winter months.
14 additional precious metals projects in Nevada under active exploration, ten governed under JV agreements
Carlin style Au mineralization in altered carbonates.
Note: * Total exploration budget on properties is financed by JV partners
Exploration Timetable
775-337-1545
- Nevada-focused generative to advanced gold exploration - expanding focus to S America and Spain. - Extensive portfolio of 18 Nevada properties - 10 of which are joint ventured. - 2007 field season drilling on nine properties - Long Canyon (Fronteer JV), West Pequop (Agnico Eagle JV), Bunce (North Range JV), Trinity Silver (Piedmont Mining JV), Leonid (Nevada Superior JV), Fireball Ridge, JPW, Gypsum Valley (Tournigan Gold) and Swiss Bank (Hawkeye Gold). - Significant exploration expenditure growth 2007-2010 with over $3.9M in anticipated expenditures by JV partners in 2007 - Key properties: Long Canyon (45 feet grading 0.58 oz/t), West Pequop and Trinity Silver. - Entered into strategic alliance with Agnico-Eagle focusing on exploration in southern Argentina & ChileCatalystsLong Canyon: Preliminary assay results beginning to arrive - expect announcements starting in Q407; Phase II drilling underway.West Pequop: Ongoing drilling; additional assay results to follow in Q407.Nevada: Results from Swiss Bank, Gypsum Valley, and Fireball Ridge to come in Q407; Drilling on Trinity Silver & Bunce in Q407. $0.00
$0.50
$1.00
$1.50
$2.00
$2.50
$3.00
Nov
-06
Dec
-06
Jan-
07
Feb-
07
Mar
-07
Apr-
07
May
-07
Jun-
07
Jul-0
7
Aug
-07
Sep
-07
Oct
-07
0.00.10.10.20.20.30.3
1
Vol
(M)
50 Day MA100 Day MA
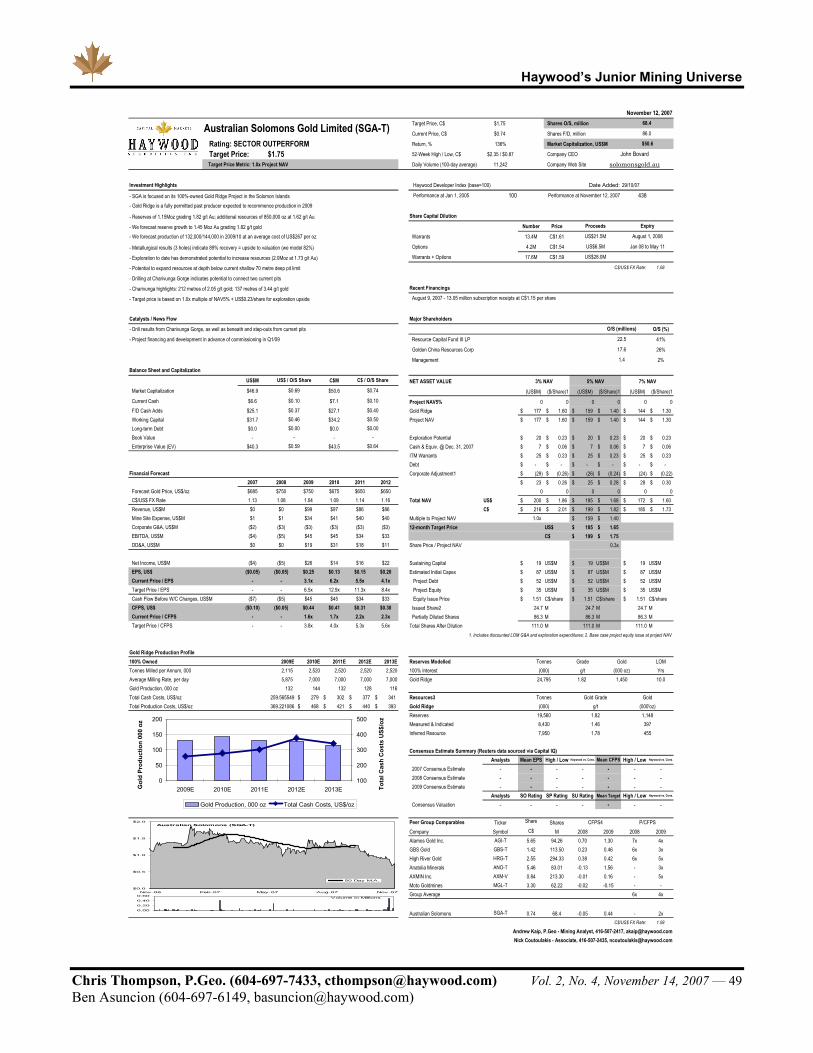
Haywood’s Junior Mining Universe
Chris Thompson, P.Geo. (604-697-7433, [email protected]) Vol. 2, No. 4, November 14, 2007 — 49 Ben Asuncion (604-697-6149, [email protected])
Target Price, C$ $1.75 Shares O/S, million
Current Price, C$ $0.74 Shares F/D, million
Rating: SECTOR OUTPERFORM Return, % 136% Market Capitalization, US$M
Target Price: $1.75 52-Week High / Low, C$ $2.35 / $0.87 Company CEO
Target Price Metric: 1.0x Project NAV Daily Volume (100-day average) 11,242 Company Web Site
Investment Highlights Haywood Developer Index (base=100) Date Added: 29/10/07
- SGA is focused on its 100%-owned Gold Ridge Project in the Solomon Islands Performance at Jan 1, 2005 100 Performance at November 12, 2007 438- Gold Ridge is a fully permitted past producer expected to recommence production in 2009
- Reserves of 1.15Moz grading 1.82 g/t Au; additional resources of 850,000 oz at 1.62 g/t Au Share Capital Dilution
- We forecast reserve growth to 1.45 Moz Au grading 1.82 g/t gold Number Price
- We forecast production of 132,000/144,000 in 2009/10 at an average cost of US$267 per oz Warrants 13.4M C$1.61
- Metallurgical results (3 holes) indicate 89% recovery = upside to valuation (we model 82%) Options 4.2M C$1.54
- Exploration to date has demonstrated potential to increase resources (2.0Moz at 1.73 g/t Au) Warrants + Options 17.6M C$1.59
- Potential to expand resources at depth below current shallow 70 metre deep pit limit C$/US$ FX Rate: 1.08
- Drilling at Charivunga Gorge indicates potential to connect two current pits
- Charivunga highlights: 212 metres of 2.05 g/t gold; 137 metres of 3.44 g/t gold Recent Financings
- Target price is based on 1.0x multiple of NAV5% + US$0.23/share for exploration upside
Catalysts / News Flow Major Shareholders
- Drill results from Charivunga Gorge, as well as beneath and step-outs from current pits O/S (%)
- Project financing and development in advance of commissioning in Q1/09 Resource Capital Fund III LP 41%
Golden China Resources Corp 26%
Management 2%
Balance Sheet and Capitalization
US$M C$M NET ASSET VALUEMarket Capitalization $46.9 $50.6 (US$M) ($/Share)1 (US$M) ($/Share)1 (US$M) ($/Share)1Current Cash $6.6 $7.1 Project NAV5% 0 0 0 0 0 0F/D Cash Adds $25.1 $27.1 Gold Ridge 177$ 1.60$ 159$ 1.40$ 144$ 1.30$ Working Capital $31.7 $34.2 Project NAV 177$ 1.60$ 159$ 1.40$ 144$ 1.30$ Long-term Debt $0.0 $0.0Book Value - - Exploration Potential 20$ 0.23$ 20$ 0.23$ 20$ 0.23$ Enterprise Value (EV) $40.3 $43.5 Cash & Equiv. @ Dec. 31, 2007 7$ 0.06$ 7$ 0.06$ 7$ 0.06$
ITM Warrants 25$ 0.23$ 25$ 0.23$ 25$ 0.23$ Debt -$ -$ -$ -$ -$ -$
Financial Forecast Corporate Adjustment1 (29)$ (0.26)$ (26)$ (0.24)$ (24)$ (0.22)$ 2007 2008 2009 2010 2011 2012 23$ 0.26$ 25$ 0.28$ 28$ 0.30$
Forecast Gold Price, US$/oz $685 $750 $750 $675 $650 $650 0 0 0 0 0 0C$/US$ FX Rate 1.13 1.08 1.04 1.09 1.14 1.16 Total NAV US$ 200$ 1.86$ 185$ 1.68$ 172$ 1.60$ Revenue, US$M $0 $0 $99 $97 $86 $86 C$ 216$ 2.01$ 199$ 1.82$ 185$ 1.73$ Mine Site Expense, US$M $1 $1 $34 $41 $40 $40 Multiple to Project NAV 1.0x 159$ 1.40$ Corporate G&A, US$M ($2) ($3) ($3) ($3) ($3) ($3) 12-month Target Price US$ 185$ 1.65$ EBITDA, US$M ($4) ($5) $45 $45 $34 $33 C$ 199$ 1.75$ DD&A, US$M $0 $0 $19 $31 $18 $11 Share Price / Project NAV 0.3x
Net Income, US$M ($4) ($5) $26 $14 $16 $22 Sustaining Capital 19$ US$M 19$ US$M 19$ US$MEPS, US$ ($0.05) ($0.05) $0.25 $0.13 $0.15 $0.20 Estimated Initial Capex 87$ US$M 87$ US$M 87$ US$MCurrent Price / EPS - - 3.1x 6.2x 5.5x 4.1x Project Debt 52$ US$M 52$ US$M 52$ US$MTarget Price / EPS - - 6.5x 12.9x 11.3x 8.4x Project Equity 35$ US$M 35$ US$M 35$ US$MCash Flow Before W/C Changes, US$M ($7) ($5) $45 $45 $34 $33 Equity Issue Price 1.51$ C$/share 1.51$ C$/share 1.51$ C$/shareCFPS, US$ ($0.10) ($0.05) $0.44 $0.41 $0.31 $0.30 Issued Share2 24.7 M 24.7 M 24.7 MCurrent Price / CFPS - - 1.6x 1.7x 2.2x 2.3x Partially Diluted Shares 86.3 M 86.3 M 86.3 MTarget Price / CFPS - - 3.8x 4.0x 5.3x 5.6x Total Shares After Dilution 111.0 M 111.0 M 111.0 M
1. Includes discounted LOM G&A and exploration expenditures; 2. Base case project equity issue at project NAV
Gold Ridge Production Profile100% Owned 2009E 2010E 2011E 2012E 2013E Reserves Modelled Grade LOMTonnes Milled per Annum, 000 2,115 2,520 2,520 2,520 2,520 100% Interest g/t YrsAverage Milling Rate, per day 5,875 7,000 7,000 7,000 7,000 Gold Ridge 1.82 10.0Gold Production, 000 oz 132 144 132 128 116Total Cash Costs, US$/oz 259.565549 279$ 302$ 377$ 341$ Resources3Total Production Costs, US$/oz 369.221086 468$ 421$ 440$ 393$ Gold Ridge
ReservesMeasured & IndicatedInferred Resource
Consensus Estimate Summary (Reuters data sourced via Capital IQ)Analysts Mean EPS High / Low Haywood vs. Cons. Mean CFPS High / Low Haywood vs. Cons.
2007 Consensus Estimate - - - - - - -2008 Consensus Estimate - - - - - - -2009 Consensus Estimate - - - - - - -
Analysts SO Rating SP Rating SU Rating Mean Target High / Low Haywood vs. Cons.
Consensus Valuation - - - - - - -
Peer Group Comparables Ticker Share SharesCompany Symbol C$ M 2008 2009 2008 2009Alamos Gold Inc. AGI-T 5.65 94.26 0.70 1.30 7x 4xGBS Gold GBS-T 1.42 113.50 0.23 0.46 6x 3xHigh River Gold HRG-T 2.55 294.33 0.38 0.42 6x 5xAnatolia Minerals ANO-T 5.46 83.01 -0.13 1.56 - 3xAXMIN Inc. AXM-V 0.84 213.30 -0.01 0.16 - 5xMoto Goldmines MGL-T 3.30 62.22 -0.02 -0.15 - -Group Average 6x 4x
Australian Solomons SGA-T 0.74 68.4 -0.05 0.44 - 2xC$/US$ FX Rate: 1.08
Andrew Kaip, P.Geo - Mining Analyst, 416-507-2417, [email protected] Coutoulakis - Associate, 416-507-2435, [email protected]
Gold(000 oz)
8,430 1.46 397
(000) g/t (000'oz)19,560 1.82
CFPS4 P/CFPS
7,950 1.78 455
1,148
17.6
1.4
Tonnes Gold Grade Gold
Tonnes(000)
24,795 1,450
November 12, 200768.4
86.0
3% NAV 5% NAV 7% NAV
Jan 08 to May 11
US$28.0M
$50.6
US$21.5M
Proceeds
solomonsgold.au
Expiry
John Bovard
August 9, 2007 - 13.05 million subscription receipts at C$1.15 per share
O/S (millions)
22.5
August 1, 2008
US$6.5M
- -
$0.40$0.46 $0.50
$0.10 $0.10$0.37
$0.00 $0.00
Australian Solomons Gold Limited (SGA-T)
US$ / O/S Share C$ / O/S Share
$0.69 $0.74
$0.59 $0.64
0
50
100
150
200
2009E 2010E 2011E 2012E 2013EGol
d Pr
oduc
tion
000
oz
100
200
300
400
500
Tota
l Cas
h C
osts
US$
/oz
Gold Production, 000 oz Total Cash Costs, US$/oz
Australian Solomons (SGA-T)
$0.0
$0.5
$1.0
$1.5
$2.0
Nov-06 Feb-07 May-07 Aug-07 Nov-07
50 Day M.A.
Volume in Millions
0.00
0.20
0.40
0.60

Haywood’s Junior Mining Universe
Chris Thompson, P.Geo. (604-697-7433, [email protected]) Vol. 2, No. 4, November 14, 2007 — 50 Ben Asuncion (604-697-6149, [email protected])
Target Price, C$ $1.45 Shares O/S, million
Current Price, C$ $0.84 Shares F/D, million
Rating: SECTOR OUTPERFORM Return, % 73% Market Capitalization, US$M
Target Price: $1.45 52-Week High / Low, C$ $1.12 / $0.78 Company CEO
Target Price Metric: 1.1x Project NAV Daily Volume (100-day average) 51,000 Company Web Site
Investment Highlights Haywood Developer Index (base=100) Date Added:
- Management has proven track record of mineral discovery in Africa (SAMAX in Tanzania) Performance at Jan 1, 2005 100 Performance at November 12, 2007 438- AXMIN is focused on its 90%-owned Passendro gold project in the Central African Republic
- Passendro reserves stand at 1.14Moz gold; additional resources of 1.44Moz gold Share Capital Dilution
- We expect a feasibility study in Q4 to increase reserves and demonstrate robust economics Number Price
- We forecast and model reserve growth to 2.2 million ounces gold grading 2.3 g/t gold Warrants 0.0M C$0.00
- We forecast production of 220,000 oz Au per annum at US$260 total cash cost per ounce Options 10.3M C$0.83
- Several satellite exploration discoveries made within 25 km radius of Passendro Warrants + Options 10.3M C$0.83
- AXMIN continues to add value through additional exploration-stage properties: C$/US$ FX Rate: 1.08
- 1. Kofi (Mali, 80% interest) - Resources of 532,000 oz Au at 2.9 g/t
- 2. Nimini Hills (Sierra Leone, 80% interest) - Resources of 394,000 oz Au at 2.5 g/t Recent Financings
- Target price is based on a 1.1x multiple of our NAV9% + US$0.24/share for Kofi, Nimini
Catalysts / News Flow Major Shareholders
- Passendro: Bankable feasibility study and resource update in Q4/07; Drilling ongoing; O/S (%) F/D (%)
- Kofi: Resource update expected in Q4/07; Drilling ongoing; Management and Directors 6% 9%
- Namini Hills: Resource update expected in Q4/07; Drilling ongoing; Addax Mining Holdings 42% 43%
Balance Sheet and Capitalization
US$M C$M Net Asset Value, US$Market Capitalization $165.9 $179.2 Per Share1 Interest $M $/share $M $/share $M $/shareCurrent Cash $38.9 $42.1 Project NAVF/D Cash Adds $3.1 $3.4 Passendro 90% 268.4 1.01 237.0 0.89 209.8 0.79 Working Capital $42.0 $45.4 Multiple 1.1x 0.0 0.00 0.0 0.00 0.0 0.00Long-term Debt $0.0 $0.0 Project NAV 295.2 1.11 260.7 1.00 230.8 0.87Book Value - -Enterprise Value (EV) $127.0 $137.1 African Exploration Upside 65.0 0.24 65.0 0.24 65.0 0.24
Est. cash at Year-end Dec. 31, 2007 38.9 0.15 38.9 0.15 38.9 0.15 ITM Cash 3.1 0.01 3.1 0.01 3.1 0.01
Financial Forecast Debt2007 2008 2009 2010 2011 2012 Other Corp. Adjustments2 (20.4) (0.08) (19.5) (0.08) (18.6) (0.08)
Forecast Gold Price, US$/oz $685 $750 $750 $675 $650 $650 Corporate NAV, $M 381.8 1.43 348.3 1.33 319.2 1.19 C$/US$ FX Rate 1.13 1.08 1.04 1.09 1.14 1.16 Corporate NAV, C$M 412.4 1.55 376.1 1.45 344.7 1.30 Revenue, US$M $0 $0 $80 $143 $137 $137 Share Price/Project NAV 0.5xMine Site Expense, US$M ($15) ($8) ($31) ($57) ($58) ($58)Corporate G&A, US$M ($2) ($3) ($3) ($3) ($3) ($3)EBITDA, US$M ($17) ($10) $46 $82 $76 $76 Passendro Metal Inventory (90% owned)DD&A, US$M $0 $0 ($19) ($24) ($18) ($14) Passendro
Reserves/ResourcesNet Income, US$M ($17) ($10) $17 $45 $47 $51 Reserves ProbableEPS, US$ ($0.06) ($0.04) $0.06 $0.17 $0.17 $0.19 Resources IndicatedCurrent Price / EPS - - 12.0x 4.5x 4.5x 4.1x InferredTarget Price / EPS - - 20.7x 7.8x 7.7x 7.1xCash Flow Before W/C Changes, US$M ($5) ($3) $41 $75 $71 $71CFPS, US$ ($0.02) ($0.01) $0.16 $0.28 $0.26 $0.26Current Price / CFPS - - 5.0x 2.8x 2.9x 3.0xTarget Price / CFPS - - 20.7x 7.8x 7.7x 7.1x
Production EstimatesAXMIN 90% 2009E 2010E 2011E 2012E 2013ETonnes Milled Per Annum, 000' 1,500 3,000 3,000 3,000 3,000Average Milling Rate, tpd 4,286 8,571 8,571 8,571 8,571Gold Production, 000'oz 109 219 219 219 217Total Cash Costs, US$/oz 254 260 259 259 261Total Production Costs, US$/oz 427 369 342 324 312 Consensus Estimate Summary (Reuters data sourced via Capital IQ)
Analysts Mean EPS High / Low Haywood vs. Cons. Mean CFPS High / Low Haywood vs. Cons.
Reserves Modelled Interest Grade LOM 2007 Consensus Estimate - - - - - - -(%) g/t Yrs 2008 Consensus Estimate - - - - - - -
Passendro 90% 2.33 10.5 2009 Consensus Estimate - - - - - - -Analysts SO Rating SP Rating SU Rating Mean Target High / Low Haywood vs. Cons.
Consensus Valuation - - - - - - -
Peer Comparables Ticker Share Shares EV EV/ozCompany Symbol C$ M US$ M Reserve Resource Gold eq.Banro Corp. BAA-T 12.01 39.9 447.3 0.0 11.4 39Moto Goldmines Ltd. MGL-T 3.30 61.9 139.8 1.7 9.4 13SEMAFO Inc. SMF-T 1.15 195.0 228.4 1.6 2.4 57Orezone Resources Inc. ORZ-T 1.23 133.7 150.0 0.0 1.4 110Northern Mining Ltd. MDN-T 1.02 87.2 89.0 0.2 0.5 128Group Average 69
AXMIN Inc. AXM-V 0.84 213.3 127.0 1.0 2.0 53
C$/US$ FX Rate: 1.08
Andrew Kaip, P.Geo - Mining Analyst, 416-507-2417, [email protected] Coutoulakis - Associate, 416-507-2435, [email protected]
Tonnes Gold Grade Contained (000') g/t Ounces
2.53 396,8701,041,900
13,740 2.59 1,143,2304,880
US$8.5M
US$8.5M
9% NAV 11% NAV
Proceeds
axmininc.com
Jonathan Forster
Dec. 07 to Jan. 12
$0.18 $0.20
November 12, 2007213.3
223.6
Expiry
29/10/07
-
$179.2
US$0.0M
$0.21$0.01
December 28 2006 - 42.5 million common shares at C$0.95 per share
F/D (millions)
19.0
95.7
O/S (millions)
12.4
89.6
AXMIN Inc.
US$ / O/S Share C$ / O/S Share
$0.78 $0.84
(000's Oz)(000)
Gold eq.3 M oz
16,820 2.00
Tonnes Gold
29,301 2,169
7% NAV
$0.60 $0.64-
$0.00 $0.00-
$0.02$0.20
100
150
200
250
300
2009E 2010E 2011E 2012E 2013E
Gol
d Pr
oduc
tion
000
oz
$225
$250
$275
$300
$325
Tota
l Cas
h C
ost U
S$/o
zGold Production, 000'oz
Total Cash Costs, US$/oz
AXMIN Inc. (AXM-V)
$0.0
$0.5
$1.0
$1.5
$2.0
Nov-06 Feb-07 May-07 Aug-07 Nov-07
50 Day M.A.
200 Day M.A.
Volume in Millions
0.0
1.0
2.0
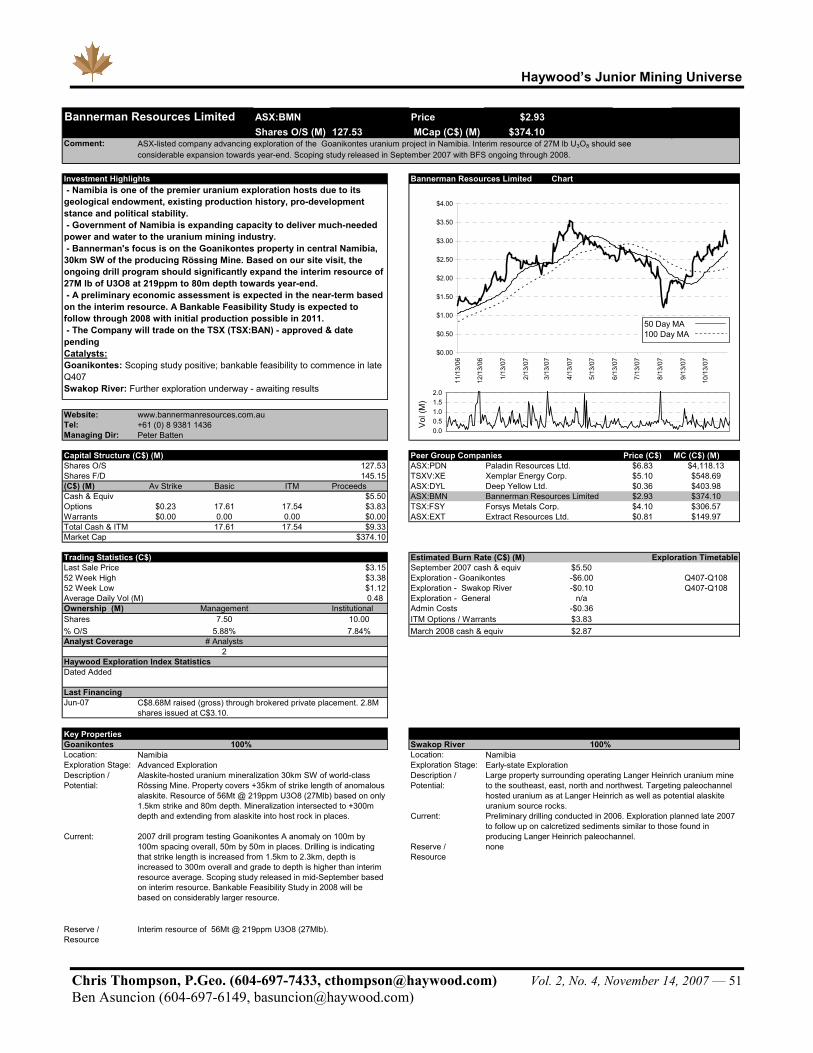
Haywood’s Junior Mining Universe
Chris Thompson, P.Geo. (604-697-7433, [email protected]) Vol. 2, No. 4, November 14, 2007 — 51 Ben Asuncion (604-697-6149, [email protected])
ASX:BMN Price $2.93 Shares O/S (M) 127.53 MCap (C$) (M) $374.10
Comment:
11/12/2007Investment Highlights Bannerman Resources Limited Chart
Website: www.bannermanresources.com.auTel:Managing Dir:
Capital Structure (C$) (M) Peer Group Companies Price (C$) MC (C$) (M)Shares O/S 127.53 ASX:PDN $6.83 $4,118.13Shares F/D 145.15 TSXV:XE $5.10 $548.69(C$) (M) Av Strike Basic ITM Proceeds ASX:DYL $0.36 $403.98Cash & Equiv $5.50 ASX:BMN $2.93 $374.10Options $0.23 17.61 17.54 $3.83 TSX:FSY $4.10 $306.57Warrants $0.00 0.00 0.00 $0.00 ASX:EXT $0.81 $149.97Total Cash & ITM 17.61 17.54 $9.33Market Cap $374.10
Trading Statistics (C$) Estimated Burn Rate (C$) (M)Last Sale Price $3.15 September 2007 cash & equiv $5.50 52 Week High $3.38 Exploration - Goanikontes -$6.00 Q407-Q10852 Week Low $1.12 Exploration - Swakop River -$0.10 Q407-Q108Average Daily Vol (M) 0.48 Exploration - General n/aOwnership (M) Management Institutional Admin Costs -$0.36 Shares 7.50 10.00 ITM Options / Warrants $3.83 % O/S 5.88% 7.84% March 2008 cash & equiv $2.87 Analyst Coverage # Analysts
2 Haywood Exploration Index StatisticsDated Added
Last FinancingJun-07
Key PropertiesGoanikontes 100% Swakop River 100%Location: Location: Exploration Stage: Exploration Stage:Description / Potential:
Description / Potential:
Current:
Current:Reserve / Resource
Interim resource of 56Mt @ 219ppm U3O8 (27Mlb).
Deep Yellow Ltd.Bannerman Resources LimitedForsys Metals Corp.Extract Resources Ltd.
Early-state ExplorationAlaskite-hosted uranium mineralization 30km SW of world-class Rössing Mine. Property covers +35km of strike length of anomalous alaskite. Resource of 56Mt @ 219ppm U3O8 (27Mlb) based on only 1.5km strike and 80m depth. Mineralization intersected to +300m depth and extending from alaskite into host rock in places.
Advanced Exploration
+61 (0) 8 9381 1436
Namibia
Peter Batten
Exploration Timetable
Paladin Resources Ltd.Xemplar Energy Corp.
Bannerman Resources Limited
ASX-listed company advancing exploration of the Goanikontes uranium project in Namibia. Interim resource of 27M lb U3O8 should see considerable expansion towards year-end. Scoping study released in September 2007 with BFS ongoing through 2008.
- Namibia is one of the premier uranium exploration hosts due to its geological endowment, existing production history, pro-development stance and political stability. - Government of Namibia is expanding capacity to deliver much-needed power and water to the uranium mining industry. - Bannerman's focus is on the Goanikontes property in central Namibia, 30km SW of the producing Rössing Mine. Based on our site visit, the ongoing drill program should significantly expand the interim resource of 27M lb of U3O8 at 219ppm to 80m depth towards year-end. - A preliminary economic assessment is expected in the near-term based on the interim resource. A Bankable Feasibility Study is expected to follow through 2008 with initial production possible in 2011. - The Company will trade on the TSX (TSX:BAN) - approved & date pendingCatalysts:Goanikontes: Scoping study positive; bankable feasibility to commence in late Q407Swakop River: Further exploration underway - awaiting results
Reserve / Resource
C$8.68M raised (gross) through brokered private placement. 2.8M shares issued at C$3.10.
Preliminary drilling conducted in 2006. Exploration planned late 2007 to follow up on calcretized sediments similar to those found in producing Langer Heinrich paleochannel.
Large property surrounding operating Langer Heinrich uranium mine to the southeast, east, north and northwest. Targeting paleochannel hosted uranium as at Langer Heinrich as well as potential alaskite uranium source rocks.
2007 drill program testing Goanikontes A anomaly on 100m by 100m spacing overall, 50m by 50m in places. Drilling is indicating that strike length is increased from 1.5km to 2.3km, depth is increased to 300m overall and grade to depth is higher than interim resource average. Scoping study released in mid-September based on interim resource. Bankable Feasibility Study in 2008 will be based on considerably larger resource.
none
Namibia
$0.00
$0.50
$1.00
$1.50
$2.00
$2.50
$3.00
$3.50
$4.00
11/1
3/06
12/1
3/06
1/13
/07
2/13
/07
3/13
/07
4/13
/07
5/13
/07
6/13
/07
7/13
/07
8/13
/07
9/13
/07
10/1
3/07
0.00.51.01.52.0
1
Vol
(M)
50 Day MA100 Day MA

Haywood’s Junior Mining Universe
Chris Thompson, P.Geo. (604-697-7433, [email protected]) Vol. 2, No. 4, November 14, 2007 — 52 Ben Asuncion (604-697-6149, [email protected])
Target Price, C$ $20.00 Shares O/S, million
Current Price, C$ $12.01 Shares F/D, million
Rating: SECTOR OUTPERFORM 52-Week High, C$ $15.75 Market Capitalization, US$M
Target Price: $20.00 52-Week Low, C$ $8.74 Company CEO
TSX:BAA Daily Volume (100-day average) 0.01 Company Web Site
Investment Highlights Haywood Developer Index (base=100) Date Added:Performance at Jan 01/05 100 Performance at November 12, 2007 438
Share Capital Dilution
Number Price
Warrants 0.0M C$0.00
Options 3.6M C$6.79
Warrants + Options 3.6M C$9.67
Recent Financings
Major Shareholders
Catalysts / News Flow O/S (%) F/D (%)
Actis Capital 7% 6%
Capital Research 7% 6%
Management and Directors 6% 14%
Other 80% 73%
Total 100% 100%
Corporate NAV Summary and Sensitivity
Balance Sheet and Capitalization Variable -20% -10% 0 +10% +20%US$M S$ / O/S Share C$M C$ / O/S Share Gold US$650 /oz US$208 US$387 US$566 US$770 US$963
Market Capitalization $431.9 $11.22 $462.1 $12.01 Discount Rate US$0 US$0 US$697 US$634 US$566 US$530 US$488Current Cash $44.1 $1.15 $47.2 $1.12 Capex, Total US$779 million US$695 US$637 US$566 US$520 US$462F/D Cash Adds $34.8 $0.90 $37.3 $0.89Working Capital $42.8 $1.11 $45.8 $1.09Long-term Debt $0.0 $0.00 $0.0 $0.00 Variable -20% -10% 0 +10% +20%Book Value $94.9 $2.47 $101.5 $2.41 Gold US$650 /oz $14.50 $17.00 $19.50 $23.00 $26.00Enterprise Value (EV) $389.1 $10.11 $416.3 $9.89 Discount Rate 9% $22.00 $21.00 $19.50 $19.50 $18.50
EV = Market Capitalization - Working Capital + Long-term Debt Capex US$779 million $22.00 $21.00 $19.50 $19.00 $18.00C$/US$ FX Rate: 1.07
Financial Forecast2010 2011 2012 2013 2014 2015 Discount Rate 5% 10% 15% 20% 25%
Forecast Gold Price, US$/lb $675 $650 $650 $650 $650 $650 Price Target $26.50 $21.50 $19.50 $17.50 $17.00C$/US$ FX Rate 0.88 0.87 0.86 0.86 0.86 0.86Shares O/S, millions 58 58 58 58 58 58 Reserves & Resources:Revenue, US$M $0 $138 $324 $306 $388 $392 Gold EV/ozMine Site Expense, US$M $0 ($37) ($102) ($112) ($164) ($167) Measured & Indicated (g/t) US$/ozCorporate G&A, US$M ($12) ($13) ($14) ($16) ($17) ($18) Twangiza 2.1EBITDA, US$M ($12) $98 $169 $153 $203 $218 Namoya 3.3EV / EBITDA - 4.0x 2.3x 2.5x 1.9x 1.8x Total 2.3 $95DD&A, US$M $0 ($13) ($70) ($69) ($84) ($78) InferredEarnings, US$M ($12) $111 $239 $223 $289 $298 Twangiza 2.0EPS, US$ ($0.22) $1.93 $4.15 $3.86 $5.00 $5.16 Kamituga 3.9Current Price / EPS - 5.8x 2.7x 2.9x 2.2x 2.2x Lugushwa 2.3Target Price / EPS - 10.4x 4.8x 5.2x 4.0x 3.9x Namoya 2.7Cash Flow Before W/C Changes, US$M ($4) $133 $319 $302 $384 $388 Total 2.3CFPS, US$ ($0.14) ($0.09) ($0.07) ($0.08) $2.31 $5.53 Total Resources $34Current Price / CFPS - - - - 5.2x 2.2xTarget Price / CFPS - - - - 8.7x 3.6x
Production ProfileProduction (Koz) 2010E 2011E 2012E 2013E 2014E 2015E Twangiza 221 339 297 272 272 Namoya 0 181 194 211 194 Lugushwa 0 0 0 140 163
221 520 491 624 629Cash Costs (US$/oz) Twangiza $188 $207 $239 $266 $266 Namoya $0 $255 $269 $256 $246 Banro Corp. Consensus Estimate Summary (Reuters data sourced via Capital IQ) Lugushwa $0 $0 $0 $396 $380 Analysts Mean NAV High LowAverage Cash Cost $188 $223 $251 $291 $289 2007 Consensus Estimate n/a n/a n/a n/a
2008 Consensus Estimate n/a n/a n/a n/a2009 Consensus Estimate n/a n/a n/a n/a
Analysts Buy Rating Hold Rating Sell Rating Mean Target High LowConsensus Valuation 2 2 - - - - -
Peer Group Comparables (Haywood Securities estimates)P / NAV
Banro Corp. N/AMoto Goldmines Ltd. N/AAurelian Resources Inc. 0.9xCentamin Egypt Ltd. N/AFirst Nickel Inc. N/ACrystallex International Corp. N/AGabriel Resources Ltd. 0.3xPeer Group Average 0.6x
Eric Zaunscherb, B.Sc., CFA - Mining [email protected]
C$3.30 n/a n/aC$8.35 C$1,211 $9.65
November 12, 2007
October 2008 - March 2012
US$34.8M
US$34.8M
Banro Corp. (TSX:BAA)
US$0.0M
Proceeds Expiry
10/29/2007
38.5
42.1
-
$454.4
Michael Prinsloo
C$12.01
www.banro.com
• Banro is a gold exploration company focused on advancement of a portfolio of projects covering the Twangiza-Namoya gold belt in the Democratic Republic of the Congo (DRC). • Controls the majority of land covering the 210-kilometre long Twangiza-Namoya gold belt in the DRC. Land tenure is secure with 100% ownership uncontested by the Government of the DRC and a ten-year tax holiday established. • The Twangiza gold project is at the prefeasibility study stage. The scoping study indicated an in-pit resource of 4.6 million ounces and the potential for production of 300,000 to 500,000 ounces per annum. • The Namoya scoping study identified a mineable resource of 1.4 million ounces in a combined open pit and underground operation producing approximately 200,000 ounces per annum. • At Lagushwa, a mineralized trend of over 4 kilometres in length has been identified. • Strong and experienced management group with Chairman Simon Village, former Managing Director of the World Gold Council; President Peter Cowley, former Managing Director of Ashanti Exploration; and CEO Michael Prinsloo, former Head of South African Operations of Gold Fields. • Tight share structure with blue-ribbon institutional investors. • Banro’s shares are trading at a 40% discount to our target based on a 1.1X project P/NAV multiple.
• Twangiza prefeasibility study expected 1Q08. • Namoya prefeasibility study expected 1Q08. • Lagushwa scoping study expected 1Q08. • Drill programs active on all projects as well as early stage exploration on Kamituga and regional targets with results regularly reported. • DRC-related catalysts include completion of the current review of mining contracts with foreign companies (but specifically excluding Banro) and resolution of the military conflict with rebel units in neighbouring North Kivu province. Success on these fronts would lead to a re-rating of all DRC-exposed companies.
May 4, 2006 - C$50.24M public offering (3.925M common shares @ C$12.80 per share)
42.138.5
30.8 30.8
Mrkt Cap NAV Consensus EstPrice
2.6 2.6
2.4 6.0
0.627.36
11.44
7,074
C$0.00 C$0 n/aC$0.87 C$123 n/aC$2.75 C$772 n/aC$1.95 C$502 $6.45
O/S (millions) F/D (millions)
2.7 2.7
98,808153,703
3.090.912.74
47,4747,260
37,000
Price Target
Corporate NAV (millions)Base Case
Tonnes(000's)45,9708,925
54,895
May 15, 2006 - C$6.0M overallotment (0.451M common shares @ C$12.80 per share)
Price Target (1.1X P/NAV)Base Case
n/aC$471
GoldMoz3.150.944.09
$5.00
$7.00
$9.00
$11.00
$13.00
$15.00
$17.00
$19.00
11/1
3/06
12/1
3/06
1/13
/07
2/13
/07
3/13
/07
4/13
/07
5/13
/07
6/13
/07
7/13
/07
8/13
/07
9/13
/07
10/1
3/07
0.00.20.40.60.81.01.2
1
Vol (
M)
50 Day MA100 Day MA
0200400600800
2010E 2011E 2012E 2013E 2014E 2015E
Koz
0100200300400
Twangiza Namoya Lugushwa Average Cash Cost

Haywood’s Junior Mining Universe
Chris Thompson, P.Geo. (604-697-7433, [email protected]) Vol. 2, No. 4, November 14, 2007 — 53 Ben Asuncion (604-697-6149, [email protected])
TSXV:BHV Price $0.87 Shares O/S (M) 23.58 MCap (C$) (M) $20.52
Comment:
11/12/2007Investment Highlights Bellhaven Copper & Gold Inc. Chart
Website: www.bellhaven-ventures.comTel:President/CEO:
Capital Structure (C$) (M)Shares O/S* 23.58Shares F/D 32.99(C$) (M) Av Strike Basic ITM ProceedsCash & Equiv $2.11Options $0.85 2.06 1.60 $1.19 Peer Group Companies Price (C$) MC (C$) (M)Warrants $1.18 7.35 0.00 $0.00 TSX:PTQ $3.03 $278.03Total Cash & ITM 9.41 1.60 $3.30 TSXV:SVL $1.20 $41.31Market Cap $20.52 TSXV:CN $1.26 $26.20Note:* Includes 3,212,000 shares for purchase of Cuprum TSXV:RDU $0.48 $26.17
TSXV:BHV $0.87 $20.52Trading Statistics (C$) Last Sale Price $0.90 Estimated Burn Rate (C$) (M)52 Week High $1.31 Sept 2007 cash & equiv $2.11 52 Week Low $0.39 Cerro Chorcha* -$9.00 Q407 - Q108Average Daily Vol (M) 0.05 Viento Frío* -$0.18 Q407 - Q108Ownership (M) Management Institutional Los Hatillos* -$0.18 Q407 - Q108Shares 1.23 0.00 Cerro Pelado & Veraguas -$1.10 Q407 - Q108% O/S 5.21% 0.00% Azuero -$0.76 Q407 - Q108Analyst Coverage # Analysts Cerro Quema -$1.00 Q407 - Q108
0 Admin Costs -$0.76 Haywood Exploration Index Statistics Financing $2.50Dated Added 22-Nov-06 ITM Options / Warrants $1.19
March 2008 cash & equiv $2.19 Last Financing
Pending $3.8 million
Key PropertiesCerro Chorcha 35% Cerro Pelado / Rio Liri & Veraguas Gold BeltLocation: Panama Location: PanamaExploration Stage: Advanced Exploration Exploration Stage: ExplorationDescription Description/Potential: /Potential:Current: Current:
Reserve/Resource: Reserve/Resource:
Azuero 100% Viento Frío 30% Location: Panama Location: PanamaExploration Stage: Exploration Exploration Stage: Advanced ExplorationDescription Description/Potential: /Potential:Current: Current:
Reserve/Resource:
Reserve/Resource: n/aCerro Quema 100%Location: PanamaExploration Stage: Advanced ExplorationDescription/Potential:Current:
Reserve/Resource:
Property hosts a historic resource of 134 M tonnes grading 0.48% Cu & 0.059 g/t Au. Higher grade trench in core area returned 61 metres grading 1.89% Cu, 1.44 g/t Au and 23.2 g/t Ag. Numerous soil and stream sediment anomalies point to new areas of untested mineralization; Recently confirmed the presence of molybdenum in historical core. Trenching results: 585 m at an average grade of 0.66 g/t Au, 0.5% Cu. Phase I drilling (3,000 m / 9 holes) to focus on testing new exploration targets - results from first two holes show elevated grades from resource estimate. Partial results from third hole show mineralization in line with previously defined resource - an intercept of 313.9m of 0.46% Cu, 1.1g/t Ag with Au results pending. Awaiting results from additional 6 holes already drilled. $7M drill program planned for 2008.
Located in Azuero Peninsula in Los Santos Province of SW Panama, 190km SW of Panama City.
NI 43-101 proven and probable resource of 15.14 M tonnes grading of 0.93g/t Au (451,400 oz Au)
- Focused on Panama with early and advanced stage projects. - Optioned 65% Cerro Chorcha copper-gold deposit to Empire Minerals -US$15 M in exploration plus US$6 M in cash and stock. - Cerro Chorcha: 134 M tonnes @ 0.48% Cu & 0.059 g/t Au (43-101 compliant). - Trenching results: 585 m at an average grade of 0.66 g/t Au, 0.5% Cu - Cerro Chorcha - results show elevated grades from resource estimate (Hole 1: 114 m @ 2.01% Cu, 0.43 g/t Au, 11.3 g/t Ag) - Cerro Chorcha - recent results in line with defined resource (Hole 3: 313.9m of 0.46% Cu, 1.1g/t Ag - Au results pending) - Purchased 100% of Cerro Quema property in Panama - historical reserve of 451,400oz Au and near-term production potential.CatalystsCerro Chorcha: Phase I drilling (3,600m/11 holes) focused on expansion of resource underway; estimated completion Q407-Q108.Azuero: Analysis of past drilling and trenching complete, 3 targets for future drilling planned - epithermal, high-sulphidation gold targetedCerro Quema: Mgmt formulating plan; potential production within 2 years, 60,000oz per year operation.Cerro Pleado / Rio Liri: Q108 drilling program focused on expansion of existinViento Frío: Targets identified from previous exploration efforts, drilling to commence in Q108.
Non-Brokered Private Placement
4.22 million shares @ $0.90 & 1/2 warrant @ $1.45 / 2yr
Same belt of dacitic volcanic rocks as the nearby Cerro Quema gold deposit (10 M tonnes at 1.23 g/t gold) Pitaloza concession - Rock, soil and stream-sediment sampling, trenching, and geologic mapping has identified three drill-ready targets, Bejucosa target, Caracucho target and Cementerio target. Previous exploration at Pitaloza intersected 26.52 m of oxide gold mineralization averaging 0.7 g/t Au and 15.25 meters of oxide gold mineralization averaging 1.8 g/t Au, respectively. Mineralization also encountered in underlying sulfide zone. 6-hole, 1,000-metre diamond-drilling program planned for Bejucosa - with 1,000-metre program planned for Caracucho and Cementerio - epithermal, high-sulphidation gold targeted.
Purchased 100% of property from Glencairn Resources (TSX:GGG). Property was previously explored by Campbell Resources with a feasibility study on the La Pava pit completed in late 2002. Similar to Glencairn's nearby Bellavista project in Costa Rica - heap leach, open pit potential.
NI 43-101 inferred resource 134 M tonnes grading 0.48% Cu and 0.059 g/t Au
Hydrothermal alteration centered on Cerro Pelado (Rio Liri) covers in excess of 5 km2 and consists of pervasive sulfidic sili-cification, advanced argillic alteration, and local vuggy silica. Gold mineralization is disseminated with 2% to 3% pyrite and fine-grained quartz. Bellhaven is the largest landholder in the Veraguas Gold Belt, site of two past producing gold mines, and host to numerous epithermal gold prospects. Bellhaven's highly prospective mineral concessions total 151 km² and and straddle the area between the Santa Rosa and Remance gold deposits. Phase I drilling (2,000 m) planned. Recently entered into a five year option agreement giving Australian Golden Cross Resources Ltd. (ASX: GCR) the right to earn 70% of the Los Hatillos Concession.
High silver values in the core and anomalous gold, silver, copper, lead, and zinc values in rock chip and soil samples
NI 43-101 non-compliant inferred resource: 2.1 M tonnes grading 1.71 g/t Au
Rio Liri concession: 1.66 M tonnes grading 1.35 g/t Au (Inferred Resources)
Optioned to Western Troy Capital Resources Inc. Explored by Minera Rayrock (acquired by Glamis Gold in 2001) between 1999 and 2001. Rayrock identified an NI 43-101 non-compliant inferred mineral resource. Previous exploration includes 1,918 soil samples and drilled 24 shallow holes totaling 1710 m. A preliminary leach test has been caried out. Stream sediment sampling, rock chip sampling, geologic mapping, topographic mapping, trenching and a ground geophysical survey are planned.
Silvercrest Mines Inc.
Exploration Timetable
Note: * JV partner Empire Minerals Corp funding exploration at Cerro Chorcha, Western Troy Capital Resources at Viento Frio and Golden Cross Resources at Los Hatillos.
Bellhaven Copper & Gold Inc.
Early stage gold targets at Cerro Pelado and Veraguas - 1,500 metres of first phase drilling planned
30 - 100%
Bellhaven Copper & Gold Inc.
Focused on Cu-Au exploration in Central America. Recently signed an exploration and development agreement for the highly prospective Cerro Chorcha copper property in Panama for a 65% interest - 3 year US$15 million work commitment
1866-599-5930Julio Benedetti
Underexplored region of Panama with porphyry Cu-Au potential identified
Radius Gold Inc.Condor Resources Inc.
Petaquilla Minerals Ltd.
$0.00
$0.20
$0.40
$0.60
$0.80
$1.00
$1.20
$1.40
11/1
3/06
12/1
3/06
1/13
/07
2/13
/07
3/13
/07
4/13
/07
5/13
/07
6/13
/07
7/13
/07
8/13
/07
9/13
/07
10/1
3/07
0.0
0.1
0.2
1
Vol (
M)
50 Day MA100 Day MA

Haywood’s Junior Mining Universe
Chris Thompson, P.Geo. (604-697-7433, [email protected]) Vol. 2, No. 4, November 14, 2007 — 54 Ben Asuncion (604-697-6149, [email protected])
TSXV:CXB Price $0.38 Shares O/S (M) 50.65 MCap (C$) (M) $19.00
Comment:
11/12/2007Investment Highlights Calibre Mining Corp. Chart
Website: www.calibremining.comTel:President/CEO:
Capital Structure (C$) (M)Shares O/S 50.65Shares F/D 62.34(C$) (M) Av Strike Basic ITM ProceedsCash & Equiv $5.00Options $0.51 7.34 0.46 $0.06Warrants $1.00 4.35 0.00 $0.00Total Cash & ITM 11.69 0.46 $5.06 Peer Group Companies Price (C$) MC (C$) (M)Market Cap $19.00 TSXV:OSR $1.02 $19.79
ASX:GCR $0.04 $19.54Trading Statistics (C$) TSXV:CXB $0.38 $19.00Last Sale Price $0.36 TSXV:CLZ $0.39 $12.3152 Week High $0.85 ASX:BCN $0.17 $5.8652 Week Low $0.32Average Daily Vol (M) 0.08 Estimated Burn Rate (C$) (M)Ownership (M) Management Institutional September 2007 cash & equiv $5.00 Shares 9.37 12.82 Point Leamington n/a % O/S 18.50% 25.31% Cargo -$0.12 Q407Analyst Coverage # Analysts Admin Costs -$0.53
0 Financings $0.00 Haywood Exploration Index Statistics ITM Options / Warrants $0.06 Dated Added 14-May-07 Year-end 2007 cash & equiv $4.41
Last Financing7/17/2006 $4.5 million
Key Properties Key PropertiesPoint Leamington 100% Cargo 70% Location: Newfoundland Location: New South Wales, AustraliaExploration Stage: Advanced Exploration Exploration Stage: Exploration Description Description/Potential: /Potential:
Current:Current:
Reserve/Resource:
Reserve/Resource: None
Beacon Minerals Limited
Non-Brokered Placements
Mineralization defined along a near-surface zone along a 500 m strike-length and to depths of 360 m. Planning additional exploration which would include diamond drilling, down-hole geophysics and metallurgical investigations.
8.7 million Units @ $0.52 per Unit plus half wt @ $1.00
Essex Prospect - previous drilling returned gold intercepts including 4.1 g/t Au over 14 m, 5.63 g/t Au over 9 m and 9.53 g/t Au over 6 m. Currently drilling a 6 hole, 1500 m reverse circulation ("RC") drilling program following up on a structural re-interpretation of property in December. Targeting down-dip extensions and within an intensely altered, steeply dipping gold and copper-bearing hydrothermal breccias - specifically areas of high relative magnetic susceptibility. Drilling has intersected significant porphyry-style copper and gold mineralization - 18 m of 0.22% Cu, 0.1 g/t Au. Phase II diamond-drilling program planned in Q407 to test for blind higher-grade porphyry copper-gold mineralization at depth.
Volcanogenic massive sulphide deposit discovered in 1971 by Noranda. Delineated by more than 21,000 m of diamond drilling in 72 core holes.
NI 43-101 Inferred resource: 12.3 million tonnes grading 1.92% Zn, 0.88 g/t Au, 0.28% Cu and 16.94 g/t Ag (348,000 oz Au and 520 million lbs Zn plus copper and silver credits).
Cybele Resources managed - 60 sq km - gold-copper porphyry potential. Cadia Hill-Ridgeway located 13 km to east.
Exploration Timetable
Canasil Resources, Inc.
Golden Cross Resources Ltd.
Calibre Mining Corp.
An exploration/development company focused on acquisition and development of world-wide precious and base metal assets. In addition to exploration in Canada and Australia, focus is directed at reviewing projects for acquisition.
Calibre Mining Corp.
Robert D. Brown
- Recently changed name from TLC Ventures to Calibre Mining - Calibre is a classic "shell" company: high quality management (recently appointed) with a focus on new gold acquisitions - Company managed by ex Barrick personnel - Robert Brown (President & CEO); David Heberlein (VP Exploration) - On-going exploration programs in Canada and Australia are not likely material to the future of the company - Point Leamington: Hosts Inferred resource - 12.3 million tonnes grading 1.92% Zn, 0.88 g/t Au, 0.28% Cu and 16.94 g/t Ag - 100% ownership of Cybele Resources (Australia) Pty Ltd - Well funded - $5 million in cashCatalystsCargo: Phase II of drill program currently underway - results pending.Point Leamington: Planning additional exploration which would include diamond drilling, down-hole geophysics and metallurgical investigations Q407-Q108.
604-681-9944
Oro Gold Resources Ltd.
$0.00
$0.10
$0.20
$0.30
$0.40
$0.50
$0.60
$0.70
$0.80
$0.90
$1.00
11/1
3/06
12/1
3/06
1/13
/07
2/13
/07
3/13
/07
4/13
/07
5/13
/07
6/13
/07
7/13
/07
8/13
/07
9/13
/07
10/1
3/07
0.00.10.20.30.40.5
1
Vol (
M)
50 Day MA100 Day MA

Haywood’s Junior Mining Universe
Chris Thompson, P.Geo. (604-697-7433, [email protected]) Vol. 2, No. 4, November 14, 2007 — 55 Ben Asuncion (604-697-6149, [email protected])
Target Price, C$ N/A Shares O/S, million
Current Price, C$ $3.27 Shares F/D, million
Rating: N/A 52-Week High, C$ $4.62 Market Capitalization, US$M
Target Price: N/A 52-Week Low, C$ $1.90 Company CEO
TSX:CZZ Average Daily Vol (M) 0.15 Company Web Site
Investment Highlights Haywood Developer Index (base=100) Date Added:Performance at Jan 01/05 100 Performance at November 12, 2007 438
Share Capital Dilution
Number Price
Warrants 1.2M C$2.22
Options 7.7M C$2.08
Warrants + Options 8.9M C$1.49
Recent Financing
Major Shareholders
O/S (%) F/D (%)
News Flow / Catalysts European Funds 22%
American Funds 18%
Quebec Funds 5%
Management and Directors 10%
Norilsk 7%
Retail Investors in Alberta 23%
Total 85%Balance Sheet and Capitalization
US$M S$ / O/S Share C$M C$ / O/S Share Estimated Burn RateMarket Capitalization $326.3 $326.3 (C$)(M) Exploration TimetableCurrent Cash $105.0 $105.0 June 30, 2007 cash & equivF/D Cash Adds $13.3 $13.3 Raglan South NickelWorking Capital $10.6 $10.6 Exploration - OtherLong-term Debt $0.0 $0.0 Admin CostsBook Value $48.1 $48.1 FinancingsEnterprise Value (EV) $315.7 $315.7 ITM Options / Warrants
EV = Market Capitalization - Working Capital + Long-term Debt Year-end 2007 cash & equivC$/US$ FX Rate: 1.00
Key PropertiesNunavik Nickel Project Other
Ownership: 100% Ownership: 100%Location: Quebec Location: Quebec / Ontario
Exploration Stage: Feasiblity Exploration Stage: Generative ExplorationDescription/Potential:
Current:
Current:
Royalties Business
Reserves & Resources:Tonnes 3E 3E Ni Cu Co(000's) g/t (Moz) (%) (%) (%)
Measured & Indicated Resource 16,183 2.73 1.4 0.9 1.1 0.0Inferred Resource 723 2.31 0.1 0.9 0.9 0.0Reserve 11,296 2.31 0.8 1.0 1.1 -
TSX:CZZ Consensus Estimate Summary (Reuters data via Capital IQ)Analysts
2007 Consensus Estimate 12008 Consensus Estimate n/a2009 Consensus Estimate n/a
Analysts Buy Rating Hold Rating Sell Rating Mean Target High LowConsensus Valuation 2 1 1 - - - -
P / NAVFNX Mining Company, Inc. N/ANorth American Palladium Ltd. N/AFirst Quantum Minerals Ltd. N/ACanadian Royalties Inc. 1.3xFirst Nickel Inc. N/AUrsa Major International Inc. N/ALundin Mining Corp. N/A
Peer Group Average 1.3x
$0.11
$1.05 $1.05$0.13 $0.13
- Canadian Royalties controls over 1,000 square kilometres of the +50 kilometre long South Raglan Trend of nickel-copper-cobalt-PGM mineralization in Northern Québec. The trend is to the south of and parallel with the Raglan Trend, which hosts Xstrata’s established Raglan mine. - Canadian Royalties completed a Bankable Feasibility Study (BFS) for 3 deposits in the Nunavik project in June 2007 and is working towards permitting by Q108 and production in 2010. The $466 million combined open pit and underground mining operation would feed a 3,500 tonne/day concentrator producing 11,800 tonnes nickel, 7,600 tonnes copper, 425 tonnes cobalt, and 93,100 ounces of PGM per annum in early years. - The Nunavik project has proven and probably reserves of 11.3 million tonnes grading 0.97% nickel, 1.13% copper, 0.45 grams per tonne platinum and 1.86 grams per tonne palladium. - The project is highly leveraged to metal prices and exploration success. The BFS did not include the known Mequillon and recently discovered high-grade Allammaq deposits, which are undergoing further drill exploration as a prelude to integration into the BFS. Many targets remain on the extensive property. - Permitting is ongoing with target commencement of production in Q210. - The Company recently completed an offtake agreement and private placement with Russia nickel miner Norilsk.
Reglan South: - Year end exploration results, including newly discovered Allammaq and Puimajuq deposits and other potential targets. - Mequillon update and BFS Addendum by year-end. - Permitting and Benefits Agreement with local Inuit communities. - Closing of Norilsk and other agreements. - Will Xstrata “tolerate” Norilsk’s incursion into its own “backyard” and future resource base?
$3.27 $3.27
n/an/a
High LowUS$2.57 US$2.57
n/an/a
n/a
n/a$2.57
n/a
n/a
C$2,897C$361
C$326C$123
US$2.57
n/a
C$6.25
NAV Consensus Estn/a
Mrkt Cap
9.8
0.0 $0.00
22.9
7.0
Q307-Q108
Proceeds
www.canadianroyalties.com
Expiry
March 2008 - February 2016
US$2.8M
99.8
108.7
March 2008 - March 2016
$326.3
10/29/2007
Richard Faucher
Canadian Royalties Inc. (TSX:CZZ)
Price
Mean NAV
n/an/a
C$100.08$0.48 $0.48$3.16 $3.16
November 12, 2007
C$33.70
Q307-Q208Q307-Q208
21.9
US$13.3M
US$10.5M
Early stage activity on numerous gold/base metal and diamond projects in Quebec and Ontario
October 10, 2007 - $25 million non-brokered private placement (7.25M common shares @ $3.45)
O/S (millions) F/D (millions)
5.0
(C$0.30)(C$15.00)(C$50.00)
84.6
C$4.95
Canadian Royalties has initiated the development of an independent, stand-alone nickel-copper mine on its Nunavik Nickel Project, located 20 kilometres south of Xstrata Nickel's Raglan Mine in northern Quebec. Canadian Royalties is proceeding with permitting applications, as well as exploration for additional resources.
$0.11
C$52.99
Stake in over 100 properties in the Abitibi greenstone belt and the James Bay and Nunavik regions of Northern Quebec through a combination of net smelter return royalties, partial property interests, cash payments, and equities (shares) receinved from the optionee companies funding the exploration.
39,380.0
Properties (some 36) within the Abitibi greenstone belt of Quebec and Ontario: key properties include Hughway and Bidlamaque. Also has the Bijoux diamond joint venture in northern Quebec, consisting of numerous early stage blocks aquired on regional magentic and geochemistey anomalies. Many of these projects can be considered "drill and kill" - develop targets followed by a drill test and move on if unsuccesful.
C$21C$4,320
18.0
C$13.27
C$6,362
C$10.43C$0.61
C$88.66C$3.27C$0.87
$1.00
$1.50
$2.00
$2.50
$3.00
$3.50
$4.00
$4.50
$5.00
11/1
3/06
12/1
3/06
1/13
/07
2/13
/07
3/13
/07
4/13
/07
5/13
/07
6/13
/07
7/13
/07
8/13
/07
9/13
/07
10/1
3/07
0.00.51.01.52.02.53.0
1
Vol
(M)
50 Day MA100 Day MA
The company controls over 1,000 sq. km with multiple discoveries along a 50 km trend. Five of the 6 defined deposits contribute to the total resources for the company and three deposits (Mesamax, Expo, Ivakkak) were considered in a bankable feasibility study completed June 2007 providing a report suitable for project financing. The study demonstrates robust economics with a 1.9-2.9 year payback (assuming US$10/lb-US$6/lb Ni) and over the first 4 years will provide in concentrate; 11,800 tonnes per year nickel, 17,600 tonnes per year copper, 14,500 oz per year platinum, and 78,600 oz per year palladium. The company has competed two financings totaling $100M over Q3 2007 that will be used for the development of the Raglan Nickel Project. Drilling continues to expand mineralization along strike and add to the total resources. The September discovery of the Allammaq deposit steps 3 km east of the furthest east deposit, Mesamax, along the trend and is open in all directions. Additonal resources were estimated from the Mequillon deposit in September 2007. All the activity has attracted the attention of Norilsk Nickel and led to the signing of several agreements (a sales agreement for nickel concentrates, a C$25 million share subscription which has been completed, and an option for additional financing at a later date to ensure project completion) October 2007 aimed at expediting development.
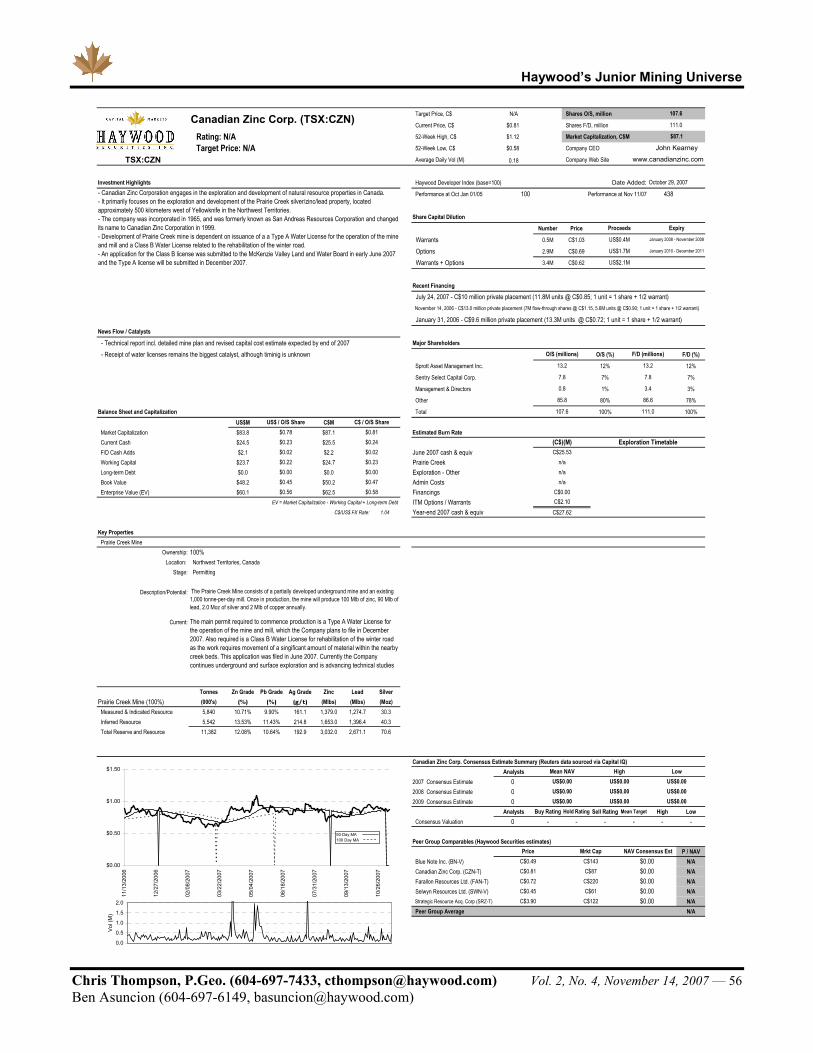
Haywood’s Junior Mining Universe
Chris Thompson, P.Geo. (604-697-7433, [email protected]) Vol. 2, No. 4, November 14, 2007 — 56 Ben Asuncion (604-697-6149, [email protected])
Target Price, C$ N/A Shares O/S, million
Current Price, C$ $0.81 Shares F/D, million
Rating: N/A 52-Week High, C$ $1.12 Market Capitalization, C$M
Target Price: N/A 52-Week Low, C$ $0.58 Company CEO
TSX:CZN Average Daily Vol (M) 0.18 Company Web Site
Investment Highlights Haywood Developer Index (base=100) Date Added:
Performance at Oct Jan 01/05 100 Performance at Nov 11/07 438
Share Capital Dilution
Number Price
Warrants 0.5M C$1.03
Options 2.9M C$0.69
Warrants + Options 3.4M C$0.62
Recent Financing
News Flow / Catalysts
- Technical report incl. detailed mine plan and revised capital cost estimate expected by end of 2007 Major Shareholders
- Receipt of water licenses remains the biggest catalyst, although timinig is unknown O/S (%) F/D (%)
Sprott Asset Management Inc. 12% 12%
Sentry Select Capital Corp. 7% 7%
Management & Directors 1% 3%
Other 80% 78%
Balance Sheet and Capitalization Total 100% 100%US$M C$M
Market Capitalization $83.8 $87.1 Estimated Burn RateCurrent Cash $24.5 $25.5F/D Cash Adds $2.1 $2.2 June 2007 cash & equivWorking Capital $23.7 $24.7 Prairie CreekLong-term Debt $0.0 $0.0 Exploration - OtherBook Value $48.2 $50.2 Admin CostsEnterprise Value (EV) $60.1 $62.5 Financings
EV = Market Capitalization - Working Capital + Long-term Debt ITM Options / WarrantsC$/US$ FX Rate: 1.04 Year-end 2007 cash & equiv
Key PropertiesPrairie Creek Mine
Ownership: 100%Location: Northwest Territories, Canada
Stage: Permitting
Description/Potential:
Current:
Tonnes Zn Grade Pb Grade Ag Grade Zinc Lead SilverPrairie Creek Mine (100%) (000's) (%) (%) (g/t) (Mlbs) (Mlbs) (Moz)Measured & Indicated Resource 5,840 10.71% 9.90% 161.1 1,379.0 1,274.7 30.3Inferred Resource 5,542 13.53% 11.43% 214.8 1,653.0 1,396.4 40.3Total Reserve and Resource 11,382 12.08% 10.64% 192.9 3,032.0 2,671.1 70.6
Canadian Zinc Corp. Consensus Estimate Summary (Reuters data sourced via Capital IQ)Analysts
2007 Consensus Estimate 02008 Consensus Estimate 02009 Consensus Estimate 0
Analysts Buy Rating Hold Rating Sell Rating Mean Target High LowConsensus Valuation 0 - - - - - -
Peer Group Comparables (Haywood Securities estimates)P / NAV
Blue Note Inc. (BN-V) N/ACanadian Zinc Corp. (CZN-T) N/AFarallon Resources Ltd. (FAN-T) N/ASelwyn Resources Ltd. (SWN-V) N/AStrategic Resource Acq. Corp (SRZ-T) N/APeer Group Average N/A
C$0.72
C$0.49
- Canadian Zinc Corporation engages in the exploration and development of natural resource properties in Canada. - It primarily focuses on the exploration and development of the Prairie Creek silver/zinc/lead property, located approximately 500 kilometers west of Yellowknife in the Northwest Territories.- The company was incorporated in 1965, and was formerly known as San Andreas Resources Corporation and changed its name to Canadian Zinc Corporation in 1999. - Development of Prairie Creek mine is dependent on issuance of a a Type A Water License for the operation of the mine and mill and a Class B Water License related to the rehabilitation of the winter road. - An application for the Class B license was submitted to the McKenzie Valley Land and Water Board in early June 2007 and the Type A license will be submitted in December 2007.
The Prairie Creek Mine consists of a partially developed underground mine and an existing 1,000 tonne-per-day mill. Once in production, the mine will produce 100 Mlb of zinc, 90 Mlb of lead, 2.0 Moz of silver and 2 Mlb of copper annually.
The main permit required to commence production is a Type A Water License for the operation of the mine and mill, which the Company plans to file in December 2007. Also required is a Class B Water License for rehabilitation of the winter road as the work requires movement of a singificant amount of material within the nearby creek beds. This application was filed in June 2007. Currently the Company continues underground and surface exploration and is advancing technical studies
US$0.00US$0.00
Mean NAVUS$0.00
$0.81
C$3.90
Mrkt Cap
C$220C$61C$122
C$143
C$0.45
C$87C$0.81
Price
Exploration Timetable
November 14, 2006 - C$13.0 million private placement (7M flow-through shares @ C$1.15, 5.6M units @ C$0.90; 1 unit = 1 share + 1/2 warrant)
O/S (millions) F/D (millions)
13.2
111.0107.6
$0.58
$0.00
13.2
US$2.1M
January 2010 - December 2011
86.6
US$1.7M
January 31, 2006 - C$9.6 million private placement (13.3M units @ C$0.72; 1 unit = 1 share + 1/2 warrant)
July 24, 2007 - C$10 million private placement (11.8M units @ C$0.85; 1 unit = 1 share + 1/2 warrant)
7.8
0.8 3.4
85.8
Canadian Zinc Corp. (TSX:CZN)
US$ / O/S Share C$ / O/S Share
C$27.62
$0.24
$0.23
7.8
$0.00$0.45$0.56
107.6
111.0
January 2008 - November 2008
$87.1
October 29, 2007
John Kearney
www.canadianzinc.com
Expiry
US$0.4M
Proceeds
$0.02
$0.47
$0.78$0.23$0.02$0.22
NAV Consensus Est
$0.00$0.00
$0.00$0.00
$0.00
(C$)(M)C$25.53
n/an/an/a
C$0.00C$2.10
High LowUS$0.00 US$0.00
US$0.00US$0.00
US$0.00US$0.00
$0.00
$0.50
$1.00
$1.50
11/1
3/20
06
12/2
7/20
06
02/0
8/20
07
03/2
2/20
07
05/0
4/20
07
06/1
8/20
07
07/3
1/20
07
09/1
3/20
07
10/2
6/20
07
0.0
0.5
1.0
1.5
2.0
1
Vol (
M)
50 Day MA100 Day MA

Haywood’s Junior Mining Universe
Chris Thompson, P.Geo. (604-697-7433, [email protected]) Vol. 2, No. 4, November 14, 2007 — 57 Ben Asuncion (604-697-6149, [email protected])
Target Price, C$ $1.70 Shares O/S, millionCurrent Price, C$ $1.08 Shares F/D, million
Rating: SECTOR OUTPERFORM Return, % 57% Market Capitalization, US$M Target Price: C$1.70 52-Week High / Low, C$ $1.32 / $0.54 Company CEO Target Price Metric: 1.0x After-Tax Corporate NAV Daily Volume (100-day average) 2,252,456 Company Web Site
Investment Highlights Haywood Developer Index (base=100) Date Added:Performance at January 1, 2005: Performance at November 12, 2007:
Share Capital DilutionNumber Price
Warrants 0.0M C$0.00Options 11.7M C$0.43Warrants + Options 11.7M C$0.43
C$/US$ FX Rate: 1.04Catalysts / News Flow- Continued drilling success at Marcona through 2007 Recent Financings- Mina Justa resource update in Q1/08- Mina Justa bankable feasibility study results in Q2/08
Balance Sheet and Capitalization Major ShareholdersUS$M C$M O/S (%) F/D (%)
Market Capitalization $316.4 $329.1 Rio Narcea Gold Mines Ltd. 20% 19%Current Cash $22.6 $23.5 Caisse de Depot et Placement du Quebec 6% 6%F/D Cash Adds $4.8 $5.0 Management and Directors 1% 1%Working Capital $22.2 $23.1 Other 73% 74%Long-term Debt $0.0 $0.0 Total 100% 100%Book Value $73.4 $76.3Enterprise Value (EV) $294.2 $306.0 Corporate NAV Summary and Sensitivity
EV = Market Capitalization - Working Capital + Long-term Debt Forecast Copper Price, US$/lb $0.75 $1.25 $1.75 $2.25C$/US$ FX Rate: 1.04 Forecast Silver Price, US$/oz $10.50 $10.50 $10.50 $10.50
Corporate Adjustments, US$M ($74) ($74) ($74) ($74)Financial Forecast After-Tax Project NAV(10%), US$M $0 $315 $633 $945
2007 2008 2009 2010 2011 2012 Additional Exploration Credit, US$M $105 $105 $105 $105Forecast Copper Price, US$/lb $3.25 $3.25 $2.75 $2.50 $2.25 $1.75 Corporate NAV, US$M $31 $347 $664 $976Forecast Silver Price, US$/oz $13.50 $14.50 $13.50 $11.50 $10.50 $10.50 Corporate Adjustments, C$ / F/D share ($0.17) ($0.17) ($0.17) ($0.17)C$/US$ FX Rate 1.08 1.04 1.09 1.14 1.16 1.17 After-Tax Project NAV(10%), C$ / F/D share $0.00 $0.72 $1.44 $2.15Shares O/S, millions 303 373 443 443 443 443 Additional Exploration Credit, C$ / F/D share $0.24 $0.24 $0.24 $0.24Revenue, US$M $0 $0 $0 $395 $296 $159 Corporate NAV, C$ / F/D share $0.07 $0.79 $1.51 $2.23Mine Site Expense, US$M $0 $0 ($37) ($86) ($88) ($97) Current Price / Corporate NAV 15.0x 1.4x 0.7x 0.5xCorporate G&A, US$M ($2) ($2) ($2) ($2) ($2) ($2) Target Price / Corporate NAV 23.7x 2.2x 1.1x 0.8xEBITDA, US$M ($2) ($2) ($39) $307 $206 $60 Haywood model is based on a US$2.50/lb copper price in 2010, US$2.25/lb in 2011, and US$1.75/lb thereafter.EV / EBITDA - - - 1.0x 1.4x 4.9x Haywood model is based on a US$11.50/oz silver price in 2010, and US$10.50/oz thereafter.DD&A, US$M $0 $0 ($28) ($84) ($84) ($85) Additional exploration credit includes credit for copper resource.Earnings, US$M ($2) ($17) ($89) $137 $74 ($29) Model shares F/D (fully financed), million: 456EPS, US$ ($0.01) ($0.05) ($0.20) $0.31 $0.17 ($0.07) Model fully financed F/D shares assumes a US$168 million equity financing @ C$1.25 per share.Current Price / EPS - - - 3.1x 5.5x - C$/US$ FX Rate: 1.04Target Price / EPS - - - 4.8x 8.6x -Cash Flow Before W/C Changes, US$M ($2) ($17) ($61) $240 $158 $56 Mina Justa Metal Inventory - Model Mineable, Reserve, and Resource (70% owned)CFPS, US$ ($0.01) ($0.05) ($0.14) $0.54 $0.36 $0.13 Tonnes Cu Grade Ag Grade Copper Silver EV/lb CuCurrent Price / CFPS - - - 1.8x 2.6x 7.1x (000's) (%) (g/t) (Blb) (Moz) (US$/lb)Target Price / CFPS - - - 2.8x 4.1x 11.2x Model Mineable (100%) 241,000 0.82% 8.8 4.4 68.1 $0.067Copper Price CFPS Sensitivity, US$ $0.00 $0.00 $0.00 $0.05 $0.05 $0.05 Model Payable (100%) - - - 3.7 49.0 $0.079CAPEX, US$M ($26) ($140) ($280) ($2) ($2) ($2) Proven and Probable Reserve (100%) - - - - - -Proceeds from Equity Financing, US$M $0 $168 $0 $0 $0 $0 Additional Measured & Indicated Resource (100%) 347,000 0.71% 14.9 5.4 166.1 $0.054Proceeds from Debt Financing, US$M $0 $252 $0 $0 $0 $0 Inferred Resource (100%) 128,000 0.60% 27.9 1.7 114.6 -Debt Repayment, US$M $0 $0 $0 ($50) ($50) ($50) Total Reserve and Resource (100%) 475,000 0.68% 18.4 7.1 280.7 $0.041Free Cash Flow, US$M ($28) $263 ($341) $188 $106 $4 Attributable Reserve - - - - - -FCPS, US$ ($0.09) $0.70 ($0.77) $0.42 $0.24 $0.01 Attributable Reserve and Resource 332,500 0.68% 18.4 5.0 196.5 $0.059
Copper price CFPS sensitivity is based on a US$0.25/lb change in forecast copper price.
Mina Justa Production Profile (70% owned)RLOM 2008 2009 2010 2011 2012
Ore Tonnes Mined, millions 241 - 4 4 8 12Ore Tonnes Milled, millions 241 - - 8 8 12Strip Ratio 1.9 - 7.9 11.3 5.6 3.4Oxide Copper Grade Milled, % 0.64% - - 1.50% 1.25% 0.57%Sulphide Copper Grade Milled, % 1.30% - - - - -Total Copper Grade Milled, % 0.82% - - 1.50% 1.25% 0.57%Oxide Copper Recovery, % 85% - - 85% 85% 85% Chariot Resources Ltd. Consensus Estimate Summary (Reuters data sourced via Capital IQ)Sulphide Copper Recovery, % 88% - - - - - Analysts Mean EPS High / Low Haywood vs. Cons. Mean CFPS High / Low Haywood vs. Cons.
Total Copper Recovery, % 86% - - 85% 85% 85% 2007 Consensus Estimate 1 (US$0.01) (US$0.01) / (US$0.02) 51% (US$0.01) (US$0.01) / (US$0.02) 61%Copper Cathode Production (100%), Mlb 2,111 - - 225 187 128 2008 Consensus Estimate 1 (US$0.01) US$0.01 / (US$0.13) 452% (US$0.01) US$0.02 / (US$0.11) 452%
1,610 - - - - - 2009 Consensus Estimate 1 (US$0.02) (US$0.01) / (US$0.07) 819% US$0.66 US$1.02 / US$0.27 (21%)Total Copper Production (100%), Mlb 3,721 - - 225 187 128 Analysts SO Rating SP Rating SU Rating Mean Target High / Low Haywood vs. Cons.
Attributable Copper Production, Mlb 2,604 - - 157 131 90 Consensus Valuation 6 5 1 - US$1.59 US$1.85 / US$1.35 107%Attributable Silver Production, Moz 34.3 - - - - -Operating Cost, US$/tonne milled $9.70 - - $13.60 $14.40 $11.00 Peer Group Comparables (Haywood Securities estimates)Copper Cash Cost (on-site, before credits), US$/lb $0.65 - - $0.50 $0.65 $1.05 Price Corp NAV Price / NAV 2007 CFPS Price / CFPS 2008 CFPS Price / CFPSCopper Cash Cost (on-site, net of credits), US$/lb $0.45 - - $0.50 $0.65 $1.05 Chariot Resources Ltd. (CHD-T) C$1.08 US$1.64 0.6x (US$0.01) - (US$0.05) -Total Copper Cash Cost (before of credits), US$/lb $0.85 - - $0.55 $0.70 $1.10 Anvil Mining Ltd. (AVM-T) C$14.15 US$17.07 0.8x US$2.20 6.2x US$2.85 4.8xTotal Copper Cash Cost (net of credits), US$/lb $0.65 - - $0.55 $0.70 $1.10 First Quantum Minerals Ltd. (FM-T) C$88.66 US$50.87 1.7x US$9.80 8.7x US$13.85 6.2x
Frontera Copper Corp. (FCC-T) C$6.80 US$5.95 1.1x US$1.10 5.9x US$1.44 4.5xImperial Metals Corp. (III-T) C$16.12 US$15.40 1.0x US$5.73 2.7x US$5.95 2.6xKatanga Mining Ltd. (KAT-T) C$16.52 US$15.77 1.0x US$0.04 - US$2.00 7.9xLundin Mining Corp. (LUN-T) C$10.43 US$10.69 0.9x US$2.00 5.0x US$2.15 4.7xNevsun Resources Ltd. (NSU-T) C$1.89 US$3.23 0.6x (US$0.08) - (US$0.04) -Sherwood Copper Corp. (SWC-V) C$6.20 US$5.28 1.1x US$0.30 - US$1.60 3.7xPeer Group Average - - 1.0x - 5.7x - 4.9x
C$/US$ FX Rate: 1.04
Stefan Ioannou, Ph.D. - Mining [email protected] 416-507-2309
Chariot Resources Ltd. (CHD-T) 304.7316.4
$0.07 $0.08
$316.4Ulli Rath
www.chariotresources.com
-March 2008 - February 2016
Oct 29/07Chariot owns a 70% interest in the Marcona copper project in Peru, which is the subject of a bankable feasibility study expected to be complete in Q2/08. With production start-up anticipated in 2010, Marcona is expected to produce up to 250 million pounds of copper annually (cathode and concentrate) at an average total cash cost of US$0.70 per pound net of credits over an 18-year base-case open-pit mine life. However, given the project’s significant resource upside, we anticipate that the scope of work at Marcona will move towards higher throughput and/or longer life. Proximity to key infrastructure, including port facilities and power, enhances the project’s value and positions Marcona as an attractive takeover target within the mid- to senior-tier base metals universe.
$0.07 $0.08$0.02 $0.02
$0.97 $1.00
$0.00 $0.00$0.24 $0.25
$748($0.17)
$105
Haywood Model($74)$716
$1.700.6x1.0x
$1.63$0.24
Expiry
March 21, 2006 - C$18.275M public offering (42.5M common shares @ C$0.43 per share)January 17, 2005 - C$29.3M public offering (118.2M units @ C$0.25; 1 unit = 1 share + 1/2 warrant @ C$0.35 to December 22, 2006)
O/S (millions)
ProceedsUS$0.0MUS$4.8MUS$4.8M
60.2F/D (millions)
60.2
316.4
17.93.0
223.6304.7
438100
Payable Copper in Concentrate Production (100%), Mlb
US$ / O/S Share$1.04
C$ / O/S Share$1.08
17.93.0
235.3
0
75
150
225
2007 2008 2009 2010 2011 2012 2013 2014 2015 2016 2017 2018 2019 2020 2021 2022
Attrib
utable
Cop
per
Prod
uctio
n (Ml
b)
$0.00
$0.50
$1.00
$1.50
Total
Cop
per C
ash C
ost
(net
of cre
dits,
US$/l
b)
Copper Cathode Copper in Concentrate Cash Cost
Chariot Resources Ltd. (CHD-T)
$0.00
$0.50
$1.00
$1.50
Nov-06 Jan-07 Mar-07 May-07 Jul-07 Sep-07 Nov-07
Share Price 50 Day M.A. 200 Day M.A.
Volume in Millions
0.0
5.0
10.0
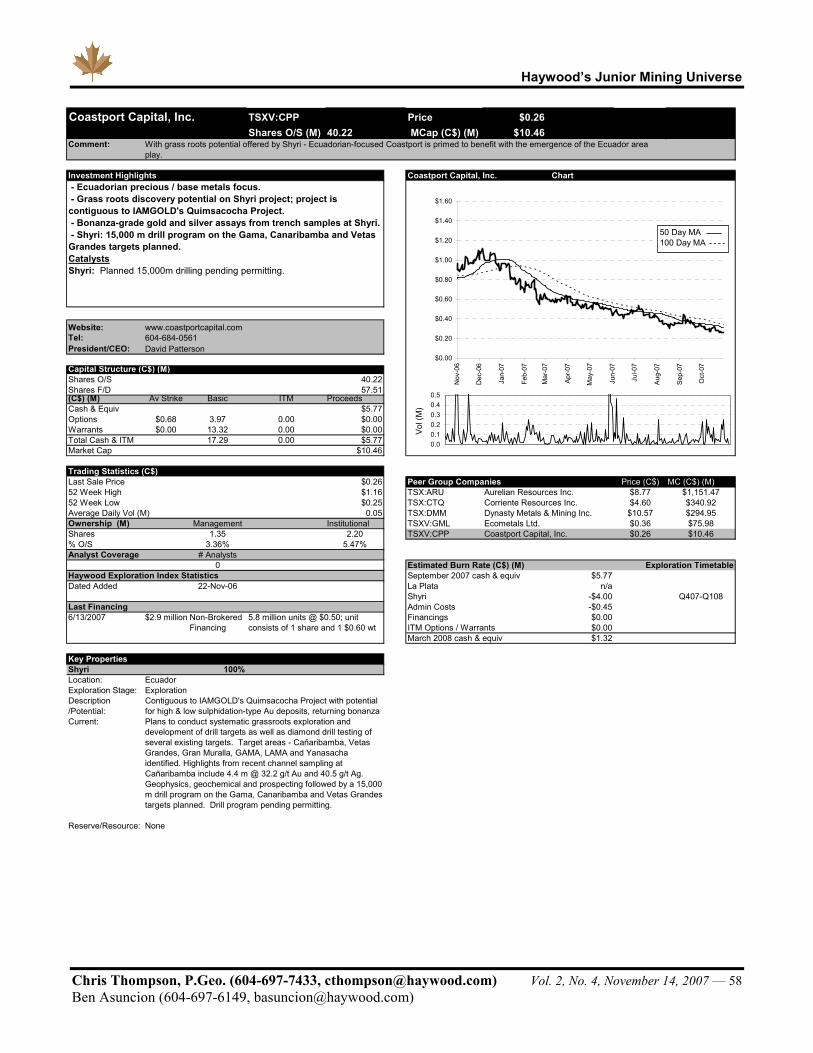
Haywood’s Junior Mining Universe
Chris Thompson, P.Geo. (604-697-7433, [email protected]) Vol. 2, No. 4, November 14, 2007 — 58 Ben Asuncion (604-697-6149, [email protected])
TSXV:CPP Price $0.26 Shares O/S (M) 40.22 MCap (C$) (M) $10.46
Comment:
11/12/2007Investment Highlights Coastport Capital, Inc. Chart
Website: www.coastportcapital.comTel:President/CEO:
Capital Structure (C$) (M)Shares O/S 40.22Shares F/D 57.51(C$) (M) Av Strike Basic ITM ProceedsCash & Equiv $5.77Options $0.68 3.97 0.00 $0.00Warrants $0.00 13.32 0.00 $0.00Total Cash & ITM 17.29 0.00 $5.77Market Cap $10.46
Trading Statistics (C$) Last Sale Price $0.26 Peer Group Companies Price (C$) MC (C$) (M)52 Week High $1.16 TSX:ARU $8.77 $1,151.4752 Week Low $0.25 TSX:CTQ $4.60 $340.92Average Daily Vol (M) 0.05 TSX:DMM $10.57 $294.95Ownership (M) Management Institutional TSXV:GML $0.36 $75.98Shares 1.35 2.20 TSXV:CPP $0.26 $10.46% O/S 3.36% 5.47%Analyst Coverage # Analysts
0 Estimated Burn Rate (C$) (M)Haywood Exploration Index Statistics September 2007 cash & equiv $5.77 Dated Added 22-Nov-06 La Plata n/a
Shyri -$4.00 Q407-Q108Last Financing Admin Costs -$0.45 6/13/2007 $2.9 million Non-Brokered Financings $0.00
Financing ITM Options / Warrants $0.00 March 2008 cash & equiv $1.32
Key PropertiesShyri 100%Location: EcuadorExploration Stage: ExplorationDescription/Potential:Current:
Reserve/Resource: None
Contiguous to IAMGOLD's Quimsacocha Project with potential for high & low sulphidation-type Au deposits, returning bonanza
Dynasty Metals & Mining Inc.
Exploration Timetable
Coastport Capital, Inc.
Plans to conduct systematic grassroots exploration and development of drill targets as well as diamond drill testing of several existing targets. Target areas - Cañaribamba, Vetas Grandes, Gran Muralla, GAMA, LAMA and Yanasacha identified. Highlights from recent channel sampling at Cañaribamba include 4.4 m @ 32.2 g/t Au and 40.5 g/t Ag. Geophysics, geochemical and prospecting followed by a 15,000 m drill program on the Gama, Canaribamba and Vetas Grandes targets planned. Drill program pending permitting.
5.8 million units @ $0.50; unit consists of 1 share and 1 $0.60 wt
Corriente Resources Inc.
Ecometals Ltd.
Coastport Capital, Inc.
With grass roots potential offered by Shyri - Ecuadorian-focused Coastport is primed to benefit with the emergence of the Ecuador area play.
Aurelian Resources Inc.
604-684-0561David Patterson
- Ecuadorian precious / base metals focus. - Grass roots discovery potential on Shyri project; project is contiguous to IAMGOLD's Quimsacocha Project. - Bonanza-grade gold and silver assays from trench samples at Shyri. - Shyri: 15,000 m drill program on the Gama, Canaribamba and Vetas Grandes targets planned.CatalystsShyri: Planned 15,000m drilling pending permitting.
$0.00
$0.20
$0.40
$0.60
$0.80
$1.00
$1.20
$1.40
$1.60
Nov
-06
Dec
-06
Jan-
07
Feb-
07
Mar
-07
Apr
-07
May
-07
Jun-
07
Jul-0
7
Aug
-07
Sep
-07
Oct
-07
0.00.10.20.30.40.5
1
Vol (
M)
50 Day MA100 Day MA
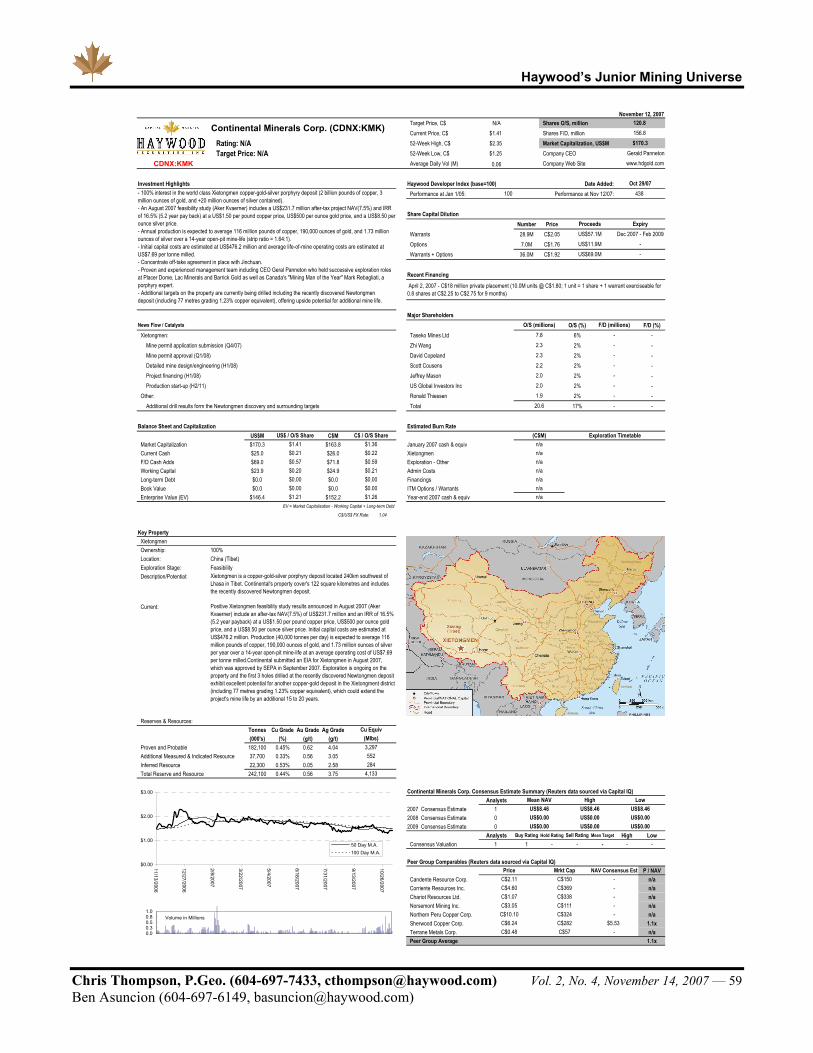
Haywood’s Junior Mining Universe
Chris Thompson, P.Geo. (604-697-7433, [email protected]) Vol. 2, No. 4, November 14, 2007 — 59 Ben Asuncion (604-697-6149, [email protected])
Target Price, C$ N/A Shares O/S, millionCurrent Price, C$ $1.41 Shares F/D, million
Rating: N/A 52-Week High, C$ $2.35 Market Capitalization, US$M
Target Price: N/A 52-Week Low, C$ $1.25 Company CEO
CDNX:KMK Average Daily Vol (M) 0.06 Company Web Site
Investment Highlights Haywood Developer Index (base=100) Date Added:Performance at Jan 1/05: Performance at Nov 12/07:
Share Capital DilutionNumber Price
Warrants 28.9M C$2.05Options 7.0M C$1.76Warrants + Options 36.0M C$1.92
Recent Financing
Major ShareholdersNews Flow / Catalysts O/S (%) F/D (%)
Xietongmen: Taseko Mines Ltd 6% -Mine permit application submission (Q4/07) Zhi Wang 2% -Mine permit approval (Q1/08) David Copeland 2% -Detailed mine design/engineering (H1/08) Scott Cousens 2% -Project financing (H1/08) Jeffrey Mason 2% -Production start-up (H2/11) US Global Investors Inc 2% -
Other: Ronald Thiessen 2% -Additional drill results form the Newtongmen discovery and surrounding targets Total 17% -
Balance Sheet and Capitalization Estimated Burn RateUS$M C$M
Market Capitalization $170.3 $163.8 January 2007 cash & equivCurrent Cash $25.0 $26.0 XietongmenF/D Cash Adds $69.0 $71.8 Exploration - OtherWorking Capital $23.9 $24.9 Admin CostsLong-term Debt $0.0 $0.0 FinancingsBook Value $0.0 $0.0 ITM Options / WarrantsEnterprise Value (EV) $146.4 $152.2 Year-end 2007 cash & equiv
EV = Market Capitalization - Working Capital + Long-term Debt
C$/US$ FX Rate: 1.04
Key PropertyXietongmenOwnership: 100%Location: China (Tibet)Exploration Stage: FeasibilityDescription/Potential:
Current:
Reserves & Resources:
Tonnes Cu Grade Au Grade Ag Grade(000's) (%) (g/t) (g/t)
Proven and Probable 182,100 0.45% 0.62 4.04Additional Measured & Indicated Resource 37,700 0.33% 0.56 3.05Inferred Resource 22,300 0.53% 0.05 2.58Total Reserve and Resource 242,100 0.44% 0.56 3.75
Continental Minerals Corp. Consensus Estimate Summary (Reuters data sourced via Capital IQ)Analysts
2007 Consensus Estimate 12008 Consensus Estimate 02009 Consensus Estimate 0
Analysts Buy Rating Hold Rating Sell Rating Mean Target High LowConsensus Valuation 1 1 - - - - -
Peer Group Comparables (Reuters data sourced via Capital IQ)P / NAV
Candente Resource Corp. n/aCorriente Resources Inc. n/aChariot Resources Ltd. n/aNorsemont Mining Inc. n/aNorthern Peru Copper Corp. n/aSherwood Copper Corp. 1.1xTerrane Metals Corp. n/aPeer Group Average 1.1x
2844,133
100 438
April 2, 2007 - C$18 million private placement (10.0M units @ C$1.80; 1 unit = 1 share + 1 warrant exerciseable for 0.8 shares at C$2.25 to C$2.75 for 9 months)
20.6 -
Cu Equiv(Mlbs)3,297552
2.2 -2.0 -
Xietongmen is a copper-gold-silver porphyry deposit located 240km southwest of Lhasa in Tibet. Continental's property cover's 122 square kilometres and includes the recently discovered Newtongmen deposit.
$1.21
$0.20
C$0.48C$6.24
Positive Xietongmen feasibility study results announced in August 2007 (Aker Kvaerner) include an after-tax NAV(7.5%) of US$231.7 million and an IRR of 16.5% (5.2 year payback) at a US$1.50 per pound copper price, US$500 per ounce gold price, and a US$8.50 per ounce silver price. Initial capital costs are estimated at US$476.2 million. Production (40,000 tonnes per day) is expected to average 116 million pounds of copper, 190,000 ounces of gold, and 1.73 million ounces of silver per year over a 14-year open-pit mine-life at an average operating cost of US$7.69 per tonne milled.Continental submitted an EIA for Xietongmen in August 2007, which was approved by SEPA in September 2007. Exploration is ongoing on the property and the first 3 holes drilled at the recently discovered Newtongmen deposit exhibit excellent potential for another copper-gold deposit in the Xietongment district (including 77 metres grading 1.23% copper equivalent), which could extend the project's mine life by an additional 15 to 20 years.
C$1.07
Mrkt CapC$150C$369C$338C$111C$3.05
C$10.10
US$69.0M
F/D (millions)
-
7.8
-
-2.3 -
US$11.9M
2.0
C$4.60
Exploration Timetable
-1.9
-
November 12, 2007
$1.26
$0.00
C$2.11
O/S (millions)
- 100% interest in the world class Xietongmen copper-gold-silver porphyry deposit (2 billion pounds of copper, 3 million ounces of gold, and +20 million ounces of silver contained). - An August 2007 feasibility study (Aker Kvaerner) includes a US$231.7 million after-tax project NAV(7.5%) and IRR of 16.5% (5.2 year pay back) at a US$1.50 per pound copper price, US$500 per ounce gold price, and a US$8.50 per ounce silver price.- Annual production is expected to average 116 million pounds of copper, 190,000 ounces of gold, and 1.73 million ounces of silver over a 14-year open-pit mine-life (strip ratio = 1.64:1).- Initial capital costs are estimated at US$476.2 million and average life-of-mine operating costs are estimated at US$7.69 per tonne milled.- Concentrate off-take agreement in place with Jinchuan.- Proven and experienced management team including CEO Geral Panneton who held successive exploration roles at Placer Dome, Lac Minerals and Barrick Gold as well as Canada's "Mining Man of the Year" Mark Rebagliati, a porphyry expert.- Additional targets on the property are currently being drilled including the recently discovered Newtongmendeposit (including 77 metres grading 1.23% copper equivalent), offering upside potential for additional mine life.
Continental Minerals Corp. (CDNX:KMK)
US$ / O/S Share C$ / O/S Share
Price
Mean NAV
US$0.00US$0.00
n/a
$0.22
$0.21
120.8156.8
Dec 2007 - Feb 2009
$170.3
Oct 29/07
Gerald Panneton
Proceeds
www.hdgold.com
ExpiryUS$57.1M
2.3 -
$0.00$0.00
$1.36
$0.59
$0.00
$1.41$0.21$0.57
C$324C$282C$57
NAV Consensus Est-
--
-
-$5.53
-
(C$M)n/an/an/an/an/an/a
High Low
US$0.00US$0.00US$0.00
US$8.46 US$8.46 US$8.46US$0.00
$0.00
$1.00
$2.00
$3.00
11/13/2006
12/27/2006
2/8/2007
3/22/2007
5/4/2007
6/18/2007
7/31/2007
9/13/2007
10/26/2007
50 Day M.A.100 Day M.A.
Volume in Millions
0.00.30.50.81.0

Haywood’s Junior Mining Universe
Chris Thompson, P.Geo. (604-697-7433, [email protected]) Vol. 2, No. 4, November 14, 2007 — 60 Ben Asuncion (604-697-6149, [email protected])
TSXV:CXX Price $2.46 Shares O/S (M) 71.67 MCap (C$) (M) $176.30
Comment:
11/13/2007Investment Highlights Crosshair Exploration & Mining CorChart
Website: www.crosshairexploration.comTel:President/CEO:
Capital Structure (C$) (M)Shares O/S 71.67Shares F/D 80.71(C$) (M) Av Strike Basic ITM Proceeds Peer Group Companies Price (C$) MC (C$) (M)Cash & Equiv $8.50 CDNX:SAN $0.59 $48.19Options $1.72 8.70 5.51 $6.57 TSXV:CXX $2.46 $176.30Warrants $1.25 0.34 0.34 $0.43 CDNX:SAN $0.59 $48.19Total Cash & ITM 9.04 5.85 $15.50 CDNX:SSE $0.98 $28.96Market Cap $176.30 TSXV:UUL $0.55 $20.67
Trading Statistics (C$) Last Sale Price $2.39 Estimated Burn Rate (C$) (M)52 Week High $4.20 September 2007 cash & equiv $8.50 52 Week Low $1.15 Central Mineral Belt -$1.91 Q407Average Daily Vol (M) 0.16 Victoria Lake $0.00 Q407Ownership (M) Management Institutional Golden Promise -$0.18 Q407Shares 1.03 14.47 Exploration - Other n/a Q407% O/S 1.43% 20.19% Admin Costs -$0.64 Analyst Coverage # Analysts Financings $0.00
0 ITM Options / Warrants $7.00 Haywood Exploration Index Statistics Year-end 2007 cash & equiv $12.77 Dated Added 22-Nov-06
Last Financing11/3/2005 $11.1 million
Key PropertiesCentral Mineral Belt 75 - 100% 60%Location: Labrador Location: NewfoundlandExploration Stage: Advanced Exploration Exploration Stage: ExplorationDescription Description/Potential: /Potential:
Current:Current:
Reserve/Resource: None
Reserve/Resource:
Victoria Lake 60%Location: NewfoundlandExploration Stage: ExplorationDescription
/Potential:
Current:
Reserve/Resource: None
604-681-8030
- Key project area: Central Mineral Belt Uranium Project - 40,000 m drilled to date. - Upper C Zone - Part of a 4.5 km structure - encompasses Area 1 and Armstrong target. - Phase II drilling of C Zone to expand 43-101 uranium resources ongoing with 3 rigs - 3.2 M lbs U308 (indicated); 4.6 M lbs U308 (inferred). - Best results to date at C Zone include 46.3m of 0.10% U308 - B Zone: Potential for new deposit; Emerging mineralized zones: Moran Heights, Area 51, Area 1 and Armstrong; New targets: Croteau Lake, Blue Star, Madsen Lake. - $8.5 million 2007 summer and fall exploration program .CatalystsCentral Mineral Belt: Drilling underway with 3 rigs through to early Nov-07, focus on advancing the resources at C Zone, Area 1 and B Zone prospects plus target testing - assay results pending for 35 holes.Golden Promise: Drilling program designed to expand zone for 43-101 in Q407 - spin-off expected early 2008 with ownership dividend to shareholders.Victoria Lake: Gravity survey and Phase 2 drilling planned - spin-off expected early 2008.
Santoy Resources Ltd.
Exploration Timetable
Mark Morabito
Universal Uranium Ltd.
Crosshair Exploration & Mining Corp.
JV with Rubicon Minerals. Adjacent to Messina Minerals' recent Boomerang discovery. Located in VMS trend - host to precious/base metal deposits.
Santoy Resources Ltd.Silver Spruce Resources Inc.
Recently completed 3,000 m diamond drill programs - 14 hole, (3,073 m) at Golden Promise - Jaclyn Main zone extended to the east - 750 m strike length and to a depth of 275 m. Recent results include: 20.65 g/t Au over 1.60 m, including 55.03 g/t Au over 0.60 m (GP06-65); Remains open along strike and at depth. Visible gold in 10 of the 14 holes. Continued delineation of Jaclyn and North zones planned. 3,750m 19 hole drill program underway. Extraction of a surface mini-bulk sample from the main Jaclyn zone planned.
Crosshair Exploration & Mining Cor
Golden Promise
Crosshair is one of a growing list of companies exploring for uranium in the Central Mineral Belt of Labrador, while continuing to advance its gold and Volcanic Massive Sulphide (VMS) projects in Newfoundland. Drilling underway on key CMB uranium property.
Brokered Private Placement
4 million FT units @ $1.00 with 1/2 wt, 8.9 million non-FT units @ $0.80 with 1 wt
JV with Rubicon Minerals. Golden Promise and South Golden Promise projects. Early stage high grade gold potential
Noranda identified favourably altered rocks with multiple VMS lithogeochemical indicators, associated with multi element soil geochemical anomalies and coincident geophysical anomalies, most of which were never drilled. 11 hole drill program (2,198m) testing coincident geological, geochemical, geophysical targets has been completed. Strongly altered, sulphide-bearing felsic volcanic rocks outlined - potential for a proximal VMS environment. Gravity survey and Phase 2 drilling planned.
Upper C Zone: Mineralization intersected over 700 m along strike and 400 m down dip - remains open in all direction. Results from the B Zone and Area 1 intersected zones of uranium mineralization (B Zone - 7.56m of 0.269%; Area 1 - 5.23m of 0.10% U3O8). Moran Heights: 5.0 m of 0.10% U3O8. Area 5: 26.6 m of 0.012% U3O8. Madsen Lake: 1.5 m of 0.048% U3O8. 3 priority target areas identified (Croteau Lake, Armstrong, Blue Star). Encouraging results of lower C mineralization (11.05 m of 0.128 % U3O8); C Zone: 46.3m of 0.10% U3O8. New discovery -Dominion zone - 40,000 m program underway focused on advancing the resources at C Zone, Area 1 and B Zone prospects plus target testing. C Zone: Indicated 3.75 million tonnes grading 0.04% (3.19 million lbs U3O8) and Inferred 6.32 million tonnes grading 0.03% (4.59 million lbs U308)
685 sq km Moran Lake Uranium / IOCG Project potentially hosts 3 types of uranium mineralization - IOCG, structurally controlled, shear zone and unconformity types.
$0.00
$0.50
$1.00
$1.50
$2.00
$2.50
$3.00
$3.50
$4.00
Nov
-06
Dec
-06
Jan-
07
Feb-
07
Mar
-07
Apr
-07
May
-07
Jun-
07
Jul-0
7
Aug
-07
Sep
-07
Oct
-07
0.00.51.01.52.0
1
Vol
(M)
50 Day MA100 Day MA
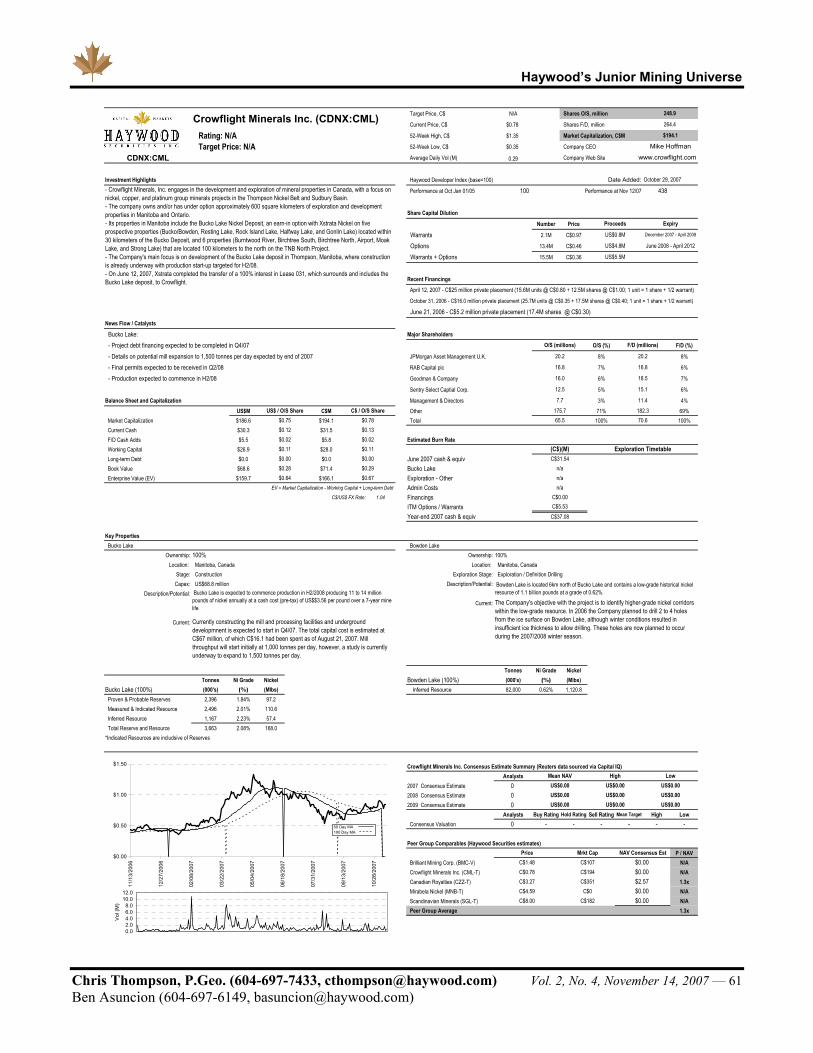
Haywood’s Junior Mining Universe
Chris Thompson, P.Geo. (604-697-7433, [email protected]) Vol. 2, No. 4, November 14, 2007 — 61 Ben Asuncion (604-697-6149, [email protected])
Target Price, C$ N/A Shares O/S, million
Current Price, C$ $0.78 Shares F/D, million
Rating: N/A 52-Week High, C$ $1.35 Market Capitalization, C$M
Target Price: N/A 52-Week Low, C$ $0.35 Company CEO
CDNX:CML Average Daily Vol (M) 0.29 Company Web Site
Investment Highlights Haywood Developer Index (base=100) Date Added:
Performance at Oct Jan 01/05 100 Performance at Nov 12/07 438
Share Capital Dilution
Number Price
Warrants 2.1M C$0.97
Options 13.4M C$0.46
Warrants + Options 15.5M C$0.36
Recent Financings
News Flow / Catalysts
Bucko Lake: Major Shareholders
- Project debt financing expected to be completed in Q4/07 O/S (%) F/D (%)
- Details on potential mill expansion to 1,500 tonnes per day expected by end of 2007 JPMorgan Asset Management U.K. 8% 8%
- Final permits expected to be received in Q2/08 RAB Capital plc 7% 6%
- Production expected to commence in H2/08 Goodman & Company 6% 7%
Sentry Select Captial Corp. 5% 6%
Balance Sheet and Capitalization Management & Directors 3% 4%US$M C$M Other 71% 69%
Market Capitalization $186.6 $194.1 Total 100% 100%Current Cash $30.3 $31.5F/D Cash Adds $5.5 $5.8 Estimated Burn RateWorking Capital $26.9 $28.0Long-term Debt $0.0 $0.0 June 2007 cash & equivBook Value $68.6 $71.4 Bucko LakeEnterprise Value (EV) $159.7 $166.1 Exploration - Other
EV = Market Capitalization - Working Capital + Long-term Debt Admin CostsC$/US$ FX Rate: 1.04 Financings
ITM Options / WarrantsYear-end 2007 cash & equiv
Key PropertiesBucko Lake Bowden Lake
Ownership: 100% Ownership: 100%Location: Manitoba, Canada Location: Manitoba, Canada
Stage: Construction Exploration Stage: Exploration / Definition DrillingCapex: US$68.8 million Description/Potential:
Description/Potential:Current:
Current:
Tonnes Ni Grade NickelTonnes Ni Grade Nickel Bowden Lake (100%) (000's) (%) (Mlbs)
Bucko Lake (100%) (000's) (%) (Mlbs) Inferred Resource 82,000 0.62% 1,120.8Proven & Probable Reserves 2,396 1.84% 97.2Measured & Indicated Resource 2,496 2.01% 110.6Inferred Resource 1,167 2.23% 57.4Total Reserve and Resource 3,663 2.08% 168.0
*Indicated Resources are includsive of Reserves
Crowflight Minerals Inc. Consensus Estimate Summary (Reuters data sourced via Capital IQ)Analysts
2007 Consensus Estimate 02008 Consensus Estimate 02009 Consensus Estimate 0
Analysts Buy Rating Hold Rating Sell Rating Mean Target High LowConsensus Valuation 0 - - - - - -
Peer Group Comparables (Haywood Securities estimates)P / NAV
Brilliant Mining Corp. (BMC-V) N/ACrowflight Minerals Inc. (CML-T) N/ACanadian Royalties (CZZ-T) 1.3xMirabela Nickel (MNB-T) N/AScandinavian Minerals (SGL-T) N/APeer Group Average 1.3x
US$0.00US$0.00
Mean NAV
PriceC$1.48 C$107
C$4.59
C$194
20.2
C$0.78
C$8.00
Bowden Lake is located 6km north of Bucko Lake and contains a low-grade historical nickel resource of 1.1 billion pounds at a grade of 0.62%.
The Company's objective with the project is to identify higher-grade nickel corridors within the low-grade resource. In 2006 the Company planned to drill 2 to 4 holes from the ice surface on Bowden Lake, although winter conditions resulted in insufficient ice thickness to allow drilling. These holes are now planned to occur during the 2007/2008 winter season.
Mrkt Cap
C$351C$0
$0.00
C$3.27
June 21, 2006 - C$5.2 million private placement (17.4M shares @ C$0.30)
April 12, 2007 - C$25 million private placement (15.6M units @ C$0.80 + 12.5M shares @ C$1.00; 1 unit = 1 share + 1/2 warrant)
October 31, 2006 - C$16.0 million private placement (25.7M units @ C$0.35 + 17.5M shares @ C$0.40; 1 unit = 1 share + 1/2 warrant)
O/S (millions) F/D (millions)
$0.67
$0.00
20.2
US$5.5M
US$4.8M
12.5
Exploration Timetable
175.7 182.3
(C$)(M)C$31.54
n/a
Crowflight Minerals Inc. (CDNX:CML)
US$ / O/S Share C$ / O/S Share
C$37.08
$0.13
$0.11
- Crowflight Minerals, Inc. engages in the development and exploration of mineral properties in Canada, with a focus on nickel, copper, and platinum group minerals projects in the Thompson Nickel Belt and Sudbury Basin. - The company owns and/or has under option approximately 600 square kilometers of exploration and development properties in Manitoba and Ontario. - Its properties in Manitoba include the Bucko Lake Nickel Deposit, an earn-in option with Xstrata Nickel on five prospective properties (Bucko/Bowden, Resting Lake, Rock Island Lake, Halfway Lake, and Gonlin Lake) located within 30 kilometers of the Bucko Deposit, and 6 properties (Burntwood River, Birchtree South, Birchtree North, Airport, Moak Lake, and Strong Lake) that are located 100 kilometers to the north on the TNB North Project. - The Company's main focus is on development of the Bucko Lake deposit in Thompson, Manitoba, where construction is already underway with production start-up targeted for H2/08. - On June 12, 2007, Xstrata completed the transfer of a 100% interest in Lease 031, which surrounds and includes the Bucko Lake deposit, to Crowflight.
$0.00$0.28$0.64
248.9
264.4
December 2007 - April 2008
$194.1
October 29, 2007
Mike Hoffman
Proceeds
www.crowflight.com
Expiry
June 2008 - April 2012
US$0.8M
15.1
16.8
70.665.5
16.8
16.0 18.5
7.7 11.4
$0.78
$0.02
$0.29
$0.75$0.12$0.02$0.11
C$182
NAV Consensus Est
$2.57$0.00
$0.00
$0.00
US$0.00
n/an/a
C$0.00C$5.53
Bucko Lake is expected to commence production in H2/2008 producing 11 to 14 million pounds of nickel annually at a cash cost (pre-tax) of US$$3.56 per pound over a 7-year mine life
Currently constructing the mill and processing facilities and underground developmnent is expected to start in Q4/07. The total capital cost is estimated at C$67 million, of which C$16.1 had been spent as of August 21, 2007. Mill throughput will start initially at 1,000 tonnes per day, however, a study is currently underway to expand to 1,500 tonnes per day.
US$0.00US$0.00
US$0.00US$0.00
High LowUS$0.00 US$0.00
$0.00
$0.50
$1.00
$1.50
11/1
3/20
06
12/2
7/20
06
02/0
8/20
07
03/2
2/20
07
05/0
4/20
07
06/1
8/20
07
07/3
1/20
07
09/1
3/20
07
10/2
6/20
07
0.02.04.06.08.0
10.012.0
1
Vol
(M)
50 Day MA100 Day MA
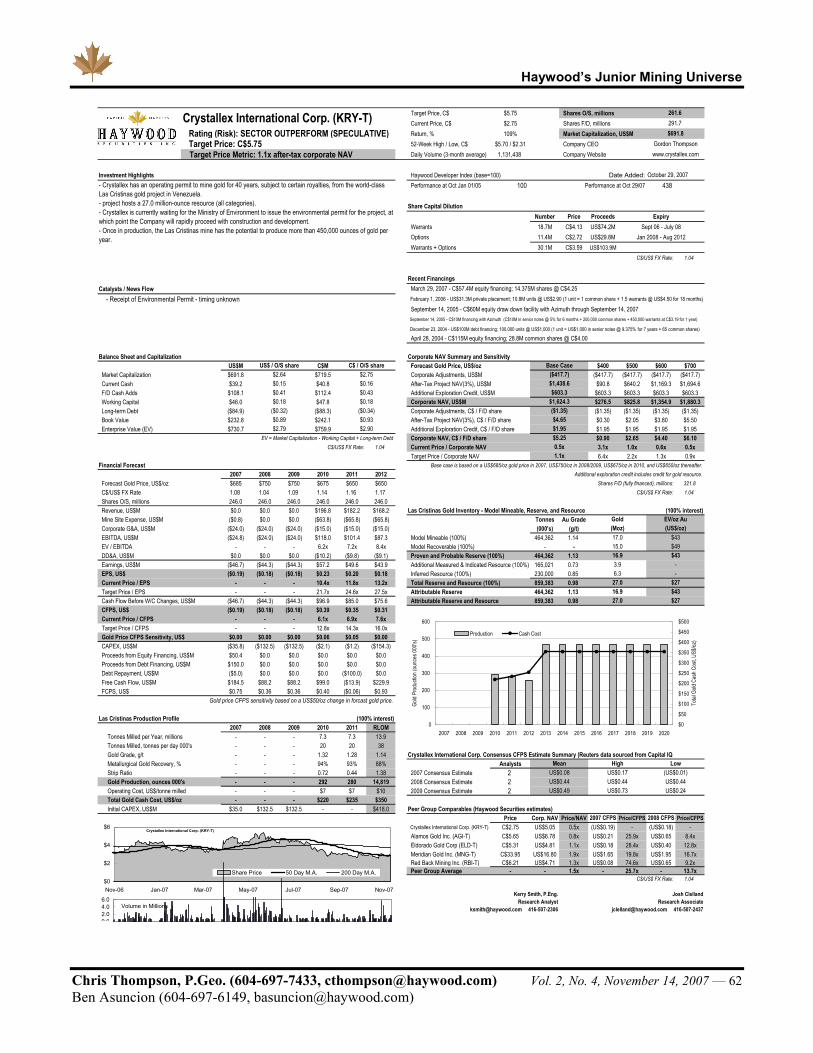
Haywood’s Junior Mining Universe
Chris Thompson, P.Geo. (604-697-7433, [email protected]) Vol. 2, No. 4, November 14, 2007 — 62 Ben Asuncion (604-697-6149, [email protected])
Target Price, C$ $5.75 Shares O/S, millionsCurrent Price, C$ $2.75 Shares F/D, millions
Rating (Risk): SECTOR OUTPERFORM (SPECULATIVE) Return, % 109% Market Capitalization, US$M Target Price: C$5.75 52-Week High / Low, C$ $5.70 / $2.31 Company CEO
Target Price Metric: 1.1x after-tax corporate NAV Daily Volume (3-month average) 1,131,438 Company Website
Investment Highlights Haywood Developer Index (base=100) Date Added:Performance at Oct Jan 01/05 100 Performance at Oct 29/07 438
Share Capital DilutionNumber Price Proceeds Expiry
Warrants 18.7M C$4.13 US$74.2M Sept 06 - July 08Options 11.4M C$2.72 US$29.8M Jan 2008 - Aug 2012Warrants + Options 30.1M C$3.59 US$103.9M
C$/US$ FX Rate: 1.04
Recent FinancingsCatalysts / News Flow
- Receipt of Environmental Permit - timing unknown
Balance Sheet and Capitalization Corporate NAV Summary and SensitivityUS$M C$M Forecast Gold Price, US$/oz $400 $500 $600 $700
Market Capitalization $691.8 $719.5 Corporate Adjustments, US$M ($417.7) ($417.7) ($417.7) ($417.7)Current Cash $39.2 $40.8 After-Tax Project NAV(3%), US$M $90.8 $640.2 $1,169.3 $1,694.6F/D Cash Adds $108.1 $112.4 Additional Exploration Credit, US$M $603.3 $603.3 $603.3 $603.3Working Capital $46.0 $47.8 Corporate NAV, US$M $276.5 $825.8 $1,354.9 $1,880.3Long-term Debt ($84.9) ($88.3) Corporate Adjustments, C$ / F/D share ($1.35) ($1.35) ($1.35) ($1.35)Book Value $232.8 $242.1 After-Tax Project NAV(3%), C$ / F/D share $0.30 $2.05 $3.80 $5.50Enterprise Value (EV) $730.7 $759.9 Additional Exploration Credit, C$ / F/D share $1.95 $1.95 $1.95 $1.95
EV = Market Capitalization - Working Capital + Long-term Debt Corporate NAV, C$ / F/D share $0.90 $2.65 $4.40 $6.10C$/US$ FX Rate: 1.04 Current Price / Corporate NAV 3.1x 1.0x 0.6x 0.5x
Target Price / Corporate NAV 6.4x 2.2x 1.3x 0.9xFinancial Forecast Base case is based on a US$685/oz gold price in 2007, US$750/oz in 2008/2009, US$675/oz in 2010, and US$650/oz thereafter.
2007 2008 2009 2010 2011 2012 Additional exploration credit includes credit for gold resource.Forecast Gold Price, US$/oz $685 $750 $750 $675 $650 $650 Shares F/D (fully financed), millions: 321.8C$/US$ FX Rate 1.08 1.04 1.09 1.14 1.16 1.17 C$/US$ FX Rate: 1.04Shares O/S, millions 246.0 246.0 246.0 246.0 246.0 246.0Revenue, US$M $0.0 $0.0 $0.0 $196.8 $182.2 $168.2 Las Cristinas Gold Inventory - Model Mineable, Reserve, and Resource (100% interest)Mine Site Expense, US$M ($0.8) $0.0 $0.0 ($63.8) ($65.8) ($65.8) Tonnes Au GradeCorporate G&A, US$M ($24.0) ($24.0) ($24.0) ($15.0) ($15.0) ($15.0) (000's) (g/t)EBITDA, US$M ($24.8) ($24.0) ($24.0) $118.0 $101.4 $87.3 Model Mineable (100%) 464,362 1.14EV / EBITDA - - - 6.2x 7.2x 8.4x Model Recoverable (100%) - -DD&A, US$M $0.0 $0.0 $0.0 ($10.2) ($9.8) ($9.1) Proven and Probable Reserve (100%) 464,362 1.13Earnings, US$M ($46.7) ($44.3) ($44.3) $57.2 $49.6 $43.9 Additional Measured & Indicated Resource (100%) 165,021 0.73EPS, US$ ($0.19) ($0.18) ($0.18) $0.23 $0.20 $0.18 Inferred Resource (100%) 230,000 0.85Current Price / EPS - - - 10.4x 11.8x 13.2x Total Reserve and Resource (100%) 859,383 0.98Target Price / EPS - - - 21.7x 24.6x 27.5x Attributable Reserve 464,362 1.13Cash Flow Before W/C Changes, US$M ($46.7) ($44.3) ($44.3) $96.9 $85.0 $75.6 Attributable Reserve and Resource 859,383 0.98CFPS, US$ ($0.19) ($0.18) ($0.18) $0.39 $0.35 $0.31Current Price / CFPS - - - 6.1x 6.9x 7.6xTarget Price / CFPS - - - 12.8x 14.3x 16.0xGold Price CFPS Sensitivity, US$ $0.00 $0.00 $0.00 $0.06 $0.05 $0.00CAPEX, US$M ($35.8) ($132.5) ($132.5) ($2.1) ($1.2) ($154.3)Proceeds from Equity Financing, US$M $50.4 $0.0 $0.0 $0.0 $0.0 $0.0Proceeds from Debt Financing, US$M $150.0 $0.0 $0.0 $0.0 $0.0 $0.0Debt Repayment, US$M ($5.0) $0.0 $0.0 $0.0 ($100.0) $0.0Free Cash Flow, US$M $184.5 $88.2 $88.2 $99.0 ($13.9) $229.9FCPS, US$ $0.75 $0.36 $0.36 $0.40 ($0.06) $0.93
Gold price CFPS sensitivity based on a US$50/oz change in forcast gold price.
Las Cristinas Production Profile (100% interest)2007 2008 2009 2010 2011 RLOM
Tonnes Milled per Year, millions - - - 7.3 7.3 13.9Tonnes Milled, tonnes per day 000's - - - 20 20 38Gold Grade, g/t - - - 1.32 1.28 1.14 Crystallex International Corp. Consensus CFPS Estimate Summary (Reuters data sourced from Capital IQMetallurgical Gold Recovery, % - - - 94% 93% 88% AnalystsStrip Ratio - - - 0.72 0.44 1.38 2007 Consensus Estimate 2Gold Production, ounces 000's - - - 292 280 14,819 2008 Consensus Estimate 2Operating Cost, US$/tonne milled - - - $7 $7 $10 2009 Consensus Estimate 2Total Gold Cash Cost, US$/oz - - - $220 $235 $350Initial CAPEX, US$M $35.0 $132.5 $132.5 - - $418.0 Peer Group Comparables (Haywood Securities estimates)
Price Corp. NAV Price/NAV 2007 CFPS Price/CFPS 2008 CFPS Price/CFPSCrystallex International Corp. (KRY-T) C$2.75 US$5.05 0.5x (US$0.19) - (US$0.18) -Alamos Gold Inc. (AGI-T) C$5.65 US$6.78 0.8x US$0.21 25.9x US$0.65 8.4xEldorado Gold Corp (ELD-T) C$5.31 US$4.81 1.1x US$0.18 28.4x US$0.40 12.8xMeridian Gold Inc. (MNG-T) C$33.95 US$16.80 1.9x US$1.65 19.8x US$1.95 16.7xRed Back Mining Inc. (RBI-T) C$6.21 US$4.71 1.3x US$0.08 74.6x US$0.65 9.2xPeer Group Average - - 1.5x - 25.7x - 13.7x
C$/US$ FX Rate: 1.04
Kerry Smith, P.Eng. Josh ClellandResearch Analyst Research Associate
[email protected] 416-507-2306 [email protected] 416-507-2437
US$0.49 US$0.73 US$0.24
October 29, 2007
US$0.08 US$0.17 (US$0.01)US$0.44 US$0.44 US$0.44
27.0 $27
Mean High Low
27.0 $2716.9 $43
3.9 -6.3 -
15.0 $4916.9 $43
EV/oz Au(Moz) (US$/oz)17.0 $43
$5.250.5x1.1x
Gold
$1,624.3($1.35)$4.65$1.95
Base Case($417.7)$1,438.6$603.3
$2.79 $2.90
March 29, 2007 - C$57.4M equity financing; 14.375M shares @ C$4.25February 1, 2006 - US$31.3M private placement; 10.8M units @ US$2.90 (1 unit = 1 common share + 1.5 warrants @ US$4.50 for 18 months)
($0.32) ($0.34)$0.89 $0.93
$0.41 $0.43$0.18 $0.18
$2.64 $2.75$0.15 $0.16
$691.8Gordon Thompsonwww.crystallex.com
US$ / O/S share C$ / O/S share
- Crystallex has an operating permit to mine gold for 40 years, subject to certain royalties, from the world-class Las Cristinas gold project in Venezuela.- project hosts a 27.0 million-ounce resource (all categories). - Crystallex is currently waiting for the Ministry of Environment to issue the environmental permit for the project, at which point the Company will rapidly proceed with construction and development. - Once in production, the Las Cristinas mine has the potential to produce more than 450,000 ounces of gold per year.
September 14, 2005 - C$60M equity draw down facility with Azimuth through September 14, 2007September 14, 2005 - C$10M financing with Azimuth (C$10M in senior notes @ 5% for 6 months + 200,000 common shares + 450,000 warrants at C$3.19 for 1 year)
December 23, 2004 - US$100M debt financing; 100,000 units @ US$1,000 (1 unit = US$1,000 in senior notes @ 9.375% for 7 years + 65 common shares)
April 28, 2004 - C$115M equity financing; 28.8M common shares @ C$4.00
Crystallex International Corp. (KRY-T) 261.6291.7
Crystallex International Corp. (KRY-T)
$0
$2
$4
$6
Nov-06 Jan-07 Mar-07 May-07 Jul-07 Sep-07 Nov-07
Share Price 50 Day M.A. 200 Day M.A.
Volume in Millions
0 02.04.06.0
0
100
200
300
400
500
600
2007 2008 2009 2010 2011 2012 2013 2014 2015 2016 2017 2018 2019 2020
Gold
Prod
uctio
n (ou
nces
000's
)
$0
$50
$100
$150
$200
$250
$300
$350
$400
$450
$500
Total
Gold
Cas
h Cos
t, US$
/oz)
Production Cash Cost
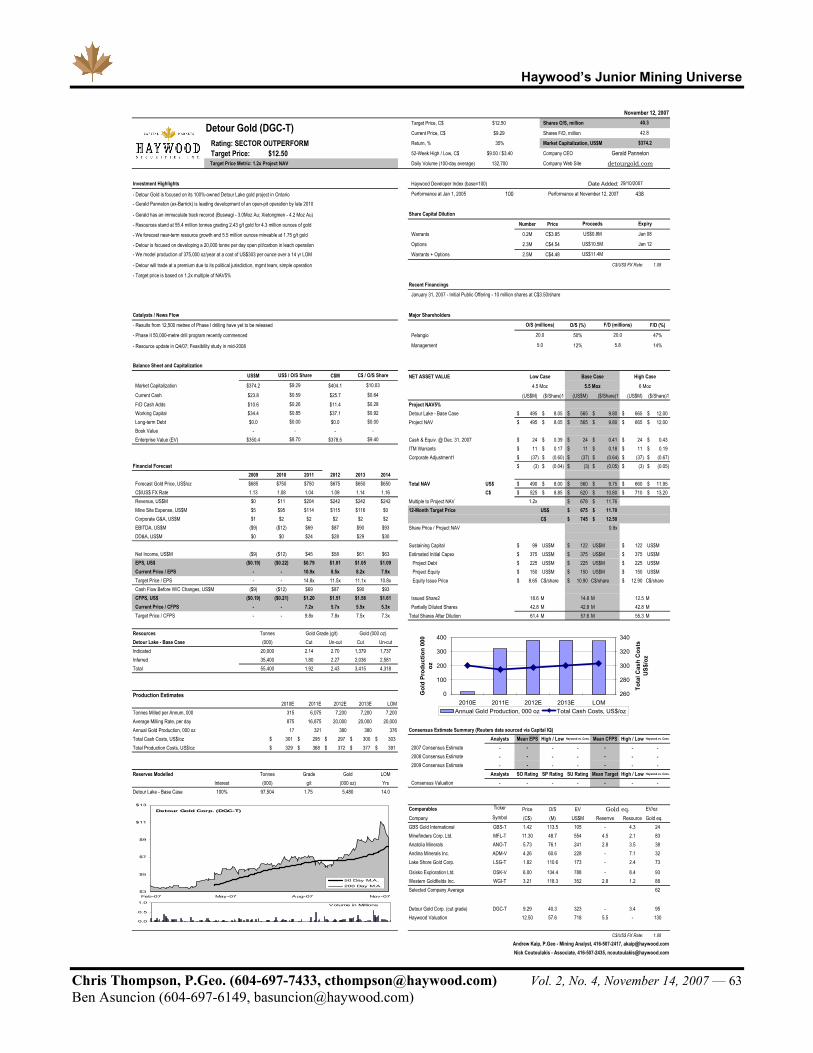
Haywood’s Junior Mining Universe
Chris Thompson, P.Geo. (604-697-7433, [email protected]) Vol. 2, No. 4, November 14, 2007 — 63 Ben Asuncion (604-697-6149, [email protected])
Target Price, C$ $12.50 Shares O/S, million
Current Price, C$ $9.29 Shares F/D, million
Rating: SECTOR OUTPERFORM Return, % 35% Market Capitalization, US$M
Target Price: $12.50 52-Week High / Low, C$ $9.50 / $3.40 Company CEO
Target Price Metric: 1.2x Project NAV Daily Volume (100-day average) 132,700 Company Web Site
Investment Highlights Haywood Developer Index (base=100) Date Added:
- Detour Gold is focused on its 100%-owned Detour Lake gold project in Ontario Performance at Jan 1, 2005 100 Performance at November 12, 2007 438- Gerald Panneton (ex-Barrick) is leading development of an open-pit operation by late 2010
- Gerald has an immaculate track recorod (Buswagi - 3.0Moz Au; Xietongmen - 4.2 Moz Au) Share Capital Dilution
- Resources stand at 55.4 million tonnes grading 2.43 g/t gold for 4.3 million ounces of gold Number Price
- We forecast near-term resource growth and 5.5 million ounces mineable at 1.75 g/t gold Warrants 0.2M C$3.85
- Detour is focused on developing a 20,000 tonne per day open pit/carbon in leach operation Options 2.3M C$4.54
- We model production of 375,000 oz/year at a cost of US$303 per ounce over a 14 yr LOM Warrants + Options 2.5M C$4.48
- Detour will trade at a premium due to its political jurisdiction, mgmt team, simple operation C$/US$ FX Rate: 1.08
- Target price is based on 1.2x multiple of NAV5%Recent Financings
Catalysts / News Flow Major Shareholders
- Results from 12,500 metres of Phase I drilling have yet to be released O/S (%) F/D (%)
- Phase II 50,000-metre drill program recently commenced Pelangio 50% 47%
- Resource update in Q4/07; Feasibility study in mid-2008 Management 12% 14%
Balance Sheet and Capitalization
US$M C$M NET ASSET VALUEMarket Capitalization $374.2 $404.1
Current Cash $23.8 $25.7 (US$M) ($/Share)1 (US$M) ($/Share)1 (US$M) ($/Share)1F/D Cash Adds $10.6 $11.4 Project NAV5%Working Capital $34.4 $37.1 Detour Lake - Base Case 495$ 8.05$ 565$ 9.80$ 665$ 12.00$ Long-term Debt $0.0 $0.0 Project NAV 495$ 8.05$ 565$ 9.80$ 665$ 12.00$ Book Value - -Enterprise Value (EV) $350.4 $378.5 Cash & Equiv. @ Dec. 31, 2007 24$ 0.39$ 24$ 0.41$ 24$ 0.43$
ITM Warrants 11$ 0.17$ 11$ 0.18$ 11$ 0.19$ Corporate Adjustment1 (37)$ (0.60)$ (37)$ (0.64)$ (37)$ (0.67)$
Financial Forecast (3)$ (0.04)$ (3)$ (0.05)$ (3)$ (0.05)$ 2009 2010 2011 2012 2013 2014
Forecast Gold Price, US$/oz $685 $750 $750 $675 $650 $650 Total NAV US$ 490$ 8.00$ 560$ 9.75$ 660$ 11.95$ C$/US$ FX Rate 1.13 1.08 1.04 1.09 1.14 1.16 C$ 525$ 8.85$ 620$ 10.80$ 710$ 13.20$ Revenue, US$M $0 $11 $204 $242 $242 $242 Multiple to Project NAV 1.2x 678$ 11.76$ Mine Site Expense, US$M $5 $95 $114 $115 $116 $0 12-Month Target Price US$ 675$ 11.70$ Corporate G&A, US$M $1 $2 $2 $2 $2 $2 C$ 745$ 12.50$ EBITDA, US$M ($9) ($12) $69 $87 $90 $93 Share Price / Project NAV 0.9x DD&A, US$M $0 $0 $24 $28 $29 $30
Sustaining Capital 99$ US$M 122$ US$M 122$ US$MNet Income, US$M ($9) ($12) $45 $58 $61 $63 Estimated Initial Capex 375$ US$M 375$ US$M 375$ US$MEPS, US$ ($0.19) ($0.22) $0.79 $1.01 $1.05 $1.09 Project Debt 225$ US$M 225$ US$M 225$ US$MCurrent Price / EPS - - 10.9x 8.5x 8.2x 7.9x Project Equity 150$ US$M 150$ US$M 150$ US$MTarget Price / EPS - - 14.8x 11.5x 11.1x 10.8x Equity Issue Price 8.65$ C$/share 10.90$ C$/share 12.90$ C$/shareCash Flow Before W/C Changes, US$M ($9) ($12) $69 $87 $90 $93CFPS, US$ ($0.19) ($0.21) $1.20 $1.51 $1.56 $1.61 Issued Share2 18.6 M 14.8 M 12.5 MCurrent Price / CFPS - - 7.2x 5.7x 5.5x 5.3x Partially Diluted Shares 42.8 M 42.8 M 42.8 MTarget Price / CFPS - - 9.8x 7.8x 7.5x 7.3x Total Shares After Dilution 61.4 M 57.6 M 55.3 M
ResourcesDetour Lake - Base Case Cut Un-cut Cut Un-cutIndicated 2.14 2.70 1,379 1,737Inferred 1.80 2.27 2,036 2,581Total 1.92 2.43 3,415 4,318
Production Estimates2010E 2011E 2012E 2013E LOM
Tonnes Milled per Annum, 000 315 6,075 7,200 7,200 7,200Average Milling Rate, per day 875 16,875 20,000 20,000 20,000Annual Gold Production, 000 oz 17 321 380 380 376 Consensus Estimate Summary (Reuters data sourced via Capital IQ)Total Cash Costs, US$/oz 301$ 295$ 297$ 300$ 303$ Analysts Mean EPS High / Low Haywood vs. Cons. Mean CFPS High / Low Haywood vs. Cons.
Total Production Costs, US$/oz 329$ 368$ 372$ 377$ 391$ 2007 Consensus Estimate - - - - - - -2008 Consensus Estimate - - - - - - -2009 Consensus Estimate - - - - - - -
Reserves Modelled Grade LOM Analysts SO Rating SP Rating SU Rating Mean Target High / Low Haywood vs. Cons.
Interest g/t Yrs Consensus Valuation - - - - - - -Detour Lake - Base Case 100% 1.75 14.0
Comparables Ticker Price O/S EV EV/ozCompany Symbol (C$) (M) US$M Reserrve Resource Gold eq.GBS Gold International GBS-T 1.42 113.5 105 - 4.3 24Minefinders Corp. Ltd. MFL-T 11.30 48.7 554 4.5 2.1 83Anatolia Minerals ANO-T 5.73 76.1 241 2.8 3.5 38Andina Minerals Inc. ADM-V 4.26 60.6 228 - 7.1 32Lake Shore Gold Corp. LSG-T 1.82 110.6 173 - 2.4 73
Osisko Exploration Ltd. OSK-V 6.00 134.4 788 - 8.4 93Western Goldfields Inc. WGI-T 3.21 118.3 352 2.8 1.2 88Selected Company Average 62
Detour Gold Corp. (cut grade) DGC-T 9.29 40.3 323 - 3.4 95Haywood Valuation 12.50 57.6 718 5.5 - 130
C$/US$ FX Rate: 1.08
Andrew Kaip, P.Geo - Mining Analyst, 416-507-2417, [email protected] Coutoulakis - Associate, 416-507-2435, [email protected]
$0.92$0.26$0.85
-$0.00 $0.00
-
(000)
97,504 5,480(000 oz)(000)
Tonnes Gold
20,000
$8.70 $9.40
35,40055,400
Tonnes Gold Grade (g/t) Gold (000 oz)
Detour Gold (DGC-T)
US$ / O/S Share C$ / O/S Share
$9.29 $10.03
November 12, 200740.3
42.8
Expiry
29/10/2007
$374.2
detourgold.com
Gerald Panneton
$0.59 $0.64
Jan 08US$0.8M
January 31, 2007 - Initial Public Offering - 10 million shares at C$3.50/share
F/D (millions)
20.0
US$10.5M
Base Case High Case
Proceeds
5.8
US$11.4M
Jan 12
O/S (millions)
20.0
5.0
$0.28
Low Case
Gold eq.
4.5 Moz 5.5 Moz 6 Moz
0
100
200
300
400
2010E 2011E 2012E 2013E LOM
Gol
d Pr
oduc
tion
000
oz
260
280
300
320
340To
tal C
ash
Cos
ts
US$
/oz
Annual Gold Production, 000 oz Total Cash Costs, US$/oz
Detour Gold Corp. (DGC-T)
$3
$5
$7
$9
$11
$13
Feb-07 May-07 Aug-07 Nov-07
50 Day M.A.
200 Day M.A.
Volume in Millions
0.0
0.5
1.0

Haywood’s Junior Mining Universe
Chris Thompson, P.Geo. (604-697-7433, [email protected]) Vol. 2, No. 4, November 14, 2007 — 64 Ben Asuncion (604-697-6149, [email protected])
TSXV:DSP Price $0.34 Shares O/S (M) 102.05 MCap (C$) (M) $34.70
Comment:
11/12/2007Investment Highlights Diamondex Resources Ltd. Chart
Website: www.diamondex.netTel:President/CEO:
Capital Structure (C$) (M)Shares O/S 102.05Shares F/D 132.33 Peer Group Companies Price (C$) MC (C$) (M)(C$) (M) Av Strike Basic ITM Proceeds TSX:SWY $0.72 $145.21Cash & Equiv $5.00 TSX:PGD $0.95 $49.10Options $0.60 13.86 5.75 $1.73 TSXV:DDN $0.80 $44.23Warrants $0.81 16.42 2.53 $0.75 TSXV:SRM $0.57 $38.95Total Cash & ITM 30.28 8.28 $7.47 TSXV:DSP $0.34 $34.70Market Cap $34.70 TSXV:IME $0.22 $13.19
Trading Statistics (C$) Last Sale Price $0.31 Estimated Burn Rate (C$) (M)52 Week High $0.54 September 2007 cash & equiv $5.00 52 Week Low $0.21 Lena West -$0.50 Q407Average Daily Vol (M) 0.21 Brodeur -$0.30 Q407Ownership (M) Management Institutional Buffalo Head Hills -$0.30 Q407Shares 3.32 17.24 Weiland & Viking -$0.50 Q407% O/S 3.25% 16.90% Admin Costs -$0.25 Analyst Coverage # Analysts Financings $0.00
0 ITM Options / Warrants $2.47 Haywood Exploration Index Statistics Year-end 2007 cash & equiv $5.62 Date Added 22-Nov-06
Last Financing6/28/2007 $11.5 million
Key PropertiesLena West 100% Brodeur 100%Location: Northwest Territories Location: NunavutExploration Stage: Exploration Exploration Stage: ExplorationDescription Description/Potential: /Potential:Current: Current:
Buffalo Head Hills JV 50%Location: AlbertaExploration Stage: ExplorationDescription/Potential:
Current: Extensive exploration efforts over the last 10 years, amounting to over $30 million, has resulted in the discovery of 38 kimberlites of which 26 are diamondiferous. Recent work includes a 400 tonne bulk sample taken with results expected by the end of 2007. Geophysics and drilling planned for Buffalo Head Hills for Q407 - Q108.
- District-scale diamond exploration at Lena West and Lac des Bois - Encouraging HMC results from basal tills and secondary collectors at Lena West - Recent purchase of 22.5% interest in Stornoway's Buffalo Hills project -awaiting results of 400-tonne bulk sampling with geophysics and drilling planned for Q407 - Q108 - Recently purchased diamond exploration portfolio from Trigon Uranium Corp - Weiland & Viking - Over $8 million in exploration expenditure for 2007 - Brodeur - completed 2,200m drill program aimed at Tuwawi - 3,110kg sample of kimberlite taken to estimate gradeCatalystsLena West: Geophysics planned through Q407 - Q108 with drilling to commence in Q108.Buffalo Head Hills JV: Geophysics completed, 400 tonnes to be processed, drill program and budget planning underway - to be finalized by mid November.Brodeur: Field component of 2007 exploration program completed - results expected from lab by end of Q407; further exploration pending results.Weiland: Plan to drill 40 targets identified by mag survey with 2 rigs in Q108.Viking: Field sampling ongoing, to complete shortly with results to follow.
District-wide diamond exploration. 200km North West of Lac des Bois. Attractive KIM distributions and diamonds in till recovered.
Brokered Private Placement
Stornoway Diamond Corp.
Indicator Minerals Inc.
16.4 million shares @ $0.28 and 17.65 million FT shares @ $0.34
Diamondex Resources Ltd.
District sized exploration and target testing in NWT. With over $8 million earmarked for exploration in 2007 and management with discoveries under the belt, Diamondex is primed for Canada's next grass-roots diamond discovery.
Diamondex Resources Ltd.
Exploration Timetable
604-687-6644
Peregrine Diamonds Ltd.
Randy Turner
Diamonds North Resources Ltd.Shear Minerals Ltd.
3.3 million acres in prospecting permits and staked claims. Seven high priority regions delineated for further detailed exploration. 15 diamonds and encouraging indicator minerals recovered. Exploration driven by KIM sampling and detailed EM geophysics continuing through Q407-Q108 with drilling planned for Q108.
409,000 acres. Water access. District-wide diamond exploration. Hosts 3 kimberlites. North of Twin Mining Freight Train kimberlites409,020 acres in optioned claims and prospecting permits. Three kimberlite bodies discovered Tuwawi (diamondiferous), Nanuk, Kuuriak. Good quality diamonds from Tuwawi. Follow-up till and stream sediment sampling carried out. Detailed ground magnetic surveys over priority airborne anomalies. Prospecting of structural, KIM, and GP trends for kimberlitic occurrences. Analysis of core left on property for evidence of kimberlite drilled at depth beneath Tuwawi. Reprocessing (high-pass filter) of geophysics data set reveals drill targets. 250 kg of Katagia kimberlite submitted for caustic fusion - results pending. Ground magnetic surveys, drilling (3,500 m)(Tuwawi pipe, Tuwawi Deep Target and additional targets) and till and stream sediment sampling underway. 3,000 kg of Tuwawi pipe to be analyzed to determine grade with results expected in Q407.
Located in north-central Alberta, the third largest district of diamond bearing kimberlite in Canada. Property is a JV with Shore Gold and contains the Loon River Property.
$0.00
$0.10
$0.20
$0.30
$0.40
$0.50
$0.60
11/1
3/06
12/1
3/06
1/13
/07
2/13
/07
3/13
/07
4/13
/07
5/13
/07
6/13
/07
7/13
/07
8/13
/07
9/13
/07
10/1
3/07
0.0
1.0
2.0
3.0
1
Vol
(M)
50 Day MA100 Day MA
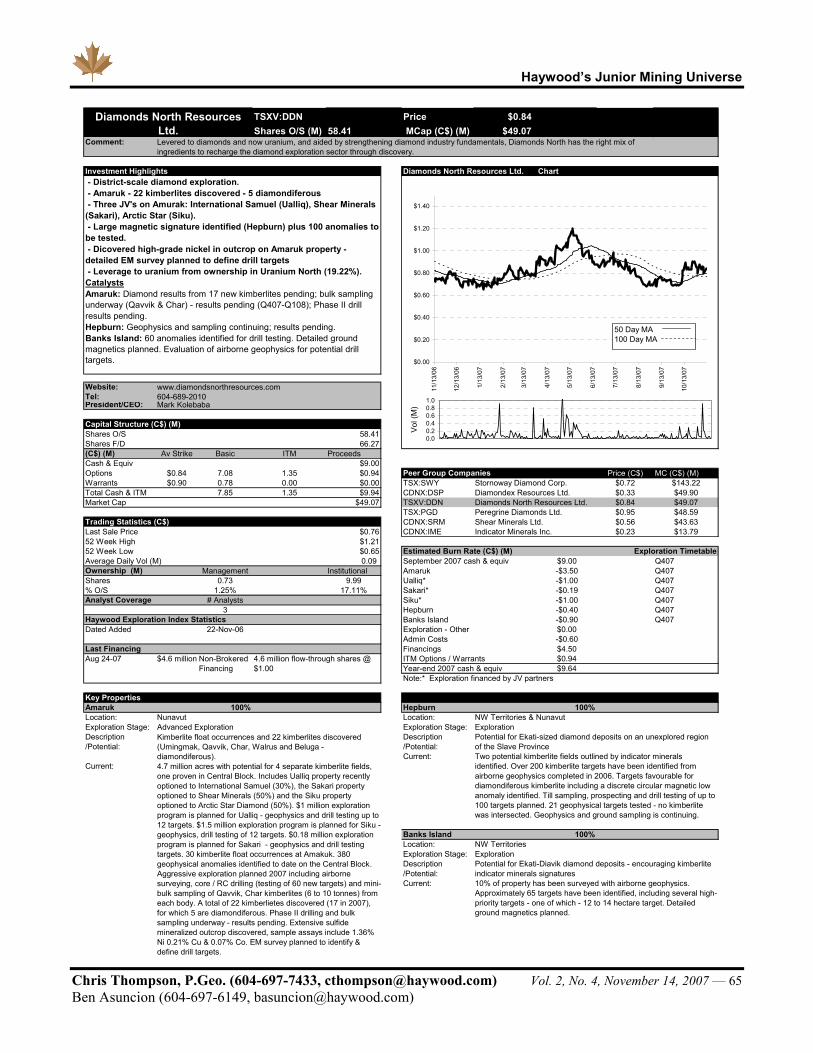
Haywood’s Junior Mining Universe
Chris Thompson, P.Geo. (604-697-7433, [email protected]) Vol. 2, No. 4, November 14, 2007 — 65 Ben Asuncion (604-697-6149, [email protected])
TSXV:DDN Price $0.84 Shares O/S (M) 58.41 MCap (C$) (M) $49.07
Comment:
11/12/2007Investment Highlights Diamonds North Resources Ltd. Chart
Website: www.diamondsnorthresources.comTel:President/CEO:
Capital Structure (C$) (M)Shares O/S 58.41Shares F/D 66.27(C$) (M) Av Strike Basic ITM ProceedsCash & Equiv $9.00Options $0.84 7.08 1.35 $0.94 Peer Group Companies Price (C$) MC (C$) (M)Warrants $0.90 0.78 0.00 $0.00 TSX:SWY $0.72 $143.22Total Cash & ITM 7.85 1.35 $9.94 CDNX:DSP $0.33 $49.90Market Cap $49.07 TSXV:DDN $0.84 $49.07
TSX:PGD $0.95 $48.59Trading Statistics (C$) CDNX:SRM $0.56 $43.63Last Sale Price $0.76 CDNX:IME $0.23 $13.7952 Week High $1.21 52 Week Low $0.65 Estimated Burn Rate (C$) (M)Average Daily Vol (M) 0.09 September 2007 cash & equiv $9.00 Q407Ownership (M) Management Institutional Amaruk -$3.50 Q407Shares 0.73 9.99 Ualliq* -$1.00 Q407% O/S 1.25% 17.11% Sakari* -$0.19 Q407Analyst Coverage # Analysts Siku* -$1.00 Q407
3 Hepburn -$0.40 Q407Haywood Exploration Index Statistics Banks Island -$0.90 Q407Dated Added 22-Nov-06 Exploration - Other $0.00
Admin Costs -$0.60Last Financing Financings $4.50 Aug 24-07 $4.6 million ITM Options / Warrants $0.94
Year-end 2007 cash & equiv $9.64 Note:* Exploration financed by JV partners
Key PropertiesAmaruk 100% Hepburn 100%Location: Nunavut Location: NW Territories & NunavutExploration Stage: Advanced Exploration Exploration Stage: ExplorationDescription Description/Potential: /Potential:
Current:Current:
Banks Island 100%Location: NW Territories Exploration Stage: Exploration
Description/Potential:Current:
mineralized outcrop discovered, sample assays include 1.36% Ni 0.21% Cu & 0.07% Co. EM survey planned to identify & define drill targets.
604-689-2010
- District-scale diamond exploration. - Amaruk - 22 kimberlites discovered - 5 diamondiferous - Three JV's on Amurak: International Samuel (Ualliq), Shear Minerals (Sakari), Arctic Star (Siku). - Large magnetic signature identified (Hepburn) plus 100 anomalies to be tested. - Dicovered high-grade nickel in outcrop on Amaruk property - detailed EM survey planned to define drill targets - Leverage to uranium from ownership in Uranium North (19.22%).CatalystsAmaruk: Diamond results from 17 new kimberlites pending; bulk sampling underway (Qavvik & Char) - results pending (Q407-Q108); Phase II drill results pending.Hepburn: Geophysics and sampling continuing; results pending.Banks Island: 60 anomalies identified for drill testing. Detailed ground magnetics planned. Evaluation of airborne geophysics for potential drill targets.
Kimberlite float occurrences and 22 kimberlites discovered (Umingmak, Qavvik, Char, Walrus and Beluga - diamondiferous).
Mark Kolebaba
Non-Brokered Financing
4.7 million acres with potential for 4 separate kimberlite fields, one proven in Central Block. Includes Ualliq property recently optioned to International Samuel (30%), the Sakari property optioned to Shear Minerals (50%) and the Siku property optioned to Arctic Star Diamond (50%). $1 million exploration program is planned for Ualliq - geophysics and drill testing up to 12 targets. $1.5 million exploration program is planned for Siku - geophysics, drill testing of 12 targets. $0.18 million exploration program is planned for Sakari - geophysics and drill testing targets. 30 kimberlite float occurrences at Amakuk. 380 geophysical anomalies identified to date on the Central Block. Aggressive exploration planned 2007 including airborne surveying, core / RC drilling (testing of 60 new targets) and mini-bulk sampling of Qavvik, Char kimberlites (6 to 10 tonnes) from each body. A total of 22 kimberlietes discovered (17 in 2007), for which 5 are diamondiferous. Phase II drilling and bulk sampling underway - results pending. Extensive sulfide
Diamondex Resources Ltd.
Exploration Timetable
Diamonds North Resources Ltd.Levered to diamonds and now uranium, and aided by strengthening diamond industry fundamentals, Diamonds North has the right mix of ingredients to recharge the diamond exploration sector through discovery.
Peregrine Diamonds Ltd.
Indicator Minerals Inc.
Stornoway Diamond Corp.
Diamonds North Resources Ltd.
Shear Minerals Ltd.
10% of property has been surveyed with airborne geophysics. Approximately 65 targets have been identified, including several high-priority targets - one of which - 12 to 14 hectare target. Detailed ground magnetics planned.
Two potential kimberlite fields outlined by indicator minerals identified. Over 200 kimberlite targets have been identified from airborne geophysics completed in 2006. Targets favourable for diamondiferous kimberlite including a discrete circular magnetic low anomaly identified. Till sampling, prospecting and drill testing of up to 100 targets planned. 21 geophysical targets tested - no kimberlite was intersected. Geophysics and ground sampling is continuing.
Potential for Ekati-Diavik diamond deposits - encouraging kimberlite indicator minerals signatures
4.6 million flow-through shares @ $1.00
Potential for Ekati-sized diamond deposits on an unexplored region of the Slave Province
$0.00
$0.20
$0.40
$0.60
$0.80
$1.00
$1.20
$1.40
11/1
3/06
12/1
3/06
1/13
/07
2/13
/07
3/13
/07
4/13
/07
5/13
/07
6/13
/07
7/13
/07
8/13
/07
9/13
/07
10/1
3/07
0.00.20.40.60.81.0
1
Vol (
M)
50 Day MA100 Day MA

Haywood’s Junior Mining Universe
Chris Thompson, P.Geo. (604-697-7433, [email protected]) Vol. 2, No. 4, November 14, 2007 — 66 Ben Asuncion (604-697-6149, [email protected])
TSXV:XRC Price $4.22 Shares O/S (M) 40.79 MCap (C$) (M) $172.12
Comment:
11/12/2007Investment Highlights Exeter Resource Corp. Chart
Website: www.exeterresource.comTel:President/CEO:
Capital Structure (C$) (M)Shares O/S 40.79 Peer Group Companies Price (C$) MC (C$) (M)Shares F/D 48.06 OTCBB:MNEA.F $1.80 $300.13(C$) (M) Av Strike Basic ITM Proceeds TSXV:XRC $4.22 $172.12Cash & Equiv $10.40 TSX:GL $1.75 $55.38Options $2.10 7.02 7.02 $14.79 TSXV:MRZ $0.74 $17.45Warrants $3.00 0.25 0.25 $0.75 TSXV:PDO $0.36 $10.08Total Cash & ITM 7.27 7.27 $25.94Market Cap $172.12
Trading Statistics (C$) Estimated Burn Rate (C$) (M)Last Sale Price $4.27 September 2007 cash & equiv $10.40 52 Week High $5.27 Don Sixto (La Cabeza) -$0.15 Q20852 Week Low $1.70 Caspiche -$3.00 Q208Average Daily Vol (M) 0.10 Cerro Moro -$7.00 Q208Ownership (M) Management Institutional Exploration - Other -$1.00 Q208Shares 5.90 6.46 Admin Costs -$2.00 % O/S 14.48% 15.84% Financings $0.00 Analyst Coverage # Analysts ITM Options / Warrants $15.54
0 June 2008 cash & equiv $12.79 Haywood Junior Exploration UniverseDate Added 22-Nov-06
Last Financing18-Oct-06 $1.25 million
Key PropertiesDon Sixto (La Cabeza) 100% Caspiche 100%Location: Argentina Location: ChileExploration Stage: Advanced Exploration Exploration Stage: ExplorationDescription Description/Potential: /Potential:Current: Current:
Reserve/Resource: None
Cerro Moro 100% Location: ArgentinaExploration Stage: Exploration
Reserve/Resource: Description/Potential:
Current:
Reserve/Resource: None
Mirasol Resources Ltd.
Recent drilling intersects high-grade mineralization - Escondida vein - 4.4 g/t Au, 471 g/t Ag over 2.00 m (MD124) and 3.0 g/t Au, 141 g/t Ag over 4.26 m (MD123). Drilling focused on defining the geometry at Carla and Escondida veins and to test Nini-Carla structural trend, expanding mineralization and test targets. A continuous gold-silver zone in the central portion of the Escondida vein found to be continuous over 950m. 10,000m drilling completed prior to CVSA decision - CVSA elected not to back in & retains 2% NSR. Currently drilling w/3 rigs and awaiting assays from additional 50+ holes drilled. Baseline environmental studies to commence ahead of resource estimate in 2008.
Previous, widely-spaced, drilling returned significant intersections of mineralized and hydrothermally altered volcanic rocks. 10,000m drill program planned for Q407-Q208 - high-sulphidation epithermal Au system confirmed. Au porphyry potential to be evaluated - 304 m @ 0.9 g/t Au, from a down hole depth of 40 m (CSDH 013).
Indicated: 20.5 M tonnes @ 1.4g/t Au (925,000 oz); inferred 9.3M tonnes @ 1.12g/t Au (334,000 oz)
25 sq km low-sulphidation style gold and silver mineralization. Historical trenching and drilling. Moro, Nini, Deborah and Esperanza veins identified. Blanketed by surficial cover.
Exeter Resource Corp.
Focused on drilling, with concurrent environmental, social, hydrological and metallurgical studies to facilitate the completion of a feasibility study. Currently carrying out a resource expansion program focusing on the Mandibula, Luna and Cuello Zones. Central Vein, Labio East and Labio West zones being tested. Drilling extends Luna zone to 200 m; grade and width of mineralization improves with depth. New zone discovered SE of Mandibula deposit - potential for blind gold targets. All activity ceased due to government legislation.
604-688-9592
0.5 million units @ $2.50; units composed of one share and a half warrant
Bryce Roxburgh
Non-Brokered Private Placement
Au-Ag rich low sulphidation epithermal system hosting 8 deposits with 43-101 compliant defined resources
Minera Andes Inc.
Au / Cu porphyry-style & epithermal targets 10 km north of the Cerro Casale Au Cu deposit and 10 km south of the Refugio gold
Exeter Resource Corp.
Exeter is one of the most active exploration companies in South America, with a focus on gold and silver in Argentina and Chile. Short term focus is the Cerro Moro and Caspiche projects. All activity at Don Sixto has ceased due to government legislation.
- Cero Moro: high grade mineralization intersected (MDO98: 3.8 m grading 128 g/t Au); drilling underway with results pending. - Caspiche: 10,000m drilling program planned following up on CSDH 013 (304 m @ 0.9 g/t Au). - Don Sixto (La Cabeza): 925,000oz indicated & 334,000oz inferred in resource - all activity ceased due to government legislation to be determined in upcoming provincial election (Q407). - Early generative stage work in southern and Maricunga regions of Chile.CatalystsCerro Moro: Results from first 10,000m of drilling show high grade Au / Ag potential; drilling 27 targets in Q407; awaiting results of 50+ holes.Caspiche: Up to 10,000m diamond drilling program planned in Q407-Q208 to follow up on porphyry gold mineralisation discovery.Don Sixto (La Cabeza): Currently conducting in-house scoping study; all activity on property ceased due to gov't legislation.
Golden Peaks Resources Ltd.
Portal Resources Ltd.
Exploration Timetable
$0.00
$0.50
$1.00
$1.50
$2.00
$2.50
$3.00
$3.50
$4.00
$4.50
11/1
3/06
12/1
3/06
1/13
/07
2/13
/07
3/13
/07
4/13
/07
5/13
/07
6/13
/07
7/13
/07
8/13
/07
9/13
/07
10/1
3/07
0.00.20.40.60.8
1
Vol
(M)
50 Day MA100 Day MA
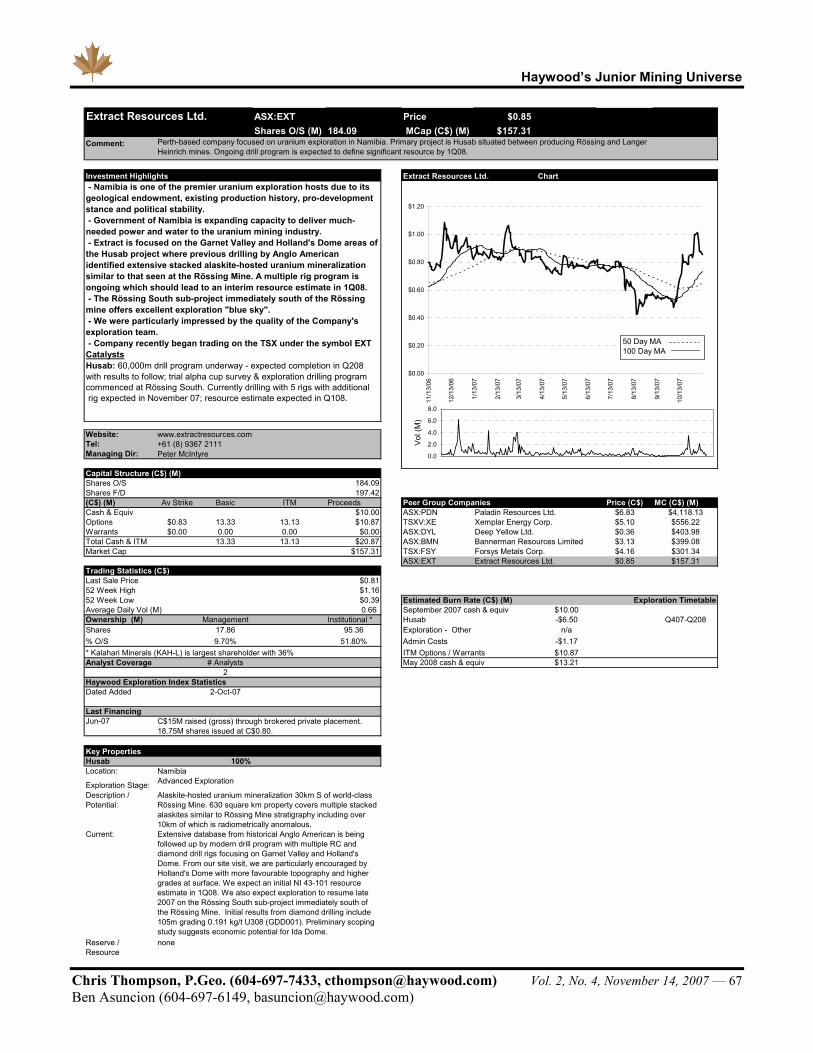
Haywood’s Junior Mining Universe
Chris Thompson, P.Geo. (604-697-7433, [email protected]) Vol. 2, No. 4, November 14, 2007 — 67 Ben Asuncion (604-697-6149, [email protected])
ASX:EXT Price $0.85 Shares O/S (M) 184.09 MCap (C$) (M) $157.31
Comment:
11/12/2007Investment Highlights Extract Resources Ltd. Chart
Website: www.extractresources.comTel:Managing Dir:
Capital Structure (C$) (M)Shares O/S 184.09Shares F/D 197.42(C$) (M) Av Strike Basic ITM Proceeds Peer Group Companies Price (C$) MC (C$) (M)Cash & Equiv $10.00 ASX:PDN $6.83 $4,118.13Options $0.83 13.33 13.13 $10.87 TSXV:XE $5.10 $556.22Warrants $0.00 0.00 0.00 $0.00 ASX:DYL $0.36 $403.98Total Cash & ITM 13.33 13.13 $20.87 ASX:BMN $3.13 $399.08Market Cap $157.31 TSX:FSY $4.16 $301.34
ASX:EXT $0.85 $157.31Trading Statistics (C$) Last Sale Price $0.8152 Week High $1.1652 Week Low $0.39 Estimated Burn Rate (C$) (M)Average Daily Vol (M) 0.66 September 2007 cash & equiv $10.00 Ownership (M) Management Institutional * Husab -$6.50 Q407-Q208Shares 17.86 95.36 Exploration - Other n/a% O/S 9.70% 51.80% Admin Costs -$1.17 * Kalahari Minerals (KAH-L) is largest shareholder with 36% ITM Options / Warrants $10.87 Analyst Coverage # Analysts May 2008 cash & equiv $13.21
2 Haywood Exploration Index StatisticsDated Added 2-Oct-07
Last FinancingJun-07
Key PropertiesHusab 100%Location:
Exploration Stage:Description / Potential:
Current:
none
Alaskite-hosted uranium mineralization 30km S of world-class Rössing Mine. 630 square km property covers multiple stacked alaskites similar to Rössing Mine stratigraphy including over 10km of which is radiometrically anomalous.
Xemplar Energy Corp.Deep Yellow Ltd.Bannerman Resources LimitedForsys Metals Corp.
Extract Resources Ltd.
Perth-based company focused on uranium exploration in Namibia. Primary project is Husab situated between producing Rössing and Langer Heinrich mines. Ongoing drill program is expected to define significant resource by 1Q08.
- Namibia is one of the premier uranium exploration hosts due to its geological endowment, existing production history, pro-development stance and political stability. - Government of Namibia is expanding capacity to deliver much-needed power and water to the uranium mining industry. - Extract is focused on the Garnet Valley and Holland's Dome areas of the Husab project where previous drilling by Anglo American identified extensive stacked alaskite-hosted uranium mineralization similar to that seen at the Rössing Mine. A multiple rig program is ongoing which should lead to an interim resource estimate in 1Q08. - The Rössing South sub-project immediately south of the Rössing mine offers excellent exploration "blue sky". - We were particularly impressed by the quality of the Company's exploration team. - Company recently began trading on the TSX under the symbol EXTCatalystsHusab: 60,000m drill program underway - expected completion in Q208 with results to follow; trial alpha cup survey & exploration drilling program commenced at Rössing South. Currently drilling with 5 rigs with additional rig expected in November 07; resource estimate expected in Q108.
Advanced Exploration
Peter McIntyre
Exploration Timetable
+61 (8) 9367 2111
Paladin Resources Ltd.
Namibia
Reserve / Resource
C$15M raised (gross) through brokered private placement. 18.75M shares issued at C$0.80.
Extensive database from historical Anglo American is being followed up by modern drill program with multiple RC and diamond drill rigs focusing on Garnet Valley and Holland's Dome. From our site visit, we are particularly encouraged by Holland's Dome with more favourable topography and higher grades at surface. We expect an initial NI 43-101 resource estimate in 1Q08. We also expect exploration to resume late 2007 on the Rössing South sub-project immediately south of the Rössing Mine. Initial results from diamond drilling include 105m grading 0.191 kg/t U308 (GDD001). Preliminary scoping study suggests economic potential for Ida Dome.
Extract Resources Ltd.
$0.00
$0.20
$0.40
$0.60
$0.80
$1.00
$1.20
11/1
3/06
12/1
3/06
1/13
/07
2/13
/07
3/13
/07
4/13
/07
5/13
/07
6/13
/07
7/13
/07
8/13
/07
9/13
/07
10/1
3/07
0.0
2.0
4.0
6.0
8.0
1
Vol (
M)
50 Day MA100 Day MA

Haywood’s Junior Mining Universe
Chris Thompson, P.Geo. (604-697-7433, [email protected]) Vol. 2, No. 4, November 14, 2007 — 68 Ben Asuncion (604-697-6149, [email protected])
TSXV:FDC Price $0.51 Shares O/S (M) 60.45 MCap (C$) (M) $30.83
Comment:
11/12/2007Investment Highlights Forum Uranium Corp. Chart
Website: www.forumuranium.comTel:President/CEO:
Capital Structure (C$) (M)Shares O/S 60.45Shares F/D 69.96(C$) (M) Av Strike Basic ITM ProceedsCash & Equiv $6.20Options $0.48 5.65 2.92 $0.89Warrants $0.81 3.86 0.00 $0.00 Peer Group Companies Price (C$) MC (C$) (M)Total Cash & ITM 9.51 2.92 $7.09 TSXV:PXP $2.64 $73.51Market Cap $30.83 TSXV:TUE $1.08 $55.96
TSXV:HAT $0.76 $51.21Trading Statistics (C$) TSXV:FDC $0.51 $30.83Last Sale Price $0.51 TSXV:UVN $0.70 $18.5952 Week High $0.9252 Week Low $0.32Average Daily Vol 0.16 Estimated Burn Rate (C$) (M)Ownership (M) Management Institutional September 2007 cash & equiv $6.20 Shares 4.81 2.02 Key Lake Road -$2.00 Q407-Q208% O/S 7.95% 3.34% Henday -$1.25 Q108-Q208Analyst Coverage # Analysts North Thelon JV -$2.00 Q407-Q208
0 Maurice Point JV* -$2.00 Q407-Q208Haywood Exploration Index Statistics Admin Costs -$0.75 Q407-Q208Dated Added 1-Oct-07 Financings $0.00
ITM Options / Warrants $0.89 Last Financing June 2008 cash & equiv -$0.91 1/11/2007 $0.9 million * Cost to be incurred by JV partner - Mega Uranium (TSX:MGA)*Pending*
Key PropertiesNorth Thelon JV 50% Henday 100%Location: Nunavut Location: SaskatchewanExploration Stage: Exploration Exploration Stage: Geophysics; data compilation leading to drilling by Q108Description Description/Potential: /Potential:
Current: Current:
Reserve/Resource: NoneReserve/Resource: NoneKey Lake Road 40% - 100% Maurice Point JV 30%Location: Saskatchewan Location: SaskatchewanExploration Stage: Exploration Exploration Stage: ExplorationDescription Description/Potential: /Potential:Current:
Current:
Reserve/Resource: None
Reserve/Resource: None
Located 30 km south of the Key Lake Mine/Mill complex of Cameco, the principal processing facility of the McArthur River deposit. Claims cover the Mudjatik-Wollaston Transition Zone, a key host for many deposits. 34 drill holes completed on four targets (5,113 m) - DD 10 holes; Rainbow 4 holes; Orchid Lake 9 holes; Hobo 12 holes. Encouraging drill holes - Hobo zone (0.15% to 1.82% U3O8 ). Detailed structural mapping and prospecting of the Hobo and Molly zones completed in 2006. Follow up drilling of shallow targets in mid-Q407 (8 holes @ 150m) with more extensive drilling program in Q407 through Q208 (2,000m). Drilling of the Molly zone planned - 8 holes of 150m - follow-up drilling also planned on the DD zone and Hobo zone. Drilling of Molly zones planned for Q407 to Q108 - 8,000m drill program of 4 targets in Molly zone.
Strategically located near to Areva's Kiggavik-Sissons 130 million lb deposit; covers a large portion of the eastern Thelon Basin; near surface targets
Non-Broker Private Placement
Pitchstone Exploration Ltd.
This JV property includes one with Superior Diamonds Inc. and recently with Tanqueray Resources and encompasses Areva's Kiggavik project that is moving forward to a production decision once permitting is completed. Work completed on the Forum ground includes geological mapping, prospecting, and gravity surveys. Planned exploration includes an airborne magnetic/apparent resistiity survey, further mapping, prospecting and gravity surveys and 3,000 m of diamond drilling planned for summer 2008.
Airborne geophysical survey completed in 2005. Hosts historic Uranium Ridge showing. Uraniferous Beach Zone - a 100 m long breccia zone - discovered from tracing radioactive boulders. Grab samples include 7.31% , 2.2% , 2.16% , 2.06% , 1.55% , 0.935% , 0.871% and 0.388% U3O8.
Recently acquired; located in eastern Athabasca Basin and relatively near existing deposits and the operating McClean Lake mine/mill complexShallow targets on this well located project on trend from the Mae zone (Denison/Areva) will be drill tested in Q108. 8 conductive trends totalling 45 line km have been outlined. 32 widely spaced holes, including 4 m grading 0.21% U3O8 and 10 with anomalous values exhibit typical unconformity alteration have been drilled. These will be high priority target areas for follow-up. Strongly developed clay alteration and anomalous boron geochemistry is evident in several of the holes; 5,000 metres of drilling underway.
Recently purchased; located in eastern Athabasca Basin immediately adjacent to Cameco's Maurice Bay deposit (1.3 M lbs U3O8) - optioned to Mega Uranium
Titan Uranium Inc.
Located on strike to the south of the Key Lake mine with excellent access with Highway 914 bifurcating much of the
604-689-2599
2.0 million units @ $0.45 with 1 wt @ $0.65 exercisable within 2 years
Rick Mazur, P.Geo.
Forum Uranium Corp.
Forum is one of a several uranium exploration companies active in Saskatchewan and Nunavut; they have quality exploration projects, experienced management and provides investors good exposure to both the Athabasca Basin and the Thelon Basin.
- Focused on uranium in Saskatchewan and Nunavut. - Top flight management with a track record of success who understand the fine art of unconformity uranium exploration . - Focused on relatively shallow drill targets with good infrastructure near existing deposits or mine operations. - Key project locations in Athabasca Basin (Key Lake, Henday, Maurice Point and Thelon Basin (North Thelon JV). - Potential JV interests attracted by strong technical management.CatalystsHenday: Geophysics; data compilation leading to drilling by Q108 (5,000m drill program planned).Key Lake Road: 8,000m drill program of 50 holes in Molly zone planned for Q407-Q108.Maurice Point: Airborne survey underway; drilling 3,000m on Beach Zone in Q407 - Q208 pending permittingNorth Thelon JV: Current $1.5M summer exploration program completing w/assays expected in Q407 - 3,000m diamond drilling program planned for summer 2008.
Exploration Timetable
Hathor Exploration Ltd.Forum Uranium Corp.Uravan Minerals Inc.
$0.00
$0.10
$0.20
$0.30
$0.40
$0.50
$0.60
$0.70
$0.80
$0.90
$1.00
Nov
-06
Dec
-06
Jan-
07
Feb-
07
Mar
-07
Apr
-07
May
-07
Jun-
07
Jul-0
7
Aug
-07
Sep
-07
Oct
-07
0.0
0.5
1.0
1.5
1
Vol (
M)
50 Day MA100 Day MA
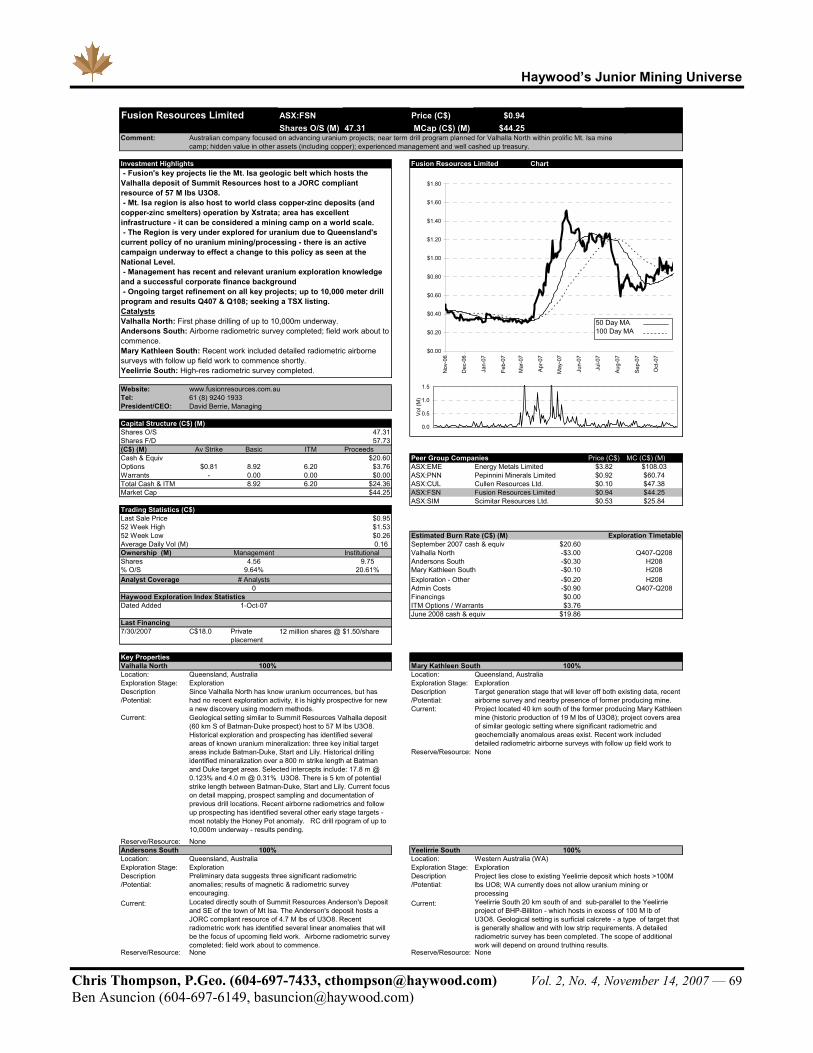
Haywood’s Junior Mining Universe
Chris Thompson, P.Geo. (604-697-7433, [email protected]) Vol. 2, No. 4, November 14, 2007 — 69 Ben Asuncion (604-697-6149, [email protected])
ASX:FSN Price (C$) $0.94 Shares O/S (M) 47.31 MCap (C$) (M) $44.25
Comment:
11/12/2007Investment Highlights Fusion Resources Limited Chart
Website: www.fusionresources.com.auTel:President/CEO:
Capital Structure (C$) (M)Shares O/S 47.31Shares F/D 57.73(C$) (M) Av Strike Basic ITM ProceedsCash & Equiv $20.60 Peer Group Companies Price (C$) MC (C$) (M)Options $0.81 8.92 6.20 $3.76 ASX:EME $3.82 $108.03Warrants - 0.00 0.00 $0.00 ASX:PNN $0.92 $60.74Total Cash & ITM 8.92 6.20 $24.36 ASX:CUL $0.10 $47.38Market Cap $44.25 ASX:FSN $0.94 $44.25
ASX:SIM $0.53 $25.84Trading Statistics (C$) Last Sale Price $0.9552 Week High $1.5352 Week Low $0.26 Estimated Burn Rate (C$) (M)Average Daily Vol (M) 0.16 September 2007 cash & equiv $20.60 Ownership (M) Management Institutional Valhalla North -$3.00 Q407-Q208Shares 4.56 9.75 Andersons South -$0.30 H208% O/S 9.64% 20.61% Mary Kathleen South -$0.10 H208Analyst Coverage # Analysts Exploration - Other -$0.20 H208
0 Admin Costs -$0.90 Q407-Q208Haywood Exploration Index Statistics Financings $0.00 Dated Added 1-Oct-07 ITM Options / Warrants $3.76
June 2008 cash & equiv $19.86 Last Financing7/30/2007 C$18.0 12 million shares @ $1.50/share
Key PropertiesValhalla North 100% 100%Location: Queensland, Australia Location: Queensland, AustraliaExploration Stage: Exploration Exploration Stage: ExplorationDescription Description/Potential: /Potential:
Current:Current:
Reserve/Resource: None
Reserve/Resource:Andersons South 100% Yeelirrie South 100%Location: Queensland, Australia Location: Western Australia (WA)Exploration Stage: Exploration Exploration Stage: ExplorationDescription Description/Potential: /Potential:
Current: Current:
Reserve/Resource: None Reserve/Resource:
Fusion Resources LimitedScimitar Resources Ltd.
Fusion Resources Limited
Australian company focused on advancing uranium projects; near term drill program planned for Valhalla North within prolific Mt. Isa mine camp; hidden value in other assets (including copper); experienced management and well cashed up treasury.
61 (8) 9240 1933David Berrie, Managing
None
Since Valhalla North has know uranium occurrences, but has had no recent exploration activity, it is highly prospective for new a new discovery using modern methods.
None
Project located 40 km south of the former producing Mary Kathleen mine (historic production of 19 M lbs of U3O8); project covers area of similar geologic setting where significant radiometric and geochemcially anomalous areas exist. Recent work included detailed radiometric airborne surveys with follow up field work to
Preliminary data suggests three significant radiometric anomalies; results of magnetic & radiometric survey encouraging.
Geological setting similar to Summit Resources Valhalla deposit (60 km S of Batman-Duke prospect) host to 57 M lbs U3O8. Historical exploration and prospecting has identified several areas of known uranium mineralization: three key initial target areas include Batman-Duke, Start and Lily. Historical drilling identified mineralization over a 800 m strike length at Batman and Duke target areas. Selected intercepts include: 17.8 m @ 0.123% and 4.0 m @ 0.31% U3O8. There is 5 km of potential strike length between Batman-Duke, Start and Lily. Current focus on detail mapping, prospect sampling and documentation of previous drill locations. Recent airborne radiometrics and follow up prospecting has identified several other early stage targets - most notably the Honey Pot anomaly. RC drill rpogram of up to 10,000m underway - results pending.
Located directly south of Summit Resources Anderson's Deposit and SE of the town of Mt Isa. The Anderson's deposit hosts a JORC compliant resource of 4.7 M lbs of U3O8. Recent radiometric work has identified several linear anomalies that will be the focus of upcoming field work. Airborne radiometric survey completed; field work about to commence.
Target generation stage that will lever off both existing data, recent airborne survey and nearby presence of former producing mine.
Mary Kathleen South
Yeelirrie South 20 km south of and sub-parallel to the Yeelirrie project of BHP-Billiton - which hosts in excess of 100 M lb of U3O8. Geological setting is surficial calcrete - a type of target that is generally shallow and with low strip requirements. A detailed radiometric survey has been completed. The scope of additional work will depend on ground truthing results.
Project lies close to existing Yeelirrie deposit which hosts >100M lbs UO8; WA currently does not allow uranium mining or processing
- Fusion's key projects lie the Mt. Isa geologic belt which hosts the Valhalla deposit of Summit Resources host to a JORC compliant resource of 57 M lbs U3O8. - Mt. Isa region is also host to world class copper-zinc deposits (and copper-zinc smelters) operation by Xstrata; area has excellent infrastructure - it can be considered a mining camp on a world scale. - The Region is very under explored for uranium due to Queensland's current policy of no uranium mining/processing - there is an active campaign underway to effect a change to this policy as seen at the National Level. - Management has recent and relevant uranium exploration knowledge and a successful corporate finance background - Ongoing target refinement on all key projects; up to 10,000 meter drill program and results Q407 & Q108; seeking a TSX listing.CatalystsValhalla North: First phase drilling of up to 10,000m underway.Andersons South: Airborne radiometric survey completed; field work about to commence.Mary Kathleen South: Recent work included detailed radiometric airborne surveys with follow up field work to commence shortly.Yeelirrie South: High-res radiometric survey completed.
Private placement
Exploration Timetable
Energy Metals LimitedPepinnini Minerals LimitedCullen Resources Ltd.
$0.00
$0.20
$0.40
$0.60
$0.80
$1.00
$1.20
$1.40
$1.60
$1.80
Nov
-06
Dec
-06
Jan-
07
Feb-
07
Mar
-07
Apr
-07
May
-07
Jun-
07
Jul-0
7
Aug
-07
Sep
-07
Oct
-07
0.0
0.5
1.0
1.5
1
Vol
(M)
50 Day MA100 Day MA
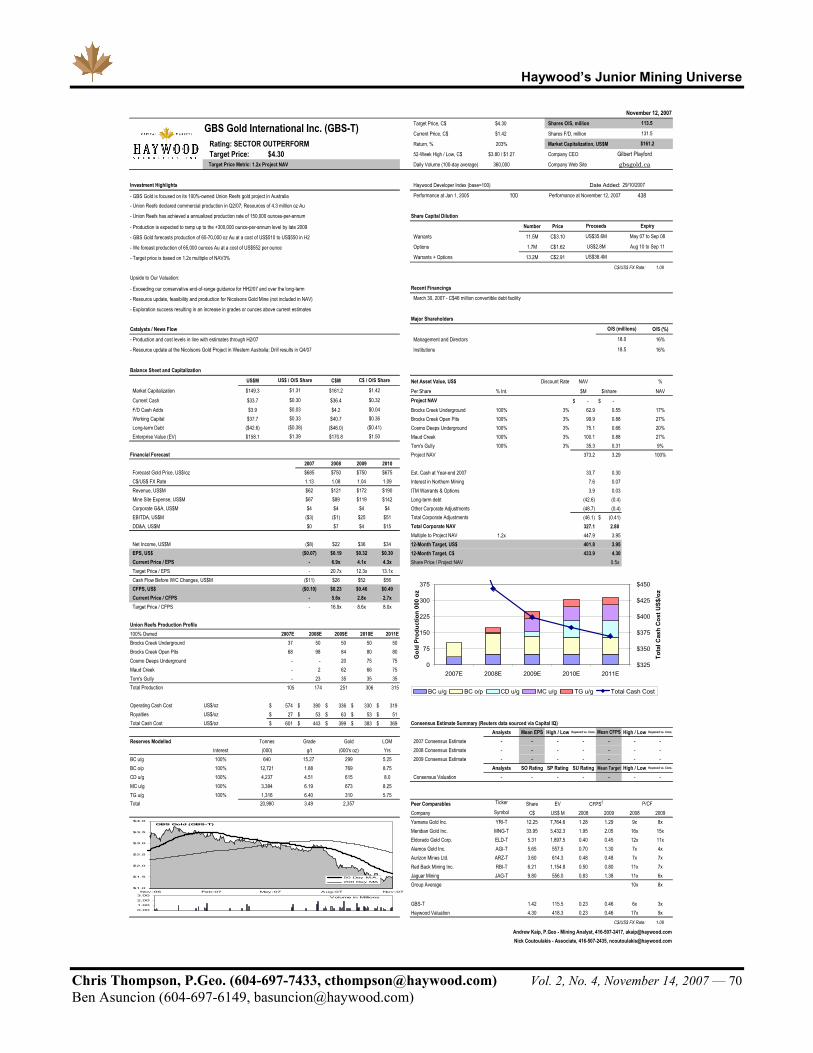
Haywood’s Junior Mining Universe
Chris Thompson, P.Geo. (604-697-7433, [email protected]) Vol. 2, No. 4, November 14, 2007 — 70 Ben Asuncion (604-697-6149, [email protected])
Target Price, C$ $4.30 Shares O/S, million
Current Price, C$ $1.42 Shares F/D, million
Rating: SECTOR OUTPERFORM Return, % 203% Market Capitalization, US$M
Target Price: $4.30 52-Week High / Low, C$ $3.80 / $1.27 Company CEO
Target Price Metric: 1.2x Project NAV Daily Volume (100-day average) 360,000 Company Web Site
Investment Highlights Haywood Developer Index (base=100) Date Added:
- GBS Gold is focused on its 100%-owned Union Reefs gold project in Australia Performance at Jan 1, 2005 100 Performance at November 12, 2007 438- Union Reefs declared commercial production in Q2/07; Resources of 4.3 million oz Au
- Union Reefs has achieved a annualized production rate of 150,000 ounces-per-annum Share Capital Dilution
- Production is expected to ramp up to the +300,000 ounce-per-annum level by late 2009 Number Price
- GBS Gold forecasts production of 65-70,000 oz Au at a cost of US$510 to US$550 in H2 Warrants 11.5M C$3.10
- We foreast production of 65,000 ounces Au at a cost of US$552 per ounce Options 1.7M C$1.62
- Target price is based on 1.2x multiple of NAV3% Warrants + Options 13.2M C$2.91
C$/US$ FX Rate: 1.08
Upside to Our Valuation:
- Exceeding our conservative end-of-range guidance for HH2/07 and over the long-term Recent Financings
- Resource update, feasibility and production for Nicolsons Gold Mine (not included in NAV)
- Exploration success resulting in an increase in grades or ounces above current estimatesMajor Shareholders
Catalysts / News Flow O/S (%)
- Production and cost levels in line with estimates through H2/07 Management and Directors 16%
- Resource update at the Nicolsons Gold Project in Western Australia; Drill results in Q4/07 Institutions 16%
Balance Sheet and Capitalization
US$M C$M Net Asset Value, US$ Discount Rate NAV %Market Capitalization $149.3 $161.2 Per Share % Int. $M $/share NAVCurrent Cash $33.7 $36.4 Project NAV -$ -$ F/D Cash Adds $3.9 $4.2 Brocks Creek Underground 100% 3% 62.9 0.55 17%Working Capital $37.7 $40.7 Brocks Creek Open Pits 100% 3% 99.9 0.88 27%Long-term Debt ($42.6) ($46.0) Cosmo Deeps Underground 100% 3% 75.1 0.66 20%Enterprise Value (EV) $158.1 $170.8 Maud Creek 100% 3% 100.1 0.88 27%
Tom's Gully 100% 3% 35.3 0.31 9%Financial Forecast Project NAV 373.2 3.29 100%
2007 2008 2009 2010Forecast Gold Price, US$/oz $685 $750 $750 $675 Est. Cash at Year-end 2007 33.7 0.30C$/US$ FX Rate 1.13 1.08 1.04 1.09 Interest in Northern Mining 7.6 0.07Revenue, US$M $62 $121 $172 $190 ITM Warrants & Options 3.9 0.03Mine Site Expense, US$M $67 $89 $119 $142 Long-term debt (42.6) (0.4)Corporate G&A, US$M $4 $4 $4 $4 Other Corporate Adjustments (48.7) (0.4)EBITDA, US$M ($3) ($1) $25 $51 Total Corporate Adjustments (46.1) (0.41)$ DD&A, US$M $0 $7 $4 $15 Total Corporate NAV 327.1 2.88
Multiple to Project NAV 1.2x 447.9 3.95Net Income, US$M ($8) $22 $36 $34 12-Month Target, US$ 401.8 3.95EPS, US$ ($0.07) $0.19 $0.32 $0.30 12-Month Target, C$ 433.9 4.30Current Price / EPS - 6.9x 4.1x 4.3x Share Price / Project NAV 0.5x Target Price / EPS - 20.7x 12.3x 13.1xCash Flow Before W/C Changes, US$M ($11) $26 $52 $56CFPS, US$ ($0.10) $0.23 $0.46 $0.49Current Price / CFPS - 5.6x 2.8x 2.7xTarget Price / CFPS - 16.9x 8.6x 8.0x
Union Reefs Production Profile100% Owned 2007E 2008E 2009E 2010E 2011EBrocks Creek Underground 37 50 50 50 50 Brocks Creek Open Pits 68 98 84 80 80 Cosmo Deeps Underground - - 20 75 75 Maud Creek - 2 62 66 75 Tom's Gully - 23 35 35 35 Total Production 105 174 251 306 315
Operating Cash Cost US$/oz 574$ 390$ 336$ 330$ 319$ Royalties US$/oz 27$ 53$ 63$ 53$ 51$ Total Cash Cost US$/oz 601$ 443$ 399$ 383$ 369$ Consensus Estimate Summary (Reuters data sourced via Capital IQ)
Analysts Mean EPS High / Low Haywood vs. Cons. Mean CFPS High / Low Haywood vs. Cons.
Reserves Modelled Grade LOM 2007 Consensus Estimate - - - - - - -Interest g/t Yrs 2008 Consensus Estimate - - - - - - -
BC u/g 100% 15.27 5.25 2009 Consensus Estimate - - - - - - -BC o/p 100% 1.88 8.75 Analysts SO Rating SP Rating SU Rating Mean Target High / Low Haywood vs. Cons.
CD u/g 100% 4.51 8.0 Consensus Valuation - - - - - - -MC u/g 100% 6.19 8.25TG u/g 100% 6.40 5.75Total 3.49 Peer Comparables Ticker Share EV
Company Symbol C$ US$ M 2008 2009 2008 2009Yamana Gold Inc. YRI-T 12.25 7,764.6 1.28 1.29 9x 8xMeridian Gold Inc. MNG-T 33.95 3,432.3 1.95 2.05 16x 15xEldorado Gold Corp. ELD-T 5.31 1,897.5 0.40 0.45 12x 11xAlamos Gold Inc. AGI-T 5.65 557.5 0.70 1.30 7x 4xAurizon Mines Ltd. ARZ-T 3.60 614.3 0.48 0.48 7x 7xRed Back Mining Inc. RBI-T 6.21 1,154.8 0.50 0.80 11x 7xJaguar Mining JAG-T 9.80 556.0 0.83 1.38 11x 6xGroup Average 10x 8x
GBS-T 1.42 115.5 0.23 0.46 6x 3xHaywood Valuation 4.30 418.3 0.23 0.46 17x 9x
C$/US$ FX Rate: 1.08
Andrew Kaip, P.Geo - Mining Analyst, 416-507-2417, [email protected] Coutoulakis - Associate, 416-507-2435, [email protected]
CFPS3 P/CF
Tonnes Gold(000) (000's oz)640 299
12,721 7694,237 615
($0.38) ($0.41)$1.39 $1.50
GBS Gold International Inc. (GBS-T)
US$ / O/S Share C$ / O/S Share
$1.31 $1.42
$0.04
May 07 to Sep 08US$35.6M
Proceeds
$0.32
$0.33 $0.36
March 30, 2007 - C$46 million convertible debt facility
O/S (millions)
18.0
18.5
$0.30$0.03
Gilbert Playford
November 12, 2007113.5
131.5
$161.2
gbsgold.ca
Aug 10 to Sep 11
US$38.4M
US$2.8M
Expiry
29/10/2007
20,980 2,357
3,384 6731,316 310
0
75
150
225
300
375
2007E 2008E 2009E 2010E 2011E
Gol
d Pr
oduc
tion
000
oz
$325
$350
$375
$400
$425
$450
Tota
l Cas
h C
ost U
S$/o
z
BC u/g BC o/p CD u/g MC u/g TG u/g Total Cash Cost
GBS Gold (GBS-T)
$1.0
$1.5
$2.0
$2.5
$3.0
$3.5
$4.0
Nov-06 Feb-07 May-07 Aug-07 Nov-07
50 Day M.A.
200 Day MA
Volume in Millions
0.00
1.00
2.00
3.00
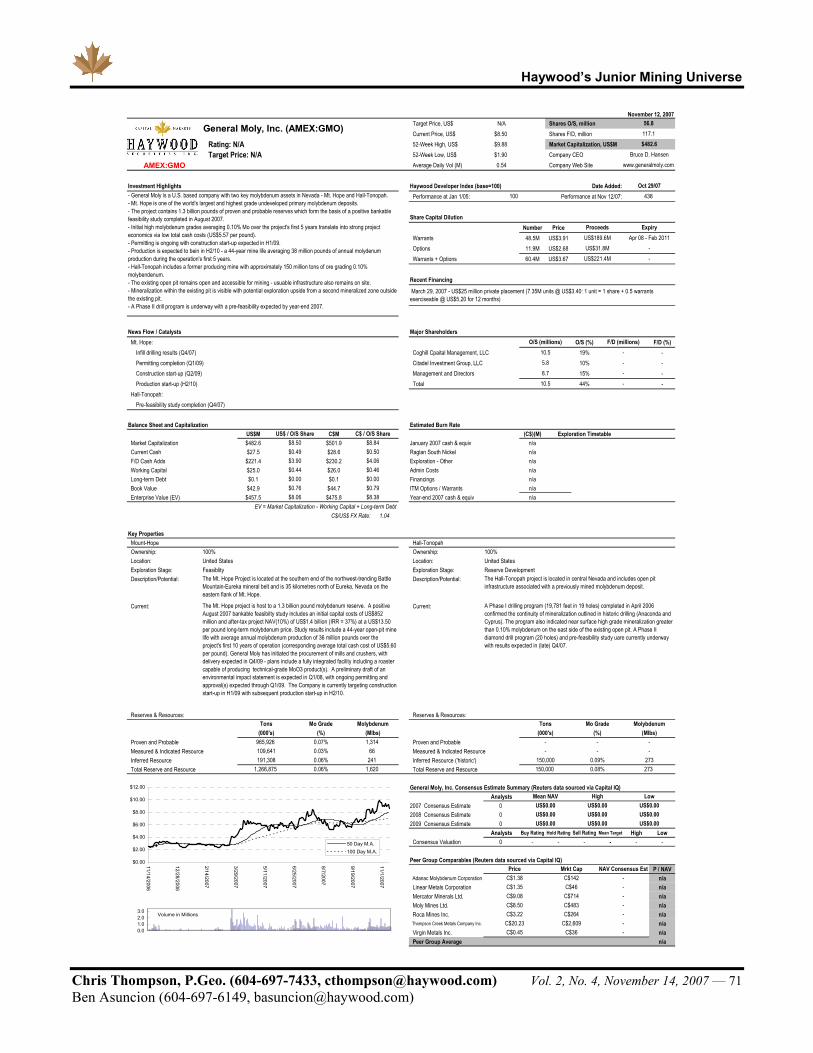
Haywood’s Junior Mining Universe
Chris Thompson, P.Geo. (604-697-7433, [email protected]) Vol. 2, No. 4, November 14, 2007 — 71 Ben Asuncion (604-697-6149, [email protected])
Target Price, US$ N/A Shares O/S, millionCurrent Price, US$ $8.50 Shares F/D, million
Rating: N/A 52-Week High, US$ $9.88 Market Capitalization, US$M
Target Price: N/A 52-Week Low, US$ $1.90 Company CEO
AMEX:GMO Average Daily Vol (M) 0.54 Company Web Site
Investment Highlights Haywood Developer Index (base=100) Date Added:Performance at Jan 1/05: Performance at Nov 12/07:
Share Capital DilutionNumber Price
Warrants 48.5M US$3.91Options 11.9M US$2.68Warrants + Options 60.4M US$3.67
Recent Financing
News Flow / Catalysts Major ShareholdersMt. Hope: O/S (%) F/D (%)
Infill drilling results (Q4/07) Coghill Cpaital Management, LLC 19% -Permitting completion (Q1/09) Citadel Investment Group, LLC 10% -Construction start-up (Q2/09) Management and Directors 15% -Production start-up (H2/10) Total 44% -
Hall-Tonopah:Pre-feasibility study completion (Q4/07)
Balance Sheet and Capitalization Estimated Burn RateUS$M C$M (C$)(M) Exploration Timetable
Market Capitalization $482.6 $501.9 January 2007 cash & equiv n/aCurrent Cash $27.5 $28.6 Raglan South Nickel n/aF/D Cash Adds $221.4 $230.2 Exploration - Other n/aWorking Capital $25.0 $26.0 Admin Costs n/aLong-term Debt $0.1 $0.1 Financings n/aBook Value $42.9 $44.7 ITM Options / Warrants n/aEnterprise Value (EV) $457.5 $475.8 Year-end 2007 cash & equiv n/a
EV = Market Capitalization - Working Capital + Long-term DebtC$/US$ FX Rate: 1.04
Key PropertiesMount-Hope Hall-TonopahOwnership: 100% Ownership: 100%Location: United States Location: United StatesExploration Stage: Feasiblity Exploration Stage: Reserve DevelopmentDescription/Potential: Description/Potential:
Current: Current:
Reserves & Resources: Reserves & Resources:
Proven and Probable Proven and ProbableMeasured & Indicated Resource Measured & Indicated ResourceInferred Resource Inferred Resource ('historic')Total Reserve and Resource Total Reserve and Resource
General Moly, Inc. Consensus Estimate Summary (Reuters data sourced via Capital IQ)Analysts
2007 Consensus Estimate 02008 Consensus Estimate 02009 Consensus Estimate 0
Analysts Buy Rating Hold Rating Sell Rating Mean Target High LowConsensus Valuation 0 - - - - - -
Peer Group Comparables (Reuters data sourced via Capital IQ)P / NAV
Adanac Molybdenum Corporation n/aLinear Metals Corporation n/aMercator Minerals Ltd. n/aMoly Mines Ltd. n/aRoca Mines Inc. n/aThompson Creek Metals Company Inc. n/aVirgin Metals Inc. n/aPeer Group Average n/a
---
-
--
-
C$483C$264
C$2,609C$36
C$46C$714C$9.08
The Mt. Hope Project is located at the southern end of the northwest-trending Battle Mountain-Eureka mineral belt and is 35 kilometres north of Eureka, Nevada on the eastern flank of Mt. Hope.
The Mt. Hope project is host to a 1.3 billion pound molybdenum reserve. A positive August 2007 bankable feasibilty study includes an initial capital costs of US$852 million and after-tax project NAV(10%) of US$1.4 billion (IRR = 37%) at a US$13.50 per pound long-term molybdenum price. Study results include a 44-year open-pit mine life with average annual molybdenum production of 36 million pounds over the project's first 10 years of operation (corresponding average total cash cost of US$5.60 per pound). General Moly has initiated the procurement of mills and crushers, with delivery expected in Q4/09 - plans include a fully integrated facility including a roaster capable of producing technical-grade MoO3 product(s). A preliminary draft of an environmental impact statement is expected in Q1/08, with ongoing permitting and approval(s) expected through Q1/09. The Company is currently targeting construction start-up in H1/09 with subsequent production start-up in H2/10.
Mrkt Cap
US$0.00US$0.00
HighUS$0.00
-US$189.6MUS$31.8M
C$142NAV Consensus Est
US$0.00US$0.00US$0.00
LowUS$0.00
Bruce D. Hansen
Proceeds
www.generalmoly.com
Expiry
General Moly, Inc. (AMEX:GMO)
Price
Mean NAV
US$0.00US$0.00
Tons Molybdenum
$0.00$0.79$8.38
$0.76$8.06
C$ / O/S Share$8.84$0.50$4.06$0.46
The Hall-Tonopah project is located in central Nevada and includes open pit infrastructure associated with a previously mined molybdenum deposit.
-
November 12, 2007
C$1.38
O/S (millions)
56.8117.1
Apr 08 - Feb 2011
$482.6
Oct 29/07
-5.8 -
US$221.4M -
C$8.50C$3.22
C$1.35
C$0.45C$20.23
191,308
100 438
March 29, 2007 - US$25 million private placement (7.35M units @ US$3.40: 1 unit = 1 share + 0.5 warrants exerciseable @ US$5.20 for 12 months)
10.5
10.5
F/D (millions)
--
8.7
1,266,875
Mo Grade(%)
0.07%0.03%0.06%0.06%
(000's)965,926109,641
(Mlbs)1,314
66241
1,620
A Phase I drilling program (19,781 feet in 19 holes) completed in April 2006 confirmed the continuity of mineralization outlined in historic drilling (Anaconda and Cyprus). The program also indicated near surface high grade mineralization greater than 0.10% molybdenum on the east side of the existing open pit. A Phase II diamond drill program (20 holes) and pre-feasibility study uare currently underway with results expected in (late) Q4/07.
Tons Mo Grade Molybdenum(000's) (%) (Mlbs)
- -- - -
150,000 0.09% 273150,000 0.08% 273
- General Moly is a U.S. based company with two key molybdenum assets in Nevada - Mt. Hope and Hall-Tonopah.- Mt. Hope is one of the world's largest and highest grade undeveloped primary molybdenum deposits.- The project contains 1.3 billion pounds of proven and probable reserves which form the basis of a positive bankable feasibility study completed in August 2007.- Initial high molybdenum grades averaging 0.10% Mo over the project's first 5 years translate into strong project economics via low total cash costs (US$5.57 per pound).- Permitting is ongoing with construction start-up expected in H1/09.- Production is expected to bein in H2/10 - a 44-year mine life averaging 38 million pounds of annual molydenum production during the operation's first 5 years.- Hall-Tonopah includes a former producing mine with approximately 150 million tons of ore grading 0.10% molybendenum.- The existing open pit remains open and accessible for mining - usuable infrastructure also remains on site.- Mineralization within the existing pit is visible with potential exploration upside from a second mineralized zone outside the existing pit.- A Phase II drill program is underway with a pre-feasibility expected by year-end 2007.
US$ / O/S Share$8.50$0.49$3.90$0.44$0.00
$0.00
$2.00
$4.00
$6.00
$8.00
$10.00
$12.00
11/14/2006
12/28/2006
2/14/2007
3/29/2007
5/11/2007
6/25/2007
8/7/2007
9/19/2007
11/1/2007
50 Day M.A.100 Day M.A.
Volume in Millions
0.01.02.03.0

Haywood’s Junior Mining Universe
Chris Thompson, P.Geo. (604-697-7433, [email protected]) Vol. 2, No. 4, November 14, 2007 — 72 Ben Asuncion (604-697-6149, [email protected])
TSXV:HAT Price $0.76 Shares O/S (M) 68.13 MCap (C$) (M) $51.78
Comment:
11/12/2007Investment Highlights Hathor Exploration Ltd. Chart
Website: www.hathor.caTel:President/CEO:
Capital Structure (C$) (M)Shares O/S 68.13Shares F/D 83.76(C$) (M) Av Strike Basic ITM ProceedsCash & Equiv $22.50Options $0.93 4.99 0.00 $0.00Warrants $1.31 10.31 4.94 $2.72Total Cash & ITM 15.29 4.94 $25.22Market Cap $51.78
Peer Group Companies Price (C$) MC (C$) (M)Trading Statistics (C$) TSX:DML $10.31 $1,955.81Last Sale Price $0.76 TSXV:STM $2.86 $206.9352 Week High $2.34 TSXV:PXP $2.64 $76.1052 Week Low $0.60 TSXV:TXM $3.35 $59.57Average Daily Vol (M) 0.24 TSXV:HAT $0.76 $51.78Ownership (M) Management Institutional Shares 4.28 1.13% O/S 6.29% 1.66% Estimated Burn Rate (C$) (M)Analyst Coverage # Analysts September cash & equiv $22.50
0 Eskay Creek Mining Camp -$0.30 Q407 - Q108Haywood Exploration Index Statistics Athabaska Basin -$7.10 Q407 - Q108Date added 22-Nov-06 Admin Costs -$0.60 Q407 - Q108
Financings $0.00 Last Financing ITM Options / Warrants $2.72 4/19/2007 $20.08 million March 2008 cash & equiv $17.22
Key PropertiesAthabaska Basin 50% Eskay Creek Mining Camp 100% Location: Saskatchewan Location: British ColumbiaExploration Stage: Exploration Exploration Stage: ExplorationDescription Description/Potential: /Potential:
Current:
Reserve/Resource: None
Current:
Reserve/Resource: None
Hathor Exploration Ltd.
Experienced management team and an extensive land position (1.1 million acres) in Eastern and Western Athabasca Basin. Plans to spin off base and precious metal properties.
Hatchet Lake - lake sediment geochemical underway, airborne geophysical survey completed; Midwest NE - 3-D seismic completed and drilling commenced - $3 million over the next 6-9 months which will include 15-20 drill holes - lake sediment geochemical underway; Milliken Creek - lake sediment geochemical underway. Russell Lake - Drilling underway (7,200 m). Lake sediment geochemical underway underway at Russell South. Vedette Lake - 97 line km of electromagnetic conductors defined - lake sediment geochemical underway. Drilling underway on Carswell property - last drill program completed 27 holes (10,000m), 9 intersecting radioactive intervals, assay results include 7m @ 0.8lb/t U308 (BR 18). Wollaston NE property - drilling planned for Q307. Haultain River - 45 line km of electromagnetic (EM) conductors defined. Follow-up ground geological, geochemical and geophysical exploration planned.
230,000 acres - Eskay Creek - precious metal-enriched VMS potential - Land position consists of Delta, MacGold, Backbone and Doc Extension properties.
Exploration Timetable
Brokered Private Placement
Extensive Athabasca Basin land position - 839,397 acres in the eastern basin - 282,427 acres in the western side of the basin. Properties include: Carswell (50% - JV with ESO Uranium -CDNX: ESO) - borders the past-producing Cluff Lake mine; Hatchet Lake - 40 km N-NE of Eagle Point mine; Midwest NE (90%) - 4 km NE of the Midwest; Milliken Creek - 26 km S-SE of Cigar Lake; Old Fort Bay (25%) - JV with Triex Uranium (CDNX: TRX) - 35 km from Cluff Lake; Russell Lake (40% - JV with Northern Continental) - borders Moore Lake property, Wheeler River and McArthur River properties; Russell South; Wollaston Northeast (49%) - JV with Triex Uranium (CDNX: TRX); Haultain River (50%) - JV Forum Uranium (CDNX:FDC); Vedette Lake.
- Extensive land position (1.1 million acres) in Eastern and Western Athabasca Basin. - Joint ventures with Northern Continental Resources, ESO Uranium Corp, Triex Minerals and Forum Uranium. - Drilling underway at Cluff Lake, Carswell and Russell Lake properties. - Lake sediment geochemical surveys planned for Vedette Lake, Haultain River, Russell South, Milliken Creek, Midwest Northeast and Hatchet Lake uranium projects. - Plans to spin off base and precious metal properties.CatalystsAthabaska Basin: Lake sediment geochemical completed; awaiting results; preliminary results indicate some samples that contain highly-anomalous uranium values.Eskay Creek Mining Camp: Planned divestiture by end of year.Russell Lake: Summer drill program completed (3,554m) focusing on the extended vicinity of the Grayling Zone - to be focus of Q407-Q108 drill program. Plans for other exploration target areas are being prepared & will be released shortly.
9 million units @ $1.60; 4 million FT units @ $1.90
Hathor Exploration Ltd.
604-684-6707
Recently completed a combined heli-borne magnetic, electro magnetic and radio metric survey. Currently flying a helicopter-borne geophysical survey. Plans to spin off base and precious metal properties in Q407.
Stephen Stanley
Triex Minerals Corp.Pitchstone Exploration Ltd.
Denison Mines Corp.Strathmore Minerals Corp.
$0.00
$0.25
$0.50
$0.75
$1.00
$1.25
$1.50
$1.75
$2.00
$2.25
$2.50
Nov
-06
Dec
-06
Jan-
07
Feb-
07
Mar
-07
Apr
-07
May
-07
Jun-
07
Jul-0
7
Aug
-07
Sep
-07
Oct
-07
0.00.30.50.81.01.31.5
1
Vol (
M)
50 Day MA100 Day MA
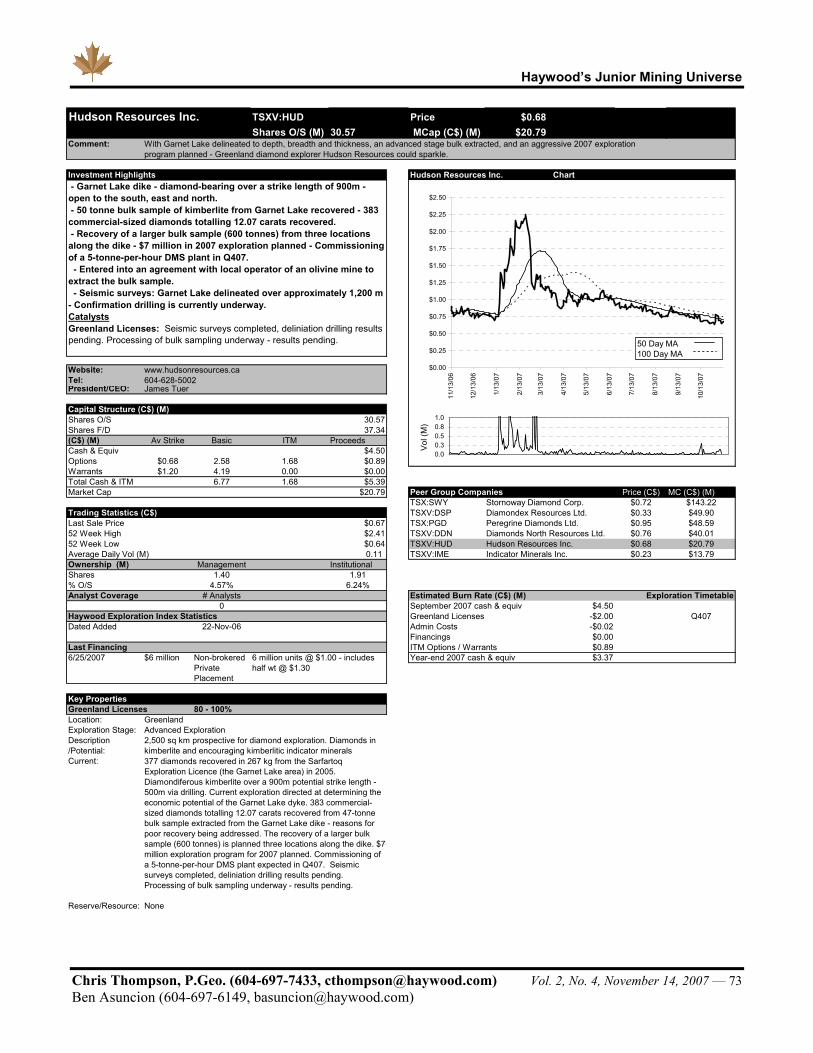
Haywood’s Junior Mining Universe
Chris Thompson, P.Geo. (604-697-7433, [email protected]) Vol. 2, No. 4, November 14, 2007 — 73 Ben Asuncion (604-697-6149, [email protected])
TSXV:HUD Price $0.68 Shares O/S (M) 30.57 MCap (C$) (M) $20.79
Comment:
11/12/2007Investment Highlights Hudson Resources Inc. Chart
Website: www.hudsonresources.caTel:President/CEO:
Capital Structure (C$) (M)Shares O/S 30.57Shares F/D 37.34(C$) (M) Av Strike Basic ITM ProceedsCash & Equiv $4.50Options $0.68 2.58 1.68 $0.89Warrants $1.20 4.19 0.00 $0.00Total Cash & ITM 6.77 1.68 $5.39Market Cap $20.79 Peer Group Companies Price (C$) MC (C$) (M)
TSX:SWY $0.72 $143.22Trading Statistics (C$) TSXV:DSP $0.33 $49.90Last Sale Price $0.67 TSX:PGD $0.95 $48.5952 Week High $2.41 TSXV:DDN $0.76 $40.0152 Week Low $0.64 TSXV:HUD $0.68 $20.79Average Daily Vol (M) 0.11 TSXV:IME $0.23 $13.79Ownership (M) Management Institutional Shares 1.40 1.91 % O/S 4.57% 6.24%Analyst Coverage # Analysts Estimated Burn Rate (C$) (M)
0 September 2007 cash & equiv $4.50 Haywood Exploration Index Statistics Greenland Licenses -$2.00 Q407Dated Added 22-Nov-06 Admin Costs -$0.02
Financings $0.00 Last Financing ITM Options / Warrants $0.89 6/25/2007 $6 million Year-end 2007 cash & equiv $3.37
Key PropertiesGreenland Licenses 80 - 100%Location: GreenlandExploration Stage: Advanced ExplorationDescription/Potential:Current:
Reserve/Resource: None
Hudson Resources Inc.
With Garnet Lake delineated to depth, breadth and thickness, an advanced stage bulk extracted, and an aggressive 2007 exploration program planned - Greenland diamond explorer Hudson Resources could sparkle.
- Garnet Lake dike - diamond-bearing over a strike length of 900m - open to the south, east and north. - 50 tonne bulk sample of kimberlite from Garnet Lake recovered - 383 commercial-sized diamonds totalling 12.07 carats recovered. - Recovery of a larger bulk sample (600 tonnes) from three locations along the dike - $7 million in 2007 exploration planned - Commissioning of a 5-tonne-per-hour DMS plant in Q407. - Entered into an agreement with local operator of an olivine mine to extract the bulk sample. - Seismic surveys: Garnet Lake delineated over approximately 1,200 m - Confirmation drilling is currently underway.CatalystsGreenland Licenses: Seismic surveys completed, deliniation drilling results pending. Processing of bulk sampling underway - results pending.
377 diamonds recovered in 267 kg from the Sarfartoq Exploration Licence (the Garnet Lake area) in 2005. Diamondiferous kimberlite over a 900m potential strike length - 500m via drilling. Current exploration directed at determining the economic potential of the Garnet Lake dyke. 383 commercial-sized diamonds totalling 12.07 carats recovered from 47-tonne bulk sample extracted from the Garnet Lake dike - reasons for poor recovery being addressed. The recovery of a larger bulk sample (600 tonnes) is planned three locations along the dike. $7-million exploration program for 2007 planned. Commissioning of a 5-tonne-per-hour DMS plant expected in Q407. Seismic surveys completed, deliniation drilling results pending. Processing of bulk sampling underway - results pending.
6 million units @ $1.00 - includes half wt @ $1.30
Exploration Timetable
Hudson Resources Inc.
Non-brokered Private Placement
2,500 sq km prospective for diamond exploration. Diamonds in kimberlite and encouraging kimberlitic indicator minerals
604-628-5002
Indicator Minerals Inc.
James Tuer
Diamonds North Resources Ltd.
Diamondex Resources Ltd.Stornoway Diamond Corp.
Peregrine Diamonds Ltd.
$0.00
$0.25
$0.50
$0.75
$1.00
$1.25
$1.50
$1.75
$2.00
$2.25
$2.50
11/1
3/06
12/1
3/06
1/13
/07
2/13
/07
3/13
/07
4/13
/07
5/13
/07
6/13
/07
7/13
/07
8/13
/07
9/13
/07
10/1
3/07
0.00.30.50.81.0
1
Vol (
M)
50 Day MA100 Day MA

Haywood’s Junior Mining Universe
Chris Thompson, P.Geo. (604-697-7433, [email protected]) Vol. 2, No. 4, November 14, 2007 — 74 Ben Asuncion (604-697-6149, [email protected])
Target Price, C$ N/A Shares O/S, millionCurrent Price, C$ $1.95 Shares F/D, million
Rating: N/A 52-Week High, C$ $2.35 Market Capitalization, US$M Target Price: N/A 52-Week Low, C$ $0.85 Company CEO
CDNX:IPR Average Daily Vol (M) 0.02 Company Web Site
Investment Highlights Haywood Developer Index (base=100) Date Added:Performance at Jan 1/05: Performance at Nov 12/07:
Share Capital DilutionNumber Price
Warrants 0.0M 0.0MOptions 3.8M C$0.85Warrants + Options 3.8M C$0.82
Recent Financing
News Flow / Catalysts Major ShareholdersMagistral: O/S (%) F/D (%)
EIS and feasibility study completion (Q4/07) Sprott Asset Management Inc. 20% -Project fianncing (H1/08) U.S. Global Investors, Inc. 1% -Construction start-up (Q3/08) Etienne, Odier, Pythoud & Cie 0% -Production start-up (2010?) RAB Capital PLC 0% -
Anthony Floyd 2% -Total 24% -
Balance Sheet and Capitalization Estimated Burn RateUS$M C$M
Market Capitalization $68.2 $71.0 January 2007 cash & equivCurrent Cash $5.0 $5.2 MagistralF/D Cash Adds $3.1 $3.2 Exploration - OtherWorking Capital $3.7 $3.8 Admin CostsLong-term Debt $0.0 $0.0 FinancingsBook Value $23.1 $24.0 ITM Options / WarrantsEnterprise Value (EV) $64.6 $67.1 Year-end 2007 cash & equiv
EV = Market Capitalization - Working Capital + Long-term Debt
C$/US$ FX Rate: 1.04
Key PropertyMagistralOwnership: 100%Location: PeruExploration Stage: FeasiblityDescription/Potential:
Current:
Reserves & Resources:Tonnes Cu Grade Mo Grade Ag Grade Copper Moly(000's) (%) (%) (g/t) (Mlbs) (Mlbs)
Proven and Probable Reserve 106,113 0.53% 0.05% 2.58 1,231 123Measured & Indicated Resource 82,935 0.49% 0.05% 2.40 895 86Total Reserve and Resource 189,048 0.51% 0.05% 2.50 2,126 208
Inca Pacific Resources Inc. Consensus Estimate Summary (Reuters data sourced via Capital IQ)Analysts
2007 Consensus Estimate 02008 Consensus Estimate 02009 Consensus Estimate 0
Analysts Buy Rating Hold Rating Sell Rating Mean Target High LowConsensus Valuation 1 1 - - - - -
Peer Group Comparables (Reuters data sourced via Capital IQ)P / NAV
Candente Resource Corp. n/aCorriente Resources Inc. n/aChariot Resources Ltd. n/aNorsemont Mining Inc. n/aNorthern Peru Copper Corp. n/aSherwood Copper Corp. 1.1xTerrane Metals Corp. n/aPeer Group Average 1.1x
US$0.00US$0.00US$0.00
US$0.00 US$0.00 US$0.00US$0.00
-
(C$)(M)n/an/an/an/an/an/a
High Low
C$324C$282C$57
NAV Consensus Est-
--
-
-$5.53
$1.95
$0.09
$0.66
$1.88$0.14$0.08$0.10
-0.1 -
$0.00
US$ / O/S Share C$ / O/S Share
0.9-8.6
0.2
Proceeds
www.incapacific.com
Expiry
Feb 2008 - May 2012US$0.0MUS$3.1M
36.440.1
-
$71.0
Oct 29/07
Anthonoy Floyd
n/a
$0.14
$0.11
$0.63$1.77
November 12, 2007
$1.84
$0.00
C$2.11
7.3
Inca Pacific Resources Inc. (CDNX:IPR)
Exploration Timetable
-
C$10.10
US$3.1M
April 5, 2007 - C$9.05 million brokered / non-brokered private placement (12.0M common shares @ C$0.75)
O/S (millions) F/D (millions)-
-
0.2
-
C$338C$111
Magistal is located 450 kilometres north-west of Lima, Peru and 183 kilometre from Chimbote, which includes port facilities for shipping concentrate to (overseas) smelters.
C$3.05
C$4.60
Price
Mean NAV
US$0.00US$0.00
100 438- 100% interest in the advanced stage Magistral copper-molybdenum-silver porphyry-skarn deposit in Peru.- Over 65,000 metres of drilling to date has delineated at 189 million tonne measured and indicated resource grading 0.51% copper and 0.05% molybdeum (2.1 billion pounds of copper and 208 million pounds of molybdenum contained) - the deposit remains open at depth.- An October 2006 prefeasibility study (SRK) includes a US$138 million after-tax project NAV(8%) and IRR of 17.1% (4.6 year pay back) at a US$1.50 per pound copper price and a US$10.00 per pound molybdenum price.- Annual production is expected to average 31,000 tonnes of copper, 2,500 tonnes of molybdenum, and 350,000 ounces of silver in concentrate over a 16-year open-pit mine-life (strip ratio = 1.8:1).- Initial capital costs are estimated at US$265 million and average life-of-mine copper cash costs are estimated at US$0.77 per pound net of credits.- Robust project economics are driven by a higher-grade starter pit, simple processing technology, and good copper and molybdenum metallurgical recoveries of 89% and 69% respectively.
C$0.48C$6.24
A preliminary feasibility study was completed by SRK in October 2006 and includes a US$138 million after-tax project NAV(8%) and IRR of 17.1% (4.6 year pay back) at a US$1.50 per pound copper price and a US$10.00 per pound molybdenum price. Annual production is expected to average 31,000 tonnes of copper, 2,500 tonnes of molybdenum, and 350,000 ounces of silver in concentrate over a 16-year open-pit mine-life (strip ratio = 1.8:1). Initial capital costs are estimated at US$265 million and average life-of-mine copper cash costs are estimated at US$0.77 per pound net of credits. A final feasibility study is currently underway and expected to be complete in Q4 2007.
C$1.07
Mrkt CapC$150C$369
$0.00
$0.50
$1.00
$1.50
$2.00
$2.50
11/13/2006
12/27/2006
2/8/2007
3/29/2007
5/14/2007
6/26/2007
8/10/2007
9/24/2007
11/6/2007
50 Day M.A.100 Day M.A.
Volume in Millions
0.00.30.50.81.0

Haywood’s Junior Mining Universe
Chris Thompson, P.Geo. (604-697-7433, [email protected]) Vol. 2, No. 4, November 14, 2007 — 75 Ben Asuncion (604-697-6149, [email protected])
TSXV:IME Price $0.22 Shares O/S (M) 59.94 MCap (C$) (M) $13.19
Comment:
11/12/2007Investment Highlights Indicator Minerals Inc. Chart
Website: www.indicatorminerals.comTel:President/CEO:
Capital Structure (C$) (M)Shares O/S 59.94Shares F/D 73.77(C$) (M) Av Strike Basic ITM ProceedsCash & Equiv $5.32Options $0.48 5.73 0.00 $0.00Warrants $0.94 8.10 0.00 $0.00Total Cash & ITM 13.83 0.00 $5.32 Peer Group Companies Price (C$) MC (C$) (M)Market Cap $13.19 TSX:SWY $0.72 $143.22
TSXV:DSP $0.33 $49.90Trading Statistics (C$) TSX:PGD $0.95 $48.59Last Sale Price $0.23 TSXV:SRM #NA $43.6352 Week High $0.66 TSXV:DDN $0.76 $40.0152 Week Low $0.19 TSXV:IME $0.22 $13.19Average Daily Vol (M) 0.06 Ownership (M) Management Institutional Shares 2.34 0.39 Estimated Burn Rate (C$) (M)% O/S 3.91% 0.65% September 2007 cash & equiv $5.32 Analyst Coverage # Analysts Darby* $0.00 Q407
0 Barrow / Grail -$1.00 Q407Haywood Exploration Index Statistics Exploration - Other $0.00 Q407Dated Added 22-Nov-06 Admin Costs -$0.40
Financings $4.20 Last Financing ITM Options / Warrants $0.00 6/28/2007 $4.2 million Year-end 2007 cash & equiv $8.52
Note* $8.5 million in exploration for 2007 - funded entirely by JV partner Teck Cominco
Key PropertiesDarby 39% Barrow 80%Location: Nunavut Location: Nunavut Exploration Stage: Exploration Exploration Stage: ExplorationDescription Description/Potential: /Potential:
Current:Current:
Grail 80%Location: Nunavut Exploration Stage: ExplorationDescription/Potential:Current:
Indicator Minerals Inc.
With kimberlites intersected by drilling and a well financed 2007 exploration season, Indicator Minerals is primed for 2007 news flow. $8.5 million budget for Darby property funded entirely by JV partner Teck Cominco. Exploration at Barrow planned.
Bruce Counts
Peregrine Diamonds Ltd.
Diamonds North Resources Ltd.
Stornoway Diamond Corp.Diamondex Resources Ltd.
604-331-4605
Indicator Minerals Inc.
Brokered Private Placement
Diamonds North Resources' Amaruk property surrounds Barrow. Previous work includes airborne and ground geophysics, collection of heavy mineral samples and prospecting. Macro and micro diamonds recovered from float. 176 diamonds in 25.5 kg of kimberlite float. Ground geophysics has yielded 11 high-interest targets. Phase II drilling of 12 targets to commence in Q407 - Q108. Initial phase of drill program completed (Q407) - 5 holes drilled & no kimberlite intersected.
- Darby property entirely funded by Teck Cominco (2007 - $8.5 million) - 8 kimberlites discovered at Darby - 3 new discoveries - results pending - Recent geophysics and geochemistry surveys: 95 new kimberlite float occurrences and 23 geophysical targets identified - Aggressive $8.5 million exploration program including geophysics, sampling and drilling at Darby - Barrow: 176 diamonds in 25.5 kg of kimberlite floatCatalystsDarby: 4,000m drilling program completed in October 2007; results pending.Barrow: 12 targets from ground geophysics. Phase II drilling to commence in Q407 (7 targets for Q407 and 5 for Q108).Grail: Airborne and ground geophysics completed; analyzing results of potential targets for further exploration.
6 million flow through units @ $0.70 incl 0.5 warrant @ $1.25 per
113,630 acres in the Franklin Diamond District. Kimberlite float identified - recovery of diamonds from float.
Exploration Timetable
#NA
Airborne geophysics planned for April followed by ground geophysics in in May. Exploration program being developed.
197,561 acres in the Franklin Diamond District. 5 kimberlites - one diamondiferous. 95 kimberlite float occurrences and 23 geophysical targets identified. Diamond analysis pending.
1.2 million acres includes the Sanagak and Mayo projects 75 km northwest of Taloyoak
Teck Cominco earning in 51% of IME's 80% interest. 20% owned by Hunter Exploration Group. Operator - 2006 - Five targets drilled intersecting 5 kimberlites - largest being the Iceberg and Inferno kimberlites. Diamond analysis results confirm Iceberg and Stealth as diamondiferous - 24 diamond 3 macros (Iceberg). No diamonds were recovered from the Prince, Skyy and Inferno kimberlites. 95 new kimberlite float occurrences identified. Results from diamond analysis of kimberlite float pending. Prospecting, heavy mineral sampling, airborne and ground geophysics and 4,000 m of core drilling completed with 9 kimberlites discovered from 2007 program. Preliminary interpretation of airborne geophysical has identified multiple high priority targets to be drill tested in 2008.
$0.00
$0.10
$0.20
$0.30
$0.40
$0.50
$0.60
$0.70
$0.80
$0.90
$1.00
11/1
3/06
12/1
3/06
1/13
/07
2/13
/07
3/13
/07
4/13
/07
5/13
/07
6/13
/07
7/13
/07
8/13
/07
9/13
/07
10/1
3/07
-0.10.20.50.71.01.2
1
Vol
(M)
50 Day MA100 Day MA
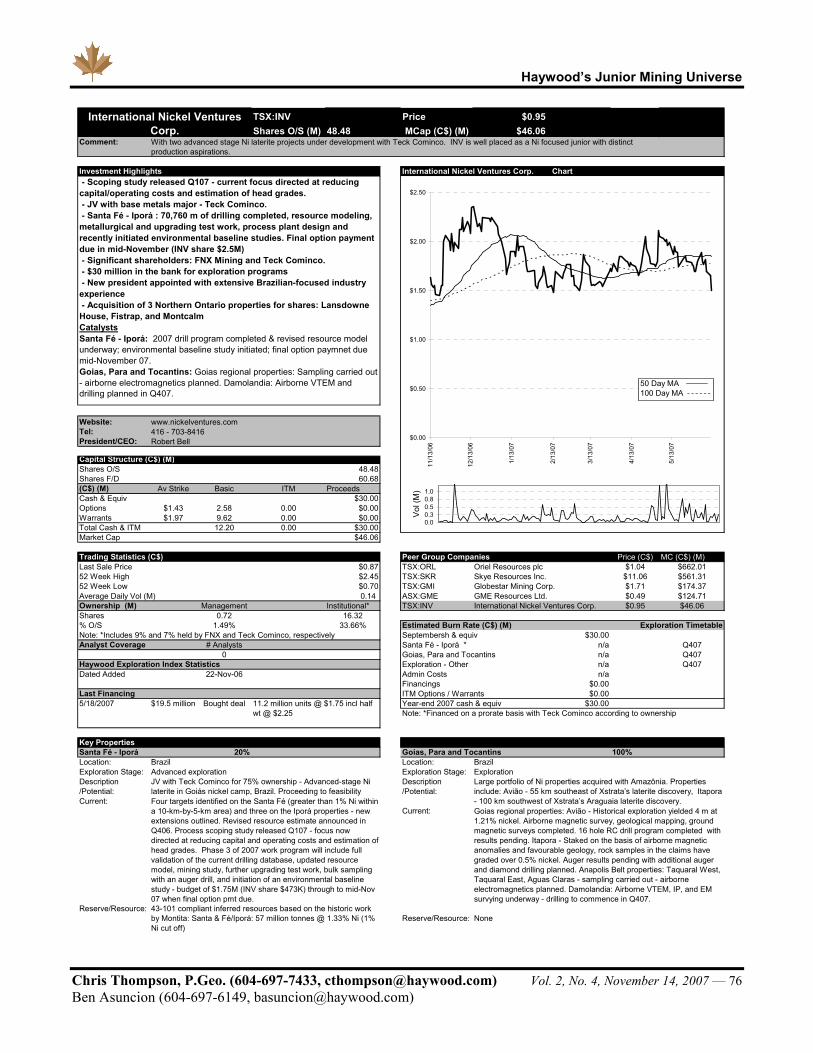
Haywood’s Junior Mining Universe
Chris Thompson, P.Geo. (604-697-7433, [email protected]) Vol. 2, No. 4, November 14, 2007 — 76 Ben Asuncion (604-697-6149, [email protected])
TSX:INV Price $0.95 Shares O/S (M) 48.48 MCap (C$) (M) $46.06
Comment:
11/12/2007Investment Highlights International Nickel Ventures Corp. Chart
Website: www.nickelventures.comTel:President/CEO:
Capital Structure (C$) (M)Shares O/S 48.48Shares F/D 60.68(C$) (M) Av Strike Basic ITM ProceedsCash & Equiv $30.00Options $1.43 2.58 0.00 $0.00Warrants $1.97 9.62 0.00 $0.00Total Cash & ITM 12.20 0.00 $30.00Market Cap $46.06
Trading Statistics (C$) Peer Group Companies Price (C$) MC (C$) (M)Last Sale Price $0.87 TSX:ORL $1.04 $662.0152 Week High $2.45 TSX:SKR $11.06 $561.3152 Week Low $0.70 TSX:GMI $1.71 $174.37Average Daily Vol (M) 0.14 ASX:GME $0.49 $124.71Ownership (M) Management Institutional* TSX:INV $0.95 $46.06Shares 0.72 16.32% O/S 1.49% 33.66% Estimated Burn Rate (C$) (M)Note: *Includes 9% and 7% held by FNX and Teck Cominco, respectively Septembersh & equiv $30.00 Analyst Coverage # Analysts Santa Fé - Iporá * n/a Q407
0 Goias, Para and Tocantins n/a Q407Haywood Exploration Index Statistics Exploration - Other n/a Q407Dated Added 22-Nov-06 Admin Costs n/a
Financings $0.00 Last Financing ITM Options / Warrants $0.00 5/18/2007 $19.5 million Bought deal Year-end 2007 cash & equiv $30.00
Note: *Financed on a prorate basis with Teck Cominco according to ownership
Key PropertiesSanta Fé - Iporá 20% Goias, Para and TocantinsLocation: Brazil Location: BrazilExploration Stage: Advanced exploration Exploration Stage: ExplorationDescription Description/Potential: /Potential:Current:
Current:
Reserve/Resource:Reserve/Resource: None
Skye Resources Inc.Globestar Mining Corp.GME Resources Ltd.International Nickel Ventures Corp.
Large portfolio of Ni properties acquired with Amazônia. Properties include: Avião - 55 km southeast of Xstrata’s laterite discovery, Itapora - 100 km southwest of Xstrata’s Araguaia laterite discovery.Goias regional properties: Avião - Historical exploration yielded 4 m at 1.21% nickel. Airborne magnetic survey, geological mapping, ground magnetic surveys completed. 16 hole RC drill program completed with results pending. Itapora - Staked on the basis of airborne magnetic anomalies and favourable geology, rock samples in the claims have graded over 0.5% nickel. Auger results pending with additional auger and diamond drilling planned. Anapolis Belt properties: Taquaral West, Taquaral East, Aguas Claras - sampling carried out - airborne electromagnetics planned. Damolandia: Airborne VTEM, IP, and EM survying underway - drilling to commence in Q407.
43-101 compliant inferred resources based on the historic work by Montita: Santa & Fé/Iporá: 57 million tonnes @ 1.33% Ni (1% Ni cut off)
11.2 million units @ $1.75 incl half wt @ $2.25
Exploration Timetable
Oriel Resources plc
100%
International Nickel Ventures Corp.
- Scoping study released Q107 - current focus directed at reducing capital/operating costs and estimation of head grades. - JV with base metals major - Teck Cominco. - Santa Fé - Iporá : 70,760 m of drilling completed, resource modeling, metallurgical and upgrading test work, process plant design and recently initiated environmental baseline studies. Final option payment due in mid-November (INV share $2.5M) - Significant shareholders: FNX Mining and Teck Cominco. - $30 million in the bank for exploration programs - New president appointed with extensive Brazilian-focused industry experience - Acquisition of 3 Northern Ontario properties for shares: Lansdowne House, Fistrap, and Montcalm CatalystsSanta Fé - Iporá: 2007 drill program completed & revised resource model underway; environmental baseline study initiated; final option paymnet due mid-November 07.Goias, Para and Tocantins: Goias regional properties: Sampling carried out - airborne electromagnetics planned. Damolandia: Airborne VTEM and drilling planned in Q407.
JV with Teck Cominco for 75% ownership - Advanced-stage Ni laterite in Goiás nickel camp, Brazil. Proceeding to feasibilityFour targets identified on the Santa Fé (greater than 1% Ni within a 10-km-by-5-km area) and three on the Iporá properties - new extensions outlined. Revised resource estimate announced in Q406. Process scoping study released Q107 - focus now directed at reducing capital and operating costs and estimation of head grades. Phase 3 of 2007 work program will include full validation of the current drilling database, updated resource model, mining study, further upgrading test work, bulk sampling with an auger drill, and initiation of an environmental baseline study - budget of $1.75M (INV share $473K) through to mid-Nov 07 when final option pmt due.
With two advanced stage Ni laterite projects under development with Teck Cominco. INV is well placed as a Ni focused junior with distinct production aspirations.
Robert Bell416 - 703-8416
$0.00
$0.50
$1.00
$1.50
$2.00
$2.50
11/1
3/06
12/1
3/06
1/13
/07
2/13
/07
3/13
/07
4/13
/07
5/13
/07
0.00.30.50.81.0
1
Vol
(M)
50 Day MA100 Day MA

Haywood’s Junior Mining Universe
Chris Thompson, P.Geo. (604-697-7433, [email protected]) Vol. 2, No. 4, November 14, 2007 — 77 Ben Asuncion (604-697-6149, [email protected])
Target Price, C$ $20.00 Shares O/S, millionsCurrent Price, C$ $16.52 Shares F/D, millions
Rating (Risk): SECTOR OUTPERFORM (SPECULATIVE) Return, % 21% Market Capitalization, US$M Target Price: C$20.00 52-Week High / Low, C$ $28.07 / $5.80 Company CEO Target Price Metric: 1.3x Corporate After-Tax NAV Daily Volume (3-month average) 711,582 Company Web Site
Investment Highlights Haywood Developer Index (base=100) Date Added:Performance at Oct Jan 01/05 100 Performance at Nov 12/07 438
Share Capital DilutionNumber Price
Warrants 13.8M C$2.84Options 2.6M C$7.95Warrants + Options 16.3M C$3.65
C$/US$ FX Rate: 1.04
Recent FinancingsCatalysts / News Flow
- Early December 2007 - mailing of shareholder circular for proposed merger with NKR-L- End of November (estimated) - completion of DRC license review- December 2007 - 1st copper cathode production- January 2008 - Katanga/Nikanor shareholder meetings to approve proposed merger- Q1/08 - KAT offer for NKR expected to close assuming positive approval from shareholders
Major ShareholdersBalance Sheet and Capitalization O/S (%) F/D (%)
US$M C$M Free Float 31% 53%Market Capitalization $1,253.1 $1,303.2 George Forrest 24% 16%Current Cash (est.) $155.3 $161.6 RP Explorer Master Fund 16% 11%F/D Cash Adds $57.4 $59.7 Central African Mining & Exploration Company plc 13% 9%Working Capital (est.) $149.0 $155.0 Arthur Ditto 9% 6%Long-term Debt ($258.0) ($268.3) Goodman & Company, Investment Counsel 8% 5%Book Value $130.3 $135.5 100% 100%Enterprise Value (EV) $1,362.0 $1,416.5
EV = Market Capitalization - Working Capital + Long-term Debt Corporate NAV Summary and SensitivityC$/US$ FX Rate: 1.04 Forecast Copper Price, US$/lb $1.20 $1.60 $2.00 $2.40
Forecast Cobalt Price, US$/lb $7.00 $7.00 $7.00 $7.00Financial Forecast Corporate Adjustments, US$M ($123.6) ($123.6) ($123.6) ($123.6)
2006 2007 2008 2009 2010 2011 After-Tax Project NAV(12%), US$M $922.6 $1,415.4 $1,902.0 $2,385.3Forecast Copper Price, US$/lb $3.06 $3.25 $3.25 $2.75 $2.50 $2.25 Additional Exploration Credit, US$M $151.1 $151.1 $151.1 $151.1Forecast Cobalt Price, US$/lb $16.34 $25.00 $20.00 $12.00 $10.00 $7.00 Corporate NAV, US$M $950.0 $1,442.9 $1,929.4 $2,412.7C$/US$ FX Rate 1.13 1.08 1.04 1.09 1.14 1.16 Corporate Adjustments, C$ / F/D share ($1.35) ($1.35) ($1.35) ($1.35)Shares O/S, millions 56.7 78.2 78.9 78.9 78.9 78.9 After-Tax Project NAV(12%), C$ / F/D share $10.05 $15.45 $20.75 $26.05Revenue, US$M $0.0 $61.3 $324.3 $450.3 $597.0 $617.7 Additional Exploration Credit, C$ / F/D share $1.65 $1.65 $1.65 $1.65Mine Site Expense, US$M $0.0 ($38.1) ($113.1) ($157.6) ($184.8) ($205.5) Corporate NAV, C$ / F/D share $10.35 $15.75 $21.05 $26.35Corporate G&A, US$M ($1.5) ($12.0) ($12.0) ($12.0) ($12.0) ($12.0) Current Price / Corporate NAV 1.6x 1.0x 0.8x 0.6xEBITDA, US$M ($4.7) $11.2 $199.2 $280.7 $400.1 $400.2 Target Price / Corporate NAV 1.9x 1.3x 1.0x 0.8xEV / EBITDA - 121.6x 6.8x 4.9x 3.4x 3.4x Base case is based on a US$3.25/lb copper price in 2007/2008, US$2.75/lb in 2009, US$2.50/lb in 2010, US$2.25/lb in 2011 and US$1.75/lb thereafter.DD&A, US$M $0.0 $0.6 $5.1 $12.1 $19.2 $24.9 Base case is based on a US$25.00/lb cobalt price in '07, US$20.00/lb in '08, US$12.00/lb in '09, US$10.00/lb in '10 and US$7.00/lb thereafter.Earnings, US$M ($3.0) $2.3 $110.4 $173.6 $260.1 $258.8 Additional exploration credit includes US$0.02/lb credit for Measured & Indicated copper resources and US$0.01/lb for Inferred copper resourcesEPS, US$ ($0.05) $0.03 $1.40 $2.20 $3.30 $3.28 Shares F/D, millions: 95.2Current Price / EPS - 509.9x 11.3x 6.9x 4.4x 4.3x C$/US$ FX Rate: 1.04Target Price / EPS - 617.3x 13.7x 8.3x 5.3x 5.3xCash Flow Before W/C Changes, US$M ($1.3) $3.1 $157.8 $197.2 $273.6 $271.8 Kamoto Metal Inventory - Model Mineable, Reserve, and Resource (75% owned)CFPS, US$ ($0.02) $0.04 $2.00 $2.50 $3.47 $3.45 Tonnes Cu Grade Co Grade Copper Cobalt EV/lb CuCurrent Price / CFPS - 382.4x 7.9x 6.1x 4.2x 4.1x (000's) (%) (%) (Mlb) (Mlb) (US$/lb)Target Price / CFPS - 463.0x 9.6x 7.3x 5.1x 5.0x Model Mineable (100%) 92,714 3.41% 0.38% 6,967 769 $0.196Copper Price CFPS Sensitivity, US$ $0.00 $0.02 $0.09 $0.15 $0.08 $0.10 Model Payable (100%) - - - 5,475 275 $0.249CAPEX, US$M ($30.7) ($141.3) ($96.5) ($104.6) ($35.0) ($15.1) Proven and Probable Reserve (100%) 92,999 3.53% 0.37% 7,237 759 $0.188Proceeds from Equity Financing, US$M $131.2 $0.0 $0.0 $0.0 $0.0 $0.0 Additional Measured & Indicated Resource (100%) 68,902 3.47% 0.39% 5,271 592 $0.258Proceeds from Debt Financing, US$M $101.8 $150.0 $0.0 $0.0 $0.0 $0.0 Inferred Resource (100%) 29,319 4.16% 0.25% 2,689 162 $0.507Debt Repayment, US$M $0.0 $0.0 ($150.0) $0.0 $0.0 $0.0 Total Reserve and Resource (100%) 191,220 3.60% 0.36% 15,197 1,513 $0.090Free Cash Flow, US$M $206.6 $11.8 ($88.7) $92.6 $238.6 $256.7 Attributable Reserve 69,749 3.53% 0.37% 4,838 475 $0.282FCPS, US$ $3.65 $0.15 ($1.12) $1.17 $3.02 $3.25 Attributable Reserve and Resource 143,415 3.60% 0.36% 10,808 1,040 $0.126
Copper price CFPS sensitivity is based on a US$0.10/lb change in forecast copper price.
Kamoto Production Profile (75% owned)2006 2007 2008 2009 2010 RLOM
Tonnes Milled, millions - 0.3 1.2 2.2 3.6 92.7Copper Grade, % - 3.8% 5.0% 4.5% 3.9% 3.4%Cobalt Grade, % - 0.32% 0.49% 0.51% 0.54% 0.38%Copper Recovery, % - 78% 78% 77% 77% 74%Cobalt Recovery, % - 41% 41% 38% 36% 31%
- 3 13 29 59 2,238- 16 88 145 192 3,237 Katanga Mining Ltd. Consensus Estimates (Reuters Data Sourced from Capital IQ
Total Copper Cathode Production (100%), Mlb - 19 101 173 251 5,475 Analysts Mean EPS High / Low Haywood vs. Cons. Mean CFPS High / Low Haywood vs. Cons.
Attributable Copper Cathode Production, Mlb - 14 76 130 188 4,106 2007 Consensus Estimate 0 US$1.68 US$1.62 / US$1.27 (98%) US$1.68 US$2.13 / US$0.82 (98%)Total Cobalt Cathode Production (100%), Mlb - 0.8 5.2 10.3 16.9 274.7 2008 Consensus Estimate 0 US$1.68 US$1.62 / US$1.27 (17%) US$1.68 US$2.13 / US$0.82 19%Attributable Cobalt Cathode Production, Mlb - 0.6 3.9 7.7 12.7 206.0 2009 Consensus Estimate 0 US$1.68 US$1.62 / US$1.27 31% US$1.68 US$2.13 / US$0.82 48%Operating Cost, US$/tonne milled - $138 $96 $70 $48 $40 Analysts SO Rating SP Rating SU Rating Mean Target High / Low Haywood vs. Cons.
Copper Cash Cost (before credits), US$/lb - $2.10 $1.10 $0.90 $0.70 $0.65 Consensus Valuation 5 6 0 0 US$21.50 US$23.00 / US$20.15 (7%)Copper Cash Cost (net of credits), US$/lb - $1.00 $0.05 $0.15 - $0.25Total Copper Cash Cost (net of credits), US$/lb - $1.60 $0.45 $0.50 $0.30 $0.50 Peer Group Comparables (Haywood Securities estimates)
Price Corp. NAV Price / NAV 2007 CFPS Price/CFPS 2008 CFPS Price/CFPSKatanga Mining Ltd. (KAT-T) C$16.70 US$15.00 1.1x US$0.04 401.4x US$2.00 8.0xFirst Quantum Minerals Ltd.(FM-T) C$88.66 US$50.87 1.7x US$9.80 8.7x US$13.85 6.2xAnvil Mining Ltd. (AVM-T) C$14.15 US$17.07 0.8x US$2.20 6.2x US$2.85 4.8xPeer Group Average - - 1.5x - 9.9x - 6.8x
C$/US$ FX Rate: 1.04
Kerry Smith, P.Eng. - Research Analyst Josh Clelland - Research [email protected] 416-507-2306 [email protected] 416-507-2437
Sulphide Stream Copper Cathode Production (100%), Mlb
October 29, 2007- Katanga is working to re-start production at its 75% owned Kamoto copper-cobalt mine in DRC.- Kamoto is expected to produce 150,000 tonnes of copper cathode and 8,000 tonnes of cobalt cathode annually by2011.- Production at Kamoto ceased in the 1990's due to lack of funding and a major collapse in the underground, causing a significant loss of resources.- Concentrate production started in August 2007, and first cathode production remains on schedule for December 2007.- On November 6th, Katanga and NIkanor plc (NKR-L) anncouned a friendly cash and stock merger.- A merger between Katanga and Nikanor is the most logical option for Katanga as it consolidates the Kamoto/KOV mining concessions, offers significant synergies, and will create a world-class copper-cobalt asset that will be more attractive to a major mining company looking for an entry into DRC. KOV b i 9 illi t f d 958 000 t f b lt t th f hi h
$15.601.1x1.3x
Oxide Stream Copper Cathode Production (100%), Mlb
$1,428.5($1.35)$15.30$1.65
Base Case
($123.6)$1,401.1$151.1
6.2 6.272.7 109.0
10.2 10.26.9 6.9
18.8 18.812.3 12.3
$1.65 $1.72$17.27 $17.96
$1.89 $1.96($3.27) ($3.40)
$0.73 $0.76
US$57.4M
$1.97 $2.05
November 11, 2006 - C$115 debt offering; 115,000 units @ C$1,000 (1 unit = 1 subordinated 14% note + 40 warrants @ $8.50)May 2, 2006 - C$152.3M private placement; 21.0M subscription receipts @ C$7.25 (1 receipt = 1 common share)October 19, 2005 - C$17.5M private placement; 14.0M subscription receipts @ C$1.25 (1 receipt = 1 common share)October 6, 2004 - C$898,000 private placement; 4.5M units @ C$0.25 (1 unit = 1 common share + 1 half warrant @ C$0.35)
O/S (millions) F/D (millions)24.5 60.9
$15.88 $16.52US$ / O/S Share C$ / O/S Share
Proceeds Expiry
US$19.8M Jan 2011 - June 2012
November 5, 2007 - US$150 million convertible debt facility; convertible into 9,157,509 shares at US$16.38
Katanga Mining Ltd. (KAT-T) 78.995.2
US$37.6M November 20, 2011
$1,253.1Arthur Ditto
www.katangamining.com
0
100
200
300
400
2006 2007 2008 2009 2010 2011 2012 2013 2014 2015
Copp
er P
rodu
ction
(Mlb)
$0.00
$0.75
$1.50
$2.25
$3.00To
tal C
oppe
r Cas
h Co
st (n
et of
credit
s, US
$/lb)Attributable Production Total Production Cash Cost
Katanga Mining Ltd. (KAT-T)
$0.00$5.00
$10.00$15.00$20.00$25.00$30.00
Nov-06 Jan-07 Mar-07 May-07 Jul-07 Sep-07 Nov-07
Share Price 50 Day M.A. 200 Day M.A.
Volume in Millions
0.00.51.01.5

Haywood’s Junior Mining Universe
Chris Thompson, P.Geo. (604-697-7433, [email protected]) Vol. 2, No. 4, November 14, 2007 — 78 Ben Asuncion (604-697-6149, [email protected])
Khan Resources (KRI:TSX) KRI:TSX 2.43$ Recommendation UNDER REVIEW Target n/a Shares O/S, M 53.2Risk Profile High 12-Month Return n/a Float, M 35.8
Market Capitalization, C$M 129.3
In C$ unless otherwise stated
Investment Highlights Capital Structure - Key asset is the partially developed Dornod uranium deposit in Mongolia - Production of 2.5 million lbs U308 stated to commence in 2010 Shares Outstanding 53.2 - Attractive valuation relative to peers Options $0.57 to $2.35 Aug - 08 - Oct - 11 4.8 - Large NI 43-101 compliant resource of 37.8 million lbs U308 Warrants $1.90 Aug-08 2.4 - Near valuation upside should clarity materialize regarding Mongolian state ownership and royalties Fully Diluted Shares 58.4 - Positive uranium supply and demand price fundamentals Additional Equity 0.0Catalysts / News Flow 58.4 - Resolution of uncertainties surrounding Mongolian state ownership and royalties Haywood Developer Index (base=100) Date Added: 29/10/2007 - Completion of Feasibility studies Performance at 01/01/05 100 HJDI Performance at 12/11/07 438 - Continued robust uranium fundamentals and price stability at or above current price levelsAssumptions 2006 2007 2008 2009 2010 2011 OwnershipPrevious Uranium US$/lb $50.00 $100.00 $125.00 $125.00 $115.00 $95.00 ManagementUranium US$/lb for KRI $0.00 $0.00 $100.00 $100.00 $100.00 $125.00 InstitutionalNet Asset Value Financial SummaryPer Shares F/D Interest $M $/share $M $/share $M $/share Year-end Sep. 30 2006A 2007E 2008E 2009E 2010E 2011EProject NAV Ave. Shares Outstanding, M 53.2 53.2 55.6 57.0 58.9 59.9
Dornod 58.6% $103.5 $1.77 $103.5 $1.77 $56.9 $0.98 EPS 0.00 0.00 0.00 0.00 0.58 1.79 P/E - - - - 4.2x 1.4x
Cash and Equivalents $36.8 $0.63 $36.8 $0.63 $36.8 $0.63 Target Price/EPS - - - - - - ITM Cash $11.4 $0.19 $11.4 $0.19 $11.4 $0.19 CFFOPS 0.00 0.00 0.00 0.00 1.03 2.72Debt $0.0 $0.00 $0.0 $0.00 $0.0 $0.00 P/CFFOPS - - - - 2.3x 0.9xCorporate NAV $48.2 $0.82 $48.2 $0.82 $48.2 $0.82 Target Price/CFFOPS - - - - - -
FreeCFPS 0.00 0.00 0.00 -3.55 0.68 1.98Exploration Credit $12.3 $0.21 $12.3 $0.21 $12.3 $0.21 Income Statement
Multiple $0.0 $0.00 $0.0 $0.00 $0.0 $0.00 Revenue, $M 0.0 0.0 0.0 0.0 77.2 196.5NAV Project 1.2 $103.5 $2.17 $103.5 $2.17 $56.9 $1.19 Operating Expenses, $M 0.0 0.0 0.0 0.0 -16.4 -33.3
Depreciation, $M 0.0 0.0 0.0 0.0 -6.5 -13.2Corp. NAV & Exploration Upside $164.0 $3.21 $164.0 $3.21 $117.4 $2.23 General & Admin, $M 0.0 0.0 0.0 0.0 -1.5 -3.0Production Estimates 2006 2007 2008 2009 2010 2011 Interest, $M 0.0 0.0 0.0 0.0 -8.4 -7.0Uranium (000) lb 0 0 0 0 1,230 2,459 Tax, $M 0.0 0.0 0.0 0.0 -11.1 -35.5Total Cash Cost, US$/lb (U3O8) $20.15 $20.15 Net Income, $M 0.0 0.0 0.0 0.0 34.1 107.2Total Production Cost, US$/lb (U3O8) - - - - $39.42 $32.49 Balance SheetResources Cutoff Grade Category Tonnes (000) U3O8 (%) U3O8 (000 lb) Cash & Equivalents, $M 8.5 38.7 43.2 40.5 50.5 126.8No. 7 0.047 % U3O8 Indicated 12,960 0.16% 45,500 Working Capital, $M 8.4 38.5 43.0 40.4 50.4 126.7No. 2 0.047 % U3O8 Indicated 3,520 0.13% 9,900 Long-term Debt, $M 0.0 0.0 0.0 -198.3 -172.1 -136.2Total Indicated 16,480 0.15% 55,400 Shareholder Equity, $M 22.4 52.6 57.1 58.4 97.2 199.9Total to KRI 38,500 Book Value, $M 22.4 51.9 55.8 57.8 106.6 213.2Modelled Resources Tonnes (000) U3O8 (%) U3O8 (000) lb Cash FlowDornod 2 Deposit 3,300 0.12% 8,803 Op. CF $M 0.0 0.0 0.0 0.0 60.9 163.2Dornod 7 Deposit 13,200 0.15% 43,943 Financing CF, $M 0.0 30.2 0.0 198.3 0.0 0.0Total Modelled 16,500 52,746 Investing CF, $M 0.0 0.0 0.0 -202.2 0.0 -0.7Assumptions Free CF, $M 0.0 0.0 0.0 -202.2 40.1 118.9Capital Cost (US$M) $313,714 Peer Group Companies S Price M CapSustaining Capital (US$M) $15,700 TSX:UUU Uranium One Inc. 10.35$ 4,823$ Debt 100% Dornod 2: Dornod 7: TSX:LAM Laramide Resources Ltd. 9.19$ 424$ Equity Financing - 0.13% 0.16% TSX:KRI Khan Resources Inc. 2.43$ 129$ Tax 25% 93% 84% CDNX:WNP Western Prospector Group Ltd. 2.04$ 91$ Royalty 5% 95% 95%Chart Production Profile (Year-end Sep. 30)
Sensitivities
Dilution (%)
15.0%
Head GradeRecovery (%)Dilution (%)
15.0% 20.0%
Head GradeRecovery (%)
Ave. Strike Price Maturity Date SharesC$/share Millions
Shares O/S, M % O/S % F/D1.5%
31.3%0.816.7
1.4%28.5%
0500
1,0001,5002,0002,5003,0003,5004,0004,5005,000
2006 2007 2008 2009 2010 2011
U3O
8, lb
000
0.002.004.006.008.0010.0012.0014.0016.0018.0020.00
Tota
l Cas
h C
ost,
US$
/lb U
3O8
$0.00
$1.00
$2.00
$3.00
$4.00
$5.00
$6.00
11-O
ct-0
6
10-N
ov-0
6
10-D
ec-0
6
9-Ja
n-07
8-Fe
b-07
10-M
ar-0
7
9-A
pr-0
7
9-M
ay-0
7
8-Ju
n-07
8-Ju
l-07
7-A
ug-0
7
6-S
ep-0
7
6-O
ct-0
7
0.00.51.01.52.0
1
Vol
(M)
Uranium Price Sensitivity
$1.60
$2.60
$3.60
$4.60
$5.60
-30%-20%-10% 0% 10% 20% 30%
Variation from Base Case (US$/lb U3O8)
Intri
nsic
Val
ue (C
$ /
shar
e)
Discount Rate Sensitivity
$2.10
$3.10
$4.10
$5.10
$6.10
$7.10
22.5
%
20.0
%
17.5
%
15.0
%
12.5
%
10.0
%
7.5%
NAV Discount Rate
Intri
nsic
Val
ue (C
$ /
shar
e)
Base Case
0% 15%

Haywood’s Junior Mining Universe
Chris Thompson, P.Geo. (604-697-7433, [email protected]) Vol. 2, No. 4, November 14, 2007 — 79 Ben Asuncion (604-697-6149, [email protected])
Laramide Resources (LAM:TSX) LAM:TSX 7.84$ Recommendation UNDER REVIEW Target n/a Shares O/S, M 55.1Risk Profile High 12-Month Return n/a Float, M 32.6
Market Capitalization, C$M 432.1
In C$ unless otherwise stated
Investment Highlights Capital Structure - Key asset is the Westmoreland uranium deposit in Australia and a prospective US property package - Production of 3 million lbs U308 stated to commence in 2011 Shares Outstanding 55.1 - Attractive valuation relative to peers Options $0.10 to $6.90 Apr 07 - Oct 08 3.0 - Large NI 43-101 compliant resource inventory of 48.5 million lbs U308 Warrants $2.50 - $9.50 Sept 07 - June 08 4.3 - Near valuation upside should clarity materialize regarding acceptance of uranium mining in Queensland Fully Diluted Shares 62.4 - Positive uranium supply and demand price fundamentals Additional Equity 0.0 - Prospective portfolio of gold assets slated to be spun off into a seporate public vehicle 62.4Catalysts / News Flow Haywood Developer Index (base=100) Date Added: 29/10/2007 - Resolution of uncertainties surrounding uranium mining in Queensland, Australia Performance at 01/01/05 100 HJDI Performance at 12/11/07 438 - Exploration results from in-fill drilling and exploration drilling at Westmorelands Ownership - Completion of Feasibility studies Management 6.8% 6.0% - Spin out of non-uranium assets Institutional 34.1% 30.1% - Continued robust uranium fundamentals and price stability at or above current price levelsAssumptions 2007 2008 2009 2010 2011 2012 Financial SummaryUranium US$/lb $100.00 $125.00 $125.00 $115.00 $95.00 $75.00 Year-end Sep. 30 2006E 2007E 2008E 2009E 2010E 2011EUranium US$/lb for LAM $0.00 $100.00 $100.00 $100.00 $100.00 $100.00 Ave. Shares Outstanding, M 55.1 57.3 61.1 62.4 62.4 62.4
EPS 0.00 0.00 0.00 0.00 0.00 1.66Net Asset Value P/E - - - - - 4.7xPer Shares F/D Interest $M $/share $M $/share $M $/share Target Price/EPS - - - - - - Project NAV
Westmoreland 100.0% $560.6 $8.98 $320.4 $5.13 $243.3 $3.90 CFFOPS 0.00 0.00 0.00 0.00 0.00 2.99 P/CFFOPS - - - - - 2.6x
Cash and Equivalents $3.5 $0.06 $3.5 $0.06 $3.5 $0.06 Target Price/CFFOPS - - - - - - Investments $26.1 $0.42 $26.1 $0.42 $26.1 $0.42 FreeCFPS 0.00 0.00 0.00 0.00 -5.71 1.99ITM Cash $21.3 $0.34 $21.3 $0.34 $21.3 $0.34 Income StatementDebt $0.0 $0.00 $0.0 $0.00 $0.0 $0.00 Revenue, $M 0.0 0.0 0.0 0.0 0.0 268.5Corporate NAV $50.9 $0.81 $50.9 $0.81 $50.9 $0.81 Operating Expenses, $M 0.0 0.0 0.0 0.0 0.0 -82.0
Ontario Gold Property Credit 29.7 $0.48 29.7 $0.48 29.7 $0.48 Depreciation, $M 0.0 0.0 0.0 0.0 0.0 -20.7US Property Credit $124.4 $1.99 $124.4 $1.99 $124.4 $1.99 General & Admin, $M 0.0 0.0 0.0 0.0 0.0 -10.0Exploration Credit $112.4 $1.80 $112.4 $1.80 $112.4 $1.80 Interest, $M 0.0 0.0 0.0 0.0 0.0 29.0
Multiple Tax, $M 0.0 0.0 0.0 0.0 0.0 -33.3NAV Project 1.9 $560.58 $17.03 $320.45 $9.74 $243.33 $7.39 Net Income, $M 0.0 0.0 0.0 0.0 0.0 103.5
Balance SheetCorp. NAV & Exploration Upside $877.91 $22.12 $637.78 $14.82 $560.67 $12.48 Cash & Equivalents, $M 8.7 14.5 44.1 56.9 56.9 69.6
Working Capital, $M 9.6 15.3 44.9 57.7 57.7 70.4 Long-term Debt, $M 0.0 0.0 0.0 0.0 -356.3 -300.7Production Estimates 2007 2008 2009 2010 2011 2012 Shareholder Equity, $M 38.8 62.9 92.5 105.3 105.3 159.1Uranium (000) lb 0 0 0 0 2,436 2,935 Book Value, $M 38.8 61.8 90.5 104.4 105.6 166.1Total Cash Cost, US$/lb (U3O8) - - - - $29.01 $29.01 Cash FlowTotal Production Cost, US$/lb (U3O8) - - - - $46.59 $43.40 Op. CF $M 0.0 0.0 0.0 0.0 0.0 186.5LOM (000) lb 45,800 Financing CF, $M 0.0 17.3 0.0 0.0 356.3 0.0Resources Investing CF, $M 0.0 0.0 0.0 0.0 -356.3 0.0
Tonnes (000) U3O8 (%) U3O8 (000 lb) Tonnes (000) U3O8 (%) U3O8 (000 lb) Free CF, $M 0.0 0.0 0.0 0.0 -356.3 124.2Redtree 3,672 0.10% 7,772 10,929 0.09% 22,407 Peer Group Companies S Price M CapHuarabagoo - - - 2,925 0.11% 6,965 ASX:DYL Deep Yellow Ltd. 0.45$ 444$ Junnagunna 4,365 0.08% 7,794 2,150 0.08% 3,554 TSX:LAM Laramide Resources Ltd. 7.84$ 432$ Total 8,037 0.09% 15,566 16,003 0.09% 32,926 CDNX:WNP Western Prospector Group Ltd. 2.04$ 91$ Modelled Resources Tonnes (000) U3O8 (%) U3O8 (000 lb) Redtree 15,694 0.09% 30,179 Valuation Components Huarabagoo 3,218 0.10% 6,965 Junnagunna 6,729 0.08% 11,348 Asset Value $/share Total 25,641 0.09% 48,492 ($M) Assumptions Westmoreland 320.4$ 5.13$ Capital Cost (US$ 000) $312,500 Mill Capacity (tonnes/year) (000) 1,501 US Property Credit 124.4$ 1.99$ Sustaining Capital (US$ 000) $42,715 Mine Life 18.5 Exploration Credit 112.4$ 1.80$ Debt Financing 100% Redtree Huarabagoo Junnagunna ITM 21.3$ 0.34$ Equity Financing - 0.10% 0.11% 0.09% Cash and Equivalents 3.5$ 0.06$ Tax 25% 94% 94% 94% Investments 26.1$ 0.42$ Royalty 5% 97% 97% 97% Total 608.1$ 9.74$
Chart Production Profile (Year-end Dec 31)
Sensitivities
18.8
Shares O/S, M % O/S % F/D3.8
Ave. Strike Price Maturity Date SharesC$/share Millions
5.0% 10.0% 12.5%
Dilution (%)
Indicated Inferred
Head GradeRecovery (%)
0
500
1,000
1,500
2,000
2,500
3,000
2007 2008 2009 2010 2011 2012
U3O
8, lb
000
0.00
5.00
10.00
15.00
20.00
25.00
30.00
Tota
l Cas
h C
ost,
US$
/lb U
3O8
$0.00
$2.00
$4.00
$6.00
$8.00
$10.00
$12.00
$14.00
$16.00
26-O
ct-0
6
26-N
ov-0
6
26-D
ec-0
6
26-J
an-0
7
26-F
eb-0
7
26-M
ar-0
7
26-A
pr-0
7
26-M
ay-0
7
26-J
un-0
7
26-J
ul-0
7
26-A
ug-0
7
26-S
ep-0
7
0.0
0.3
0.5
0.8
1.0
1
Vol (
M)
Uranium Price Sensitivity
$18.00
$18.50$19.00
$19.50$20.00
$20.50
-30%
-20%
-10% 0% 10%
20%
30%
Variation from Base Case (US$/lb U3O8)
Intri
nsic
Val
ue (C
$ /
shar
e)
0%
Discount Rate Sensitivity
$10.00
$15.00
$20.00
$25.00
$30.00
20.0
%
17.5
%
15.0
%
12.5
%
10.0
%
7.5%
5.0%
NAV Discount Rate
Intri
nsic
Val
ue (C
$ /
shar
e)
10%
$0
$100
$200
$300
$400
Wes
tmor
elan
d
US
Prop
erty
Cre
dit
Exp
lora
tion
Cre
dit
Ont
ario
Gol
dC
redi
t ITM
Inve
stm
ents
Cas
h an
dE
quiv
alen
ts
Base Case
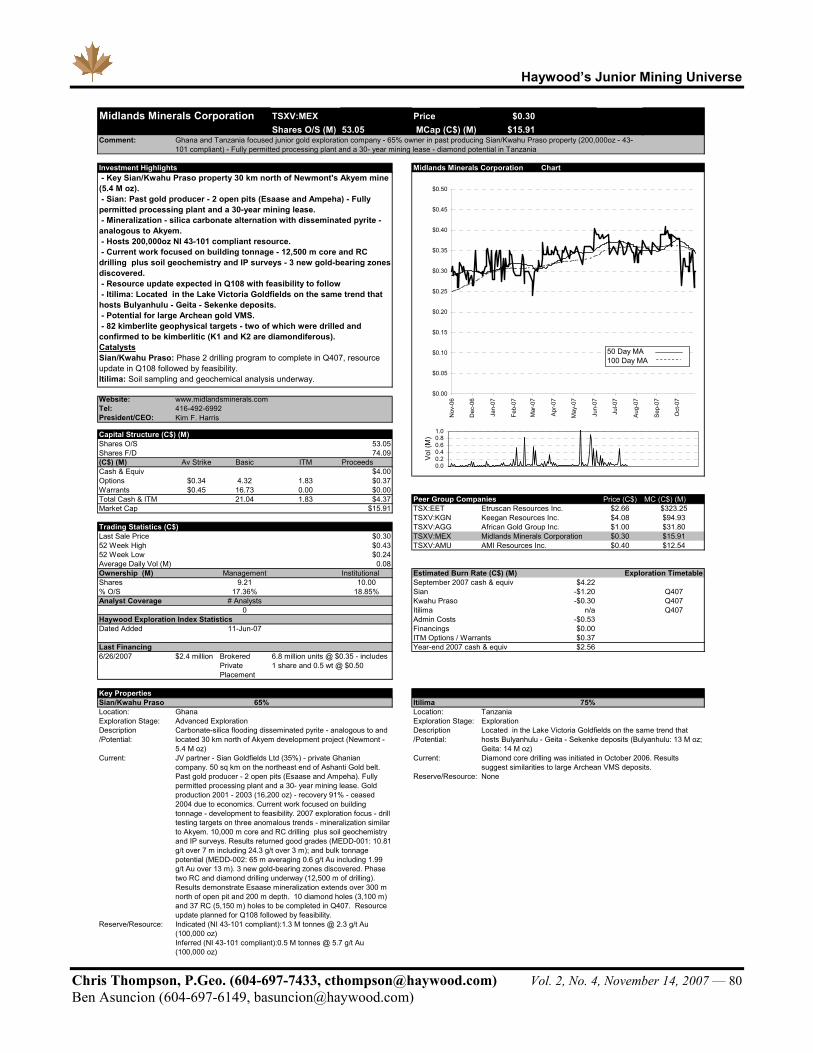
Haywood’s Junior Mining Universe
Chris Thompson, P.Geo. (604-697-7433, [email protected]) Vol. 2, No. 4, November 14, 2007 — 80 Ben Asuncion (604-697-6149, [email protected])
TSXV:MEX Price $0.30 Shares O/S (M) 53.05 MCap (C$) (M) $15.91
Comment:
11/12/2007Investment Highlights Midlands Minerals Corporation Chart
Website: www.midlandsminerals.comTel:President/CEO:
Capital Structure (C$) (M)Shares O/S 53.05Shares F/D 74.09(C$) (M) Av Strike Basic ITM ProceedsCash & Equiv $4.00Options $0.34 4.32 1.83 $0.37Warrants $0.45 16.73 0.00 $0.00Total Cash & ITM 21.04 1.83 $4.37 Peer Group Companies Price (C$) MC (C$) (M)Market Cap $15.91 TSX:EET $2.66 $323.25
TSXV:KGN $4.08 $94.93Trading Statistics (C$) TSXV:AGG $1.00 $31.80Last Sale Price $0.30 TSXV:MEX $0.30 $15.9152 Week High $0.43 TSXV:AMU $0.40 $12.5452 Week Low $0.24Average Daily Vol (M) 0.08Ownership (M) Management Institutional Estimated Burn Rate (C$) (M)Shares 9.21 10.00 September 2007 cash & equiv $4.22 % O/S 17.36% 18.85% Sian -$1.20 Q407Analyst Coverage # Analysts Kwahu Praso -$0.30 Q407
0 Itilima n/a Q407Haywood Exploration Index Statistics Admin Costs -$0.53 Dated Added 11-Jun-07 Financings $0.00
ITM Options / Warrants $0.37 Last Financing Year-end 2007 cash & equiv $2.56 6/26/2007 $2.4 million
Key PropertiesSian/Kwahu Praso 65% Itilima 75%Location: Ghana Location: TanzaniaExploration Stage: Advanced Exploration Exploration Stage: ExplorationDescription Description/Potential: /Potential:
Current: Current:
Reserve/Resource: None
Reserve/Resource:
Keegan Resources Inc.African Gold Group Inc.Midlands Minerals CorporationAMI Resources Inc.
Midlands Minerals Corporation
Ghana and Tanzania focused junior gold exploration company - 65% owner in past producing Sian/Kwahu Praso property (200,000oz - 43-101 compliant) - Fully permitted processing plant and a 30- year mining lease - diamond potential in Tanzania
- Key Sian/Kwahu Praso property 30 km north of Newmont's Akyem mine (5.4 M oz). - Sian: Past gold producer - 2 open pits (Esaase and Ampeha) - Fully permitted processing plant and a 30-year mining lease. - Mineralization - silica carbonate alternation with disseminated pyrite - analogous to Akyem. - Hosts 200,000oz NI 43-101 compliant resource. - Current work focused on building tonnage - 12,500 m core and RC drilling plus soil geochemistry and IP surveys - 3 new gold-bearing zones discovered. - Resource update expected in Q108 with feasibility to follow - Itilima: Located in the Lake Victoria Goldfields on the same trend that hosts Bulyanhulu - Geita - Sekenke deposits. - Potential for large Archean gold VMS. - 82 kimberlite geophysical targets - two of which were drilled and confirmed to be kimberlitic (K1 and K2 are diamondiferous).CatalystsSian/Kwahu Praso: Phase 2 drilling program to complete in Q407, resource update in Q108 followed by feasibility.Itilima: Soil sampling and geochemical analysis underway.
Exploration Timetable
416-492-6992Kim F. Harris
Brokered Private Placement
6.8 million units @ $0.35 - includes 1 share and 0.5 wt @ $0.50
Etruscan Resources Inc.
Indicated (NI 43-101 compliant):1.3 M tonnes @ 2.3 g/t Au (100,000 oz)Inferred (NI 43-101 compliant):0.5 M tonnes @ 5.7 g/t Au (100,000 oz)
Located in the Lake Victoria Goldfields on the same trend that hosts Bulyanhulu - Geita - Sekenke deposits (Bulyanhulu: 13 M oz; Geita: 14 M oz)Diamond core drilling was initiated in October 2006. Results suggest similarities to large Archean VMS deposits.
JV partner - Sian Goldfields Ltd (35%) - private Ghanian company. 50 sq km on the northeast end of Ashanti Gold belt. Past gold producer - 2 open pits (Esaase and Ampeha). Fully permitted processing plant and a 30- year mining lease. Gold production 2001 - 2003 (16,200 oz) - recovery 91% - ceased 2004 due to economics. Current work focused on building tonnage - development to feasibility. 2007 exploration focus - drill testing targets on three anomalous trends - mineralization similar to Akyem. 10,000 m core and RC drilling plus soil geochemistry and IP surveys. Results returned good grades (MEDD-001: 10.81 g/t over 7 m including 24.3 g/t over 3 m); and bulk tonnage potential (MEDD-002: 65 m averaging 0.6 g/t Au including 1.99 g/t Au over 13 m). 3 new gold-bearing zones discovered. Phase two RC and diamond drilling underway (12,500 m of drilling). Results demonstrate Esaase mineralization extends over 300 m north of open pit and 200 m depth. 10 diamond holes (3,100 m) and 37 RC (5,150 m) holes to be completed in Q407. Resource update planned for Q108 followed by feasibility.
Carbonate-silica flooding disseminated pyrite - analogous to and located 30 km north of Akyem development project (Newmont - 5.4 M oz)
$0.00
$0.05
$0.10
$0.15
$0.20
$0.25
$0.30
$0.35
$0.40
$0.45
$0.50
Nov
-06
Dec
-06
Jan-
07
Feb-
07
Mar
-07
Apr
-07
May
-07
Jun-
07
Jul-0
7
Aug
-07
Sep
-07
Oct
-07
0.00.20.40.60.81.0
1
Vol
(M)
50 Day MA100 Day MA

Haywood’s Junior Mining Universe
Chris Thompson, P.Geo. (604-697-7433, [email protected]) Vol. 2, No. 4, November 14, 2007 — 81 Ben Asuncion (604-697-6149, [email protected])
TSXV:MIO Price $0.65 Shares O/S (M) 75.47 MCap (C$) (M) $49.06
Comment:
11/12/2007Investment Highlights Mindoro Resources Ltd. Chart
Website: www.mindoro.comTel:President/CEO:
Capital Structure (C$) (M)Shares O/S 75.47Shares F/D 102.96(C$) (M) Av Strike Basic ITM ProceedsCash & Equiv $4.16Options $0.67 6.10 2.58 $0.96Warrants $0.97 14.39 0.39 $0.23Total Cash & ITM 20.49 2.96 $5.36 Peer Group Companies Price (C$) MC (C$) (M)Market Cap $49.06 ASX:MML $1.27 $180.83
TSXV:MBR $2.00 $133.67Trading Statistics (C$) TSX:OYM $0.50 $116.18Last Sale Price $0.70 TSXV:MIO $0.65 $49.0652 Week High $1.31 TSXV:CNF $0.22 $18.2152 Week Low $0.58Average Daily Vol (M) 0.10Ownership (M) Management Institutional Shares 2.48 0.17 Estimated Burn Rate (C$) (M)% O/S 3.29% 0.22% September 2007 cash & equiv $4.16 Analyst Coverage # Analysts Agata -$4.00 Q407-Q108
0 Archangel - Kay Tanda -$0.50 Q407-Q108Haywood Exploration Index Statistics Calo / El Paso $0.00Dated Added 4-Sep-07 Exploration - Other -$0.50
Admin Costs -$0.42 Q407-Q108Last Financing Financings $3.95
1-Oct-07 $4.14 millio ITM Options / Warrants $1.19 Year-end 2007 cash & equiv $3.89
Key PropertiesAgata 75% Calo / El Paso 75%Location: Philippines Location: PhilippinesExploration Stage: Advanced Exploration Exploration Stage: ExplorationDescription Description/Potential: /Potential:Current: Current:
Reserve/Resource: None Reserve/Resource: NoneArchangel / Kay Tanda 75%Location: PhilippinesExploration Stage: Advanced ExplorationDescription/Potential:Current:
Reserve/Resource:
6 km Strike length, volcanic rocks with andesitic/dacitic intrusives
NI 43-101 non-compliant internal resource estimate:1 M tonnes Au grading 0.8 g/t & 3.6 M tonnes Ag grading 2.6 g/t & 3.6 M tonnes Ag grading 2.6 g/t
2006 drilling identified an initial target resources of 2 - 3.5 million tonnes grading 0.9% - 1.2% Ni. The drill program covered less than 20% of the mapped mineralization. A resource estimate and scoping study is scheduled for Q407 with production objective for H108. Production to include 3-5 years at 700 K increasing to 1 M tonnes / annum. Recent drill results are in line with requirements for direct shipping grade material for ferro-nickel feedstock. Agreement signed with JV partner to develop Southern Agata Nickel Laterite deposit for 45% of net profits to MIO.
Low grade oxidized epithermal gold project. Extensive drilling on Kay Tanda included over 21,000 m in 2006-2007. 150 holes drilled averaging 0.8 g/t Au and 2.6 g/t Ag - Bonanza mineralization intersected. NI 43-101 compliant resource estimate expected by Q407. Potential for near surface mineralization to be extracted via low-cost open pit / heap leach mining. 3 drill rigs currently operating. Scoping study and economic evaluation planned for Q407-Q108.
Chargeability anomalies defined over 1.5 km by 2.5 km - occur at the intersection of regional northwest to SE and northeast to SW structural features. High-sulphidation epithermal mineralization Cu-Au-Ag located in NW of Calo prospect. Encouraging trench samples - 2.62% Cu over 30 m and 2.17% Cu over 20 m. Preliminary target testing (7 holes - 3,500 m) - 4 drill hole results released have intersected porphyry-related alteration - second hole intersected 213 m of 0.18% Cu, 0.3 g/t Au, and 2.3 g/t Ag. Drill testing planned later in 2007 or 2008 once groundwork has been completed and priority drill targets defined.
Ni laterite deposit in a historically rich area of the Philippines 50-60 M tonnes grading 0.9%-1.2% Nickel - H207 production
Mindoro Resources Ltd.Cadan Resources Corporation
Private placement
Porphyry Cu-Au mineralization, 7 km from Freeports Taysan deposit first phase drilling planned
Exploration Timetable
6.9 million units @ $0.60 + 1 Warrant for one year @
$0.90/$1.10
Mindoro Resources Ltd.
A comprehensive 30,000 ha land package in the Philippines. Near-term Ni production potential from Ni laterites, an emerging bulk tonnage low grade Au resource and prospective land package for Cu / Au porphyries make MIO an exploration company to watch.
Tony Climie
Medusa Mining Ltd.
780-413-8187
Olympus Pacific Minerals Inc.MBMI Resources, Inc.
- Focused on Philippines with near term Ni production and gold, silver and copper exploration properties - a prospective 50,000 ha land package. - NI 43-101 compliant resource estimates expected for Agata Ni project and the Kay Tanda Au Ag project - H207. - Near term Ni production of up to 1 million tonnes in H208 - Grades: 0.9 - 1.2% Ni and 40-45% Fe - near term cashflow potential. - Kay Tanga: 150 RC and diamond holes drilled-Grades: 0.8-1.2g/t - Planned 3,500 m drilling on Calo Cu-Au property . - Additional exploration properties including Calo and El Paso porphyry copper-gold prospects defined by high chargeability anomalies.CatalystsAgata: Awaiting definition of resource, enviro impact stmt nearing completion, mine planning at adv stage, company has target production for H108.Archangel / Kay Tanda: Drilling on property completed and NI 43-101 expected in Q407; Scoping study and economic evaluation planned for Q407-Q108.Calo / El Paso: Continued exploration and drilling of targets identified from preliminary surveying.
$0.00
$0.20
$0.40
$0.60
$0.80
$1.00
$1.20
11/1
3/06
12/1
3/06
1/13
/07
2/13
/07
3/13
/07
4/13
/07
5/13
/07
6/13
/07
7/13
/07
8/13
/07
9/13
/07
10/1
3/07
0.0
0.20.40.60.8
1
Vol
(M)
50 Day MA100 Day MA
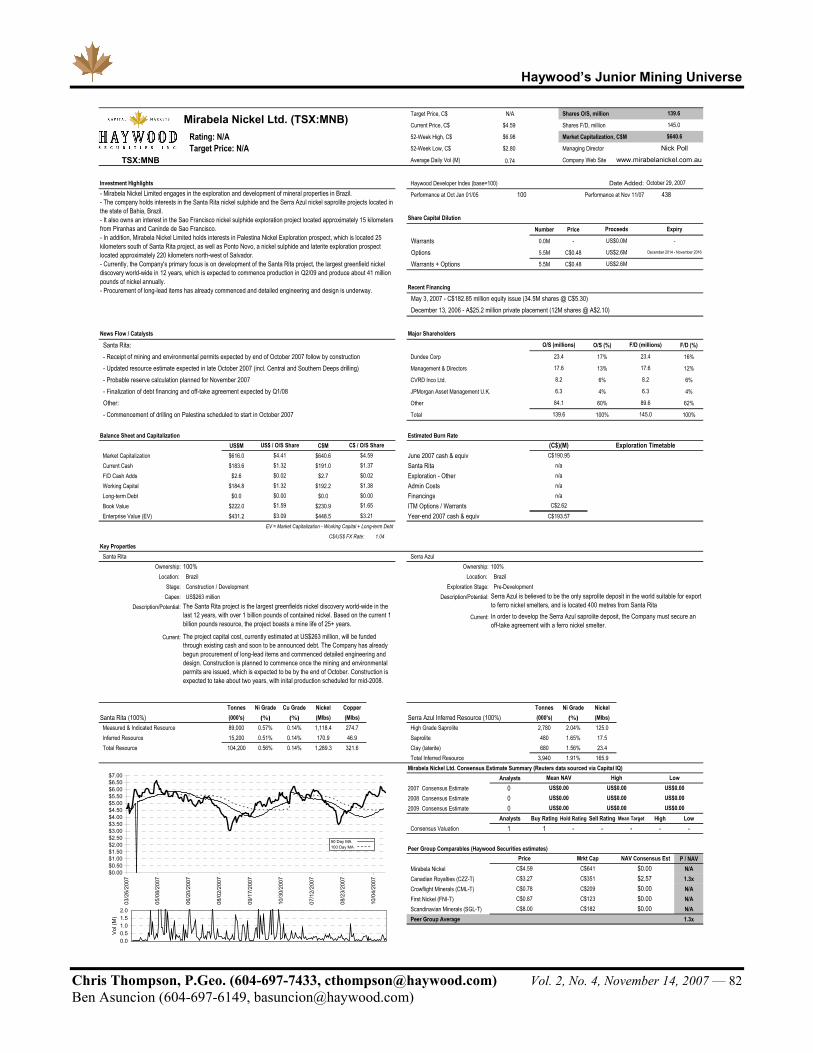
Haywood’s Junior Mining Universe
Chris Thompson, P.Geo. (604-697-7433, [email protected]) Vol. 2, No. 4, November 14, 2007 — 82 Ben Asuncion (604-697-6149, [email protected])
Target Price, C$ N/A Shares O/S, million
Current Price, C$ $4.59 Shares F/D, million
Rating: N/A 52-Week High, C$ $6.98 Market Capitalization, C$M
Target Price: N/A 52-Week Low, C$ $2.80 Managing Director
TSX:MNB Average Daily Vol (M) 0.74 Company Web Site
Investment Highlights Haywood Developer Index (base=100) Date Added:
Performance at Oct Jan 01/05 100 Performance at Nov 11/07 438
Share Capital Dilution
Number Price
Warrants 0.0M -
Options 5.5M C$0.48
Warrants + Options 5.5M C$0.48
Recent Financing
News Flow / Catalysts Major Shareholders
Santa Rita: O/S (%) F/D (%)
- Receipt of mining and environmental permits expected by end of October 2007 follow by construction Dundee Corp 17% 16%
- Updated resource estimate expected in late October 2007 (incl. Central and Southern Deeps drilling) Management & Directors 13% 12%
- Probable reserve calculation planned for November 2007 CVRD Inco Ltd. 6% 6%
- Finalization of debt financing and off-take agreement expected by Q1/08 JPMorgan Asset Management U.K. 4% 4%
Other: Other 60% 62%
- Commencement of drilling on Palestina scheduled to start in October 2007 Total 100% 100%
Balance Sheet and Capitalization Estimated Burn RateUS$M C$M
Market Capitalization $616.0 $640.6 June 2007 cash & equivCurrent Cash $183.6 $191.0 Santa RitaF/D Cash Adds $2.6 $2.7 Exploration - OtherWorking Capital $184.8 $192.2 Admin CostsLong-term Debt $0.0 $0.0 FinancingsBook Value $222.0 $230.9 ITM Options / WarrantsEnterprise Value (EV) $431.2 $448.5 Year-end 2007 cash & equiv
EV = Market Capitalization - Working Capital + Long-term Debt
C$/US$ FX Rate: 1.04
Key PropertiesSanta Rita Serra Azul
Ownership: 100% Ownership: 100%Location: Brazil Location: Brazil
Stage: Construction / Development Exploration Stage: Pre-DevelopmentCapex: US$263 million Description/Potential:
Description/Potential:Current:
Current:
Tonnes Ni Grade Cu Grade Nickel Copper Tonnes Ni Grade NickelSanta Rita (100%) (000's) (%) (%) (Mlbs) (Mlbs) Serra Azul Inferred Resource (100%) (000's) (%) (Mlbs)Measured & Indicated Resource 89,000 0.57% 0.14% 1,118.4 274.7 High Grade Saprolite 2,780 2.04% 125.0Inferred Resource 15,200 0.51% 0.14% 170.9 46.9 Saprolite 480 1.65% 17.5Total Resource 104,200 0.56% 0.14% 1,289.3 321.6 Clay (laterite) 680 1.56% 23.4
Total Inferred Resource 3,940 1.91% 165.9Mirabela Nickel Ltd. Consensus Estimate Summary (Reuters data sourced via Capital IQ)
Analysts2007 Consensus Estimate 02008 Consensus Estimate 02009 Consensus Estimate 0
Analysts Buy Rating Hold Rating Sell Rating Mean Target High LowConsensus Valuation 1 1 - - - - -
Peer Group Comparables (Haywood Securities estimates)P / NAV
Mirabela Nickel N/ACanadian Royalties (CZZ-T) 1.3xCrowflight Minerals (CML-T) N/AFirst Nickel (FNI-T) N/AScandinavian Minerals (SGL-T) N/APeer Group Average 1.3x
$0.00C$8.00 C$182
US$0.00US$0.00US$0.00
US$0.00US$0.00
$0.00C$123
(C$)(M)C$190.95
n/an/a
Low
NAV Consensus Est
$2.57$0.00
$0.00
HighUS$0.00 US$0.00
$0.02
$1.65
n/an/a
C$2.62
139.6
145.0
-
$640.6
October 29, 2007
Nick Poll
www.mirabelanickel.com.au
Expiry
US$0.0M
Proceeds
Mirabela Nickel Ltd. (TSX:MNB)
US$ / O/S Share C$ / O/S Share
C$193.57
$1.37
$1.38
17.6
$0.00$1.59$3.09
May 3, 2007 - C$182.85 million equity issue (34.5M shares @ C$5.30)
O/S (millions) F/D (millions)
23.4
145.0139.6
17.6
8.2 8.2
$3.21
$0.00
23.4
6.3
$4.59
US$2.6M
84.1
6.3
December 13, 2006 - A$25.2 million private placement (12M shares @ A$2.10)
December 2014 - November 2016
89.6
US$0.00
Mean NAV
C$0.87
US$2.6M
Serra Azul is believed to be the only saprolite deposit in the world suitable for export to ferro nickel smelters, and is located 400 metres from Santa RitaIn order to develop the Serra Azul saprolite deposit, the Company must secure an off-take agreement with a ferro nickel smelter.
Price
Exploration Timetable
C$3.27C$0.78
C$4.59
US$0.00
Mrkt Cap
C$351C$209
C$641
$4.41
- Mirabela Nickel Limited engages in the exploration and development of mineral properties in Brazil. - The company holds interests in the Santa Rita nickel sulphide and the Serra Azul nickel saprolite projects located in the state of Bahia, Brazil. - It also owns an interest in the Sao Francisco nickel sulphide exploration project located approximately 15 kilometers from Piranhas and Caninde de Sao Francisco. - In addition, Mirabela Nickel Limited holds interests in Palestina Nickel Exploration prospect, which is located 25 kilometers south of Santa Rita project, as well as Ponto Novo, a nickel sulphide and laterite exploration prospect located approximately 220 kilometers north-west of Salvador. - Currently, the Company's primary focus is on development of the Santa Rita project, the largest greenfield nickel discovery world-wide in 12 years, which is expected to commence production in Q2/09 and produce about 41 million pounds of nickel annually. - Procurement of long-lead items has already commenced and detailed engineering and design is underway.
The Santa Rita project is the largest greenfields nickel discovery world-wide in the last 12 years, with over 1 billion pounds of contained nickel. Based on the current 1 billion pounds resource, the project boasts a mine life of 25+ years.
The project capital cost, currently estimated at US$263 million, will be funded through existing cash and soon to be announced debt. The Company has already begun procurement of long-lead items and commenced detailed engineering and design. Construction is planned to commence once the mining and environmental permits are issued, which is expected to be by the end of October. Construction is expected to take about two years, with inital production scheduled for mid-2008.
$1.32$0.02$1.32
$0.00$0.50$1.00$1.50$2.00$2.50$3.00$3.50$4.00$4.50$5.00$5.50$6.00$6.50$7.00
03/2
6/20
07
05/0
8/20
07
06/2
0/20
07
08/0
2/20
07
09/1
7/20
07
10/3
0/20
07
07/1
2/20
07
08/2
3/20
07
10/0
4/20
07
0.00.51.01.52.0
1
Vol
(M)
50 Day MA100 Day MA
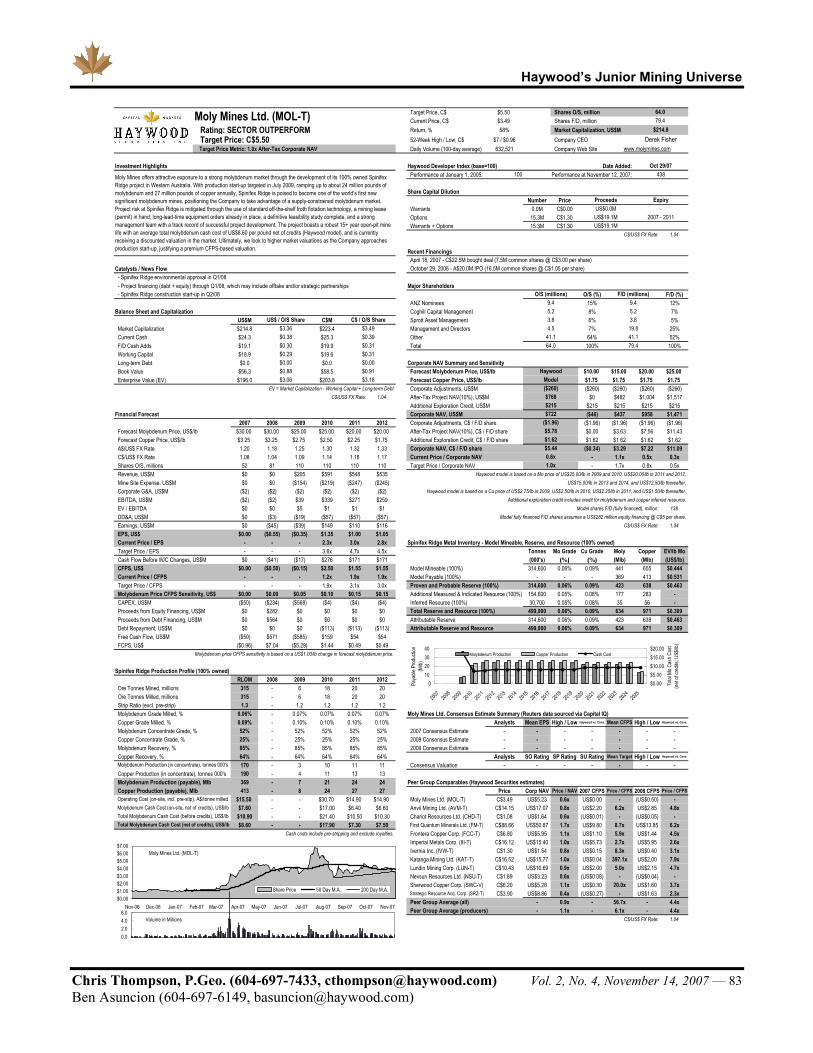
Haywood’s Junior Mining Universe
Chris Thompson, P.Geo. (604-697-7433, [email protected]) Vol. 2, No. 4, November 14, 2007 — 83 Ben Asuncion (604-697-6149, [email protected])
Target Price, C$ $5.50 Shares O/S, millionCurrent Price, C$ $3.49 Shares F/D, million
Rating: SECTOR OUTPERFORM Return, % 58% Market Capitalization, US$M Target Price: C$5.50 52-Week High / Low, C$ $7 / $0.96 Company CEO Target Price Metric: 1.0x After-Tax Corporate NAV Daily Volume (100-day average) 632,521 Company Web Site
Investment Highlights Haywood Developer Index (base=100) Date Added:Performance at January 1, 2005: Performance at November 12, 2007:
Share Capital DilutionNumber Price
Warrants 0.0M C$0.00Options 15.3M C$1.30Warrants + Options 15.3M C$1.30
C$/US$ FX Rate: 1.04
Recent Financings
Catalysts / News Flow- Spinifex Ridge environmental approval in Q1/08- Project financing (debt + equity) through Q1/08, which may include offtake and/or strategic partnerships Major Shareholders- Spinifex Ridge construction start-up in Q2/08 O/S (%) F/D (%)
ANZ Nominees 15% 12%Balance Sheet and Capitalization Coghill Capital Management 8% 7%
US$M C$M Sprott Asset Management 6% 5%Market Capitalization $214.8 $223.4 Management and Directors 7% 25%Current Cash $24.3 $25.3 Other 64% 52%F/D Cash Adds $19.1 $19.9 Total 100% 100%Working Capital $18.9 $19.6Long-term Debt $0.0 $0.0 Corporate NAV Summary and SensitivityBook Value $56.3 $58.5 Forecast Molybdenum Price, US$/lb $10.00 $15.00 $20.00 $25.00Enterprise Value (EV) $196.0 $203.8 Forecast Copper Price, US$/lb $1.75 $1.75 $1.75 $1.75
EV = Market Capitalization - Working Capital + Long-term Debt Corporate Adjustments, US$M ($260) ($260) ($260) ($260)C$/US$ FX Rate: 1.04 After-Tax Project NAV(10%), US$M $0 $482 $1,004 $1,517
Additional Exploration Credit, US$M $215 $215 $215 $215Financial Forecast Corporate NAV, US$M ($46) $437 $958 $1,471
2007 2008 2009 2010 2011 2012 Corporate Adjustments, C$ / F/D share ($1.96) ($1.96) ($1.96) ($1.96)Forecast Molybdenum Price, US$/lb $30.00 $30.00 $25.00 $25.00 $20.00 $20.00 After-Tax Project NAV(10%), C$ / F/D share $0.00 $3.63 $7.56 $11.43Forecast Copper Price, US$/lb $3.25 $3.25 $2.75 $2.50 $2.25 $1.75 Additional Exploration Credit, C$ / F/D share $1.62 $1.62 $1.62 $1.62A$/US$ FX Rate 1.20 1.18 1.25 1.30 1.32 1.33 Corporate NAV, C$ / F/D share ($0.34) $3.29 $7.22 $11.09C$/US$ FX Rate 1.08 1.04 1.09 1.14 1.16 1.17 Current Price / Corporate NAV - 1.1x 0.5x 0.3xShares O/S, millions 52 81 110 110 110 110 Target Price / Corporate NAV - 1.7x 0.8x 0.5xRevenue, US$M $0 $0 $205 $591 $548 $535 Haywood model is based on a Mo price of US$25.00/lb in 2009 and 2010, US$20.00/lb in 2011 and 2012,Mine Site Expense, US$M $0 $0 ($154) ($219) ($247) ($245) US$15.00/lb in 2013 and 2014, and US$12.50/lb thereafter.Corporate G&A, US$M ($2) ($2) ($2) ($2) ($2) ($2) Haywood model is based on a Cu price of US$2.75/lb in 2009, US$2.50/lb in 2010, US$2.25/lb in 2011, and US$1.50/lb thereafter.EBITDA, US$M ($2) ($2) $39 $339 $271 $259 Additional exploration credit includes credit for molybdenum and copper inferred resource.EV / EBITDA $0 $0 $5 $1 $1 $1 Model shares F/D (fully financed), million: 138DD&A, US$M $0 ($3) ($19) ($57) ($57) ($57) Model fully financed F/D shares assumes a US$282 million equity financing @ C$5 per share.Earnings, US$M $0 ($45) ($39) $149 $110 $116 C$/US$ FX Rate: 1.04EPS, US$ $0.00 ($0.55) ($0.35) $1.35 $1.00 $1.05Current Price / EPS - - - 2.3x 3.0x 2.8x Spinifex Ridge Metal Inventory - Model Mineable, Reserve, and Resource (100% owned)Target Price / EPS - - - 3.6x 4.7x 4.5x Tonnes Mo Grade Cu Grade Moly Copper EV/lb MoCash Flow Before W/C Changes, US$M $0 ($41) ($17) $276 $171 $171 (000's) (%) (%) (Mlb) (Mlb) (US$/lb)CFPS, US$ $0.00 ($0.50) ($0.15) $2.50 $1.55 $1.55 Model Mineable (100%) 314,600 0.06% 0.09% 441 655 $0.444Current Price / CFPS - - - 1.2x 1.9x 1.9x Model Payable (100%) - - - 369 413 $0.531Target Price / CFPS - - - 1.9x 3.1x 3.0x Proven and Probable Reserve (100%) 314,600 0.06% 0.09% 423 638 $0.463Molybdenum Price CFPS Sensitivity, US$ $0.00 $0.00 $0.05 $0.10 $0.15 $0.15 Additional Measured & Indicated Resource (100%) 154,600 0.05% 0.08% 177 283 -CAPEX, US$M ($50) ($234) ($568) ($4) ($4) ($4) Inferred Resource (100%) 30,700 0.05% 0.08% 35 56 -Proceeds from Equity Financing, US$M $0 $282 $0 $0 $0 $0 Total Reserve and Resource (100%) 499,900 0.06% 0.09% 634 971 $0.309Proceeds from Debt Financing, US$M $0 $564 $0 $0 $0 $0 Attributable Reserve 314,600 0.06% 0.09% 423 638 $0.463Debt Repayment, US$M $0 $0 $0 ($113) ($113) ($113) Attributable Reserve and Resource 499,900 0.06% 0.09% 634 971 $0.309Free Cash Flow, US$M ($50) $571 ($585) $159 $54 $54FCPS, US$ ($0.96) $7.04 ($5.29) $1.44 $0.49 $0.49
Molybdenum price CFPS sensitivity is based on a US$1.00/lb change in forecast molybdenum price.
Spinifex Ridge Production Profile (100% owned)RLOM 2008 2009 2010 2011 2012
Ore Tonnes Mined, millions 315 - 6 18 20 20Ore Tonnes Milled, millions 315 - 6 18 20 20Strip Ratio (excl. pre-strip) 1.3 - 1.2 1.2 1.2 1.2Molybdenum Grade Milled, % 0.06% - 0.07% 0.07% 0.07% 0.07% Moly Mines Ltd. Consensus Estimate Summary (Reuters data sourced via Capital IQ)Copper Grade Milled, % 0.09% - 0.10% 0.10% 0.10% 0.10% Analysts Mean EPS High / Low Haywood vs. Cons. Mean CFPS High / Low Haywood vs. Cons.
Molybdenum Concentrate Grade, % 52% - 52% 52% 52% 52% 2007 Consensus Estimate - - - - - - -Copper Concentrate Grade, % 25% - 25% 25% 25% 25% 2008 Consensus Estimate - - - - - - -Molybdenum Recovery, % 85% - 85% 85% 85% 85% 2009 Consensus Estimate - - - - - - -Copper Recovery, % 64% - 64% 64% 64% 64% Analysts SO Rating SP Rating SU Rating Mean Target High / Low Haywood vs. Cons.
170 - 3 10 11 11 Consensus Valuation - - - - - - -Copper Production (in concentrate), tonnes 000's 190 - 4 11 13 13Molybdenum Production (payable), Mlb 369 - 7 21 24 24 Peer Group Comparables (Haywood Securities estimates)Copper Production (payable), Mlb 413 - 8 24 27 27 Price Corp NAV Price / NAV 2007 CFPS Price / CFPS 2008 CFPS Price / CFPS
$15.50 - - $30.70 $14.90 $14.90 Moly Mines Ltd. (MOL-T) C$3.49 US$5.23 0.6x US$0.00 - (US$0.50) -$7.60 - - $17.00 $6.40 $6.60 Anvil Mining Ltd. (AVM-T) C$14.15 US$17.07 0.8x US$2.20 6.2x US$2.85 4.8x
$10.90 - - $21.40 $10.50 $10.30 Chariot Resources Ltd. (CHD-T) C$1.08 US$1.64 0.6x (US$0.01) - (US$0.05) -$8.60 - - $17.90 $7.30 $7.50 First Quantum Minerals Ltd. (FM-T) C$88.66 US$50.87 1.7x US$9.80 8.7x US$13.85 6.2x
Cash costs include pre-stripping and exclude royalties. Frontera Copper Corp. (FCC-T) C$6.80 US$5.95 1.1x US$1.10 5.9x US$1.44 4.5xImperial Metals Corp. (III-T) C$16.12 US$15.40 1.0x US$5.73 2.7x US$5.95 2.6xIvernia Inc. (IVW-T) C$1.30 US$1.54 0.8x US$0.15 8.3x US$0.40 3.1xKatanga Mining Ltd. (KAT-T) C$16.52 US$15.77 1.0x US$0.04 397.1x US$2.00 7.9xLundin Mining Corp. (LUN-T) C$10.43 US$10.69 0.9x US$2.00 5.0x US$2.15 4.7xNevsun Resources Ltd. (NSU-T) C$1.89 US$3.23 0.6x (US$0.08) - (US$0.04) -Sherwood Copper Corp. (SWC-V) C$6.20 US$5.28 1.1x US$0.30 20.0x US$1.60 3.7xStrategic Resource Acq. Corp. (SRZ-T) C$3.90 US$8.86 0.4x (US$0.27) - US$1.63 2.3xPeer Group Average (all) - 0.9x - 56.7x - 4.4xPeer Group Average (producers) - 1.1x - 6.1x - 4.4x
C$/US$ FX Rate: 1.04
Total Molybdenum Cash Cost (net of credits), US$/lb
Molybdenum Production (in concentrate), tonnes 000's
Total Molybdenum Cash Cost (before credits), US$/lb
Operating Cost (on-site, incl. pre-stip), A$/tonne milledMolybdenum Cash Cost (on-site, net of credits), US$/lb
$722($1.96)
Moly Mines offers attractive exposure to a strong molybdenum market through the development of its 100% owned Spinifex Ridge project in Western Australia. With production start-up targeted in July 2009, ramping up to about 24 million pounds of molybdenum and 27 million pounds of copper annually, Spinifex Ridge is poised to become one of the world’s first new significant molybdenum mines, positioning the Company to take advantage of a supply-constrained molybdenum market. Project risk at Spinifex Ridge is mitigated through the use of standard off-the-shelf froth flotation technology, a mining lease (permit) in hand, long-lead-time equipment orders already in place, a definitive feasibility study complete, and a strong management team with a track record of successful project development. The project boasts a robust 15+ year open-pit mine life with an average total molybdenum cash cost of US$8.60 per pound net of credits (Haywood model), and is currently receiving a discounted valuation in the market. Ultimately, we look to higher market valuations as the Company approaches production start-up, justifying a premium CFPS-based valuation.
$3.06 $3.18
$0.30 $0.31
$215$768
$0.00
79.4
3.84.5
1.0x
Model($260)
$5.440.6x
$5.78$1.62
5.23.819.841.1
Oct 29/07100 438
US$19.1M
-ProceedsUS$0.0M
Expiry
2007 - 2011
$0.00$0.88 $0.91
$0.29 $0.31
$0.38 $0.39
$214.8Derek Fisher
www.molymines.com
$3.36 $3.49US$ / O/S Share C$ / O/S Share
US$19.1M
Moly Mines Ltd. (MOL-T) 64.079.4
April 18, 2007 - C$22.5M bought deal (7.5M common shares @ C$3.00 per share)
O/S (millions) F/D (millions)
Haywood
41.164.0
October 29, 2006 - A$20.0M IPO (16.5M common shares @ C$1.05 per share)
9.45.2
9.4
Moly Mines Ltd. (MOL-T)
$0.00$1.00$2.00$3.00$4.00$5.00$6.00$7.00
Nov-06 Dec-06 Jan-07 Feb-07 Mar-07 Apr-07 May-07 Jun-07 Jul-07 Aug-07 Sep-07 Oct-07 Nov-07
Share Price 50 Day M.A. 200 Day M.A.
Volume in Millions
0.02.04.06.0
010203040
2007
2008
2009
2010
2011
2012
2013
2014
2015
2016
2017
2018
2019
2020
2021
2022
2023
2024
2025
Paya
ble P
rodu
ction
(M
lb)
$0.00$5.00$10.00$15.00$20.00
Total
Mo C
ash C
ost
(net
of cre
dits;
US$/l
b)
Molybdenum Production Copper Production Cash Cost
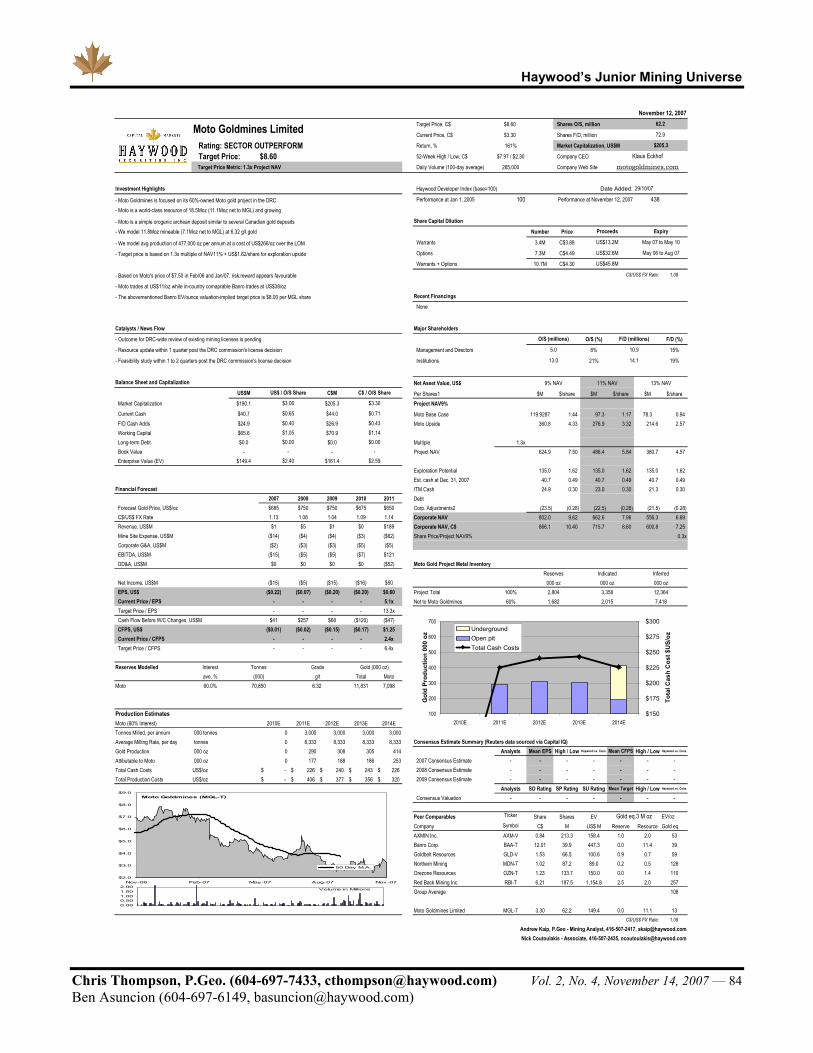
Haywood’s Junior Mining Universe
Chris Thompson, P.Geo. (604-697-7433, [email protected]) Vol. 2, No. 4, November 14, 2007 — 84 Ben Asuncion (604-697-6149, [email protected])
Target Price, C$ $8.60 Shares O/S, million
Current Price, C$ $3.30 Shares F/D, million
Rating: SECTOR OUTPERFORM Return, % 161% Market Capitalization, US$M
Target Price: $8.60 52-Week High / Low, C$ $7.97 / $2.30 Company CEO
Target Price Metric: 1.3x Project NAV Daily Volume (100-day average) 265,000 Company Web Site
Investment Highlights Haywood Developer Index (base=100) Date Added:
- Moto Goldmines is focused on its 60%-owned Moto gold project in the DRC Performance at Jan 1, 2005 100 Performance at November 12, 2007 438- Moto is a world-class resource of 18.5Moz (11.1Moz net to MGL) and growing
- Moto is a simple orogenic archean deposit similar to several Canadian gold deposits Share Capital Dilution
- We model 11.8Moz mineable (7.1Moz net to MGL) at 6.32 g/t gold Number Price
- We model avg production of 477,000 oz per annum at a cost of US$266/oz over the LOM Warrants 3.4M C$3.88
- Target price is based on 1.3x multiple of NAV11% + US$1.62/share for exploration upside Options 7.3M C$4.49
Warrants + Options 10.7M C$4.30
- Based on Moto's price of $7.50 in Feb/06 and Jan/07, risk:reward appears favourable C$/US$ FX Rate: 1.08
- Moto trades at US$11/oz while in-country comaprable Banro trades at US$38/oz
- The abovementioned Banro EV/ounce valuation-implied target price is $8.00 per MGL share Recent Financings
Catalysts / News Flow Major Shareholders
- Outcome for DRC-wide review of existing mining licenses is pending O/S (%) F/D (%)
- Resource update within 1 quarter post the DRC commission's license decision Management and Directors 8% 15%
- Feasibility study within 1 to 2 quarters post the DRC commission's license decision Institutions 21% 19%
Balance Sheet and Capitalization Net Asset Value, US$US$M C$M Per Shares1 $M $/share $M $/share $M $/share
Market Capitalization $190.1 $205.3 Project NAV9%Current Cash $40.7 $44.0 Moto Base Case 119.9287 1.44 97.3 1.17 78.3 0.94 F/D Cash Adds $24.9 $26.9 Moto Upside 360.8 4.33 276.9 3.32 214.6 2.57 Working Capital $65.6 $70.9Long-term Debt $0.0 $0.0 Multiple 1.3xBook Value - - Project NAV 624.9 7.50 486.4 5.84 380.7 4.57 Enterprise Value (EV) $149.4 $161.4
Exploration Potential 135.0 1.62 135.0 1.62 135.0 1.62 Est. cash at Dec. 31, 2007 40.7 0.49 40.7 0.49 40.7 0.49
Financial Forecast ITM Cash 24.9 0.30 23.0 0.30 21.3 0.30 2007 2008 2009 2010 2011 Debt
Forecast Gold Price, US$/oz $685 $750 $750 $675 $650 Corp. Adjustments2 (23.5) (0.28) (22.5) (0.28) (21.5) (0.28) C$/US$ FX Rate 1.13 1.08 1.04 1.09 1.14 Corporate NAV 802.0 9.62 662.6 7.96 556.3 6.69 Revenue, US$M $1 $5 $1 $0 $189 Corporate NAV, C$ 866.1 10.40 715.7 8.60 600.8 7.25 Mine Site Expense, US$M ($14) ($4) ($4) ($3) ($62) Share Price/Project NAV9% 0.3xCorporate G&A, US$M ($2) ($3) ($3) ($5) ($5)EBITDA, US$M ($15) ($5) ($5) ($7) $121DD&A, US$M $0 $0 $0 $0 ($52) Moto Gold Project Metal Inventory
Net Income, US$M ($15) ($5) ($15) ($16) $50EPS, US$ ($0.22) ($0.07) ($0.20) ($0.20) $0.60 Project Total 100%Current Price / EPS - - - - 5.1x Net to Moto Goldmines 60%Target Price / EPS - - - - 13.3xCash Flow Before W/C Changes, US$M $41 $257 $68 ($120) ($47)CFPS, US$ ($0.01) ($0.02) ($0.15) ($0.17) $1.25Current Price / CFPS - - - - 2.4xTarget Price / CFPS - - - - 6.4x
Reserves Modelled Interestave. % Total Moto
Moto 60.0% 11,831 7,098
Production EstimatesMoto (60% Interest) 2010E 2011E 2012E 2013E 2014ETonnes Milled, per annum 000 tonnes 0 3,000 3,000 3,000 3,000Average Milling Rate, per day tonnes 0 8,333 8,333 8,333 8,333 Consensus Estimate Summary (Reuters data sourced via Capital IQ)Gold Production 000 oz 0 290 308 305 414 Analysts Mean EPS High / Low Haywood vs. Cons. Mean CFPS High / Low Haywood vs. Cons.
Attibutable to Moto 000 oz 0 177 188 186 253 2007 Consensus Estimate - - - - - - -Total Cash Costs US$/oz -$ 226$ 240$ 243$ 226$ 2008 Consensus Estimate - - - - - - -Total Production Costs US$/oz -$ 406$ 377$ 356$ 320$ 2009 Consensus Estimate - - - - - - -
Analysts SO Rating SP Rating SU Rating Mean Target High / Low Haywood vs. Cons.
Consensus Valuation - - - - - - -
Peer Comparables Ticker Share Shares EV EV/ozCompany Symbol C$ M US$ M Reserve Resource Gold eq.AXMIN Inc. AXM-V 0.84 213.3 158.4 1.0 2.0 53Banro Corp. BAA-T 12.01 39.9 447.3 0.0 11.4 39Goldbelt Resources GLD-V 1.53 66.5 100.6 0.9 0.7 59Northern Mining MDN-T 1.02 87.2 89.0 0.2 0.5 128Orezone Resources OZN-T 1.23 133.7 150.0 0.0 1.4 110Red Back Mining Inc. RBI-T 6.21 187.5 1,154.8 2.5 2.0 257Group Average 108
Moto Goldmines Limited MGL-T 3.30 62.2 149.4 0.0 11.1 13C$/US$ FX Rate: 1.08
Andrew Kaip, P.Geo - Mining Analyst, 416-507-2417, [email protected] Coutoulakis - Associate, 416-507-2435, [email protected]
$2.40 $2.59
1,682
Tonnes Grade Gold (000 oz)
2,804
g/t
Gold eq.3 M oz
2,015 7,418
70,850 6.32
Moto Goldmines Limited
US$ / O/S Share C$ / O/S Share
$3.06 $3.30
$0.00 $0.00
(000)
5.0
13.0
-
$0.43$1.05 $1.14$0.40
-
9% NAV
$0.65 $0.71
November 12, 200762.2
72.9
Expiry
29/10/07
May 07 to May 10
$205.3
US$13.2M
Proceeds
motogoldmines.com
Klaus Eckhof
May 06 to Aug 07
US$45.8M
US$32.6M
11% NAV 13% NAV
None
F/D (millions)
10.9
14.1
O/S (millions)
3,358 12,364
Reserves Indicated Inferred000 oz 000 oz 000 oz
100
200
300
400
500
600
700
2010E 2011E 2012E 2013E 2014E
Gol
d Pr
oduc
tion
000
oz
$150
$175
$200
$225
$250
$275
$300
Tota
l Cas
h C
ost $
US/
oz
UndergroundOpen pitTotal Cash Costs
Moto Goldmines (MGL-T)
$2.0
$3.0
$4.0
$5.0
$6.0
$7.0
$8.0
$9.0
Nov-06 Feb-07 May-07 Aug-07 Nov-07
50 Day M.A.
Volume in Millions
0.000.501.001.502.00

Haywood’s Junior Mining Universe
Chris Thompson, P.Geo. (604-697-7433, [email protected]) Vol. 2, No. 4, November 14, 2007 — 85 Ben Asuncion (604-697-6149, [email protected])
Target Price, C$ $3.50 Shares O/S, millionCurrent Price, C$ $1.89 Shares F/D, million
Rating: SECTOR OUTPERFORM Return, % 85% Market Capitalization, US$M Target Price: C$3.50 52-Week High / Low, C$ $3.33 / $0.8 Company CEO Target Price Metric: 1.0x After-Tax Corporate NAV Daily Volume (100-day average) 346,525 Company Web Site
Investment Highlights Haywood Developer Index (base=100) Date Added:Performance at January 1, 2005: Performance at November 12, 2007:
Share Capital DilutionNumber Price
Warrants 22.8M C$4.79Options 5.5M C$2.92Warrants + Options 28.3M C$4.43
C$/US$ FX Rate: 1.04
Catalysts / News Flow Recent Financings- Formal receipt of a mining license at Bisha in Q4/07- Project financing and construction start-up at Bisha through H1/08- Continued exploration success at Nevsun’s regional base metals targets in Eritrea, including Bisha Northwest and Harena
Balance Sheet and CapitalizationUS$M C$M Major Shareholders
Market Capitalization $232.1 $241.4 O/S (%) F/D (%)Current Cash $33.3 $34.6 Baker Steel Capital Managers 8% 7%F/D Cash Adds $120.7 $125.6 JP Morgan Chase & Company 3% 3%Working Capital $31.0 $32.3 Wellington Management 3% 2%Long-term Debt ($4.0) ($4.2) Passport Capital LLC 2% 2%Book Value $42.4 $44.1 Management 1% 1%Enterprice Value (EV) $205.1 $213.3 Other 82% 86%
EV = Market Capitalization - Working Capital + Long-term Debt Total 18% 14%C$/US$ FX Rate: 1.04
Corporate NAV Summary and SensitivityFinancial Forecast Forecast Copper Price, US$/lb $1.00 $1.25 $1.50 $2.00
2007 2008 2009 2010 2011 2012 Forecast Zinc Price, US$/lb $0.45 $0.55 $0.65 $0.85Forecast Copper Price, US$/lb $3.25 $3.25 $2.75 $2.50 $2.25 $1.75 Forecast Gold Price, US$/oz $500 $550 $600 $700Forecast Zinc Price, US$/lb $1.55 $1.50 $1.25 $1.25 $1.00 $0.75 Forecast Silver Price, US$/oz $7.50 $8.50 $9.50 $11.50Forecast Gold Price, US$/oz $685 $750 $750 $675 $650 $650 Corporate Adjustments, US$M $113 $113 $113 $113Forecast Silver Price, US$/oz $13.50 $14.50 $13.50 $11.50 $10.50 $10.50 Bisha After-Tax Project NAV, US$M $116 $227 $299 $425C$/US$ FX Rate 1.08 1.04 1.09 1.14 1.16 1.17 Additional Exploration Credit, US$M $110 $110 $110 $110Shares O/S, millions 128 143 158 158 158 158 Corporate NAV, US$M $340 $450 $522 $648Revenue, US$M $27 $0 $0 $192 $174 $195 Corporate Adjustments, C$ / F/D share $0.65 $0.65 $0.65 $0.65Mine Site Expense, US$M ($31) $0 ($6) ($58) ($55) ($81) Bisha After-Tax Project NAV, C$ / F/D share $0.67 $1.30 $1.71 $2.43Corporate G&A, US$M ($6) ($6) ($6) ($6) ($6) ($6) Additional Exploration Credit, C$ / F/D share $0.63 $0.63 $0.63 $0.63EBITDA, US$M ($10) ($6) ($12) $127 $114 $107 Corporate NAV, C$ / F/D share $1.95 $2.58 $2.99 $3.71EV / EBITDA - - - 1.6x 1.8x 1.9x Current Price / Corporate NAV 1.0x 0.7x 0.6x 0.5xDD&A, US$M ($14) ($14) ($18) ($47) ($41) ($48) Target Price / Corporate NAV 1.8x 1.4x 1.2x 0.9xEarnings, US$M ($24) ($20) ($44) $36 $37 $32 Haywood model is based on a US$2.50/lb Cu price in 2010, US$2.25/lb in 2011, and US$1.75/lb thereafter.EPS, US$ ($0.18) ($0.14) ($0.28) $0.23 $0.23 $0.20 Haywood model is based on a US$1.25/lb Zn price in 2010, US$1.00/lb in 2011, and US$0.75/lb thereafter.Current Price / EPS - - - 7.2x 7.1x 8.1x Haywood model is based on a US$675/oz Au price in 2010 and US$650/oz thereafter.Target Price / EPS - - - 13.3x 13.1x 15.0x Haywood model is based on a US$11.50/oz Ag price in 2010 and US$10.50/oz thereafter.Cash Flow Before W/C Changes, US$M ($10) ($6) ($26) $117 $95 $99 Bisha after-tax project NAV discounts precious metal production at 3% and base metal production at 10%.CFPS, US$ ($0.08) ($0.04) ($0.16) $0.74 $0.60 $0.62 Additional exploration credit includes credit for Bisha's precious and base metal resource.Current Price / CFPS - - - 2.2x 2.7x 2.6x Model shares F/D (fully financed), million: 182Target Price / CFPS - - - 4.1x 5.0x 4.8x Model fully financed F/D shares assumes a US$88 million equity financing @ C$3.00 per share.Copper Price CFPS Sensitivity, US$ $0.00 $0.00 $0.00 $0.00 $0.00 $0.10 C$/US$ FX Rate: 1.04Zinc Price CFPS Sensitivity, US$ $0.00 $0.00 $0.00 $0.00 $0.00 $0.00Gold Price CFPS Sensitivity, US$ $0.02 $0.00 $0.00 $0.07 $0.07 $0.00 Metal Inventory - Model Mineable, Reserve, and ResourceCAPEX, US$M ($1) ($93) ($158) ($5) ($44) ($4)Proceeds from Equity Financing, US$M $0 $88 $0 $0 $0 $0Proceeds from Debt Financing, US$M $0 $132 $0 $0 $0 $0 Model Mineable (100%) 1.5% Cu 860 Mlb Cu 1.8 g/t Au 1.4 Moz AuDebt Repayment, US$M $0 $0 $0 ($26) ($26) ($26) Model Payable (100%) - 746 Mlb Cu - 1.1 Moz AuProceeds from ENAMCO, US$M $0 $30 $0 $35 $35 $35 Bisha Oxide (60% owned)Free Cash Flow, US$M ($11) $152 ($183) $121 $61 $103 Proven and Probable Reserve (100%) 8.0 g/t Au 1.0 Moz Au 32.9 g/t Ag 4.2 Moz AgFCPS, US$ ($0.08) $1.06 ($1.16) $0.76 $0.38 $0.65 Total Reserve and Resource (100%) 7.0 g/t Au 1.1 Moz Au 30.0 g/t Ag 4.7 Moz Ag
Copper price CFPS sensitivity is based on a US$0.25/lb change in forecast copper price. Bisha Supergene (60% owned)Zinc price CFPS sensitivity is based on a US$0.10/lb change in forecast zinc price. Proven and Probable Reserve (100%) 4.4% Cu 616 Mlb Cu 0.8 g/t Au 0.2 Moz AuGold price CFPS sensitivity is based on a US$50/oz change in forecast gold price. Total Reserve and Resource (100%) 3.9% Cu 664 Mlb Cu 0.7 g/t Au 0.2 Moz Au
Bisha Primary (60% owned)Bisha Production Profile (60% owned) Proven and Probable Reserve (100%) 7.2% Zn 1,544 Mlb Zn 1.1% Cu 244 Mlb Cu
RLOM 2008 2009 2010 2011 2012 Total Reserve and Resource (100%) 5.7% Zn 3,336 Mlb Zn 1.0% Cu 576 Mlb CuOxide Ore Tonnes Milled, millions 4.0 - - 2.0 2.0 0.0 Tabakoto / Segala (60% owned)Supergene Ore Tonnes Milled, millions 6.4 - - - - 2.0 Proven and Probable Reserve (100%) 4.1 g/t Au 0.8 Moz Au - -Primary Ore Tonnes Milled, millions 9.7 - - - - - Total Reserve and Resource (100%) 4.4 g/t Au 2.7 Moz Au - -Total Ore Tonnes Milled, millions 20.1 - - 2.0 2.0 2.0Strip Ratio 4.7 - 84.3 5.3 3.4 3.8 Nevsun Resources Ltd. Consensus Estimate Summary (Reuters data sourced via Capital IQ)Oxide Gold Grade Milled, g/t 8.0 - - 8.3 7.8 8.0 Analysts Mean EPS High / Low Haywood vs. Cons. Mean CFPS High / Low Haywood vs. Cons.
Supergene Copper Grade Milled, % 4.4% - - - - 4.4% 2007 Consensus Estimate 6 (US$0.12) (US$0.10) / (US$0.20) 154% (US$0.09) (US$0.06) / (US$0.15) 84%Primary Zinc Grade Milled, % 7.2% - - - - - 2008 Consensus Estimate 5 (US$0.07) (US$0.01) / US-$0.15 203% (US$0.06) (US$0.05) / US-$0.10 65%Oxide Gold Recovery, % 87% - - 87% 87% 87% 2009 Consensus Estimate 1 (US$0.05) (US$0.05) / (US$0.05) 554% US$0.00 (US$0.00) / (US$0.00) -Supergene Copper Recovery, % 92% - - - - 92% Analysts SO Rating SP Rating SU Rating Mean Target High / Low Haywood vs. Cons.
Primary Zinc Recovery, % 84% - - - - - Consensus Valuation 6 4 1 1 US$2.46 US$3.44 / US$1.25 142%Gold Production (100%), ounces 000's 1,088 - - 464 432 38Attributable Gold Production, ounces 000's 653 - - 278 259 23 Peer Group Comparables (Haywood Securities estimates)Payable Copper Production (100%), Mlb 746 - - - - 170 Price Corp NAV Price / NAV 2007 CFPS Price / CFPS 2008 CFPS Price / CFPSAttributable Payable Copper Production, Mlb 448 - - - - 102 Nevsun Resources Ltd. (NSU-T) C$1.89 US$3.23 0.6x (US$0.08) - (US$0.04) -Payable Zinc Production (100%), Mlb 1,094 - - - - - Anvil Mining Ltd. (AVM-T) C$14.15 US$17.07 0.8x US$2.20 6.2x US$2.85 4.8xAttributable Payable Zinc Production, Mlb 656 - - - - - Chariot Resources Ltd. (CHD-T) C$1.08 US$1.64 0.6x (US$0.01) - (US$0.05) -Operating Cost, US$/tonne milled $32 - - $39 $36 $29 First Quantum Minerals Ltd. (FM-T) C$88.66 US$50.87 1.7x US$9.80 8.7x US$13.85 6.2x
$205 - - $195 $190 $190 Frontera Copper Corp. (FCC-T) C$6.80 US$5.95 1.1x US$1.10 5.9x US$1.44 4.5x$0.60 - - - - - Imperial Metals Corp. (III-T) C$16.12 US$15.40 1.0x US$5.73 2.7x US$5.95 2.6x$0.20 - - - - - Ivernia Inc. (IVW-T) C$1.30 US$1.54 0.8x US$0.15 8.3x US$0.40 3.1x
Total cash costs are net of credits. Katanga Mining Ltd. (KAT-T) C$16.52 US$15.77 1.0x US$0.04 - US$2.00 7.9xLundin Mining Corp. (LUN-T) C$10.43 US$10.69 0.9x US$2.00 5.0x US$2.15 4.7xSherwood Copper Corp. (SWC-V) C$6.20 US$5.28 1.1x US$0.30 - US$1.60 3.7xStrategic Resource Acq. Corp. (SRZ-T) C$3.90 US$8.86 0.4x (US$0.27) - US$1.63 2.3xPeer Group Average - - 1.0x - 6.1x - 4.4x
C$/US$ FX Rate: 1.04
Stefan Ioannou, Ph.D. - Mining [email protected] 416-507-2309
Grade Metal
October 18, 2007 - C$15M private placement (10M shares @ C$1.50 per share)
5,958
156.1
$0.65
1.0x
Haywood Model
October 25, 2005 - C$40M bought deal (17.8M units @ C$2.25; 1 unit = I share + 1/2 warrant at C$3.00 to October 25, 2008)
O/S (millions)
4,860
Metal
4,016
9,71326,443
25,537
Tonnes(000's)
6,3507,709
Primary Zinc Total Cash Cost, US$/lb
Nevsun Resources Ltd. (NSU-T) 127.7156.1
$1.82 $1.89
$232.1
18,919
Grade
John Clarkewww.nevsunresources.com
US$ / O/S Share C$ / O/S Share
Nevsun has advanced its 60% owned Bisha gold and base metals project through feasibility and is now focusing its efforts on timely permitting, mine financing, and construction start-up. Bisha boasts a robust initial 10-year open-pit mine life and will likely be the first of a number of recently discovered volcanogenic massive sulphide (VMS) deposits developed in Eritrea. In time, we anticipate the country will emerge as a world-class VMS mining district.Eritrea’s world-class potential has not gone unnoticed by the majors, as is evidenced by the Lundin Mining Corporation (LUN–T) 19.6% interest in Sunridge Gold Corp. (SGC–V) and 13.4% interest in Sanu Resources Ltd. (SNU–V), and the Anvil Mining Limited (AVM–T) 18% interest in Sub-Sahara Resources NL (SBS–A). With a feasibility study complete and permitting well advanced, we believe Bisha is ‘ripe for the picking’ in a marketplace characterized by ongoing consolidation.
Oct 29/07100
US$120.7M
438
October 31, 2006 - C$30M bought deal (10M units @ C$3.00; 1 unit = I share + 1/2 warrant at C$4.00 to October 31, 2009)
F/D (millions)10.74.0
10.7$0.95 $0.98$0.26 $0.27
127.7105.4
$0.24 $0.25($0.03) ($0.03)
1.3$0.33 $0.35$1.61 $1.67
4.03.33.1
$3.360.6x
$110$586
1.3133.7
Supergene Copper Total Cash Cost, US$/lbOxide Gold Total Cash Cost, US$/oz
-
$2.08$0.63
$113$363
US$15.4M
Proceeds
3.33.1
ExpiryJune 2008 - October 2009
various
May 12, 2006 - C$10M private placement (2.5M shares @ C$4.00 per share)
US$105.3M
Nevsun Resources Ltd. (NSU-T)
$0.00$1.00$2.00$3.00$4.00
Nov-06 Jan-07 Mar-07 May-07 Jul-07 Sep-07 Nov-07
Share Price 50 Day M.A. 200 Day M.A.
Volume in Millions
0.0
1.0
2.0

Haywood’s Junior Mining Universe
Chris Thompson, P.Geo. (604-697-7433, [email protected]) Vol. 2, No. 4, November 14, 2007 — 86 Ben Asuncion (604-697-6149, [email protected])
TSXV:OK Price $1.81 Shares O/S (M) 95.71 MCap (C$) (M) $173.24
Comment:
11/12/2007 CDNX:OKInvestment Highlights Orko Silver Corp. Chart
39,399
Website: http://www.orkosilver.comTel:President/CEO:
Capital Structure (C$) (M)Shares O/S* 95.71Shares F/D 114.79(C$) (M) Av Strike Basic ITM ProceedsCash & Equiv $4.27Options $0.68 14.13 14.13 $9.62Warrants $0.89 4.95 4.95 $4.41Total Cash & ITM 19.08 19.08 $18.31Market Cap $173.24
Peer Group Companies Price (C$) MC (C$) (M)Trading Statistics (C$) TSX:MAG $14.90 $651.71Last Sale Price $1.87 TSXV:OK $1.81 $173.2452 Week High $2.17 TSX:SPM $1.43 $148.7552 Week Low $0.45 TSX:SEG $0.81 $44.93Average Daily Vol (M) 0.48 TSXV:MSM $0.77 $31.08Ownership (M) Management Institutional Shares 0.89 2.49% O/S 0.93% 2.60% Estimated Burn Rate (C$) (M)Analyst Coverage # Analysts September 2007 cash & equiv $8.00
1 La Preciosa -$2.40 Q407-Q108Haywood Exploration Index Statistics San Juan/Santa Monica -$2.40 Q407-Q108Dated Added 22-Nov-06 Admin Costs -$0.60
ITM Options / Warrants $14.03 Last Financing Year-end 2007 cash & equiv $16.63 July 11-07 $4 million
Key PropertiesLa Preciosa 100% San Juan / Santa Monica Location: Mexico Location: MexicoExploration Stage: Advanced Exploration Exploration Stage: ExplorationDescription Description/Potential: /Potential:Current:
Current:
Reserve/Resource: Reserve/Resource:
Orko Silver Corp.
Focused on Ag exploration in Mexico. 66.6 million oz Ag of inferred resource defined on 100% controlled La Preciosa property - aggressive exploring JV properties - Santa Monica and San Juan - contiguous with La Preciosa.
75% (earn -in)
La Gloria, Abundancia, Luz Elena, Martha veins. Aggressive drill program (over 67,000m to date) focused on resource expansion. 30% of the initial targets tested - potential of expansion on strike and at depth. New vein discoveries. Geophysical mapping shows a strike length of 1.2 km extends for 5 km. Recent results: Abundancia Vein - 11.76 m grading 0.082 g/t Au and 383.6 g/t Ag. Martha Vein: 23.17 m grading 0.532 g/t Au and 216.5 g/t Ag. Currently drilling on property with 3 rigs - with goal of having a new resource estimate in Q108.
Mag Silver Corp.
- Focused on Silver with early and advanced exploration projects. - Interests in 3 key projects - La Preciosa (100%) - San Juan and Santa Monica JV properties. - Aggressive exploration program - 5 diamond drill rigs active in Mexico - 4 rigs on La Preciosa and 1 on San Juan/Santa Monica. - La Preciosa: 43-101 compliant resource of 10.36 M tonnes at 200g/t Au and 0.328g/t Ag (73.1 million oz Ag equivalent), new resource estimate in Q108 - 67,000 m drilled to date on La Preciosa - awaiting results from over 30 holes already drilled and not included in Q407 revised resource - JV properties - Santa Monica and San Juan - contiguous with La Preciosa.CatalystsLa Preciosa: Significant silver-gold mineralization intersected; 3 rigs continuously drilling; awaiting results from 30 holes (17,000m of drilling) in Q407 with another new resource estimate expected by Q108.San Juan / Santa Monica: Drilling targets identified from geochemical analysis; drilling with 1 rig expected to commence late Q407.
Early stage silver exploration with 3 epithermal veins identified. JV partner - Silver Standard Resources (San Juan); GoldCorp (Santa Monica).
Gary Cope
Aggressive exploration program on a multiple vein - open along strike and at depth - growing resource.
Scorpio Mining Corp.
The Santa Monica property which covers 17,285 hectares is optioned by Orko for a 75% earn-in interest from GoldCorp Inc. Orko has a 75% earn-in interest in the San Juan property from Silver Standard which spans 24,580 hectares. Both properties are bordering with Orko's La Preciosa project. The company plans a 3 step process to explore both projects; regional floating quartz sampling survey - currently underway; grid trench sampling & drill testing of targets. Drilling is currently underway on San Juan with Santa Monica expected to be drilled in late Q407.N/A
Exploration Timetable
604-684-4691
5.0 million units @ $0.80 + 1/2 warrant @ $1.00
Orko Silver Corp.
Silver Eagle Mines Inc.
Inferred (NI 43-101 compliant) 10.36 M tonnes grading 200.0 g/t Ag & 0.328 g/t Au
Mexican Silver Mines Ltd.
Private Placement
$0.00
$0.20
$0.40
$0.60
$0.80
$1.00
$1.20
$1.40
11/1
3/06
12/1
3/06
1/13
/07
2/13
/07
3/13
/07
4/13
/07
5/13
/07
6/13
/07
7/13
/07
8/13
/07
9/13
/07
10/1
3/07
0.00.51.01.52.02.5
1
Vol (
M)
50 Day MA100 Day MA
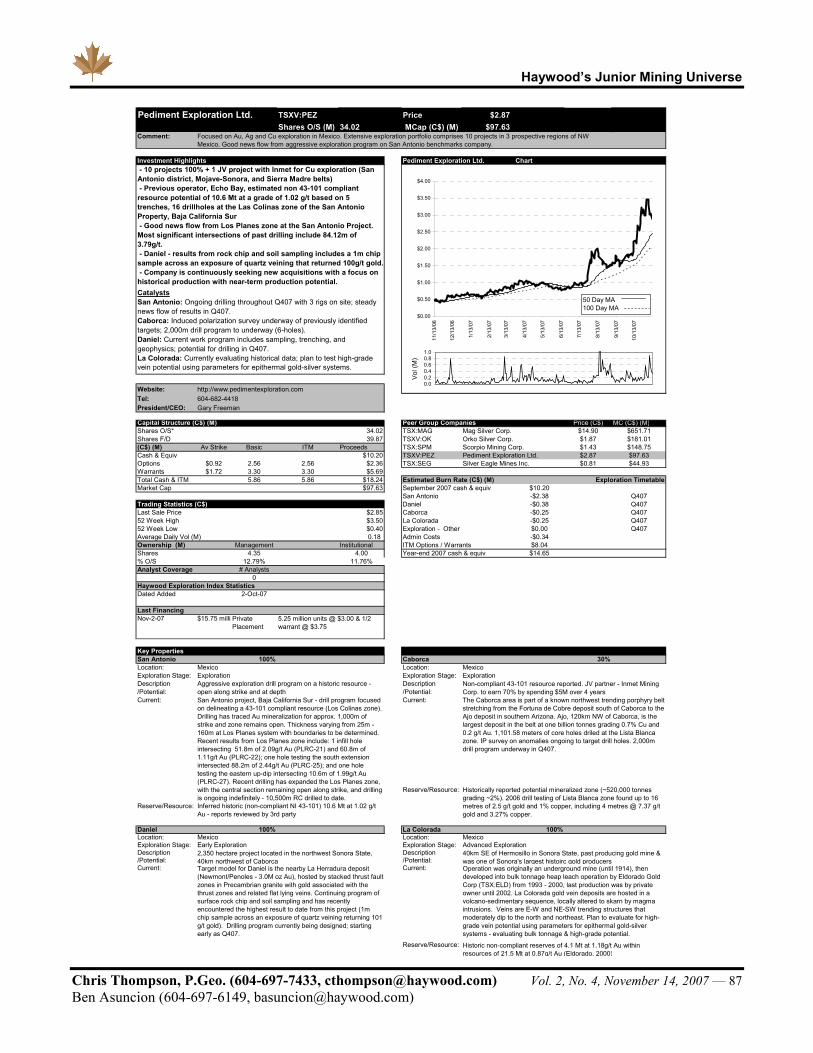
Haywood’s Junior Mining Universe
Chris Thompson, P.Geo. (604-697-7433, [email protected]) Vol. 2, No. 4, November 14, 2007 — 87 Ben Asuncion (604-697-6149, [email protected])
TSXV:PEZ Price $2.87 Shares O/S (M) 34.02 MCap (C$) (M) $97.63
Comment:
11/12/2007Investment Highlights Pediment Exploration Ltd. Chart
Website: http://www.pedimentexploration.comTel:President/CEO:
Capital Structure (C$) (M) Peer Group Companies Price (C$) MC (C$) (M)Shares O/S* 34.02 TSX:MAG $14.90 $651.71Shares F/D 39.87 TSXV:OK $1.87 $181.01(C$) (M) Av Strike Basic ITM Proceeds TSX:SPM $1.43 $148.75Cash & Equiv $10.20 TSXV:PEZ $2.87 $97.63Options $0.92 2.56 2.56 $2.36 TSX:SEG $0.81 $44.93Warrants $1.72 3.30 3.30 $5.69Total Cash & ITM 5.86 5.86 $18.24 Estimated Burn Rate (C$) (M)Market Cap $97.63 September 2007 cash & equiv $10.20
San Antonio -$2.38 Q407Trading Statistics (C$) Daniel -$0.38 Q407Last Sale Price $2.85 Caborca -$0.25 Q40752 Week High $3.50 La Colorada -$0.25 Q40752 Week Low $0.40 Exploration - Other $0.00 Q407Average Daily Vol (M) 0.18 Admin Costs -$0.34 Ownership (M) Management Institutional ITM Options / Warrants $8.04 Shares 4.35 4.00 Year-end 2007 cash & equiv $14.65 % O/S 12.79% 11.76%Analyst Coverage # Analysts
0 Haywood Exploration Index StatisticsDated Added 2-Oct-07
Last FinancingNov-2-07 $15.75 milli
Key PropertiesSan Antonio 100% Caborca 30%Location: Mexico Location: MexicoExploration Stage: Exploration Exploration Stage: ExplorationDescription Description/Potential: /Potential:Current: Current:
Reserve/Resource:
Reserve/Resource:
Daniel 100% La Colorada 100%Location: Mexico Location: MexicoExploration Stage: Early Exploration Exploration Stage: Advanced ExplorationDescription Description/Potential: /Potential:Current: Current:
Reserve/Resource:
2,350 hectare project located in the northwest Sonora State, 40km northwest of Caborca
Historic non-compliant reserves of 4.1 Mt at 1.18g/t Au within resources of 21.5 Mt at 0.87g/t Au (Eldorado, 2000)
Pediment Exploration Ltd.
Focused on Au, Ag and Cu exploration in Mexico. Extensive exploration portfolio comprises 10 projects in 3 prospective regions of NW Mexico. Good news flow from aggressive exploration program on San Antonio benchmarks company.
Orko Silver Corp.
604-682-4418Gary Freeman
Exploration Timetable
San Antonio project, Baja California Sur - drill program focused on delineating a 43-101 compliant resource (Los Colinas zone). Drilling has traced Au mineralization for approx. 1,000m of strike and zone remains open. Thickness varying from 25m - 160m at Los Planes system with boundaries to be determined. Recent results from Los Planes zone include: 1 infill hole intersecting 51.8m of 2.09g/t Au (PLRC-21) and 60.8m of 1.11g/t Au (PLRC-22); one hole testing the south extension intersected 88.2m of 2.44g/t Au (PLRC-25); and one hole testing the eastern up-dip intersecting 10.6m of 1.99g/t Au (PLRC-27). Recent drilling has expanded the Los Planes zone, with the central section remaining open along strike, and drilling is ongoing indefinitely - 10,500m RC drilled to date.
Scorpio Mining Corp.
Non-compliant 43-101 resource reported. JV partner - Inmet Mining Corp. to earn 70% by spending $5M over 4 years
Pediment Exploration Ltd.
Private Placement
Silver Eagle Mines Inc.
Aggressive exploration drill program on a historic resource - open along strike and at depth
The Caborca area is part of a known northwest trending porphyry belt stretching from the Fortuna de Cobre deposit south of Caborca to the Ajo deposit in southern Arizona. Ajo, 120km NW of Caborca, is the largest deposit in the belt at one billion tonnes grading 0.7% Cu and 0.2 g/t Au. 1,101.58 meters of core holes driled at the Lista Blanca zone. IP survey on anomalies ongoing to target drill holes. 2,000m drill program underway in Q407.
5.25 million units @ $3.00 & 1/2 warrant @ $3.75
CatalystsSan Antonio: Ongoing drilling throughout Q407 with 3 rigs on site; steady news flow of results in Q407.Caborca: Induced polarization survey underway of previously identified targets; 2,000m drill program to underway (6-holes).Daniel: Current work program includes sampling, trenching, and geophysics; potential for drilling in Q407.La Colorada: Currently evaluating historical data; plan to test high-grade vein potential using parameters for epithermal gold-silver systems.
- 10 projects 100% + 1 JV project with Inmet for Cu exploration (San Antonio district, Mojave-Sonora, and Sierra Madre belts) - Previous operator, Echo Bay, estimated non 43-101 compliant resource potential of 10.6 Mt at a grade of 1.02 g/t based on 5 trenches, 16 drillholes at the Las Colinas zone of the San Antonio Property, Baja California Sur - Good news flow from Los Planes zone at the San Antonio Project. Most significant intersections of past drilling include 84.12m of 3.79g/t. - Daniel - results from rock chip and soil sampling includes a 1m chip sample across an exposure of quartz veining that returned 100g/t gold. - Company is continuously seeking new acquisitions with a focus on historical production with near-term production potential.
Target model for Daniel is the nearby La Herradura deposit (Newmont/Penoles - 3.0M oz Au), hosted by stacked thrust fault zones in Precambrian granite with gold associated with the thrust zones and related flat lying veins. Continuing program of surface rock chip and soil sampling and has recently encountered the highest result to date from this project (1m chip sample across an exposure of quartz veining returning 101 g/t gold). Drilling program currently being designed; starting early as Q407.
Historically reported potential mineralized zone (~520,000 tonnes grading ~2%). 2006 drill testing of Lista Blanca zone found up to 16 metres of 2.5 g/t gold and 1% copper, including 4 metres @ 7.37 g/t gold and 3.27% copper.
Inferred historic (non-compliant NI 43-101) 10.6 Mt at 1.02 g/t Au - reports reviewed by 3rd party
40km SE of Hermosillo in Sonora State, past producing gold mine & was one of Sonora's largest histoirc gold producersOperation was originally an underground mine (until 1914), then developed into bulk tonnage heap leach operation by Eldorado Gold Corp (TSX:ELD) from 1993 - 2000, last production was by private owner until 2002. La Colorada gold vein deposits are hosted in a volcano-sedimentary sequence, locally altered to skarn by magma intrusions. Veins are E-W and NE-SW trending structures that moderately dip to the north and northeast. Plan to evaluate for high-grade vein potential using parameters for epithermal gold-silver systems - evaluating bulk tonnage & high-grade potential.
Mag Silver Corp.
$0.00
$0.50
$1.00
$1.50
$2.00
$2.50
$3.00
$3.50
$4.00
11/1
3/06
12/1
3/06
1/13
/07
2/13
/07
3/13
/07
4/13
/07
5/13
/07
6/13
/07
7/13
/07
8/13
/07
9/13
/07
10/1
3/07
0.00.20.40.60.81.0
1
Vol
(M)
50 Day MA100 Day MA
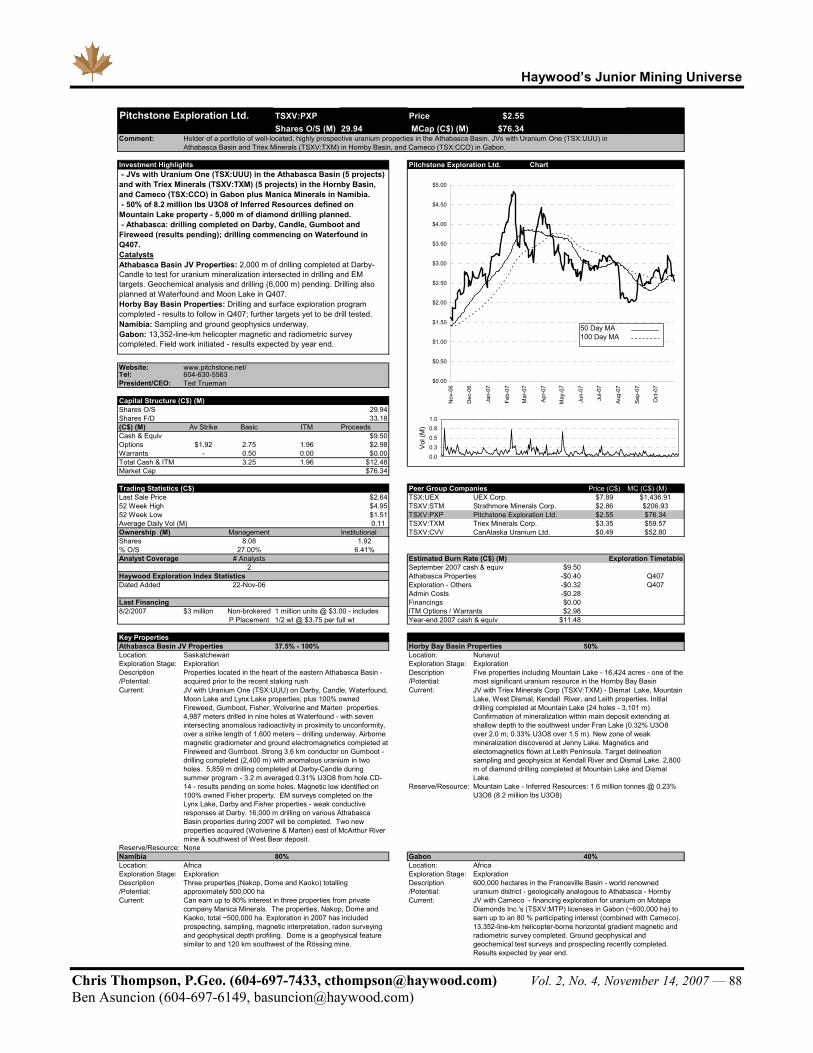
Haywood’s Junior Mining Universe
Chris Thompson, P.Geo. (604-697-7433, [email protected]) Vol. 2, No. 4, November 14, 2007 — 88 Ben Asuncion (604-697-6149, [email protected])
TSXV:PXP Price $2.55 Shares O/S (M) 29.94 MCap (C$) (M) $76.34
Comment:
11/12/2007Investment Highlights Pitchstone Exploration Ltd. Chart
Website: www.pitchstone.net/Tel:President/CEO:
Capital Structure (C$) (M)Shares O/S 29.94Shares F/D 33.18(C$) (M) Av Strike Basic ITM ProceedsCash & Equiv $9.50Options $1.92 2.75 1.96 $2.98Warrants - 0.50 0.00 $0.00Total Cash & ITM 3.25 1.96 $12.48Market Cap $76.34
Trading Statistics (C$) Peer Group Companies Price (C$) MC (C$) (M)Last Sale Price $2.64 TSX:UEX $7.89 $1,436.9152 Week High $4.95 TSXV:STM $2.86 $206.9352 Week Low $1.51 TSXV:PXP $2.55 $76.34Average Daily Vol (M) 0.11 TSXV:TXM $3.35 $59.57Ownership (M) Management Institutional TSXV:CVV $0.49 $52.80Shares 8.08 1.92% O/S 27.00% 6.41%Analyst Coverage # Analysts Estimated Burn Rate (C$) (M)
2 September 2007 cash & equiv $9.50 Haywood Exploration Index Statistics Athabasca Properties -$0.40 Q407Dated Added 22-Nov-06 Exploration - Others -$0.32 Q407
Admin Costs -$0.28 Last Financing Financings $0.00 8/2/2007 $3 million ITM Options / Warrants $2.98
Year-end 2007 cash & equiv $11.48
Key PropertiesAthabasca Basin JV Properties 37.5% - 100% Horby Bay Basin PropertiesLocation: Saskatchewan Location: NunavutExploration Stage: Exploration Exploration Stage: ExplorationDescription Description/Potential: /Potential:Current: Current:
Reserve/Resource:
Reserve/Resource: NoneNamibia 80% Gabon Location: Africa Location: AfricaExploration Stage: Exploration Exploration Stage: ExplorationDescription Description/Potential: /Potential:Current: Current:
Pitchstone Exploration Ltd.
Holder of a portfolio of well-located, highly prospective uranium properties in the Athabasca Basin. JVs with Uranium One (TSX:UUU) in Athabasca Basin and Triex Minerals (TSXV:TXM) in Hornby Basin, and Cameco (TSX:CCO) in Gabon.
- JVs with Uranium One (TSX:UUU) in the Athabasca Basin (5 projects) and with Triex Minerals (TSXV:TXM) (5 projects) in the Hornby Basin, and Cameco (TSX:CCO) in Gabon plus Manica Minerals in Namibia. - 50% of 8.2 million lbs U3O8 of Inferred Resources defined on Mountain Lake property - 5,000 m of diamond drilling planned. - Athabasca: drilling completed on Darby, Candle, Gumboot and Fireweed (results pending); drilling commencing on Waterfound in Q407.CatalystsAthabasca Basin JV Properties: 2,000 m of drilling completed at Darby-Candle to test for uranium mineralization intersected in drilling and EM targets. Geochemical analysis and drilling (6,000 m) pending. Drilling also planned at Waterfound and Moon Lake in Q407.Horby Bay Basin Properties: Drilling and surface exploration program completed - results to follow in Q407; further targets yet to be drill tested.Namibia: Sampling and ground geophysics underway. Gabon: 13,352-line-km helicopter magnetic and radiometric survey completed. Field work initiated - results expected by year end.
50%
Strathmore Minerals Corp.
Ted Trueman
Pitchstone Exploration Ltd.
UEX Corp.
604-630-5563
Triex Minerals Corp.
JV with Cameco - financing exploration for uranium on Motapa Diamonds Inc.'s (TSXV:MTP) licenses in Gabon (~600,000 ha) to earn up to an 80 % participating interest (combined with Cameco). 13,352-line-km helicopter-borne horizontal gradient magnetic and radiometric survey completed. Ground geophysical and geochemical test surveys and prospecting recently completed. Results expected by year end.
Properties located in the heart of the eastern Athabasca Basin - acquired prior to the recent staking rush
Five properties including Mountain Lake - 16,424 acres - one of the most significant uranium resource in the Hornby Bay Basin
CanAlaska Uranium Ltd.
Non-brokered P Placement
Mountain Lake - Inferred Resources: 1.6 million tonnes @ 0.23% U3O8 (8.2 million lbs U3O8)
600,000 hectares in the Franceville Basin - world renowned uranium district - geologically analogous to Athabasca - Hornby
Can earn up to 80% interest in three properties from private company Manica Minerals. The properties, Nakop, Dome and Kaoko, total ~500,000 ha. Exploration in 2007 has included prospecting, sampling, magnetic interpretation, radon surveying and geophysical depth profiling. Dome is a geophysical feature similar to and 120 km southwest of the Rössing mine.
40%
Exploration Timetable
JV with Triex Minerals Corp (TSXV:TXM) - Dismal Lake, Mountain Lake, West Dismal, Kendall River, and Leith properties. Initial drilling completed at Mountain Lake (24 holes - 3,101 m). Confirmation of mineralization within main deposit extending at shallow depth to the southwest under Fran Lake (0.32% U3O8 over 2.0 m; 0.33% U3O8 over 1.5 m). New zone of weak mineralization discovered at Jenny Lake. Magnetics and electomagnetics flown at Leith Peninsula. Target delineation sampling and geophysics at Kendall River and Dismal Lake. 2,800 m of diamond drilling completed at Mountain Lake and Dismal Lake.
1 million units @ $3.00 - includes 1/2 wt @ $3.75 per full wt
JV with Uranium One (TSX:UUU) on Darby, Candle, Waterfound, Moon Lake and Lynx Lake properties; plus 100% owned Fireweed, Gumboot, Fisher, Wolverine and Marten properties. 4,987 meters drilled in nine holes at Waterfound - with seven intersecting anomalous radioactivity in proximity to unconformity, over a strike length of 1,600 meters – drilling underway. Airborne magnetic gradiometer and ground electromagnetics completed at Fireweed and Gumboot. Strong 3.6 km conductor on Gumboot - drilling completed (2,400 m) with anomalous uranium in two holes. 5,859 m drilling completed at Darby-Candle during summer program - 3.2 m averaged 0.31% U3O8 from hole CD-14 - results pending on some holes. Magnetic low identified on 100% owned Fisher property. EM surveys completed on the Lynx Lake, Darby and Fisher properties - weak conductive responses at Darby. 16,000 m drilling on various Athabasca Basin properties during 2007 will be completed. Two new properties acquired (Wolverine & Marten) east of McArthur River mine & southwest of West Bear deposit.
Three properties (Nakop, Dome and Kaoko) totalling approximately 500,000 ha
$0.00
$0.50
$1.00
$1.50
$2.00
$2.50
$3.00
$3.50
$4.00
$4.50
$5.00
Nov
-06
Dec
-06
Jan-
07
Feb-
07
Mar
-07
Apr
-07
May
-07
Jun-
07
Jul-0
7
Aug
-07
Sep
-07
Oct
-07
0.00.3
0.5
0.81.0
1
Vol
(M)
50 Day MA100 Day MA
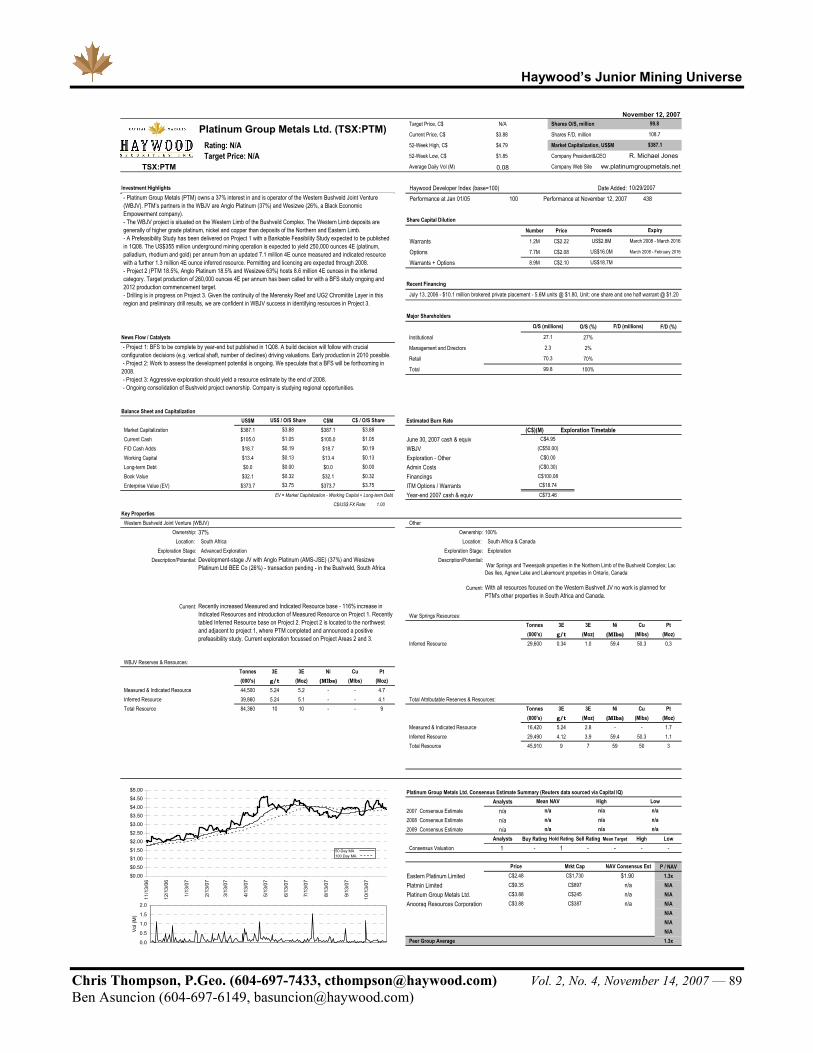
Haywood’s Junior Mining Universe
Chris Thompson, P.Geo. (604-697-7433, [email protected]) Vol. 2, No. 4, November 14, 2007 — 89 Ben Asuncion (604-697-6149, [email protected])
Target Price, C$ N/A Shares O/S, million
Current Price, C$ $3.88 Shares F/D, million
Rating: N/A 52-Week High, C$ $4.79 Market Capitalization, US$M
Target Price: N/A 52-Week Low, C$ $1.85 Company President&CEO
TSX:PTM Average Daily Vol (M) 0.08 Company Web Site
Investment Highlights Haywood Developer Index (base=100) Date Added:Performance at Jan 01/05 100 Performance at November 12, 2007 438
Share Capital Dilution
Number Price
Warrants 1.2M C$2.22
Options 7.7M C$2.08
Warrants + Options 8.9M C$2.10
Recent Financing
Major Shareholders
O/S (%) F/D (%)
News Flow / Catalysts Institutional 27%
Management and Directors 2%
Retail 70%
Total 100%
Balance Sheet and CapitalizationUS$M C$M Estimated Burn Rate
Market Capitalization $387.1 $387.1 (C$)(M) Exploration TimetableCurrent Cash $105.0 $105.0 June 30, 2007 cash & equivF/D Cash Adds $18.7 $18.7 WBJVWorking Capital $13.4 $13.4 Exploration - OtherLong-term Debt $0.0 $0.0 Admin CostsBook Value $32.1 $32.1 FinancingsEnterprise Value (EV) $373.7 $373.7 ITM Options / Warrants
EV = Market Capitalization - Working Capital + Long-term Debt Year-end 2007 cash & equivC$/US$ FX Rate: 1.00
Key PropertiesWestern Bushveld Joint Venture (WBJV) Other
Ownership: 37% Ownership: 100%Location: South Africa Location: South Africa & Canada
Exploration Stage: Advanced Exploration Exploration Stage: ExplorationDescription/Potential: Description/Potential:
Current:
Current:War Springs Resources:
Tonnes 3E 3E Ni Cu Pt(000's) g/t (Moz) (Mlbs) (Mlbs) (Moz)
Inferred Resource 29,600 0.34 1.0 59.4 50.3 0.3
WBJV Reserves & Resources:Tonnes 3E 3E Ni Cu Pt(000's) g/t (Moz) (Mlbs) (Mlbs) (Moz)
Measured & Indicated Resource 44,500 5.24 5.2 - - 4.7Inferred Resource 39,860 5.24 5.1 - - 4.1 Total Attributable Reserves & Resources:Total Resource 84,360 10 10 - - 9 Tonnes 3E 3E Ni Cu Pt
(000's) g/t (Moz) (Mlbs) (Mlbs) (Moz)Measured & Indicated Resource 16,420 5.24 2.8 - - 1.7Inferred Resource 29,490 4.12 3.9 59.4 50.3 1.1Total Resource 45,910 9 7 59 50 3
Platinum Group Metals Ltd. Consensus Estimate Summary (Reuters data sourced via Capital IQ)Analysts
2007 Consensus Estimate n/a2008 Consensus Estimate n/a2009 Consensus Estimate n/a
Analysts Buy Rating Hold Rating Sell Rating Mean Target High LowConsensus Valuation 1 - 1 - - - -
P / NAVEastern Platinum Limited 1.3xPlatmin Limited N/APlatinum Group Metals Ltd. N/AAnooraq Resources Corporation N/A
N/AN/AN/A
Peer Group Average 1.3x
$0.00 $0.00
$3.75 $3.75
$3.88$1.05 $1.05
$0.13$0.19
US$ / O/S Share C$ / O/S Share
- Project 1: BFS to be complete by year-end but published in 1Q08. A build decision will follow with crucial configuration decisions (e.g. vertical shaft, number of declines) driving valuations. Early production in 2010 possible. - Project 2: Work to assess the development potential is ongoing. We speculate that a BFS will be forthcoming in 2008. - Project 3: Aggressive exploration should yield a resource estimate by the end of 2008. - Ongoing consolidation of Bushveld project ownership. Company is studying regional opportunities.
High Lown/a n/a
n/an/a
n/a
n/an/a
n/a
War Springs and Tweespalk properties in the Northern Limb of the Bushveld Complex; Lac Des Iles, Agnew Lake and Lakemount properties in Ontario, Canada
Mrkt CapC$1,730C$897
n/a
n/a
C$9.35
NAV Consensus Est$1.90
2.3
70.3
99.8
C$4.95
F/D (millions)
Proceeds
ww.platinumgroupmetals.net
Expiry
March 2008 - February 2016
US$2.8M
US$16.0M
99.8
108.7
March 2008 - March 2016
$387.1
10/29/2007
R. Michael Jones
Platinum Group Metals Ltd. (TSX:PTM)
Price
Mean NAV
n/an/a
C$100.08
$3.88
$0.19
July 13, 2006 - $10.1 million brokered private placement - 5.6M units @ $1.80, Unit: one share and one half warrant @ $1.20
O/S (millions)
November 12, 2007
$0.32
$0.13
C$2.48
27.1
US$18.7M
Development-stage JV with Anglo Platinum (AMS-JSE) (37%) and Wesizwe Platinum Ltd BEE Co (26%) - transaction pending - in the Bushveld, South Africa
(C$0.30)C$0.00
(C$50.00)
$0.32C$18.74
With all resources focused on the Western Bushvelt JV no work is planned for PTM's other properties in South Africa and Canada.
C$73.46
C$245C$3.88C$3.88 C$387
$0.00
$0.50
$1.00$1.50
$2.00$2.50
$3.00
$3.50$4.00
$4.50
$5.00
11/1
3/06
12/1
3/06
1/13
/07
2/13
/07
3/13
/07
4/13
/07
5/13
/07
6/13
/07
7/13
/07
8/13
/07
9/13
/07
10/1
3/07
0.0
0.5
1.0
1.5
2.0
1
Vol
(M)
50 Day MA100 Day MA
Recently increased Measured and Indicated Resource base - 116% increase in Indicated Resources and introduction of Measured Resource on Project 1. Recently tabled Inferred Resource base on Project 2. Project 2 is located to the northwest and adjacent to project 1, where PTM completed and announced a positive prefeasibility study. Current exploration focussed on Project Areas 2 and 3.
- Platinum Group Metals (PTM) owns a 37% interest in and is operator of the Western Bushveld Joint Venture (WBJV). PTM’s partners in the WBJV are Anglo Platinum (37%) and Wesizwe (26%, a Black Economic Empowerment company). - The WBJV project is situated on the Western Limb of the Bushveld Complex. The Western Limb deposits are generally of higher grade platinum, nickel and copper than deposits of the Northern and Eastern Limb. - A Prefeasibility Study has been delivered on Project 1 with a Bankable Feasibility Study expected to be published in 1Q08. The US$355 million underground mining operation is expected to yield 250,000 ounces 4E (platinum, palladium, rhodium and gold) per annum from an updated 7.1 million 4E ounce measured and indicated resource with a further 1.3 million 4E ounce inferred resource. Permitting and licencing are expected through 2008. - Project 2 (PTM 18.5%, Anglo Platinum 18.5% and Wesizwe 63%) hosts 8.6 million 4E ounces in the inferred category. Target production of 260,000 ounces 4E per annum has been called for with a BFS study ongoing and 2012 production commencement target. - Drilling is in progress on Project 3. Given the continuity of the Merensky Reef and UG2 Chromitite Layer in this region and preliminary drill results, we are confident in WBJV success in identifying resources in Project 3.
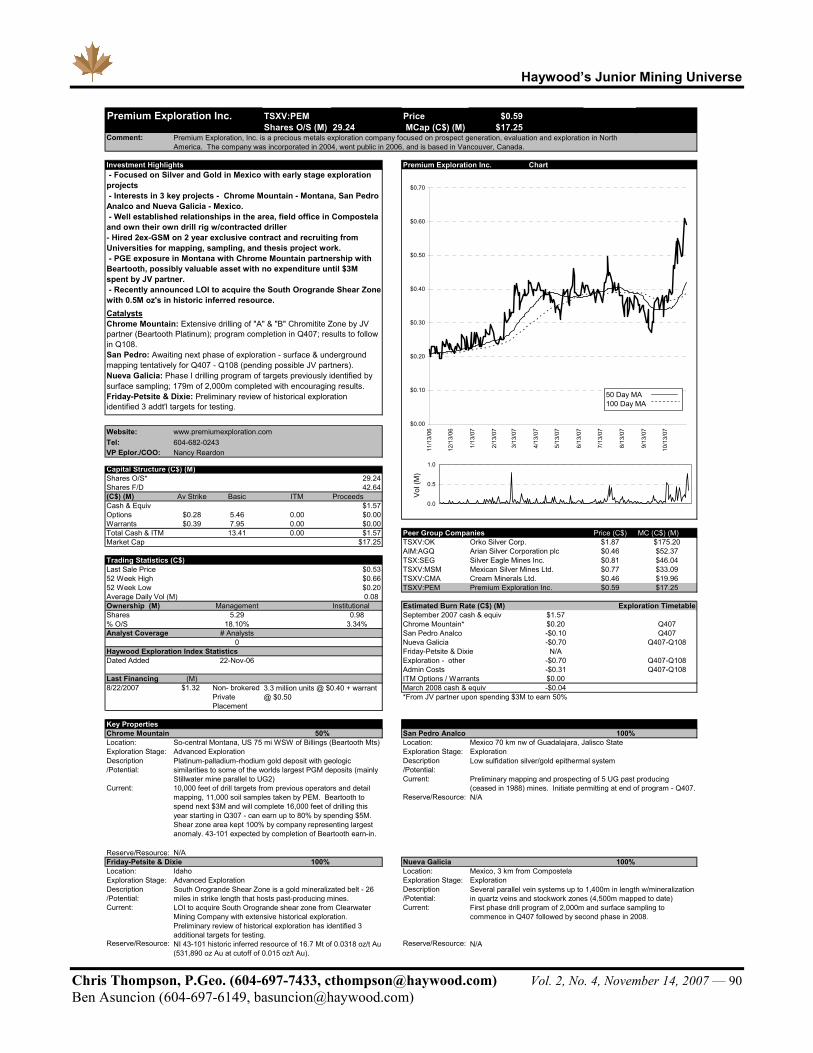
Haywood’s Junior Mining Universe
Chris Thompson, P.Geo. (604-697-7433, [email protected]) Vol. 2, No. 4, November 14, 2007 — 90 Ben Asuncion (604-697-6149, [email protected])
TSXV:PEM Price $0.59 Shares O/S (M) 29.24 MCap (C$) (M) $17.25
Comment:
11/12/2007Investment Highlights Premium Exploration Inc. Chart
39,399
Website: www.premiumexploration.comTel:VP Eplor./COO:
Capital Structure (C$) (M)Shares O/S* 29.24Shares F/D 42.64(C$) (M) Av Strike Basic ITM ProceedsCash & Equiv $1.57Options $0.28 5.46 0.00 $0.00Warrants $0.39 7.95 0.00 $0.00Total Cash & ITM 13.41 0.00 $1.57 Peer Group Companies Price (C$) MC (C$) (M)Market Cap $17.25 TSXV:OK $1.87 $175.20
AIM:AGQ $0.46 $52.37Trading Statistics (C$) TSX:SEG $0.81 $46.04Last Sale Price $0.53 TSXV:MSM $0.77 $33.0952 Week High $0.66 TSXV:CMA $0.46 $19.9652 Week Low $0.20 TSXV:PEM $0.59 $17.25Average Daily Vol (M) 0.08 Ownership (M) Management Institutional Estimated Burn Rate (C$) (M)Shares 5.29 0.98 September 2007 cash & equiv $1.57 % O/S 18.10% 3.34% Chrome Mountain* $0.20 Q407Analyst Coverage # Analysts San Pedro Analco -$0.10 Q407
0 Nueva Galicia -$0.70 Q407-Q108Haywood Exploration Index Statistics Friday-Petsite & Dixie N/ADated Added 22-Nov-06 Exploration - other -$0.70 Q407-Q108
Admin Costs -$0.31 Q407-Q108Last Financing (M) ITM Options / Warrants $0.00 8/22/2007 $1.32 March 2008 cash & equiv -$0.04
*From JV partner upon spending $3M to earn 50%
Key PropertiesChrome Mountain 50% San Pedro Analco 100% Location: So-central Montana, US 75 mi WSW of Billings (Beartooth Mts) Location: Mexico 70 km nw of Guadalajara, Jalisco StateExploration Stage: Advanced Exploration Exploration Stage: ExplorationDescription Description/Potential: /Potential:
Current:Current:
Reserve/Resource:
Reserve/Resource: N/AFriday-Petsite & Dixie 100% Nueva Galicia 100% Location: Idaho Location: Mexico, 3 km from CompostelaExploration Stage: Advanced Exploration Exploration Stage: ExplorationDescription Description/Potential: /Potential:Current: Current:
Reserve/Resource: Reserve/Resource:
Platinum-palladium-rhodium gold deposit with geologic similarities to some of the worlds largest PGM deposits (mainly Stillwater mine parallel to UG2)10,000 feet of drill targets from previous operators and detail mapping, 11,000 soil samples taken by PEM. Beartooth to spend next $3M and will complete 16,000 feet of drilling this year starting in Q307 - can earn up to 80% by spending $5M. Shear zone area kept 100% by company representing largest anomaly. 43-101 expected by completion of Beartooth earn-in.
N/A
First phase drill program of 2,000m and surface sampling to commence in Q407 followed by second phase in 2008.
South Orogrande Shear Zone is a gold mineralizated belt - 26 miles in strike length that hosts past-producing mines.LOI to acquire South Orogrande shear zone from Clearwater Mining Company with extensive historical exploration. Preliminary review of historical exploration has identified 3 additional targets for testing.NI 43-101 historic inferred resource of 16.7 Mt of 0.0318 oz/t Au (531,890 oz Au at cutoff of 0.015 oz/t Au).
Several parallel vein systems up to 1,400m in length w/mineralization in quartz veins and stockwork zones (4,500m mapped to date)
Non- brokered Private Placement
3.3 million units @ $0.40 + warrant @ $0.50
Premium Exploration Inc.
Preliminary mapping and prospecting of 5 UG past producing (ceased in 1988) mines. Initiate permitting at end of program - Q407.
Low sulfidation silver/gold epithermal system
Silver Eagle Mines Inc.Arian Silver Corporation plc
Premium Exploration Inc.
Premium Exploration, Inc. is a precious metals exploration company focused on prospect generation, evaluation and exploration in North America. The company was incorporated in 2004, went public in 2006, and is based in Vancouver, Canada.
Orko Silver Corp.
- Focused on Silver and Gold in Mexico with early stage exploration projects - Interests in 3 key projects - Chrome Mountain - Montana, San Pedro Analco and Nueva Galicia - Mexico. - Well established relationships in the area, field office in Compostela and own their own drill rig w/contracted driller- Hired 2ex-GSM on 2 year exclusive contract and recruiting from Universities for mapping, sampling, and thesis project work. - PGE exposure in Montana with Chrome Mountain partnership with Beartooth, possibly valuable asset with no expenditure until $3M spent by JV partner. - Recently announced LOI to acquire the South Orogrande Shear Zone with 0.5M oz's in historic inferred resource.C t l tCatalystsChrome Mountain: Extensive drilling of "A" & "B" Chromitite Zone by JV partner (Beartooth Platinum); program completion in Q407; results to follow in Q108.San Pedro: Awaiting next phase of exploration - surface & underground mapping tentatively for Q407 - Q108 (pending possible JV partners).Nueva Galicia: Phase I drilling program of targets previously identified by surface sampling; 179m of 2,000m completed with encouraging results.Friday-Petsite & Dixie: Preliminary review of historical exploration identified 3 addt'l targets for testing.
604-682-0243
Mexican Silver Mines Ltd.
N/A
Exploration Timetable
Cream Minerals Ltd.
Nancy Reardon
$0.00
$0.10
$0.20
$0.30
$0.40
$0.50
$0.60
$0.70
11/1
3/06
12/1
3/06
1/13
/07
2/13
/07
3/13
/07
4/13
/07
5/13
/07
6/13
/07
7/13
/07
8/13
/07
9/13
/07
10/1
3/07
0.0
0.5
1.0
1
Vol
(M)
50 Day MA100 Day MA
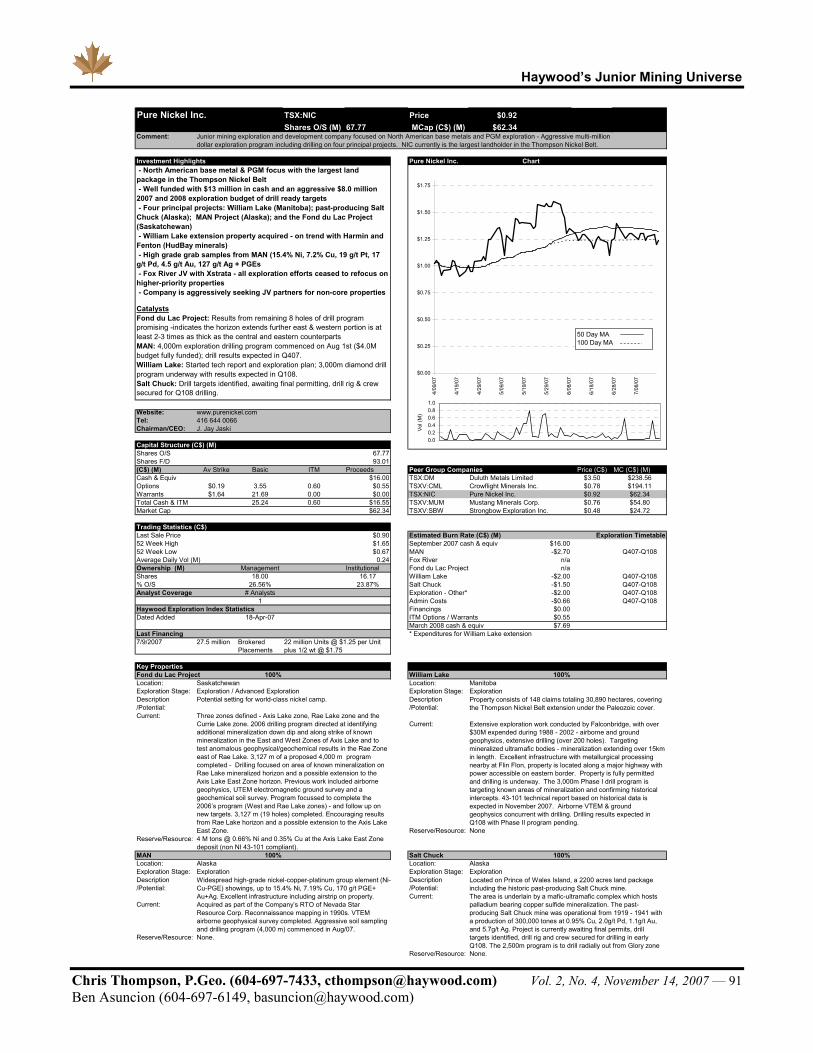
Haywood’s Junior Mining Universe
Chris Thompson, P.Geo. (604-697-7433, [email protected]) Vol. 2, No. 4, November 14, 2007 — 91 Ben Asuncion (604-697-6149, [email protected])
TSX:NIC Price $0.92 Shares O/S (M) 67.77 MCap (C$) (M) $62.34
Comment:
11/12/2007Investment Highlights Pure Nickel Inc. Chart
Website: www.purenickel.comTel:Chairman/CEO:
Capital Structure (C$) (M)Shares O/S 67.77Shares F/D 93.01(C$) (M) Av Strike Basic ITM Proceeds Peer Group Companies Price (C$) MC (C$) (M)Cash & Equiv $16.00 TSX:DM $3.50 $238.56Options $0.19 3.55 0.60 $0.55 TSXV:CML $0.78 $194.11Warrants $1.64 21.69 0.00 $0.00 TSX:NIC $0.92 $62.34Total Cash & ITM 25.24 0.60 $16.55 TSXV:MUM $0.76 $54.80Market Cap $62.34 TSXV:SBW $0.48 $24.72
Trading Statistics (C$) Last Sale Price $0.90 Estimated Burn Rate (C$) (M)52 Week High $1.65 September 2007 cash & equiv $16.00 52 Week Low $0.67 MAN -$2.70 Q407-Q108Average Daily Vol (M) 0.24 Fox River n/a Ownership (M) Management Institutional Fond du Lac Project n/a Shares 18.00 16.17 William Lake -$2.00 Q407-Q108% O/S 26.56% 23.87% Salt Chuck -$1.50 Q407-Q108Analyst Coverage # Analysts Exploration - Other* -$2.00 Q407-Q108
1 Admin Costs -$0.66 Q407-Q108Haywood Exploration Index Statistics Financings $0.00 Dated Added 18-Apr-07 ITM Options / Warrants $0.55
March 2008 cash & equiv $7.69 Last Financing * Expenditures for William Lake extension7/9/2007 27.5 million
Key Properties Key PropertiesFond du Lac Project 100% William Lake 100%Location: Saskatchewan Location: ManitobaExploration Stage: Exploration / Advanced Exploration Exploration Stage: ExplorationDescription Potential setting for world-class nickel camp. Description/Potential: /Potential:Current:
Current:
Reserve/Resource: NoneReserve/Resource: MAN 100% Salt Chuck 100%Location: Alaska Location: AlaskaExploration Stage: Exploration Exploration Stage: ExplorationDescription Description/Potential: /Potential:
Current:Current:
Reserve/Resource: None. Reserve/Resource: None.
Crowflight Minerals Inc.
Brokered Placements
22 million Units @ $1.25 per Unit plus 1/2 wt @ $1.75
Strongbow Exploration Inc.Mustang Minerals Corp.Pure Nickel Inc.
Extensive exploration work conducted by Falconbridge, with over $30M expended during 1988 - 2002 - airborne and ground geophysics, extensive drilling (over 200 holes). Targeting mineralized ultramafic bodies - mineralization extending over 15km in length. Excellent infrastructure with metallurgical processing nearby at Flin Flon, property is located along a major highway with power accessible on eastern border. Property is fully permitted and drilling is underway. The 3,000m Phase I drill program is targeting known areas of mineralization and confirming historical intercepts. 43-101 technical report based on historical data is expected in November 2007. Airborne VTEM & ground geophysics concurrent with drilling. Drilling results expected in Q108 with Phase II program pending.
Three zones defined - Axis Lake zone, Rae Lake zone and the Currie Lake zone. 2006 drilling program directed at identifying additional mineralization down dip and along strike of known mineralization in the East and West Zones of Axis Lake and to test anomalous geophysical/geochemical results in the Rae Zone east of Rae Lake. 3,127 m of a proposed 4,000 m program completed - Drilling focused on area of known mineralization on Rae Lake mineralized horizon and a possible extension to the Axis Lake East Zone horizon. Previous work included airborne geophysics, UTEM electromagnetic ground survey and a geochemical soil survey. Program focussed to complete the 2006’s program (West and Rae Lake zones) - and follow up on new targets. 3,127 m (19 holes) completed. Encouraging results from Rae Lake horizon and a possible extension to the Axis Lake East Zone.
Property consists of 148 claims totaling 30,890 hectares, covering the Thompson Nickel Belt extension under the Paleozoic cover.
Duluth Metals Limited
Pure Nickel Inc.
Junior mining exploration and development company focused on North American base metals and PGM exploration - Aggressive multi-million dollar exploration program including drilling on four principal projects. NIC currently is the largest landholder in the Thompson Nickel Belt.
J. Jay Jaski416 644 0066
- North American base metal & PGM focus with the largest land package in the Thompson Nickel Belt - Well funded with $13 million in cash and an aggressive $8.0 million 2007 and 2008 exploration budget of drill ready targets - Four principal projects: William Lake (Manitoba); past-producing Salt Chuck (Alaska); MAN Project (Alaska); and the Fond du Lac Project (Saskatchewan) - William Lake extension property acquired - on trend with Harmin and Fenton (HudBay minerals) - High grade grab samples from MAN (15.4% Ni, 7.2% Cu, 19 g/t Pt, 17 g/t Pd, 4.5 g/t Au, 127 g/t Ag + PGEs - Fox River JV with Xstrata - all exploration efforts ceased to refocus on higher-priority properties - Company is aggressively seeking JV partners for non-core propertiesCatalystsCatalystsFond du Lac Project: Results from remaining 8 holes of drill program promising -indicates the horizon extends further east & western portion is at least 2-3 times as thick as the central and eastern counterpartsMAN: 4,000m exploration drilling program commenced on Aug 1st ($4.0M budget fully funded); drill results expected in Q407.William Lake: Started tech report and exploration plan; 3,000m diamond drill program underway with results expected in Q108.Salt Chuck: Drill targets identified, awaiting final permitting, drill rig & crew secured for Q108 drilling.
Acquired as part of the Company’s RTO of Nevada Star Resource Corp. Reconnaissance mapping in 1990s. VTEM airborne geophysical survey completed. Aggressive soil sampling and drilling program (4,000 m) commenced in Aug/07.
Widespread high-grade nickel-copper-platinum group element (Ni-Cu-PGE) showings, up to 15.4% Ni, 7.19% Cu, 170 g/t PGE+ Au+Ag. Excellent infrastructure including airstrip on property.
Located on Prince of Wales Island, a 2200 acres land package including the historic past-producing Salt Chuck mine.
4 M tons @ 0.66% Ni and 0.35% Cu at the Axis Lake East Zone deposit (non NI 43-101 compliant).
Exploration Timetable
The area is underlain by a mafic-ultramafic complex which hosts palladium bearing copper sulfide mineralization. The past-producing Salt Chuck mine was operational from 1919 - 1941 with a production of 300,000 tones at 0.95% Cu, 2.0g/t Pd, 1.1g/t Au, and 5.7g/t Ag. Project is currently awaiting final permits, drill targets identified, drill rig and crew secured for drilling in early Q108. The 2,500m program is to drill radially out from Glory zone
$0.00
$0.25
$0.50
$0.75
$1.00
$1.25
$1.50
$1.75
4/09
/07
4/19
/07
4/29
/07
5/09
/07
5/19
/07
5/29
/07
6/08
/07
6/18
/07
6/28
/07
7/08
/07
0.00.20.40.60.81.0
1
Vol
(M)
50 Day MA100 Day MA
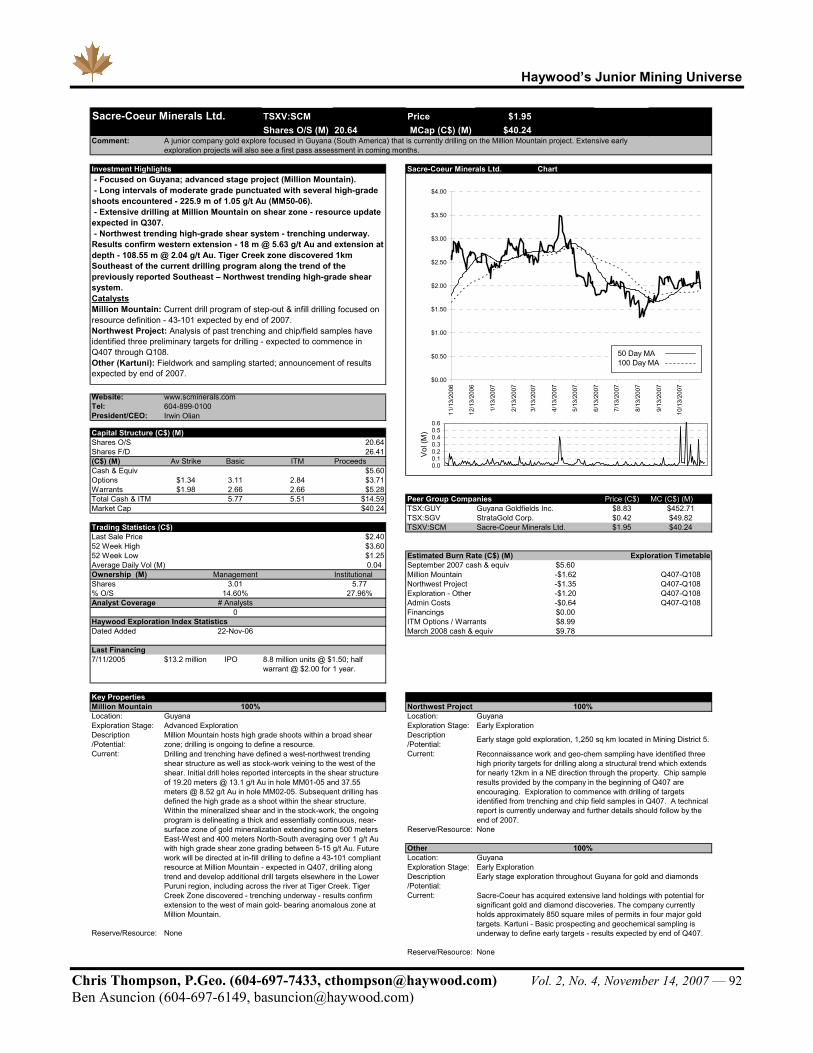
Haywood’s Junior Mining Universe
Chris Thompson, P.Geo. (604-697-7433, [email protected]) Vol. 2, No. 4, November 14, 2007 — 92 Ben Asuncion (604-697-6149, [email protected])
TSXV:SCM Price $1.95 Shares O/S (M) 20.64 MCap (C$) (M) $40.24
Comment:
11/12/2007Investment Highlights Sacre-Coeur Minerals Ltd. Chart
Website: www.scminerals.comTel:President/CEO:
Capital Structure (C$) (M)Shares O/S 20.64Shares F/D 26.41(C$) (M) Av Strike Basic ITM ProceedsCash & Equiv $5.60Options $1.34 3.11 2.84 $3.71Warrants $1.98 2.66 2.66 $5.28Total Cash & ITM 5.77 5.51 $14.59 Peer Group Companies Price (C$) MC (C$) (M)Market Cap $40.24 TSX:GUY $8.83 $452.71
TSX:SGV $0.42 $49.82Trading Statistics (C$) TSXV:SCM $1.95 $40.24Last Sale Price $2.4052 Week High $3.6052 Week Low $1.25 Estimated Burn Rate (C$) (M)Average Daily Vol (M) 0.04 September 2007 cash & equiv $5.60 Ownership (M) Management Institutional Million Mountain -$1.62 Q407-Q108Shares 3.01 5.77 Northwest Project -$1.35 Q407-Q108% O/S 14.60% 27.96% Exploration - Other -$1.20 Q407-Q108Analyst Coverage # Analysts Admin Costs -$0.64 Q407-Q108
0 Financings $0.00 Haywood Exploration Index Statistics ITM Options / Warrants $8.99 Dated Added 22-Nov-06 March 2008 cash & equiv $9.78
Last Financing7/11/2005 $13.2 million IPO
Key PropertiesMillion Mountain 100% Northwest Project 100%Location: Guyana Location: GuyanaExploration Stage: Advanced Exploration Exploration Stage: Early ExplorationDescription Description/Potential: /Potential:Current: Current:
Reserve/Resource: None
Other 100%Location: GuyanaExploration Stage: Early ExplorationDescription Early stage exploration throughout Guyana for gold and diamonds/Potential:
Current:
Reserve/Resource: None
Reserve/Resource: None
Sacre-Coeur Minerals Ltd.
A junior company gold explore focused in Guyana (South America) that is currently drilling on the Million Mountain project. Extensive early exploration projects will also see a first pass assessment in coming months.
Irwin Olian
Guyana Goldfields Inc.
604-899-0100
StrataGold Corp.
Exploration Timetable
Reconnaissance work and geo-chem sampling have identified three high priority targets for drilling along a structural trend which extends for nearly 12km in a NE direction through the property. Chip sample results provided by the company in the beginning of Q407 are encouraging. Exploration to commence with drilling of targets identified from trenching and chip field samples in Q407. A technical report is currently underway and further details should follow by the end of 2007.
Drilling and trenching have defined a west-northwest trending shear structure as well as stock-work veining to the west of the shear. Initial drill holes reported intercepts in the shear structure of 19.20 meters @ 13.1 g/t Au in hole MM01-05 and 37.55 meters @ 8.52 g/t Au in hole MM02-05. Subsequent drilling has defined the high grade as a shoot within the shear structure. Within the mineralized shear and in the stock-work, the ongoing program is delineating a thick and essentially continuous, near-surface zone of gold mineralization extending some 500 meters East-West and 400 meters North-South averaging over 1 g/t Au with high grade shear zone grading between 5-15 g/t Au. Future work will be directed at in-fill drilling to define a 43-101 compliant resource at Million Mountain - expected in Q407, drilling along trend and develop additional drill targets elsewhere in the Lower Puruni region, including across the river at Tiger Creek. Tiger Creek Zone discovered - trenching underway - results confirm extension to the west of main gold- bearing anomalous zone at Million Mountain.
- Focused on Guyana; advanced stage project (Million Mountain). - Long intervals of moderate grade punctuated with several high-grade shoots encountered - 225.9 m of 1.05 g/t Au (MM50-06). - Extensive drilling at Million Mountain on shear zone - resource update expected in Q307. - Northwest trending high-grade shear system - trenching underway. Results confirm western extension - 18 m @ 5.63 g/t Au and extension at depth - 108.55 m @ 2.04 g/t Au. Tiger Creek zone discovered 1km Southeast of the current drilling program along the trend of the previously reported Southeast – Northwest trending high-grade shear system.CatalystsMillion Mountain: Current drill program of step-out & infill drilling focused on resource definition - 43-101 expected by end of 2007.Northwest Project: Analysis of past trenching and chip/field samples have identified three preliminary targets for drilling - expected to commence in Q407 through Q108.Other (Kartuni): Fieldwork and sampling started; announcement of results expected by end of 2007.
Early stage gold exploration, 1,250 sq km located in Mining District 5.Million Mountain hosts high grade shoots within a broad shear zone; drilling is ongoing to define a resource.
8.8 million units @ $1.50; half warrant @ $2.00 for 1 year.
Sacre-Coeur Minerals Ltd.
Sacre-Coeur has acquired extensive land holdings with potential for significant gold and diamond discoveries. The company currently holds approximately 850 square miles of permits in four major gold targets. Kartuni - Basic prospecting and geochemical sampling is underway to define early targets - results expected by end of Q407.
$0.00
$0.50
$1.00
$1.50
$2.00
$2.50
$3.00
$3.50
$4.00
11/1
3/20
06
12/1
3/20
06
1/13
/200
7
2/13
/200
7
3/13
/200
7
4/13
/200
7
5/13
/200
7
6/13
/200
7
7/13
/200
7
8/13
/200
7
9/13
/200
7
10/1
3/20
07
0.00.10.20.30.40.50.6
1
Vol
(M)
50 Day MA100 Day MA
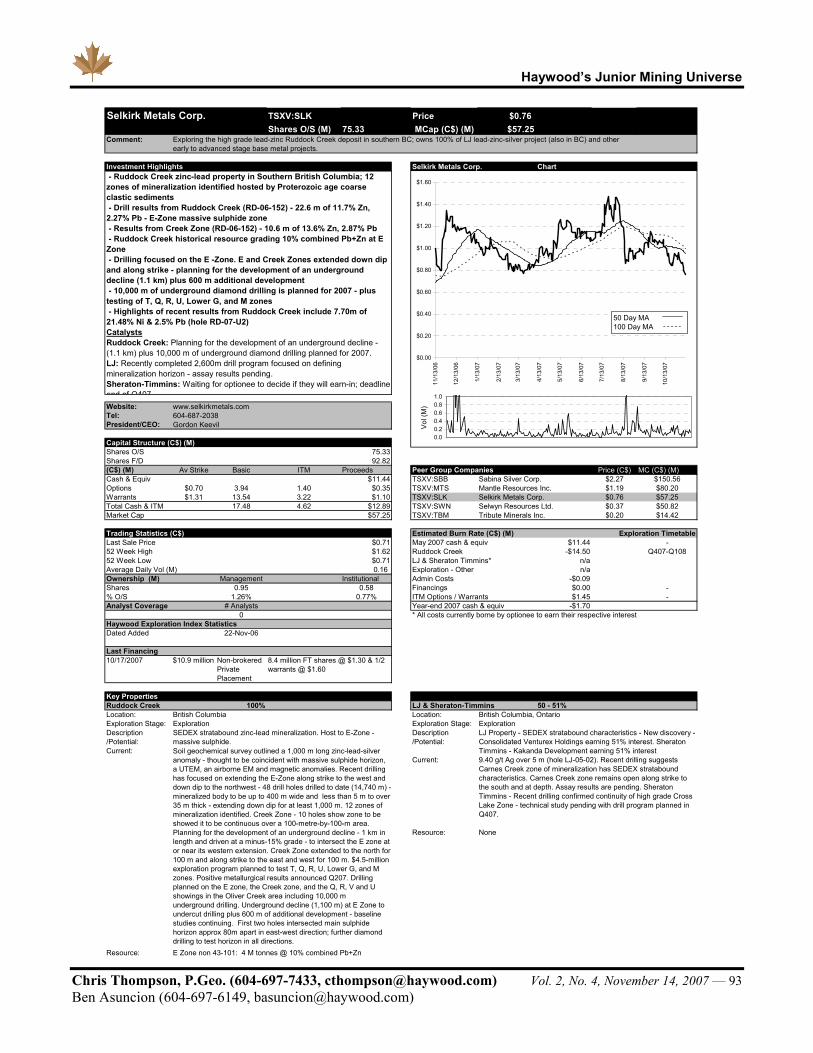
Haywood’s Junior Mining Universe
Chris Thompson, P.Geo. (604-697-7433, [email protected]) Vol. 2, No. 4, November 14, 2007 — 93 Ben Asuncion (604-697-6149, [email protected])
TSXV:SLK Price $0.76 Shares O/S (M) 75.33 MCap (C$) (M) $57.25
Comment:
11/12/2007Investment Highlights Selkirk Metals Corp. Chart
Website: www.selkirkmetals.comTel:President/CEO:
Capital Structure (C$) (M)Shares O/S 75.33Shares F/D 92.82(C$) (M) Av Strike Basic ITM Proceeds Peer Group Companies Price (C$) MC (C$) (M)Cash & Equiv $11.44 TSXV:SBB $2.27 $150.56Options $0.70 3.94 1.40 $0.35 TSXV:MTS $1.19 $80.20Warrants $1.31 13.54 3.22 $1.10 TSXV:SLK $0.76 $57.25Total Cash & ITM 17.48 4.62 $12.89 TSXV:SWN $0.37 $50.82Market Cap $57.25 TSXV:TBM $0.20 $14.42
Trading Statistics (C$) Estimated Burn Rate (C$) (M)Last Sale Price $0.71 May 2007 cash & equiv $11.44 - 52 Week High $1.62 Ruddock Creek -$14.50 Q407-Q10852 Week Low $0.71 LJ & Sheraton Timmins* n/aAverage Daily Vol (M) 0.16 Exploration - Other n/aOwnership (M) Management Institutional Admin Costs -$0.09 Shares 0.95 0.58 Financings $0.00 - % O/S 1.26% 0.77% ITM Options / Warrants $1.45 - Analyst Coverage # Analysts Year-end 2007 cash & equiv -$1.70
0 * All costs currently borne by optionee to earn their respective interestHaywood Exploration Index StatisticsDated Added 22-Nov-06
Last Financing10/17/2007 $10.9 million
Key Properties Ruddock Creek 100% LJ & Sheraton-Timmins 50 - 51%Location: British Columbia Location: British Columbia, Ontario Exploration Stage: Exploration Exploration Stage: ExplorationDescription Description/Potential: /Potential:Current:
Current:
Resource: None
Resource: E Zone non 43-101: 4 M tonnes @ 10% combined Pb+Zn
underground drilling. Underground decline (1,100 m) at E Zone to undercut drilling plus 600 m of additional development - baseline studies continuing. First two holes intersected main sulphide horizon approx 80m apart in east-west direction; further diamond drilling to test horizon in all directions.
Selkirk Metals Corp.
Exploring the high grade lead-zinc Ruddock Creek deposit in southern BC; owns 100% of LJ lead-zinc-silver project (also in BC) and other early to advanced stage base metal projects.
8.4 million FT shares @ $1.30 & 1/2 warrants @ $1.60
Exploration Timetable
Non-brokered Private Placement
LJ Property - SEDEX stratabound characteristics - New discovery - Consolidated Venturex Holdings earning 51% interest. Sheraton Timmins - Kakanda Development earning 51% interest
Gordon Keevil 604-687-2038
- Ruddock Creek zinc-lead property in Southern British Columbia; 12 zones of mineralization identified hosted by Proterozoic age coarse clastic sediments - Drill results from Ruddock Creek (RD-06-152) - 22.6 m of 11.7% Zn, 2.27% Pb - E-Zone massive sulphide zone - Results from Creek Zone (RD-06-152) - 10.6 m of 13.6% Zn, 2.87% Pb - Ruddock Creek historical resource grading 10% combined Pb+Zn at E Zone - Drilling focused on the E -Zone. E and Creek Zones extended down dip and along strike - planning for the development of an underground decline (1.1 km) plus 600 m additional development - 10,000 m of underground diamond drilling is planned for 2007 - plus testing of T, Q, R, U, Lower G, and M zones - Highlights of recent results from Ruddock Creek include 7.70m of 21.48% Ni & 2.5% Pb (hole RD-07-U2)CatalystsRuddock Creek: Planning for the development of an underground decline - (1.1 km) plus 10,000 m of underground diamond drilling planned for 2007.LJ: Recently completed 2,600m drill program focused on defining mineralization horizon - assay results pending.Sheraton-Timmins: Waiting for optionee to decide if they will earn-in; deadline end of Q407
9.40 g/t Ag over 5 m (hole LJ-05-02). Recent drilling suggests Carnes Creek zone of mineralization has SEDEX stratabound characteristics. Carnes Creek zone remains open along strike to the south and at depth. Assay results are pending. Sheraton Timmins - Recent drilling confirmed continuity of high grade Cross Lake Zone - technical study pending with drill program planned in Q407.
SEDEX stratabound zinc-lead mineralization. Host to E-Zone - massive sulphide.
Sabina Silver Corp.Mantle Resources Inc.Selkirk Metals Corp.Selwyn Resources Ltd.Tribute Minerals Inc.
Soil geochemical survey outlined a 1,000 m long zinc-lead-silver anomaly - thought to be coincident with massive sulphide horizon, a UTEM, an airborne EM and magnetic anomalies. Recent drilling has focused on extending the E-Zone along strike to the west and down dip to the northwest - 48 drill holes drilled to date (14,740 m) - mineralized body to be up to 400 m wide and less than 5 m to over 35 m thick - extending down dip for at least 1,000 m. 12 zones of mineralization identified. Creek Zone - 10 holes show zone to be showed it to be continuous over a 100-metre-by-100-m area. Planning for the development of an underground decline - 1 km in length and driven at a minus-15% grade - to intersect the E zone at or near its western extension. Creek Zone extended to the north for 100 m and along strike to the east and west for 100 m. $4.5-million exploration program planned to test T, Q, R, U, Lower G, and M zones. Positive metallurgical results announced Q207. Drilling planned on the E zone, the Creek zone, and the Q, R, V and U showings in the Oliver Creek area including 10,000 m
$0.00
$0.20
$0.40
$0.60
$0.80
$1.00
$1.20
$1.40
$1.60
11/1
3/06
12/1
3/06
1/13
/07
2/13
/07
3/13
/07
4/13
/07
5/13
/07
6/13
/07
7/13
/07
8/13
/07
9/13
/07
10/1
3/07
0.00.20.40.60.81.0
1
Vol
(M)
50 Day MA100 Day MA
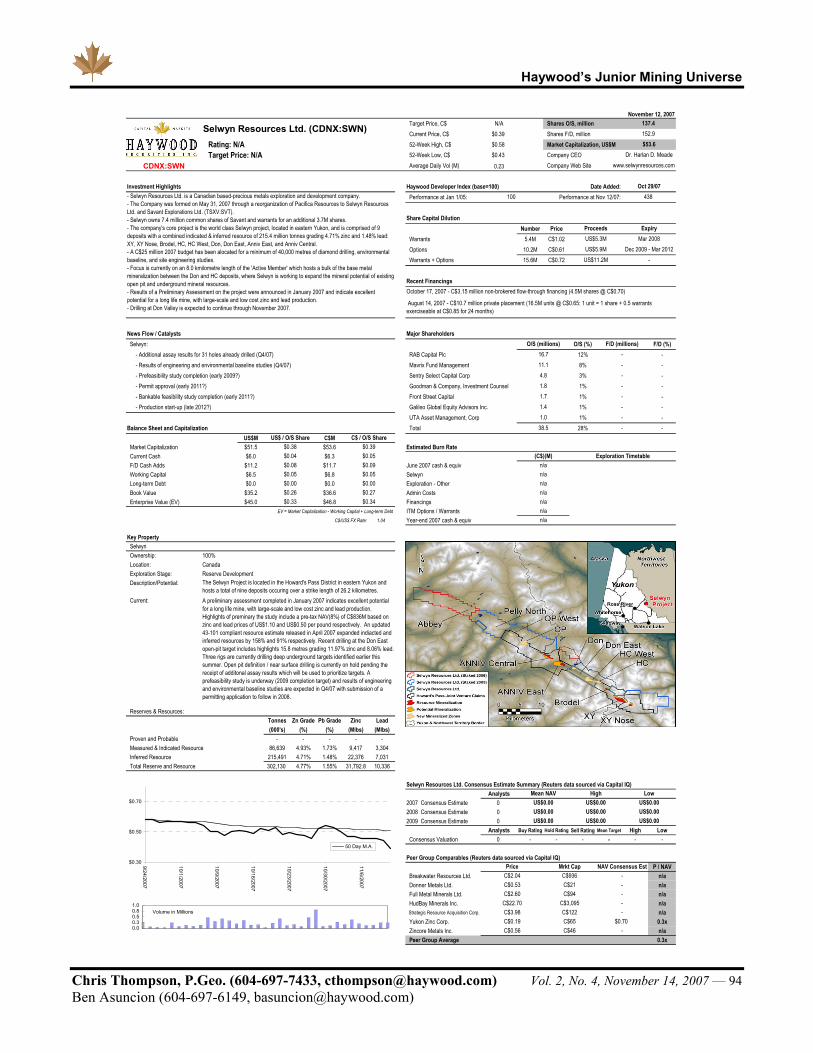
Haywood’s Junior Mining Universe
Chris Thompson, P.Geo. (604-697-7433, [email protected]) Vol. 2, No. 4, November 14, 2007 — 94 Ben Asuncion (604-697-6149, [email protected])
Target Price, C$ N/A Shares O/S, millionCurrent Price, C$ $0.39 Shares F/D, million
Rating: N/A 52-Week High, C$ $0.58 Market Capitalization, US$M Target Price: N/A 52-Week Low, C$ $0.43 Company CEO
CDNX:SWN Average Daily Vol (M) 0.23 Company Web Site
Investment Highlights Haywood Developer Index (base=100) Date Added:Performance at Jan 1/05: Performance at Nov 12/07:
Share Capital DilutionNumber Price
Warrants 5.4M C$1.02Options 10.2M C$0.61Warrants + Options 15.6M C$0.72
Recent Financings
News Flow / Catalysts Major ShareholdersSelwyn: O/S (%) F/D (%)
- Additional assay results for 31 holes already drilled (Q4/07) RAB Capital Plc 12% -- Results of engineering and environmental baseline studies (Q4/07) Mavrix Fund Management 8% -- Prefeasibility study completion (early 2009?) Sentry Select Capital Corp 3% -- Permit approval (early 2011?) Goodman & Company, Investment Counsel 1% -- Bankable feasibility study completion (early 2011?) Front Street Capital 1% -- Production start-up (late 2012?) Galileo Global Equity Advisors Inc. 1% -
UTA Asset Management, Corp 1% -Balance Sheet and Capitalization Total 28% -
US$M C$MMarket Capitalization $51.5 $53.6 Estimated Burn RateCurrent Cash $6.0 $6.3F/D Cash Adds $11.2 $11.7 June 2007 cash & equivWorking Capital $6.5 $6.8 SelwynLong-term Debt $0.0 $0.0 Exploration - OtherBook Value $35.2 $36.6 Admin CostsEnterprise Value (EV) $45.0 $46.8 Financings
EV = Market Capitalization - Working Capital + Long-term Debt ITM Options / WarrantsC$/US$ FX Rate: 1.04 Year-end 2007 cash & equiv
Key PropertySelwynOwnership: 100%Location: CanadaExploration Stage: Reserve DevelopmentDescription/Potential:
Current:
Reserves & Resources:Tonnes Zn Grade Pb Grade Zinc Lead(000's) (%) (%) (Mlbs) (Mlbs)
Proven and Probable - - - - -Measured & Indicated Resource 86,639 4.93% 1.73% 9,417 3,304Inferred Resource 215,491 4.71% 1.48% 22,376 7,031Total Reserve and Resource 302,130 4.77% 1.55% 31,792.8 10,336
Selwyn Resources Ltd. Consensus Estimate Summary (Reuters data sourced via Capital IQ)Analysts
2007 Consensus Estimate 02008 Consensus Estimate 02009 Consensus Estimate 0
Analysts Buy Rating Hold Rating Sell Rating Mean Target High LowConsensus Valuation 0 - - - - - -
Peer Group Comparables (Reuters data sourced via Capital IQ)P / NAV
Breakwater Resources Ltd. n/aDonner Metals Ltd. n/aFull Metal Minerals Ltd. n/aHudBay Minerals Inc. n/aStrategic Resource Acquisition Corp. n/aYukon Zinc Corp. 0.3xZincore Metals Inc. n/aPeer Group Average 0.3x
100 438
C$0.56C$0.19
C$2.60
Mrkt CapC$936C$21C$94
C$3,095
US$11.2M
October 17, 2007 - C$3.15 million non-brokered flow-through financing (4.5M shares @ C$0.70)
-
O/S (millions)
4.8
-
11.1 -
August 14, 2007 - C$10.7 million private placement (16.5M units @ C$0.65: 1 unit = 1 share + 0.5 warrants exerciseable at C$0.85 for 24 months)
-
F/D (millions)16.7 -
C$22.70
1.038.5
--
1.8 -1.7
C$0.53
-1.4
(C$)(M) Exploration Timetablen/an/a
November 12, 2007
$0.34
$0.00
C$2.04
- Selwyn Resources Ltd. is a Canadian based-precious metals exploration and development company. - The Company was formed on May 31, 2007 through a reorganization of Pacifica Resources to Selwyn Resources Ltd. and Savant Explorations Ltd. (TSXV:SVT).- Selwyn owns 7.4 million common shares of Savant and warrants for an additional 3.7M shares.- The company's core project is the world class Selwyn project, located in eastern Yukon, and is comprised of 9 deposits with a combined indicated & inferred resource of 215.4 million tonnes grading 4.71% zinc and 1.48% lead: XY, XY Nose, Brodel, HC, HC West, Don, Don East, Anniv East, and Anniv Central.- A C$25 million 2007 budget has been alocated for a minimum of 40,000 metres of diamond drilling, environmental baseline, and site engineering studies. - Focus is currently on an 8.0 kmilometre length of the 'Active Member' which hosts a bulk of the base metal mineralization between the Don and HC deposits, where Selwyn is working to expand the mineral potential of existing open pit and underground mineral resources.- Results of a Preliminary Assessment on the project were announced in January 2007 and indicate excellentpotential for a long life mine, with large-scale and low cost zinc and lead production.- Drilling at Don Valley is expected to continue through November 2007.
Selwyn Resources Ltd. (CDNX:SWN)
US$ / O/S Share C$ / O/S Share
Price
Mean NAV
US$0.00US$0.00
n/a
$0.05
$0.05
n/a
n/a
137.4152.9
Mar 2008
$53.6
Oct 29/07
Dr. Harlan D. Meade
Proceeds
www.selwynresources.com
Expiry
Dec 2009 - Mar 2012US$5.3MUS$5.9M
$0.39
$0.09
$0.27
$0.38$0.04$0.08$0.05
$0.70
$0.00$0.26$0.33
C$3.98
n/a
n/a
--
-
-
The Selwyn Project is located in the Howard's Pass District in eastern Yukon and hosts a total of nine deposits occuring over a strike length of 26.2 kiliometres.A preliminary assessment completed in January 2007 indicates excellent potential for a long life mine, with large-scale and low cost zinc and lead production. Highlights of preminary the study include a pre-tax NAV(8%) of C$836M based on zinc and lead prices of US$1.10 and US$0.50 per pound respectively. An updated 43-101 compliant resource estimate released in April 2007 expanded indiacted and inferred resources by 158% and 91% respectively. Recent drilling at the Don East open-pit target includes highlights 15.8 metres grading 11.97% zinc and 8.06% lead. Three rigs are currently drilling deep underground targets identified earlier this summer. Open pit definition / near surface drilling is currently on hold pending the receipt of additonal assay results which will be used to prioritize targets. A prefeasibility study is underway (2009 completion target) and results of engineering and environmental baseline studies are expected in Q4/07 with submission of a permitting application to follow in 2008.
US$0.00US$0.00US$0.00
US$0.00 US$0.00 US$0.00US$0.00
-
High Low
C$122C$65C$46
NAV Consensus Est-
$0.30
$0.50
$0.70
9/24/2007
10/1/2007
10/9/2007
10/16/2007
10/23/2007
10/30/2007
11/6/2007
50 Day M.A.
Volume in Millions
0.00.30.50.81.0

Haywood’s Junior Mining Universe
Chris Thompson, P.Geo. (604-697-7433, [email protected]) Vol. 2, No. 4, November 14, 2007 — 95 Ben Asuncion (604-697-6149, [email protected])
TSXV:SRM Price $0.50 Shares O/S (M) 77.91 MCap (C$) (M) $38.95
Comment:
11/12/2007Investment Highlights Shear Minerals Ltd. Chart
Website: www.shearminerals.comTel:President/CEO:
Capital Structure (C$) (M)Shares O/S 77.91Shares F/D 85.46(C$) (M) Av Strike Basic ITM ProceedsCash & Equiv $2.00Options $0.60 4.45 2.04 $0.72 Peer Group Companies Price (C$) MC (C$) (M)Warrants $0.85 2.70 0.00 $0.00 TSX:SWY $0.72 $143.22Total Cash & ITM 7.15 2.04 $2.72 TSXV:DSP $0.33 $49.90Market Cap $38.95 TSX:PGD $0.95 $48.59
TSXV:DDN $0.76 $40.01Trading Statistics (C$) TSXV:SRM $0.50 $38.95Last Sale Price $0.56 TSXV:IME $0.23 $13.7952 Week High $1.4552 Week Low $0.37 Average Daily Vol (M) 0.16 Estimated Burn Rate (C$) (M)Ownership (M) Management Institutional September 2007 cash & equiv $2.00 Shares 6.17 4.06 Churchill* -$1.00 Q407% O/S 7.92% 5.21% Afridi Lake n/a Analyst Coverage # Analysts Sakari n/a
0 Exploration - General -$0.50 Q407Haywood Exploration Index Statistics Admin Costs -$0.18 Dated Added 22-Nov-06 Financings $0.00
ITM Options / Warrants $0.72 Last Financing Year-end 2007 cash & equiv $1.04 6/12/2007 $6 million Note*: Total 2007 exploration budgets $8.5 million at Churchill
Key Properties Churchill 58% Afridi Lake 58%Location: Nunavut Location: NW TerritoriesExploration Stage: Exploration Exploration Stage: ExplorationDescription Description/Potential: /Potential:
Current:
Sakari 50%Location: Nunavut Exploration Stage: Exploration
Description /Potential:
Discovery of 79 kimberlites including Notch, Jigsaw, PST003, Meeka, two unamed, and Kahuna dike-like kimberlites. Recovered macro and micro diamonds from the kimberlites.
Brokered Private Placement
4.55 million FT shares @ $0.88 & 2.67 million units @ $0.75 - incl 1/2 wt @ $0.95
Bedrock source for the diamondiferous till samples identified - Notch kimberlite, Sedna Corridor (0.82 cpt from 5.43 tonne); Jigsaw kimberlite, Sedna Corridor (0.49 cpt from 5.2 tonne sample); PST003 kimberlite, Sedna Corridor (2.18 cpt from 3.55 tonne sample); Kahuna dike-like kimberlite, Josephine Corridor (1.11 cpt from 3.13 tonne sample), Meeka (19 daimonds recovered from 15kg till sample). Currently mini-bulk testing kimberlite dikes to recover 200 carats. Core drilling planned to assess size and tonnage. Partial results released from bulk sampling of Kahuna - 93.5 carats recovered from 107 dry tons (out of 400-ton bulk sample). 2007 exploration summary: geophysical surveying, till sampling, 51 auger drill holes, 64 DC holes drilled (4,666m) and 31 new kimberlites discovered - results pending.
Pamela Strand
Exploration Timetable
Indicator Minerals Inc.
Shear Minerals Ltd.
Kimberlite discovery track record at Churchill: 79 kimberlites discovered / macrodiamonds recovered. With encouraging results from Churchill, Shear represents an entry point into the diamond sector through a junior with grass roots discovery potential.
- 79 kimberlites discovered at Churchill including Notch, Jigsaw, PST003, Meeka, and Kahuna dike-like kimberlites. Two additional kimberlites in the Sedna Corridor have yet to be named. - On-site indicator mineral processing facility at Churchill. - Significant numbers of micro and macro diamonds recovered from four kimberlites. - 3.1 tonnes of Kahuna kimberlite processed - 1.1 ct/tonne; 5.4 tonnes of Notch kimberlite processed - 0.7 ct/tonne; 3.5 tonnes of PST-003 kimberlite processed - 2.04 ct/tonne. - Aggressive exploration program to recover at least 200 carats of diamonds from its main Churchill dikes - up to 500-tonne bulk sample. - Encouraging kimberlite indicator dispersion plume at Stella Polaris project in Saskatchewan.CatalystsChurchill: Partial results from Kahuna kimberlite promising; results from complete 400-tonne bulk sample pending.Afridi Lake: Airborne gravity surveying done w/positive results - followed up by ground geophysics; preliminary results expected Q407 with potential drilling in Q108.Sakari: Finished airborne surveying (completed by JV partner DDN); results pending and expected in Q407.
780-435-0045
Stornoway Diamond Corp.
Diamonds North Resources Ltd.Shear Minerals Ltd.
Diamondex Resources Ltd.
Located 25 km east of Peregrine's DO-27 pipe and about 50 km east-southeast of Diavik. Contains a cluster of diamondiferous kimberlites (40) - New kimberlite targets identified.
Covers portion of the Franklin kimberlite field adjacent to Indicator Mineral's Darby property - five kimberlites discovered during the 2006 field season - Preliminary targets identified. Airborne geophysics completed (results expected Q407) and drill testing high priority targets planned.
Focus will be to test new kimberlite targets including existing DA-1, DA-2 and DA-3 kimberlites. Results from high resolution airborne gravity survey completed (results expected Q407) - drill testing of targets planned.
Peregrine Diamonds Ltd.
$0.00
$0.20
$0.40
$0.60
$0.80
$1.00
$1.20
$1.40
11/1
3/06
12/1
3/06
1/13
/07
2/13
/07
3/13
/07
4/13
/07
5/13
/07
0.00.30.50.81.01.31.5
1
Vol
(M)
50 Day MA100 Day MA
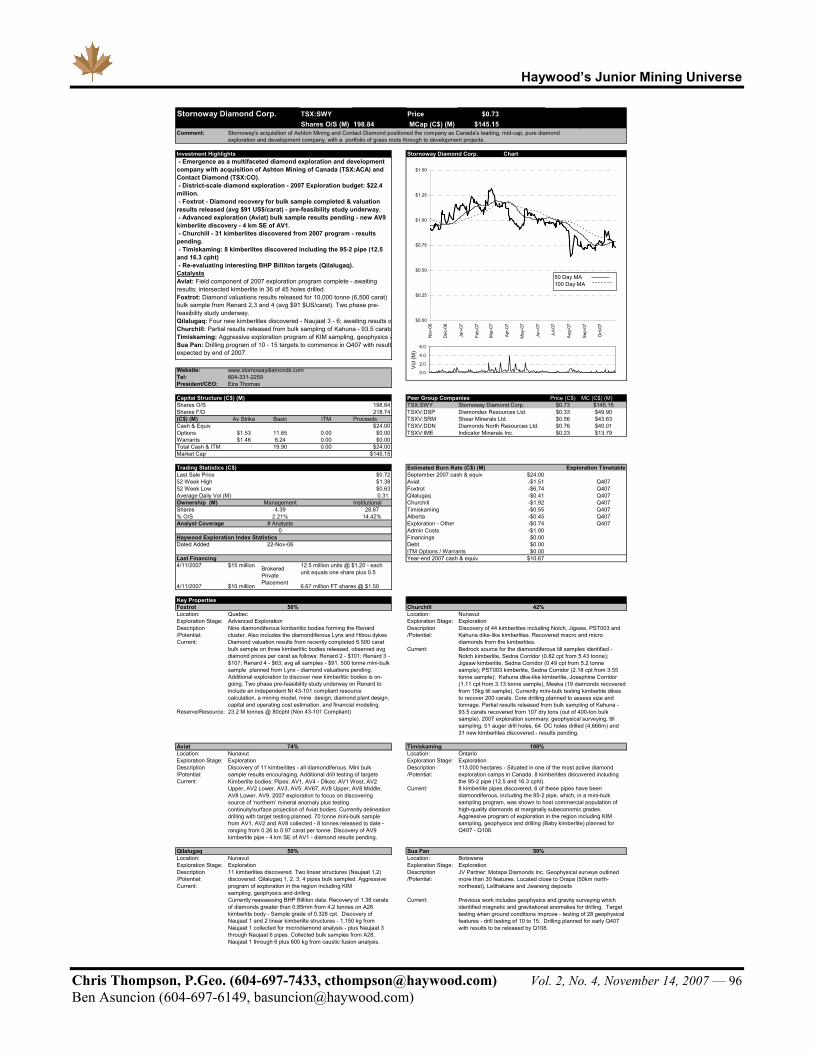
Haywood’s Junior Mining Universe
Chris Thompson, P.Geo. (604-697-7433, [email protected]) Vol. 2, No. 4, November 14, 2007 — 96 Ben Asuncion (604-697-6149, [email protected])
TSX:SWY Price $0.73 Shares O/S (M) 198.84 MCap (C$) (M) $145.15
Comment:
11/12/2007Investment Highlights Stornoway Diamond Corp. Chart
Website: www.stornowaydiamonds.comTel:President/CEO:
Capital Structure (C$) (M) Peer Group Companies Price (C$) MC (C$) (M)Shares O/S 198.84 TSX:SWY $0.73 $145.15Shares F/D 218.74 TSXV:DSP $0.33 $49.90(C$) (M) Av Strike Basic ITM Proceeds TSXV:SRM $0.56 $43.63Cash & Equiv $24.00 TSXV:DDN $0.76 $40.01Options $1.53 11.65 0.00 $0.00 TSXV:IME $0.23 $13.79Warrants $1.46 8.24 0.00 $0.00Total Cash & ITM 19.90 0.00 $24.00Market Cap $145.15
Trading Statistics (C$) Estimated Burn Rate (C$) (M)Last Sale Price $0.72 September 2007 cash & equiv $24.00 52 Week High $1.38 Aviat -$1.51 Q40752 Week Low $0.63 Foxtrot -$6.74 Q407Average Daily Vol (M) 0.31 Qilalugaq -$0.41 Q407Ownership (M) Management Institutional Churchill -$1.92 Q407Shares 4.39 28.67 Timiskaming -$0.55 Q407% O/S 2.21% 14.42% Alberta -$0.45 Q407Analyst Coverage # Analysts Exploration - Other -$0.74 Q407
0 Admin Costs -$1.00 Haywood Exploration Index Statistics Financings $0.00 Dated Added 22-Nov-06 Debt $0.00
ITM Options / Warrants $0.00 Last Financing Year-end 2007 cash & equiv $10.67 4/11/2007 $15 million
4/11/2007 $10 million 6.67 million FT shares @ $1.50
Key PropertiesFoxtrot 50% Churchill 42%Location: Quebec Location: Nunavut Exploration Stage: Advanced Exploration Exploration Stage: ExplorationDescription Description/Potential: /Potential:Current:
Current:
Reserve/Resource:
Aviat 74% Timiskaming 100% Location: Nunavut Location: Ontario Exploration Stage: Exploration Exploration Stage: ExplorationDescription Description/Potential: /Potential:Current:
Current:
Qilalugaq 50% Sua Pan 50% Location: Nunavut Location: BotswanaExploration Stage: Exploration Exploration Stage: ExplorationDescription Description/Potential: /Potential:Current:
Current:
Diamondex Resources Ltd.
Currently reassessing BHP Billiton data. Recovery of 1.38 carats of diamonds greater than 0.85mm from 4.2 tonnes on A28 kimberlite body - Sample grade of 0.328 cpt. Discovery of Naujaat 1 and 2 linear kimberlite structures - 1,150 kg from Naujaat 1 collected for microdiamond analysis - plus Naujaat 3 through Naujaat 6 pipes. Collected bulk samples from A28, Naujaat 1 through 6 plus 600 kg from caustic fusion analysis.
12.5 million units @ $1.20 - each unit equals one share plus 0.5
11 kimberlites discovered. Two linear structures (Naujaat 1,2) discovered. Qilalugaq 1, 2, 3, 4 pipes bulk sampled. Aggressive program of exploration in the region including KIMsampling, geophysics and drilling.
Diamond valuation results from recently completed 6,500 carat bulk sample on three kimberlitic bodies released, observed avg diamond prices per carat as follows: Renard 2 - $101; Renard 3 - $107; Renard 4 - $63; avg all samples - $91. 500 tonne mini-bulk sample planned from Lynx - diamond valuations pending. Additional exploration to discover new kimberlitic bodies is on-going. Two phase pre-feasibility study underway on Renard to include an independent NI 43-101 compliant resource calculation, a mining model, mine design, diamond plant design, capital and operating cost estimation, and financial modeling.
Discovery of 11 kimberlites - all diamondiferous. Mini bulk sample results encouraging. Additional drill testing of targets
Nine diamondiferous kimberlitic bodies forming the Renard cluster. Also includes the diamondiferous Lynx and Hibou dykes
Stornoway Diamond Corp.
Stornoway's acquisition of Ashton Mining and Contact Diamond positioned the company as Canada's leading, mid-cap, pure diamond exploration and development company, with a portfolio of grass roots through to development projects.
604-331-2259
- Emergence as a multifaceted diamond exploration and development company with acquisition of Ashton Mining of Canada (TSX:ACA) and Contact Diamond (TSX:CO). - District-scale diamond exploration - 2007 Exploration budget: $22.4 million. - Foxtrot - Diamond recovery for bulk sample completed & valuation results released (avg $91 US$/carat) - pre-feasibility study underway. - Advanced exploration (Aviat) bulk sample results pending - new AV9 kimberlite discovery - 4 km SE of AV1. - Churchill - 31 kimberlites discovered from 2007 program - results pending. - Timiskaming: 8 kimberlites discovered including the 95-2 pipe (12.5 and 16.3 cpht) - Re-evaluating interesting BHP Billiton targets (Qilalugaq).CatalystsAviat: Field component of 2007 exploration program complete - awaiting results; intersected kimberlite in 36 of 45 holes drilled.Foxtrot: Diamond valuations results released for 10,000 tonne (6,500 carat) bulk sample from Renard 2,3 and 4 (avg $91 $US/carat). Two phase pre-feasibility study underway.Qilalugaq: Four new kimberlites discovered - Naujaat 3 - 6; awaiting results oChurchill: Partial results released from bulk sampling of Kahuna - 93.5 caratsTimiskaming: Aggressive exploration program of KIM sampling, geophysics &Sua Pan: Drilling program of 10 - 15 targets to commence in Q407 with resultexpected by end of 2007.
Eira Thomas
Shear Minerals Ltd.
Indicator Minerals Inc.
Brokered Private Placement
Stornoway Diamond Corp.
Kimberlite bodies: Pipes: AV1, AV4 - Dikes: AV1 West, AV2 Upper, AV2 Lower, AV3, AV5, AV67, AV8 Upper, AV8 Middle, AV8 Lower, AV9. 2007 exploration to focus on discovering source of ‘northern’ mineral anomaly plus testing continuity/surface projection of Aviat bodies. Currently delineation drilling with target testing planned. 70 tonne mini-bulk sample from AV1, AV2 and AV8 collected - 8 tonnes released to date - ranging from 0.26 to 0.97 carat per tonne. Discovery of AV9 kimberlite pipe - 4 km SE of AV1 - diamond results pending.
Previous work includes geophysics and gravity surveying which identified magnetic and gravitational anomalies for drilling. Target testing when ground conditions improve - testing of 28 geophysical features - drill testing of 10 to 15. Drilling planned for early Q407 with results to be released by Q108.
Diamonds North Resources Ltd.
8 kimberlite pipes discovered, 6 of these pipes have been diamondiferous, including the 95-2 pipe, which, in a mini-bulk sampling program, was shown to host commercial population ofhigh-quality diamonds at marginally subeconomic grades. Aggressive program of exploration in the region including KIM sampling, geophysics and drilling (Baby kimberlite) planned for Q407 - Q108.
JV Partner: Motapa Diamonds Inc. Geophysical surveys outlined more than 30 features. Located close to Orapa (50km north-northeast), Letlhakane and Jwaneng deposits
Exploration Timetable
Discovery of 44 kimberlites including Notch, Jigsaw, PST003 and Kahuna dike-like kimberlites. Recovered macro and micro diamonds from the kimberlites.
113,000 hectares - Situated in one of the most active diamond exploration camps in Canada. 8 kimberlites discovered including the 95-2 pipe (12.5 and 16.3 cpht).
Bedrock source for the diamondiferous till samples identified - Notch kimberlite, Sedna Corridor (0.82 cpt from 5.43 tonne); Jigsaw kimberlite, Sedna Corridor (0.49 cpt from 5.2 tonne sample); PST003 kimberlite, Sedna Corridor (2.18 cpt from 3.55 tonne sample); Kahuna dike-like kimberlite, Josephine Corridor (1.11 cpt from 3.13 tonne sample), Meeka (19 daimonds recovered from 15kg till sample). Currently mini-bulk testing kimberlite dikes to recover 200 carats. Core drilling planned to assess size and tonnage. Partial results released from bulk sampling of Kahuna - 93.5 carats recovered from 107 dry tons (out of 400-ton bulk sample). 2007 exploration summary: geophysical surveying, till sampling, 51 auger drill holes, 64 DC holes drilled (4,666m) and 31 new kimberlites discovered - results pending.
23.2 M tonnes @ 80cpht (Non 43-101 Compliant)
$0.00
$0.25
$0.50
$0.75
$1.00
$1.25
$1.50
Nov
-06
Dec
-06
Jan-
07
Feb-
07
Mar
-07
Apr
-07
May
-07
Jun-
07
Jul-0
7
Aug
-07
Sep
-07
Oct
-07
0.0
2.0
4.0
6.0
1
Vol
(M)
50 Day MA100 Day MA

Haywood’s Junior Mining Universe
Chris Thompson, P.Geo. (604-697-7433, [email protected]) Vol. 2, No. 4, November 14, 2007 — 97 Ben Asuncion (604-697-6149, [email protected])
Target Price, C$ $9.00 Shares O/S, millionCurrent Price, C$ $3.90 Shares F/D, million
Rating: SECTOR OUTPERFORM Return, % 131% Market Capitalization, US$M Target Price: C$9.00 52-Week High / Low, C$ $6.88 / $3.51 Company CEO Target Price Metric: 5.3x 2008E CFPS Daily Volume (60-day average) 226,656 Company Web Site
Investment Highlights Haywood Developer Index (base=100) Date Added:Performance at January 1, 2005: Performance at November 12, 2007:
Share Capital DilutionNumber Price
Warrants 1.4M C$3.57Options 2.1M C$3.28Warrants + Options 3.5M C$3.40
C$/US$ FX Rate: 1.04
Recent FinancingsCatalysts / News Flow
- Successful zinc concentrate production start-up at Middle Tennessee Mines in late Q4/07- Middle Tennessee Mines ramp-up to full scale production through 2008- Additional resource/reserve development at Middle Tennesse Mines through 2008 and beyond Major Shareholders- Additional 'strategic acquisition' corporate growth O/S (%) F/D (%)
Passport Management LLC 12.2% 10.9%Balance Sheet and Capitalization Synergy Asset Management 1.1% 1.0%
US$M C$M Midas Management Corporation 0.4% 0.3%Market Capitalization $108.9 $113.3 Management and Directors 18.9% 16.9%Current Cash $88.1 $91.6 Total 20.4% 18.2%F/D Cash Adds $11.5 $11.9Working Capital $85.4 $88.8 Corporate NAV Summary and SensitivityLong-term Debt ($39.5) ($41.1) Forecast Zinc Price, US$/lb $0.75 $1.25 $1.75 $2.25Book Value $75.4 $78.4 Corporate Adjustments, US$M $25 $25 $25 $25Enterprise Value (EV) $63.1 $65.6 MTM After-Tax Project NAV(10%), US$M $45 $297 $549 $784
EV = Market Capitalization - Working Capital + Long-term Debt MTM Project Optimization Upside, US$M $82 $82 $82 $82C$/US$ FX Rate: 1.04 Additional Exploration Credit, US$M $16 $16 $16 $16
Corporate NAV(10%), US$M $167 $419 $671 $907Financial Forecast Corporate Adjustments, C$ / F/D share $0.79 $0.79 $0.79 $0.79
2007 2008 2009 2010 2011 2012 $1.43 $9.49 $17.53 $25.06Forecast Zinc Price, US$/lb $1.55 $1.50 $1.25 $1.25 $1.00 $0.75 $2.61 $2.61 $2.61 $2.61Realized Zinc Price, US$/lb $1.55 $1.50 $1.25 $1.25 $1.00 $0.75 Additional Exploration Credit, C$ / F/D share $0.50 $0.50 $0.50 $0.50C$/US$ FX Rate 1.08 1.04 1.09 1.14 1.16 1.17 Corporate NAV(10%), C$ / F/D share $5.33 $13.39 $21.43 $28.96Shares O/S, millions 29 29 29 29 29 29 Current Price / Corporate NAV 0.7x 0.3x 0.2x 0.1xRevenue, US$M $9 $151 $164 $165 $132 $99 Target Price / Corporate NAV 1.7x 0.7x 0.4x 0.3xMine Site Expense, US$M ($7) ($82) ($101) ($101) ($93) ($86) Haywood model is based on a US$1.55/lb zinc price in 2007, US$1.50/lb in 2008, Corporate G&A, US$M ($5) ($5) ($5) ($5) ($5) ($5) US$1.25/lb in 2009 and 2010, US$1.00/lb in 2011, and US$0.75/lb thereafter.EBITDA, US$M ($3) $64 $58 $59 $34 $8 Model shares F/D (fully financed), million: 32.6EV / EBITDA - 1.0x 1.1x 1.1x 1.9x 7.6x C$/US$ FX Rate: 1.04DD&A, US$M $0 ($0) ($9) ($13) ($14) ($14)Earnings, US$M ($8) $47 $37 $36 $16 $0 Middle Tennessee Mines Metal Inventory - Model Mineable, Reserve, and Resource (100% owned)EPS, US$ ($0.27) $1.62 $1.28 $1.23 $0.57 $0.00 Zn Grade ZincCurrent Price / EPS - 2.3x 2.8x 2.8x 5.9x 1374.2x (%) (Mlb)Target Price / EPS - 5.3x 6.5x 6.4x 13.7x 3171.3x Model Mineable (100%) 3.40% 1,705Cash Flow Before W/C Changes, US$M ($8) $47 $46 $49 $30 $14 Model Payable (100%) - 1,363CFPS, US$ ($0.27) $1.63 $1.57 $1.67 $1.04 $0.48 Proven and Probable Reserve (100%) - -Current Price / CFPS - 2.3x 2.3x 2.0x 3.2x 6.9x Additional Indicated Resource (100%) 3.35% 835Target Price / CFPS - 5.3x 5.3x 4.7x 7.5x 16.0x Inferred Resource (100%) 3.43% 1,142Zinc Price CFPS Sensitivity, US$ $0.05 $0.50 $0.80 $0.80 $0.80 $0.80 Total Reserve and Resource (100%) 3.40% 1,977CAPEX, US$M ($71) ($17) ($14) ($4) ($1) ($1) Attributable Reserve - -Proceeds from Equity Financing, US$M $56 $0 $0 $0 $0 $0 Attributable Reserve and Resource 3.40% 1,977Proceeds from Debt Financing, US$M $53 $0 $0 $0 $0 $0Debt Repayment, US$M ($5) $0 $0 $0 $0 ($48) Strategic Resource Acquisition Corp. Consensus Estimate Summary (Reuters data sourced via Capital IQ)Free Cash Flow, US$M $25 $30 $32 $45 $29 ($34) Analysts Mean EPS High / Low Haywood vs. Cons. Mean CFPS High / Low Haywood vs. Cons.
FCPS, US$ $0.86 $1.05 $1.10 $1.54 $0.99 ($1.18) 2007 Consensus Estimate - - - - - - -Zinc price CFPS sensitivity is based on a US$0.25/lb change in forecast zinc price. 2008 Consensus Estimate - - - - - - -
2009 Consensus Estimate - - - - - - -Middle Tennessee Mines Production Profile (100% owned) Analysts SO Rating SP Rating SU Rating Mean Target High / Low Haywood vs. Cons.
2007 2008 2009 2010 2011 RLOM Consensus Valuation 2 2 - - US$8.85 US$9.00 / US$8.70 102%Ore Tons Mined, millions 0.1 1.8 2.4 2.4 2.4 25.0Ore Tons Milled, millions 0.1 1.8 2.4 2.4 2.4 25.0 Peer Group Comparables (Haywood Securities estimates)Ore Tons Milled, tons per day 300 5,400 7,000 7,000 7,000 6,600 Price Corp NAV Price / NAV 2007 CFPS Price / CFPS 2008 CFPS Price / CFPSZinc Head Grade, % 3.4% 3.4% 3.4% 3.4% 3.4% 3.4% Strategic Res. Acq. Corp. (SRZ-T) C$3.90 US$8.86 0.4x (US$0.27) - US$1.63 2.3xZinc Recovery, % 94% 94% 94% 94% 94% 94% Anvil Mining Ltd. (AVM-T) C$14.15 US$17.07 0.8x US$2.20 6.2x US$2.85 4.8xConcentrate Zinc Grade, % 64.5% 64.5% 64.5% 64.5% 64.5% 64.5% Chariot Resources Ltd. (CHD-T) C$1.08 US$1.64 0.6x (US$0.01) - (US$0.05) -Payable Zinc Production, Mlb 5 100 130 130 130 1,358 First Quantum Minerals Ltd. (FM-T) C$88.66 US$50.87 1.7x US$9.80 8.7x US$13.85 6.2xLimestone Aggregate Production, tons 000's 150 750 750 750 750 8,250 Frontera Copper Corp. (FCC-T) C$6.80 US$5.95 1.1x US$1.10 5.9x US$1.44 4.5xOperating Cost, US$/ton milled $50 $25 $25 $25 $25 $25 Imperial Metals Corp. (III-T) C$16.12 US$15.40 1.0x US$5.73 2.7x US$5.95 2.6x
$0.95 $0.50 $0.50 $0.50 $0.50 $0.50 Katanga Mining Ltd. (KAT-T) C$16.52 US$15.77 1.0x US$0.04 397.1x US$2.00 7.9xTotal Zinc Cash Cost, US$/lb $1.30 $0.85 $0.80 $0.80 $0.75 $0.70 Lundin Mining Corp. (LUN-T) C$10.43 US$10.69 0.9x US$2.00 5.0x US$2.15 4.7x
Moly Mines Ltd. (MOL-T) C$3.49 US$6.79 0.5x US$0.00 - (US$0.50) -Nevsun Resources Ltd. (NSU-T) C$1.89 US$3.23 0.6x (US$0.08) - (US$0.04) -Sherwood Copper Corp. (SWC-V) C$6.20 US$5.28 1.1x US$0.30 20.0x US$1.60 3.7x
- 1.1x - 5.7x - 4.9x- 0.9x - 63.7x - 4.9x
C$/US$ FX Rate: 1.04
Stefan Ioannou, Ph.D. - Mining [email protected] 416-507-2309
Strategic Resource Acquisition Corp. (SRZ-T) 29.132.6
$3.75 $3.90
$108.9Victor Wyprysky
www.sra-corporation.com
US$ / O/S Share C$ / O/S Share
Oct 29/07438
US$4.8M
$0.39 $0.41$3.03 $3.15
$2.94 $3.06($1.36) ($1.41)$2.59 $2.70$2.17 $2.26
100Strategic is a mid-tier developer preparing to re-start zinc concentrate production at its 100% owned Middle Tennessee Mines operation in late Q4/07. At full capacity, the project is expected to produce approximately 130 million pounds of payable zinc annually at an average total zinc cash-cost of US$0.70 per pound. Project risk is mitigated through the use of standard off-the-shelf froth flotation technology, coupled with a strong management team that boasts a track record of successful project development in the United States. In addition, 27 years of historic production in the district provide a strong knowledge base for current and future operations. On paper the project currently boasts a robust 10-year mine life. However, we anticipate longer life will be realized as resource development accompanies underground mining. Middle Tennessee Mines is expected to produce one of the highest quality zinc concentrates in the world and efforts are underway to establish recovery methods for the valuable gallium and germanium contained in the concentrate.
3.50.3
--
Zinc Cash Cost (on-site, before royalties), US$/lb
-12,46916,646
1.0x
$0.50$9.21
0.15.529.1
US$6.7MUS$11.5M
32.6
May 29, 2007 - $60.00M IPO common share financing (priced at $4.85 per common share)
3.5
-$0.032
$25$166$82$16
29,115
(000's)25,081
-
-$0.032
MTM Project Optimization Upside, C$ / F/D share
-29,115
(US$/lb)$0.037$0.046
-$0.075
EV/lb Zn
Proceeds Expiry
O/S (millions) F/D (millions)
May 29, 2007 - $51.75M IPO unit offering (1 unit = $1,000 5-year note at 10% [semi-annual] + 29 common shares; includes 15% over allotment)
0.4x
0.30.15.5
Peer Group Average (producers)Peer Group Average (all)
MTM After-Tax Project NAV(10%), C$ / F/D share
Haywood
Tons
$5.31$2.61
$0.79$288
Strategic Resource Acquisition Corp. (SRZ-T)
$0.00$2.00$4.00$6.00$8.00
May-07 Jun-07 Jul-07 Aug-07 Sep-07 Oct-07 Nov-07
Share Price 50 Day M.A.
Volume in Millions
0.00.51.0
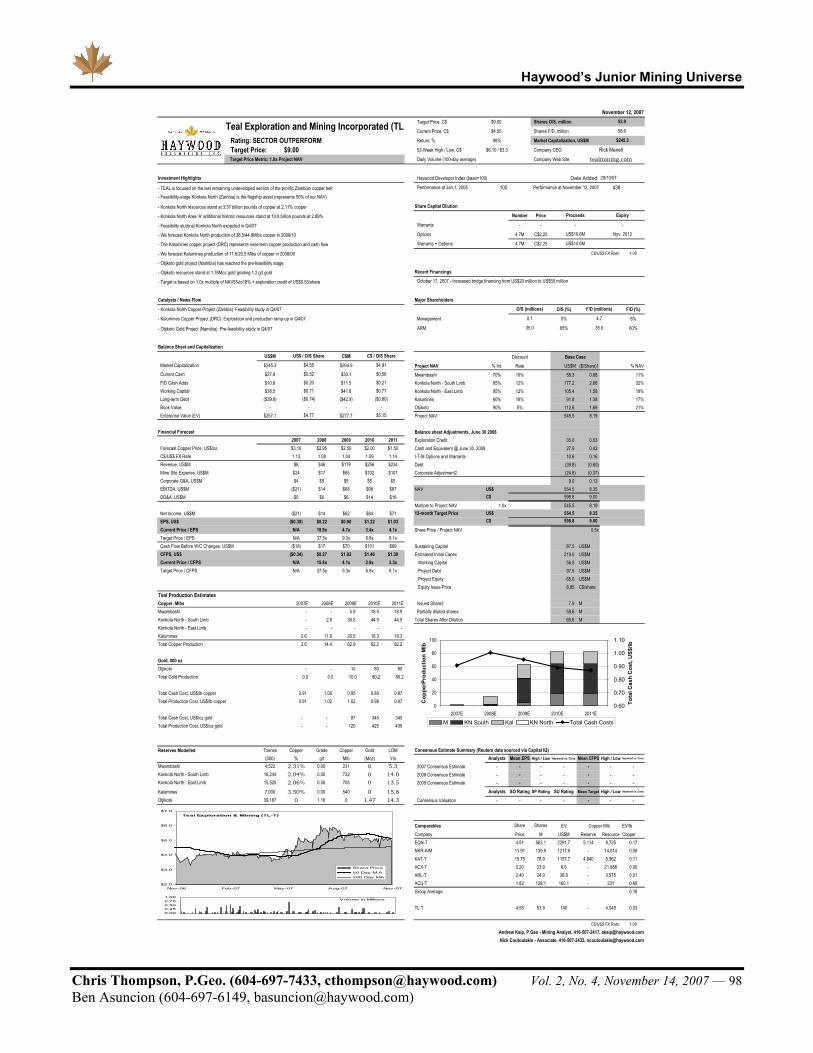
Haywood’s Junior Mining Universe
Chris Thompson, P.Geo. (604-697-7433, [email protected]) Vol. 2, No. 4, November 14, 2007 — 98 Ben Asuncion (604-697-6149, [email protected])
Target Price, C$ $9.00 Shares O/S, million
Current Price, C$ $4.55 Shares F/D, million
Rating: SECTOR OUTPERFORM Return, % 98% Market Capitalization, US$M
Target Price: $9.00 52-Week High / Low, C$ $6.10 / $3.3 Company CEO
Target Price Metric: 1.0x Project NAV Daily Volume (100-day average) Company Web Site
Investment Highlights Haywood Developer Index (base=100) Date Added:
- TEAL is focused on the last remaining undeveloped section of the prolific Zambian copper belt Performance at Jan 1, 2005 100 Performance at November 12, 2007 438- Feasibility-stage Konkola North (Zambia) is the flagship asset (represents 50% of our NAV)
- Konkola North resources stand at 3.37 billion pounds of copper at 2.11% copper Share Capital Dilution
- Konkola North Area 'A' additional historic resources stand at 10.8 billion pounds at 2.89% Number Price
- Feasibility study at Konkola North expected in Q4/07 Warrants - -
- We forecast Konkola North production of 36.5/44.9Mlbs copper in 2009/10 Options 4.7M C$2.25
- The Kalumines copper project (DRC) represents near-term copper production and cash flow Warrants + Options 4.7M C$2.25
- We forecast Kalumines production of 11.6/20.5 Mlbs of copper in 2008/09 C$/US$ FX Rate: 1.08
- Otjikoto gold project (Namibia) has reached the pre-feasibility stage
- Otjikoto resources stand at 1.76Moz gold grading 1.2 g/t gold Recent Financings
- Target is based on 1.0x multiple of NAV5%to18% + exploration credit of US$0.53/share
Catalysts / News Flow Major Shareholders
- Konkola North Copper Project (Zambia): Feasibility study in Q4/07 O/S (%) F/D (%)
- Kalumines Copper Project (DRC): Exploration and production ramp-up in Q4/07 Management 0% 8%
- Otjikoto Gold Project (Namibia): Pre-feasibility study in Q4/07 ARM 65% 60%
Balance Sheet and Capitalization
US$M C$M DiscountMarket Capitalization $245.3 $264.9 Project NAV % Int. Rate US$M ($/Share)1 % NAVCurrent Cash $27.9 $30.1 Mwambashi 70% 10% 58.3 0.88 11%F/D Cash Adds $10.6 $11.5 Konkola North - South Limb 95% 12% 177.2 2.66 32%Working Capital $38.5 $41.6 Konkola North - East Limb 95% 12% 105.4 1.58 19%Long-term Debt ($39.8) ($42.9) Kalumines 60% 18% 91.8 1.38 17%Book Value - - Otjikoto 90% 5% 112.6 1.69 21%Enterprise Value (EV) $257.1 $277.7 Project NAV 545.5 8.19
Financial Forecast Balance sheet Adjustments, June 30 20082007 2008 2009 2010 2011 Exploration Credit 35.0 0.53
Forecast Copper Price, US$/oz $3.10 $2.95 $2.50 $2.00 $1.50 Cash and Equivalent @ June 30, 2008 27.9 0.42 C$/US$ FX Rate 1.13 1.08 1.04 1.09 1.14 I-T-M Options and Warrants 10.6 0.16 Revenue, US$M $8 $46 $178 $256 $234 Debt (39.8) (0.60) Mine Site Expense, US$M $24 $17 $65 $102 $101 Corporate Adjustment2 (24.8) (0.37) Corporate G&A, US$M $4 $5 $5 $5 $5 9.0 0.13 EBITDA, US$M ($21) $14 $68 $98 $87 NAV US$ 554.5 8.35 DD&A, US$M $0 $0 $6 $14 $16 C$ 598.8 9.00
Multiple to Project NAV 1.0x 545.5 8.19 Net Income, US$M ($21) $14 $62 $84 $71 12-month Target Price US$ 8.35 EPS, US$ ($0.38) $0.22 $0.90 $1.22 $1.03 C$ 9.00
Current Price / EPS N/A 18.9x 4.7x 3.4x 4.1x Share Price / Project NAV 0.5xTarget Price / EPS N/A 37.5x 9.3x 6.8x 8.1xCash Flow Before W/C Changes, US$M ($18) $17 $70 $101 $89 Sustaining Capital 87.5 US$MCFPS, US$ ($0.34) $0.27 $1.02 $1.46 $1.30 Estimated Initial Capex 219.0 US$MCurrent Price / CFPS N/A 15.8x 4.1x 2.9x 3.3x Working Capital 56.5 US$MTarget Price / CFPS N/A 37.5x 9.3x 6.8x 8.1x Project Debt 97.5 US$M
Project Equity 65.0 US$M Equity Issue Price 8.85 C$/share
Teal Production EstimatesCopper, Mlbs 2007E 2008E 2009E 2010E 2011E Issued Share3 7.9 MMwambashi - - 5.9 18.9 18.9 Partially diluted shares 58.6 MKonkola North - South Limb - 2.8 36.5 44.9 44.9 Total Shares After Dilution 66.6 MKonkola North - East Limb - - - - - Kalumines 2.6 11.6 20.5 18.3 18.3 Total Copper Production 2.6 14.4 62.9 82.2 82.2
Gold, 000 ozOtjikoto - - 10 80 80 Total Gold Production 0.0 0.0 10.0 80.2 80.2
Total Cash Cost, US$/lb copper 0.91 1.00 0.95 0.89 0.87 Total Production Cost, US$/lb copper 0.91 1.02 1.02 0.98 0.97
Total Cash Cost, US$/oz gold - - 87 345 345 Total Production Cost, US$/oz gold - - 120 425 439
Reserves Modelled Tonnes Copper Grade Copper Gold LOM Consensus Estimate Summary (Reuters data sourced via Capital IQ)(000) % g/t Mlb (Moz) Yrs Analysts Mean EPS High / Low Haywood vs. Cons. Mean CFPS High / Low Haywood vs. Cons.
Mwambashi 4,522 2.31% 0.00 231 0 5.3 2007 Consensus Estimate - - - - - - -Konkola North - South Limb 16,244 2.04% 0.00 732 0 14.0 2008 Consensus Estimate - - - - - - -Konkola North - East Limb 15,525 2.06% 0.00 705 0 13.5 2009 Consensus Estimate - - - - - - -Kalumines 7,000 3.50% 0.00 540 0 15.8 Analysts SO Rating SP Rating SU Rating Mean Target High / Low Haywood vs. Cons.
Otjikoto 39,187 0 1.16 0 1.47 14.3 Consensus Valuation - - - - - - -
Comparables Share Shares EV EV/lbCompany Price M US$M Reserve Resource CopperEQN-T 4.51 563.1 2291.7 5,114 8,725 0.17NKR-AIM 11.91 139.9 1217.8 - 14,614 0.08KAT-T 15.75 78.9 1157.7 4,840 5,962 0.11ACX-T 0.20 33.9 6.6 - 21,888 0.00ARL-T 2.40 24.9 36.8 - 3,975 0.01ACU-T 1.82 128.1 160.1 - 231 0.69Group Average 0.18
TL-T 4.55 53.9 140 - 4,048 0.03
C$/US$ FX Rate: 1.08
Andrew Kaip, P.Geo - Mining Analyst, 416-507-2417, [email protected] Coutoulakis - Associate, 416-507-2435, [email protected]
O/S (millions)
0.1
35.0
Base Case
F/D (millions)
4.7
35.0
$0.71
$4.77 $5.15-
($0.74) ($0.80)-
Teal Exploration and Mining Incorporated (TL-
US$ / O/S Share C$ / O/S Share
$4.55 $4.91
November 12, 200753.9
58.6
Expiry
29/10/07
$245.3
tealmining.com
Rick Menell
Proceeds
--
October 17, 2007 - Increased bridge financing from US$20 million to US$50 million
US$10.6M
US$10.6M
Copper Mlb
Nov. 2013
$0.52 $0.56
554.5 598.8
$0.77$0.20 $0.21
0
20
40
60
80
100
2007E 2008E 2009E 2010E 2011E
Cop
perP
rodu
ctio
n M
lb
0.60
0.70
0.80
0.90
1.00
1.10
Tota
l Cas
h C
ost,
US$
/lb
M KN South Kal KN North Total Cash Costs
Teal Exploration & Mining (TL-T)
$2.0
$3.0
$4.0
$5.0
$6.0
$7.0
Nov-06 Feb-07 May-07 Aug-07 Nov-07
Share Price
50 Day M.A.
200 Day MA
Volume in Millions
0.000.250.500.751.00

Haywood’s Junior Mining Universe
Chris Thompson, P.Geo. (604-697-7433, [email protected]) Vol. 2, No. 4, November 14, 2007 — 99 Ben Asuncion (604-697-6149, [email protected])
Target Price, C$ N/A Shares O/S, millionCurrent Price, C$ $0.50 Shares F/D, million
Rating: N/A 52-Week High, C$ $0.95 Market Capitalization, US$M
Target Price: N/A 52-Week Low, C$ $0.32 Company CEO
CDNX:TRX Average Daily Vol (M) 0.14 Company Web Site
Investment Highlights Haywood Developer Index (base=100) Date Added:Performance at Jan 1/05: Performance at Nov 12/07:
Share Capital DilutionNumber Price
Preferred Shares (Goldcorp Inc.) 240M n/aWarrants 31.5M C$0.87Options 18.3M C$0.60Warrants + Options 49.8M C$0.74
Recent Financing
News Flow / Catalysts Major ShareholdersMount Milligan: O/S (%) F/D (%)
Full feasibility study completion (Q1/08) Goldcorp Inc. 212% -Environmental Assessment Completion (mid-2008) Jeffrey Franzen 1% -Construction Start-up (mid-20008) Douglas Alexander Leishman 0% -Production Start-up (2011) Rober Pease 0% -
Berg: Puplava Financial Services, Ltd 0% -NI 43-101 compliant resource estimate (Q4/07) Total 214% -Definition drilling results (H1/08)Scoping study completion (Q2/08)Feasibility study completion (mid-2010)
Balance Sheet and Capitalization Estimated Burn RateUS$M C$M
Market Capitalization $53.9 $56.0 January 2007 cash & equivCurrent Cash $21.9 $22.8 Mt. MilliganF/D Cash Adds $37.0 $38.5 BergWorking Capital $21.9 $22.8 Admin CostsLong-term Debt $0.0 $0.0 FinancingsBook Value $153.3 $159.4 ITM Options / WarrantsEnterprise Value (EV) $32.0 $33.2 Year-end 2007 cash & equiv
EV = Market Capitalization - Working Capital + Long-term Debt
C$/US$ FX Rate: 1.04
Key PropertiesMount Milligan BergOwnership: 100% Ownership: 100%Location: British Columbia Location: British ColumbiaExploration Stage: Feasiblity Exploration Stage: Resource DevelopmentDescription/Potential: Description/Potential:
Current: Current:
Reserves & Resources: Reserves & Resources:Tonnes Cu Grade Au Grade Copper Gold Cu Equiv Tonnes Cu Grade Mo Grade Copper Moly Cu Equiv(000's) (%) (g/t) (Mlbs) (Mozs) (Mlbs) (000's) (%) (%) (Mlbs) (Mlbs) (Mlbs)
Measured & Indicated Resource 417,100 0.21% 0.41 1,931 5.5 3,973 Measured & Indicated Resource - - - - - -Inferred Resource 6,500 0.19% 0.29 27 0.1 49 Inferred Resource 238,000 0.4% 0.052% 2,099 273 4,048Total Reserve and Resource 423,600 0.21% 0.41 1,958 5.6 4,023 Total Reserve and Resource 238,000 0.4% 0.052% 2,099 273 4,048
Terrane Metals Corp. Consensus Estimate Summary (Reuters data sourced via Capital IQ)Analysts
2007 Consensus Estimate 02008 Consensus Estimate 02009 Consensus Estimate 0
Analysts Buy Rating Hold Rating Sell Rating Mean Target High LowConsensus Valuation 0 - - - - - -
Peer Group Comparables (Reuters data sourced via Capital IQ)P / NAV
Candente Resource Corp. n/aCorriente Resources Inc. n/aChariot Resources Ltd. n/aImperial Metals Corp. n/aInca Pacific Resources Inc. n/aNorthern Peru Copper Corp. n/aSherwood Copper Corp. 1.1xPeer Group Average 1.1x
In June 2007 Terrane completed its Phase I and II drilling programs and announced the completion of a NI 43-101 compliant mineral resource estimate.In October 2007 Terrane announced the results of the Preliminary Economic Assessment conducted by Wardrop Engineering. The study includes a pre-tax project NPV(8%) of C$580 million, IRR of 20.6%, and a 3.9 year payback period, based on a copper price US$2.50 per pound and a gold price of US$550 per ounce. Annual production is expected to average 90 million pounds of copper and 221,530 ounces of gold over a 14.5-year open-pit mine-life. Initial capital and life-of-mine average operating costs are estimated at C$827 million and C$7.12 per tonne milled (US$0.65 per pound of copper net of credits) respectively.
-
June 21, 2007 - C$28.6 million public offering (36.4M units @ C$0.65 + 6.25M flow through common shares @ C$0.80; 1 unit = 1 share + 0.5 warrants exerciseable @ C$0.85 for 5 years)
November 3, 2006 - $10.5 million placement (13.4M units @ C$0.75; 1 unit = 1 share + 0.5 warrants exerciseable @ C$1.00 to C$1.25 for 2 years)
O/S (millions)240.01.60.4
$0.00$1.35
100 438
High Low
0.30.0
242.3
F/D (millions)--
C$74
US$0.00 US$0.00 US$0.00US$0.00
--
-
C$536
-$5.53
(C$M)n/an/an/an/an/an/a
NAV Consensus Est
$0.20
C$324C$282
Mrkt CapC$150C$369C$338
US$0.00US$0.00
-
-
$0.28
$0.50
$0.34
$1.41
$0.48$0.19$0.33$0.19
$0.20
Expiry
-US$26.4M
In late June 2007, Terrane commenced a 12,000 meter drilling program. Wardrop Engineering has been contracted to deliver a NI 43-101 compliant resource estimate in Q4/07. Two additional engineering consulting firms have undertaken studies in support of a preliminary assessment of the Berg project expected in Q2/08. A full feasibility study is expected to begin in Q3/08 for a 30,000 tonne per day operation producing 75 million pounds of copper and 5 million pounds of molybdenum per annum over a +17 year open-pit mine life. Copper cash costs are anticipated to average about (US$0.13) per pound net of credits (@ US$30 per pound molybdenum).
Proceeds
Exploration Timetable
---
US$ / O/S Share C$ / O/S Share
- 100% interest in the advanced stage Mt. Milligan copper-gold porphyry deposit in British Columbia (1.9 billion pounds of copper and 5.5 million ounces of gold contained). - An October 2007 preliminary economic assessment (Wardrop) includes a C$580 million pre-tax project NAV(8%) and IRR of 20.6% (3.9 year pay back) at a US$2.50 per pound copper price and a US$550 per ounce gold price.- Annual production is expected to average 90 million pounds of copper and 221,530 ounces of gold over a 14.5-year open-pit mine-life (strip ratio = 0.8:1).- Initial capital costs are estimated at C$827 million and average life-of-mine operating costs are estimated at C$7.12 per tonne milled.- The project sits within the McKenzie land use plan, an area zoned for mine (and related infrastructure) development.- Terran'e project portfolio extends beyond Mt Milligan and includes a 100% interest in the advanced stage Berg copper-moly-silver project in British Columbia. In late June 2007, Terrane announced that it had commenced a 12,000 meter drilling program at Berg and Wardrop Engineering has been contracted to deliver a NI 43-101 compliant - Terrane's management team consists of top notch geologists with an intimate knowledge of the Mt. Milligan depositincluding President and CEO Rob Pease, formerly Placer Dome's General Manager, Canada, Exploration andGlobal Major Projects who was originally responsible for discovering the site.
113.2403.0
Oct 2008 - Jun 2012
$56.0
Oct 29/07
Robert Peasewww.terranemetals.com
November 12, 2007
$0.29
$0.00
-US$10.6M
Terrane Metals Corp. (CDNX:TRX)
C$2.11Price
Mean NAV
US$0.00US$0.00
n/a
The Berg copper-molybdenum-silver property is located in the Omineca Mining Division 84 kilometres southwest of Houston British Columbia.
US$0.00
-
The Mt. Milligan copper-gold deposit sits in an area zoned for mined development, the McKenzie land use plan, and is 155 kilometres northwest of Prince George.
n/a
C$6.24C$10.10
C$1.07C$16.00C$1.95
US$37.0M
C$4.60
$0.00
$0.25
$0.50
$0.75
$1.00
$1.25
11/13/2006
12/27/2006
2/8/2007
3/22/2007
5/4/2007
6/18/2007
7/31/2007
9/13/2007
10/26/2007
50 Day M.A.100 Day M.A.
Volume in Millions
0.00.51.01.52.0

Haywood’s Junior Mining Universe
Chris Thompson, P.Geo. (604-697-7433, [email protected]) Vol. 2, No. 4, November 14, 2007 — 100 Ben Asuncion (604-697-6149, [email protected])
ASX:TGS Price (C$) $0.33 Shares O/S (M) 175.16 MCap (C$) (M) $58.08
Comment:
11/12/2007Investment Highlights Tiger Resources Ltd. Chart
Website: www.tigerrez.comTel:Managing Dir:
Capital Structure (C$) (M)Shares O/S 175.16Shares F/D 256.71(C$) (M) Av Strike Basic ITM ProceedsCash & Equiv $5.75Options $0.47 4.15 $1.14 Peer Group Companies Price (C$) MC (C$) (M)Warrants $1.13 0.00 $0.00 TSX:KAT $16.21 $1,278.77Total Cash & ITM 0.00 4.15 $6.89 TSX:TL $5.05 $272.25Market Cap $58.08 TSX:ARL $2.30 $58.18
ASX:TGS $0.33 $58.08Trading Statistics (C$) TSXV:ELN $1.15 $25.03Last Sale Price $0.3252 Week High $0.8152 Week Low $0.29 Estimated Burn Rate (C$) (M)Average Daily Vol (M) 0.29 October 2007 cash & equiv $5.75 Ownership (M) Management Institutional Kipoi JV -$2.00 Q407-Q208Shares 6.99 30.37 Aurum JV -$1.00 Q407-Q208% O/S 3.99% 17.34% Rio de Maio n/aAnalyst Coverage # Analysts Kipese -$1.40 Q1-Q208
0 Somika JV -$0.10 Q407-Q208Haywood Exploration Index Statistics Admin Costs -$0.75 Q407-Q208Dated Added 22-Nov-06 Financings $0.00
ITM Options / Warrants $0.00 Last Financing June 2008 cash & equiv $0.50 10/5/2007 $15.5 million
10/5/2007 $2.5 million
Key PropertiesKipoi JV 60% Aurum JV 70% Location: Katanga Province, Democratic Republic of Congo (DRC) Location: Katanaga Province, DRCExploration Stage: Advanced Exploration Exploration Stage: DrillingDescription Description/Potential: /Potential:
Current:Current:
Reserve/Resource: None Reserve/Resource: None
Tiger is earning an overall direct 51% interest in Kipoi by completing a BFS. Payments to total C$22m within 16 months of BFS for 60%. Kipoi hosts 5 historical deposits: Kipoi Central; Kipoi North; Kaminamfitwe, Kileba and Juderia. The focus of recent drilling has been on Kipoi Central deposit where drill results include 133.5m @ 6.1% Cu. Significant cobalt present within the copper rich zones 39.6 m @ 1.54% Co plus silver at Kipoi North - 2.3% Cu and 38g/t Ag. Drilling ongoing w/5 rigs focused on completing resource estimation for Kipoi Central and Kipoi North - plus tests for strike continuation around the Judeira and Kileba targets. Preliminary metallurgical testing has been positive confirming HMS followed by electric arc furnace plus SW/EX plant to produce LME ingots for Kipoi Central. Feasibility studies ongoing - results pending.
Kipoi is host to 5 known copper deposits located within 12 km of favourable strike length; recent drilling has defined significant copper oxide over 1.5 km The JV with Aurum provides for Tiger to earn up 70% interest over
a 3 year period by spending AUD$5.0 million. Aurum is an international trading company with a copper processing plant at Lubumbashi (DRC). Significant copper in soil anomalies have been delineated and are the focus of a 15,000 metre air core drilling programme. All of the prospects for the JV lie in the Roan sequence geological structures and include the Kolwezi project, on strike from Tenke-Fungurume (global resource of 550 million tonnes grading 3.5% Cu and 0.3% Co). The Lupoto (PR2214) Project is located only 10km south of the Kipoi Project and has three significant anomalies including one over a distance of 3kms with the same structures and lithologies as Kipoi. The Sakania Project is close to the south west border with Zambia is in a known copper and gold area and close to First Quantum's Lonshi copper deposit
Brokered Private Placement
6.25 million units @ C$0.40 with 1/2 wt
- Cashed up at ~ C$18M enabling completion of exploration plans and to commence preliminary economic studies. - News flow from the drill bit will be steady well into 2008 with a 40,000 metre drill program underway on several projects and resource statements to follow. - Kipoi: currently 5 drill rigs operating with JORC compliant resource expected by end of 2007. - Capable and experienced management with a track record of success and extensive knowledge of the DRC; strong working relationship with Gecamines on key project (Kipoi). - Gov't of DRC is reviewing underlying contracts & until review is complete by end of Q4, there will be measurable ownership risk.CatalystsKipoi JV: Preliminary feasibility expected early Q407 with resource estimate to follow by end of Q407; working towards final resource and full feasibility by early 2009.Aurum JV: RC and additional air core drilling is planned for Q407 to follow up on targets identified from previous drilling and exploration efforts. Large regional soil sampling program of 9,200 samples planned for Q407.
Africo Resources Ltd.Teal Exploration & Mining IncKatanga Mining Limited
El Nino Ventures Inc.
38.75 million units @ $0.40 with 1/2 wt; full wt exercise @ $0.50 till May 31, 2009 (portion escrowed)
Brokered Private Placement
Tiger Resources Ltd.
Focusing on the discovery/acquisition of deposits within the highly mineralized "Roan Sequence" of the Democratic Republic of Congo; advancing several projects in Katanga Province; flagship property is the Kipoi where drill results include 122 m @ 7.3% Cu.
David Young61 (8) 9240 1933
Project consists of 7 permits all located in the Katanga Copperbelt and in close proximity to large, high grade deposits
Tiger Resources Ltd.
Exploration Timetable
$0.00
$0.10
$0.20
$0.30
$0.40
$0.50
$0.60
$0.70
$0.80
$0.90
$1.00
Nov
-06
Dec
-06
Jan-
07
Feb-
07
Mar
-07
Apr
-07
May
-07
Jun-
07
Jul-0
7
Aug
-07
Sep
-07
Oct
-07
0.0
0.5
1.0
1.5
1
Vol
(M)
50 Day MA100 Day MA
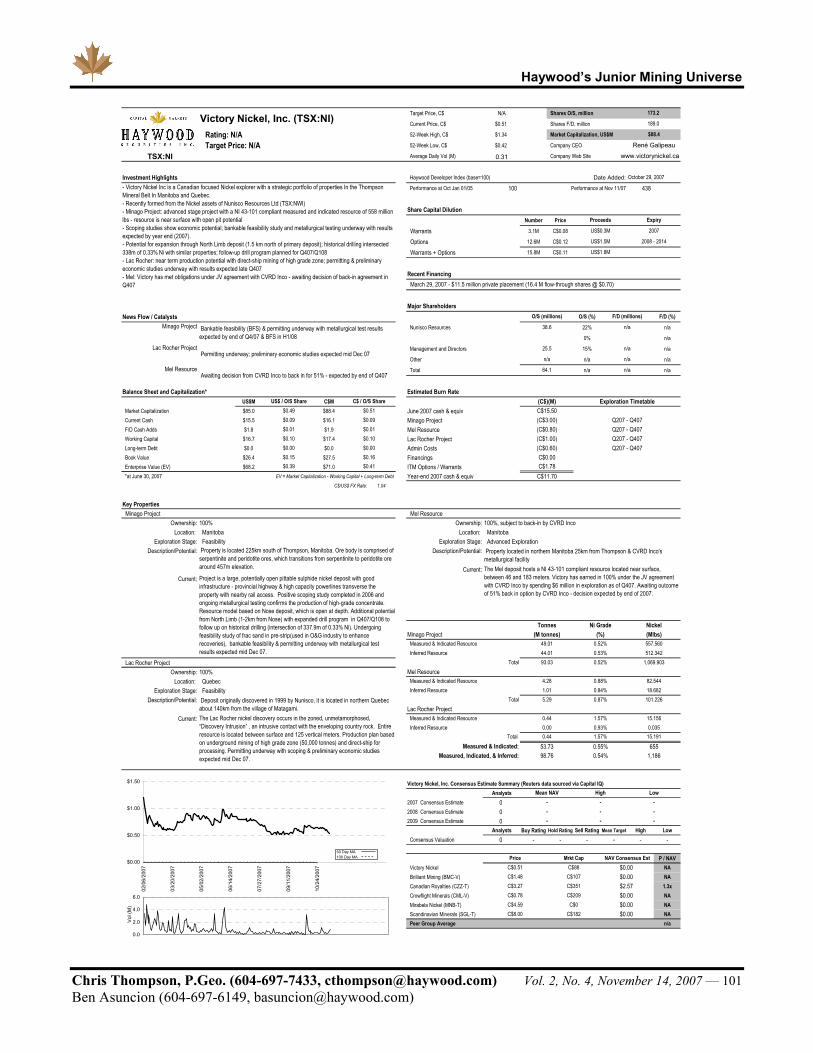
Haywood’s Junior Mining Universe
Chris Thompson, P.Geo. (604-697-7433, [email protected]) Vol. 2, No. 4, November 14, 2007 — 101 Ben Asuncion (604-697-6149, [email protected])
Target Price, C$ N/A Shares O/S, million
Current Price, C$ $0.51 Shares F/D, million
Rating: N/A 52-Week High, C$ $1.34 Market Capitalization, US$M
Target Price: N/A 52-Week Low, C$ $0.42 Company CEO
TSX:NI Average Daily Vol (M) 0.31 Company Web Site
Investment Highlights Haywood Developer Index (base=100) Date Added:
Performance at Oct Jan 01/05 100 Performance at Nov 11/07 438
Share Capital DilutionNumber Price
Warrants 3.1M C$0.08
Options 12.6M C$0.12
Warrants + Options 15.8M C$0.11
Recent Financing
Major ShareholdersNews Flow / Catalysts O/S (%) F/D (%)
Minago Project Nunisco Resources 22% n/a
0% n/aLac Rocher Project Management and Directors 15% n/a
Other n/a n/aMel Resource Total n/a n/a
Balance Sheet and Capitalization* Estimated Burn RateUS$M C$M
Market Capitalization $85.0 $88.4 June 2007 cash & equivCurrent Cash $15.5 $16.1 Minago ProjectF/D Cash Adds $1.8 $1.9 Mel ResourceWorking Capital $16.7 $17.4 Lac Rocher ProjectLong-term Debt $0.0 $0.0 Admin CostsBook Value $26.4 $27.5 FinancingsEnterprise Value (EV) $68.2 $71.0 ITM Options / Warrants*at June 30, 2007 EV = Market Capitalization - Working Capital + Long-term Debt Year-end 2007 cash & equiv
C$/US$ FX Rate: 1.04
Key PropertiesMinago Project Mel Resource
Ownership: 100% Ownership: 100%, subject to back-in by CVRD IncoLocation: Manitoba Location: Manitoba
Exploration Stage: Feasibility Exploration Stage: Advanced ExplorationDescription/Potential: Description/Potential:
Current:Current:
Lac Rocher ProjectOwnership: 100%
Location: QuebecExploration Stage: Feasibility
Description/Potential:
Current:
Victory Nickel, Inc. Consensus Estimate Summary (Reuters data sourced via Capital IQ)Analysts
2007 Consensus Estimate 02008 Consensus Estimate 02009 Consensus Estimate 0
Analysts Buy Rating Hold Rating Sell Rating Mean Target High LowConsensus Valuation 0 - - - - - -
P / NAVVictory Nickel NABrilliant Mining (BMC-V) NACanadian Royalties (CZZ-T) 1.3xCrowflight Minerals (CML-V) NAMirabela Nickel (MNB-T) NAScandinavian Minerals (SGL-T) NAPeer Group Average n/a
C$3.27
--
--
C$88
Low- - -
(C$0.60)C$0.00C$1.78
High
0.52%
0.88%0.84%
0.53%
(C$)(M)C$15.50(C$3.00)
(C$1.00)
C$0C$182
NAV Consensus Est
$2.57$0.00$0.00
$0.00$0.00$0.00
C$107
C$209
$0.49$0.09$0.01$0.10
Deposit originally discovered in 1999 by Nunisco, it is located in northern Quebec about 140km from the village of Matagami.
0.00
Ni Grade(%)
0.52%
Proceeds
www.victorynickel.ca
Expiry
2008 - 2014
US$0.3M
US$1.5M
173.2
189.0
2007
$88.4
October 29, 2007
René Galipeau
Victory Nickel, Inc. (TSX:NI)
US$ / O/S Share C$ / O/S Share
Price
Mean NAV
--
C$11.70
$0.09
$0.10
Exploration Timetable
Q207 - Q407
March 29, 2007 - $11.5 million private placement (16.4 M flow-through shares @ $0.70)
O/S (millions) F/D (millions)
n/a
n/a
n/a64.1
$0.41
$0.00Q207 - Q407Q207 - Q407
38.6
- Victory Nickel Inc is a Canadian focused Nickel explorer with a strategic portfolio of properties In the Thompson Mineral Belt In Manitoba and Quebec.- Recently formed from the Nickel assets of Nunisco Resources Ltd (TSX:NWI)- Minago Project: advanced stage project with a NI 43-101 compliant measured and indicated resource of 558 million lbs - resource is near surface with open pit potential- Scoping studies show economic potential; bankable feasibility study and metallurgical testing underway with results expected by year end (2007).- Potential for expansion through North Limb deposit (1.5 km north of primary deposit); historical drilling intersected 338m of 0.33% Ni with similar properties; follow-up drill program planned for Q407/Q108- Lac Rocher: near term production potential with direct-ship mining of high grade zone; permitting & preliminary economic studies underway with results expected late Q407- Mel: Victory has met obligations under JV agreement with CVRD Inco - awaiting decision of back-in agreement in Q407
$0.39
0.93%
US$1.8M
n/a
25.5 n/a
Awaiting decision from CVRD Inco to back in for 51% - expected by end of Q407
Permitting underway; preliminary economic studies expected mid Dec 07
C$0.78
Property located in northern Manitoba 25km from Thompson & CVRD Inco's metallurgical facility
1.015.29
0.44
C$1.48
0.44
Mrkt Cap
C$351
C$8.00C$4.59
(M tonnes)49.0144.0193.03
4.28
C$0.51
Measured & Indicated Resource
Bankable feasibility (BFS) & permitting underway with metallurgical test results expected by end of Q4/07 & BFS in H1/08
Tonnes
Property is located 225km south of Thompson, Manitoba. Ore body is comprised of serpentinite and peridotite ores, which transitions from serpentinite to peridotite ore around 457m elevation.
$0.00$0.15
$0.51
$0.01
$0.16
Project is a large, potentially open pittable sulphide nickel deposit with good infrastructure - provincial highway & high capacity powerlines transverse the property with nearby rail access. Positive scoping study completed in 2006 and ongoing metallurgical testing confirms the production of high-grade concentrate. Resource model based on Nose deposit, which is open at depth. Additional potential from North Limb (1-2km from Nose) with expanded drill program in Q407/Q108 to follow up on historical drilling (intersection of 337.9m of 0.33% Ni). Undergoing feasibility study of frac sand in pre-strip(used in O&G industry to enhance recoveries), bankable feasibility & permitting underway with metallurgical test results expected mid Dec 07.
Minago Project
1.57% 15.156
1,069.903
82.54418.682
Nickel(Mlbs)557.560512.342
The Lac Rocher nickel discovery occurs in the zoned, unmetamorphosed, “Discovery Intrusion” , an intrusive contact with the enveloping country rock. Entire resource is located between surface and 125 vertical meters. Production plan based on underground mining of high grade zone (50,000 tonnes) and direct-ship for processing. Permitting underway with scoping & preliminary economic studies expected mid Dec 07.
Inferred ResourceTotal
Measured & Indicated ResourceInferred Resource
Mel Resource
Measured, Indicated, & Inferred:
Lac Rocher Project
Total Measured & Indicated:
Total
Measured & Indicated ResourceInferred Resource 0.035
15.1911.57%
101.2260.87%
65598.76 0.54% 1,18653.73 0.55%
(C$0.80) Q207 - Q407
The Mel deposit hosts a NI 43-101 compliant resource located near surface, between 46 and 183 meters. Victory has earned in 100% under the JV agreement with CVRD Inco by spending $6 million in exploration as of Q407. Awaiting outcome of 51% back in option by CVRD Inco - decision expected by end of 2007.
$0.00
$0.50
$1.00
$1.50
02/0
6/20
07
03/2
0/20
07
05/0
2/20
07
06/1
4/20
07
07/2
7/20
07
09/1
1/20
07
10/2
4/20
07
0.0
2.0
4.0
6.0
1
Vol
(M)
50 Day MA100 Day MA
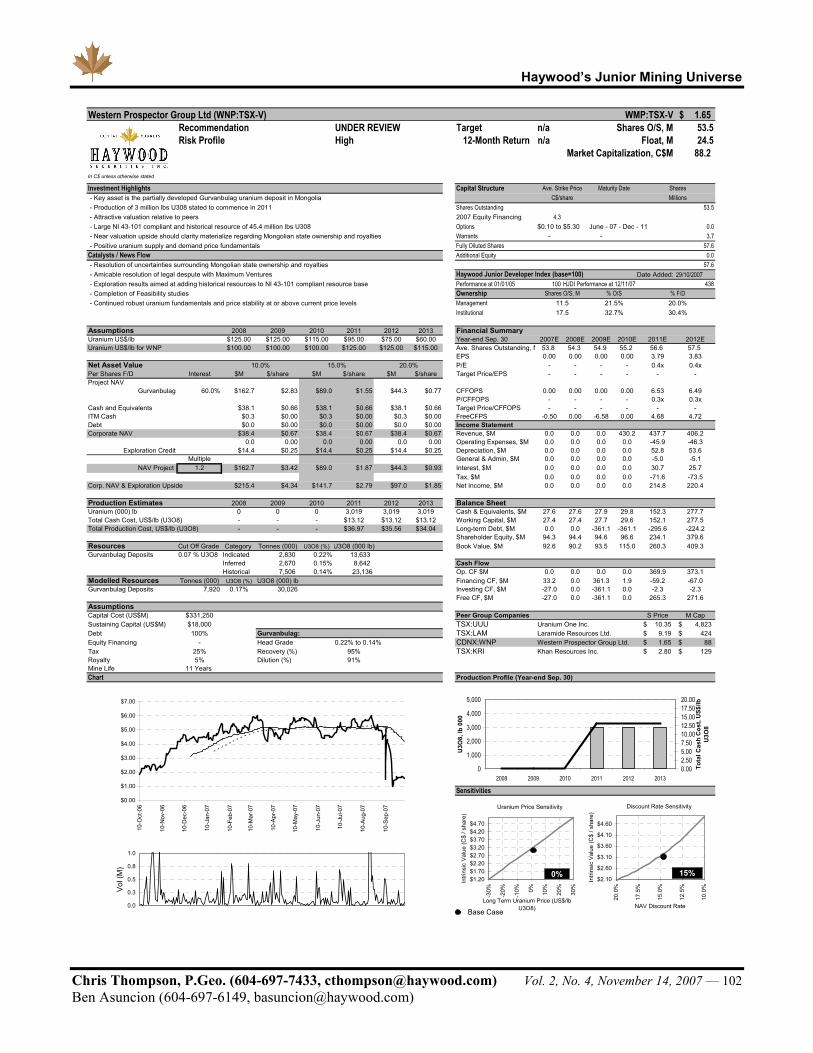
Haywood’s Junior Mining Universe
Chris Thompson, P.Geo. (604-697-7433, [email protected]) Vol. 2, No. 4, November 14, 2007 — 102 Ben Asuncion (604-697-6149, [email protected])
Western Prospector Group Ltd (WNP:TSX-V) WMP:TSX-V 1.65$ Recommendation UNDER REVIEW Target n/a Shares O/S, M 53.5Risk Profile High 12-Month Return n/a Float, M 24.5
Market Capitalization, C$M 88.2
In C$ unless otherwise stated
Investment Highlights Capital Structure - Key asset is the partially developed Gurvanbulag uranium deposit in Mongolia - Production of 3 million lbs U308 stated to commence in 2011 Shares Outstanding 53.5 - Attractive valuation relative to peers 2007 Equity Financing 4.3 - Large NI 43-101 compliant and historical resource of 45.4 million lbs U308 Options $0.10 to $5.30 June - 07 - Dec - 11 0.0 - Near valuation upside should clarity materialize regarding Mongolian state ownership and royalties Warrants - - 3.7 - Positive uranium supply and demand price fundamentals Fully Diluted Shares 57.6Catalysts / News Flow Additional Equity 0.0 - Resolution of uncertainties surrounding Mongolian state ownership and royalties 57.6 - Amicable resolution of legal despute with Maximum Ventures Haywood Junior Developer Index (base=100) Date Added: 29/10/2007 - Exploration results aimed at adding historical resources to NI 43-101 compliant resource base Performance at 01/01/05 100 HJDI Performance at 12/11/07 438 - Completion of Feasibility studies Ownership - Continued robust uranium fundamentals and price stability at or above current price levels Management
Institutional
Assumptions 2008 2009 2010 2011 2012 2013 Financial SummaryUranium US$/lb $125.00 $125.00 $115.00 $95.00 $75.00 $60.00 Year-end Sep. 30 2007E 2008E 2009E 2010E 2011E 2012EUranium US$/lb for WNP $100.00 $100.00 $100.00 $125.00 $125.00 $115.00 Ave. Shares Outstanding, M 53.8 54.3 54.9 55.2 56.6 57.5
EPS 0.00 0.00 0.00 0.00 3.79 3.83Net Asset Value P/E - - - - 0.4x 0.4xPer Shares F/D Interest $M $/share $M $/share $M $/share Target Price/EPS - - - - - - Project NAV
Gurvanbulag 60.0% $162.7 $2.83 $89.0 $1.55 $44.3 $0.77 CFFOPS 0.00 0.00 0.00 0.00 6.53 6.49 P/CFFOPS - - - - 0.3x 0.3x
Cash and Equivalents $38.1 $0.66 $38.1 $0.66 $38.1 $0.66 Target Price/CFFOPS - - - - - - ITM Cash $0.3 $0.00 $0.3 $0.00 $0.3 $0.00 FreeCFPS -0.50 0.00 -6.58 0.00 4.68 4.72Debt $0.0 $0.00 $0.0 $0.00 $0.0 $0.00 Income StatementCorporate NAV $38.4 $0.67 $38.4 $0.67 $38.4 $0.67 Revenue, $M 0.0 0.0 0.0 430.2 437.7 406.2
0.0 0.00 0.0 0.00 0.0 0.00 Operating Expenses, $M 0.0 0.0 0.0 0.0 -45.9 -46.3Exploration Credit $14.4 $0.25 $14.4 $0.25 $14.4 $0.25 Depreciation, $M 0.0 0.0 0.0 0.0 52.8 53.6
Multiple General & Admin, $M 0.0 0.0 0.0 0.0 -5.0 -5.1NAV Project 1.2 $162.7 $3.42 $89.0 $1.87 $44.3 $0.93 Interest, $M 0.0 0.0 0.0 0.0 30.7 25.7
Tax, $M 0.0 0.0 0.0 0.0 -71.6 -73.5Corp. NAV & Exploration Upside $215.4 $4.34 $141.7 $2.79 $97.0 $1.85 Net Income, $M 0.0 0.0 0.0 0.0 214.8 220.4 Production Estimates 2008 2009 2010 2011 2012 2013 Balance SheetUranium (000) lb 0 0 0 3,019 3,019 3,019 Cash & Equivalents, $M 27.6 27.6 27.9 29.8 152.3 277.7Total Cash Cost, US$/lb (U3O8) - - - $13.12 $13.12 $13.12 Working Capital, $M 27.4 27.4 27.7 29.6 152.1 277.5Total Production Cost, US$/lb (U3O8) - - - $36.97 $35.56 $34.04 Long-term Debt, $M 0.0 0.0 -361.1 -361.1 -295.6 -224.2
Shareholder Equity, $M 94.3 94.4 94.6 96.6 234.1 379.6Resources Cut Off Grade Category Tonnes (000) U3O8 (%) U3O8 (000 lb) Book Value, $M 92.6 90.2 93.5 115.0 260.3 409.3Gurvanbulag Deposits 0.07 % U3O8 Indicated 2,830 0.22% 13,633
Inferred 2,670 0.15% 8,642 Cash FlowHistorical 7,506 0.14% 23,136 Op. CF $M 0.0 0.0 0.0 0.0 369.9 373.1
Modelled Resources Tonnes (000) U3O8 (%) U3O8 (000) lb Financing CF, $M 33.2 0.0 361.3 1.9 -59.2 -67.0Gurvanbulag Deposits 7,920 0.17% 30,026 Investing CF, $M -27.0 0.0 -361.1 0.0 -2.3 -2.3 Free CF, $M -27.0 0.0 -361.1 0.0 265.3 271.6AssumptionsCapital Cost (US$M) $331,250 Peer Group Companies S Price M CapSustaining Capital (US$M) $18,000 TSX:UUU Uranium One Inc. 10.35$ 4,823$ Debt 100% Gurvanbulag: TSX:LAM Laramide Resources Ltd. 9.19$ 424$ Equity Financing - Head Grade CDNX:WNP Western Prospector Group Ltd. 1.65$ 88$ Tax 25% Recovery (%) 95% TSX:KRI Khan Resources Inc. 2.80$ 129$ Royalty 5% Dilution (%) 91%Mine Life 11 Years Chart Production Profile (Year-end Sep. 30)
Sensitivities
17.521.5%32.7%
20.0%30.4%
Shares O/S, M % O/S % F/D11.5
Ave. Strike Price Maturity Date SharesC$/share Millions
10.0% 15.0% 20.0%
0.22% to 0.14%
0
1,000
2,000
3,000
4,000
5,000
2008 2009 2010 2011 2012 2013
U3O
8, lb
000
0.002.505.007.5010.0012.5015.0017.5020.00
Tota
l Cas
h C
ost,
US$
/lb
U3O
8
$0.00
$1.00
$2.00
$3.00
$4.00
$5.00
$6.00
$7.00
10-O
ct-0
6
10-N
ov-0
6
10-D
ec-0
6
10-J
an-0
7
10-F
eb-0
7
10-M
ar-0
7
10-A
pr-0
7
10-M
ay-0
7
10-J
un-0
7
10-J
ul-0
7
10-A
ug-0
7
10-S
ep-0
7
0.0
0.3
0.5
0.8
1.0
1
Vol
(M)
Uranium Price Sensitivity
$1.20$1.70$2.20$2.70$3.20$3.70$4.20$4.70
-30%
-20%
-10% 0% 10%
20%
30%
Long Term Uranium Price (US$/lb U3O8)
Intri
nsic
Val
ue (C
$ / s
hare
)
Discount Rate Sensitivity
$2.10
$2.60
$3.10
$3.60
$4.10
$4.60
20.0
%
17.5
%
15.0
%
12.5
%
10.0
%
NAV Discount Rate
Intri
nsic
Val
ue (C
$ / s
hare
)
Base Case
0% 15%
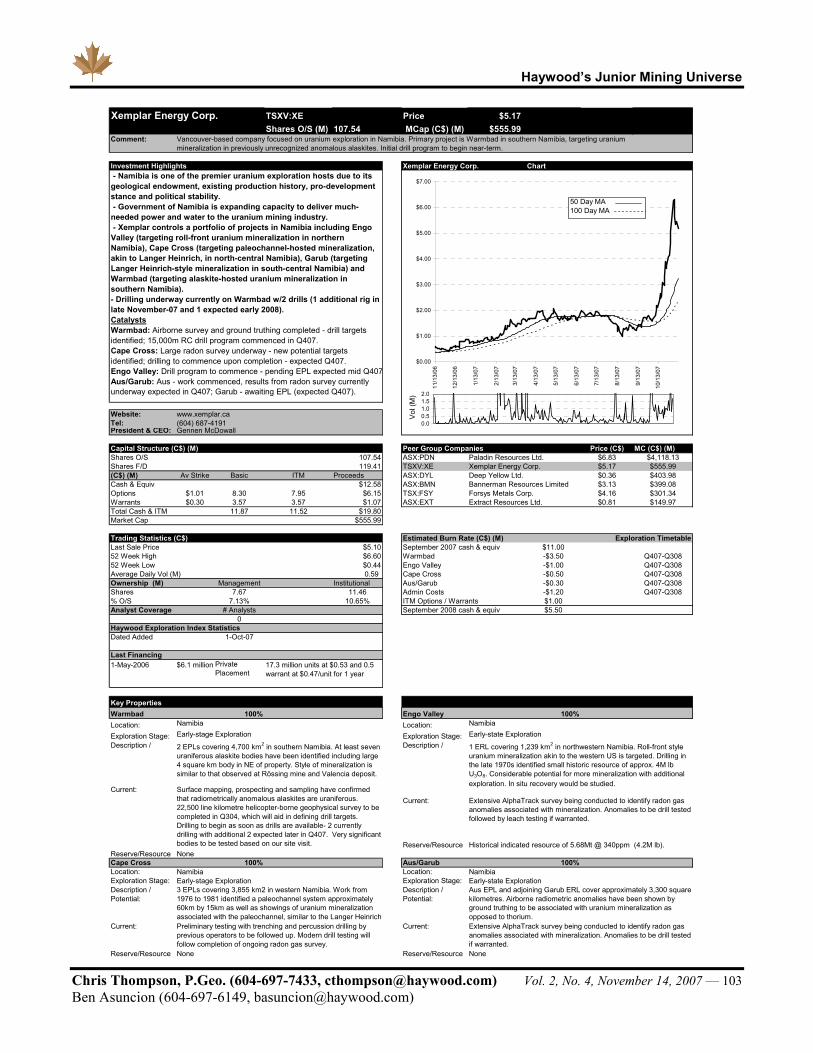
Haywood’s Junior Mining Universe
Chris Thompson, P.Geo. (604-697-7433, [email protected]) Vol. 2, No. 4, November 14, 2007 — 103 Ben Asuncion (604-697-6149, [email protected])
TSXV:XE Price $5.17 Shares O/S (M) 107.54 MCap (C$) (M) $555.99
Comment:
11/12/2007Investment Highlights Xemplar Energy Corp. Chart
Website: www.xemplar.caTel:President & CEO:
Capital Structure (C$) (M) Peer Group Companies Price (C$) MC (C$) (M)Shares O/S 107.54 ASX:PDN $6.83 $4,118.13Shares F/D 119.41 TSXV:XE $5.17 $555.99(C$) (M) Av Strike Basic ITM Proceeds ASX:DYL $0.36 $403.98Cash & Equiv $12.58 ASX:BMN $3.13 $399.08Options $1.01 8.30 7.95 $6.15 TSX:FSY $4.16 $301.34Warrants $0.30 3.57 3.57 $1.07 ASX:EXT $0.81 $149.97Total Cash & ITM 11.87 11.52 $19.80Market Cap $555.99
Trading Statistics (C$) Estimated Burn Rate (C$) (M)Last Sale Price $5.10 September 2007 cash & equiv $11.00 52 Week High $6.60 Warmbad -$3.50 Q407-Q30852 Week Low $0.44 Engo Valley -$1.00 Q407-Q308Average Daily Vol (M) 0.59 Cape Cross -$0.50 Q407-Q308Ownership (M) Management Institutional Aus/Garub -$0.30 Q407-Q308Shares 7.67 11.46 Admin Costs -$1.20 Q407-Q308% O/S 7.13% 10.65% ITM Options / Warrants $1.00 Analyst Coverage # Analysts September 2008 cash & equiv $5.50
0 Haywood Exploration Index StatisticsDated Added 1-Oct-07
Last Financing1-May-2006 $6.1 million
Key PropertiesWarmbad 100% Engo Valley 100%Location: Location: Exploration Stage: Exploration Stage:Description / Description /
Current:Current:
Reserve/ResourceReserve/ResourceCape Cross 100% Aus/Garub 100%Location: Location: Exploration Stage: Exploration Stage:Description / Potential:
Description / Potential:
Current: Current:
Reserve/Resource Reserve/Resource
Early-state Exploration
2 EPLs covering 4,700 km2 in southern Namibia. At least seven uraniferous alaskite bodies have been identified including large 4 square km body in NE of property. Style of mineralization is similar to that observed at Rössing mine and Valencia deposit.
Paladin Resources Ltd.Xemplar Energy Corp.Deep Yellow Ltd.Bannerman Resources LimitedForsys Metals Corp.Extract Resources Ltd.
Xemplar Energy Corp.
Vancouver-based company focused on uranium exploration in Namibia. Primary project is Warmbad in southern Namibia, targeting uranium mineralization in previously unrecognized anomalous alaskites. Initial drill program to begin near-term.
(604) 687-4191
- Namibia is one of the premier uranium exploration hosts due to its geological endowment, existing production history, pro-development stance and political stability. - Government of Namibia is expanding capacity to deliver much-needed power and water to the uranium mining industry. - Xemplar controls a portfolio of projects in Namibia including Engo Valley (targeting roll-front uranium mineralization in northern Namibia), Cape Cross (targeting paleochannel-hosted mineralization, akin to Langer Heinrich, in north-central Namibia), Garub (targeting Langer Heinrich-style mineralization in south-central Namibia) and Warmbad (targeting alaskite-hosted uranium mineralization in southern Namibia).- Drilling underway currently on Warmbad w/2 drills (1 additional rig in late November-07 and 1 expected early 2008).CatalystsWarmbad: Airborne survey and ground truthing completed - drill targets identified; 15,000m RC drill program commenced in Q407.Cape Cross: Large radon survey underway - new potential targets identified; drilling to commence upon completion - expected Q407.Engo Valley: Drill program to commence - pending EPL expected mid Q407Aus/Garub: Aus - work commenced, results from radon survey currently underway expected in Q407; Garub - awaiting EPL (expected Q407).
Private Placement
17.3 million units at $0.53 and 0.5 warrant at $0.47/unit for 1 year
Gennen McDowall
Exploration Timetable
None None
3 EPLs covering 3,855 km2 in western Namibia. Work from 1976 to 1981 identified a paleochannel system approximately 60km by 15km as well as showings of uranium mineralization associated with the paleochannel, similar to the Langer Heinrich
Early-stage Exploration
1 ERL covering 1,239 km2 in northwestern Namibia. Roll-front style uranium mineralization akin to the western US is targeted. Drilling in the late 1970s identified small historic resource of approx. 4M lb U3O8. Considerable potential for more mineralization with additional exploration. In situ recovery would be studied.
Extensive AlphaTrack survey being conducted to identify radon gas anomalies associated with mineralization. Anomalies to be drill tested followed by leach testing if warranted.
Aus EPL and adjoining Garub ERL cover approximately 3,300 square kilometres. Airborne radiometric anomalies have been shown by ground truthing to be associated with uranium mineralization as opposed to thorium.Extensive AlphaTrack survey being conducted to identify radon gas anomalies associated with mineralization. Anomalies to be drill tested if warranted.
Historical indicated resource of 5.68Mt @ 340ppm (4.2M lb).
Preliminary testing with trenching and percussion drilling by previous operators to be followed up. Modern drill testing will follow completion of ongoing radon gas survey.
Namibia
Early-state Exploration
Surface mapping, prospecting and sampling have confirmed that radiometrically anomalous alaskites are uraniferous. 22,500 line kilometre helicopter-borne geophysical survey to be completed in Q304, which will aid in defining drill targets. Drilling to begin as soon as drills are available- 2 currently drilling with additional 2 expected later in Q407. Very significant bodies to be tested based on our site visit.
Namibia Namibia
None
Early-stage Exploration
Namibia
$0.00
$1.00
$2.00
$3.00
$4.00
$5.00
$6.00
$7.00
11/1
3/06
12/1
3/06
1/13
/07
2/13
/07
3/13
/07
4/13
/07
5/13
/07
6/13
/07
7/13
/07
8/13
/07
9/13
/07
10/1
3/07
0.00.51.01.52.0
1
Vol
(M)
50 Day MA100 Day MA

Haywood’s Junior Mining Universe
Chris Thompson, P.Geo. (604-697-7433, [email protected]) Vol. 2, No. 4, November 14, 2007 — 104 Ben Asuncion (604-697-6149, [email protected])
Distribution This report is not for distribution to non-institutional clients in the United States.
Analyst Certification I, Chris Thompson, hereby certify that the views expressed in this report (which includes the rating assigned to the issuer’s shares as well as the analytical substance and tone of the report) accurately reflect my/our personal views about the subject securities and the issuer. No part of my/our compensation was, is, or will be directly or indirectly related to the specific recommendations.
Important Disclosures This report is prepared by Haywood Securities Inc. for use by Haywood Securities Inc., Haywood Securities (USA) Inc. and Haywood Securities (UK) Limited and their clients. Haywood Securities Inc. is a Canadian broker-dealer and a member of the Toronto Stock Exchange and the Canadian Venture Exchange. Haywood Securities (USA) Inc. is a wholly owned subsidiary of Haywood Securities Inc., registered with the U.S. Securities and Exchange Commission, and is a member of the National Association of Securities Dealers (NASD) and the Securities Investor Protection Corporation (SIPC).
Haywood Securities, Inc., and Haywood Securities (USA) Inc. do have officers in common however, none of those common officers affect or control the ratings given a specific issuer or which issuer will be the subject of Research coverage. In addition, the firm does maintain and enforce written policies and procedures reasonably designed to prevent influence on the activities of affiliated analysts.
Haywood analysts are salaried employees who may receive a performance bonus that may be derived, in part, from corporate finance income.
Of the companies included in the report the following Important Disclosures apply:
Ticker
Company (The following list of companies are NOT
under formal Haywood coverage) 1 2 3 4 5 6 7 8 TSXV:AZX Alexandria Minerals Corp. X TSXV:XAU AuEx Ventures Inc. TSXV:BHV Bellhaven Copper & Gold Inc. X X ASX:BMN Bannerman Resources Limited X TSXV:CXB Calibre Mining Corp. X TSXV:CPP Coastport Capital, Inc. X TSXV:CXX Crosshair Exploration & Mining Corp TSXV:DSP Diamondex Resources Ltd. TSXV:DDN Diamonds North Resources Ltd. X TSXV:XRC Exeter Resources Corp. ASX:EXT Extract Resources Ltd. X X X TSXV:FDC Forum Uranium Corp. X ASX:FSN Fusion Resources Limited TSXV:HAT Hathor Exploration Ltd. X TSXV:HUD Hudson Resources Inc. TSXV:IME Indicator Minerals Inc. X TSX:INV International Nickel Ventures Corp. TSXV:MEX Midlands Minerals Corporation X TSXV:MIO Mindoro Resources Ltd. TSXV:OK Orko Silver Corp. TSXV:PEZ Pediment Exploration Ltd. X

Haywood’s Junior Mining Universe
Chris Thompson, P.Geo. (604-697-7433, [email protected]) Vol. 2, No. 4, November 14, 2007 — 105 Ben Asuncion (604-697-6149, [email protected])
TSXV:PXP Pitchstone Exploration Ltd. X TSXV:PEM Premium Exploration Inc. TSXV:NIC Pure Nickel Inc. X TSXV:SCM Sacre-Coeur Minerals Ltd. TSXV:SLK Selkirk Metals Corp. TSXV :SRM Shear Minerals Ltd. TSX:SWY Stornoway Diamond Corp. X X X ASX:TGS Tiger Resources Ltd. X TSXV:XE Xemplar Energy Corp.
Ticker
Company (The following list of companies ARE under
formal Haywood coverage) 1 2 3 4 5 6 7 8 TSX:AVM Anvil Mining Limited X X X TSX:ANO Anatolia Minerals Dvlpt Ltd. X X TSX:AQI Aquiline Resources Inc. TSXV:AXM AXMIN Inc. X X X TSX:SGA Australian Solomons Gold Limited X X TSX:BAA Banro Corporation TSX:CHD Chariot Resources Limited X TSX:KRY Crystallex International Corp. X X TSX:DGC Detour Gold Corporation X X TSX:FM First Quantum Minerals Ltd. X TSX:GBS GBS Gold International Inc. X X X X TSX:KAT Katanga Mining Limited X X TSX:KRI Khan Resources Inc. X X X X TSX:LAM Laramide Resources Ltd. X TSX:MOL Moly Mines Limited X X TSX:MGL Moto Goldmines Ltd. X X TSX:NSU Nevsun Resources Ltd. X X TSX:SRZ Strategic Resource Acquisition Corportation. TSX:TL TEAL Exploration & Mining Inc. X TSXV:WNP Western Prospector Group Ltd. X X
1 The Analyst(s) preparing this report (or a member of the Analysts’ households) have a financial interest in this company. 2 As of the end of the month immediately preceding this publication either Haywood Securities, Inc., its officers or directors
beneficially owned 1% or more of this company. 3 Haywood Securities, Inc. has reviewed lead projects of this company and a portion of the expenses for this travel have
been reimbursed by the issuer. 4 Haywood Securities Inc. or an Affiliate has managed or co-managed a public offering of securities for this company in the
last 12 months. 5 Haywood Securities, Inc. or an Affiliate has received compensation for investment banking services from this company in
the past 12 months 6 Haywood Securities, Inc. or an Affiliate has received compensation for investment banking services from this company in
the past 24 months 7 Haywood Securities, Inc. is restricted on this company at the time of publication 8 Haywood Securities, Inc. or an Affiliate expects to receive or intends to seek compensation for investment banking services
from this company in the next three months

Haywood’s Junior Mining Universe
Chris Thompson, P.Geo. (604-697-7433, [email protected]) Vol. 2, No. 4, November 14, 2007 — 106 Ben Asuncion (604-697-6149, [email protected])
Other material conflict of interest of the research analyst of which the research analyst or member knows or has reason to know at the time of publication or at the time of public appearance:
• As a collective, Haywood Securities Inc. owns greater than 10% if Calibre Mining Corp. (CXB-V).
Rating Structure Each company within analyst’s universe, or group of companies covered, is assigned a rating to represent how the analyst feels the stock will perform in comparison with the other companies, in that specific sector, over the upcoming 12 month period.
SECTOR OUTPERFORM – Haywood’s top rating category. The analyst believes that the security will outperform its sector. Furthermore, the shares are forecast to provide attractive returns measured against alternative investments when considering risk profiles. The rating carries a minimum total return threshold of 15% for equities and 12% for trusts. The rating applies to companies that have tangible underlying assets that give a measure of support to the market valuation. The rating category considers both the absolute and relative values in assigning the highest rating on the security.
SECTOR PERFORM – The analyst believes that the security will trade with tight correlation to its underlying sector. Furthermore, the target price (together with any anticipated distributions) is at or above the market price, and forecast risk-adjusted returns are attractive relative to alternative investments.
SECTOR UNDERPERFORM – Investors are advised to sell the security or hold alternative securities within the sector. Stocks in this category are expected to underperform relative to their sector. The category also represents stocks with unattractive forecast returns relative to alternative investments.
The above ratings are determined by the analyst at the time of publication. On occasion, total returns may fall outside of the ranges due to market price movements and/or short term volatility. At the discretion of Haywood’s Management, these deviations may be permitted after careful consideration
Other Ratings TENDER – The analyst is recommending that investors tender to a specific offering for the company’s stock.
RESEARCH COMMENT – An analyst comment about an issuer event that does not include a rating or recommendation.
UNDER REVIEW – Placing a stock Under Review does not revise the current rating or recommendation of the analyst. A stock will be placed Under Review when the relevant company has a significant material event with further information pending or to be announced. An analyst will place a stock Under Review while he/she awaits sufficient information to re-evaluation the company’s financial situation.
COVERAGE DROPPED – Haywood Securities will no longer cover the issuer. Haywood will provide notice to clients whenever coverage of an issuer is discontinued.
* Haywood’s current rating structure (outlined above) does not correlate to the 3-tiered BUY, HOLD, SELL structure required by the NASD and NYSE. Our ratings of Sector Outperform, Sector Perform and Sector Underperform most closely correspond to Buy, Hold/Neutral and Sell respectively however, as described above, our assigned ratings take into account the relevant sector.

Haywood’s Junior Mining Universe
Chris Thompson, P.Geo. (604-697-7433, [email protected]) Vol. 2, No. 4, November 14, 2007 — 107 Ben Asuncion (604-697-6149, [email protected])
Rating Distribution June 15, 2007 - September 15, 2007
83%
8%
5%
1%3%
Buy
Hold
Sell
Tender
Coverage Dropped
Investment Banking Services Provided within the past 12 months as of September 15, 2007
97%
3% 0% 0% 0%0%
20%
40%
60%
80%
100%
Buy Hold Sell Tender CoverageDropped
Haywood's focus is to search for undervalued companies which analysts believe may achieve attractive risk-adjusted returns. This research coverage on potentially undervalued companies may result in an outweighed percentage of companies rated as Sector Outperform. Management regularly reviews rating and targets in all sectors to ensure fairness and accuracy.
For further information on Haywood Securities’ research dissemination policies, please visit: http://www.haywood.com/research_dissemination.asp
Risk Profile Parameters SPECULATIVE: – Investment for risk accounts only. Companies within this category carry greater financial and/or execution risk. All junior/venture companies that carry great financial and/or liquidity risk will be tagged “SPECULATIVE”. A stock indicating a SPECULATIVE risk is determined from sector specific criteria outlined below listed below.
Risk Profile Parameters – Mining and Minerals Sector Forecast Risk: High – Haywood forecasts are below guidance. The Company has a history of missing targets and/or Haywood expects guidance to be lowered. Limited hedging increases commodity leverage. Forecasts reflect higher commodity prices or production relative to guidance. Moderate – Haywood forecasts are generally in line with guidance. The Company has a history of meeting or exceeding guidance. Forecasts are consistent with current commodity pricing and production guidance. Hedging is in line with peers. Low – Haywood forecasts exceed guidance. The Company has a history of meeting or exceeding guidance. Forecasts allow for modestly lower commodity pricing or production levels. Commodity hedging lowers volatility relative to peers.
Financial Risk: High – The business plan is not fully funded, but requires debt and/or equity financing. The exploration program is funded for two years or less. This categorization does not predict whether the additional funds will be raised. Moderate – The development plan is fully funded, with the exploration program funded for three years or more. The Company’s debt is rated below investment grade. Low – The Company is fully funded. Its debt is rated investment grade and/or the Company has a history of profitability or dividend payments in each of the last three years.
Valuation Risk: High – The current valuation is at the high end of historic levels and/or at a premium to peers. The valuation reflects considerable exploration success and/or commodity appreciation. Where applicable, the current capitalization exceeds the DCF evaluation by more than 50%. Moderate – The current valuation is within historic ranges and generally consistent with peers. The valuation reflects reasonable exploration success and/or commodity appreciation. Where applicable, the current capitalization exceeds the DCF valuation by 15% to 50%. Low – The current valuation is at the low end of historic ranges and at a discount to peer valuations. The valuation
Haywood’s Junior Mining Universe
Chris Thompson, P.Geo. (604-697-7433, [email protected]) Vol. 2, No. 4, November 14, 2007 — 108 Ben Asuncion (604-697-6149, [email protected])
reflects limited new exploration success and no commodity appreciation. Where applicable, the current capitalization exceeds the DCF valuation by less than 15% or falls below the current market value.
Political Risk: High – Currently no industry activity or infrastructure exists. Government opposition is significant. Obtaining permits is challenging. Moderate – Industry activity or infrastructure is minimal. Government at national, regional, and local levels is indifferent. Obtaining permits is relatively straightforward. Low – Industry activity and infrastructure exist. Government is supportive. Obtaining permits is facilitated.
Disclaimers Estimates and projections contained herein, whether or not our own, are based on assumptions that we believe to be reasonable. The information presented, while obtained from sources we believe reliable, is checked but not guaranteed against errors or omissions.
Haywood Securities Inc., its subsidiaries and their respective officers, directors, and employees may hold positions in the securities mentioned and may purchase and/or sell them from time to time.
Haywood Securities, or certain of its affiliated companies, may from time to time receive a portion of commissions or other fees derived from the trading or financings conducted by other affiliated companies in the covered security.
This report is neither a solicitation for the purchase of securities nor an offer of securities. Our ratings are intended only for clients of Haywood Securities Inc. Haywood Securities (USA) Inc., and those of Haywood Securities (UK) Limited and such clients are cautioned to consult the respective firm prior to purchasing or selling any security recommended or views contained in this report. Haywood Securities (UK) Limited (“HSUK”) is a wholly owned subsidiary of Haywood Securities Inc. authorized and regulated in the UK by the Financial Services Authority as a stock broker and investment adviser and is a member of the London Stock Exchange.
This report has been approved by HSUK for the purposes of section 21 of the UK’s Financial Services and Markets Act 2000.If you wish to contact HSUK please email D. Kim Gorius at [email protected].
If you are a UK resident private customer your attention is drawn to the risk warnings set out below:
Haywood Securities Inc or its subsidiaries or respective officers, directors or employees have or may have a material interest in the securities to which this report relates.
Past performance should not be seen as an indication of future performance. The investments to which this report relates can fluctuate in value and accordingly you are not certain to make a profit on any investment: you could make a loss.
Changes in the rates of exchange between currencies may cause the value of your investment to fluctuate.
If you are a UK resident private customer and you propose to do business with Haywood Securities Inc, please take note of the following:
Any investment services undertaken on your behalf by Haywood Securities Inc are not covered by the rules and regulations made for the protection of private investors in the UK. This means that you will not have the benefit of rights designed to protect investors under the Financial Services and Markets Act 2000 and under the rules of the Financial Services Authority (“FSA”).In particular, you will not benefit from the following UK protections: (a) the right to claim through the UK’s Financial Services Compensation Scheme for losses resulting in the unlikely event of our default; (b) in the event of a dispute, access to the UK’s Financial Ombudsman Service; (c) protection of money held on your behalf under the FSA’s Client Money Rules.
Corporate Head Office400 Burrard Street, Suite 2000
Vancouver, British ColumbiaV6C 3A6
telephone: 604-697-7100fax: 604-697-7499
Haywood Securities, Calgary808 First Street SW, Suite 301Calgary, AlbertaT2P 1M9telephone: 403-509-1900fax: 403-609-1999
Haywood Securities, Toronto181 Bay Street, Suite 2910
Bay Wellington Tower, Brookfield PlaceToronto, Ontario
M5J 2T3telephone: 416-507-2300
fax: 416-507-2399
email: [email protected] site: www.haywood.com
RESEARCH
Haywood Securities (UK) Ltd.Ryder Court14 Ryder StreetLondon, EnglandSW1Y 6QBtelephone: +44(0)20 7031 8000fax: +44(0)20 7031 8001
Natural Resources
Stefan Ioannou 416-507-2309Andrew Kaip 416-507-2417Alan Knowles 403-509-1931Kristian Schneck 403-509-1938Kerry Smith 416-507-2306Chris Thompson 604-697-7433Eric Zaunscherb 604-697-6089 Max Zureski 403-509-1926
Ben Asuncion 604-697-6149Josh Clelland 416-507-2437Nick Coutoulakis 416-507-2435Joshua Markle 403-509-1966
Special Situations
David Beasley 416-507-2710Dev Bhangui 416-507-2790Ralph Garcea 416-507-2609Rob Goff 416-507-2740Tania Maciver 416-507-2601Peter Prattas 416-507-2382Terry Thib 416-507-2419
Ian Mashal 416-507-2433Tim Miller 416-507-2339