hcm business intelligence training
TRANSCRIPT

HCM Business
Intelligence Training

Cognos Analytics Introduction | Version 1.0 | 2018 2
Table of Contents
Contents
Introduction ................................................................................................................. 3
Building a Simple List .................................................................................................. 4
Toolbar Icons and Menu Items ...................................................................................... 7
Adding Data ................................................................................................................ 8
Modifying Columns ..................................................................................................... 9
Filters ........................................................................................................................ 11
Deleting a Filter .......................................................................................................... 14
Prompts ..................................................................................................................... 15
Rename Column Headers ........................................................................................... 16
Sorting ....................................................................................................................... 17
Key Concepts ............................................................................................................. 18

Cognos Analytics Introduction | Version 1.0 | 2018 3
Introduction The query report template will provide the workspace to create and build new reports on the business intelligence website.
There is no limit to the number of reports you can create or save.
Keep in mind the reporting tool is web based, so it is important to save the report often to ensure you do not lose changes should the system time out or there be a connection issue which causes you to have to begin again.
HCM to BI connection is one way. Data and information flows from the HCM web portal to the Business Intelligence application. The information generated in the reports does not feed over into the PlanSource HCM system

Cognos Analytics Introduction | Version 1.0 | 2018 4
Building a Simple List List reports present your data in rows and columns. Crosstab and charts are more advanced and only used in special situations. Most reports will be lists.
From the side panel select New, then Report.
From the Template and Themes page, select Blank and then select Ok.
A blank reporting interface appears. To start the report creation process you must select a package and report layout. From the Source tab, select Add Report Data (+). If the Source tab does not display automatically, select the Data icon from the side panel.
In the Open File dialogue box, navigate to a package location, select a package, and then select Open
Navigate following the below file path to access the Delivered Packages.
Team Content>UltiPro BI Content>UltiPro BI for Core HR and Payroll>UltiPro Delivered Packages
Package data items appear on the Source tab

Cognos Analytics Introduction | Version 1.0 | 2018 5
Select the + icon in the center of the work area, and then select List.
Items available for the report layout are listed in the Toolbox, the Pinned section. You can change the default layout objects that appear.
In the Object and Query name dialogue box, rename the object and select a different query, if necessary and then Select Ok.

Cognos Analytics Introduction | Version 1.0 | 2018 6
From the Source tab, expand the package to view the list of data items.

Cognos Analytics Introduction | Version 1.0 | 2018 7
Toolbar Icons and Menu Items The toolbar will provide quick access to commonly used reporting functions. The icons are utilized to edit and manage the reports. The toolbar icons are also located on the report view of the report template.
Hovering over the icons will reveal a short description of each and its properties

Cognos Analytics Introduction | Version 1.0 | 2018 8
Adding Data Data items from the package are utilized to build the report.
To build the report, move data items from the Source tab to the report layout in the work area.
Drag and drop the data items to the report layout or double click on each data item to add it to the report layout.
Click on a data item in the report layout to have the toolbar of editing functions

Cognos Analytics Introduction | Version 1.0 | 2018 9
Modifying Columns After selecting the data fields to appear on the report, the columns may need to be modified.
To move a data field, click on the header value and drag the data field to the left of the data field it should be in front of, make sure you see the flashing black bar.
If a data field is added to the report in error, click on the data item or column header and then click the delete key on your keyboard.
Or you may click on the “more” ellipses icon in the toolbar functions to either Cut or Delete the data element.

Cognos Analytics Introduction | Version 1.0 | 2018 10
NOTE – if you cut the data element from the page, this will not remove it from the Data Items under the Query. The below reflects the “Job” data element item is in the Query Items but not on the report template page.

Cognos Analytics Introduction | Version 1.0 | 2018 11
Filters Filtering will focus a report and minimize processing time by excluding unwanted data. Also, you can utilize filters to look for missing values in a specific column. For example, employees with missing email addresses.
To apply a filter to a data element you can click on the data element and select the filter icon.
Select Edit Filters, click on the green add icon to add a detail filter, then select Advanced

Cognos Analytics Introduction | Version 1.0 | 2018 12
From here you will build your Expression Definition.
You can build a filter using your current data elements on the report template or use a new data element to build a filter.
For example, you may want to build a filter on an organizational level value but not reflect the data element on the report.

Cognos Analytics Introduction | Version 1.0 | 2018 13
Expand the My Employees package, identify the data element and double click or drag/drop it into the Expression Definition box.
Using your functions select the applicable value from the operators functions list or type it into the Expression Definition box, then enter the value.
Cognos Analytics Introduction | Version 1.0 | 2018 14
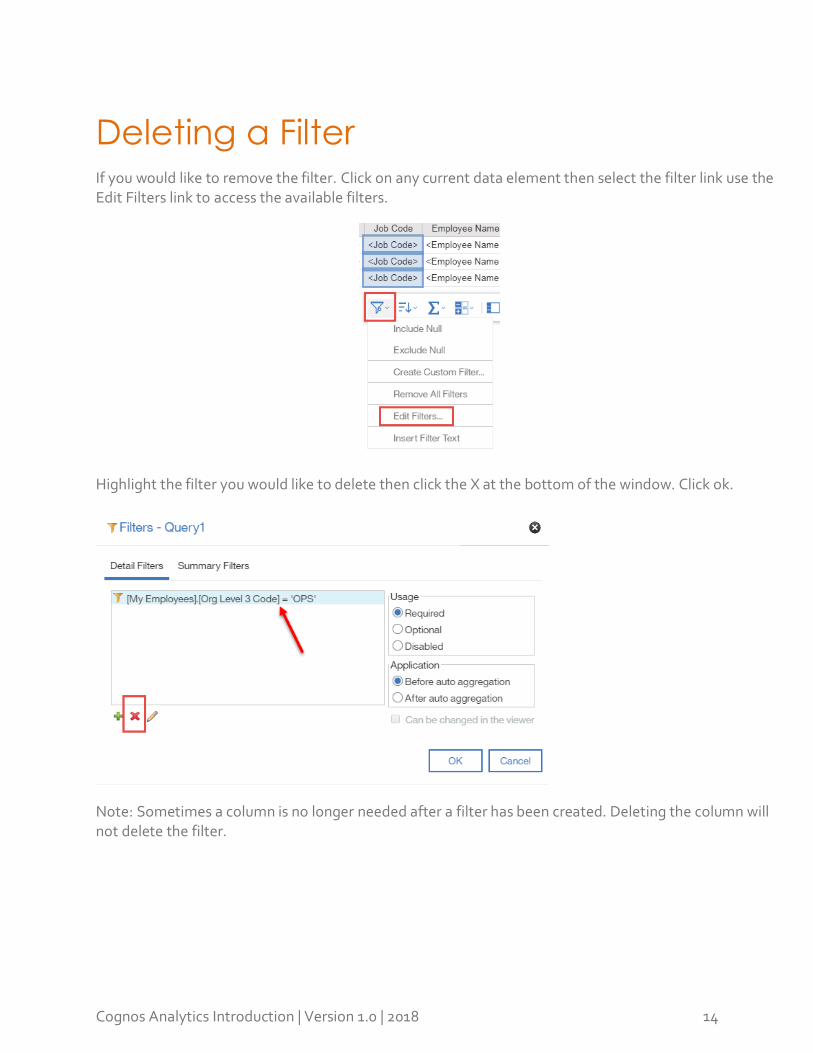
Deleting a Filter If you would like to remove the filter. Click on any current data element then select the filter link use the Edit Filters link to access the available filters.
Highlight the filter you would like to delete then click the X at the bottom of the window. Click ok.
Note: Sometimes a column is no longer needed after a filter has been created. Deleting the column will not delete the filter.
Cognos Analytics Introduction | Version 1.0 | 2018 15
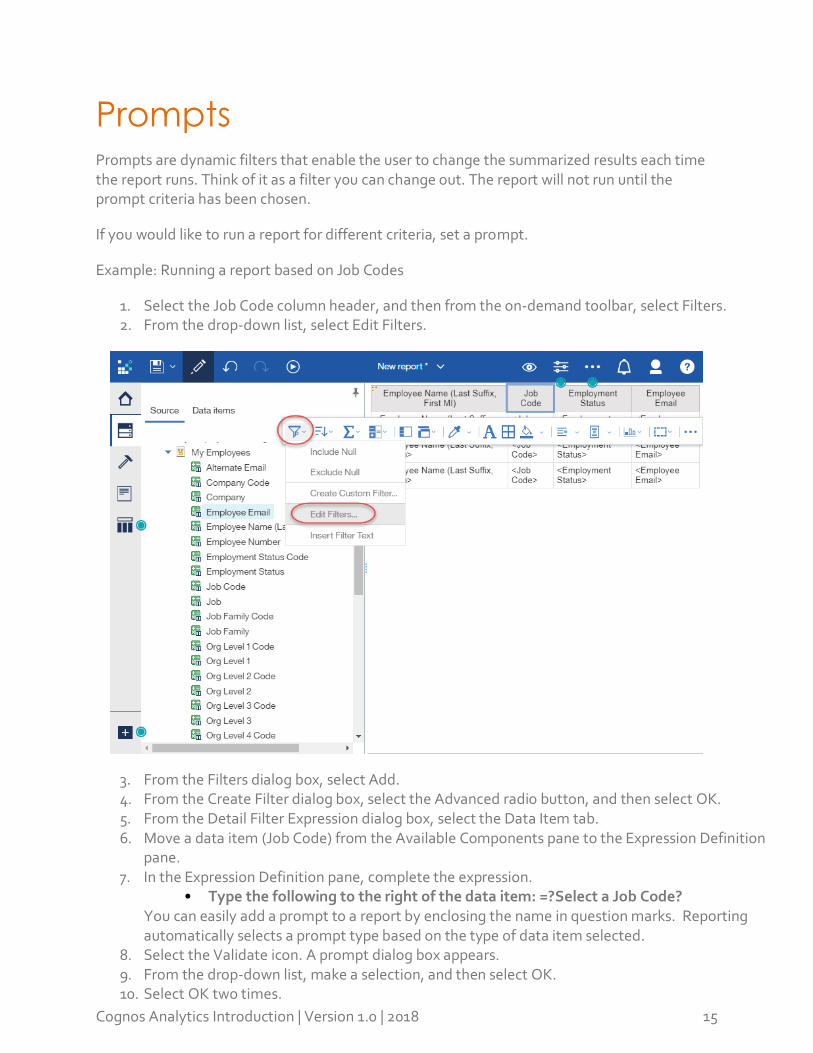
Prompts Prompts are dynamic filters that enable the user to change the summarized results each time the report runs. Think of it as a filter you can change out. The report will not run until the prompt criteria has been chosen.
If you would like to run a report for different criteria, set a prompt.
Example: Running a report based on Job Codes
1. Select the Job Code column header, and then from the on-demand toolbar, select Filters. 2. From the drop-down list, select Edit Filters.
3. From the Filters dialog box, select Add. 4. From the Create Filter dialog box, select the Advanced radio button, and then select OK. 5. From the Detail Filter Expression dialog box, select the Data Item tab. 6. Move a data item (Job Code) from the Available Components pane to the Expression Definition
pane. 7. In the Expression Definition pane, complete the expression.
• Type the following to the right of the data item: =?Select a Job Code? You can easily add a prompt to a report by enclosing the name in question marks. Reporting automatically selects a prompt type based on the type of data item selected.
8. Select the Validate icon. A prompt dialog box appears. 9. From the drop-down list, make a selection, and then select OK. 10. Select OK two times.

Cognos Analytics Introduction | Version 1.0 | 2018 16
Rename Column Headers By default, the column headings will display the name provided in the package.
Select the Column Header (1) then select Show Properties (2). Enter the new label (3). Example: Employee Name

Cognos Analytics Introduction | Version 1.0 | 2018 17
Sorting Sorting data means placing it in a custom order, allowing you to locate the information easily based on the specifications selected. You can sort the data in ascending or descending alphabetical or numerical order.
Reports are sorted by the first column by default arranging the information in ascending order.
Choose the sorting icon from the toolbar: Select the sorting of choice (ascending, descending, don’t sort).
Note: The sorting feature will respond differently when chosen in the toolbar vs selecting
the item from the menu or right clicking on the screen. See on the following page.

Cognos Analytics Introduction | Version 1.0 | 2018 18
Key Concepts
1. There is no limit to the number of reports you can create or save.
2. Keep in mind the reporting tool is web based, so it is important to save the report often
to ensure you do not lose changes should the system time out or there be a connection issue which causes you to have to begin again.
3. HCM to BI connection is one way. Data and information flows from the HCM web portal
to the Business Intelligence application. The information generated in the reports does not feed over into the PlanSource HCM system
4. Some of the editing and managing report options can be found in multiple locations:
the toolbar, menu items and the right click menu ( right click anywhere on the screen)