hdfc top 100 fund top 100 fund presentation...classification as per sebi circular (sebi / ho/ imd/...
TRANSCRIPT
1
July 2019
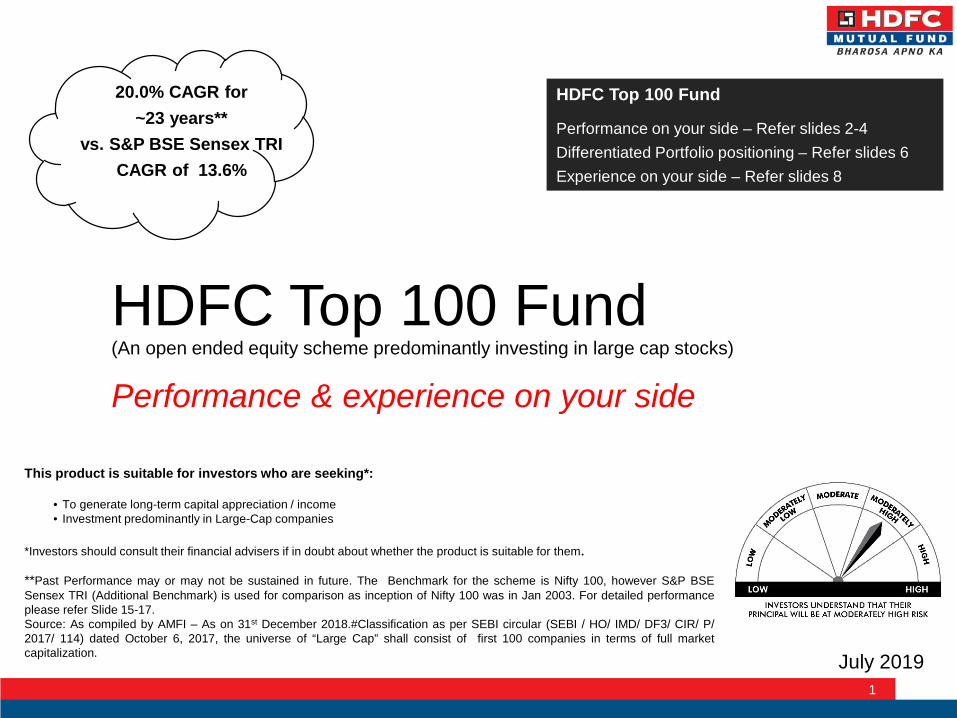
HDFC Top 100 Fund(An open ended equity scheme predominantly investing in large cap stocks)
Performance & experience on your side
This product is suitable for investors who are seeking*:
• To generate long-term capital appreciation / income• Investment predominantly in Large-Cap companies
*Investors should consult their financial advisers if in doubt about whether the product is suitable for them.
**Past Performance may or may not be sustained in future. The Benchmark for the scheme is Nifty 100, however S&P BSESensex TRI (Additional Benchmark) is used for comparison as inception of Nifty 100 was in Jan 2003. For detailed performanceplease refer Slide 15-17.Source: As compiled by AMFI – As on 31st December 2018.#Classification as per SEBI circular (SEBI / HO/ IMD/ DF3/ CIR/ P/2017/ 114) dated October 6, 2017, the universe of “Large Cap” shall consist of first 100 companies in terms of full marketcapitalization.
20.0% CAGR for~23 years**
vs. S&P BSE Sensex TRICAGR of 13.6%
HDFC Top 100 Fund
Performance on your side – Refer slides 2-4Differentiated Portfolio positioning – Refer slides 6Experience on your side – Refer slides 8
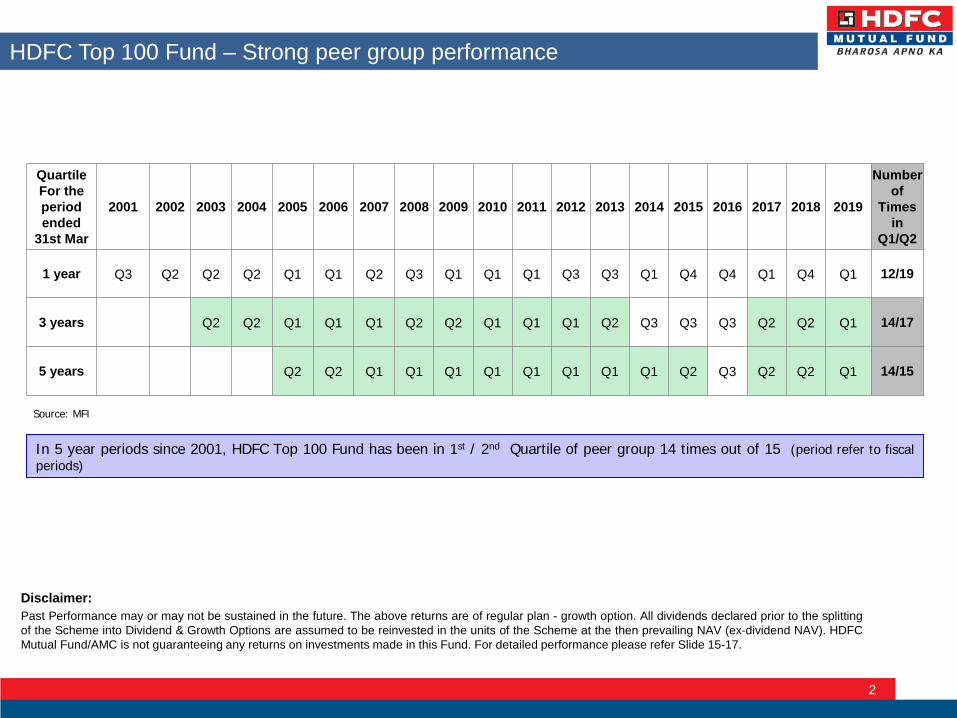
HDFC Top 100 Fund – Strong peer group performance
2
In 5 year periods since 2001, HDFC Top 100 Fund has been in 1st / 2nd Quartile of peer group 14 times out of 15 (period refer to fiscalperiods)
Quartile For the period ended
31st Mar
2001 2002 2003 2004 2005 2006 2007 2008 2009 2010 2011 2012 2013 2014 2015 2016 2017 2018 2019
Numberof
Times in
Q1/Q2
1 year Q3 Q2 Q2 Q2 Q1 Q1 Q2 Q3 Q1 Q1 Q1 Q3 Q3 Q1 Q4 Q4 Q1 Q4 Q1 12/19
3 years Q2 Q2 Q1 Q1 Q1 Q2 Q2 Q1 Q1 Q1 Q2 Q3 Q3 Q3 Q2 Q2 Q1 14/17
5 years Q2 Q2 Q1 Q1 Q1 Q1 Q1 Q1 Q1 Q1 Q2 Q3 Q2 Q2 Q1 14/15
Disclaimer:Past Performance may or may not be sustained in the future. The above returns are of regular plan - growth option. All dividends declared prior to the splittingof the Scheme into Dividend & Growth Options are assumed to be reinvested in the units of the Scheme at the then prevailing NAV (ex-dividend NAV). HDFCMutual Fund/AMC is not guaranteeing any returns on investments made in this Fund. For detailed performance please refer Slide 15-17.
Source: MFI
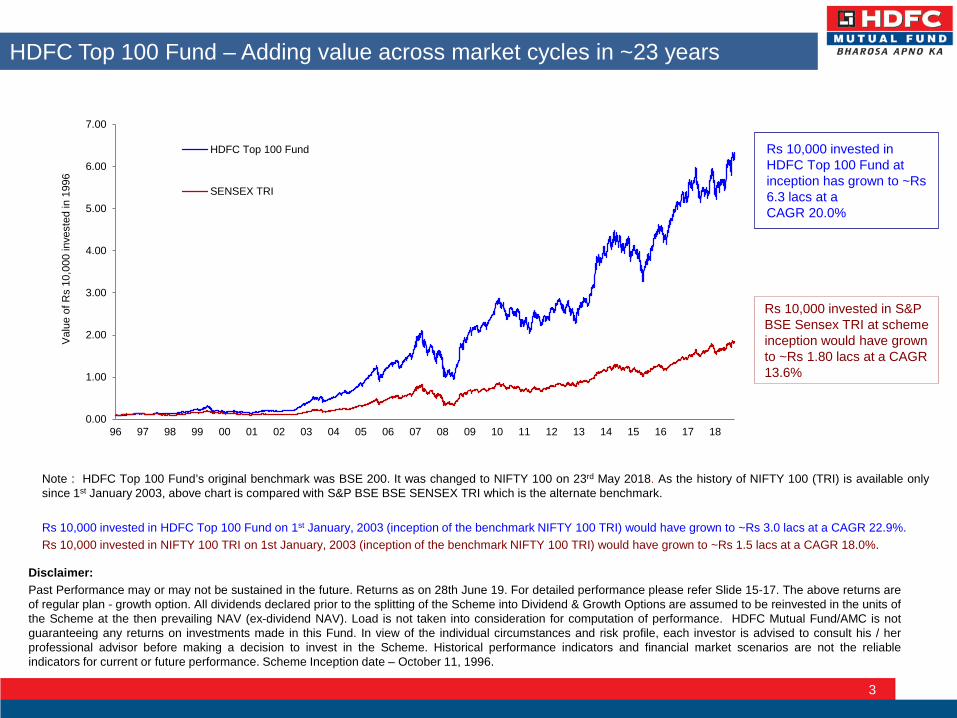
HDFC Top 100 Fund – Adding value across market cycles in ~23 years
3
Rs 10,000 invested in HDFC Top 100 Fund at inception has grown to ~Rs 6.3 lacs at aCAGR 20.0%
Rs 10,000 invested in S&P BSE Sensex TRI at scheme inception would have grown to ~Rs 1.80 lacs at a CAGR 13.6%
Disclaimer:Past Performance may or may not be sustained in the future. Returns as on 28th June 19. For detailed performance please refer Slide 15-17. The above returns areof regular plan - growth option. All dividends declared prior to the splitting of the Scheme into Dividend & Growth Options are assumed to be reinvested in the units ofthe Scheme at the then prevailing NAV (ex-dividend NAV). Load is not taken into consideration for computation of performance. HDFC Mutual Fund/AMC is notguaranteeing any returns on investments made in this Fund. In view of the individual circumstances and risk profile, each investor is advised to consult his / herprofessional advisor before making a decision to invest in the Scheme. Historical performance indicators and financial market scenarios are not the reliableindicators for current or future performance. Scheme Inception date – October 11, 1996.
Note : HDFC Top 100 Fund’s original benchmark was BSE 200. It was changed to NIFTY 100 on 23rd May 2018. As the history of NIFTY 100 (TRI) is available onlysince 1st January 2003, above chart is compared with S&P BSE BSE SENSEX TRI which is the alternate benchmark.
Rs 10,000 invested in HDFC Top 100 Fund on 1st January, 2003 (inception of the benchmark NIFTY 100 TRI) would have grown to ~Rs 3.0 lacs at a CAGR 22.9%.Rs 10,000 invested in NIFTY 100 TRI on 1st January, 2003 (inception of the benchmark NIFTY 100 TRI) would have grown to ~Rs 1.5 lacs at a CAGR 18.0%.
0.00
1.00
2.00
3.00
4.00
5.00
6.00
7.00
96 97 98 99 00 01 02 03 04 05 06 07 08 09 10 11 12 13 14 15 16 17 18
Valu
e of
Rs
10,0
00 in
vest
ed in
199
6
HDFC Top 100 Fund
SENSEX TRI
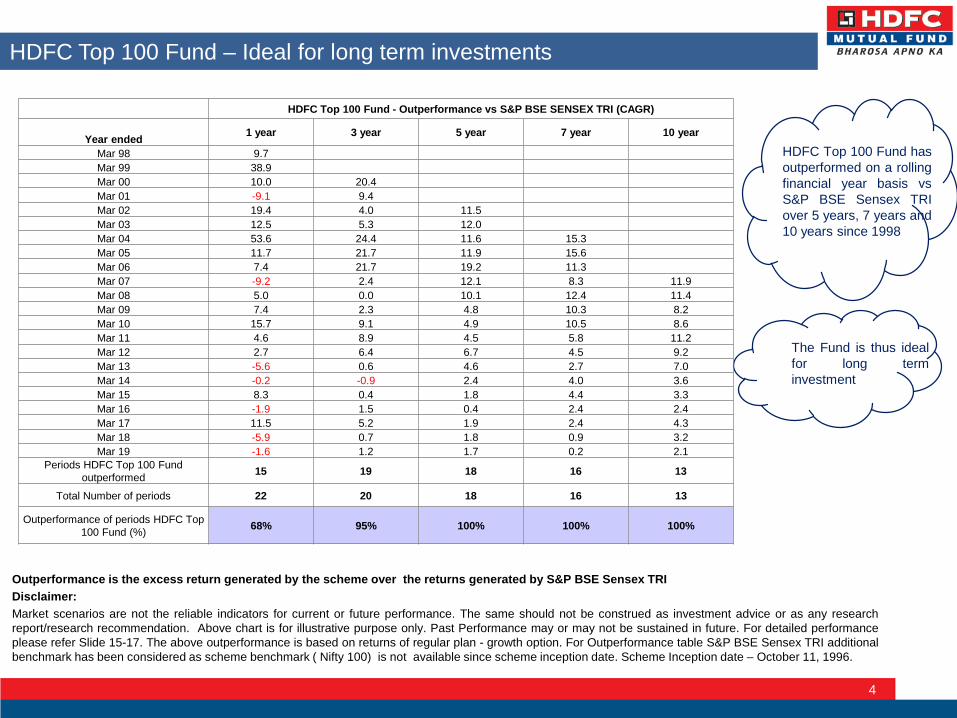
HDFC Top 100 Fund – Ideal for long term investments
4
HDFC Top 100 Fund hasoutperformed on a rollingfinancial year basis vsS&P BSE Sensex TRIover 5 years, 7 years and10 years since 1998
The Fund is thus idealfor long terminvestment
Outperformance is the excess return generated by the scheme over the returns generated by S&P BSE Sensex TRIDisclaimer:Market scenarios are not the reliable indicators for current or future performance. The same should not be construed as investment advice or as any researchreport/research recommendation. Above chart is for illustrative purpose only. Past Performance may or may not be sustained in future. For detailed performanceplease refer Slide 15-17. The above outperformance is based on returns of regular plan - growth option. For Outperformance table S&P BSE Sensex TRI additionalbenchmark has been considered as scheme benchmark ( Nifty 100) is not available since scheme inception date. Scheme Inception date – October 11, 1996.
HDFC Top 100 Fund - Outperformance vs S&P BSE SENSEX TRI (CAGR)
Year ended 1 year 3 year 5 year 7 year 10 year
Mar 98 9.7Mar 99 38.9Mar 00 10.0 20.4Mar 01 -9.1 9.4Mar 02 19.4 4.0 11.5Mar 03 12.5 5.3 12.0Mar 04 53.6 24.4 11.6 15.3Mar 05 11.7 21.7 11.9 15.6Mar 06 7.4 21.7 19.2 11.3Mar 07 -9.2 2.4 12.1 8.3 11.9Mar 08 5.0 0.0 10.1 12.4 11.4Mar 09 7.4 2.3 4.8 10.3 8.2Mar 10 15.7 9.1 4.9 10.5 8.6Mar 11 4.6 8.9 4.5 5.8 11.2Mar 12 2.7 6.4 6.7 4.5 9.2Mar 13 -5.6 0.6 4.6 2.7 7.0Mar 14 -0.2 -0.9 2.4 4.0 3.6Mar 15 8.3 0.4 1.8 4.4 3.3Mar 16 -1.9 1.5 0.4 2.4 2.4Mar 17 11.5 5.2 1.9 2.4 4.3Mar 18 -5.9 0.7 1.8 0.9 3.2Mar 19 -1.6 1.2 1.7 0.2 2.1
Periods HDFC Top 100 Fund outperformed 15 19 18 16 13
Total Number of periods 22 20 18 16 13
Outperformance of periods HDFC Top 100 Fund (%) 68% 95% 100% 100% 100%
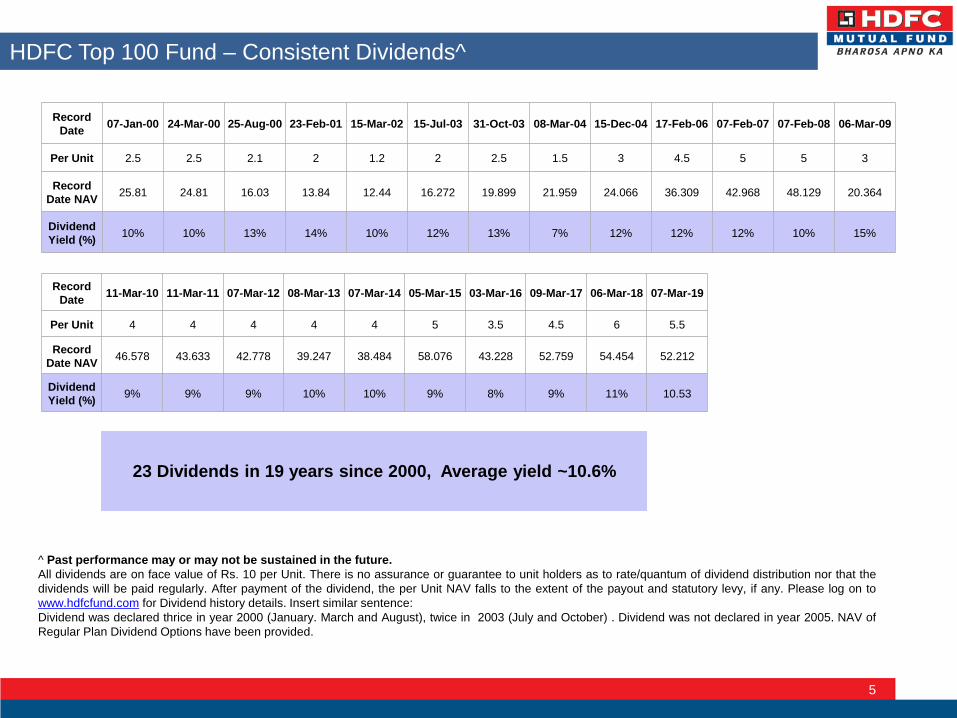
HDFC Top 100 Fund – Consistent Dividends^
5
23 Dividends in 19 years since 2000, Average yield ~10.6%
^ Past performance may or may not be sustained in the future.All dividends are on face value of Rs. 10 per Unit. There is no assurance or guarantee to unit holders as to rate/quantum of dividend distribution nor that thedividends will be paid regularly. After payment of the dividend, the per Unit NAV falls to the extent of the payout and statutory levy, if any. Please log on towww.hdfcfund.com for Dividend history details. Insert similar sentence:Dividend was declared thrice in year 2000 (January. March and August), twice in 2003 (July and October) . Dividend was not declared in year 2005. NAV ofRegular Plan Dividend Options have been provided.
Record Date 07-Jan-00 24-Mar-00 25-Aug-00 23-Feb-01 15-Mar-02 15-Jul-03 31-Oct-03 08-Mar-04 15-Dec-04 17-Feb-06 07-Feb-07 07-Feb-08 06-Mar-09
Per Unit 2.5 2.5 2.1 2 1.2 2 2.5 1.5 3 4.5 5 5 3
Record Date NAV 25.81 24.81 16.03 13.84 12.44 16.272 19.899 21.959 24.066 36.309 42.968 48.129 20.364
Dividend Yield (%) 10% 10% 13% 14% 10% 12% 13% 7% 12% 12% 12% 10% 15%
Record Date 11-Mar-10 11-Mar-11 07-Mar-12 08-Mar-13 07-Mar-14 05-Mar-15 03-Mar-16 09-Mar-17 06-Mar-18 07-Mar-19
Per Unit 4 4 4 4 4 5 3.5 4.5 6 5.5
Record Date NAV 46.578 43.633 42.778 39.247 38.484 58.076 43.228 52.759 54.454 52.212
Dividend Yield (%) 9% 9% 9% 10% 10% 9% 8% 9% 11% 10.53
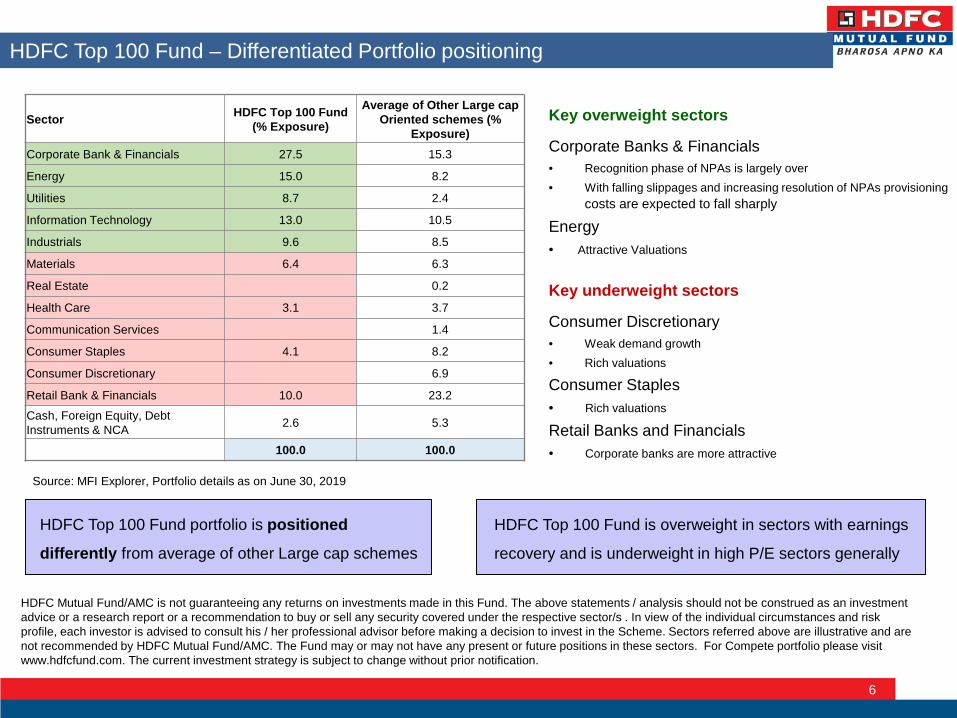
HDFC Top 100 Fund – Differentiated Portfolio positioning
6
HDFC Mutual Fund/AMC is not guaranteeing any returns on investments made in this Fund. The above statements / analysis should not be construed as an investment advice or a research report or a recommendation to buy or sell any security covered under the respective sector/s . In view of the individual circumstances and risk profile, each investor is advised to consult his / her professional advisor before making a decision to invest in the Scheme. Sectors referred above are illustrative and are not recommended by HDFC Mutual Fund/AMC. The Fund may or may not have any present or future positions in these sectors. For Compete portfolio please visit www.hdfcfund.com. The current investment strategy is subject to change without prior notification.
HDFC Top 100 Fund is overweight in sectors with earnings
recovery and is underweight in high P/E sectors generally
HDFC Top 100 Fund portfolio is positioned
differently from average of other Large cap schemes
Source: MFI Explorer, Portfolio details as on June 30, 2019
Key overweight sectors
Corporate Banks & Financials• Recognition phase of NPAs is largely over• With falling slippages and increasing resolution of NPAs provisioning
costs are expected to fall sharply
Energy• Attractive Valuations
Key underweight sectors
Consumer Discretionary• Weak demand growth• Rich valuations
Consumer Staples• Rich valuations
Retail Banks and Financials• Corporate banks are more attractive
Sector HDFC Top 100 Fund (% Exposure)
Average of Other Large cap Oriented schemes (%
Exposure)Corporate Bank & Financials 27.5 15.3
Energy 15.0 8.2
Utilities 8.7 2.4
Information Technology 13.0 10.5
Industrials 9.6 8.5
Materials 6.4 6.3
Real Estate 0.2
Health Care 3.1 3.7
Communication Services 1.4
Consumer Staples 4.1 8.2
Consumer Discretionary 6.9
Retail Bank & Financials 10.0 23.2Cash, Foreign Equity, Debt Instruments & NCA 2.6 5.3
100.0 100.0
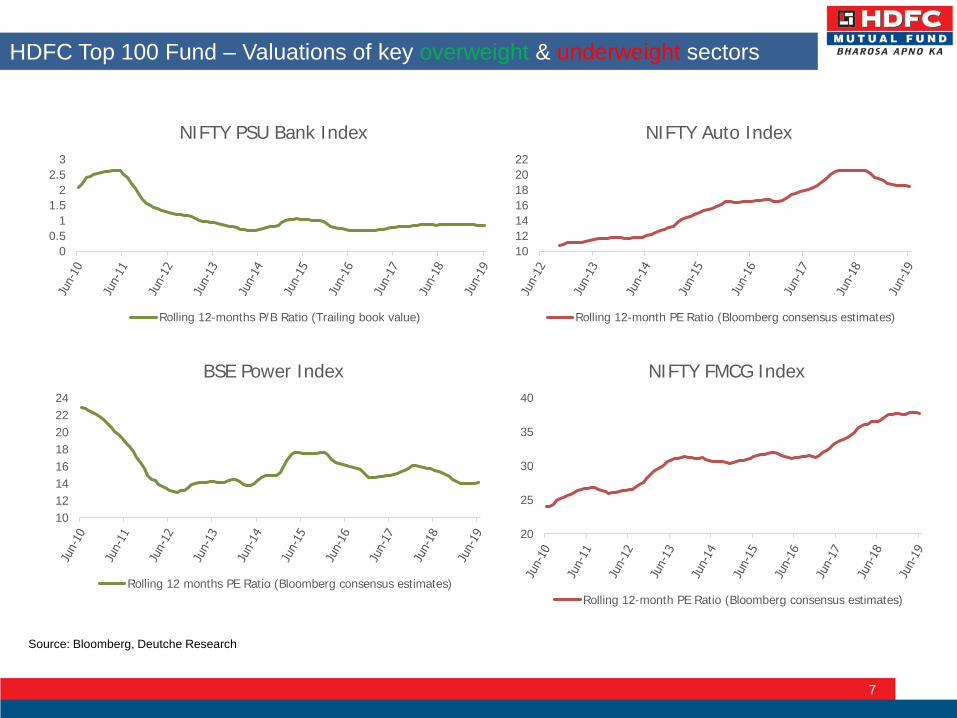
HDFC Top 100 Fund – Valuations of key overweight & underweight sectors
7
Source: Bloomberg, Deutche Research
00.5
11.5
22.5
3
NIFTY PSU Bank Index
Rolling 12-months P/B Ratio (Trailing book value)
10121416182022
NIFTY Auto Index
Rolling 12-month PE Ratio (Bloomberg consensus estimates)
1012141618202224
BSE Power Index
Rolling 12 months PE Ratio (Bloomberg consensus estimates)
20
25
30
35
40
NIFTY FMCG Index
Rolling 12-month PE Ratio (Bloomberg consensus estimates)
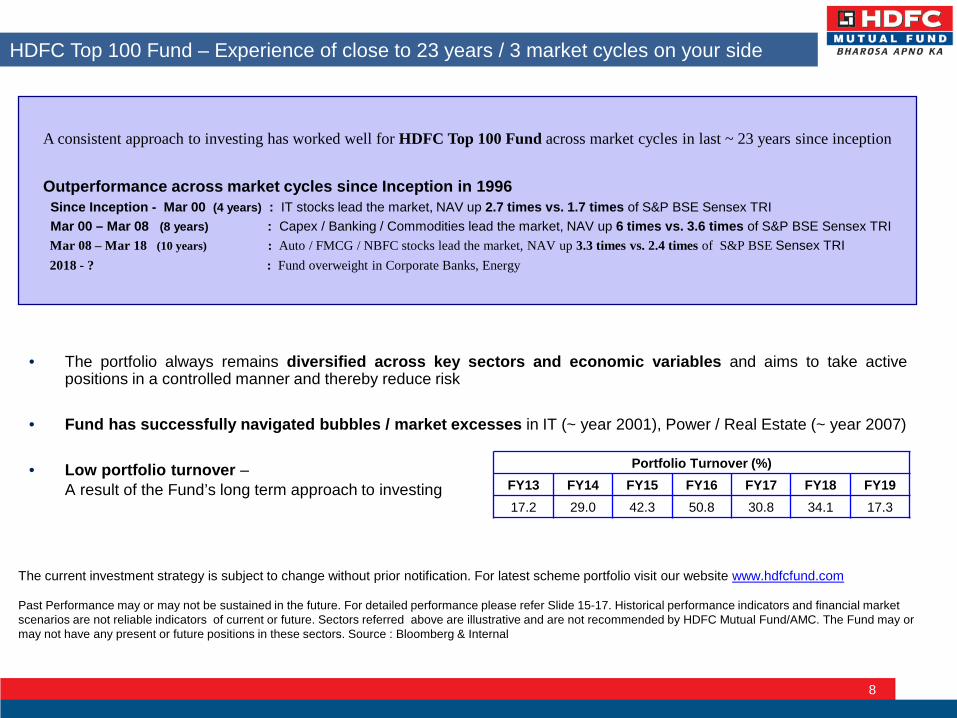
HDFC Top 100 Fund – Experience of close to 23 years / 3 market cycles on your side
8
• The portfolio always remains diversified across key sectors and economic variables and aims to take activepositions in a controlled manner and thereby reduce risk
• Fund has successfully navigated bubbles / market excesses in IT (~ year 2001), Power / Real Estate (~ year 2007)
• Low portfolio turnover –A result of the Fund’s long term approach to investing
The current investment strategy is subject to change without prior notification. For latest scheme portfolio visit our website www.hdfcfund.com
A consistent approach to investing has worked well for HDFC Top 100 Fund across market cycles in last ~ 23 years since inception
Outperformance across market cycles since Inception in 1996Since Inception - Mar 00 (4 years) : IT stocks lead the market, NAV up 2.7 times vs. 1.7 times of S&P BSE Sensex TRIMar 00 – Mar 08 (8 years) : Capex / Banking / Commodities lead the market, NAV up 6 times vs. 3.6 times of S&P BSE Sensex TRIMar 08 – Mar 18 (10 years) : Auto / FMCG / NBFC stocks lead the market, NAV up 3.3 times vs. 2.4 times of S&P BSE Sensex TRI2018 - ? : Fund overweight in Corporate Banks, Energy
Past Performance may or may not be sustained in the future. For detailed performance please refer Slide 15-17. Historical performance indicators and financial market scenarios are not reliable indicators of current or future. Sectors referred above are illustrative and are not recommended by HDFC Mutual Fund/AMC. The Fund may or may not have any present or future positions in these sectors. Source : Bloomberg & Internal
Portfolio Turnover (%)FY13 FY14 FY15 FY16 FY17 FY18 FY1917.2 29.0 42.3 50.8 30.8 34.1 17.3
Indian Economy - Slowing GDP growth, other macro economic parameters stable
9
HDFC Mutual Fund/AMC is not guaranteeing any returns on investments made in this Fund.
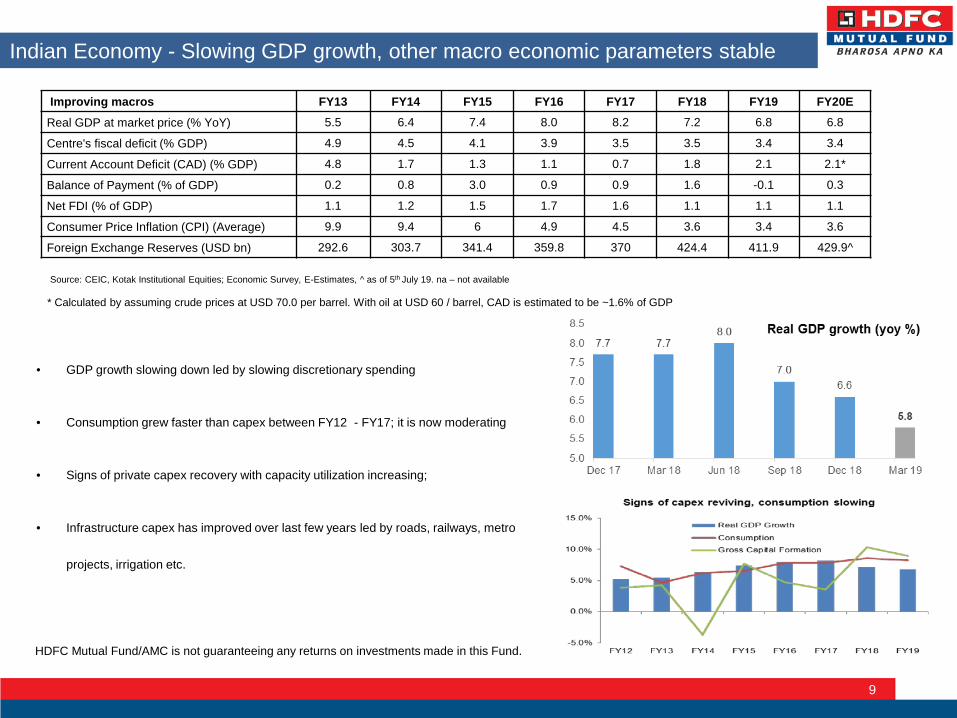
Improving macros FY13 FY14 FY15 FY16 FY17 FY18 FY19 FY20EReal GDP at market price (% YoY) 5.5 6.4 7.4 8.0 8.2 7.2 6.8 6.8
Centre's fiscal deficit (% GDP) 4.9 4.5 4.1 3.9 3.5 3.5 3.4 3.4
Current Account Deficit (CAD) (% GDP) 4.8 1.7 1.3 1.1 0.7 1.8 2.1 2.1*
Balance of Payment (% of GDP) 0.2 0.8 3.0 0.9 0.9 1.6 -0.1 0.3
Net FDI (% of GDP) 1.1 1.2 1.5 1.7 1.6 1.1 1.1 1.1
Consumer Price Inflation (CPI) (Average) 9.9 9.4 6 4.9 4.5 3.6 3.4 3.6
Foreign Exchange Reserves (USD bn) 292.6 303.7 341.4 359.8 370 424.4 411.9 429.9^
Source: CEIC, Kotak Institutional Equities; Economic Survey, E-Estimates, ^ as of 5th July 19. na – not available
* Calculated by assuming crude prices at USD 70.0 per barrel. With oil at USD 60 / barrel, CAD is estimated to be ~1.6% of GDP
• GDP growth slowing down led by slowing discretionary spending
• Consumption grew faster than capex between FY12 - FY17; it is now moderating
• Signs of private capex recovery with capacity utilization increasing;
• Infrastructure capex has improved over last few years led by roads, railways, metro
projects, irrigation etc.
Equity Markets Review – Improving micro despite weak macro
10
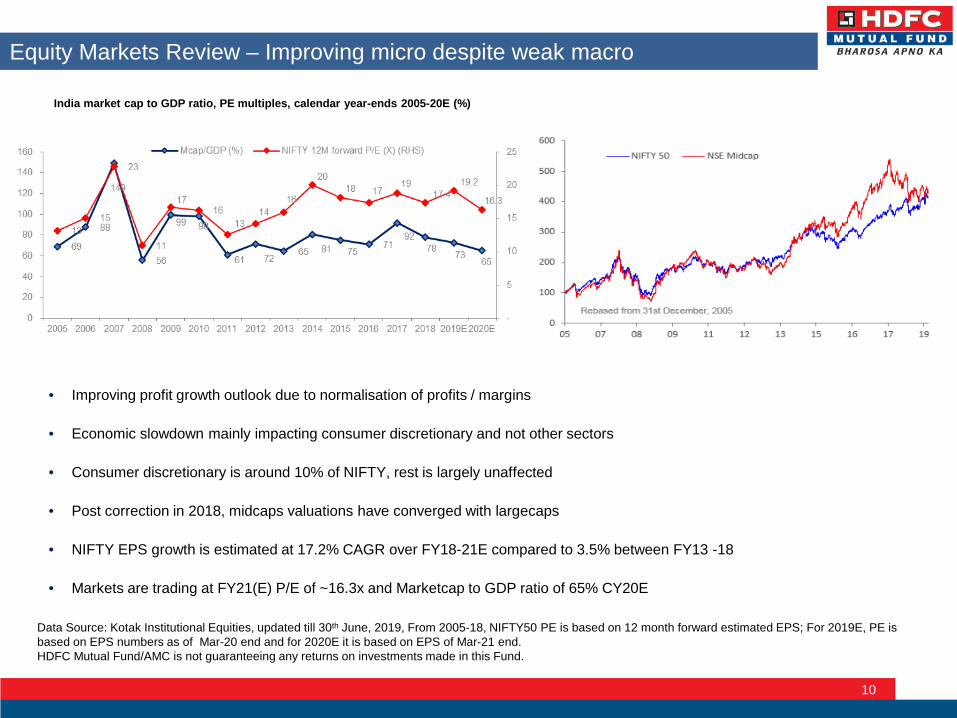
• Improving profit growth outlook due to normalisation of profits / margins
• Economic slowdown mainly impacting consumer discretionary and not other sectors
• Consumer discretionary is around 10% of NIFTY, rest is largely unaffected
• Post correction in 2018, midcaps valuations have converged with largecaps
• NIFTY EPS growth is estimated at 17.2% CAGR over FY18-21E compared to 3.5% between FY13 -18
• Markets are trading at FY21(E) P/E of ~16.3x and Marketcap to GDP ratio of 65% CY20E
India market cap to GDP ratio, PE multiples, calendar year-ends 2005-20E (%)
Data Source: Kotak Institutional Equities, updated till 30th June, 2019, From 2005-18, NIFTY50 PE is based on 12 month forward estimated EPS; For 2019E, PE is based on EPS numbers as of Mar-20 end and for 2020E it is based on EPS of Mar-21 end.HDFC Mutual Fund/AMC is not guaranteeing any returns on investments made in this Fund.

Improving profit growth outlook
11
Source: Kotak Institutional Equities
NIFTY50 EPS growth: The worst is behind, strong improvement ahead
NIFTY 50 PAT growth (CAGR %)
Sector Mar 18-21E
Consumer Discretionary 7.2
Consumer Staples 13.2
Corporate Banks & Financials 161.1
Energy 10.3
Health Care 22.6
Industrials 12.6
Information Technology 11.3
Materials 8.9
Retail Banks & Financials 18.7
Utilities 11.8
Communication Services -25.3
Capital Goods
• Weak capex in economy
• Stretched working capital cycle and high interest rates
Utilities
• Change in CERC (Central Electricity Regulatory Commission) regulations
Corporate Banks & Financials
• Significant increase in stress in steel, power & infra sectors
• Higher provisioning on NPAs impacted profitability sharply
Healthcare
• Scaling up of specialty products and complex generic products (respiratory, injectibles, etc.) in the United States to improve margins
Utilities
• Capacity led growth
Corporate Banks & Financials
• Recognition phase of NPAs is largely over, GNPA provisioning is at 62% as on Mar 19
• With falling slippages and increasing resolution of NPAs provisioning costs are expected to fall sharply
Reasons for weak NIFTY 50 Earnings growth in FY13-18
Earnings growth in FY18-21E expected to be driven by
PAT (Rs crs) Mar-13 Mar-14 Mar-15 Mar-16 Mar-17 Mar-18 Mar-19 Mar-20E Mar-21E
Corporate Banks & Financials(ICICI, Axis, SBI, Yes)
28,911 28,537 33,758 30,440 27,096 4,730 10,622 61,903 84,155
FY13 FY14 FY15 FY16 FY17 FY18 NIFTY 50 EPS CAGR 13-18 FY19E FY20E FY21E NIFTY 50 EPS
CAGR 18-21E
NIFTY EPS 377 410 398 384 439 4493.5
480 614 72317.2
Growth % 8.8 -2.9 -3.5 14.4 2.0 6.9 27.9 17.8
HDFC Mutual Fund/AMC is not guaranteeing any returns on investments made in this Fund.
Summary
12
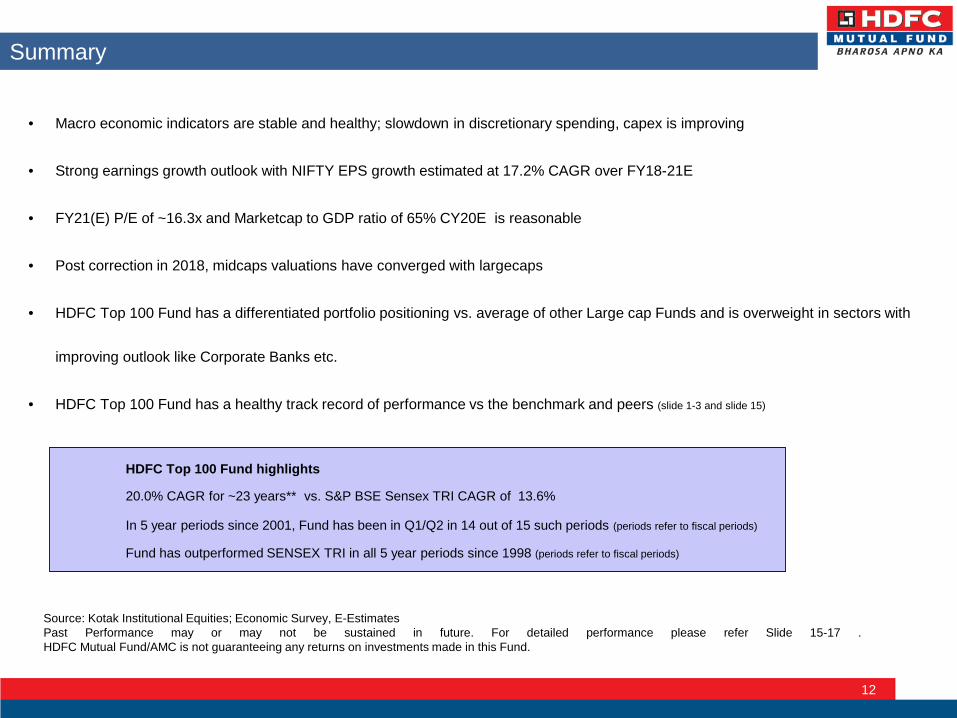
• Macro economic indicators are stable and healthy; slowdown in discretionary spending, capex is improving
• Strong earnings growth outlook with NIFTY EPS growth estimated at 17.2% CAGR over FY18-21E
• FY21(E) P/E of ~16.3x and Marketcap to GDP ratio of 65% CY20E is reasonable
• Post correction in 2018, midcaps valuations have converged with largecaps
• HDFC Top 100 Fund has a differentiated portfolio positioning vs. average of other Large cap Funds and is overweight in sectors with
improving outlook like Corporate Banks etc.
• HDFC Top 100 Fund has a healthy track record of performance vs the benchmark and peers (slide 1-3 and slide 15)
Source: Kotak Institutional Equities; Economic Survey, E-EstimatesPast Performance may or may not be sustained in future. For detailed performance please refer Slide 15-17 .HDFC Mutual Fund/AMC is not guaranteeing any returns on investments made in this Fund.
HDFC Top 100 Fund highlights
20.0% CAGR for ~23 years** vs. S&P BSE Sensex TRI CAGR of 13.6%
In 5 year periods since 2001, Fund has been in Q1/Q2 in 14 out of 15 such periods (periods refer to fiscal periods)
Fund has outperformed SENSEX TRI in all 5 year periods since 1998 (periods refer to fiscal periods)
HDFC Top 100 Fund – Proven track record over 3 market cycles (refer slide 7) in ~ 23 years
13
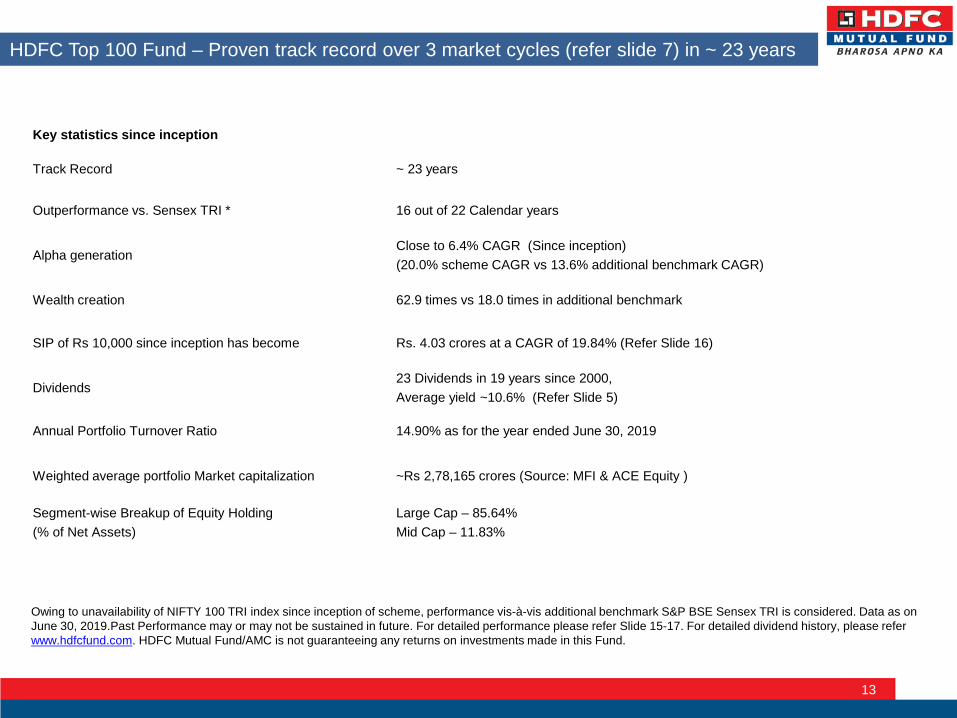
Key statistics since inception
Track Record ~ 23 years
Outperformance vs. Sensex TRI * 16 out of 22 Calendar years
Alpha generationClose to 6.4% CAGR (Since inception)(20.0% scheme CAGR vs 13.6% additional benchmark CAGR)
Wealth creation 62.9 times vs 18.0 times in additional benchmark
SIP of Rs 10,000 since inception has become Rs. 4.03 crores at a CAGR of 19.84% (Refer Slide 16)
Dividends23 Dividends in 19 years since 2000, Average yield ~10.6% (Refer Slide 5)
Annual Portfolio Turnover Ratio 14.90% as for the year ended June 30, 2019
Weighted average portfolio Market capitalization ~Rs 2,78,165 crores (Source: MFI & ACE Equity )
Segment-wise Breakup of Equity Holding(% of Net Assets)
Large Cap – 85.64%Mid Cap – 11.83%
Owing to unavailability of NIFTY 100 TRI index since inception of scheme, performance vis-à-vis additional benchmark S&P BSE Sensex TRI is considered. Data as on June 30, 2019.Past Performance may or may not be sustained in future. For detailed performance please refer Slide 15-17. For detailed dividend history, please refer www.hdfcfund.com. HDFC Mutual Fund/AMC is not guaranteeing any returns on investments made in this Fund.

HDFC Top 100 Fund – Asset Allocation Pattern
14
The investment universe of "Large Cap" shall comprise companies as defined by SEBI from time to time. The list of stocks of Large Cap companies prepared by AMFI in this regard will be adopted.
The Scheme may invest in the schemes of Mutual Funds in accordance with the applicable extant SEBI (Mutual Funds) Regulations as amended from time to time. The Scheme may invest up to 35% of its total assets in foreign securities. The Scheme may invest upto 100% of its total assets in Derivatives.For further information, kindly refer to the Scheme Information Document of HDFC Top 100 Fund.
Under normal circumstances, the asset allocation (% of total assets) of the Scheme’s portfolio will be as follows :
Types of Instruments Minimum Allocation (% of Total Assets)
Maximum Allocation (% of Total Assets) Risk Profile
Equity and Equity relatedinstruments of large cap companies
80 100 High
Equity and Equity relatedinstruments other than above
0 20 High
Debt Securities (including securitiseddebt) and money marketinstruments
0 20 Low to Medium
Units issued by REITs and InvITs 0 10 Medium to High
Non-convertible preference shares 0 10 Low to Medium
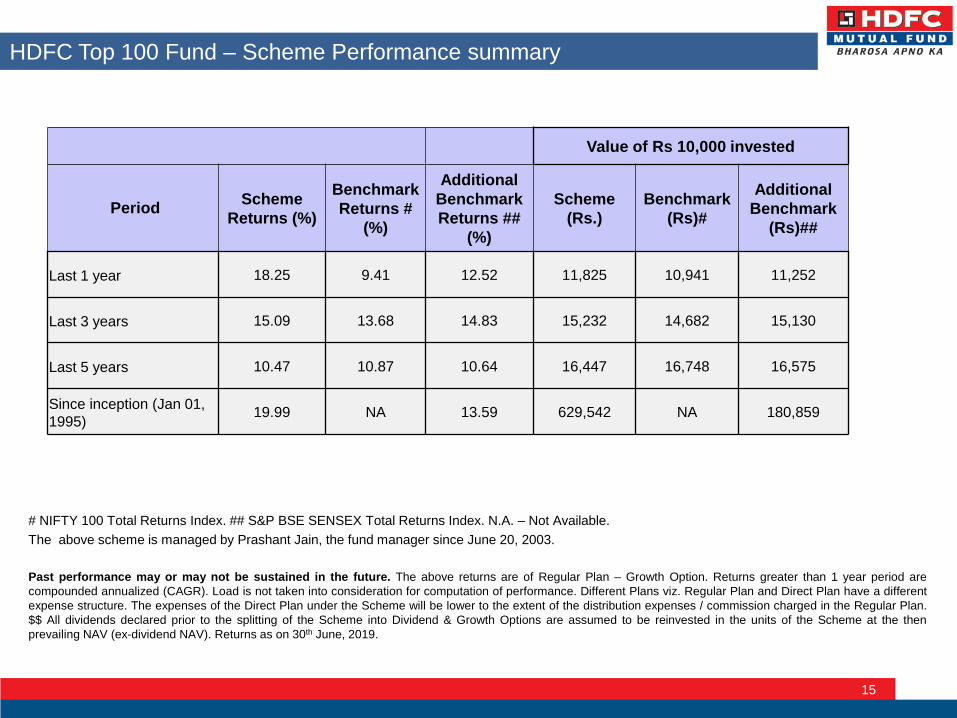
HDFC Top 100 Fund – Scheme Performance summary
15
Value of Rs 10,000 invested
Period Scheme Returns (%)
Benchmark Returns #
(%)
Additional Benchmark Returns ##
(%)
Scheme(Rs.)
Benchmark(Rs)#
Additional Benchmark
(Rs)##
Last 1 year 18.25 9.41 12.52 11,825 10,941 11,252
Last 3 years 15.09 13.68 14.83 15,232 14,682 15,130
Last 5 years 10.47 10.87 10.64 16,447 16,748 16,575
Since inception (Jan 01, 1995) 19.99 NA 13.59 629,542 NA 180,859
# NIFTY 100 Total Returns Index. ## S&P BSE SENSEX Total Returns Index. N.A. – Not Available.The above scheme is managed by Prashant Jain, the fund manager since June 20, 2003.
Past performance may or may not be sustained in the future. The above returns are of Regular Plan – Growth Option. Returns greater than 1 year period arecompounded annualized (CAGR). Load is not taken into consideration for computation of performance. Different Plans viz. Regular Plan and Direct Plan have a differentexpense structure. The expenses of the Direct Plan under the Scheme will be lower to the extent of the distribution expenses / commission charged in the Regular Plan.$$ All dividends declared prior to the splitting of the Scheme into Dividend & Growth Options are assumed to be reinvested in the units of the Scheme at the thenprevailing NAV (ex-dividend NAV). Returns as on 30th June, 2019.
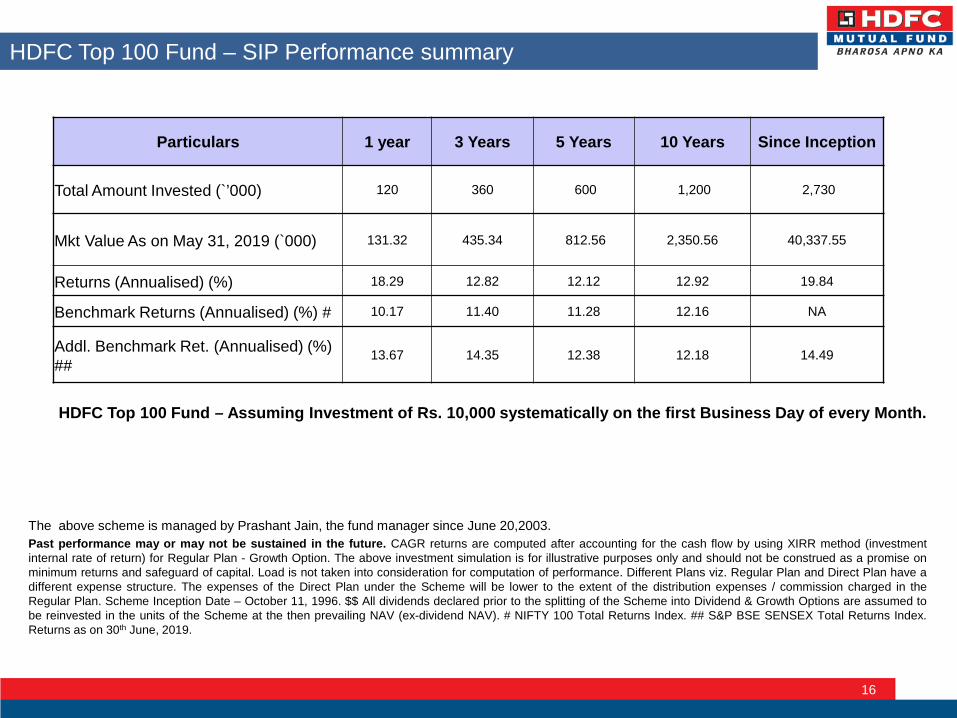
HDFC Top 100 Fund – SIP Performance summary
16
The above scheme is managed by Prashant Jain, the fund manager since June 20,2003.Past performance may or may not be sustained in the future. CAGR returns are computed after accounting for the cash flow by using XIRR method (investmentinternal rate of return) for Regular Plan - Growth Option. The above investment simulation is for illustrative purposes only and should not be construed as a promise onminimum returns and safeguard of capital. Load is not taken into consideration for computation of performance. Different Plans viz. Regular Plan and Direct Plan have adifferent expense structure. The expenses of the Direct Plan under the Scheme will be lower to the extent of the distribution expenses / commission charged in theRegular Plan. Scheme Inception Date – October 11, 1996. $$ All dividends declared prior to the splitting of the Scheme into Dividend & Growth Options are assumed tobe reinvested in the units of the Scheme at the then prevailing NAV (ex-dividend NAV). # NIFTY 100 Total Returns Index. ## S&P BSE SENSEX Total Returns Index.Returns as on 30th June, 2019.
Particulars 1 year 3 Years 5 Years 10 Years Since Inception
Total Amount Invested (`’000) 120 360 600 1,200 2,730
Mkt Value As on May 31, 2019 (`000) 131.32 435.34 812.56 2,350.56 40,337.55
Returns (Annualised) (%) 18.29 12.82 12.12 12.92 19.84
Benchmark Returns (Annualised) (%) # 10.17 11.40 11.28 12.16 NA
Addl. Benchmark Ret. (Annualised) (%) ##
13.67 14.35 12.38 12.18 14.49
HDFC Top 100 Fund – Assuming Investment of Rs. 10,000 systematically on the first Business Day of every Month.
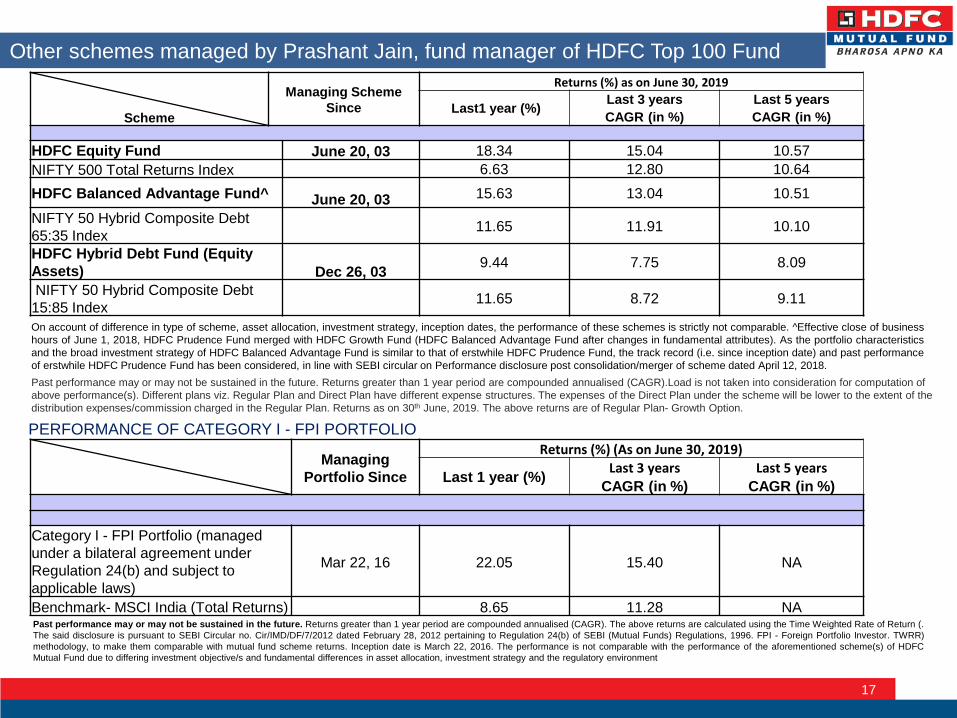
Other schemes managed by Prashant Jain, fund manager of HDFC Top 100 Fund
17
Scheme
Managing SchemeSince
Returns (%) as on June 30, 2019
Last1 year (%) Last 3 years Last 5 yearsCAGR (in %) CAGR (in %)
HDFC Equity Fund June 20, 03 18.34 15.04 10.57NIFTY 500 Total Returns Index 6.63 12.80 10.64HDFC Balanced Advantage Fund^ June 20, 03 15.63 13.04 10.51NIFTY 50 Hybrid Composite Debt 65:35 Index 11.65 11.91 10.10
HDFC Hybrid Debt Fund (Equity Assets) Dec 26, 03 9.44 7.75 8.09
NIFTY 50 Hybrid Composite Debt15:85 Index 11.65 8.72 9.11
Past performance may or may not be sustained in the future. Returns greater than 1 year period are compounded annualised (CAGR). The above returns are calculated using the Time Weighted Rate of Return (.The said disclosure is pursuant to SEBI Circular no. Cir/IMD/DF/7/2012 dated February 28, 2012 pertaining to Regulation 24(b) of SEBI (Mutual Funds) Regulations, 1996. FPI - Foreign Portfolio Investor. TWRR)methodology, to make them comparable with mutual fund scheme returns. Inception date is March 22, 2016. The performance is not comparable with the performance of the aforementioned scheme(s) of HDFCMutual Fund due to differing investment objective/s and fundamental differences in asset allocation, investment strategy and the regulatory environment
Managing Portfolio Since
Returns (%) (As on June 30, 2019)
Last 1 year (%) Last 3 years Last 5 yearsCAGR (in %) CAGR (in %)
Category I - FPI Portfolio (managed under a bilateral agreement under Regulation 24(b) and subject to applicable laws)
Mar 22, 16 22.05 15.40 NA
Benchmark- MSCI India (Total Returns) 8.65 11.28 NA
PERFORMANCE OF CATEGORY I - FPI PORTFOLIO
On account of difference in type of scheme, asset allocation, investment strategy, inception dates, the performance of these schemes is strictly not comparable. ^Effective close of businesshours of June 1, 2018, HDFC Prudence Fund merged with HDFC Growth Fund (HDFC Balanced Advantage Fund after changes in fundamental attributes). As the portfolio characteristicsand the broad investment strategy of HDFC Balanced Advantage Fund is similar to that of erstwhile HDFC Prudence Fund, the track record (i.e. since inception date) and past performanceof erstwhile HDFC Prudence Fund has been considered, in line with SEBI circular on Performance disclosure post consolidation/merger of scheme dated April 12, 2018.Past performance may or may not be sustained in the future. Returns greater than 1 year period are compounded annualised (CAGR).Load is not taken into consideration for computation of above performance(s). Different plans viz. Regular Plan and Direct Plan have different expense structures. The expenses of the Direct Plan under the scheme will be lower to the extent of the distribution expenses/commission charged in the Regular Plan. Returns as on 30th June, 2019. The above returns are of Regular Plan- Growth Option.
Disclaimer
The presentation dated 24th July, 2019 has been prepared by HDFC Asset Management Company Limited (HDFCAMC) based on internal data, publicly available information and other sources believed to be reliable. Any calculationsmade are approximations, meant as guidelines only, which you must confirm before relying on them. The informationgiven is for general purposes only. Past performance may or may not be sustained in future. The current investmentstrategies are subject to change depending on market conditions. The statements are given in summary form and donot purport to be complete. The views / information provided do not have regard to specific investment objectives,financial situation and the particular needs of any specific person who may receive this information. The information/data herein alone are not sufficient and should not be used for the development or implementation of an investmentstrategy. The statements contained herein may include statements of future expectations and other forward-lookingstatements that are based on our current views and involve known and unknown risks and uncertainties that couldcause actual results, performance or events to differ materially from those expressed or implied in such statements.Stocks/Sectors referred in the presentation are illustrative and should not be construed as an investment advice or aresearch report or a recommended by HDFC Mutual Fund / AMC. The Fund may or may not have any present or futurepositions in these sectors. HDFC Mutual Fund/AMC is not guaranteeing any returns on investments made in theScheme(s). The data/statistics are given to explain general market trends in the securities market, it should not beconstrued as any research report/research recommendation. Neither HDFC AMC and HDFC Mutual Fund nor anyperson connected with them, accepts any liability arising from the use of this document. The recipient(s) before actingon any information herein should make his/her/their own investigation and seek appropriate professional advice andshall alone be fully responsible / liable for any decision taken on the basis of information contained herein. For completeportfolio/details refer to our website www.hdfcfund.com
MUTUAL FUND INVESTMENTS ARE SUBJECT TO MARKET RISKS, READ ALL SCHEME RELATED DOCUMENTS CAREFULLY
18

Thank You
19