he chemical shift - uzh - department of chemistry
TRANSCRIPT

PARAMETER OF ONE-DIMENSIONAL NMR SPECTRA:
The following parameters can be extracted from 1-D spectra and contain usefulinformation
1) chemical shifts (in ppm),
2) scalar coupling constants (in Hz)
3) line-widths (in Hz)
4) intensity of signals (integrals)
1) THE CHEMICAL SHIFT:
The chemical shift is related to the resonance frequency of a particular nucleus.However, instead of presenting the frequency itself, which depends on thestrength of the static field, the chemical shift is usually given relative to astandard and normalized with respect to the transmitter frequency. Thisrelative scale is field independent so that the values obtained in differentlaboratories or on different instruments can be compared:
(X)= 106 ( ref)/ ref
( ref) is the frequency of a standard, (e.g. TMS), usually but not always at 0
ppm. Since the obtained values are small, they are given in parts per million(ppm). The chemical shift of protons is mainly due to the diamagneticcontribution, which depends on the following three parameters:
a) the electron density around the nucleusb) local anisotropy effectsc) steric effects
The electron cloud decreases the magnitude of the static field at the locus of thespin (the so-called shielding effect) so that the resulting effective field is weakerand hence the resonance frequency ( ) lower:
2 = effeff = Bo -
C H O HFig.1: The thickness of the lines is proportional to the strength of the magnetic field. A) Nucleus in the absence of elctrons.B) Nucleus surrounded by a spherical cloud. C) Electron distribution in a C-H bond. Due to the similar electronegativitiesof carbon and hydrogen the electron cloud is a symmetric ellipsoid. D) Electron distribution about an OH fragment. Dueto the much larger electronegativity of the oxygen the cloud is asymmetric with the effective field being much stronger atthe proton site when compared to C).

2
( is an atom-type dependent constant, the so-called gyromagnetic ratio, is the
chemical shielding constant). Electronegative substituents reduce electrondensity at neighbouring protons, thereby reducing the shielding effect andleading to higher frequencies at neighbouring nuclei. The shielding gives rise toshifts with larger values in ppm. Methoxy protons resonate around 4 ppmwhereas “normal” methyl protons are found close to 1 ppm.
Some chemical bonds display pronounced anisotropy in their electrondistribution. This means that the magnetic susceptibility of a proton can bestrongly dependent on the orientation of surrounding protons. Such effects areparticularly observed in the vicinity of -electrons. For examples, protons
located over the center of an aromatic ring are deshielded whereas thoseoutside the ring are shielded. The ring-current shifts contribute significantly tothe chemical shift dispersion observed in spectra of proteins:
Fig.2: Cones of anisotropy observed for double/triple bonds and aromatic systems (taken from [1])
3
123456789 ppm
Aromat
Aliphat
Me
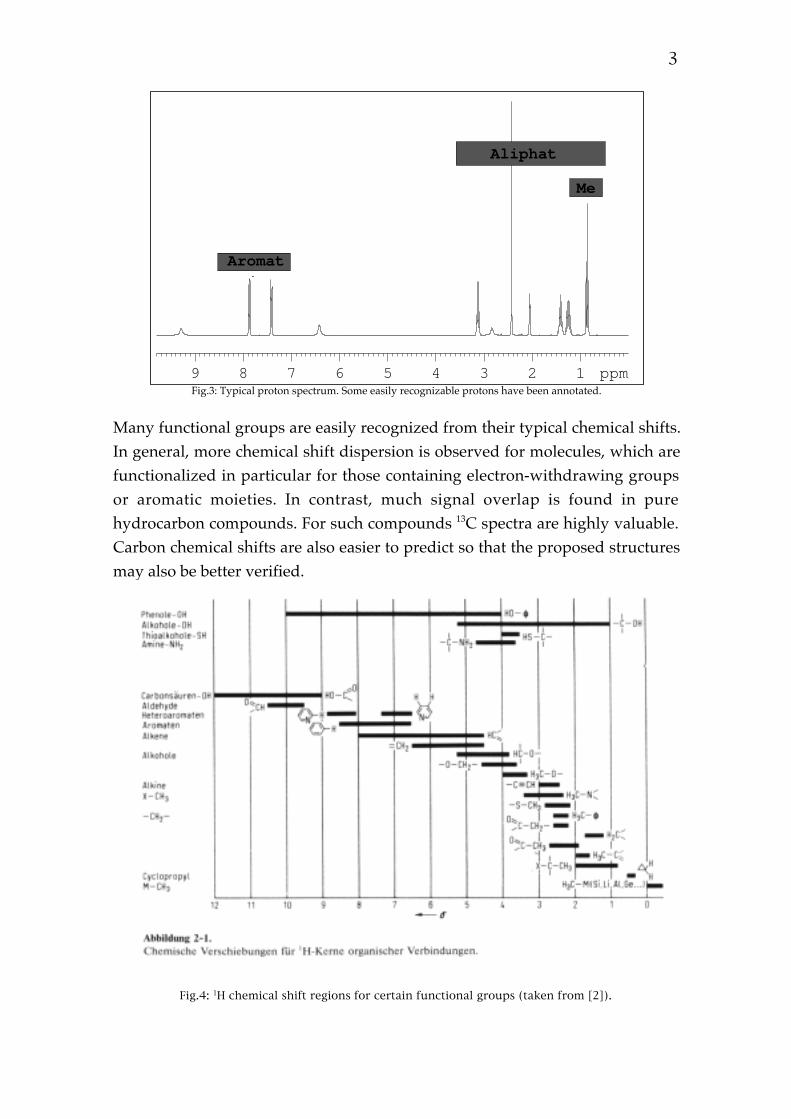
Fig.3: Typical proton spectrum. Some easily recognizable protons have been annotated.
Many functional groups are easily recognized from their typical chemical shifts.In general, more chemical shift dispersion is observed for molecules, which arefunctionalized in particular for those containing electron-withdrawing groupsor aromatic moieties. In contrast, much signal overlap is found in purehydrocarbon compounds. For such compounds 13C spectra are highly valuable.Carbon chemical shifts are also easier to predict so that the proposed structuresmay also be better verified.
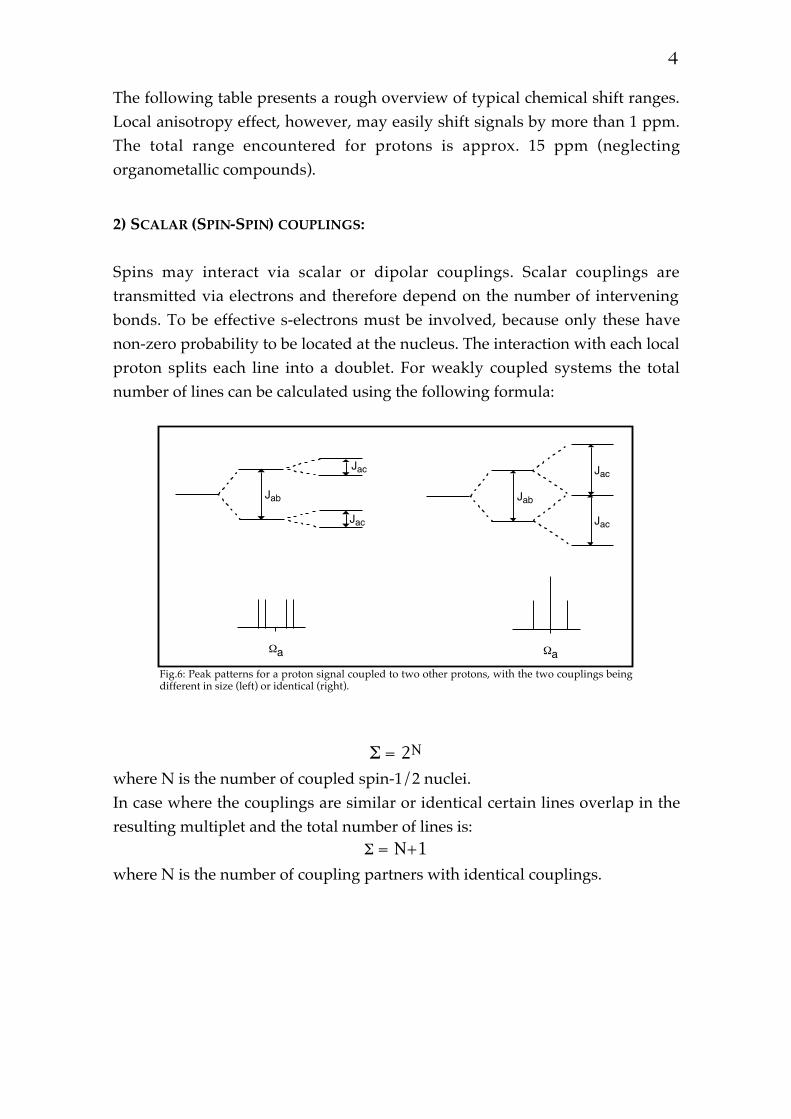
Fig.4: 1H chemical shift regions for certain functional groups (taken from [2]).
4
The following table presents a rough overview of typical chemical shift ranges.Local anisotropy effect, however, may easily shift signals by more than 1 ppm.The total range encountered for protons is approx. 15 ppm (neglectingorganometallic compounds).
2) SCALAR (SPIN-SPIN) COUPLINGS:
Spins may interact via scalar or dipolar couplings. Scalar couplings aretransmitted via electrons and therefore depend on the number of interveningbonds. To be effective s-electrons must be involved, because only these havenon-zero probability to be located at the nucleus. The interaction with each localproton splits each line into a doublet. For weakly coupled systems the totalnumber of lines can be calculated using the following formula:
Jab
Jac
Jac
Jab
Jac
Jac
a a
Fig.6: Peak patterns for a proton signal coupled to two other protons, with the two couplings beingdifferent in size (left) or identical (right).
= 2N
where N is the number of coupled spin-1/2 nuclei.In case where the couplings are similar or identical certain lines overlap in theresulting multiplet and the total number of lines is:
= N+1
where N is the number of coupling partners with identical couplings.

5
360370380390400410420430440 Hz
Fig.7: Typical multiplet pattern in a 1-D spectrum.
In the latter case some lines have larger intensities than others. The relativeintensities of lines are given in the following table (which is constructed fromthe Pascal triangle):
Number of coupled partners Total number oflines
rel. Intensities
I=1/2 I=1
0 1 (Singlet) 11 2 (Doublet) 1:12 3 (Triplet) 1:2:13 4 (Quartet) 1:3:3:14 5 (Quintet) 1:4:6:4:15 6 (Sextet) 1:5:10:10:5:16 7 (Septet) 1:6:15:20:15:6:1
0 1 (Singlet) 11 3 (Triplett) 1:1:12 5 (Quintet) 1:2:3:2:13 7 (Septet) 1:3:6:7:6:3:1
The magnitude of the scalar couplings largely depends on the number ofintervening bonds, and mostly (but not always) decreases with increasingnumber of bonds. The number of intervening bonds is annotated as asuperscript (e.g. 2J or geminal, 3J for vicinal couplings ,etc.)
1J >> 2J > 3J for J (1H,1H)1J >> 3J , 2J for J (1H,13C)

6
Based on coupling patterns ortho, meta- or para-disubstituted aromaticcompounds are easily distinguished, because they contain signals with differentmultiplet patterns.The three-bond scalar couplings (3J) depend on the dihedral angle about thecentral bond (Karplus relationship) and this fact is much used to determinestereochemistry. As shown in the figure below syn- or anti- conformations ( =
0° or 180°) display large 3J couplings and gauche conformations ( = ±60°)
small 3J couplings. However, this effect is only observable if the bonds are notfreely rotating, otherwise the rotationally averaged values are observed.Averaging takes place over the gauche and trans conformations and usuallyleads to couplings of around 7 Hz.
HH
b
a
3J (Hz)
/rad
Fig.8: Karplus curve for vicinal 1H,1H couplings
Rotation about single bonds is largely hindered (or impossible) in cycliccompounds. Hence scalar couplings are very useful for determination ofstereochemistry in sugars, in which axial-axial arrangements many be easilydistinguished from axial-equatorial or equatorial-equatorial arrangements:
3Ja,e = 2-5 Hz3Ja,a = 10-13 Hz3Je,e = 2-5 Hz
3Ja,b 11 Hz 3Ja,b 18-19 Hz
H2e
H1a
H2a
R
HaR'
Hb
R
HaHb
R'
Fig.9: Vicinal couplings in rigid systems

7
Similarly, couplings are very useful to determine substitution at double bonds,with the trans arrangement usually giving rise to the larger coupling. It shouldbe noted here that the magnitude of scalar couplings also depends on thesubstituents.Geminal couplings depend on the s-character of the involved bonds, andtherefore are related to hybridization:
H2C
H
H
109°
-12.4 Hz
H
H
120°
H
H
120°H2C=C
- 4.3 Hz +2.5 Hz
Fig.10: Geminal couplings
4J couplings are only observed when the intervening bonds are held constantlyin a zig-zag arrangement, which is often the case in cyclic or double-bondedsystems (they are small, mostly smaller than 1 Hz):
H2eH4eH
H
H
HH
H
H
H
Fig.11: Long-range (4J) couplings
13C nuclei are mostly coupled to protons (but not to other carbons for reasons oflow 13C abundance). Usually, these heteronuclear couplings are removedduring signal acquisition by broadband decoupling. 1J 13C,1H couplings dependon the hybridization:
sp3: 125 Hzsp2: 167 Hzsp : 250 Hz
Some 13C experiments (e.g. DEPT) display information about the number ofattached protons and provide very useful help for the assignment of the 13Csignals.

8
THE INTENSITY OF SIGNALS:
Definition: The integral of a signal reflects the intensity under the curve and isproportional to the number of protons contributing to that signal.They are usually plotted as numbers below the signal or asintegral trails.
Unfortunately, integrals can easily be substantially wrong. This is often the casewhen relaxation properties of the involved protons are different. Isolatedprotons (those far away from others) cannot efficiently relax via dipolarcouplings and therefore have long T1 relaxation times. As a result they do notrapidly relax back into the equilibrium state, leading to partial saturation (andhence lower intensities). This problem may be circumvented (provided it hasbeen recognized!) if the relaxation delay is set to longer values.Another type of protons, which notoriously display wrong values for theintegrals are those, which are broad (either by exchange or by othermechanisms (paramagnetic relaxation).
123456789 ppm
Fig.17: 1H spectrum with integrals.

9
HIGHER ORDER SPECTRA
When the chemical shift difference of spins (in Hz) that are coupled to eachother is not large with respect to their mutual scalar coupling constant (| a-
b|/Jab < 10) so-called higher-order spectra occur. In such systems the
intensity of lines does not follow the normal rules and even more lines thanusual may be encountered. In the case of two spins solely coupled to each other,the inner lines of the two doublets are larger than the outer lines; this effect iscalled the “roof effect”:
250 200 150 100 50 0 Hz
250 200 150 100 50 0 Hz
250 200 150 100 50 0 Hz
250 200 150 100 50 0 Hz
250 200 150 100 50 0 Hz
250 200 150 100 50 0 Hz
250 200 150 100 50 0 Hz
250 200 150 100 50 0 Hz
3000 Hz
3000 Hz
3000 Hz
3000 Hz
AB-System
JAB = 10 Hz
ABX-System
JAB = 10 Hz, JAX = 6 Hz, JBX = 4Hz
Fig.12: Second order effects in dependence of the shift difference. For the simulations
the following values have been used: A B/J=15(1), 3(2), 1(3) und 0(4). For the ABX
spin system the X-part is shown separately.
When | a- b|/Jab > 10 a two spin system is called an AX system, whereas if| a- b|/Jab < 10 it is an AB system and for a= b an A2 system is
encountered. Scalar coupling constants cannot be simply read out of higherorder spectra. In such cases spectra simulations are required in order todetermine the true values.

10
THE NOMENCALTURE OF SPIN SYSTEMS :
A spin system is a set of spins in a coupling network, in which no interruption
of scalar coupling occurs.
CH3
H3C
H3C
CH3
H H
CH3
HOH
H
Fig.13: Covalent structure of a steroid. The separate spin systems contained in the molecule aredrawn in different colors.
chemical equivalence: Atoms, which through symmetry operations can be
transformed into each other are called chemically
equivalent.
For all spins, which are chemically non-equivalent
different letters of the alphabet are used. The
separation of the letters in the alphabet reflects the
difference in chemical shift (AB vs. AX). The number
of chemically equivalent nuclei is annotated as a
subscript, e.g. A2X3.
isocronic nuclei: Nuclei, which by accidence or through chemical
equivalence, have identical resonance frequencies are
called isochronic.
magnetic equivalence: nuclei, which have identical scalar coupling
constants to all other spins within the molecule are
called magnetically equivalent.

11
Chemically equivalent nuclei need not be
magnetically equivalent in cases where isochronic
nuclei are not magnetically equivalent, an additional
dash is used, e.g. AA’ instead of A2.
S
Hb
Ha Ha
Hb
Fig.14: Thiophene molecule
In thiophene the protons Ha und Ha' are chemically equivalent because they
may be transformed into each other (the molecule has a C2 axis). But becausethe coupling constant of J(Ha, Hb)
is not equal to the coupling J(Ha' ,Hb) the two spinsare magnetically non equivalent and hence the spin system is called AA’BB’.
Homo-, enantio- and diastereotopic spins
Two groups or nuclei X within a -CX2-R fragment may be homotopic,
enantiotopic or diastereotopic.
In order to test which of the three possibilities is correct for the group in
question X is replaced by a new group T: X|T and T|X:
Homotopic spins: If X|T and T|X are identical molecules, the two groups
are homotopic. Homotopic protons are chemically
equivalent and will only lead to a single signal.
Enantiotopic spins: In case X|and T|X form a pair of enantiomers, the two
groups are enantiotopic. Such groups will give a single
signal in a non-chiral environment but may by resolved
into the separate signals by using chiral solvents or
chiral shift reagents.

12
Diastereotopic spins: Where X|T and T|X are diastereomers, the groups are
called diastereotopic. Diastereotopic groups are
chemically inequivalent but may still (by accidence) be
isochronic. Whether one or two signals are observed is
most often related to the distance from the chiral centre.

13
General literature:
[1] M. Hesse, H. Meier, B. Zeeh, Spektroskopische Methoden in der organischenChemie, Verlag Thieme.Good overview over the most common spectroscopic methods (IR, NMR, UV,MS) with a very useful chapter on NMR.[2] H. Friebolin, Ein- und zweidimensionale NMR Spektroskopie, VerlagChemie, 1992.Simple explanation in german language.[3] T.D.W. Claridge, High-Resolution NMR Techniques in Organic Chemistry,Pergamon Press 1999.One of the best books in my view. Contains a lot of practical tips and also somedescriptions of the hardware.[4] J.K.M. Sanders, B.K. Hunter, Modern NMR Spectroscopy, Oxford UniversityPress, 1987.[5] H. Günter, NMR-Spektroskopie, Verlag Thieme, 1992.[6] S. Braun, H.-O. Kalinowski, S. Berger: 150 and more Basic NMRExperiments, VCH-WileyPractical introduction into many of the commonly used experiments. Veryuseful for those, who run their own spectra.
2-Dimensional NMR spectroscopy
[7] W.R. Croasmun, R.M.K. Carlson, Two-Dimensional NMR Spectroscopy,Applications for Chemists and Biochemists, Verlag Chemie, 1994.Expensive, but useful guide for 2D NMR (see the NMR library).
Special books
[8] H.O. Kalinowski, S. Berger, S. Braun, 13C NMR Spektroskopiecontains an enormous amount of 13C data.[9] D. Neuhaus, M. Williamson, The Nuclear Overhauser Effect in Structuraland Conformational Analysis, Verlag Chemie, 1989.The best book about the NOE.[10] K. Wüthrich, NMR of Proteins and Nucleic Acids, Wiley, 1986.Bible for Protein/Peptide and DNA/RNA NMR.[11] G.C.K. Roberts, NMR of Macromolecules, A practical Approach, IRL Press,1993.A bit more practically oriented.[12] J. Cavanagh, W.J. Fairbrother, A.G. Palmer III, N.J. Skelton, Protein NMRSpectroscopy, Academic Press 1996.[13]J. Mason, Multinuclear NMR, Plenum Press, 1987.Bible for all “other” nuclei ( e.g. 11B, 15N ...)[14] M.H. Levitt, Spin Dynamics, Wiley 2001Very good book for a deeper understanding of theory (my favorite book)

1
13C-NMR-Spectroscopy 13C is the only NMR-active isotope of carbon. Unfortunately, its natural abundance is low
(1.1%). In addition the gyromagnetic ratio of carbon is about one fourth of that of protons
resulting in further loss of sensitivity. Therefore, 13C NMR is inherently much less sensitive than
proton NMR and usually much larger quantities (or much longer measuring times) are needed.
Exercise: Please classify the relative sensitivities of the following nuclei (high, medium,
small, inactive)
Spin
nucleus 1/2 > 1/2 0
natural abundance N (%)
γγγγ (107 rad s-1 T-1)
sensitivity
1H 99.985 26.75
2H 0.015 4.10
12C 98.9
13C 1.1 6.73
19F 100 25.18
31P 100 10.84
10B 19.58 2.87
11B 80.42 8.58
14N 99.63 1.93
15N 0.37 -2.71
16O 99.76
17O 0.04 -3.63
195Pt 33.8 5.84

2
Due to the scalar couplings between 13C and (mainly the directly attached) protons, rather
complicated spectra can result (see Fig. 1). Although analysis of the multiplicities would, in
principle, allow the determination of the number of attached protons and would thus enable us to
distinguish between CH, CH2 and CH3 groups, the couplings would degrade signal intensity
enormously:
30405060708090100110120130140 ppm Fig.1: 13C-spectrum (non 1H-decoupled) of 10% ethylene benzene in CDCl3
The recording of so called DEPT spectra, in which the carbon lines are proton decoupled, but
which by their signal phase still encode the number of attached protons is much more sensitive.
For 13C natural abundance molecules 13C,13C-couplings are usually not visible in the 1D-13C-
spectra.
Mostly, carbon spectra are recorded in fully proton-decoupled mode. Thereby signal intensity is
increased because the lines collapse, and signal dispersion is increased (because the number of
lines is reduced). In addition, proton-decoupling gives rise to the NOE (nuclear Overhauser
effect), which may result in increases in signal intensities of up to 200%. The gain in intensity
due to the hetereonuclear NOE depends on the distance separation to the next proton and yields
significant values only for directly attached protons.
30405060708090100110120130140 ppm Fig .2: 13C-spectrum (CPD-decoupled) of 10% ethylene benzene in CDCl3
However, not only the differing extent to which signal intensities are influenced by the NOE
contribute to the vastly different signal intensities observed in 13C spectra, as illustrated in Fig. 2.
Signal intensities are even more strongly influenced by the T1 relaxation rates of the protons,
which in turn depend (in first approximation) on the distance to the nearest protons. Quaternary

3
carbons, for example as well as carbonyl carbons, relax very slowly. Considering that pulse
repetition rates are usually chosen in the range of 1-4 seconds, these carbon resonances (for
which T1 values can easily reach 20 seconds or longer) remain in a partially saturated state,
leading to lower signal intensities. Therefore, 13C spectra are usually not integrated.
In cases were 13C spectra need to be integrated, e.g. when working with compound mixtures, so-
called inverse-gated spectra may be recorded. Two measures are taken to re-establish proper
signal intensities: The relaxation delay is set to sufficiently long values (20 to 60 seconds) and
proton decoupling is only turned on during signal acquisition but not during the relaxation delay.
Since the NOE buildup takes some time (usually during the relaxation delay) but decoupling
takes place instantaneously, reasonable signal intensities are restored with perfectly decoupled
signals (see Fig. 3).
Relaxation
During a 1D 13C-NMR-experiment equilibrium populations of α and β states are disturbed.
Longitudinal relaxation (T1 relaxation) will re-establish the equilibrium population of the levels
according to the Boltzman distribution. The time constant of this first-order process is called T1.
Since the two states are characterized by different energies, this process is enthalpic. Many
interactions will contribute to T1 relaxation, with the dipole-dipole interaction between the 13C
nucleus and its attached proton being the most important source. Where no proton is directly
attached (because dipole-dipole interaction depends on d-6), other mechanisms such as chemical
shift anisotropy (CSA, the chemical shift depends on the orientation of the molecule with respect
to the static field and hence fluctuates due to (Brownian) motion in solution).
The following figure presents typical values of T1 in a small organic molecule. Obviously, a
wide range of values is observed. The T1 values depend on 1) vicinity of protons, 2) molecular
weight (tumbling time), segmental mobility etc.
Example of some T1 values (in seconds):
Br-CH 2-CH 2-(CH 2)5-CH 2-CH 2-CH 3
2.8 2.7 2.0 3.1 3.9 5.3 C CH132
14
8.2
9.3
14
107

4
Figure 3 depicts 13C{1H}-spectra of phenyl ethylene, recorded at different pulse repetition rates
as well as with an inverse-gated experiment. Experiments 1 to 3 demonstrate the influence of
choosing different relaxation delays on the signal intensities. The signal-to-noise ratio is always
determined on the ortho C atom (128 ppm). Obviously, signal intensity dramatically decreases
when reducing the relaxation delay, especially for quaternary carbons. It is important to note that
even with relaxation delays as long as 64 seconds signal intensities are still not identical but vary
due to the different amounts of NOE the carbons receive.
406080100120140 ppm
Si/No=94pulse repetition rate 2s
Si/No=232pulse repetition rate 64s
Si/No=458pulse repetition rate 64s
Si/No=311pulse repetition rate 8s
1
2
3
4
Fig.3: 1-3 13C{1H}-Spectra of 10% ethylene benzene in CDCl3, recorded with various repetition rates. Spectrum 4 is recorded with the inverse-gated sequence.
Attention: Routine carbon spectra on the sample changer are not optimized for slowly relaxing
nuclei! Therefore quaternary carbons may easily be missed. If you think some signals are
missing, the relaxation delay (usually called “d1” on Bruker instruments) can be extended.
5
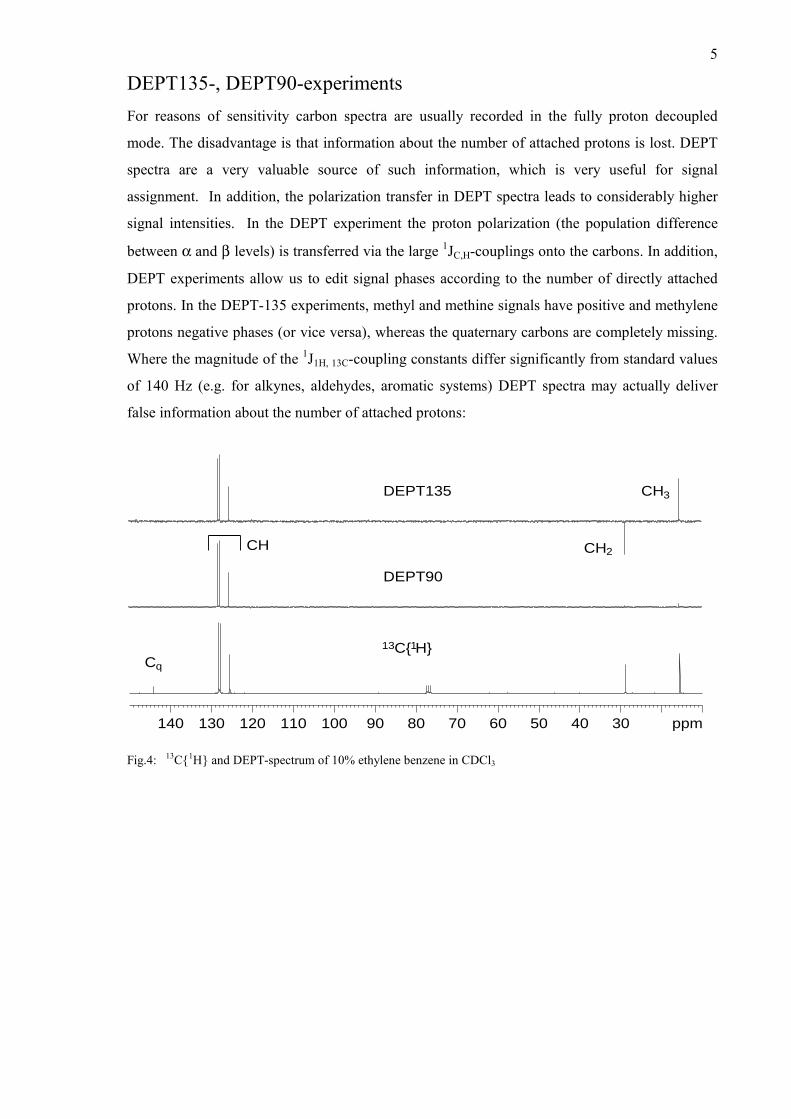
DEPT135-, DEPT90-experiments
For reasons of sensitivity carbon spectra are usually recorded in the fully proton decoupled
mode. The disadvantage is that information about the number of attached protons is lost. DEPT
spectra are a very valuable source of such information, which is very useful for signal
assignment. In addition, the polarization transfer in DEPT spectra leads to considerably higher
signal intensities. In the DEPT experiment the proton polarization (the population difference
between α and β levels) is transferred via the large 1JC,H-couplings onto the carbons. In addition,
DEPT experiments allow us to edit signal phases according to the number of directly attached
protons. In the DEPT-135 experiments, methyl and methine signals have positive and methylene
protons negative phases (or vice versa), whereas the quaternary carbons are completely missing.
Where the magnitude of the 1J1H, 13C-coupling constants differ significantly from standard values
of 140 Hz (e.g. for alkynes, aldehydes, aromatic systems) DEPT spectra may actually deliver
false information about the number of attached protons:
30405060708090100110120130140 ppm
C
CH
CHDEPT135
DEPT90
C{ H}
CH
q
2
3
13 1
Fig.4: 13C{1H} and DEPT-spectrum of 10% ethylene benzene in CDCl3
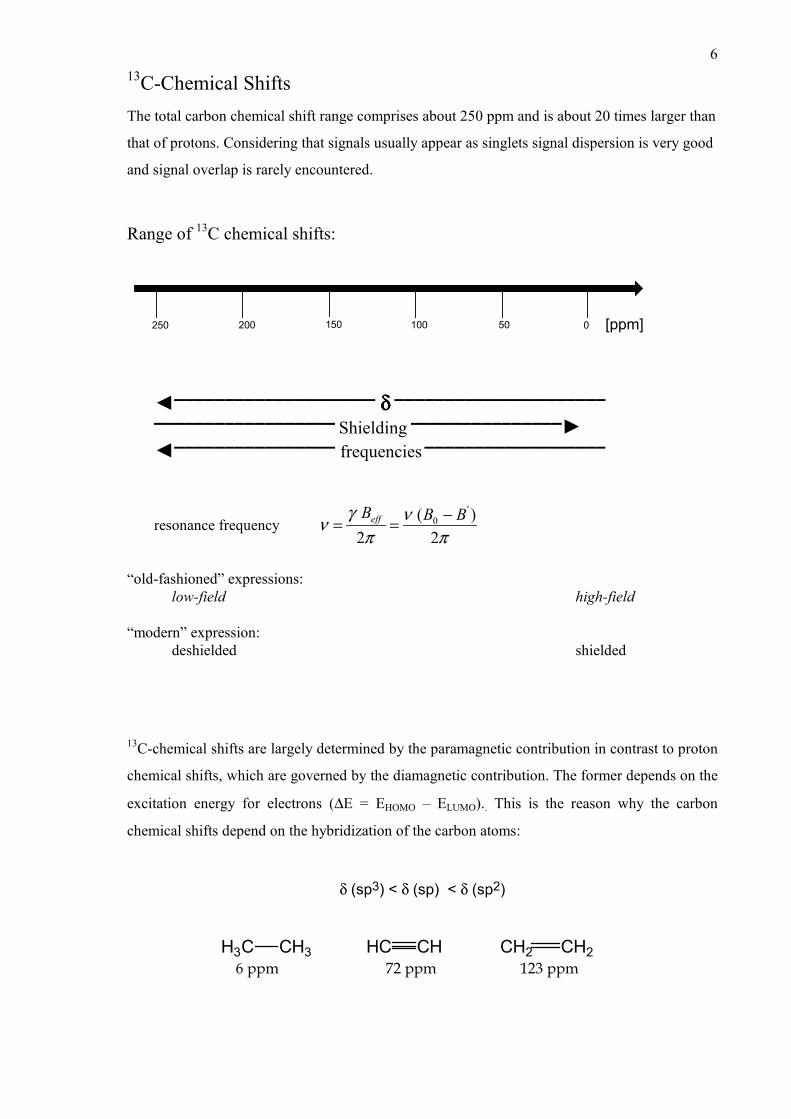
613C-Chemical Shifts The total carbon chemical shift range comprises about 250 ppm and is about 20 times larger than
that of protons. Considering that signals usually appear as singlets signal dispersion is very good
and signal overlap is rarely encountered.
Range of 13C chemical shifts:
200 150 100 50 0250 [ppm]
◄▬▬▬▬▬▬▬▬▬▬▬▬▬▬▬▬▬▬▬▬ δδδδ ▬▬▬▬▬▬▬▬▬▬▬▬▬▬▬▬▬▬▬▬▬ ▬▬▬▬▬▬▬▬▬▬▬▬▬▬▬▬▬▬ Shielding ▬▬▬▬▬▬▬▬▬▬▬▬▬▬▬► ◄▬▬▬▬▬▬▬▬▬▬▬▬▬▬▬▬ frequencies ▬▬▬▬▬▬▬▬▬▬▬▬▬▬▬▬▬▬
resonance frequency
“old-fashioned” expressions: low-field high-field
“modern” expression: deshielded shielded
13C-chemical shifts are largely determined by the paramagnetic contribution in contrast to proton
chemical shifts, which are governed by the diamagnetic contribution. The former depends on the
excitation energy for electrons (∆E = EHOMO – ELUMO).. This is the reason why the carbon
chemical shifts depend on the hybridization of the carbon atoms:
δ (sp3) < δ (sp) < δ (sp2)
6 ppm 72 ppm 123 ppm H3C CH3 CH2 CH2HC CH
πν
πγ
ν2
)(2
'0 BBBeff −==

7
Fig.5: Ranges of 13C- chemical shifts grouped according to functional groups
Carbon chemical shifts almost completely depend on the neighboring groups and local
anisotropy effects have negligible influence. In contrast, stereochemistry has a strong impact on
the values:
Extensive 13C chemical shift databases have been build up and quite often compounds can be
determined from the carbon chemical shifts using expert systems. In addition carbon chemical
shifts are more easily calculated than proton chemical shifts.
CH3
H
15.7 ppmCH3
28.2 ppm
H
trans-9-methylene decalin cis-9-methylene decalin

8
Influences of substituents on the 13C-chemical shifts The introduction of functional groups into unsubstituted alkanes generally leads to a shielding at
the α-position and to deshielding at the γ-position, whereas the influence at the δ and ε positions
are usually negligible. The deshielding effect increases with increasing electronegativity of the
substitutents.
The following example demonstrates the effect of introduction of a hydroxyl group:
+49.7 10.8 -4.7 +1.6 +2.2
When comparing pentane, 2-methylpentane and 2-dimethyl pentane it becomes obvious that
increasing alkylation leads to deshielding at C1, C2 and C3:
Molecule symmetry and the number of signals in the 13C{1H}-spectrum The symmetry of molecules reduces the number of signals. Any carbons that can be transformed
into another by a symmetry operation (rotation, translation, reflection) will give rise to only a
single line in the spectrum.
6 signals 6 signals 4 signals
H3C CH3
H H
H H
H H
H3C CH3
H3C H
H H
H H
H3C CH3
H3CCH3
H H
H H
13.513.5
22.234.1
22.2
27.7
27.7
27.941.9
20.8
14.329.5
29.5
29.5
47.318.1
15.1
30.6
Br
Cl
Br
Cl
CH3-CH2-CH2-CH2-CH313.5 22.2 34.1 22.2 13.5
63.2 33 29.4 23.8 15.3
HO-CH2-CH2-CH2-CH2-CH3
Br
Cl

9
Increment-method
Using increments, chemical shifts of carbon spectra can be estimated quite reliably with
accuracies of about +/- 5ppm. Provided the substituent effects are additive the following general
formula may be used to calculate the shifts:
δi = B + ∑ Aknk + ∑Siα
δi = chemical shift of the carbon in question
B = basis value (depends on the compound class, e.g. the value for aromatic carbons in
benzene)
A = substituent increment
n = number of substituents
S = steric or electronic correction factor
Increment systems for alkanes
According to Grant and Paul, substitution of a hydrogen atom by a methyl group leads to a low-
field shift of the attached carbon by approx. 9 ppm and for the β-carbon to a low-field shift of
about the same extent. Assuming free rotation about C-C bonds leads to an up-field shift of
approx. 2.5 ppm.

10
steric correction factors substituent increments
observed 13C-resonance
Cα, highest substituted
neighboring C-atom
CH3 CH2 CH C
Aα = +9.1ppm
Aβ = +9.4ppm
primary
secondary
tertiary
quaternary
0.0 0.0 -1.1 -3.4
0.0 0.0 -2.5 -6.0
0.0 -3.7 -8.5 -10.0
-1.5 -8.0 -10.0 -12.5
Aγ = -2.5ppm
Aδ = + 0.3pp
example: Calculation of the 13C-shifts of 2,2-dimethyl pentane and comparison with
experimental data:
13C
No.
Basis value
B
α β γ δ steric
correction
Calc. Exp. value
1 -2.3 +9.1 3*9.4 -2.5 +0.3 -3.4 29.4 29.5
2 -2.3 +4*9.1 +9.4 -2.5 - -8.0 33 30.6
3 -2.3 +2*9.1 +4*9.4 - - -6.0 47.5 47.3
4 -2.3 +2*9.1 +9.4 -3*2.5 - 0 17.8 18.1
5 -2.3 9.1 +9.4 -2.5 +3*0.3 0 14.6 15.1
H3C CH3
H3CCH3
H H
H H
1
2 34
5
11
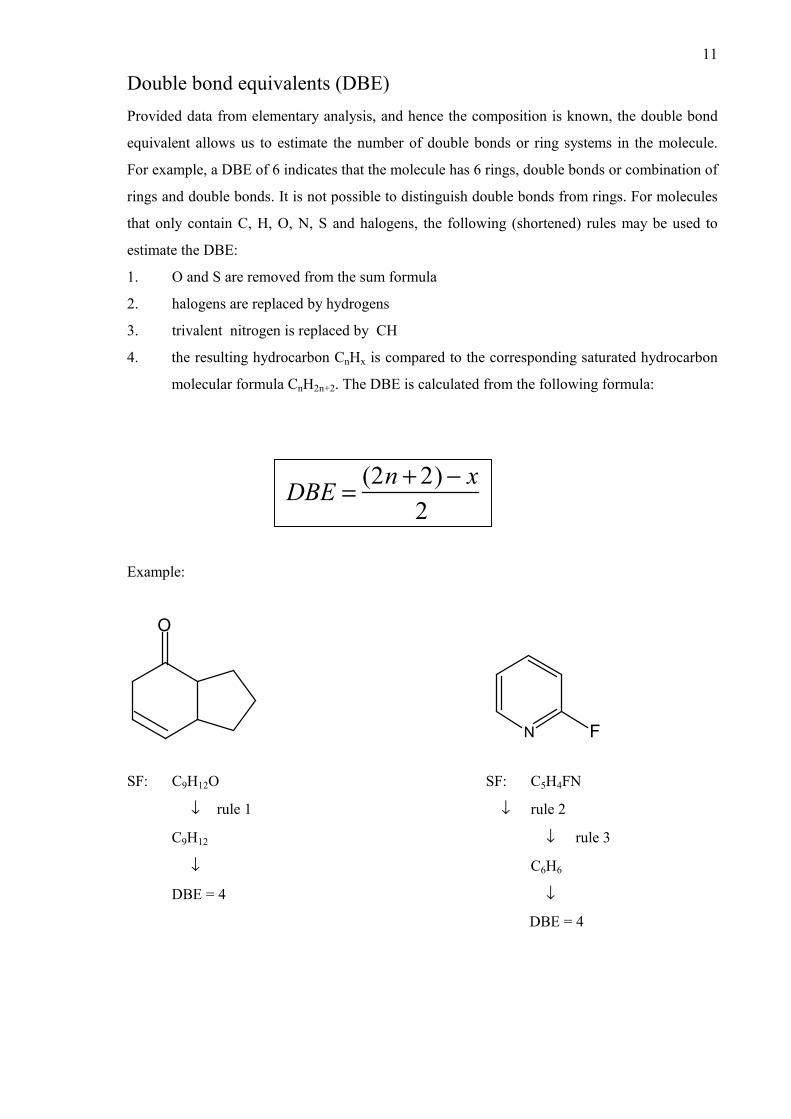
Double bond equivalents (DBE) Provided data from elementary analysis, and hence the composition is known, the double bond
equivalent allows us to estimate the number of double bonds or ring systems in the molecule.
For example, a DBE of 6 indicates that the molecule has 6 rings, double bonds or combination of
rings and double bonds. It is not possible to distinguish double bonds from rings. For molecules
that only contain C, H, O, N, S and halogens, the following (shortened) rules may be used to
estimate the DBE:
1. O and S are removed from the sum formula
2. halogens are replaced by hydrogens
3. trivalent nitrogen is replaced by CH
4. the resulting hydrocarbon CnHx is compared to the corresponding saturated hydrocarbon
molecular formula CnH2n+2. The DBE is calculated from the following formula:
Example:
SF: C9H12O SF: C5H4FN
↓ rule 1 ↓ rule 2
C9H12 ↓ rule 3
↓ C6H6
DBE = 4 ↓
DBE = 4
N F
O
DBE = (2n + 2) − x2
1213C,X-Spin,Spin-Couplings
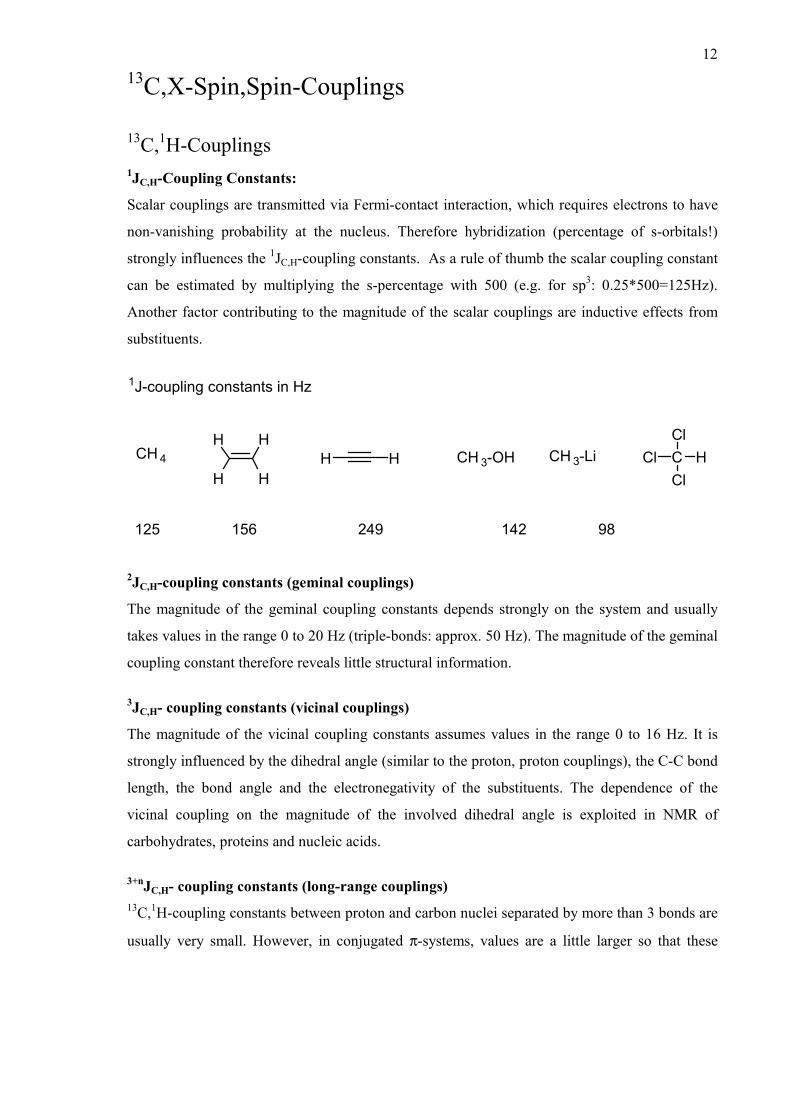
13C,1H-Couplings 1JC,H-Coupling Constants:
Scalar couplings are transmitted via Fermi-contact interaction, which requires electrons to have
non-vanishing probability at the nucleus. Therefore hybridization (percentage of s-orbitals!)
strongly influences the 1JC,H-coupling constants. As a rule of thumb the scalar coupling constant
can be estimated by multiplying the s-percentage with 500 (e.g. for sp3: 0.25*500=125Hz).
Another factor contributing to the magnitude of the scalar couplings are inductive effects from
substituents.
CH 4H
H
H
HH H CH 3-OH C HCl
Cl
Cl
1J-coupling constants in Hz
125 156 249 142 98 2
CH 3-Li
2JC,H-coupling constants (geminal couplings)
The magnitude of the geminal coupling constants depends strongly on the system and usually
takes values in the range 0 to 20 Hz (triple-bonds: approx. 50 Hz). The magnitude of the geminal
coupling constant therefore reveals little structural information.
3JC,H- coupling constants (vicinal couplings)
The magnitude of the vicinal coupling constants assumes values in the range 0 to 16 Hz. It is
strongly influenced by the dihedral angle (similar to the proton, proton couplings), the C-C bond
length, the bond angle and the electronegativity of the substituents. The dependence of the
vicinal coupling on the magnitude of the involved dihedral angle is exploited in NMR of
carbohydrates, proteins and nucleic acids.
3+nJC,H- coupling constants (long-range couplings) 13C,1H-coupling constants between proton and carbon nuclei separated by more than 3 bonds are
usually very small. However, in conjugated π-systems, values are a little larger so that these

13
couplings can be observed. Long-range couplings are not really important for structure
elucidation.
It is important to note that the magnitude of the scalar couplings is often not sufficient to
distinguish two- and three bond C,H scalar couplings.

1413C, 13C –couplings 1JC,C-coupling constants 13C-couplings cannot usually be observed due to the low natural abundance of 13C (1.1%). The
so-called satellite lines are 200 times smaller than the centre lines. Carbon-Carbon couplings are
of course observable in isotopically enriched molecules; this fact is exploited in protein NMR.
The magnitude of the 1JC,C-coupling constant depends on the hybridization of the involved
nuclei. Substitutent effects are largely limited to the couplings of the attached carbon (see
Fig.6).
C
C
C
72
40C
C
C
C
C
C61
NH2
Br
67
5656.5
59.5C
C
C
C
O
H
O70
33
C C CH 3
17567
H
Fig.6 13C,13C-coupling constants of various molecules [in Hz]
13C,31P-couplings Since phosphorus is 100% comprised of the spin-1/2 isotope 31P, 13C,31P-couplings will appear
as doublets in proton decoupled carbon spectra.
The magnitude of the one-bond 31P, 13C-couplings vary dramatically with values observed in the
range between–53 and 476 Hz. Interestingly,13C,31P-1J-coupling constants may also take up
values about 0 Hz, and may therefore assume values otherwise observed for geminal or vicinal
couplings. As a consequence, multiplicities cannot be easily used to determine by how many
bonds the carbon and phosphorus nuclei are separated.
(H3C-CH2-CH2-CH2)3P CH3-P(O)-(O-CH2-CH3)2 1JC,P = -11 1JC,P = 143 2JC,P =+12 2JC,P = -5.9 3JC,P =+13 3JC,P = +5.9 4JC,P = 0

1513C ,19F -couplings
Like phosphorus, fluorine entirely exists in the form of the 19F isotope, and therefore gives rise
to line splittings in carbon spectra similar to 31P. The magnitude of the coupling decreases with
increasing number of separating bonds. 1JC,F-coupling constants are relatively large (160–
400Hz). In aliphatic systems, 13C,19F-couplings may not be observed over 4 bonds, but in
conjugated π-systems couplings over up to 8 bonds have been found:
1JC2,F = 238Hz 2JC3,F = 37Hz
3JC4,F = 7.7Hz, 3JC6,F = 14.5Hz 4JC5,F = 4.2Hz
163164 ppm ppm 141 ppm 121 ppm ppm147.2 109.1
C2 C6 C4 C5 C3
Fig. 7: Proton decoupled 13C- spectrum of 2-fluoropyridine
N F
3
4
5
6 2

1
1D vs. 2D NMR spectra (general definitions)
A one dimensional NMR spectra has two dimensions: The x axis corresponds to the frequency axis (the chemical shifts in ppm) and the Y axis corresponds to the intensity (see the following figure).
12345678910 ppm
Intensity
increasing frequencies In contrast, a 2D NMR spectrum contains two frequency axes. Intensities present the third axis and are therefore usually displayed as contour plots (similar to the presentation used in geographical maps).
F2
F1
Figure: Two different presentations of a 2D spectrum: Stacked plot (left), contour plot
(right) [taken from: Derome, A.E., Modern NMR Techniques for Chemistry Research] Definition: The horizontal axis is defined as F2 (direct dimension) and the vertical axis as F1 (indirect dimension). This definition is valid for Bruker spectrometers, Varian actually uses it the other way around. If both dimensions contain chemical shifts, the experiment is called shift-correlated 2D NMR, if one dimension denotes scalar couplings, the spectra are called J-resolved.

2
Diagonal-, cross peaks
In a [1H, 1H]-COSY-experiment both frequency axes denote proton chemical shifts. Peaks in 2D spectra will connect nuclei, which are correlated in one way (usually either by scalar or dipolar couplings). Cross peaks correlate spins with different frequencies:
ν1 ≠ ν2
In homonuclear spectra (those, which contain similar nuclei (e.g. both proton frequencies) in the two frequency dimensions), peaks are symmetric with respect to the diagonal of the spectrum. The diagonal peaks correlate identical spins, and are therefore of little analytical use.
ν1 = ν2 The diagonal in some way represents the 1D spectrum. Each COSY-spectrum contains duplicated sets of cross peaks due to its symmetry. The peaks (ν1, ν2, cross peak) (ν1, ν1; diagonal peak), (ν2, ν1; cross peak) and (ν2, ν2; diagonal peak) form the corners of a square. All peaks with ν1 = −ν1 form the anti-diagonal.
ν 1
ν 1
F1
F2Anti-Diagonal: ν 1 = -ν1
Diagonal: ν 1 = ν 1
ν 2
ν 2
(ν 1, ν 1)( ν 1 , ν 2 )
( ν 2 , ν 2 ) (ν 2, ν 1)

3
The principle of 2D NMR spectroscopy
In a standard 1D proton experiment, acquisition of the signal starts (almost) immediately after the excitation radiofrequency pulse. But how are frequencies encoded in a 2D experiment? In principle, all 2D experiments are designed according to the same principle: They consist of a series of 1D experiments, in which a single delay has been altered in length. The building blocks of 2D experiments are: preparation, evolution, mixing and detection. Both evolution and detection are time periods, called t1 and t2, during which chemical shift and scalar couplings evolve. Therefore, signal intensities and phase are variables of
Int = f (t1, t2)
t1
Fig: Working principle of a 2D COSY experiment [taken from: van de Ven, F.J.M., Multidimensional NMR in Liquids]
During the preparation period the system is prepared, the magnetization is usually prepared along a transverse axis (x or y). During the evolution time t1, magnetization evolves with chemical shift and/or scalar couplings. During the mixing period coherences are transferred from one spin (the one that is frequency encoded in F1) to another spin (the one that is detected during t2). If the two spins are different, such a transfer will give rise to cross peaks, otherwise it will yield a diagonal peak. The different 2D experiments differ by which mechanism (e.g. scalar coupling1 or dipolar coupling2) magnetization is transferred. The signal is finally detected during the detection (acquisition) period. During recording of a 2D experiment the same NMR experiment is repeated over and over again, simply setting the evolution time to another value from 1D spectrum to 1D spectrum. The increment ∆t1, that is added to the evolution time from experiment to experiment, depends on
the spectral width in the indirect dimension.
1 the dipolar coupling, often called dipole-dipole coupling, is mediated via the dipole moment of the spins via space. Its size depends on the orientation of the molecule with respect to the static field. 2 the scalar coupling, often called spin-spin-couplung, is mediated via electrons through bonds. Its size is independent of the orientation of the molecule with respect to the static field. Scalar couplings give rise to multiplet patterns of the signals.

4
How many 1D experiments need to be recorded for the complete 2D spectrum?
For a typical 2D [1H, 1H]-COSY spectrum usually a series of 512 1D spectra is recorded. The 1D spectra contain resonances at identical frequency, but the amplitudes (intensities) of the signals are modulated (vary) from experiment to experiment. A Fourier transformation along the direct frequency dimension F2 results in a set of 1D spectra containing all chemical shifts and couplings, which are active during the acquisition period t2. Because the signals physically give rise to a signal in the detection coil this dimension is called the direct dimension. Only so-called single-quantum frequencies can be recorded, because only these will result in a signal in the coil.
Int (t1, t2 ) FT → Int (t1,ν2 )
Figure: Schematic representation of a set of free induction decays (FIDs) (left) subject to the first fourier transformation. [taken from: van de Ven, F.J.M., Multidimensional NMR in Liquids]
The modulation of the amplitude of the signals in the different 1D spectra is due to evolution of chemical shifts and scalar couplings during the evolution time t1. A second Fourier transformation is performed in the orthogonal dimension (along t1), and data points correspond to different FIDs.
Int (t1,ν2 ) FT → Int (ν1, ν2 )
Since the frequencies are derived from the amplitude modulation of the signals indirectly, the F1 frequency dimension is called the indirect dimension. The second FT therefore yields the full spectrum with two frequency dimensions:

5
Figure: FT along t1 will yield the full 2D spectrum. Cross peaks may be displayed either as cross peaks with
a contour plot (c) or a stacked plot (a,b) [taken from: van de Ven, F.J.M., Multidimensional NMR in Liquids]
Depending on whether only scalar couplings or scalar couplings and chemical shifts were active during t1, a J-resolved or a shift-correlated spectrum will result. In a COSY experiment, chemical shifts are active during t1 and t2, and coherence transfer takes place via scalar couplings. How much time and how much disk space are required for recording a 2D experiment?
The NMR signal (the FID) is recorded in stroboscopic fashion; single data points, separated in time, are measured. Resolution gets better when more data points are recorded. High-resolution 1D proton spectra typically contain 32768 (32K) data points corresponding to 128 kilobyte disk space. The resolution, assuming a spectral width of 12500 Hz, is then 0.4Hz per data point. In order to yield the same resolution in both dimensions in the 2D spectrum, 32768*32768 (2 GB) need to be recorded. Even if only a single scan per increment would be used (which is usually not sufficient), the whole experiment would last almost 2 days. In order to reduce disk space requirements and, nowadays more important, in order to save measuring time, 2D data sets are usually recorded with reduced resolution. For a typical [1H, 1H]-COSY experiment 512 FIDs with 2048 data points each are recorded. The total disk space requirements are then 2 MB, and the measuring time would last for 18 min.

6
Projections
Along the edges of 2D contour plots the one-dimensional spectra may be plotted. Either internal projections (generated by projecting all signals onto one axis) or external projection (by plotting the separately recorded 1D spectrum along the axes) may be chosen. The following figure displays a 2D [1H, 13C]-HSQC-spectrum. In these experiments proton frequencies are recorded in F2 and carbon frequencies in F1 in order to correlate protons with their directly attached carbon nuclei.
ppm
6.66.87.0 ppm
100
110
120
1H−NMR Spektrum as external projection13
C−
NM
R S
pekt
rum
as
exte
rnal
pro
ject
ion
F2
F1
internal projection
inte
rnal
pro
ject
ion
Internal and external projections are both plotted along the spectrum. Since the internal projections are generated from the 2D spectrum, which is recorded with reduced resolution, internal projections have lower resolution. This is obvious from the two signals at 6.6 and 6.8 ppm, for which the small couplings are not resolved in the internal projections. Similarly, the very close signals at 111 and 112 ppm are not fully resolved in the internal projection. Two-dimensional spectra have much lower resolution than their 1-dimensional counterparts. However, since signals are dispersed in two dimensions, signal overlap in the 2D spectrum is actually much smaller. Therefore, apart from the fact that 2D spectra display correlations between signals, they also allow to better extract the chemical shifts from the better-dispersed signals.
7
2D Experiments The [1H, 1H]-COSY-experiment
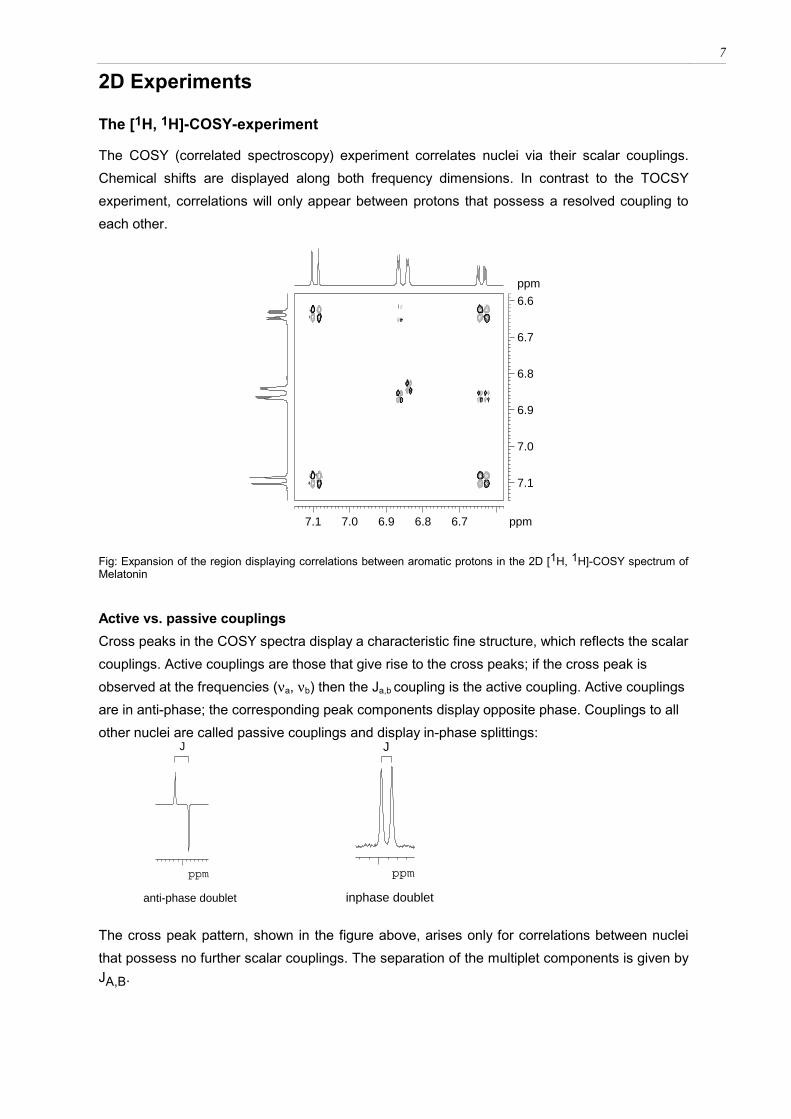
The COSY (correlated spectroscopy) experiment correlates nuclei via their scalar couplings. Chemical shifts are displayed along both frequency dimensions. In contrast to the TOCSY experiment, correlations will only appear between protons that possess a resolved coupling to each other.
ppm
6.76.86.97.07.1 ppm
6.6
6.7
6.8
6.9
7.0
7.1
Fig: Expansion of the region displaying correlations between aromatic protons in the 2D [1H, 1H]-COSY spectrum of Melatonin
Active vs. passive couplings Cross peaks in the COSY spectra display a characteristic fine structure, which reflects the scalar couplings. Active couplings are those that give rise to the cross peaks; if the cross peak is observed at the frequencies (νa, νb) then the Ja,b coupling is the active coupling. Active couplings are in anti-phase; the corresponding peak components display opposite phase. Couplings to all other nuclei are called passive couplings and display in-phase splittings:
ppm
anti-phase doublet
J
ppm
inphase doublet
J
The cross peak pattern, shown in the figure above, arises only for correlations between nuclei that possess no further scalar couplings. The separation of the multiplet components is given by JA,B.

8
ppm
2.00 ppm
4.00
F1
J(A,B)
J(A,B)
F2
Fig.: Cross peak of a 2-spin system in the COSY-spectrum
For the following spin system consisting of a linear chain of three protons, in which C is coupled to A and B coupled to A
C
A
B spin-system:
the cross peak (νA, νB) would be as illustrated in the following figure:
ppm
2.00 ppm
4.00
F1
J(A,B)
J(A,B)
F2
J(A,C)
Fig.: Cross peak of the three-spin system in the COSY
The active coupling JA,B leads to the anti-phase splitting. Due to the passive coupling JA,C an
additional in-phase splitting occurs. The distance separation of the in-phase components therefore allows, in principle, to extract the passive coupling JA,C (however, partial signal
cancellation leads to wrong values for small couplings; these are better extracted from ECOSY spectra).

9
Artefacts in COSY spectra
• t1-Noise is noise strips running parallel to
the frequency axes. They mostly originate from instrumental instabilities, with temperature instabilities are being the most serious source. Since the noise is proportional to the signal height, they are most prominent for strong signals, e.g. singlet methyl groups or other sharp lines. T1-noise always degrades spectrum quality but becomes particularly annoying when cross peaks with small intensities should be interpreted. • If the chosen relaxation delay is too short, so-called rapid-scanning artefacts are observed. They occur at the double-quantum frequencies (the sum of the frequencies of the coupled nuclei) and lead to a second diagonal , twice as steep. They can (and should!) be easily recognized by the fact that they occur at positions at which no signals are found in the 1D spectrum.
Fig.: taken from: Cavanagh, J. et al. Protein Spectroscopy
The anti-phase character of COSY cross peaks leads to cancellation of signal intensities for
small couplings. It is important to note that the resolution in the two frequency dimensions is
ppm
3.03.5 ppm
2
4
6
Fig.:Example for t1-noise in a COSY-Spectrum
10
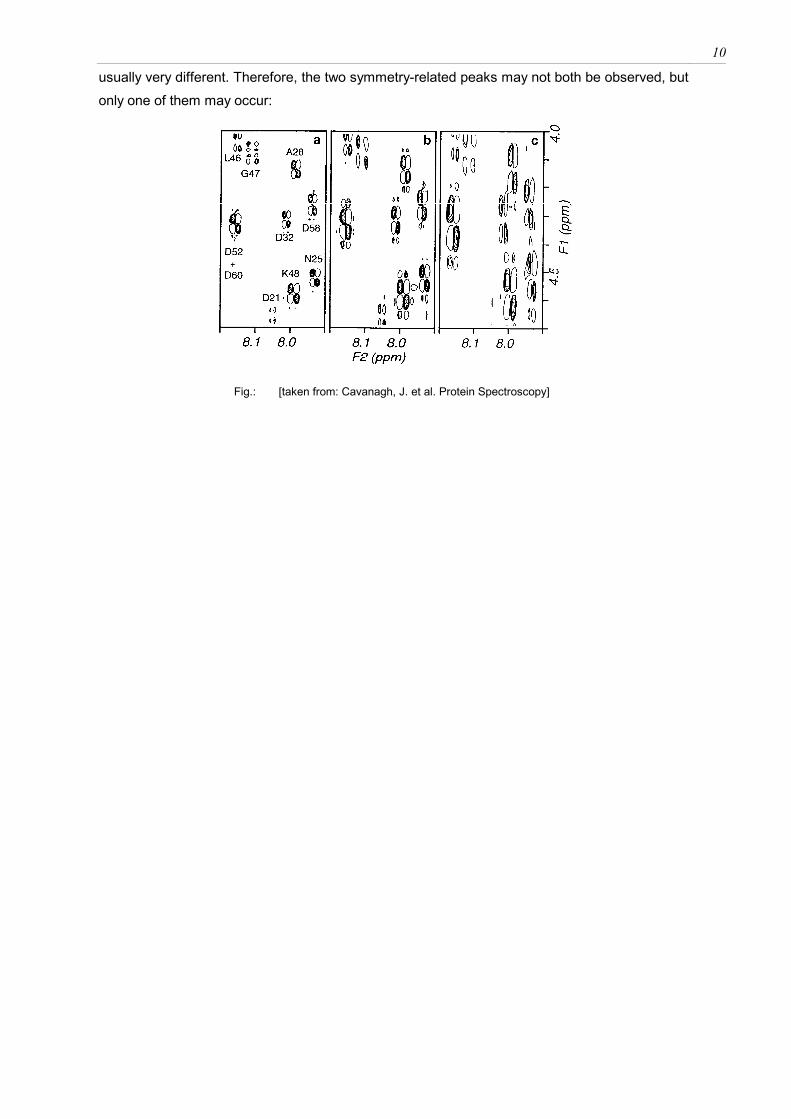
usually very different. Therefore, the two symmetry-related peaks may not both be observed, but
only one of them may occur:
Fig.: [taken from: Cavanagh, J. et al. Protein Spectroscopy]

11
The [1H, 1H]-TOCSY-experiment
Similar to the COSY, the TOCSY is a homonuclear, shift-correlated 2D NMR experiment, in which coherence transfer takes place via scalar couplings. Cross-peaks contain both passive and active couplings in-phase. In contrast to the COSY, correlation between a spin and all other spins from the same spin system3 may be observed. For example, correlations from the amide proton will, under favorable conditions, include all side-chain protons from the same amino acid (e.g. for lysine). Another example would be correlations from the anomeric proton in sugars, which could display correlations to all other protons from the same sugar unit. The strength of the experiment lies in the fact that one resolved (non-overlapped) resonance (e.g. the anomeric proton or the amide proton) may be sufficient to determine, which spins are part of the same spin system, even if parts of the spin systems heavily overlap with other spin systems. By proper choice of the length of the mixing time (e.g. 10 ms), coherence transfer can be limited to just vicinal correlations, thus resulting in a COSY-like spectrum, or to correlations between all members of the spin system (e.g. for 80 ms). Because the multiplet components are in-phase, signal cancellation does not occur even if line-widths become larger, and hence a short mixing time TOCSY is preferable to a COSY for larger molecules.
ppm
6.46.66.87.07.2 ppm
6.5
7.0
ppm
6.46.66.87.07.2 ppm
6.5
7.0
mixing time 15ms mixing time 100ms
Fig.: Expansion of the region displaying aromatic correlations of Melatonin, for different settings of the mixing time.
3 Definition of a spinsystem: Spins, which belong to the same coupling network are part of the same spin system.
12
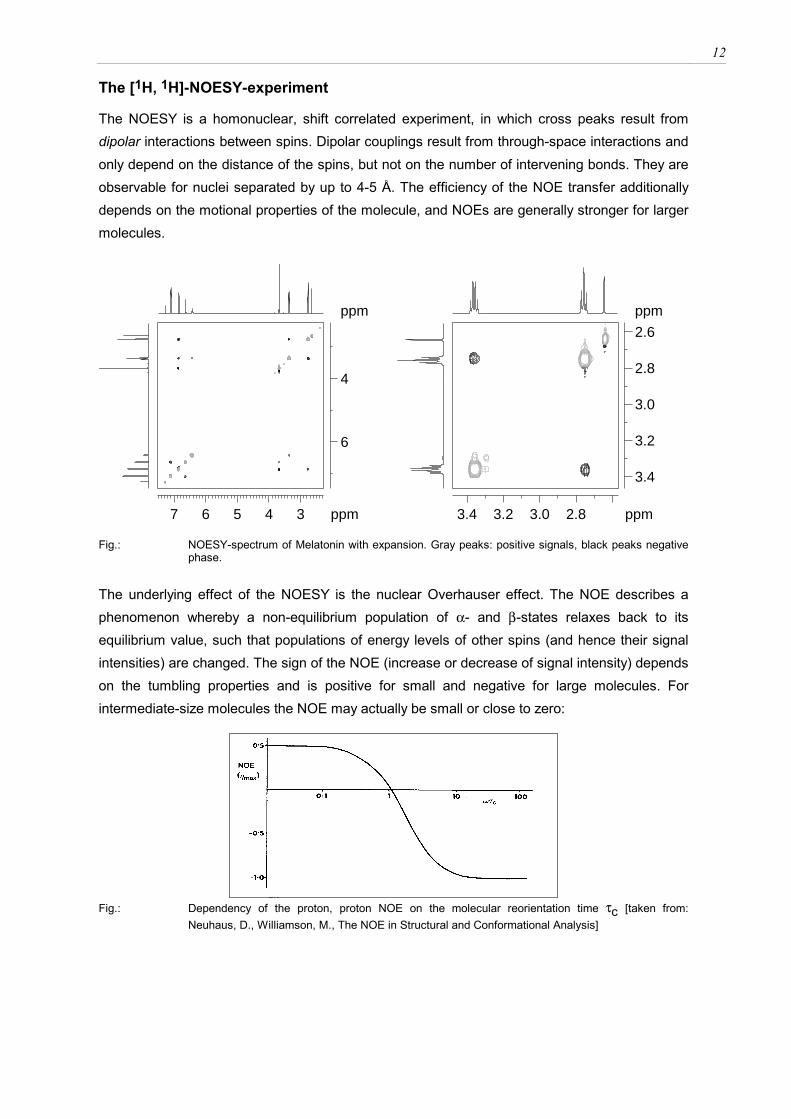
The [1H, 1H]-NOESY-experiment
The NOESY is a homonuclear, shift correlated experiment, in which cross peaks result from dipolar interactions between spins. Dipolar couplings result from through-space interactions and only depend on the distance of the spins, but not on the number of intervening bonds. They are observable for nuclei separated by up to 4-5 Å. The efficiency of the NOE transfer additionally depends on the motional properties of the molecule, and NOEs are generally stronger for larger molecules.
ppm
34567 ppm
4
6
ppm
2.83.03.23.4 ppm
2.6
2.8
3.0
3.2
3.4
Fig.: NOESY-spectrum of Melatonin with expansion. Gray peaks: positive signals, black peaks negative
phase. The underlying effect of the NOESY is the nuclear Overhauser effect. The NOE describes a phenomenon whereby a non-equilibrium population of α- and β-states relaxes back to its equilibrium value, such that populations of energy levels of other spins (and hence their signal intensities) are changed. The sign of the NOE (increase or decrease of signal intensity) depends on the tumbling properties and is positive for small and negative for large molecules. For intermediate-size molecules the NOE may actually be small or close to zero:
Fig.: Dependency of the proton, proton NOE on the molecular reorientation time τc [taken from:
Neuhaus, D., Williamson, M., The NOE in Structural and Conformational Analysis]

13
Because the sign of the NOE depends on the molecular reorientation time τc of the molecule, peaks in the NOESY may be positive (large molecules) or negative (small molecules). The reorientation time is largely influenced by the viscosity of the solvent. Even smaller molecules therefore tend to behave like large molecules when measured in DMSO. A dramatic influence on motional properties is also seen by the temperature: As a rule of thumb, changing the temperature by 20 degrees corresponds to the same change in motional properties, as would be observed upon doubling the molecular weight. The following table describes the behavior of molecules of different size in NOESY experiments:
Phase of the
diagonal peaks Phase of the cross
peaks
Small molecules in
low-viscosity
solvents
positive negative
Medium-sized
molecules positive
Very weak signals (positive or negative)
Large molecules,
viscous solvents
positive positive
Artifacts in the NOESY • EXSY-(exchange)-peaks: They often display large intensities, possess the same phase as the diagonal peaks, and are often also observed for very short mixing times. Typical examples are exchange peaks between amide protons, or sugar hydroxyl protons, and the water signal. • COSY-peaks (anti-Phase COSY-type peaks;observed between protons that display both dprotons), and for shorter mixing times. Due to larger molecules, they disappear in NOESY spectheir COSY-type typical anti-phase peak pattern. they lead to partial cancellation of NOE cross pea
• t1-noise und rapid scanning artifacts (see rema
zero-quantum interference peaks): They are
ppm
3.03.54.04.55.0 ppm
3
4
5
Fig.: NOESY-spectrum containing exchange peaks.
ipolar and scalar couplings (e.g. for geminal the different relaxation properties of protons in tra of proteins. These peaks are manifested by When overlapped with genuine NOESY signals k intensity resulting in titled peaks.
rks for the COSY-experiment).

14
The [1H, 1H]-ROESY-experiment
The ROESY (rotating frame NOE experiment, sometimes also called CAMELSPIN) experiment is like the NOESY, a 2D homonuclear shift-correlated experiment, in which coherence transfer is achieved through dipolar couplings for protons separated by less than 5Å. The NOE transfer takes place in a rotating frame leading to a different dependence of the sign of the ROE on the motional properties of the molecule. Effectively, the ROE is always positive (leading to negative cross peaks for positively phased diagonal peaks). The ROE buildup is twice as fast as the NOE buildup. During the mixing time T1ρ relaxation takes place, which is similar in size to T2, and therefore the use of the ROSY is limited to smaller or medium-size molecules.
ppm
2345678 ppm
2
3
4
5
Fig.: ROESY-spectrum of a peptide; grey peaks = positive signals, black peaks = negative signals
Artefacts in the ROESY
• TOCSY-Peaks, (in-phase, positive), observed for geminal protons, whose chemical shift difference is small • spin-diffusion peaks (ROE-ROE relay peaks) (in-phase, positive) • TOCSY-ROESY transfer Peaks (in-phase, negative) • exchange peaks (positive) It can be seen that almost all artifacts can be readily recognized from the different sign of the peaks.

15
The [X, X]-EXSY-experiment
The EXSY experiment is a homonuclear, shift correlated experiment, in which coherence transfer takes place through chemical or conformational exchange. In fact, the pulse sequence is the same as the one used for the NOESY. Because exchange is usually faster than the NOE buildup, shorter mixing times may be used for the EXSY. From recording a series of EXSY spectra with different mixing times, exchange kinetics may be deduced.
NO
H
N
O
H
ppm
234567 ppm
2
4
6
ppm
7.07.5 ppm
7.0
7.5
Fig.: [1H, 1H]-EXSY-spectrum displaying exchange between the two rotamers in the figure on top.
Artefacts in EXSY spectra: • NOESY-Peaks

16
The [13C, 13C]-INADEQUATE-experiment
Like the COSY experiment the INADEQUATE provides spectra of the homonuclear, shift-correlated type. INEADEQUATE experiments are mainly used for 13C,13C correlation spectra of natural abundance 13C molecules. The INADEQUATE contains a very efficient filter to suppress 13C signals of 13C,12C isotopomers. This filter selects for 13C,13C double quantum coherences, which can only be formed by a pair of coupled 13C nuclei. In F1 the double quantum frequencies are recorded, and hence the cross peaks have the following coordinates: F2: ν(a), F1: ν(a)+ ν(b). Because 13C,13C isotopomers are very rare (0.01*0.01=0.0001) in 13C natural abundance molecules, extremely concentrated samples are required. The experiment is very powerful, and very useful for highly substituted compounds, in which proton density is low. The following figure displays an expansion of an INADEQUATE experiment recorded on melatonin:
ppm
110120130140150 ppm
140
150
160
170
C5C6C7/C8C9
C10C11C12
Fig.: Expansion of a 2D INADEQUATE spectrum recorded on melatonin
Cross peaks are spilt into doublets by the one-bond C-C coupling. The two coupled resonances can be recognized as two separate peaks at a common frequency in F1 (on a horizontal line). Sometimes one of the two peaks is missing due to low signal-to-noise. The coupled partner can be easily calculated, because its frequency plus the frequency of the coupling partner must add up to the F1 frequency.
N
N C CH3
HH3CO
O
125
10 8
9
117
6
H
Melatonin
17
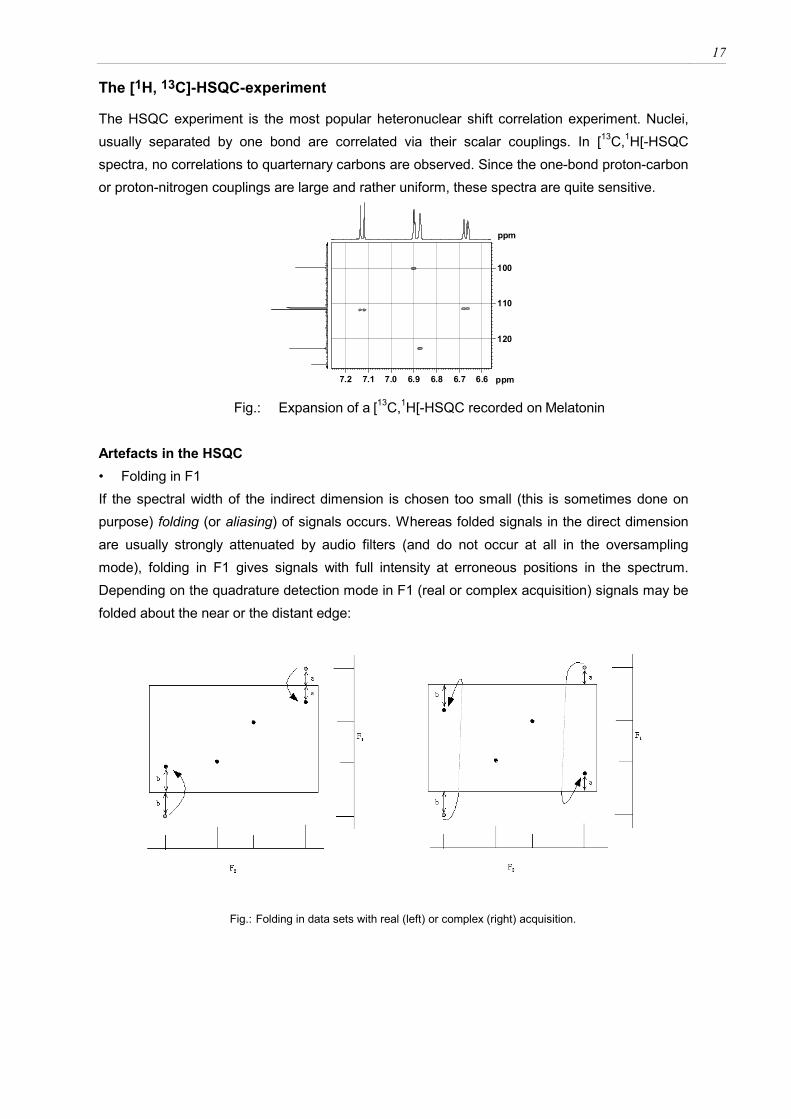
The [1H, 13C]-HSQC-experiment
The HSQC experiment is the most popular heteronuclear shift correlation experiment. Nuclei, usually separated by one bond are correlated via their scalar couplings. In [13C,1H[-HSQC spectra, no correlations to quarternary carbons are observed. Since the one-bond proton-carbon or proton-nitrogen couplings are large and rather uniform, these spectra are quite sensitive.
ppm
6.66.76.86.97.07.17.2 ppm
100
110
120
Fig.: Expansion of a [13C,1H[-HSQC recorded on Melatonin Artefacts in the HSQC • Folding in F1 If the spectral width of the indirect dimension is chosen too small (this is sometimes done on purpose) folding (or aliasing) of signals occurs. Whereas folded signals in the direct dimension are usually strongly attenuated by audio filters (and do not occur at all in the oversampling mode), folding in F1 gives signals with full intensity at erroneous positions in the spectrum. Depending on the quadrature detection mode in F1 (real or complex acquisition) signals may be folded about the near or the distant edge:
Fig.: Folding in data sets with real (left) or complex (right) acquisition.

18
The [1H, 13C]-HMBC-experiment
The HMBC experiment like the HSQC gives heteronuclear shift-correlation spectra. In contrast to the HSQC, coherences are transferred through the much smaller long-range couplings. The long-range couplings span rather a wide-range. The 1H,13C 3J coupling, for example, displays a Karplus-type dependence on the dihedral angle. Therefore, some couplings may be close to zero, and such correlations will then of course be absent from the spectrum. Depending on the system under study, the 2J or the 3J coupling may be larger, so that these spectra contain much ambiguity. Nevertheless, the HMBC is a very useful experiment, because it contains correlations to quarternary carbons.
ppm
2.02.53.03.54.04.55.05.56.06.57.0 ppm
155
160
165
170
Fig.: Expansion of the [13C,1H]- HMBC-spectrum of Melatonin
Artefacts • HMBC spectra often contain correlations due to 1JC,H-couplings. Since HMBC spectra are
not usually decoupled during acquisition, these couplings will show up as rather larger (e.g. 200 Hz) doublets. The HMBC contains a filter for such correlations, which however fails to work when the one-bond couplings differ significantly from standard values (e.g. from 140Hz, aromatic carbons).
ppm
2.02.53.03.5 ppm
25
30
35
40
1J(C,H) coupling
Fig.: HMBC-spectrum displaying correlations due to the 1JC,Hcouplings
• axial peaks (artifacts which can be found on a horizontal line along the center frequency) • folded signal similar to the situation encountered for HSQC spectra

Summary
1H chemical shift of protons, integrals, coupling constants 13C{1H} chemical shift of 13C; couplings to nmr-active nuclei like
31P, 19F, … will be observed ( except to 1H) DEPT135 distinguish between von C; CH2 und CH/CH3 DEPT90 distinguish between CH and CH3 (only CH are observable) 1H,1H-COSY scalar couplings between protons (2J, 3J) TOCSY Determination of protons which belong to
the same spin system. HSQC Which proton is directly bonded to which
heteronucleus (13C,15N). HMBC 2J-,3J- or 4J- CH-couplings NOESY Correlations between protons separated by ROESY less than 5Ǻ. No matter how many bonds are in between. INADEQUATE 1J- 13C-13C-couplings will be observed.
Determination of the 13C skeleton. Especially useful for highly substituted compounds.
HSQC-TOCSY Additional to the one-bond CH-correlation
also the neigbouring protons of CHx-groups are observed. This can also be NH- or OH-protons. Very useful experiment when the proton shift dispersion is small.
CH
C CH H
J J
C CH H
J
CC CH J
C CH H
NOE/ROE
C CH H
J
CH
C CH H
J J J
CC CH H

Chirality and NMR
Enantiomeric molecules in principle do not differ in their physical propertiesunless they are placed in a chiral environment. In optical spectroscopy, linearly-polarized light is used to determine the rotation angle in order to determine purityof optically active compounds. Protons attached to chiral centers will give rise toseparate signals only if the molecule is placed in a non-chiral environment.Protons at prochiral centers (e.g. methylen protons) may be enantiotopic ordiastereotopic. Enantiotopic protons can be converted into each other by a“drehspiegel” operation and will give rise to a single peak; they are isochronous.To reveal whether protons are enantiotopic or diasterotopic one proton may besubstituted by a (so far non-existing group) X. If the resulting molecules arediastereoisomers, the protons are called diastereotopic. They may than (but notnecessarily) resonate at different frequencies (e.g. methylen protons at -positionsof amino acids). Whether or not two separate signals are observed often dependson the spatial separation to the nearest chiral center. In the case a pair ofenantiomers is formed the protons are called enantiotopic. Diastereotopic protonscan only be found in molecules that contain at least one chiral center.Enantiotopic protons (belonging to the R- and S-form) can only be distinguishedin the presence of a chiral environment. Such a chiral environment may forexample be a chiral solvent but could also be a chiral molecule that complexes tothe molecule of interest:
• chiral solvents
2,2,2-Trifluoro-1-phenylethanol 1-Phenylethylamine
Since these solvents are non-deuterated another (external) substance must beadded for enabling locking on deuterium.
NH2
CF3
OH

• chiral reagents ( chiral shift reagents)
Lanthanide shift reagents contain unpaired electrons, which by interaction of theelectrons of the metal with the protons of the substance of interest lead to (large)changes in the resonance frequency (paramagnetic contribution to the chemicalshift).Pr3+ : High-field shift of the signals ( )Eu3+ : Low-field shift of the signals ( )By adding lanthanide shift reagents highly overlapped (crowded) regions of thespectrum can be better dispersed.
Commonly used shift reagents and their properties:
Fig. 1 taken from: H.Günther,
NMR-Spectroscopy
Chiral shift reagents form diastereotopic complexes with the compounds, whichdiffer in their physical properties. Some lanthanide shift reagents contain chiralligands and the resulting complexes with chiral molecules are diastereotopic.Provided sufficient chiral lanthanide shift reagent has been added the enantiotopicprotons are shifted into opposite directions until they are (completely) resolved.But because shift reagents contain paramagnetic material proton-electron dipolarrelaxation will lead to (significant) signal broadening. Therefore it is highly
recommended to add only little quantities until the signal separation of R- and S-signals is sufficient.
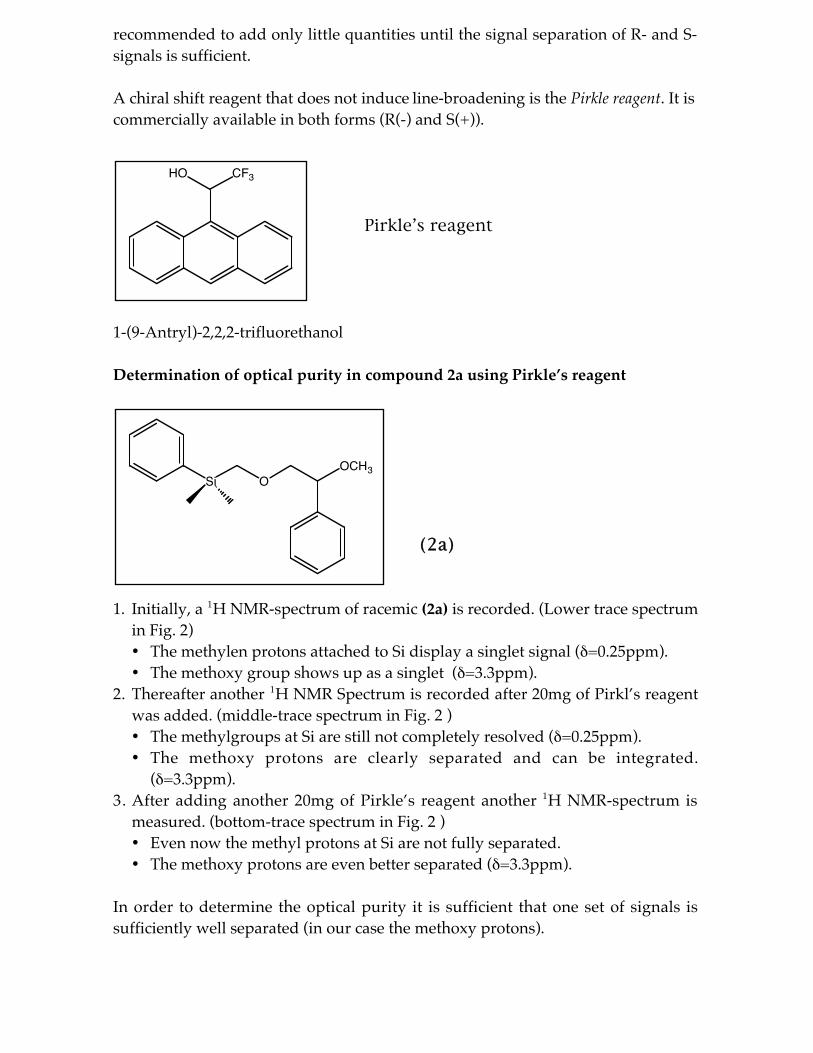
A chiral shift reagent that does not induce line-broadening is the Pirkle reagent. It iscommercially available in both forms (R(-) and S(+)).
Pirkle’s reagent
1-(9-Antryl)-2,2,2-trifluorethanol
Determination of optical purity in compound 2a using Pirkle’s reagent
(2a)
1. Initially, a 1H NMR-spectrum of racemic (2a) is recorded. (Lower trace spectrumin Fig. 2)• The methylen protons attached to Si display a singlet signal ( =0.25ppm).• The methoxy group shows up as a singlet ( =3.3ppm).
2. Thereafter another 1H NMR Spectrum is recorded after 20mg of Pirkl’s reagentwas added. (middle-trace spectrum in Fig. 2 )• The methylgroups at Si are still not completely resolved ( =0.25ppm).• The methoxy protons are clearly separated and can be integrated.
( =3.3ppm).3. After adding another 20mg of Pirkle’s reagent another 1H NMR-spectrum is
measured. (bottom-trace spectrum in Fig. 2 )• Even now the methyl protons at Si are not fully separated.• The methoxy protons are even better separated ( =3.3ppm).
In order to determine the optical purity it is sufficient that one set of signals issufficiently well separated (in our case the methoxy protons).
HO CF3
Si OOCH3

Fig. 2 : 1H NMR-Spectrum of (2a)
Determination of optical purity of alcohols and amines
9 8 7 6 5 4 3 2 1 ppm
Racemat
Racemat +20mg Reagens
Racemat +40mg Reagens
3.43.63.84.04.2 ppm
3.43.63.84.04.2 ppm
3.43.63.84.04.2 ppm
0.25 ppm
0.25 ppm
0.25 ppm

Mosher’s reagent
Mosher’s reagent enables the determination of absolute stereochemistry ofsecondary alcohols or amines.
• Preparation: All proton chemical shifts should be assigned in the molecule.• Reaction: Take two samples of the molecule of interest and treat them
with either R(-)-Mosher’s reagent or S(+)-Mosher’s reagent.
Mosher’s reagent: 2-Methoxy-2-(trifluoromethyl)-2-phenylaceticacid chloride
R(-)-MTPA-Cl S(+)-MTPA-Cl
219.80 SFr./500mg 199.60 SFr./500mgstore at -18°C store at -18°C
• Measurement: Record 1-D proton spectra of both reaction products.The method relies on the large contribution of the ring currentfrom the phenyl moiety of the reagent to the chemical shifts ofthe methylene protons. The magnitude of the effect isproportional to the distance of the methylene protons to theMTPA-moiety.
Never use benzene-d6 or pyridine-d5 as the solvent (for obvious reasons!).
• Interpretation: Compute the differences in chemical shift for the methyleneprotons ( = S R) (i n Hz) between the R- or S-MTPA-esters.For all protons on one side of the stereocenter > 0 and on theother side < 0. The absolute stereochemistry at the chiralcenter can then be extracted by using the following picture:
F3C OCH3
O
Cl
H3CO CF3
O
Cl
C
OMTPA
H
>0<0
H1
H2
H3
H1'
H2'
H3'

Si CH3
CH3
CH3
H3C
Referencing of NMR-Spectra
In order to compare NMR spectra recorded at different places spectra need to bereferenced correctly. Moreover, the exact conditions under which samples wereprepared (pH, salt content etc.) and recorded (temperature) should be describedand general standards have to be used.Standards may be directly added to the sample or given as an external reference.In the latter, the standard is filled into a small capillary, which is placed inside thetube. Unfortunately, the external reference does not experience identicalconditions of susceptibility, pH, temperature or pH, and therefore internalstandards are usually preferable.An ideal standard should not interfere (react!) with the sample. The signal ideallyis a singlet, which resonates outside the region (e.g. tetramethylsilane, TMS), inwhich the signals commonly occur. In addition, temperature and pH sensitivitymust be small and known.
Frequently used chemicals for referencing:
TMS Tetrametylsilane1H: = 0 ppm13C: = 0 ppm
Cyclosilane-d181H: = 0.327 ppm
DSS 2,2-Dimethyl-2-silapentane-sulfonic acidsodium salt3-Trimethylsilyl-1-propanesulfonic acidsodium salt
1H: = 0 ppm
TSP 3-(Trimethylsilyl)-propionic acidSodium salt
1H: = 0 ppm13C: = 1.7 ppm
Dioxane1H: = 3.75 ppm13C: = 67.4 ppm
Si
CH3
CH3
H3C
S O
NaO
Si
CH3
CH3
H3C O
ONa
Si Si
Si
D3C CD3
CD3
CD3D3C
D3C
O
O

Calibration of proton spectra
Be careful when referencingmeasurements in water or methanol:shifts are pH and temperature dependend!
Measurements in water:
TMS is not water insoluble and therefore TSP is mostly used. The resonancefrequency of TSP is pH dependent. TSP may also interact with hydrophobic partsof the molecule, and the chemical shift will then be the population-weightedaverage, which of course depends on the concentration ( 0 ppm). Anotheroften-used possibility is to use the water signal for referencing. The waterfrequency is highly temperature and weakly pH dependent (0.02 ppm / pH-unit).Provided the exact temperature in the sample is known (which may not be trivial!Some experiments do deliver a considerable amount of heating, e.g. the TOCSY)the chemical shift of the water is calculated from the following formula:
[ppm] T = measuring temp. in Kelvinat pH = 5.5
Measurements in organic solvents:
In most organic solvents TMS is used as an internal standard. It is added in smallamounts (!) (5 drops of TMS to 30 ml solvent, one may also use a pipet and sucksome TMS from the gas phase and add it to the NMR sample, never directly add theTMS liquid!). Because TMS is highly volatile it is better substituted by Cyclosilan-d18, whose boiling point is 208 °C, for high-temperature measurements. A lessprecise method is to use the solvent signal for referencing.
(H 2O )= 7.83
T
96.9
TMS =0 ppm
TSP =0 ppm
DSS =0 ppm
Cyclosilan-d18 =0.327 ppm
Dioxan =3.75 ppm
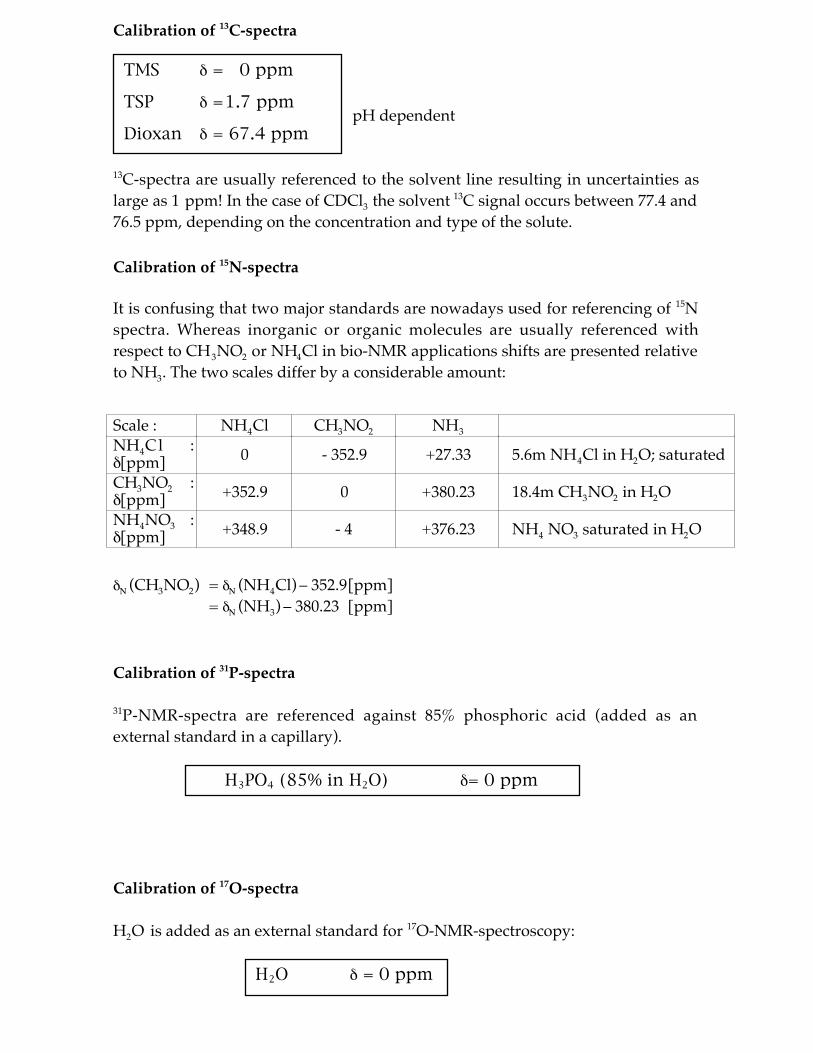
Calibration of 13C-spectra
pH dependent
13C-spectra are usually referenced to the solvent line resulting in uncertainties aslarge as 1 ppm! In the case of CDCl3 the solvent 13C signal occurs between 77.4 and76.5 ppm, depending on the concentration and type of the solute.
Calibration of 15N-spectra
It is confusing that two major standards are nowadays used for referencing of 15Nspectra. Whereas inorganic or organic molecules are usually referenced withrespect to CH3NO2 or NH4Cl in bio-NMR applications shifts are presented relativeto NH3. The two scales differ by a considerable amount:
Scale : NH4Cl CH3NO2 NH3
NH4Cl :[ppm]
0 - 352.9 +27.33 5.6m NH4Cl in H2O; saturated
CH3NO2 :[ppm]
+352.9 0 +380.23 18.4m CH3NO2 in H2O
NH4NO3 :[ppm]
+348.9 - 4 +376.23 NH4 NO3 saturated in H2O
(CH3NO2) = (NH4Cl) – 352.9[ppm]
= (NH3) – 380.23 [ppm]
Calibration of 31P-spectra
31P-NMR-spectra are referenced against 85% phosphoric acid (added as anexternal standard in a capillary).
Calibration of 17O-spectra
H2O is added as an external standard for 17O-NMR-spectroscopy:
TMS = 0 ppm
TSP =1.7 ppm
Dioxan = 67.4 ppm
H2O = 0 ppm
H3PO4 (85% in H2O) = 0 ppm

Be careful: Sometimes CH3NO2- or (CH3)2CO is used for referencing! The resultingscales are very different:
17O (H2O) = 17O (CH3NO2) + 605 [ppm]
= 17O ((CH3)2CO) + 569 [ppm]
Calibration of 19F-spectra
Mostly CFCl3 is used as an external standard in 19F NMR spectroscopy:
Unfortunately 19F chemical shifts are highlysolvent dependent and hence the exactconditions of measurement must be presented!
Fig. 19F NMR spectrum of CFCl3 in CDCl3.
The fine structure of the 19F-signal of CFCl3 isdue to the different isotopes of chlorine: 35Cland 37Cl.For referencing F of CF35Cl2
37Cl is set to 0 ppm.
Another, less frequently used standard is C6F6.
Calibration of 29Si-spectra
For 29Si NMR TMS is used as an internal standard:
In case the 29Si resonance of TMS overlaps with signals from the compound ofinterest a spectrum is measured without standard, after which one drop of TMS isadded and another spectrum is taken.
CFCl3 = 0 ppm
TMS = 0
−0.010.01 0.00 ppm
−0.013
−0.006
0.000
0.006

Referencing without standard (indirect calibration)
Some nuclei are so insensitive that internal standards yield insufficient signal-to-noise. In these cases the chemical shift scale of the heteronucleus may becomputed from the proton scale using the following formula:
X denotes the tabulated standard values of resonance frequencies ofX-nuclei. Therein H is 100 MHz, X
0 the frequency of 0 ppm for the Xnucleus and H
0 the frequency of 0 ppm 1H.
The ratio of frequencies depends on the nature of the used proton standard:
13C 15N (rel. to NH3)
TMS 0.25145002 0.10132914DSS 0.25144952 0.10132905TSP 0.25144954 0.10132900
Fig: Taken from J.Cavanagh et al., Protein NMR Spectroscopy
Indirect referencing is more precise than the use of external standards!
Closing remarks:
The following rules should be obeyed when publishing chemical shifts:
- Don’t define your own standards or own rules, because comparing your datato those taken by others will be difficult (or impossible).
- Always note which signal has been used for referencing.- When using indirect referencing exactly report how this was achieved.- Always add: Temperature, pH- (for measurements in water), concentration,
referencing mode….
Xo= H
o X
H

1
Terpenes
Natural products which are produced biosynthetically from „activated isoprene“
(isopentenylpdiphosphate or dimethylallyldiphosphate, see Fig. 1) are called terpenes.
OPP
1
2
3
4
5
OPP
1
2
3
4
5
isopentenyldiphosphate dimethylallyldiphosphate
Two or more of these isoprene units are coupled to each other in a head-to-tail fashion
resulting in molecules whose number of carbons can be divided by 5. Upon coupling
the double bond is shifted from position 3,4 to 2,3.
OPP
1
2
3
4
5
OPP
1
2
3
4
5H
CH2OPP
geranyldiphosphate
However, secondary modifications, occurring during ring-closures for example, may
decrease the number of carbon atoms. Other modifications such as methylation may
also increase the number of carbon atoms.
Terpenes are classified according to:
monoterpenes = C1 0 skeleton
sesquiterpenes = C1 5 skeleton (very abundant)
diterpene = C2 0 skeleton (total number large, but may be rare in certain plants)
sesterterpenes = C2 5 skeleton (very rare)
triterpenes = C3 0 skeleton ((very)abundant)
steroids = C2 7 skeleton (some of them ubiquitous, others rare)
2
tetraterpenes= C4 0 skeleton
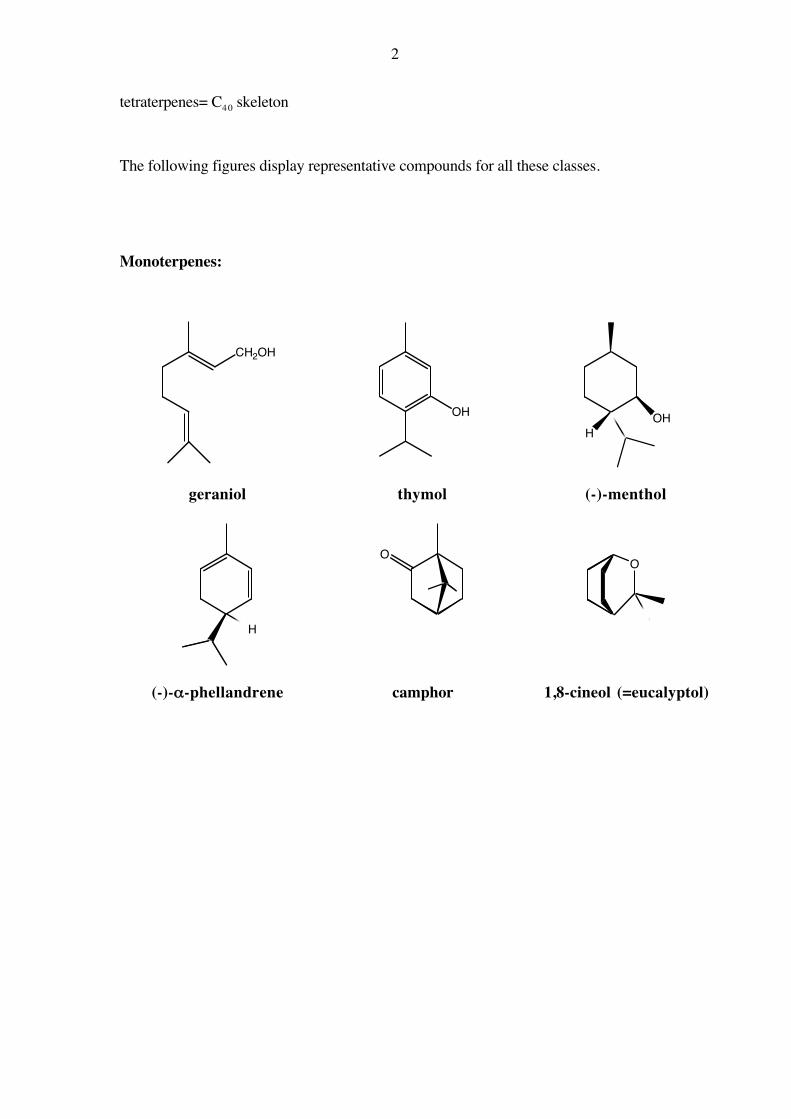
The following figures display representative compounds for all these classes.
Monoterpenes:
CH2OH
OHH
OH
geraniol thymol (-)-menthol
H
OO
(-)-α-phellandrene camphor 1,8-cineol (=eucalyptol)

3
Sesquiterpenes:
Up to 70 different subclasses of sequiterpenes are known today. Sesquiterpenes are
encountered in form of their open-chain and cyclic compounds. They are often
derivatized by oxidation involving one or more carbon atoms resulting in the
corresponding alcohols, ketons, aldehydes, carbonic acids and lactones.
germacrane caryophyllane bisabolane
eudesmane cadinane guajane

4
Diterpenes:
The majority of diterpenes is bi- or tricyclic, but open-chain as well as tetracyclic
compounds are also known. Similarly to the sesquiterpenes, oxidation reactions result in
various carbonyl derivatives.
H
1
35 7
9
1113
15
16
1720
19 18
H
1819
20
17
12
15
16
3
1
105
labdan clerodan
H
1
35 7
9
11 13
16
19 18
20H
14
15
17
H
H
1
35 7
9
11 13
19 18
20H
14
15
16
H
17
abietan kauran

5
Triterpenes:
Triterpenes are structurally rather diverse. Steroids belong to this class of terpenes, and
theses have been described in great detail before.
H
H
H 20
3
17
6
241
dammaran-type
H
H
1
3 5
9
10H
1417
18
1920
H
H
1
3 5
9
10H
1417
18
1920
24 23
27
29
30
oleanan-type (most abundant) ursan-type

6
H
H H
1
3 5
9
10
1417
18
1920
H
H
H
18
192029
30
21
22
friedelan-type lupan-type
Due to the immense structural diversity of terpenes it is difficult to describe a generally
valid route for their unambiguous identification. Some hints, nevertheless, are given here:
1.) Terpenes are usually found in the lipophilic extract (dichloromethane, ethyl
acetate). This is not true for glycosides or other highly functionalized molecules.
2.) The carbon and proton spectra are dominated by many signals from CH, CH2
and CH3 groups, which occasionally leads to spectra highly crowded between
0.9 and 2.0 ppm.
3.) Signals due to methyl groups are dispersed over the range from (~0.7 to 2.0
ppm)
Successful identification of terpenes requires the use of 2D NMR experiments. Due to
the small signal dispersion, carbon editing (HSQC, HMBC) is very useful. For the same
reason an HSQC-TOCSY is preferable to the COSY experiment.

NMR of carbohydrates 1
Saccharides
General remarks:
This introduction is very brief. For an excellent and more detailed description of the topic see for
example: T. Lindhorst: Essentials of carbohydrate chemistry and biochemistry, 2nd edition, Wiley
2004.
Carbohydrates are polyhydroxycarbonyl compounds with the general formula: Cn(H2O)n. According
to whether only a single, a few or many monomeric units are linked, the resulting molecules are
called mono-, oligo- or polysaccharides. Most naturally occurring sugars are optically active.
Monosaccharides are further classified according to the number of carbon atoms into trioses (3C),
tetroses (4), pentoses (5C) and hexoses (6C). Naturally occurring monosccharides are usually
pentoses [C(H2O)]5 or hexoses [C(H2O)]6.
Monosaccharides preferably exist as cyclic hemiactelas or hemiketals. The most-simple precursors
are 2,3-dihydroxypropanal (glycerinaldehyde) and 1,3-dihydroxypropanon. Sugars derived from the
aldehyde are referred to as aldoses and those derived from the ketone as ketoses. Forming the
intramolecular hemiacetals or hemiketals usually yields five-membered (furanoses) or six-
membered rings (pyranoses).
OC
OH
H
OH
OH
H
H
OH
CH2OH
HOH
O
OH
H
H
OH
CH2OH
H
OH
H
H
O
H
O
H
OH
CH2OH
H
H
OH
OH
H
H
OH
neues Ciralitäts-zentrum
neues Ciralitäts-zentrum
D-(-)-Glucose
D-(+)-Glucofuranoseweniger stabil
D-(+)-Glucopyranosestabiler
Examples for pentoses: Arabinose, Xylose, Ribose Examples for hexoses: Glucose, Mannose, Fructose, Sorbose

NMR of carbohydrates 2 Aldoses:
H
C
C
C
C
CH2OH
O
OH
OH
OH
H
C
C
C
C
CH2OH
O
OH
OH
OH
H
C
C
C
C
CH2OH
O
OH
OH
OH
H
C
C
C
C
C
O
OH
OH
OH
CH2OH
OHOH
OH
OOH
OH
CH2OH
C-1, neues Chiralitätszentrum,anomeres C-Atom
Arabinose Xylose Ribose Glucose !-D-Glucopyranose
Ketoses:
CH2OH
C
C
C
CH2OH
O
OH
OH
CH2OH
C
C
C
C
CH2OH
O
OH
OH
OH OH
OH
OH
H
OOH
CH2OH
C-1, anomeres C-Atom
Xylulose Fructose !-D-Fructopyranose
A new stereocenter is created while the hemiacetal / hemiketal ring closure occurs, leading to the formation of two possible diastereoisomers. The molecule with S-configuration at C-1 is called the α -form, the one with R-configuration is called the β-form. It is actually easier to remember the definition when drawing the molecule in the chair (4C1)-conformation (C4- corner pointing up, C-1 corner pointing down):
OH
OH
OOH
OH
CH2OH
1
4OH
CH2OH
OH
OOH
OH1
4
!-D-Glucose (1C4) !-D-Glucose (4C1) "-D-Glucose (4C1)
O
OH
OOHH
OH
CH2OH
H
1
4
OH
OOH
OHOH
CH2OH
1
4
In the α -form the hydroxl-group is placed axial and in the β-form it is placed equatorial. The two diasteromers derived from different configuration at C-1 are also called anomers, and carbon-1 is referred to as the anomeric carbon. Conformations of pyranoses and furanoses
The tetrahydropyran six-membered ring represents a cyclohexane-type skeleton, which usually has a chair-like conformation. The lowest-energy conformation corresponds to the one in which the most bulky substituents are positioned equatorially. The situation is much less clear for furanoses. Furanose stereochemistry is of great importance in nucleic acid chemistry and biology. Five-membered rings can adopt conformations in which all

NMR of carbohydrates 3 atoms are in one plane, but unfavorable 1,2 ecliptic interactions are usually avoided by folding up one corner to adopt an envelope-like conformation (ring pucker). In contrast to the situation encountered in six-membered rings, the so-called twist conformation is also reasonably low in energy. It is therefore very difficult to predict conformations of five-membered rings. Any assumptions about which NOEs should be and which should not be observable have therefore to be made with much care. Structural data derived from crystallography may help to predict conformations. If no such information is available, optimization of energy by molecular mechanics programs may help, but these methods tend not to be sufficiently precise.
E2
3T2
O
1
23
4
O H
O
O
H
OH
H
H
C(CH3)2
H
OHHOH
2C
1
2
3
4
OH
OH
HOH
H
H
HOH2C
OMe1
23
4 OTetrahydro-
furan
OTetrahydro-
pyran
OO O
chair boat twisted boat
O1
2
3
4
E-2 denotes that carbon 2 is placed at the corner, which is bent out of the plane formed by the
remaining four atoms. Similarly, 3T2 indicates that in the twisted form C-3 is pointing up and C-2 is
pointing down with respect to the plane of the remaining three atoms. Which atom is displaced from
the plane is difficult to predict and depends on the nature of all substituents. Therefore great care is
required when predicting the ring pucker.
Mutarotation:
Stereochemical analysis is complicated by the fact that in solution α- and β-pyranoses interconvert via the open-chain form (base- and acid-catalysis).
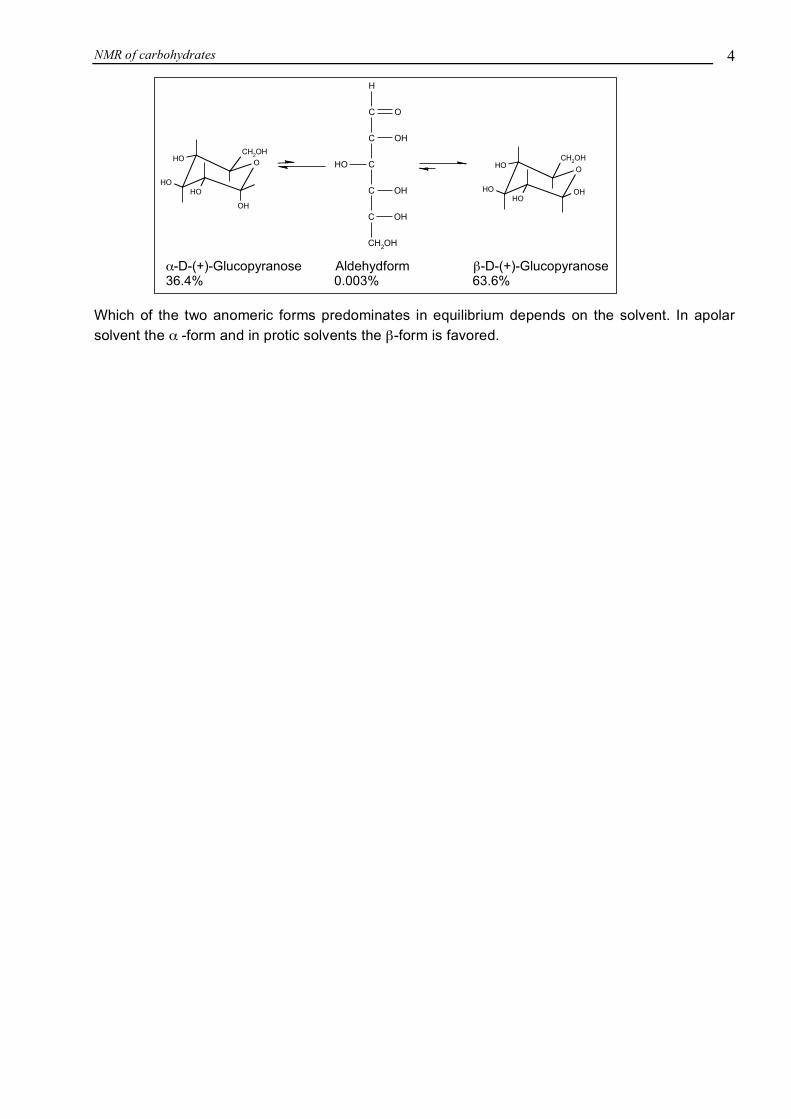
NMR of carbohydrates 4 Which of the two anomeric forms predominates in equilibrium depends on the solvent. In apolar solvent the α -form and in protic solvents the β-form is favored.
OH
OH
OOH
OH
CH2OH
OH
OOH
OHOH
CH2OH
H
C
C
C
C
C
O
OH
OH
OH
CH2OH
OH
!-D-(+)-Glucopyranose Aldehydform "-D-(+)-Glucopyranose36.4% 0.003% 63.6%

NMR of carbohydrates 5 Oligo- und Polysaccharides Oligosaccharides consist of 2 to 6 monosaccharide units, whereas polysaccharides contain more than 6 units. Upon forming the glycosidic bond two monomeric units are linked by forming the mixed acetal. Therein, the glycosidic bond is chemically more inert and mutarotation is no longer possible. examples: Disaccharides (C12H22O11) : Saccharose, Maltose, Lactose, ... Trisaccharides (C18H32O16) : Raffinose
O
OH
OOH
OH
CH2OH
O
CH2OH
OH
OH
CH2OH
!-D-Glucopyranose "-D-Frucofuranose Saccharose
O
OH
OOH
OH
CH2OH
OH
O
OHOH
CH2OH
D-Glucose D-Glucose
Maltose ("-Form)
O
OH
OCH
2OH
OHO
OHOH
CH2OHOH OH
D-Galactose D-Glucose
Lactose (!-Form)
O
CH2OH
OH
OH
CH2OH
O
O
OHOH
CH2OH
OH
O
OH
O
OHOH
CH2
Raffinose
D-Galactose D-Glucose D-Fructose

NMR of carbohydrates 6 Polysaccharides: e.g. Cellulose
OH
OO
OOH
CH2OH
OH
OO
OH
CH2OH
OH
O
O
OH
CH2OH
Amylopectin:
O
.OH
OO
OH
CH2OH
O
O
OH
O
OH
CH2
O
.OH
OO
OH
CH2OH
OH
O
OH
CH2OH
Verzweigungspunkt

NMR of carbohydrates 7 Amylose:
O
O
OH
O
OH
CH2OH
O
.OH
OO
OH
CH2OH
OH
O
OH
CH2OH
C-1, !
C-4
Maltoseeinheit
Aminodeoxycarbohydrates
Often, hydroxyl groups are replaced by amino groups. If the nitrogen is bound to the anomeric carbon they are called glycosamines, otherwise they are called aminodeoxysugars.
OH
OOH
OHNH
2
CH2OH
OH
OOH
NH2
OH
CH2OH
!-D-Glucosamin oder2-Amino-2-desoxy-D-glucopyranose
!-D-Glucopyranosamin
Deoxycarbohydrates In deoxycarbohydrates one (or more) hydroxyl groups are replaced by hydrogens. A famous example is the deoxy-D-ribofuranose, which forms an important part of DNA.
OH
OH
O
OH
CH3
OH
!-D-Rhamnose
O
OH
OH
CH2OH
2-Desoxy-D-ribofuranose

NMR of carbohydrates 8 NMR-spectroscopy of carbohydrates The most useful 2D NMR experiments are listed here:
DQF-COSY: Helps to establish neighboring connectivities in the sugar rings via 1H,1H –
scalar couplings. From the appearance of cross peaks, the magnitude of the scalar coupling and thereby the relative stereochemistry can be deduced.
TOCSY: Determination of the monosaccharide spin-systems. The experiment is
especially useful for oligosaccharides, because it allows assignment of protons to the different monosaccharide units. Signal dispersion is usually best in the the anomeric proton region.
HSQC: Delivers 13C information about the attached carbons. Is very useful to identify
anomeric protons/carbons, and to distinguish CH from CH2 moieties. HMBC: One of the two experiments for establishing the linkage between
monosaccharide units via the glycosidic bond. Sometimes, the corresponding dihedral angle is close to 90°, and therefore the corresponding cross peaks may be missing.
OH
OH
O
OH
CH2OH
O
.OH
OOH
OH
CH2OH
C-1
C-4*
H- 1
H- 4*
HSQC-TOCSY: This experiment is extremely useful, because chemical shifts of sugar ring protons are very similar, and cross peaks required for establishing neighboring connectivities may be close to the diagonal in the COSY. The better dispersion in the carbon spectrum is a great help in alleviating these problems. An HSQC is also required to distinguish one-bond from two- and three-bond correlations. Unfortunately, larger amounts of substance are required.
NOESY/ROESY: Experiments to establish stereochemistry and the location of the glycosidic linkage. In our experience the ROESY/NOESY are much less useful for establishing relative stereochemistry when compared to other classes of compounds, especially in the case of pyranoses. Part of the problem is that the ring conformation may not be known exactly. Never ever establish stereochemistry based upon observation of NOE between protons attached to neighboring carbons, only use 1,3 (diaxial) NOEs!
OH
H
OH
O
OH
CH2OH
H
O
OH
OCH
2OH
OH
OH
NOE

NMR of carbohydrates 9 Useful NOEs to identify carbohydrate units: Once again: 1.2 NOEs will usually always be observable, because these distances tend to be smaller than 4 Å in any case. It may also be that the ring conformation significantly deviates from the standard chair/envelope forms, so that the distances may not be so different between the cis-and trans-proton.

NMR of carbohydrates 10 Typical ranges for 1H- and 13C-chemical shifts of “standard” carbohydrates:
1H : anomeric protons 4.3 - 5.8 ppm ring protons 3.0 - 4.5 ppm
13C : anomeric carbons 90 - 112 ppm
hexoses: δ C1 > 90ppm aldose (pyranose) δ C2 > 90ppm ketose (furanose)
ring carbons 70 - 80 ppm
aldose: a single CH2 in the range 60 - 70 ppm ketose: two CH2 in the range 60 - 70 ppm
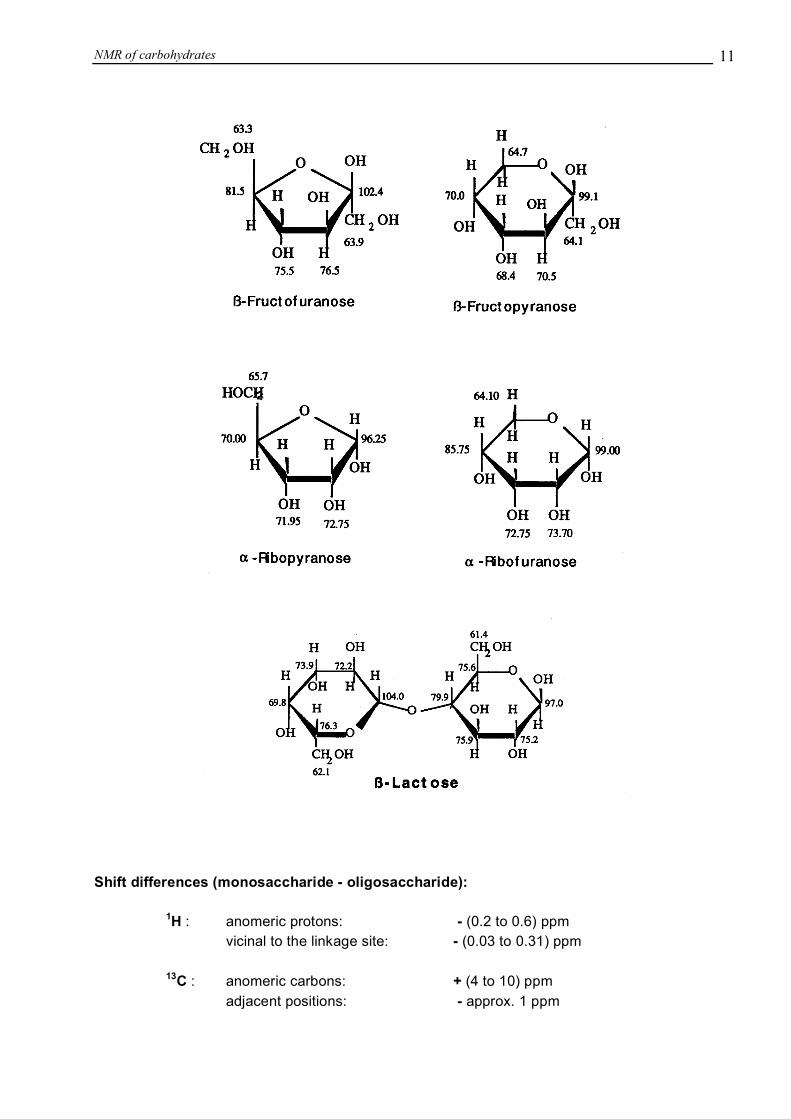
NMR of carbohydrates 11 Shift differences (monosaccharide - oligosaccharide):
1H : anomeric protons: - (0.2 to 0.6) ppm vicinal to the linkage site: - (0.03 to 0.31) ppm 13C : anomeric carbons: + (4 to 10) ppm adjacent positions: - approx. 1 ppm

NMR of carbohydrates 12 Typical values for 3J(1H,1H)- und 1J-(13C,1H)- scalar coupling constants in carbohydrates: 3JH,H : Hax,Hax : 7 - 9 Hz for ∠ H-C-C-H approx. 180°
Heq,Hax : 2 - 4 Hz for ∠ H-C-C-H approx. 60° Heq,Heq : 2 - 4 Hz for ∠ H-C-C-H approx. 60°
1JC,H : 160 - 170 Hz for anomeric carbons 1JC,H : 145 Hz for all other carbons
Identification of hydroxyl protons in 1D spectra: H/D-exchange: If the sample is dissolved in D2O or d4-methanol the signals due to hydroxyl
protons will disappear. Although some stereochemical information seems to be lost by this at first glance, complementary information can be obtained from the carbon-bound protons. Spectra are significantly less complicated in fully-deuterated protic solvents (due to the absence of hydroxl protons), and cross peak patterns in the COSY are also much simplified, which helps a lot in the stereochemical analysis. When recording spectra in DMSO, addition of one drop of deuterated water causes the hydroxyl resonances to disappear. Hydroxyl protons may also be identified by comparing spectra recorded with and without water suppression, because saturation transfer will lead to signal attenuation in the presaturation experiment.
temperature: Increasing the temperature leads to broadening of the hydroxyl resonances (due to accelerated exchange). Usually, the carbon-bound protons sharpen up when the temperature is increased.
ROESY/NOESY: Observation of exchange peaks between hydroxyl protons and the water
signal for spectra recorded in 90%H2O/D2O. Such water exchange-mediated peaks may also be found between hydroxyl protons in the TOCSY spectra.
Identification of stereochemistry at the anomeric center:
α -form β-form
proton chemical shift (H-1) 4.8 - 5.8 ppm 4.3 - 4.8 ppm carbon chemical shift (C-1) 98 - 103 ppm 103 - 106 ppm scalar coupling constants (3J(H-1,H-2)) 1 - 4 Hz 6 - 8 Hz 1JC-1,H-1 coupling constants 170 Hz 160 Hz

NMR of carbohydrates 13 13C-atoms bearing hydroxyl groups can be identified from H/D-isotope shifts in 13C-spectra In order to measure the isotope shift, a spectrum of the sugar in a non-protic solvent (e.g. DMSO) is recorded. After addition of a drop of D2O the spectrum is re-measured and the isotope shift calculated according to: In general, large isotope shifts are observed for those carbons which have hydroxyl groups directly attached. This method requires the exchange with the water protons to be slow, because the lifetime of the deuterium is very short otherwise (and hence the magnitude of the isotope shift is small)!
Δ (ppm) = δ 13C(DMSO) - δ 13C(DMSO+D2O)

NMR of carbohydrates 14 Strategy for structure determination of carbohydrates
Determine the number of monosaccharide units
1. Count the number of signals in the 13C NMR spectrum. Determine the number of CH2-groups in the range between 60 - 70 ppm.
2. Determine the number of anomeric protons and carbons (90-110 ppm) using 1H-, 13C-, DEPT90- und HSQC-spectra.
3. Correlate protons signals to their directly attached carbon resonances by using the HSQC spectrum.
4. Determine the number and type of spin systems from the TOCSY. In particular, traces along the positions of the anomeric protons (in which the proton spectra are best resolved) are very helpful. For larger carbohydrates the HSQC-TOCSY is an enormously helpful experiment to resolve possible overlap by exploiting dispersion of the carbon frequencies.
Determine the relative configuration
Assign hydroxyl groups to axial or equatorial positions. This may be done by using information from the scalar couplings, which may be read out of the COSY spectrum. Alternatively, 1,3 NOEs (diaxial correlations) may be used. Determine the glycosidic linkage sites This can be done from NOEs/ROEs or from correlations in the long-range proton carbon correlation experiment (HMBC). Tip: It has already been mentioned that recording spectra in fully deuterated, protic solvents leads to rapid exchange of all hydroxyl protons by deuterium. This leads to a remarkable simplification of the spectra. Since stereochemical information derived from hydroxyl protons and the corresponding carbon-bound protons is complementary, the loss of information content is small and is easily compensated by the fact that the spectra are much easier to interpret. In addition, cross peaks pattern in the DQF-COSY are simplified, so that stereochemistry can be read off much more easily. Determining relative stereochemistry of the hydroxyl groups from COSY cross peaks:
COSY cross peaks display both active (anti-phase) and passive (in-phase) couplings. 1,2 diaxial protons will display large couplings, whereas axial-equatorial or equatorial-equatorial couplings are small. How this can be exploited in monosaccharide units is shown in the following figure: Quite often it is sufficient to recognize whether the couplings are large or small. An instructive example is given for the cross peaks C3(F2)-C2(F1) of β-mannose. In F2, the in-phase coupling is large, whereas the anti-phase coupling is small. Thereby it is clear that protons at C-3 and C4 must both be axial (because the passive coupling is large). The proton at C2 must be equatorial, because the active coupling is small. If both the passive and the active couplings are large and similar, certain multiplet components cancel each other (e.g. as seen in β-glucose). The advantage of reading out scalar couplings from the COSY is that this method can still be used when signal overlap in the 1D spectrum prevents extraction of the coupling constants.

NMR of carbohydrates 15

1
Peptide/Protein NMR
Peptides
Peptides are macromolecules which are built up of amino acids, connected through the formation of a
peptide bond. In nature all peptides exists in the L-configuration (at least in eukaryotes).
The amide bond is almost exclusively found in the trans configuration, although for Xxx-Pro the bond
may exist in the cis configuration to a considerable extent. Therefore, short, Pro-containing peptides often
display a (minor) second set of signals due to the cis conformer.
Shorter, non-cyclic peptides are rarely structured and hence are described as random coils. Longer pep-
tides are mostly (but not always!) structured. Their secondary structure is classified according to the di-
hedral angles, which are defined as follows:
Cαααα
R
NCO H
ω
ψ
φ
χ
α α
α
α
α β γ
i i i i i
i i i i i
i i i i i
i i i i i
for C C cis to N C
for C N trans to C O
for C C trans to N H
for C N cis to C O
= − −
= − −
= − −
= − −
+ +0
0
0
0
1 1
1
©
©
©

2
Peptide/Protein NMR
Secondary structures:
The three major classes of secondary structure are as follows:
•
the
α
-helix
•
the parallel
β
-sheet
•
the antiparallel
β
-sheet
Left: Schematic Drawing of the α-helix. Middle: Backbone presentation with direction of dipole moment. Right: Structure of the 434 repressor.

3
Peptide/Protein NMR
The corresponding values for the dihedral angles
φ
and
ψ
are.
Turns are often found at the protein surface.
β
-Turns possess H-bonds between the carbonyl-O (i) and
the NH (i+3)) and
γ
-turns (tight turns) are characterized by H-bonds between the carbonyl-O (i) and the
NH (i+2)). Secondary structural elements have characteristic, short distances for certain proton pairs,
which help to identify them by NMR. However, before this short distances can be identified, all resonanc-
es need to be completely assigned.
M
EASUREMENT
OF
SPECTRA
Structure calculation of proteins is based on the Nuclear Overhauser Effect (NOEs) between protons. In
order to assign the NOE to specific resonances, all non-labile protons must be assigned to their sequence-
specific position (sequence-specific sequential resonance assignment). Due to the large number of pro-
tons per residue (3-13) and the resulting resonance overlap, even smaller peptides cannot be assigned
from 1D spectra but require the use of two or three dimensional correlation spectra. The following figure
indicates the positions of the protons in the 1D spectrum of ubiquitin:
φ ψ ω
residues/turn
extension of the chain/
residue (Å)
antiparallel
β
-sheet
-139° 135° -178° 2.0 3.4
parallel
β
-sheet -119° 113° 180° 2.0 3.2
α
-helix -57° -47° 180° 3.6 1.5
3
10
-helix -49° -26° 180° 3.0 2.0
π
-helix -57° -70° 180° 4.4 1.15
PolyprolineI -83° 158° 0° 3.3 1.9
PolyprolineII -78° 149° 180° 3.0 3.12
PolyprolineIII -80° 150° 180° 3.0 3.1
Proton spectrum of ubiquitin (taken from Cavanagh et al., Protein NMR spectroscopy)

4
Peptide/Protein NMR
For resonance assignments of small (non-labelled) peptides, a set of three different spectra is usually re-
corded: a COSY, a TOCSY and the NOESY.
A short remark: Spectra are usually recorded in 90% H
2
O, 10% D
2
O. The very strong water signal must
be suppressed in the experiment and the residual water usually appears in the middle of the spectrum. In
2D spectra the residual water signal is manifested as a band of noise in the center of the spectrum. It may
obscure peaks close to the water resonance (such as the H
α
protons).
In order to prevent loss of signals of amide protons from exchange with solvent deuterons, hydrophilic
peptides are usually measured in 90% H
2
0/D
2
O. Backbone-NH exchange is slowest at approx. pH 3.0,
but for reasons of stability (amide bonds may be hydrolyzed in acidic solutions), the chosen pH is gener-
ally between 4 and 5. (Fig. 1) It is important to note that the N terminus contains a free amine group. Ex-
change of amine protons is very fast, and the free N terminus will therefore
never
be observable. In the
case of globular (folded) proteins, amide protons are usually part of hydrogen bonds and therefore ex-
change much more slowly, so that neutral or even basic values of the pH may be chosen. Similar argu-
ments apply for solvent-shielded protons (those in the core).
Concentrations used for NMR are high (0.5 to 2mM) and often lead to aggregation. Aggregation effects
can often (but not always!) be reduced by proper choice of buffer and salt (see the Hofmeister series).
Sometimes, small additions of organic solvents or detergents (CHAPS) may improve the spectra remark-
ably.
[
1
H,
1
H]-COSY:[
1
H,
1
H]-
Co
rrelated
S
pectroscop
y
The COSY displays [
1
H,
1
H]-correlations due to scalar (through-bond) couplings. Efficiency of the coher-
ence transfer decreases greatly with increasing linewidth (which is related to the molecular weight). The
COSY experiment is therefore almost exclusively used for smaller (non-labelled) peptides.
Positions of cross peaks in the COSY are characteristic for the amino acids and can be classified according
to the following rules (see the following figure for their position in the spectra):
Logarithmic presentation of the intrinsic exchange rates vs. pH for solvent accessible, labile protons in aqueous solution at 25°C (taken from Wüthrich’s book).

5
Peptide/Protein NMR
•
all non-labile, non-aromatic sidechain protons except those from
β
H -
γ
CH
3
of Thr,
δ
H-
δ
H of Pro and
β
H-
β
H of Ser.
•
α
H-
β
CH
3
of Ala and
β
H-
γ
CH
3
of Thr.
•
α
H-
β
H of Val, Ile, Leu, Glu, Gln, Met, Pro, Arg, and Lys.
•
α
H-
β
H of Cys, Asp, Asn, Phe, Tyr, His and Trp.
•
α
H-
α
H of Gly,
α
H-
β
H of Thr,
δ
H-
δ
H of Pro,
α
H-
β
H and
β
H-
β
H of Ser.
.
•
aromatic ring protons, including 2H-4H of His, as well as sidechain protons from Asn and Gln.
•
backbone NH-
α
H.
•
δ
CH
2
-
ε
NH of Arg.
The region comprising the NH-
α
H-Region (g) (in spectra recorded in 90%H
2
O/10%D
2
O, in D
2
O back-
bone NH-protons exchange with solvent D) is called the
fingerprint
-region. Spectral resolution and ap-
pearance in this region serves as an indicator whether the peptide/protein can be successfully investigated
by NMR. For each amino acid (expect Pro) a single peak is observed in this region. The N-terminal amino
proton cannot be observed due to very rapid exchange with the solvent.
Scalar couplings can only be observed between protons separated by not more than 3 bonds. Moreover,
the protons need to have a different resonance frequency. However, signal overlap, exchange broadening,
[
1
H,
1
H]-COSY of Neuropeptide Y (NPY)

6
Peptide/Protein NMR
and small values of the J
NH-
α
Η
-coupling constants (which in stable
α
-Helices is < 4 Hz), resulting from
dihedral angles close to 90°, may lead to less than the expected number of signals being observed.
[
1
H,
1
H]-TOCSY:
To
tal
Correlation Spectroscopy
A TOCSY experiment contains all cross peaks due to protons of the same spin system. Protons from dif-
ferent amino acids always belong to different spin systems, because there is no scalar coupling across the
amide bond. Some amino acids consist of a single spinsystem (Ile), some contain two (e.g. Phe) or three
(e.g. Trp):
Analysis of spin systems allows us to decide to which type of amino acids the spin system belongs. Pos-
sible criteria are: Occurrence or absence of methyl groups, length of the spin system, positions of chem-
ical shifts in the spin system. Although the exact amino acid can rarely be derived many amino acids can
be excluded by such an analysis. The mixing time (a parameter that can be varied during setup of the ex-
periment) determines whether neighboring correlations (e.g. for a 12ms TOCSY, which displays infor-
mation similar to a COSY) or long-range correlations (e.g. for a 80ms TOCSY) are detected. Such an
analysis is conducted in a region of the spectrum which displays the smallest overlap. This part is usually
the region containing the amide protons. Possible overlap may be overcome by recording a second set of
spectra at a slightly different temperature.
The following figure shows the difference between a COSY and a 80ms TOCSY. Whereas only a single
correlation from each amide proton is found in the COSY, many of them occur in the TOCSY:
Spinsystems of Tyr (J) and Arg(X) in the TOCSY

7
Peptide/Protein NMR
.
Comparison of the regions containing the amide protons (F2) and aliphatic protons (F1) for a COSY (AC) or TOCSY (B,D).

8
Peptide/Protein NMR
[1H,1H]-NOESY: Nuclear Overhauser Effect Spectroscopy
Cross peaks in the NOESY are due to dipolar couplings resulting from interactions of spins via space and
hence depend only on the distance rather than on the number of intervening bonds:
Similarly to the situation encountered in TOCSY/COSY spectra peaks may be classified according to the
region of the spectrum in which they are found:
a. NH; aromatic - NH; aromatic-aromatic.
b. NH; aromatic - αH; δH of Pro; βH of Ser and Thr.
c. NH; aromatic - aliphatic sidechains.
d. αH; δH of Pro; βH of Ser and Thr - αH; δH of Pro; βH of Ser and Thr.
e. αH; δH of Pro; βH of Ser and Thr - aliphatic sidechains.
f. Aliphatic sidechains - aliphatic sidechains.
The NOESY not only contains peaks from which distances are derived for the structure calculation but is
also used to great extent during the sequential resonance assignment process. Considering that scalar cou-
plings are restricted to protons within a single amino acid, sequential correlations (correlations between
protons of neighboring amino acids) need to be taken from the NOESY.
D r 6–≈
[1H,1H]-NOESY of ProteinD (phage envelope protein)

9
Peptide/Protein NMR
STRATEGIES FOR RESONANCE ASSIGNMENT OF SMALL NON-LABELLED PEPTIDES
Optimizing spectral quality
The spectral quality can be rated by inspection of the fingerprint region (number of peaks should roughly
match the number of non-proline residues). If more than 10% of peaks are missing, the conditions should
be varied (temperature, pH, salt etc.) in order to remove peak overlap or aggregation.
In the first step peaks must be referenced correctly. In protein NMR the water signal (usually in the center
of the spectrum) is used, whose frequency depends on the temperature according to (T in [K]):
Sometimes it is advisable to record a second set of spectra at a slightly different temperature to remove
peak overlap.
Spinsystem-Identification: NH-αΗ−βΗ−...
In a first step the spin systems are classified. This is best done in the TOCSY, selecting the amide proton
region (approx. 6.5-12 ppm) in F2 and the aliphatic region (0-5 ppm) in F1. Spin systems will line up
vertically in that region, and the number and position of peaks give valuable information.Useful criteria
are
• the length of the spin systems (number of peaks)there are short spin systems (type J, e.g. Ser), long spinsystems (e.g. Lys)
• pattern of peak positions are characteristic (see appendix)
Some amino acids can be identified based on the chemical shifts rather easily:
• Ser: β−protons low-field (> 4ppm), no methyl group
• Thr: β−protons low-field (> 4ppm), methyl group around 1.2 ppm
• Ala: no β-protons, but methyl group around 1.3 ppm
Gly is the only amino acid that shows up as a triplet for the amide proton (coupling to two α-
protons!), Pro has no amide proton, but displays a characteristic pattern in the aliphatic region of the
TOCSY. Ala, Thr, Val, Leu and Ile are methyl-group containing amino acids and can be distinguished
from each other based on their COSY connectivities. Short spin systems (only NH, α- and β-
protons) are from Ser or Cys, Asp, Asn, Phe, His, Trp and Tyr (so called type J-spin systems). The
following table contains the random-coil chemical shifts, measured in unstructured small peptides.
The values rather serve as an indication for approx. values. In structured proteins deviations can be
substantial!
H2O( )δ 7 83, T96 9,------------ppm–=

10
Peptide/Protein NMR
The long spin systems like Lys, Arg, Met, Gln, Glu and Pro all contain two γ-protons, coupled to the β−
protons. Usually, the β-protons are observed at frequencies higher than 2.2 ppm and were therefore called
type U (upfield) spin systems. Met, Gln and Glu have their γH-frequencies lower than those of the β-pro-
tons whereas they are higher for Arg, Lys, Pro and Leu.
Characteristic patterns for cross peaks, found in COSY or TOCSY spectra are summarized in the appen-
dix.
Sequence-specific assignment
Sequential resonance assignment means connecting spin systems in their sequential order. Considering
the fact that scalar couplings will never occur between protons of different amino acids it is clear that
NOEs must be used for this purpose. Since NOEs may be found between all protons close in space, their
use introduces some ambiguity. For sequential correlations a set of peaks are usually used, largely de-
Random coil chemical shifts for dipeptides (following Ala residues)
residue NH Hα Hβ other
Ala 8.24 4.32 1.39
Cys(red) 8.32 4.55 2.93, 2.93
Cys(ox) 8.43 4.71 3.25, 2.99
Asp 8.34 4.64 2.72, 2.65
Glu 8.42 4.35 2.06, 1.96 γCH2 2.31, 2.31
Phe 8.30 4.62 3.14, 3.04 2,6H 7.28; 3,5H 7.38; 4H 7.32
Gly 8.33 3.96
His 8.42 4.73 3.29, 3.16 2H 8.58; 4H 7.29
Ile 8.00 4.17 1.87 γCH2 1.45, 1.16; γCH3 0.91; δCH3 0.86
Lys 8.29 4.32 1.84, 1.75 γCH2 1.44, 1.44; δCH2 1.68, 1.68;
εCH2 2.99, 2.99; εNH3+ 7.81
Leu 8.16 4.34 1.62, 1.62 γCH 1.59; δCH3 0.92, 0.87
Met 8.28 4.48 2.11, 2.01 γCH2 2.60, 2.54; εCH3 2.10
Asn 8.40 4.74 2.83, 2.75 γNH2 7.59, 6.91
Pro - 4.42 2.29, 1.94 γCH2 2.02, 2.02; δCH2 3.63, 3.63
Gln 8.32 4.34 2.12, 1.99 γCH2 2.36, 2.36; δNH2 7.52, 6.85
Arg 8.23 4.34 1.86, 1.76 γCH2 1.63, 1.63; δCH2 3.20, 3.20; εNH 8.07
Ser 8.31 4.47 3.89, 3.87
Thr 8.15 4.35 4.24 γCH3 1.21
Val 8.03 4.12 2.08 γCH3 0.94, 0.93
Trp 8.25 4.66 3.29, 3.27 2H 7.27; 4H 7.65; 5H 7.18; 6H 7.25; 7H 7.50
Tyr 8.12 4.55 3.03, 2.98 2,6H 7.14; 3,5H 6.84
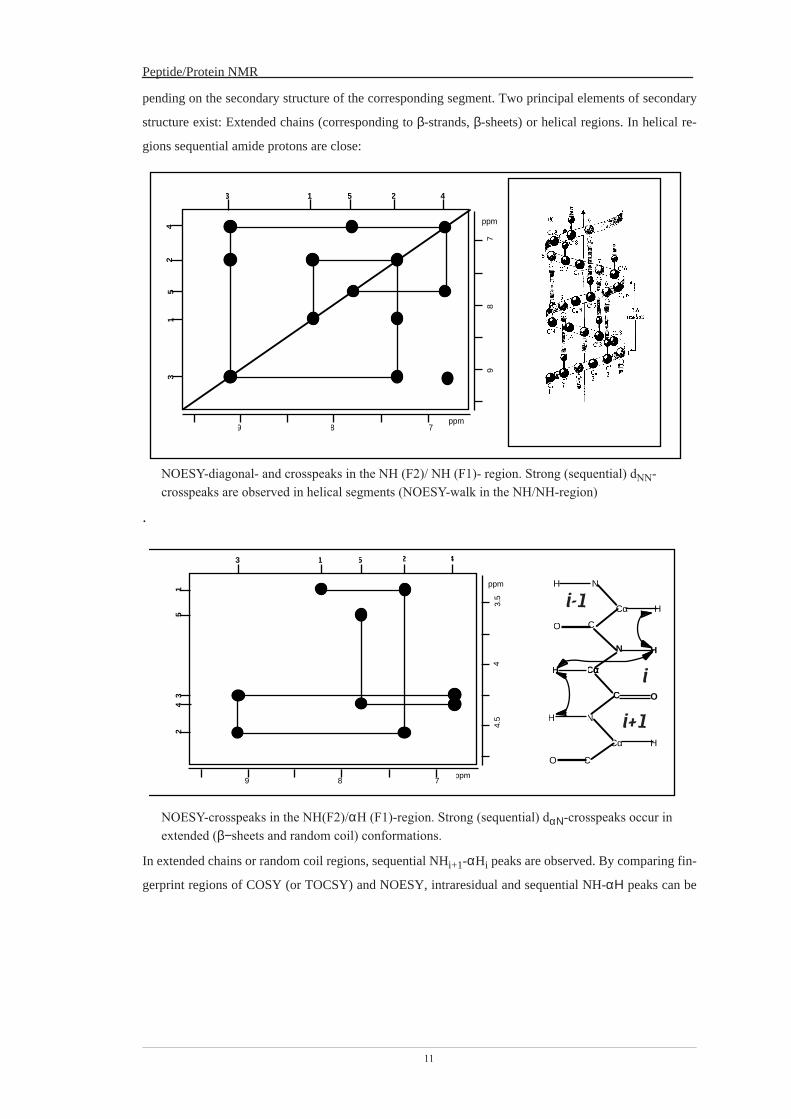
11
Peptide/Protein NMR
pending on the secondary structure of the corresponding segment. Two principal elements of secondary
structure exist: Extended chains (corresponding to β-strands, β-sheets) or helical regions. In helical re-
gions sequential amide protons are close:
.
In extended chains or random coil regions, sequential NHi+1-αHi peaks are observed. By comparing fin-
gerprint regions of COSY (or TOCSY) and NOESY, intraresidual and sequential NH-αΗ peaks can be
NOESY-diagonal- and crosspeaks in the NH (F2)/ NH (F1)- region. Strong (sequential) dNN-crosspeaks are observed in helical segments (NOESY-walk in the NH/NH-region)
NOESY-crosspeaks in the NH(F2)/αH (F1)-region. Strong (sequential) dαΝ-crosspeaks occur in extended (β−sheets and random coil) conformations.
9 8 7ppm
98
7
ppm
3 1 2 45
31
24
5
9 8 7ppm
4.5
43.
5
ppm
3 1 2 45
31
24
5
NH
Cα H
CO
N H
CααααH
C O
NH
Cα H
CO
i
i+1
i-1
i-1
i
i+1
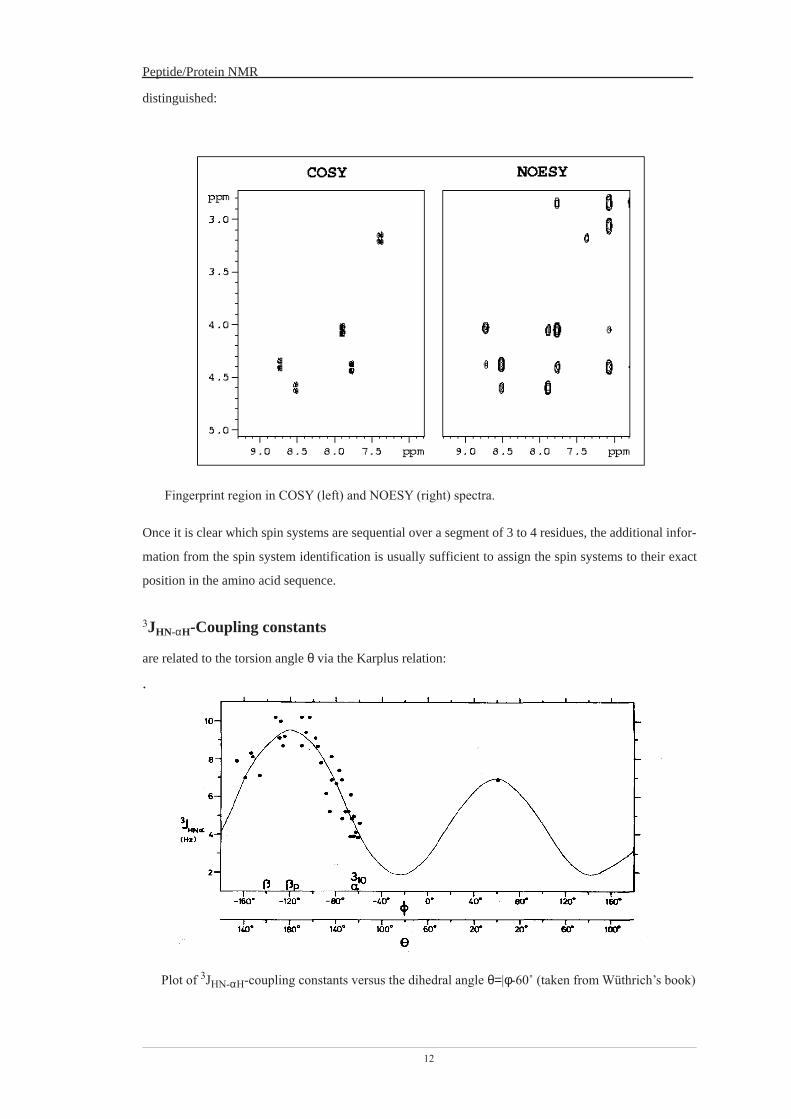
12
Peptide/Protein NMR
distinguished:
Once it is clear which spin systems are sequential over a segment of 3 to 4 residues, the additional infor-
mation from the spin system identification is usually sufficient to assign the spin systems to their exact
position in the amino acid sequence.
3JHN-αH-Coupling constants
are related to the torsion angle θ via the Karplus relation:
.
Fingerprint region in COSY (left) and NOESY (right) spectra.
Plot of 3JHN-αH-coupling constants versus the dihedral angle θ=|φ-60˚ (taken from Wüthrich’s book)

13
Peptide/Protein NMR
Internal flexibility leads to rotationally averaged values of the scalar coupling constants, resulting in typ-
ical values of about 7 Hz in short, unstructured peptides, and hence values between 6 and 8 Hz are usually
not included in the structure calculations.
NOEs
NOEs are the by far most important source of information for the structure calculation. They are usually
observed for protons separated by less than 5 Å. They may come from protons far in distance in the amino
acid sequence (e.g. cross-strand NOEs in β-sheets)!
Theoretical values of 3JHN-αH in typical secondary structural elements:
secondary structure θ 3JHN-αH
α-helix -57˚ 3.9 Hz
310-helix -60˚ 4.2 Hz
antiparallel β-sheet -139˚ 8.9 Hz
parallel β-sheet -119˚ 9.7 Hz
Short (<4.5A) sequential and medium-range 1H-1H distances in polypeptide secondary structures
Distance α-Helix 310-Helix β βp turn I turn II
dαN 3.5 3.4 2.2 2.2 3.4 / 3.2 2.2 / 3.2
dαN(i,i+2) 4.4 3.8 3.6 3.3
dαN(i,i+3) 3.4 3.3 3.1-4.2 3.8-4.7
dαN(i,i+4) 4.2
dNN 2.8 2.6 4.3 4.2 2.6 / 2.4 4.5 / 2.4
dNN(i,i+2) 4.2 4.1 3.8 4.3
dβN 2.5-4.1 2.9-4.4 3.2-4.5 3.7-4.7 2.9-4.43.6-4.6
3.6-4.63.6-4.6
dαβ(i,i+3) 2.5-4.4 3.1-5.1
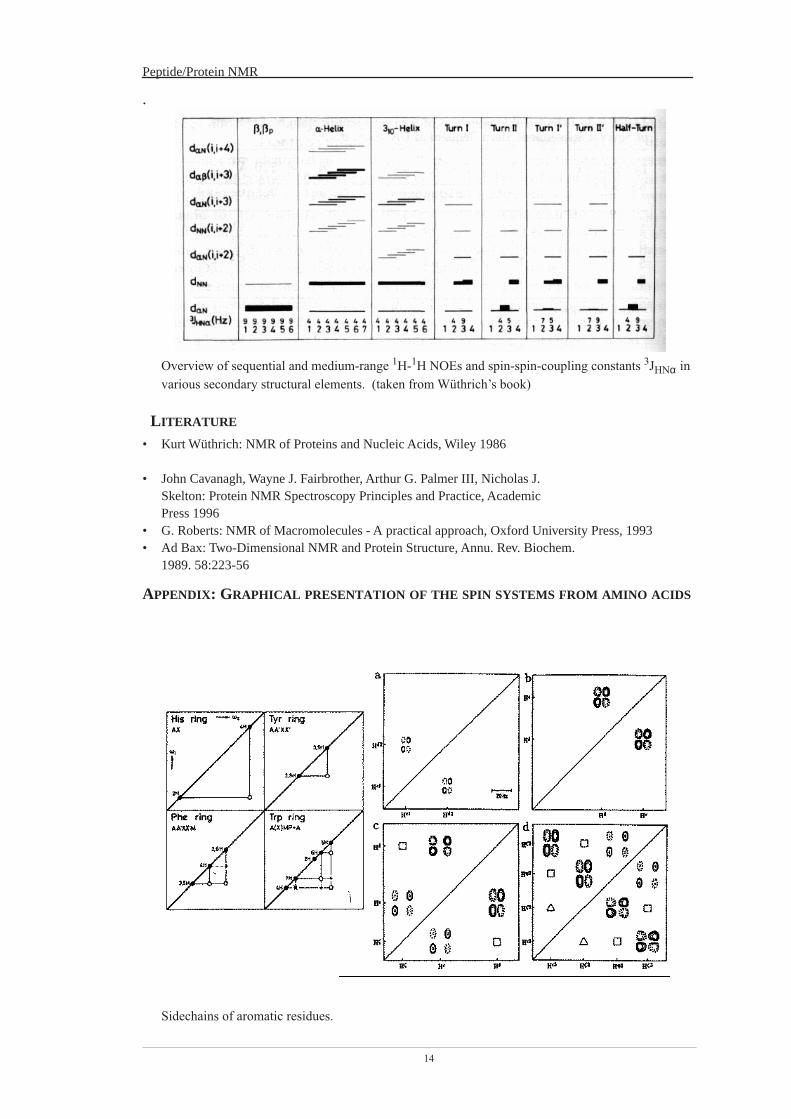
14
Peptide/Protein NMR
.
LITERATURE
• Kurt Wüthrich: NMR of Proteins and Nucleic Acids, Wiley 1986
• John Cavanagh, Wayne J. Fairbrother, Arthur G. Palmer III, Nicholas J.Skelton: Protein NMR Spectroscopy Principles and Practice, AcademicPress 1996
• G. Roberts: NMR of Macromolecules - A practical approach, Oxford University Press, 1993• Ad Bax: Two-Dimensional NMR and Protein Structure, Annu. Rev. Biochem.
1989. 58:223-56
APPENDIX: GRAPHICAL PRESENTATION OF THE SPIN SYSTEMS FROM AMINO ACIDS
Overview of sequential and medium-range 1H-1H NOEs and spin-spin-coupling constants 3JHNα in various secondary structural elements. (taken from Wüthrich’s book)
Sidechains of aromatic residues.

15
Peptide/Protein NMR
Side-chain spin system pattern as observed in COSY or TOCSY spectra
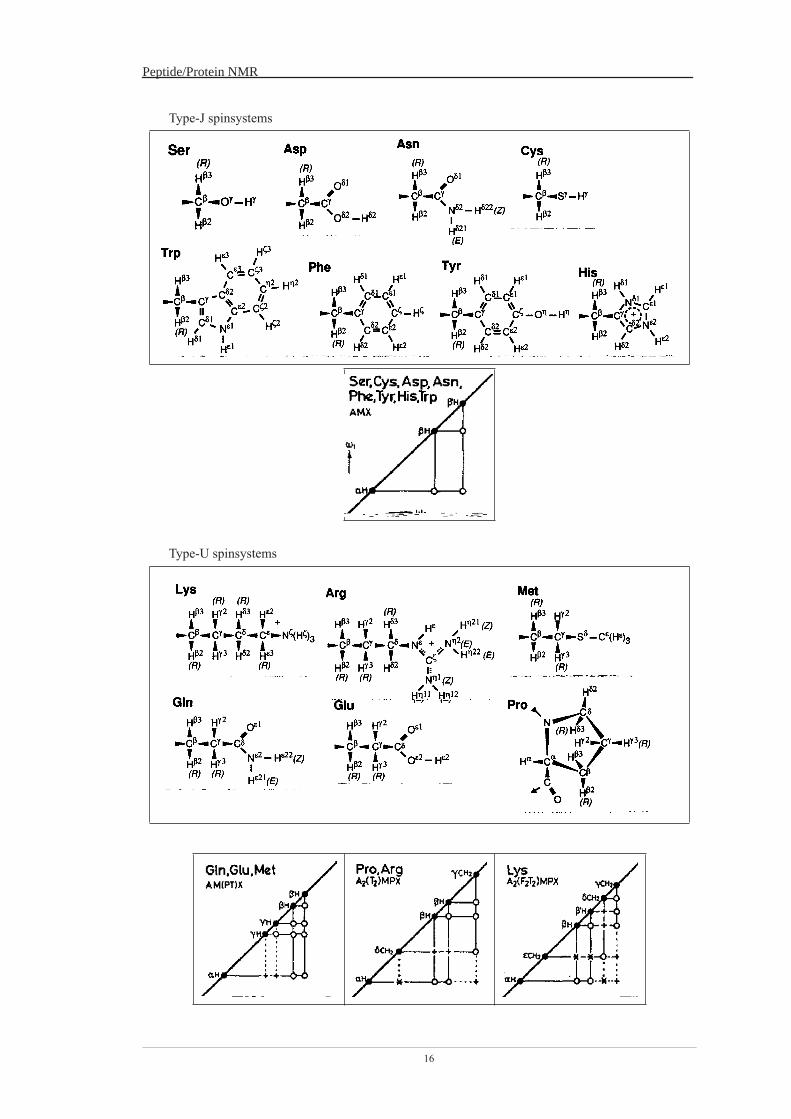
16
Peptide/Protein NMR
Type-J spinsystems
Type-U spinsystems

Steroids 1
Steroids Introduction: The steroid skeleton is often found to be part of natural products. It consists of four fused ring systems, three six-membered and one five-membered ring. In the simplest compound, gonan, three cyclohexane rings are fused, abbreviated as rings A,B and C, and C is connected to a cyclopentane moiety, called ring D. The numbering for the carbon atoms is shown in the figure below. The stereochemistry of the ring-junction of rings A and B may be cis or trans, whereas rings B and C are always fused in trans conformation. In most steroids methyl groups numbered C-19 and C-18 are attached to carbons C-10 and C-13, respectively. Position 17 is often derivatized. Ring A may be aromatic (e.g. in estrogen), and oxygen functionality is often found at C-3. When all rings are trans-fused, an all-chair conformation is observed, in which steric tension is minimized. The angular methyl groups (C-19 and C-18) or their corresponding hydrogen atoms are placed axially. The fused ring systems form a plane, and substituents above the plane (on the top side) are called β-substituents whereas those, which are found on the bottom side, are called α- substituents. The axial methyl groups are also called angular methyl groups.
H
X
CH3
CH3
H
H
H
cis-fusion
1
2
3
4
56
7
8910
1112
13
14
15
H
16
17
18
19
H
H
X
H
CH3
CH3
H
H
12
36
54
7
89
10
11
1213
14 15
16
17
18
19
20
21
22
23
25
24
26
27
α
β
β
β
β
α
α
α
axialaxial
axial
trans-fusiontrans-
fuion
trans-fusion
A BC D

Steroids 2
Biogenic Origin of steroids:
HO
A
C D
B
Cholesterole
A
C D
B
O
O
Progesterone Glucocorticoides Mineralocorticoides
O
HOH 2C
O OH HO
O
CH2OH
OHO
OH
Cortisole Aldosterone
Androgene
O
OH
Testosterone
A
C D
B
HO
OH
Östradiole
Östrogene

Steroids 3
Origin of steroids in plants
A
C D
B
RO
O O
Glycosides
HO
A
C D
B
Cholesterole
A
C D
B
HO
Alkyl
A
C D
B
RO
O
X
Phytosterole Steroidsaponines and -alkaloids

Steroids 4 NMR-spectra of steroids
Proton chemical shifts in steroids
Proton spectra of steroids look very complicated. In particular, the non-functionalized steroids
display little signal dispersion, and almost all signals are found between 0.5 and 2 ppm. The
occurrence of signals in different regions, e.g. in the region around 7 ppm or around 5-6 ppm
indicates the presence of aromatic rings or double bonds, respectively. Similarly, signals at 4 ppm
indicate the presence of hydroxyl groups. This information helps to quickly identify to which class of
steroids the compound belongs.
Because of the missing signal dispersion it is highly recommended to record spectra at the highest
available field. On lower-field instruments second order effects (in case ∆δ/J ≥ 3) will additionally
complicate the analysis. The following figure displays the proton spectra of β-Sitosterin, recorded at
300 and 600 MHz.
Fig.1 1H-sp
If the sign
Usually, th
spectra o
frequently
compound
improved
achieve b
or Yb(FOD
Substantia
reference,
As a rule o
diastereot
1 J. Chem. P
600MHz
ectrum of β-Sitosterin recorded in CDCl3 at 300MHz and 600 MHz.
al dispersion at higher field is still poor spectra may be recorded in different solvents.
e chemical shifts are considerably influenced by the choice of solvent. In figure 2 the
f 4-cholesten-3-one are displayed in acetone, benzene and chloroform. The most
used solvent for steroids with little functionalization is chloroform; highly oxygenated
s can also be measured in methanol. Often, a few drops of benzene are added to
signal dispersion (ASIS effect, aromatic solvent-induced shifts). Another possibility to
etter signal dispersion is addition of a lanthanide shift reagent, e.g. Eu(FOD)3, Pr(FOD)3
)3.
l data have been accumulated for steroids, and the Paper of N. Kirk1 serves as a good
containing data for more than 160 steroids.
f thumb, the equatorial protons are low-field shifted with respect to the axial protons for
opic methylene protons.
erkin. Trans. 2 (1990), 1567.
0.80.91.01.11.21.31.41.51.61.71.81.92.02.12.22.3 ppm
300MHz

Steroids 5
0.8
0.9
1.0
1.1
1.2
1.3
1.4
1.5
1.6
1.7
1.8
1.9
2.0
2.1
2.2
2.3
2.4
2.5
ppm
Ace
ton−
d6
Ben
zol−
d6
CD
Cl3
−d1
Fig. 2 Expansion of the 1H-NMR-spectrum of 4-cholesten-3-one recorded in acetone, Benzene and CDCl3.

Steroids 6
13C-NMR spectroscopy: Carbon spectra of steroids are much simpler than their proton counterparts because of the better
signal dispersion and the lack of homonuclear couplings. Surprisingly, as demonstrated in the case
of cholestane, carbon signals may be found as low as 50 ppm in the absence of functional groups.
The chemical shift of the angular methyl group C-19 is between 11 and 19 ppm in the case of the
5α-form and about 24 ppm in case of the 5β-form:

Steroids 7
The chemical shift of 155 ppm, observed for C-3 in estrogen, is typical for an aromatized A ring, to
which a hydroxyl group has been attached. The double-bond carbon C5 in progesterone or
testosterone is found at 170 ppm, which may be erroneously interpreted as a carbonyl carbon
(ester, amide) from some side-chain functionality attached to C-17. Carbon chemical shifts may be
calculated quite accurately with the help of the increment system starting from known values of
similar compounds.
1H-1H-couplings: Due to the rigid nature of the cyclohexane ring systems couplings do not vary greatly and therefore
present very useful parameters to elucidate stereochemistry:
Scalar coupling constants for rings A, B and C
geminal -12 to -14 Hz axial-equatorial 3.5 to 5 Hz
axial-axial 10.5 to 14 Hz equatorial- equatorial 2.5 to 4Hz
long-range approx. 1Hz (W-couplings)
Due to the enhanced flexibility of the cyclopentane ring D, the scalar couplings vary much more and
are therefore less informative.
Because of the rigid geometry, many 4J couplings can actually be observed (and also be used to
deduce stereochemistry). Even methyl protons H-18 and H-19 may exhibit long-range couplings to
H-12α and 17α or H-1α.
Multiplet recognition It has been recognized that multiplet patterns due to 3JH,H- couplings in the rigidly fused ring systems are similar provided the stereochemistry is the same (e.g. for 5α, 14α) and hence the
Me
Me
12
Me
Me
O
OH12
Me
Me
OMe
OAc
O
Me
12
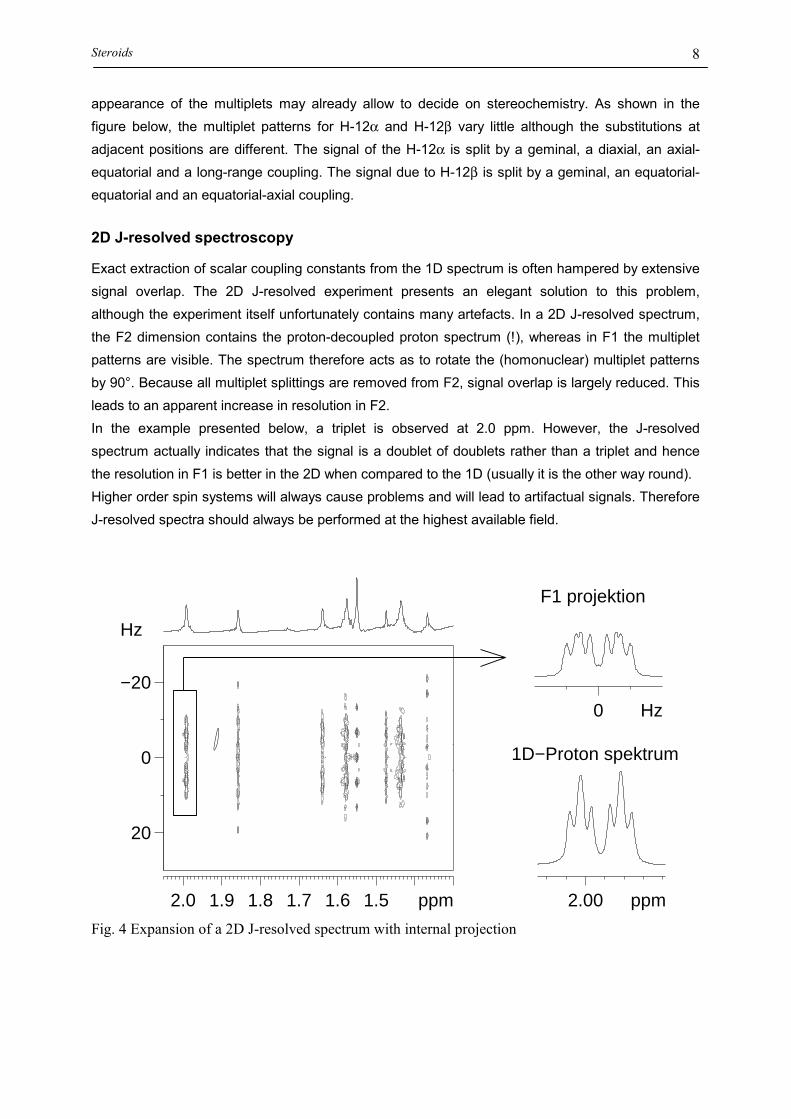
Steroids 8
appearance of the multiplets may already allow to decide on stereochemistry. As shown in the figure below, the multiplet patterns for H-12α and H-12β vary little although the substitutions at adjacent positions are different. The signal of the H-12α is split by a geminal, a diaxial, an axial-equatorial and a long-range coupling. The signal due to H-12β is split by a geminal, an equatorial-equatorial and an equatorial-axial coupling.
2D J-resolved spectroscopy
Exact extraction of scalar coupling constants from the 1D spectrum is often hampered by extensive signal overlap. The 2D J-resolved experiment presents an elegant solution to this problem, although the experiment itself unfortunately contains many artefacts. In a 2D J-resolved spectrum, the F2 dimension contains the proton-decoupled proton spectrum (!), whereas in F1 the multiplet patterns are visible. The spectrum therefore acts as to rotate the (homonuclear) multiplet patterns by 90°. Because all multiplet splittings are removed from F2, signal overlap is largely reduced. This leads to an apparent increase in resolution in F2. In the example presented below, a triplet is observed at 2.0 ppm. However, the J-resolved spectrum actually indicates that the signal is a doublet of doublets rather than a triplet and hence the resolution in F1 is better in the 2D when compared to the 1D (usually it is the other way round). Higher order spin systems will always cause problems and will lead to artifactual signals. Therefore J-resolved spectra should always be performed at the highest available field.
Fig. 4 Expansion of a 2D J-resolved spectrum with internal projection
Hz
1.51.61.71.81.92.0 ppm
−20
20
0
0 Hz
2.00 ppm
F1 projektion
1D−Proton spektrum
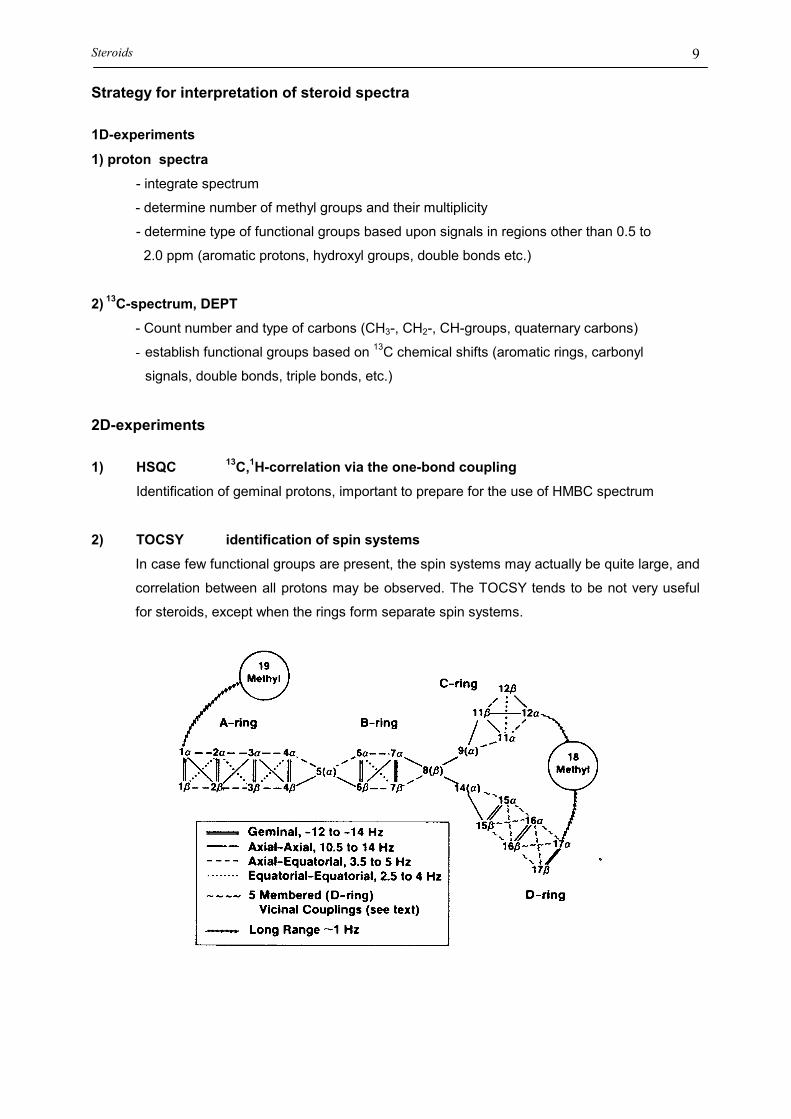
Steroids 9 Strategy for interpretation of steroid spectra 1D-experiments
1) proton spectra
- integrate spectrum
- determine number of methyl groups and their multiplicity
- determine type of functional groups based upon signals in regions other than 0.5 to
2.0 ppm (aromatic protons, hydroxyl groups, double bonds etc.)
2) 13C-spectrum, DEPT
- Count number and type of carbons (CH3-, CH2-, CH-groups, quaternary carbons)
- establish functional groups based on 13C chemical shifts (aromatic rings, carbonyl
signals, double bonds, triple bonds, etc.)
2D-experiments 1) HSQC 13C,1H-correlation via the one-bond coupling
Identification of geminal protons, important to prepare for the use of HMBC spectrum
2) TOCSY identification of spin systems
In case few functional groups are present, the spin systems may actually be quite large, and
correlation between all protons may be observed. The TOCSY tends to be not very useful
for steroids, except when the rings form separate spin systems.
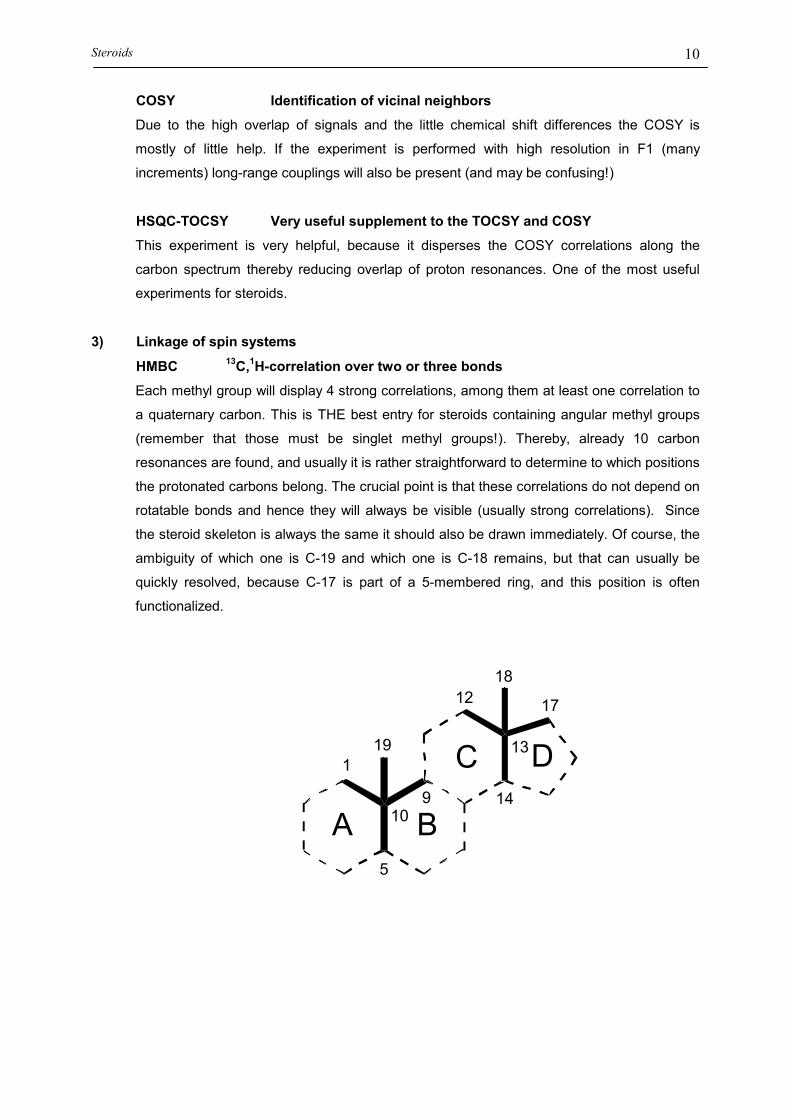
Steroids 10
COSY Identification of vicinal neighbors
Due to the high overlap of signals and the little chemical shift differences the COSY is
mostly of little help. If the experiment is performed with high resolution in F1 (many
increments) long-range couplings will also be present (and may be confusing!)
HSQC-TOCSY Very useful supplement to the TOCSY and COSY
This experiment is very helpful, because it disperses the COSY correlations along the
carbon spectrum thereby reducing overlap of proton resonances. One of the most useful
experiments for steroids.
3) Linkage of spin systems
HMBC 13C,1H-correlation over two or three bonds
Each methyl group will display 4 strong correlations, among them at least one correlation to
a quaternary carbon. This is THE best entry for steroids containing angular methyl groups
(remember that those must be singlet methyl groups!). Thereby, already 10 carbon
resonances are found, and usually it is rather straightforward to determine to which positions
the protonated carbons belong. The crucial point is that these correlations do not depend on
rotatable bonds and hence they will always be visible (usually strong correlations). Since
the steroid skeleton is always the same it should also be drawn immediately. Of course, the
ambiguity of which one is C-19 and which one is C-18 remains, but that can usually be
quickly resolved, because C-17 is part of a 5-membered ring, and this position is often
functionalized.
A B
C D191
10
5
9
12
13
18
17
14

Steroids 11
4) NOESY/ROESY Determination of stereochemistry
very strong NOEs: between geminal protons (A)
strong NOEs: between vicinal equatorial-axial protons (A)
medium NOEs: between 1,3-diaxial protons (B)
weak NOEs: long range NOE’s, e.g. between 7β and 15α (C)
As stated before many times, please use 1,3 diaxial NOEs and not NOEs between vicinal protons!
INA
Ve
req
(DR
DEQUATE 13C-13C connectivities
ry useful experiment to elucidate steroid structures. Unfortunately, a lot of material is
uired (approx. 50mg compound to get a spectrum within 24 hours measuring time)
X600, DRX500).
Summary: Strategies for structure elucidation of natural products
In the following a strategy is developed, which should help in identifying natural
products solely from the one-dimensional proton and carbon spectra. Once the classof natural product has been recognized, a set of 2D spectra is used together with a
more specific strategy for their final unambiguous identification. For the latter, we
would like to refer to the descriptions of the various natural product compoundclasses.
Of course, it is very important to use ALL available information right from the
beginning. Information is almost always available when the compound is derivedfrom chemical synthesis, but rearrangement reactions or other side-reactions may lead
to non-expected products, which should then be more carefully characterized.However, when the compound of interest has been isolated from plants, much less
information is available. It is often well known, which type of compounds can be
found in a particular system, but one should be careful not to too strongly bias theanalysis. Information about solubility in solvents of different polarity is always
available and can help to exclude certain classes of compounds. A very valuablesource of additional information is the molecular mass, derived from the MS data
(make sure you use a soft ionization procedure which yields the molecular ion peak).
Other helpful sources are UV spectra to recognize whether chromophores are present,separation behavior on TLC plates (in addition to specific staining methods). Even
elementary analysis is useful, although many heteroatoms may not be tested, and theprecision is usually limited.
One-dimensional spectra contain a wealth of information, and in favorable cases the
natural compound class can be recognized straight away. This is particularly true inthe case of peptides, steroids and carbohydrates. Other classes, such as alkaloids or
terpenes, are much more difficult to identify and may require full interpretation of the2D spectra.
In the following the information content of 1D spectra of compounds from the
different classes of natural products is summarized:

13C spectra:Number of signals: Information about the size of the compound, which helps toexclude certain classes of compound. One should be aware that quaternary carbons
might yield only very weak signals, which may escape detection in spectra with lowsignal-to-noise. In such cases, carbon resonance positions may be more usefully
extracted from the proton-detected experiments, e.g. from HSQC or HMBC data. In
the latter, correlations may not be found for quaternary carbons, if the proton densityis low and therefore no 2J or 3J couplings exist. The carbon spectra will also contain
very useful information on whether the molecule or parts of it possess symmetry(reduction of signals).
Multiplicity information, derived from DEPT spectra, can be extremely helpful, e.g.
for carbohydrates. The most valuable source of information is the shift dispersion andthe regions, in which signals are found in the proton or carbon spectra. Easily
recognizable are: Presence of methyl groups, double bonds, aromatic carbons,
carbonyl carbons, and triple bonds. Since many compounds may actually bederivatives of natural products, it is important to realize, in which regions the majority
of resonances are found. Another useful parameter is the ratio of aliphatic to aromaticsignals.
The following figure summarizes the regions, in which resonances from natural
products typically occur. Of course, carbon shift positions may be used to search inchemical databases, provided the compound has been isolated before, or can at least
be used to yield information on known, similar compounds. Carbon chemical shiftsare much more reliable than proton resonances in this respect, because they tend to be
much more reproducible (less dependent (although not independent) on temperature,
solvent, pH).
1H spectra:Due to their high sensitivity, recording a proton spectrum usually is usually the firststep in the spectroscopic identification procedure. Furthermore, they help to decidewhether the compound is pure. Some natural products, such as carbohydrates,steroids, and peptides may already be identified at this stage.It is particularly helpful to find out whether chemically labile protons are found (NHor OH protons), e.g. by adding d4-methanol or deuterated water. Especially in thecase of peptides or carbohydrates this will lead to the loss of many signals. On the

other hand, successful identification of peptides requires the interpretation of amideproton signals, and therefore the peptides should not be measured in deuteratedwater.The integration of spectra yields very useful information.
The following section summarizes features of natural product classes, which can berecognized from the one-dimensional spectra:
Carbohydrates:• Typical 13C range: no signals below 60 ppm (for the typical carbohydrate
skeleton!, exceptions: deoxy sugars, amino sugars). All signals in the range of60-110 ppm.
• Number of 13C signals in the range 60-110 ppm can often be divided by 6 (or acombination of 5 and 6, but other signals due to added functional groups maybe found in this region).
• Labile protons in the region between 3.5 and 5.0 ppm (Proof: Add D2O, becareful when recording spectra in D2O or MeOD!).
• One anomeric proton/carbon per sugar unit in a characteristic chemical shiftrange (90-110 ppm). Usually no double bonds or aromatic carbons.
• Soluble in H2O, DMSO, MeOH, pyridine.• No UV absorption• Typical derivates: Deoxy, N-derivatives, glycerol derivatives, N-Acetyl, Me,
Methoxy.
Peptides:• 1H: Typical range between 10 to 6.5 ppm (amide- and aromatic protons), as
well as below 5 ppm. Usually no signals between 5 and 6.5 ppm (may containsignals in case of glycopeptides, from the carbohydrate part)
• 13C: Carbonyls around 170 ppm (many!), mostly aromatic carbons between110 and 150 ppm, an “empty window” between 100 and 60 ppm (in contrastto carbohydrates), aliphatic resonances below 60 ppm.
• Labile protons between 6.5 and 10 ppm (amide protons, may even be foundfurther down-field). The line-width of these signals depends strongly on pH(pH-dependent exchange phenomena when recording spectra in90%H2O/D2O).
• Soluble in H2O, pyridine, DMSO, hydrophobic peptides in CDCl3.• Strong UV absorption.

• Characteristic behavior on TLC.• Most often found derivatives: Glycopeptides, lipopeptides, methylated
derivatives.
Steroids:• Typical chemical shift range: 13C 10-60 ppm, 1H 1-2.5 ppm.• A lot of signals with much overlap in the region 1-2.5 ppm („steroid hump“)• More than 17 13C signals• Frequently encountered: Singlet methyl groups (angular methyl groups) at
characteristic positions (bound to C-8, C-10 und C-13)• ring A often aromatized• Other derivatives: double- or triple-bonds, substitutents at position 17,
methyl groups, methoxy groups, carbohydrates (saponins), fatty acidattachments.
• No UV absorption from the skeleton, unless ring A is aromatized orfunctional groups are part of the side-chain attached to C-17).
• Solvents: CDCl3, CDCl2 (unsubst.) or MeOD, DMSO (O-subst.).
Flavonoids:• 13C spectrum: many aromatic carbons, partially strongly low-field shifted.• 1H spectrum contains very few signals, often as singlets with shifts larger
than 7 ppm. Integrals are frequently quite incorrect, because the isolatedprotons relax very slowly.
• At least 15 carbon signals• TLC: natural product reagent A, colored compounds (yellowish).• Solvents: MeOD, DMSO, (CDCl3)• Contain labile protons that disappear in protic, deuterated solvents (OH)• Strongly low-field shifted OH-protons found (> 10 ppm), due to the
formation of intra-molecular hydrogen bonds.• Substituents: OH, OMe, sugars, dimerization.
Alkaloids:• (MS: compounds contain nitrogen!)• Free base lipophilic, salt hydrophilic; hence solubility in various solvents is
hard to predict!• Draggendorf reagent/iodine platinat• Extremely difficult to recognize, because alkaloids are chemically very
heterogeneous!

Terpenes:• 1H/13C: Many methyl groups• Signals can be found over the full 1H or 13C range!• Often (but not always), the number of carbons can be divided by 5.• lipophilic to medium-lipophilic (solvents: CDCl3, benzene, (MeOD))• Terpenes may often be recognized by the nature of the plant material from
which the compound has been isolated.• Similarly to alkoloids, terpenes are very difficult to recognize due to their
very heterogeneous chemical nature!

Common sources of artefacts in 2D spectra
- F1(2) or F2 (3) quadrature images
- t1 noise (1)
- F1 or F2 folding
- axial peaks (4,5)
- repetition-rate artefacts
- quadrature imagesQuad. images are due to incomplete quadrature detection. The intensity of quad.images is proportional to the intensity of the main signal, and hence, usually onlyquad. images of diagonal signals are observed. Quad. images are located on the anti-diagonal.
- t1 noiset1 noise is manifested as vertical strips (noise bands), which are running along F1and is mainly observed for intense signals, e.g. strong singlet signals (methylgroups). The intensity of the noise band is proportional to the signal height.t1 noise comes from random instabilities of the lock signal, which may originatefrom instable room or probe temperature, amplitude or phase modulations of thesignals due to sample spinning, instabilities in the magnetic field homogeneitycaused by magnetic disturbances of the environment (traffic), or from digitizationerrors. Instable temperature is the major source for t1 noise.
- F1 or F2 foldingFolding is observed when the spectral width is not chosen sufficiently large enoughto cover all signals. The intensity of signals, which are folded in F2 is largelydiminished through audio-filters. However, folded signals in F1 are not attenuated inintensity. Signals are folded along the near edge (real acquisition) or along thedistant edge (complex acquisition). Folded signals cannot always be phased.
1
2
3
4
5

real data complex data
- axial peaksAxial peaks arise from magnetization which has relaxed during the evolution period.These signals are therefore not frequency labeled and behave as if they would havezero frequency. Depending on the F1 quad. detection mode, they are on a linerunning parallel to the F2 axis through the middle of the spectrum (magnitude modespectra, States quad. detection) or are located at the bottom of the spectrum (TPPI,States-TPPI quad. detection).
- repetition-rate artifactsRepetition rate artefacts do occur, when the relaxation delay is not chosen sufficientlylong enough and arise from magnetization which is "left over" from the previousscan. Such artefacts may give rise to cross peaks at various frequencies along F1,such as the double-quantum frequency etc.... Such artefacts can sometimes berecognized when there is no corresponding signal at the F1 frequency of the crosspeak, or when additional signals on diagonal lines of higher steepness are observed.
- errors from symmetrization of spectra (processing)Symmetrization is a mathematical tool to improve spectral quality by removing allsignals, which are not symmetrical about the diagonal. When two diagonal signalshave strong noise bands, symmetrization leaves a signal at the cross peak position:
Sym
In addition, a lot of coherent artefacts can be observed. They result from incompletesuppression of unwanted signals which have not been properly removed through thephase-cycling procedures, e.g. COSY cross peaks in NOESY spectra. They will bediscussed under the various 2D experiments.