health plan strategic implications of macrashealth plan strategic implications of macra executive...
TRANSCRIPT

August 2019
Health Plan Strategic Implications of MACRA

Copyright © 2019 Society of Actuaries
2
Health Plan Strategic Implications of MACRA
AUTHORS Optum:
Julie Witt, FSA, FCA, MAAA
Jim Dolstad, ASA, MAAA
Richard Gamret, FSA, MAAA
Betty Siu, ASA, MAAA
Eric McKeeman, ASA, MAAA
CONTRIBUTOR Alex Niederloh SPONSOR Society of Actuaries
The content of this report was completed prior to the “2020 Quality Payment Program Proposed Rule”. Readers are encouraged to review the proposed rule in conjunction with this report.
Caveat and Disclaimer The opinions expressed and conclusions reached by the authors are their own and do not represent any official position or opinion of the Society of Actuaries or its members. The Society of Actuaries makes no representation or warranty to the accuracy of the information
Copyright © 2019 by the Society of Actuaries. All rights reserved.

Copyright © 2019 Society of Actuaries
3
Contents Acronyms ......................................................................................................................................... 4 Executive Summary ......................................................................................................................... 5 MACRA—Is the Market Ready? ....................................................................................................... 7 Overview and Objectives of MACRA ............................................................................................... 9 Industry Transformation ................................................................................................... 10 Choosing a MACRA Path ................................................................................................................ 12 MIPS .................................................................................................................................. 12 MIPS Performance Scores ................................................................................................ 14 AAPMs .............................................................................................................................. 15 Transitioning to AAPM ...................................................................................................... 16 MACRA—What Does This Mean to Providers? ............................................................................. 18 Provider Reactions and Implications ................................................................................ 18 Revenue Implications ....................................................................................................... 20 Scenario Modeling ............................................................................................................ 21 MACRA’s Impact on Payers ........................................................................................................... 25 Variation of MACRA’s Impact by Payer and Geography ................................................... 26 Medicare ........................................................................................................................................ 28 Medicare Advantage ...................................................................................................................... 28 High-Level Summary of MACRA Mechanics ..................................................................... 29 MACRA’s Impact on the Medicare Advantage Market .................................................... 29 MACRA’s Impact on the Medicare Advantage Plans ........................................................ 30 Medicare Supplement (Medigap) .................................................................................................. 32 Medicaid ........................................................................................................................................ 33 Commercial .................................................................................................................................... 33 Revenue Impact ............................................................................................................................. 36 Framework for Estimating Financial Impact by Line of Business ..................................... 36 Scenario Modeling ............................................................................................................ 37 Health Care Ecosystem .................................................................................................................. 38 Appendix ........................................................................................................................................ 40 Exhibit 1: MIPS Measures ................................................................................................. 40 Exhibit 2: AAPM QP Thresholds ........................................................................................ 42 Exhibit 3a: Scenario 1: MIPS to AAPM (Low Performer) .................................................. 45 Exhibit 3b: Scenario 2: MIPS APM to AAPM (High Performer) ......................................... 48 Exhibit 4: Payer Model Scenarios 1 and 2 ........................................................................ 51 Exhibit 5: Maps ................................................................................................................. 52 About The Society of Actuaries ..................................................................................................... 60

Copyright © 2019 Society of Actuaries
4
Acronyms
ACA Affordable Care Act MHM Medical Home Model
ACO Accountable Care Organization MedPAC Medicare Payment Advisory Commission
APM Alternative Payment Model MIPS Merit-based-Incentive Payment System
AAPM Advanced Alternative Payment Model MSSP Medicare Shared Savings Program
CAH Critical Access Hospital MU Meaningful Use
CAHPS Consumer Assessment of Healthcare Providers and Systems
NPI National Provider Identifier
CEHRT Certified EHR Technology OCM Oncology Care Model
CMS Centers for Medicare & Medicaid Services
PFS Physician Fee Schedule
CMMI Center for Medicare and Medicaid Innovation
PHM Population Health Management
CPS Composite Performance Score PQRS Physician Quality Reporting System
CQM Clinical Quality Measure PT Performance Target
EHR Electronic Health Record QCDR Qualified Clinical Data Registry
EP Exceptional Performer QP Qualifying Participant
FFS Fee for Service QPP Quality Payment Program
MA Medicare Advantage SGR Sustainable Growth Rate
MACRA Medicare Access & CHIP Reauthorization Act of 2015
VBC Value-Based Care
MAO Medicare Advantage Organization VM Value Modifier

Copyright © 2019 Society of Actuaries
5
Health Plan Strategic Implications of MACRA
Executive Summary
The Medicare Access and CHIP Reauthorization Act of 2015 (MACRA) has made sweeping changes to how Medicare pays physicians and other clinicians for the services they provide. Aside from simply addressing clinician payments, MACRA is intended to significantly improve patient outcomes and reduce the cost of health care by offering incentives to medical professionals for the overall quality of care they provide, rather than the number of services and procedures they perform.
MACRA was signed into law in April 2015, intending to drive health care payment reform for clinicians, health systems, Medicare and commercial health care plans. MACRA created the Quality Payment Program (QPP), which implemented two incentive paths for clinicians: the Merit-Based Incentive Payment System (MIPS) and Advanced Alternative Payment Models (AAPMs). The primary goal of this legislation was related to transforming traditional fee-for-service (FFS) payments to value-based payment models built around improving quality of care.
On November 4, 2016, the Centers for Medicare and Medicaid Services (CMS) released the Final Rule1
to implement MACRA through an iterative process that subsequently led to release of the Final Rule for Year 22 in November 2017. Meanwhile, subsequent iterations are expected to be moving forward, including the release of the QPP Proposed Year 3 rule3 on July 12, 2018, and Final Year 3 rule4 on November 1, 2018, which was driven by the Bipartisan Budget Act of 2018.5 CMS has addressed concerns from clinicians regarding new reporting burdens by defining the early years of this program as “transition years.” This allows clinicians additional flexibility and time for reporting. While some of these changes reduced the initial requirements, MACRA’s additional regulations will soon be fully implemented, with implications for not only clinicians but also the entire health care industry.
MACRA initially had bipartisan support when it was enacted in 2015. Despite that bipartisan support, on January 11, 2018, the influential Medicare Payment Advisory Commission (MedPAC) voted 14 to 2 in favor of repealing MACRA in favor of an as yet undefined alternative model. Congress and CMS are clearly aware of MedPAC’s sentiment but appear to be fully committed to MACRA nevertheless.
1 Federal Register, “Medicare Program; Merit-Based Incentive Payment System (MIPS) and Alternative Payment Model (APM) Incentive Under the Physician Fee Schedule, and
Criteria for Physician-Focused Payment Models,” https://www.federalregister.gov/documents/2016/11/04/2016-25240/medicare-program-merit-based-incentive-payment-system-mips-and-alternative-payment-model-apm. 2 Federal Register, “Medicare Program; CY 2018 Updates to the Quality Payment Program; and Quality Payment Program: Extreme and Uncontrollable Circumstance Policy for the
Transition Year,” https://www.federalregister.gov/documents/2017/11/16/2017-24067/medicare-program-cy-2018-updates-to-the-quali ty-payment-program-and-quality-payment-program-extreme. 3 Federal Register, “Medicare Program; Revisions to Payment Policies under the Physician Fee Schedule and Other Revisions to Part B for CY 2019; Medicare Shared Savings
Program Requirements; Quality Payment Program; and Medicaid Promoting Interoperability Program,” https://s3.amazonaws.com/public-inspection.federalregister.gov/2018-14985.pdf. 4 Federal Register, “Medicare Program; Revisions to Payment Policies Under the Physician Fee Schedule and Other Revisions to Part B for CY 2019; Medicare Shared Savings
Program Requirements; Quality Payment Program; Medicaid Promoting Interoperability Program; Quality Payment Program-Extreme and Uncontrollable Circumstance Policy for the 2019 MIPS Payment Year; Provisions From the Medicare Shared Savings Program-Accountable Care Organizations-Pathways to Success; and Expanding the Use of Telehealth Services for the Treatment of Opioid Use Disorder Under the Substance Use-Disorder Prevention That Promotes Opioid Recovery and Treatment (SUPPORT) for Patients and Communities Act,” https://www.federalregister.gov/documents/2018/11/23/2018-24170/medicare-program-revisions-to-payment-policies-under-the-physician-fee-schedule-and-other-revisions. 5 U.S. Congress, H. R. 1892, https://www.congress.gov/115/bills/hr1892/BILLS-115hr1892enr.pdf.

Copyright © 2019 Society of Actuaries
6
Congress and CMS have continually made small refinements to MACRA since its initial passage to make it easier for many providers to address the significant administrative challenges. Although some of the initial burden has been taken out of MACRA over the last few years, CMS’s goals of stressing value over volume remain firmly in place.
MACRA published studies and commentary to date have primarily focused on providers, with the majority of research addressing the impacts for clinicians. However, our initial investigation into MACRA’s impact on hospitals and health plans has far-reaching implications. MACRA will impact each geographic market and line of business in a unique way, and health plans will have multiple strategic decisions to consider given the changing market dynamics.
As the focus for clinicians moves from volume to quality, hospitals and health plans must also consider the potential implications. Among other impacts, these include the following:
• Indirect impact to Medicare FFS revenues because of utilization reduction pressures
• Potential reduction in Medicare Advantage county benchmark rates
• Potential misalignment of CMS MIPS scores relative to health plan high-performance networks
• Streamlining and harmonizing the metrics for provider performance
• New product offerings
• Additional policy changes
• Potential cost shifting.
There is no one-size-fits-all solution for stakeholders to address these concerns, since quality, competition, provider group composition and demographics vary by location.
The primary intention of this white paper is to provide insight and considerations for the actuarial profession in assessing the potential risk and opportunities of MACRA to both provider and payer organizations. As such, clinicians, hospitals, health systems and health plans will gain a better understanding of the following:
• Financial impacts and risks of MACRA, including both MIPS and AAPM pathways
• Collaboration opportunities across clinicians, hospitals, health systems and health plans
• Implications of MIPS metrics and correlation to Stars, other programs and Accountable Care Organizations (ACOs)
• Implications to provider-payer contracting and relationships.
Health plan administrators will also gain a better understanding of the following:
• Potential friction between provider and health plan relations either caused or amplified by MACRA
• Potential for cascading impact on non-Medicare businesses, similar to implementation of the Stars Rating Program and Diagnosis Related Groups (DRGs)
• Potential for commercial cost shifting and the relationship to each market’s unique characteristics and region

Copyright © 2019 Society of Actuaries
7
• Likely implications to a health plan’s narrow network strategy should clinician MIPS grades not align with the health plan’s inclusion/exclusion performance criteria
• Potential impact on Medicare Advantage profitability if or when county benchmark rates are reduced or trends mitigated as a result of MACRA.
MACRA—Is the Market Ready?
In July 2017, Optum released a market survey for payer and provider decision makers. This nationwide survey included 149 respondents from health insurance organizations, integrated delivery networks and hospitals or health systems and focused on the following objectives:
• Assess health plan and hospital/health system decision makers’ awareness and perception of MACRA
• Gauge organizations’ and clinicians’ readiness to implement MACRA in 2017 and determine what decision makers perceive to be the greatest needs
• Compare knowledge, needs and concerns of health plan and hospital/health system decision makers.
The notable survey results included the following:
• MACRA knowledge and attitudes
o Hospital/health system decision makers most often agree:
▪ Their organization is concerned about potential MACRA changes that may occur under the current federal administration (92%).
▪ Their clinicians are concerned about successfully implementing MACRA (86%).
▪ Their organization is addressing MACRA in silos (86%).
o Also, few hospital/health system decision makers report their organization (19%) and clinicians (14%) were prepared for MACRA in 2017.
o Notably, some hospital/health system decision makers (27%) incorrectly believe all providers can receive positive payments under MIPS; nearly another third do not know.
o Health plan decision makers most often agree their organization:
▪ Is concerned about successfully implementing MACRA (88%).
▪ Is aware of the data, metrics, reporting and other performance management needs required to successfully implement MACRA (88%).
▪ Is addressing MACRA in silos (87%).
▪ Is concerned about potential MACRA changes that may occur under the current federal administration (86%).
▪ Has the right internal governance to act upon the information collected for MACRA (86%).
o Additionally, most health plan decision makers (81%) say there is a lack of harmony between risk, STARS, ACO measures and risk adjustment.

Copyright © 2019 Society of Actuaries
8
• Anticipated impacts of MACRA
o Although MACRA is provider-directed, health plan decision makers anticipate both financial and operational impacts in the near (74% and 79%, respectively) and medium (78% and 85%, respectively) terms. Hospital/health system decision makers have similar perceptions.
o Most health plan decision makers (72%) are concerned with clinician reimbursement rate changes.
o Only 50% of health plan decision makers consider themselves knowledgeable about the financial implications of MACRA.
o Most health plan decision makers (65%) are concerned about the implications of MIPS scores being released in summer 2018.
▪ Note that CMS published the aggregate 2017 MIPS scores on November 8, 2018.6 To date, the individual MIPS scores have been released to the participants, but not to the public.
• MACRA strategy and initiatives
o The majority of health plan (69%) and hospital/health system (64%) decision makers anticipate MACRA will lead to changes in their organization’s strategy.
▪ Approximately one in four health plan and four in 10 hospital/health system decision makers could potentially use support putting the right people, processes and technology in place to accurately collect, report and harmonize efforts between MACRA and risk adjustment.
o A plurality of health plan (31%) and hospital/health system (43%) decision makers most often say MACRA expertise is the most needed/important resource for future MACRA strategy development.
▪ Most health plan (71%) and hospital/health system (65%) decision makers say their organization is likely to work with external partners in the future.
▪ Collaboration between health care providers and health plan organization regarding MACRA efforts and initiatives is important to both health plan (78%) and hospital/health (88%) system decision makers.
o About half (52%) of hospital/health system decision makers report MACRA will have resource/staff implications.
▪ Among these decision makers, the focus is tactical, rather than strategic; only 15% say they need more MACRA strategists as the majority will look for external expertise.
Overall, the common theme among both hospital/health systems and health plans is the concern about succeeding under MACRA and understanding the financial and operational impacts. Those addressing MACRA in silos, whether by product line, department or area of specialty, will need to revisit their overall strategy to a more integrated approach due to MACRA’s overlying reach, and as the market increasingly moves to more provider-payer collaboration to succeed in a value-based health care environment.
6
. “2017 QPP Performance Data Infographic,” Quality Payment Program, Centers for Medicare and Medicaid Services, May 5, 2019, https://qpp-cm-prod-content.s3.amazonaws.com/uploads/276/2017%20QPP%20Performance%20Data%20Infographic%20Final.pdf.

Copyright © 2019 Society of Actuaries
9
Overview and Objectives of MACRA
Passed by large majorities in both houses of Congress, MACRA repealed the Medicare physician sustainable growth rate (SGR) formula, which was largely unpopular among clinicians due to the unpredictability of payment reimbursements on a year-to-year basis. Instead, MACRA explicitly codifies the principles of “value-based care” articulated in the Affordable Care Act (ACA) of 2010 and endorsed by CMS for more than a decade. In simplest terms, it moves the majority of fee-for-service payments to a system based on value and quality of care, which is in alignment with health care transformation in the United States.
The new payment approach, or Quality Payment Program (QPP), will base compensation to providers on patient health outcomes, activities that improve their clinical practices, efficient use of medical resources and the meaningful use of certified electronic health records (EHRs). Providers will be paid either under the MIPS or based on their participation in and adoption of AAPMs, which could have additional revenue implications for individual clinicians. CMS will offer payment incentives for clinicians participating in AAPMs and for those who exceed goals tied to patient outcomes and population health metrics. MACRA provisions offer the potential for improved patient health and more stable updates to Medicare physician fee schedule payment rates. However, a larger percentage of clinician revenue will be at an upside or downside risk.
Furthermore, although there is federal momentum for this shift to value-based payments, it is difficult to predict impacts due to potential new or changing government policies. However, policy makers on each side of the political spectrum have agreed that value-based payment is necessary to contain health care costs. The Bipartisan Budget Act of 2018 provides additional authority to continue the gradual transition to MIPS for three more years, in hopes that the overall direction of fostering collaboration to improve care delivery and population health will continue.
For now, MACRA offers strategic and financial incentives for most health care organizations. Specifically, providers should begin to implement steps toward long-term stability, which could potentially include the following:
• Developing a glide path toward AAPMs: Develop provider and payer partnerships, data management and analytics capabilities, and effective risk modeling.
• Innovating care management: Create or evolve care transition programs, care management strategies and collaborative models for complex patients.
• Managing unit costs: Apply evidence-based practice and proactive clinical management techniques, especially for high-risk patients, to control both internal and external expenses over the long term.
• Integrating technology, data and analytics: Enhancement of data collection; development of advanced analytics, including integration of claims and clinical data, along with social determinants of health; optimization of technology resources and interoperability.
• Using MACRA as a catalyst for growth: Expand patient panels and volume over time to achieve a scale that can be leveraged into future AAPMs and improved provider-patient engagement.
Additionally, health care providers and payers must acquire the capabilities to comply with MACRA operational changes as the impacts become more apparent, potentially exposing them to increased financial risk. Finding the best path to comply with MACRA will afford organizations the stability and freedom to gain market share in the ever-changing health care economy.

Copyright © 2019 Society of Actuaries
10
Industry Transformation
CMS has explicitly articulated a value-based agenda to move the majority of fee-for-service payments to a value and quality basis, continuing a policy direction that began in 2003 with Inpatient Quality Reporting (IQR) (see Figure 1). In January 2015, the U.S. Department of Health and Human Services (HHS) announced goals for Medicare of 30% of payments tied to alternative payment models in 2016 and 50% by 2018 and goals of 85% of payments tied to quality in 2016 and 90% by 2018. HHS met the 2016 goals 11 months ahead of schedule.7 With bipartisan congressional support, and CMS and the Center for Medicare and Medicaid Innovation (CMMI) continuing to introduce more models, including by way of CMS’s “Pathways to Success” Final Rule8 introduced in December 2018 (in which Medicare ACOs will have a limited time to transition into two-sided risk models), movement to AAPMs will be further accelerated. Figure 1 Evolution of CMS Policies
CMS has been driving innovation for 13 years. MACRA is intended to help accelerate the transformation to value-
based care.
Source: Optum
In addition to holding clinicians accountable for performance, MACRA/QPP will accelerate the development of AAPMs that will require providers to:
• Collaborate across the continuum of care
• Bear financial risk for episodes and populations and
• Engage more proactively with the populations in which they are taking on financial risk.
Our research and experience indicates that MACRA regulations seem in line with the health care industry’s move to value-based care. However, potential risks and opportunities for hospitals, clinicians
7 Sandra L. Fryhofer, Meena Seshamani, Karen B. DeSalvo, and Patrick H. Conway, “Progress and Path Forward on Delivery System Reform,” NEJM Catalyst (Oct. 18, 2017),
https://catalyst.nejm.org/delivery-system-reform-progress-path/. 8 Federal Register, “Medicare Program; Medicare Shared Savings Program; Accountable Care Organizations-Pathways to Success and Extreme and Uncontrollable Circumstances
Policies for Performance Year 2017,” https://www.federalregister.gov/documents/2018/12/31/2018-27981/medicare-program-medicare-sharedsavings-program-accountable-care-organizations-pathways-to-success.
Measurement regimes
Incentive for infrastructure development
Payment and delivery reforms
2006 2008 2009 2010 2011 2012 2013 2014 2015 2017 2018
Hospital inpatient quality
reporting (IQR)
CMS ceases paying for hospital- acquired
conditions
Affordable Care Act
Meaningful use incentives
Health
Hospital Value- Based
Purchasing and readmission
penalties
Merit-based incentive
payment system and alternative
payment models
Pathways to Success Program
Physician quality reporting
system
Information Technology for Economic and Clinical Health
Act
First generation of Physician value- First Medicare Shared based modifier performance Savings Program year for MACRA
payments

Copyright © 2019 Society of Actuaries
11
and health systems still exist. For clinicians, there is direct impact to Medicare FFS revenues, significant margin risk, necessary new investments to gather/report measures, EHR meaningful use penalties, market consolidation/mergers and acquisitions (M&A), new product offerings and additional policy changes. Individual clinicians may need to rely on hospital and health system administration for help managing MIPS or AAPM pathways. Providers may consider several potential strategies, such as leveraging an ACO model with Medicare populations, developing AAPMs, creating a reporting analytic management services organization (MSO), assisting in MIPS metric selections and developing/modifying Medicare Advantage (MA) strategies that may reduce Medicare FFS participation.
Overall, an industry transformation is likely following the QPP implementation, encompassing the following changes:
• More Medicare-specific and other-payer ACOs/AAPMs will emerge. Financial models point to AAPMs as the most attractive for clinicians. Because APMs often involve hospitals, health systems and payers as well as clinicians, the QPP will be a catalyst for bringing more of the health care industry under the value-based care umbrella.
• Over the next few years, the market is likely to see more “provider collaboratives” developing risk-bearing ACO models to qualify for AAPM payments by 2020. Collaboratives could join Medicare programs such as the ACO Pathways. In addition, the industry will likely see CMS develop more pathways to AAPMs.
• Health system/clinician alignment and collaboration will continue to grow. Clinicians, especially those in small to midsize practices, will likely look to hospitals and health systems to help them with the QPP. Smaller practices typically don’t have the resources to support the people, processes and technology needed to create or participate in AAPMs or to be successful under the various paths of MIPS.
• Payer support and collaboration are expected to increase. Because providers in AAPMs require timely quality and claims data to be successful, commercial payers are looking to become better partners. This includes improving the sharing of claims data and other intelligence to help provider organizations achieve their goals. Timely and accurate data are key components of value-based care, because data are essential to collaboration and understanding the needs of the population.
• Similarly, providers will need to work with payers to define measurable outcomes. It can be difficult to gain consensus when choosing outcome measures that will be credible to all stakeholders and will make the greatest difference. For example, readmissions seem like an outcome that is easy to define and measure. However, for some tertiary care hospitals with high readmission rates, the more relevant outcome is their ability to keep patients alive who may not have survived had they been treated without the specialized training and technologies afforded to the tertiary care hospital.
• Consolidation will likely continue. Given the QPP’s operational and strategic complexities, it will be burdensome on independent and small practices that see a high volume of Medicare patients. While some will do their best to succeed under the QPP, others may avoid the investment of time and money needed to participate and will instead integrate their practice into a larger organization that can support these requirements.
• Medicare Advantage (MA) plans may see greater clinician engagement. The QPP, specifically MIPS, is a requirement under Medicare FFS only. Medicare Advantage may serve as a haven from MACRA because MA doesn’t fall under MIPS. CMS doesn’t adjudicate MA claims (clinicians are paid by MA contractors, not directly by Medicare), so CMS can’t measure clinician performance. Therefore, clinicians who see a high percentage of MA patients may not meet the minimum

Copyright © 2019 Society of Actuaries
12
standards for participation in the QPP. Clinicians who are hoping to avoid MIPS reporting requirements may shift their focus to MA. Alternatively, an MA AAPM can assist clinicians in meeting the qualified participant threshold required for the 5% bonus payment under AAPM’s for the Other Payer scenarios in 2019 and later. This is discussed in the following sections.
Choosing a MACRA Path
Although MACRA’s provisions focus primarily on Medicare clinician reimbursement, the law has implications for the entire health care industry. Clinicians, facilities, health systems and payers will need to work together to determine the best course of action. For instance, among other decisions, stakeholders will need to adjust short- and long-term strategies and resource allocations in response to MACRA’s new requirements, as well as determine how their competitors are reacting to MACRA and its effects on their organizations. Finally, health care leaders will need to evaluate what near-term tactical decisions are required to be successful. To understand MACRA’s reach, it is critical to understand what it is designed to do currently and in the future. The law authorizes the QPP for providers, which offers two pathways described in detail below: MIPS and AAPMs.
MIPS
MIPS is a measurement-based regime, which consolidates the three CMS existing programs (Physician Quality Reporting System [PQRS], Value Modifier [VM], Meaningful Use [MU]) into a single, metric-driven track. Eligible professionals will be measured on quality, resource use, clinical practice improvement and the ability to capture and share health information. However, the reporting demands of MIPS could be onerous, and MIPS metrics aren’t likely to significantly accelerate or improve the delivery of value- based care.
MIPS does present certain significant challenges. For instance, Medicare intended the MIPS payment program to be a zero-sum game (outside of the exceptional performer bonus pool), meaning that positive payment adjustments will require taking revenue from other participants via reduced fee schedules. Providers who choose MIPS can’t predict with certainty whether they will gain or lose revenue, because fee schedule adjustments will be determined by the relative performance of all clinicians in the MIPs program.
Meanwhile, mirroring the limited scope of current performance measures, MIPS primarily incentivizes behavior. Clinicians will be scored in varying degrees over the next several years on resource use, clinical practice improvement, EHR utilization and quality. However, scoring weights will change in the future. For example, quality measures comprise 60% of the standard MIPS score in the 2017 reporting period, but this percentage will decrease with the corresponding increasing weight on the resource use measure to 30% by the 2020 performance year (see Figure 2). Further discussion of the specific MIPS measures can be found in the Appendix, Exhibit 1.

Copyright © 2019 Society of Actuaries
13
Figure 2 MIPS Measure Weights
Source: Optum
Additionally, MIPS performance outcomes may be quite punitive. As the program is currently structured, its performance target score resets every year, meaning that past performance will be no guarantee of future success. Clinician groups that aren’t improving as fast as their peers will be further disadvantaged in the fee schedule adjustments in subsequent reporting periods. Because MIPS will generate both winners and losers in terms of provider reimbursements, it will lead to competition on performance metrics. This type of structure has inherent limitations, and although MIPS will include a measure of resource use in future years, it won’t necessarily drive down the overall cost of care because it is simply a measurement-based regime, lacking the financial incentives of a value-based care program.
Figure 3 MIPS Scoring Part B physician fee schedule adjustments will be based on MIPS CPS. Low performing physicians will be compensated at a lower rate.
Source: Optum

Copyright © 2019 Society of Actuaries
14
MIPS Performance Scores
Scores for each of the four MIPS components (Quality, Resource Use, Advancing Care and Clinical Practice Improvement Activities) are combined into a single composite performance score (CPS), and compared against the Performance Target (PT) to determine the Part B fee schedule adjustment. For 2017 and 2018 transition years, the PT was set at 3 and 15, respectively. Based on the Final Rule for Year 3 recently released, the PT for 2019 is to be set at 30. Until further rule changes are introduced, it is assumed for 2020 and subsequent years that CMS will set the PT based on the mean or median of all CPS scores (as defined by regulation), with those above the PT receiving positive fee schedule adjustments, and those below receiving negative adjustments.
The MIPS fee schedule adjustments begin at ±4% for 2017, and will increase to ±9% through 2025 (see Figure 4). These adjustments are to remain budget neutral, with the positive payments for high performers offset by the negative payments for low performers. For the transition years, the top end of the payment range is expected to be closer to 1%.9 This is due to the combination of budget neutrality and the low PT resulting in a smaller pool of “negative offsets” available, that is, a small penalty pool = a small bonus pool. Note that these adjustments reset each year and are not cumulative. Beginning in 2026, there will be an additional fee schedule adjustment of 0.25% per year.
MIPS also offers an “exceptional performer” (EP) bonus payment, which is capped at $500 million. The adjustment can vary from 0.5% to 10% based on available funds.10 For the 2017 and 2018 transition years, the EP target was set at 70. The Year 3 Final Rule sets the 2019 EP target at 75. For subsequent years, the EP target will be based on the top 25th percentile performers.
Figure 4 Part B Fee Schedule Adjustments
Source: CMS
The fee schedule adjustments for a payment year will be based on performance for the two years prior. For instance, for 2019, the adjustment is based on 2017 performance scores. The adjustment is applied to the clinician’s Part B fee schedule payments from CMS beginning January 1 of the payment year and is applied at the NPI level. This means that if all clinicians participated, theoretically there could be 1.5 million varying clinician fee schedules.
To succeed in MIPS, a clinician must be a consistently high performer as compared to his or her peers.
9 Based on the 2017 aggregate results released on November 8, 2018, the top end of the range was 0.2%, as 93% of participants received a positive score. 10 Based on the 2017 aggregate results released on November 8, 2018, the top end of the EP adjustment was 1.68%.
Copyright © 2019 Society of Actuaries
15
In addition, a MIPS APM, such as a Medicare Shared Savings Program (MSSP) Track 1 or Medical Home Model (MHM), can qualify for special scoring. MIPS APM measure weights are 50% Quality, 20% Improvement Activities (IA) and 30% Advancing Care. There is no additional reporting requirement because MIPS will use the APM Quality measures already reported via the program, and participants also receive full credit for the IA category.
CMS has indicated that MACRA will be implemented iteratively, with new provisions introduced in the upcoming years. Speculation suggests that those new iterations of the QPP will continue to encourage providers toward AAPM structures. For providers who aren’t exempt from MACRA, participating in MIPS should be considered only a short-term solution. Providers should not focus only on MIPS success; instead, they should also position themselves on a glide path toward participation in an AAPM.
For providers, the QPP is likely to be the tip of the iceberg. While MIPS may seem to be a reporting regimen, it may also reasonably be viewed as a training ground for the reporting and collaboration required under AAPMs. MIPS may be the easiest and most lucrative option for high-performing groups in the short term, but the direction of Medicare is clear: the federal payer of health insurance for senior citizens is increasingly about risk and reward in regard to quality and cost efficiency performance, with AAPMs offering the greatest odds for long-term financial success.
AAPMs
AAPMs are value-based payment programs authorized by the ACA to pay for care given to Medicare beneficiaries. These include ACOs that involve two-sided risk models offering not only the potential for increased payment for improving quality and containing costs, but also potential downside penalties for failing to achieve financial and quality targets.
AAPM requirements are more influential. In addition to incentivizing high performance and penalizing poor performance, AAPM structures encourage providers to collaborate across the continuum of care, bear financial risk for episodes and populations, and more proactively engage patients.
An AAPM is defined in the MACRA regulation as “a model under section 1115A of the Social Security Act (the Act) (excluding a health care innovation award), the Shared Savings Program under section 1899 of the Act, a demonstration under section 1866C of the Act, or a demonstration required by federal law.” An AAPM model must meet several criteria, including use of Certified Electronic Health Record Technology (CEHRT), require payment based on quality measures and involve financial risk. For the last, the AAPM must meet the General Nominal Amount Standard, meaning the total amount of risk must be equal to at least either 8% of the average estimated total Medicare Parts A and B revenues or 3% of the expected expenditures for which the Alternative Payment Model (APM) entity is responsible. There are separate requirements for MHM.
Examples of AAPM models include MSSP Track 2, MSSP Track 3, Medicare ACO Track 1+, Next Generation ACO, MHM, CPC+, BPCI-Advanced and ACO Pathways to Success Basic E and Enhanced. Models that do not meet the criteria include MSSP Track 1, Bundled Payments for Care Improvement (BPCI), Comprehensive Care for Joint Replacement (CJR), ACO Pathways Basic A–D and other one-sided risk programs.
The AAPM track offers a 5% bonus to the AAPM entity based on Part B revenues for 2019 to 2024 payment years (2017–2022 performance years) if all defined criteria is met. In addition, for 2026 and subsequent years, the AAPM clinicians will also receive an annual Part B fee schedule increase of 0.75% (see Figure 4). The 5% bonus for a payment year is based on the Part B revenue from the preceding year.

Copyright © 2019 Society of Actuaries
16
For instance, for payment year 2019, the calculation is based on 2018 revenue and will be paid before the end of 2019.
In addition to meeting the defined criteria, participating providers must also meet a revenue or patient threshold requirement in the AAPM for Qualified Participant (QP) status under these models each year to receive the 5% bonus payment based on their Part B revenue. AAPMs that do not meet the thresholds will automatically default to MIPS. The threshold increases each year. For 2017 and 2018, only the Medicare Option is available, with a QP defined as having at least 25% of Part B revenue (or 20% of patients) to attributed beneficiaries. In performance year 2019, the All-Payer Option is introduced, in which QP status is based on both the (lower) Medicare threshold, and another threshold based on the combined Medicare APM and Other Payer APMs (e.g., private payers, Medicaid).
An AAPM may alternatively qualify as a partial QP under the Medicare Option, with a 20% revenue (10% patients) threshold for 2017 and 2018, but will not be eligible for the 5% bonus. Similar thresholds are introduced in 2019 for the All-Payer Option. Partial QPs have the option to participate in MIPS, but participation will most likely only be considered for high performers who would receive a positive fee schedule adjustment. The specific QP thresholds are outlined in the Appendix, Exhibit 2.
For a clinician to be considered a qualifying APM participant, he or she must be included on the AAPM participant list for any one of three snapshots during the QP performance period (January–August), which are March 31, June 30 and August 31.
Transitioning to AAPM
Most organizations will likely start with the MIPS option unless they are already participating in an APM but will need to efficiently determine how to successfully transition to an AAPM moving forward, as MIPS will likely present increasing risk exposure after the transitional years. For example, becoming an AAPM requires organizational culture and operational changes that will tie clinical operations to quality of outcomes and the ability to manage total cost of care under an ACO or total episodic spending under BPCI-Advanced. This could include embracing telemedicine or other new enabling technologies. Other changes include implementing risk stratification and providing proactive care to patients at greatest risk for high utilization or poor outcomes. Provider organizations will need to assess their market to determine which lines of business they need to emphasize, evaluate how much risk they can bear based on their current outcomes and utilization, and gauge the readiness of their clinical infrastructure.
Based on this assessment, provider organizations should develop a transition strategy based on the type of AAPM that best fits the organization and its strategic objectives. Then organizations will need to identify the steps required and resources needed to adopt the AAPM model, which will likely require a clear understanding of the direction and movement of the health care industry. Finally, organizations will need to conduct ongoing performance management to ensure an uninterrupted track toward adopting AAPM requirements and to ensure exceptions are addressed and risks are mitigated.
Transitioning from MIPS to AAPMs will require sustained effort and specific capabilities within provider organizations. Actuarial and analytics expertise is necessary to provide an accurate picture of current and future financial risks. Experts in value-based care will help providers choose the best paths for a sustainable solution. Meanwhile, population health expertise is required to assist organizations manage both clinical and financial risks over time.

Copyright © 2019 Society of Actuaries
17
As noted earlier, one of CMS’s implicit priorities is incentivizing providers to collaborate across the entire care delivery chain. Most organizations require collaborative relationships to develop and establish the skills, standards, policies and scale necessary to succeed in AAPM models. While MIPS can be pursued alone, AAPMs will likely require partners that can help each other to accomplish the following:
• Aggressively pursue population health and quality initiatives to boost patient engagement: Excellence in population health management (PHM) is the key to success in both upside and downside financial risk models. A high-performing PHM function is preferable and will support providers as they integrate with additional care resources for those patients who have the most needs. With high-performing PHM capabilities such as care management programs, community outreach programs, and quality improvement efforts, patient engagement and outcomes will improve.
• Focus on improving care delivery and care transitions: Focusing on care coordination across the continuum of care, from ambulatory to post-acute, will pay dividends. Clinical collaboration across care settings will help establish best practices and information sharing to enable the “right” care to be performed in the “right” setting at the “right” time.
• Lead the market in cost performance: To qualify for shared savings or succeed in a capitated arrangement, organizations need to perform on both quality and cost measurements. Focus should be on cost improvement by establishing evidence-based practice, driving down variation in care, implementing telemedicine and proactively managing high-risk patients. This will drive down costs while also improving quality of care.
• Widely integrate technology, data, analytics and operational assets: While having the appropriate technology and assets is important, making the critical outputs from these assets available across multiple provider and payer organizations will help transform care delivery.
• Obtain the tools and expertise necessary to enable the transformation: An initial assessment of value-based care requirements and readiness will help providers understand their current capabilities as well as their current weaknesses regarding value-based transformation. Based on the assessment, providers need a plan for obtaining the necessary people, processes and technology to enable their transformation.
For many providers, this is not business as usual, and blind spots can limit opportunities for improvement. Most providers have not developed the required advanced actuarial and financial expertise to help assess and manage QPP risk exposure. However, accessing this type of expertise can help organizations predict and manage risk, leading to more favorable and predictable performance results. Experienced actuaries can offer sharper understanding of risk exposure and help develop strategies for managing risk now and in the future.
Meanwhile, many provider organizations are limited in the data to which they have access, making it difficult to prioritize population health initiatives to optimize care delivery transformation. Gaining access to industry benchmarks and integrating data across organizations will help providers evaluate and target where to invest for the best market position and the greatest financial return. Finally, some providers may be unclear on where and how they need to enhance specific capabilities. Gaining an outside perspective on where to concentrate efforts and resources toward building an AAPM can give providers the roadmaps and associated metrics they need to help acquire and utilize the right capabilities.

Copyright © 2019 Society of Actuaries
18
MACRA—What Does This Mean to Providers?
Provider Reactions and Implications
Clinicians are at the center of MACRA and its ramifications, yet the law has put many of them in a difficult position. Since the ACA was passed, value-based care has been positioned as a beneficial idea rather than a requirement. However, CMS put the weight of law behind value-based care for most clinicians, increasing the urgency of care delivery transformation due to increasing incentives and penalties. Like most transformations, however, moving from a volume to value payment policy will come with significant challenges.
For clinicians, the challenges associated with MACRA stem from more than just transforming care patterns; there are financial considerations as well. MACRA, like the SGR before it, doesn’t increase at an annual rate that is historically consistent with overall health care spending. While its effects aren’t likely to be nearly as significant to a clinician as the SGR’s prescribed methodology, Medicare fee-for-service revenues in inflation-adjusted dollars may not keep up with increasing costs in the short term. MACRA is intended to bend the cost curve and reduce the underlying health care spending rates, but this will come over time. So regardless of which path clinicians choose, the revenues for only the highest performing clinicians will be above inflation for the near future.
Figure 5 Medicare FFS Margin Contribution Impact
Source: Optum

Copyright © 2019 Society of Actuaries
19
Provider organizations will have pathways to succeed in the QPP; however, these will be limited. These choices may include the following:
• Shift from traditional fee-for-service to Medicare Advantage. Under MACRA, providers still do have choices. For instance, some clinicians may limit the number of fee-for-service beneficiaries they see, replacing those patients with either Medicare Advantage or commercial patients. Clinicians are exempt from MIPs if they are newly enrolled in Medicare, do not meet minimum Medicare volume thresholds (fewer than 200 patients or less than $90K in revenue for 2018+) or are a QP or partial QP in an AAPM. These clinicians will not receive a fee schedule adjustment for each year they are exempt.
• Consolidate smaller practices or shift to employment-based model. Clinicians may join a Virtual Group for MIPS reporting in 2018 and beyond. Alternatively, clinicians may choose to join a larger practice or health system. While neither of these pathways will absolve them from the reporting requirements or the need to transform care delivery, it can allow access to the resources that larger organizations typically employ. Some organizations will provide clinicians with a pathway to AAPMs, ensuring that revenues stay more consistent and putting clinicians on a fast track to value.
• Collaborate with payer partners. Finally, clinician organizations may choose to join an AAPM or start their own. While most independent practitioners will not likely have the resources to establish an APM, they may partner with organizations that can invest the finances necessary to do so. Larger providers with more mature capabilities related to value, such as reporting experience and participation in risk programs, are more likely to be successful in an AAPM.
To understand the QPP’s impact and develop the best short- and long-term strategies, provider organizations need to consider their ability to manage risk and prioritize investments over the next few years. To understand the business risks and choose the best QPP path for 2019 and beyond, clinician groups need to develop and deploy financial models. A common starting point could be an initial assessment of current and future financial position and risk exposure, which would help enable providers to understand how various options affect their risk and project financial impacts. Provider organizations should do the following:
• Consider how to distribute, manage and optimize resources across payer and contract types.
• Review revenue distribution by payer and identify potential areas for renegotiating reimbursements from payers to offset FFS margin erosion.
• Identify, via transparency of preferable MIPS scores, potential areas to drive recontracting and membership growth.
Of course, MACRA has implications beyond just revenue, including the models providers and payers use to conduct business and provide care for patients.
It would be easy for hospitals to dismiss MACRA as a clinician problem or for health systems to relegate the necessary changes and adjustments to their clinician group leadership. However, MACRA will change the way clinicians practice and the way they refer patients, which will have a direct impact on hospital admissions and revenues. Because clinician referrals are critical to a facility’s bottom line, health systems should use the opportunity MACRA provides them to become more valuable partners with clinicians and connect providers across the continuum of care (e.g., ambulatory, acute, post-acute and rehabilitation).
Copyright © 2019 Society of Actuaries
20
Many clinicians may rely on health systems for assistance in complying with whichever payment pathway they choose. Buying individual practices is one path some health systems could potentially take to help providers deal with the QPP. A larger organization could scale its administrative infrastructure, relieving the clinicians of some administrative duties, thus allowing providers to focus on clinical improvement.
Health systems that aren’t on a path to acquisition have other, sometimes better, choices. If working with clinicians who are content with MIPS, health systems can use their administrative assets to create a managed-services organization that will take care of MIPS reporting and other functions. Providing such an option will give clinicians valuable assistance to promote greater loyalty and establish or strengthen referral relationships.
Setting up an AAPM takes capital and capabilities that many individual clinician organizations don’t often possess. Larger health care facilities, on the other hand, may possess some of the functions necessary for AAPM success, including the following:
• Population health management (PHM) applications that include clinical and claims data and
sophisticated analytics
• High-risk care management programs
• Tools that enable clinical integration and collaboration across care settings, including settings external to the system
• Community outreach programs.
Developing relationships with new provider groups will be important for facilities, because MACRA, and value-based care in general, creates further implicit emphasis on growth. One of the ways value-based models keep costs down, for instance, is by structuring care to prevent hospitalizations. Under AAPM models, reducing the number of patients in hospitals is rewarded, since higher bed occupancy can lead to higher overall health care costs and could expose provider organizations to value-based care losses. The key in this equation is for facilities to expand the base of patients for whom they are responsible. By doing this, hospitals can backfill the empty beds created by gains in efficient care delivery, managing to keep per capita spending lower and maintaining overall revenues. By expanding relationships with both new and existing provider organizations, hospitals will be drawing referrals from a broader space, which also leads to new relationships with payers.
Despite the many challenges of participating in MIPS or an AAPM, clinicians, hospitals and even payers can have positive outcomes due to MACRA with careful planning and strategy. While there is no single surefire strategy that will guarantee a win or loss, health care stakeholders must understand the potential financial implications of each pathway. We begin with a discussion of potential revenue implications for clinicians in the following section.
Revenue Implications
Predicting performance under MIPS is difficult since performance bonuses in MIPS will be based not only on how well a provider performs but also on comparisons to other providers. The performance bonus bar is likely to rise as the program matures and providers improve. As the performance target resets each year, if a provider doesn’t improve at a rate consistent or better than others, this could result in lower MIPS adjustments in later years.

Copyright © 2019 Society of Actuaries
21
Uncertainty surrounding MIPS payment adjustments and the relatively small adjustments that most providers will receive due to the transition years will likely influence providers to realize that MIPS is not likely the preferred long-term solution. However, MIPS is the path of least resistance for clinicians who are already reporting in PQRS, VM and MU. In the short run, these clinicians may not consider AAPMs to be a more attractive option. That perspective could shift in the future, especially as overall MIPS performance scores improve and it becomes more difficult to achieve bonuses. For most clinicians affected by the QPP, MIPS should be just a starting point or an interim strategy. In the long run, AAPMs are a more stable and progressive long-term option. AAPMs reward ongoing, incremental improvement year over year in a way that MIPS doesn’t. To succeed, AAPM models require that providers establish standard practices to reduce variation in care. MIPS, on the other hand, does not reinforce all of the requirements other payers are expecting of providers.
As QPP clinician reimbursement impacts become more apparent and impactful, the more favorable incentives will likely draw additional providers and group practices to seek qualification status under an AAPM. In the 2024 payment year, the market will likely see about half of providers in the QPP qualify for AAPM status and thus receive performance bonuses in the 5% range. The other half will remain in MIPS seeking to reap the performance rewards up to a 9% positive fee schedule adjustment and potential exceptional performer bonus or enduring the performance penalties, which can be up to a 9% negative adjustment. However, given that CMS continues to make iterative changes to the performance targets for MIPS, it is highly likely that a performance target set at less than median or mean scores will result in a much lower adjustment, as we have seen for performance year 2017.
Figure 4 illustrates the range of potential adjustments via the QPP through 2026. It should be noted that the EP bonus for MIPS and the 5% AAPM bonus are written into the legislation only through 2024. This makes 2025 a pivotal year, when a convergence of these policy factors may significantly reduce the payments to clinicians, unless addressed within the federal health policy legislative agenda.
Scenario Modeling
To illustrate potential implications under the QPP, Optum developed a financial projection model, for educational purposes, whereby a group of providers or an ACO can estimate QPP payments and revenue streams based on current QPP status (i.e. traditional FFS, APM, AAPM). The educational model will compare changes in revenue for shifting to an AAPM with the qualifying 5% bonus; or conversely, if currently an AAPM, compare the impact of shifting back to MIPS. The Excel-based provider revenue model is provided with this white paper. The educational model allows testing of a wide variety of scenarios and includes tabs with instructions and a description of the underlying assumptions. The model user should be familiar with the QPP program and concepts.
For purposes of this white paper, we will review two scenarios: a provider group reporting under MIPS, and an MSSP Track 1 (MIPS APM), both transitioning to AAPM status.
Scenario 1: MIPS to AAPM (Low Performer)
Assume a physician group with annual revenue in 2017 of $10 million in the early stages of adopting value-based care contracts; this group therefore must report under MIPS. The group has 6,000 members, split into 50% for each of Medicare FFS and other payer non-AAPM. The revenue split is 40% Medicare FFS and 60% other. We will assume a 1% annual growth rate per year across all lines of business (LOBs).

Copyright © 2019 Society of Actuaries
22
For the baseline scenario, MIPS scores for 2017 and 2018 will be 18 for Quality, 20 for Practice Improvement, 50 for Promoting Interoperability and 3 for Resource Use, for a CPS score of 38. For subsequent years, Quality is 36, Practice Improvement 40, Promoting Interoperability 50 and Resource Use 3, for a CPS score of 54.5. These scores assume the group is on par with peers, but not showing any substantial improvements in each of the categories, and will not meet the threshold for the exceptional performer bonus. For the shift to AAPM scenario, let’s assume this group transitioned 50% of its Medicare FFS members to an AAPM in 2020, in which they would meet the QP threshold and receive the 5% bonus. For simplicity, we assumed 0% upside/downside risk revenues/liabilities will be earned.
The full details of the model can be found in the Appendix, Exhibit 3a.
First, let’s see how the Medicare FFS payment adjustments compare under the two scenarios (see Figure 6a). Figure 6a Scenarios for Medicare FFS Payment Adjustments
Source: MACRA provider model, Charts Performance tab
For this group to receive positive MIPS payments for 2022, this provider group must continue to improve its scoring for each of the categories and capitalize on any available bonus points. Should this group transition to an AAPM in 2020, it would meet the QP threshold, and payments for 2022 through 2024 would reflect the 5% bonus payment. Note that as the regulation is currently written, the 5% bonus is not available after 2024.
Translating this into FFS revenue impact, we see the charts in Figure 6b.
Figure 6b Scenarios for Projected Medicare FFS Revenue
Source: MACRA provider model, Charts Rev & Margin tab
200
($50)
$0
$50
$100
$150
$200
2018 2019 2020 2021 2022 2023 2024 2025 2026
Revenue at Risk (000) - Baseline
MIPS AAPM
$0
$50
$100
$150
$200
2018 2019 2020 2021 2022 2023 2024 2025 2026
Revenue at Risk (000) - Shift to AAPM
MIPS AAPM
Copyright © 2019 Society of Actuaries
23
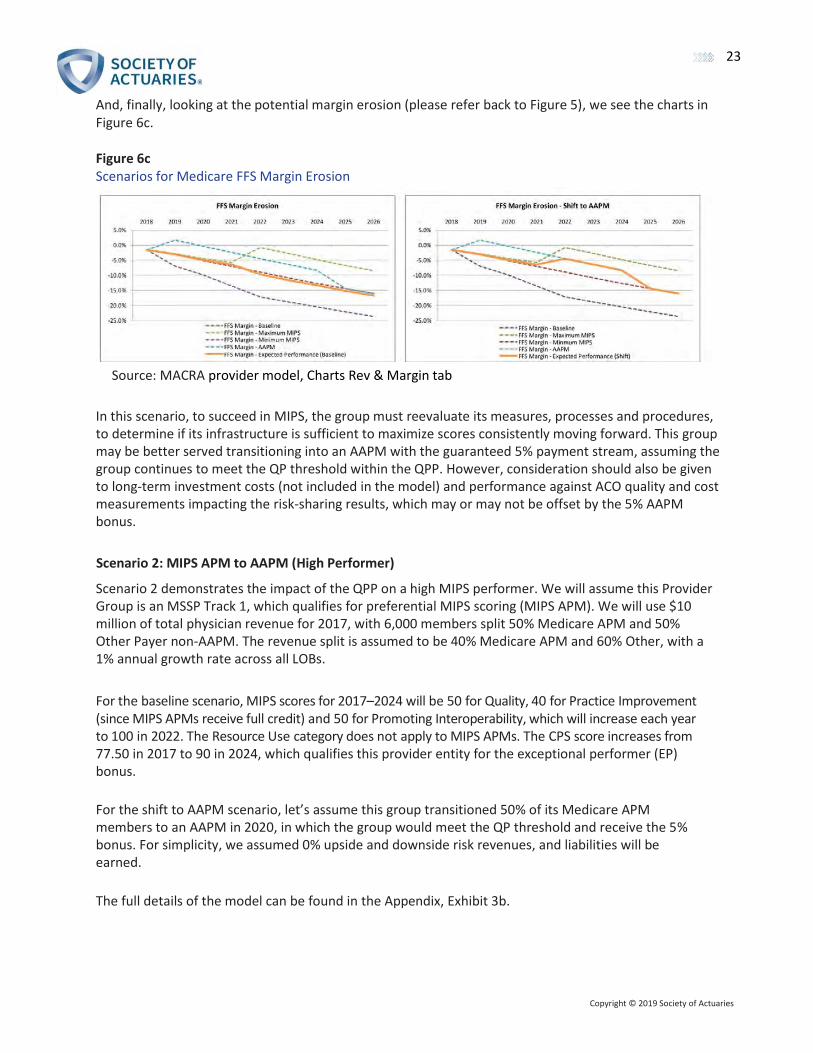
And, finally, looking at the potential margin erosion (please refer back to Figure 5), we see the charts in Figure 6c.
Figure 6c Scenarios for Medicare FFS Margin Erosion
Source: MACRA provider model, Charts Rev & Margin tab
In this scenario, to succeed in MIPS, the group must reevaluate its measures, processes and procedures, to determine if its infrastructure is sufficient to maximize scores consistently moving forward. This group may be better served transitioning into an AAPM with the guaranteed 5% payment stream, assuming the group continues to meet the QP threshold within the QPP. However, consideration should also be given to long-term investment costs (not included in the model) and performance against ACO quality and cost measurements impacting the risk-sharing results, which may or may not be offset by the 5% AAPM bonus.
Scenario 2: MIPS APM to AAPM (High Performer)
Scenario 2 demonstrates the impact of the QPP on a high MIPS performer. We will assume this Provider Group is an MSSP Track 1, which qualifies for preferential MIPS scoring (MIPS APM). We will use $10 million of total physician revenue for 2017, with 6,000 members split 50% Medicare APM and 50% Other Payer non-AAPM. The revenue split is assumed to be 40% Medicare APM and 60% Other, with a 1% annual growth rate across all LOBs.
For the baseline scenario, MIPS scores for 2017–2024 will be 50 for Quality, 40 for Practice Improvement (since MIPS APMs receive full credit) and 50 for Promoting Interoperability, which will increase each year to 100 in 2022. The Resource Use category does not apply to MIPS APMs. The CPS score increases from 77.50 in 2017 to 90 in 2024, which qualifies this provider entity for the exceptional performer (EP) bonus.
For the shift to AAPM scenario, let’s assume this group transitioned 50% of its Medicare APM members to an AAPM in 2020, in which the group would meet the QP threshold and receive the 5% bonus. For simplicity, we assumed 0% upside and downside risk revenues, and liabilities will be earned.
The full details of the model can be found in the Appendix, Exhibit 3b.
Copyright © 2019 Society of Actuaries
24
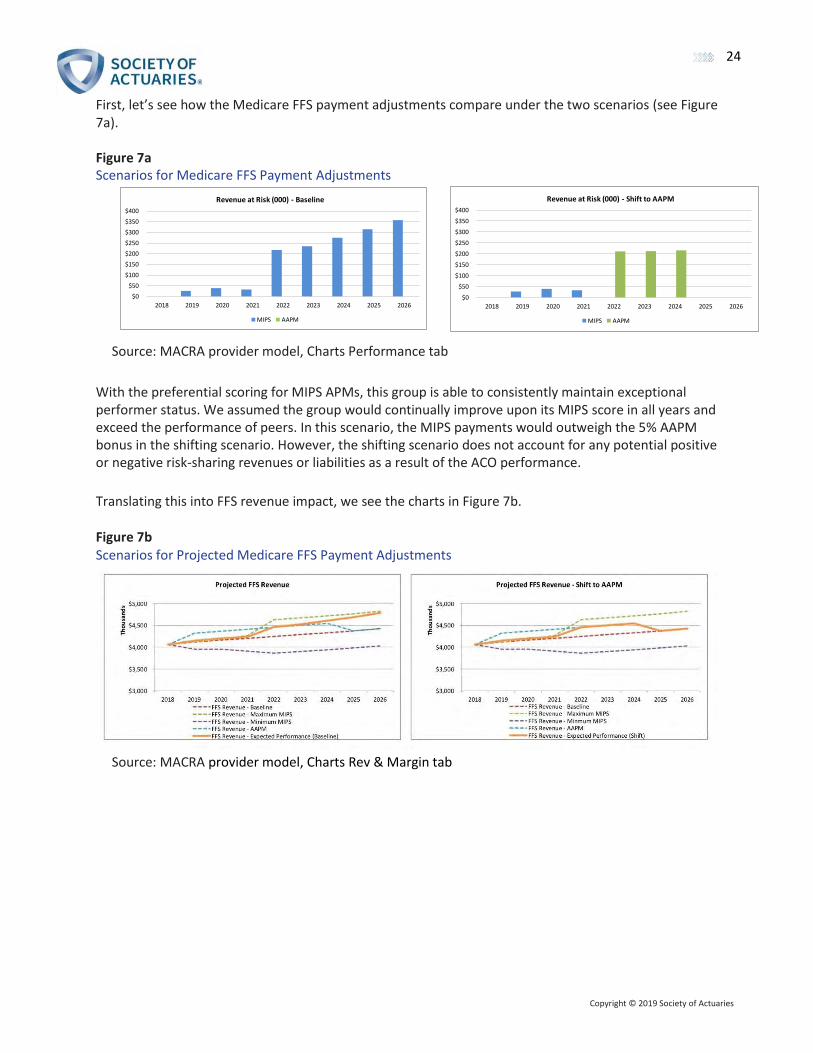
First, let’s see how the Medicare FFS payment adjustments compare under the two scenarios (see Figure 7a).
Figure 7a Scenarios for Medicare FFS Payment Adjustments
Source: MACRA provider model, Charts Performance tab
With the preferential scoring for MIPS APMs, this group is able to consistently maintain exceptional performer status. We assumed the group would continually improve upon its MIPS score in all years and exceed the performance of peers. In this scenario, the MIPS payments would outweigh the 5% AAPM bonus in the shifting scenario. However, the shifting scenario does not account for any potential positive or negative risk-sharing revenues or liabilities as a result of the ACO performance.
Translating this into FFS revenue impact, we see the charts in Figure 7b.
Figure 7b Scenarios for Projected Medicare FFS Payment Adjustments
Source: MACRA provider model, Charts Rev & Margin tab
400
$0
$50
$100
$150
$200
$250
$300
$350
$400
2018 2019 2020 2021 2022 2023 2024 2025 2026
Revenue at Risk (000) - Baseline
MIPS AAPM
$0
$50
$100
$150
$200
$250
$300
$350
$400
2018 2019 2020 2021 2022 2023 2024 2025 2026
Revenue at Risk (000) - Shift to AAPM
MIPS AAPM

Copyright © 2019 Society of Actuaries
25
And, finally, looking at the margin erosion (please refer back to Figure 5), we see the charts in Figure 7c.
Figure 7c Scenarios for Medicare FFS Payment Margin Erosion
Source: MACRA provider model, Charts Rev & Margin tab In this scenario, it appears the provider group would be better served staying in the Track 1 ACO for the longer term, assuming it can maintain consistently high MIPS scores. However, the “Pathways to Success” rule must be considered, because the ACO will be forced to transition from Track 1 into a two-sided risk model or opt out of the ACO program and report under MIPS. If it opts out, the ACO will lose the MIPS APM preferential scoring, and the clinicians will be subject to the MIPS performance score methodology where individual clinician fee schedules will be adjusted based on the clinician performance compared to his or her peers.
As demonstrated, the model can be used to test a wide variety of scenarios for projected financial impact. The user must keep in mind the reasonableness of assumptions used, along with any subsequent CMS or CMMI regulations introduced after the date of publication.
As described, CMS continues to pursue value-based reimbursement with its investment in quality reporting programs, its development of alternative payment models and its willingness to promote provider success. With CMS taking the lead, private payers are following. The impact on payers, by market and lines of business, will be explored in the subsequent sections of this white paper.
MACRA’s Impact on Payers
While MACRA is largely directed at providers serving Medicare FFS members, its indirect impact will cross all lines of a payer’s business: Medicare, Medicaid and commercial. However, whether MACRA will ultimately have the same impact of some of its predecessor CMS programs such as DRGs, risk adjustment and Star ratings remains unknown. Meanwhile, MACRA continues CMS’s objective of stressing value over volume within the economics of the health care system.
One direct impact of MACRA will affect the Medicare Supplement market. One of the most popular plans, Plan F, offers the most comprehensive coverage of the 10 Medicare Supplement plans. Beginning January 1, 2020, Plan F, which covers the Part B deductible and Part B excess costs, will no longer be available to new enrollees. The downstream impact of MACRA has direct implications for payers related to their MA plans as well as Medigap or Medicare Supplement plans designed to augment members’ traditional FFS coverage.

Copyright © 2019 Society of Actuaries
26
MACRA is in its early stages, but its downstream impact is quickly becoming a reality for payers. Currently, the primary payer concerns include the following issues:
• How will we process, in theory, more than one million unique provider fee schedules?
• Will our brand reputation take a hit if our narrow network providers have below-average
MIPS scores?
• How are our payments to providers, and cost to customers, impacted since they are expressed as a percentage of Medicare reimbursement?
• Will our concerns over MACRA reporting erode our gains in value-based care?
• When, in what counties and by how much are the MA benchmark rates likely to decrease?
• How will the distribution of members across our Medicare plans be impacted, and what will be the change in the underlying mix of risk?
Variation of MACRA’s Impact by Payer and Geography
MACRA’s financial impact to payers is dependent on numerous variables, including market competitiveness by line of business, coding and documentation accuracy capabilities, clinical quality, value-based care sophistication and MA plan penetration, to name just a few. These factors vary significantly by both geography and payer and will result in the magnitude of MACRA’s impact to vary by geography and payer as well.
The key variables to begin an assessment of a market from a given payer’s perspective include the following:
• County Risk Score
• County MA penetration rate
• County benchmark rate
• County Star rating
• Number of MA plans with more than 5% market share
• Number of MA plans charging a monthly premium more than $20
• Number of MA plans charging a $0 monthly premium
• Percentage of dual eligibles within a market
• Percentage of population age 65 or over
• One-payer–dominated market (50%+)
• Value-Based Care maturity.

Copyright © 2019 Society of Actuaries
27
The maps in the Appendix, Exhibit 5 are designed to help visually identify counties that may be more impacted by MACRA than others. For example, counties that have strong MA penetration rates, above-average Star ratings, and above-average coding and documentation have traits and performance that reflect mature value-based care markets. Many payers in these markets are less likely to be impacted by MACRA than payers operating in less mature markets because less transformation is required. MACRA, from a provider reimbursement perspective, is a zero-sum game, with variables such as risk adjustment designed to be budget neutral to CMS. Thus evaluating the outliers across key variables may provide insights regarding the specific counties where an actuary may be asked to evaluate the potential impact of MACRA. The maps in Exhibit 5 and the corresponding cross sections of the maps leverage the following variables:
• County benchmark rates (stratified by quartiles)
• Composite risk adjustment factors by county
• Star ratings by county
• MA plan penetration rate by county.
While many counties may be minimally impacted by MACRA, the financial impact to rates within some counties may be plus or minus a few percentage points to the CMS county benchmark rate. For example, the intersection in a given county between a low-risk adjustment score and a Star rating would be less than 4. Indirectly, this relationship may allow providers in that county to have significant opportunities to improve their coding and documentation accuracy. Stars and risk adjustment scores may be good indicators as to whether providers have the discipline and resources to code and document accurately. Those who perform well in these areas may be more likely to score better in MIPS. From this one simple point, the cascading impact of MACRA across lines of business can begin. Regardless of the line of business, many payers express their provider reimbursements as a percentage of Medicare, which may impact not only Medicare Supplement and Medicare Advantage plans, but also many commercial plans as well. In theory, roughly 1.3 million unique fee schedules are required. Practically, CMS excludes providers who participate in an AAPM, have a low volume of Medicare FFS patients or are new to Medicare. It is difficult to estimate this number exactly, but the consensus appears to be that 500,000 to 700,000 physicians will initially be subject to MIPS. Furthermore, direct provider reimbursement may be impacted, but potential cost-shifting efforts are also likely among providers concerned their MIPS scores may be lower than the majority of their peers’ scores.
MIPS reporting requirements may be resource intensive for all providers. For those providers wanting to improve coding and documentation accuracy as a way to increase their MIPS scores, the challenge is even greater. Depending upon incentives, providers may divert efforts away from private payers’ quality and value-based care programs, thereby putting the payer at additional risk if providers do not perform as expected under current contracts.
Finally, it is important to evaluate each market independently, recognizing the impact of MACRA within a market may vary by payer based on the market share and network contracting strategy. Two payers in the same market with different market shares are likely to be impacted differently by MACRA. The payer with greater market share is more likely to have a greater influence with their key health systems, as well as be more likely to avoid cost-shifting attempts by providers attempting to achieve budget neutrality based on potential impacts of MACRA to their practices and systems.

Copyright © 2019 Society of Actuaries
28
Medicare
In 2017, approximately 58.5 million Americans were enrolled in some form of Medicare. The Office of the Actuary projects that Medicare enrollment will grow to number 73.7 million members by 2026, an increase of 26%. Although the majority of Medicare members are covered under traditional Medicare FFS, the popularity of MA plans continues to increase year over year, accounting for more than one-third of Medicare members. Meanwhile, the number covered by Medicare has increased by 11.5% over the last five years. During that period, traditional Medicare has grown by 3.2%, and MA plans by 34.7%. In 2017, even though Medicare enrollees grew by roughly 1.4 million members, traditional Medicare enrollment decreased by roughly 63,000 members.
This section outlines some of the financial implications and risks posed by MACRA to these two distinct products offered to the Medicare-eligible population (see Figure 8).
Figure 8 Comparison of Original Medicare with Medicare Advantage and Other Health Plans
Source: Medicare Enrollment Dashboard, Office of Enterprise Data and Analytics Center for Medicare and Medicaid Services, April 2019, https://www.cms.gov/Research-Statistics-Data-and-Systems/Statistics-Trends-and-Reports/Dashboard/Medicare-Enrollment/Enrollment%20Dashboard.html
As previously noted, MACRA’s primary focus is to bring value-based care concepts to the Medicare FFS market. However, the downstream impact of MACRA has direct implications for payers related to their MA plans as well as their Medigap or Medicare Supplement plans designed to augment members’ traditional FFS coverage.
Medicare Advantage
When evaluating the impact MACRA could have on the Medicare market, it is important to evaluate the MA population separately from traditional FFS members. Physicians who contract with MA plans will most likely not see significant changes, because they are not directly reimbursed by CMS for patient care under a MA plan, unless the MA plan ties its reimbursements directly to Medicare FFS rates. Alternatively, physicians who receive payment directly from CMS for treating traditional FFS members are likely to experience the most significant payment changes.

Copyright © 2019 Society of Actuaries
29
High-Level Summary of MACRA Mechanics
At its core, MACRA incentivizes value over volume by modifying the formula used by CMS to determine physician reimbursements. Before the implementation of MACRA, physicians were reimbursed based on the Medicare Fee Schedule with adjustment for relative value units (RVUs). The RVUs adjusted payments to reflect the following considerations:
• The relative time and intensity associated with providing the service
• The cost of maintaining a practice (such as rent, supplies, equipment and staff)
• Malpractice insurance costs
• Geographic adjustments.
Under MACRA, the RVUs previously used to modify physician payments will be adjusted by a MIPS multiplier, based on CPS. With this process, physicians considered high-performing providers will receive a larger payment compared to a low-performing physician for the same service. Under the revised formula, by 2020 the potential payment gap could be up to 19.7% (1.09/0.91) between the highest and lowest performing providers.
MIPS performance scores, and thus clinician revenues under Medicare FFS, are associated with a physician’s quality, resource use, clinical practice improvement activities and use of EHR technology. In other words, MIPS will have similar implications as Star ratings have for MA plans. However, it will likely require a significant time and resource investment for physicians to satisfy the MIPS criteria, which will ultimately create an administrative and resource burden for many small- and medium-sized physician groups. Therefore, many providers are expected to join APMs to avoid the burdens associated with the MIPS program.
MACRA’S Impact on the Medicare Advantage Market
In general, MACRA will not have any direct impact on the MA market because MACRA impacts only physicians who are reimbursed directly from CMS. However, it is expected that MA will experience secondary impacts as a result of changes predicted to take place in the traditional FFS market. At its core, MACRA will modify the physician payment formula, which many MA plans mimic with additional adjustment. The extent and severity of those secondary impacts are likely affected by the following market-specific characteristics. These characteristics are likely to be the most significant indicators impacting MA plans.
1. Medicare Advantage penetration rate: Markets with low MA penetration levels may experience the greatest impact because a large portion of the population is treated by physicians who will be impacted by MIPS. As these physicians transform their delivery to align with the CMS desire to stress value over volume, improvements in coding and documentation are likely to result in improved quality and risk adjustment scores. The rigor and expense of MIPS compliance may also cause some physicians to rethink their own business model and potentially avoid MIPS by encouraging their membership to move to MA plans. On the other hand, counties with very high MA penetration rates are likely to experience the smallest changes in MA penetration because most of the population is treated by physicians who are accustomed to the rigor of managed care, coding and documentation.

16. https://www.cms.gov/Medicare/Health-Plans/MedicareAdvtgSpecRateStats/Downloads/OONPayments.pdf, Page 36 Copyright © 2019 Society of Actuaries
30
2. County Star ratings: Areas with high average Star ratings represent areas where MIPS scores are expected to be the greatest. This is because providers and health plans in counties with high average Star ratings have already demonstrated their ability to provide high-quality care under the Star rating program. It is important to note that a significant portion of Star rating metrics, on a weighted basis, are covered by MIPS. This relationship should remain in place under the MIPS program, because the highest Star rating regions will most likely be the most receptive to quality-linked financial programs.
3. Regional contracting methods: Regions that predominantly reimburse physicians using fixed
PMPM capitations and percentage of premiums will likely experience the smallest impact of change to the MA rates. The Medicare FFS reimbursement rate and adjustments for the MIPS will have no impact on physicians that take risk via capitations and premium sharing.
4. HMO versus PPO: Markets containing numerous PPOs will likely see a greater impact to pricing
compared to HMO-dominated markets due to the out-of-network component associated with PPOs. Since there are no predetermined reimbursement arrangements between MA plans and out-of-network providers, MACRA could impact these claims. However, since out-of-network claim payments are capped at 115% of Medicare FFS and OON utilization is typically small compared to in-network utilization, these effects are not expected to be dramatic.16
5. Relative risk adjustment factors by county: Counties that typically have risk adjustment factors
below 1.0 may have less experience with coding and documentation than other markets, and/ or may not yet have adapted to the more focused management of members that has become second nature in many markets. Maps in Exhibit 5 highlight those counties that score particularly well in risk adjustment and Stars as well as those counties that are lagging in both areas relative to other counties. When evaluating the impact on counties that score well in both categories, these counties may sustain the least impact of MACRA as it pertains to any change in the county benchmark rate. Alternatively, counties that lag in both metrics may be areas experiencing additional downward pressure on the county benchmark rate as providers react more strongly to CMS’s emphasis of value over volume.
MACRA’S Impact on Medicare Advantage Plans
MACRA will impact every MA plan differently. Some plans may see a significant impact while other plans will exhibit little to no impact. The impact on a specific MA plan will depend primarily on the following considerations regarding the physician network:
1. How does your Medicare Advantage Organization (MAO) currently reimburse physicians?
a. If the MAO reimburses physicians using risk-sharing arrangements, such as PMPM capitation
or percentage of premium arrangements, the plan will likely not experience an impact, barring special circumstances such as utilization of out-of-network providers. However, if the MAO utilizes the CMS Medicare reimbursement percentages as a method of determining capitation rates or risk-sharing levels, there could be an impact. Capitation arrangements are expected to experience the smallest impact, but recommendations would suggest a more detailed evaluation of specific capitations to determine the extent of the impact.

Copyright © 2019 Society of Actuaries
31
b. If the MAO reimburses physicians based on a percentage of the Medicare fee schedule, impacts could occur depending upon the details of specific contracts. Since physician reimbursements mimic Medicare FFS reimbursements, an MAO’s payments would follow suit with variation for individual contract details. However, the magnitude and directional variation that any specific MAO will experience is highly dependent on the actual physicians who receive reimbursements, their associated reimbursement levels determined by CMS and the plan’s ability to administer the various CMS fee adjustments.
c. Does the MAO currently offer physicians Pay-For-Performance or Shared Savings
programs? Depending on the structure of these programs, the impact of MACRA could be amplified or reduced. The specific mechanics of a given program, however, will determine the overall magnitude that MACRA may or may not have.
2. Who are the physicians the MAO is currently reimbursing, and how are those physicians likely
to operate within the framework created by MACRA? Because physicians’ participation methods can have dramatic impacts on their FFS reimbursements, the following considerations are recommended:
a. If physicians treat low volumes of traditional Medicare FFS members, the MAO will likely see
no impact because these physicians are exempt from MIPS and would not receive the associated fee schedule adjustment. The currently proposed minimum volume threshold for 2018 and beyond is fewer than 200 traditional FFS patients with $90,000 in annual revenue from CMS.
b. Physicians who treat large volumes of traditional FFS members are the most incentivized to
participate in the MIPS program, because they have the highest potential for gain. However, the direction and magnitude this would have on an MAO is dependent on the actual MIPS score of a given physician. To evaluate this impact, MAOs should determine the MIPS payment modifier associated with the physicians.
c. The average size of the physician group can impact several considerations. Large groups are
more likely to participate in the MIPS program because they have the necessary resources and the most to gain from a favorable MIPS payment adjustment. Additionally, large groups tend to have significantly more negotiating power compared to smaller physician groups.
d. Physicians who are part of an AAPM are eligible for an additional 5% bonus payment
depending on the contracting methodology; this could possibly translate into a 5% increase of physician claims.
e. When evaluating the impact that physician mix could have on a population, evaluating the
physicians who treat the highest volume of members is recommended. This will allow MAOs to isolate the most impactful physician groups.
Finally, evaluating the direction and magnitude MACRA could have on a specific MAO is a multifactorial issue. The contracting methods and physician mix both play an equally large role in determining the impact MACRA may or may not have on a specific organization.

Copyright © 2019 Society of Actuaries
32
Medicare Supplement (Medigap)
Medicare FFS enrollment has decreased in recent years, but Medicare Supplement, or “Medigap” plans, remain popular among seniors who prefer traditional FFS Medicare over MA along with low deductibles and cost-sharing. The plan designs offered by Medigap plans are standardized by CMS. Medigap coverage is private insurance, with the offerings varying by state. The two most popular plans are Supplement F and Supplement G, both of which cover a majority of the member’s cost-sharing responsibility under traditional FFS Medicare. In additional to individual coverage, some employers offer Medigap coverage to their retirees. Based on AHIP’s most recent Medigap Enrollment Study in 2015, Plans F and G accounted for 65% of Medigap enrollment.11
Medigap plans will experience two changes due to MACRA:
1. All Medigap plans that provide coverage for the Part B deductible will close to new entrants on January 1, 2020. However, beneficiaries enrolled in those plans before January 1, 2020, will remain grandfathered into their current plans. Medicare Supplement F and C are the only plans affected by this, because they are the only offerings that cover the Part B deductible. It is predicted that most members currently in Supplement F or C will remain in their respective plans, because Medicare members tend to be reluctant to change. New members, who will be excluded from purchasing Supplement C or F, may be likely to enroll in Supplement G or MA depending on personal preference.
a. Incoming members who value low Part B deductibles may be most likely to join MA plans. New members of Medigap plans will not be offered Part B deductible coverage. However, $0 deductible plans are extremely common in the MA market. Historically, Plan F attracted members who have wanted first dollar coverage. The migration of these members into other Medigap and MA plans could possibly impact some existing risk pools.
b. Incoming members who prefer to remain in traditional Medicare plans and desire lower member cost-sharing options are expected to enroll in Medicare Supplement plan G, which is identical to F except for its Part B deductible coverage. After members have satisfied their Part B deductible ($183 per year in 2018) there are no differences between Supplements F and G.
2. Medigap plans could potentially see cost fluctuations due to MACRA, but the full effect will likely be subtle, because Medigap plans provide coverage only for a fraction of every health care dollar spent. Plan F, the broadest of all supplemental policies, provides coverage for the Part B deductible and the 20% Part B member coinsurance. Therefore, total Part B spending would need to experience a large fluctuation to drive a significant impact on the Medigap market.
Given the nature of Medigap products, future changes to traditional FFS Medicare cost-sharing or Part B premiums are expected to cause a large movement of members among MA and Medigap plans, most likely further accelerating the growth of MA plans relative to Medigap plans.
11 “Trends in Medigap Enrollment and Coverage Options, 2015,” AHIP (May 1, 2017), https://www.ahip.org/trends-in-medigap-enrollment-2015/.
Copyright © 2019 Society of Actuaries
33
Medicaid
In most states, Medicaid is likely to be less impacted than other lines of business because the reimbursement rates are largely determined by individual states. However, approximately 20% of Medicare members also have dual eligibility for Medicaid. Dual-eligible members can enroll in either traditional Medicare or MA plans, while also receiving “wrap-around” services through Medicaid. For those enrolling in traditional Medicare, the following impacts may occur:
1. From a contracting perspective, if payer agreements with providers are based on a percentage of Medicare, MACRA will impact reimbursement. However, if states have a mandated fee schedule for Medicaid, there will be little to no impact.
2. From a capitation rate perspective, the Medicaid portion of covered costs may change according to the change in the underlying contracting basis.
Another contributing factor to consider is the evolution of how Medicaid programs provide coverage to dual beneficiaries. Some states have begun to offer integrated benefits through one payer (i.e., managed Medicaid coverage and MA coverage through one payer). The appeal of this arrangement for members is an integrated approach to care delivery in addition to supplemental benefits the member would typically not be offered. This may lead to more dual-eligible members selecting MA than in the past.
These potential impacts will be exacerbated in the coming years as the Office of the Actuary is projecting an increase in Medicaid members from 72.7 million in 2017 to 81.2 million in 2026.
Clearly, the unique nature of Medicaid programs in each state will dictate the impact MACRA has for each payer in each state. Each payer needs to account for its unique contracting arrangements, how services are reimbursed in each state, and the vision each state has for providing services to dual-eligible members before assessing the impact of MACRA. Finally, these areas should be revisited periodically depending on the level of contracting changes occurring as well as any state administration changes that look to alter the vision of Medicaid.
Commercial
Commercial lines of business are not directly impacted by MACRA, but many payers may experience significant indirect impacts across numerous areas of operation, including, but not limited to, claims payment, network contracting, increased call center activity and pricing. Given that commercial enrollment is currently around 179 million compared to Medicare enrollment of 59 million and Medicaid enrollment of 81 million, one could argue more commercial members could sustain impacts larger than those of the other two lines of business combined.

Copyright © 2019 Society of Actuaries
34
Many commercial payers express their provider reimbursement levels in relation to Medicare reimbursement rates. Under MACRA, there are theoretically more than 1.3 million unique fee schedules that potentially would need to be defined and processed. By excluding some types of providers and putting minimum limits on the volume of patients, CMS previously reduced the potential pool of impacted providers to less than one-half of the total pool. The actual impact of MACRA on provider contracts within each payer, expressed as a percentage of Medicare reimbursement, will need to be carefully reviewed by each plan’s legal counsel. The operational aspects of how claims will be paid will vary significantly by payer and are outside the scope of this white paper.
Meanwhile, the focus of this white paper remains on three primary areas with respect to MACRA’s impact on commercial plans:
1. Provider revenue shifting: As noted, one likely impact of MACRA will be the continual erosion of
physicians’ financial margins. Physicians have historically attempted to make up lost revenue from CMS and other entities by pursuing higher revenues from commercial payers and self- funded employers. This strategy has worked to varying degrees in different markets and will likely continue to be used as physicians and physician groups begin to study the potential impact on their specific businesses. In markets where payers have leverage through market share and other means, there may be less of an impact. Meanwhile, when payers have a small market share, and many physicians in the market are pessimistic about the impact of MACRA on their future incomes, attempts at revenue shifting are even more likely.
2. Brand reputation—narrow networks: Payers’ network(s) have become an important part of
their public-facing identities. Significant effort is placed on selecting, recruiting and maintaining the physicians within a provider’s network based on multiple factors. Facing cost pressures across all lines of business, many payers now also offer narrow networks to meet the needs of specific consumers that are most sensitive to premium levels. Payers carefully evaluate their primary networks to identify physicians across multiple specialties that they generally identify to be highly efficient when taking into consideration clinical outcomes and total cost of care. CMS uses specific formulas to evaluate physician performance and will begin making those evaluations public beginning in late 2018 and annually thereafter. For many, if not most, payers, there will be significant differences between the criteria both CMS and private payers use to identify high-performing providers. This misalignment will likely result in some physicians considered by CMS to be high-quality and high-performing not being included in a provider’s network. In fact, this is already occurring given the overall competitiveness of the health care system. A primary concern arises in the event a significant portion of a payer’s network is rated below average. In this situation, the brand reputation of a payer is at risk. CMS grades are set on a national rather than a regional standard, so the proportion of a physician’s favorable versus unfavorable CMS grades may vary significantly by geography. Therefore, depending on the specific market, payers may or may not be able to expand their narrow networks to include providers whom CMS has graded favorably. For physicians whom CMS graded above average while the payer did not, there may be a potential cost to adding those physicians, depending on the reasons they were not previously included in the payer’s narrow network. If the payer wants to keep the provider in the network, the payer may also need to bear the costs associated with helping the provider improve the provider’s MIPS score. A framework for understanding this potential impact is included in the models described in this white paper.

Copyright © 2019 Society of Actuaries
35
3. Potential erosion of historic value-based care gains: MACRA stresses value over volume, consistent with the direction many payers have been taking over the last several years. The reality of MACRA, however, is that it places a burden on physicians to improve their investments in outcome reporting and technology. While this is a burden for all MACRA-qualifying physicians, this creates a larger burden for some physicians as compared to others. In fact, many payer groups have openly noted that the efforts required to focus on MACRA will take away from the value-based initiatives they have developed with payers because CMS comprises a significant portion of the provider’s revenue, if not the majority of revenue. From a practical perspective, physicians need to evaluate their current and potential future membership with a given provider and determine if they have the resources available to continue to invest in that relationship. This is of particular concern for payers that do not have significant market share, because the historic gains they have achieved through value-based care could be eroded or lost. The framework for evaluating the potential impact of losing value-based gains is provided within the models associated with this white paper.

Copyright © 2019 Society of Actuaries
36
Revenue Impact
Models have been included as part of this white paper to give actuaries a sample framework to determine MACRA’s potential impact on a specific payer’s business, given the unique geography and competitive position. The levers that will impact the magnitude of MACRA’s impact by model are shown in Table 1.
Table 1 Magnitude of MACRA’s Impact by Model
Lever Medicaid (Duals) Brand Reputation Population Health/ Value-Based Care
Risk Adjustment Coding Accuracy
MA Penetration Rate
Benchmark Rate
Star Rating
Number of Plans Charging $20+ Monthly Premiums
Number of Plans Charging $0 Monthly Premiums
Single-Payer 50%+ Market Share
Market Value-Based Care Maturity
Source: Optum Actuaries Subject Matter Experts by Line of Business
Certain levers will be more impactful than others depending on each payer’s unique circumstances. The level of impact for each lever that is built into the models is for a sample market and will not necessarily hold true for every market. Therefore, it is highly recommended that a thorough review of each lever be conducted to modify the level of impact each lever may exert on a payer’s market.
Framework for Estimating Financial Impact by Line of Business
As previously described, the potential financial impact will vary not only by geography and line of business, but also by the specific characteristics of payers within each market. The model has been developed to assist actuaries in considering the complexities of MACRA and how different plans will be impacted differently in the same market. The model is designed to serve as initial guidance; thus additional work may be required to adapt the model to a specific circumstance. Three hypothetical markets are illustrated in Table 2, with some variance across the eight key levers.

Copyright © 2019 Society of Actuaries
37
Table 2 Three Hypothetical MACRA Markets
Market
Lever A B C
County Risk Adjustment Score 1.20 1.16 0.98
County MA Penetration Rate 47.58% 36.49% 47.15%
County Benchmark Rate $897.45 $827.98 $835.62
County Star Rating 4 Stars 3.5 Stars 4 Stars
Number of MA Plans Charging Monthly Member Premium of >$20
15 5 4
Number of MA Plans Charging $0 Monthly Member Premium
25 4 5
Single-Payer 50%+ Market Share No No No
Value-Based Care Maturity Mature Initial Stages Mature
The model is designed to help actuaries quantify the potential financial impact for a given payer, recognizing that impact may vary significantly by market, line of business and the payer’s competitive position and market share within each line of business. When applying the model, actuaries need to think through how the levers outlined above impact the assumptions they should enter into the model. In some mature value-based markets where coding and documentation are above the national average, there may be very little financial impact. Conversely, in markets where value-based care is just beginning, and there has been historically less emphasis on coding and documentation, the financial impact may be more significant.
Scenario Modeling
To illustrate potential implications of MACRA, Optum has developed a flexible financial model with which a payer can estimate physician payments changes based on current reimbursement methods (i.e., Traditional FFS, Capitation, Fixed Fee Schedule) by line of business.
The Excel-based provider revenue model is provided with this white paper. The model allows testing of a wide variety of scenarios and includes tabs with instructions and a description of the underlying assumptions. The model user should be familiar with the MACRA and concepts.
For purposes of this white paper, we will review multiple scenarios that a payer may experience as a result of MACRA.
Scenario 1: Medicare
Let’s assume a health plan has annual Medicare physician’s claims in 2018 of $810K. This health plan is in the early stages of estimating the impact of MACRA and therefore must estimate the average MIPS score of its physician network. Medicare physician claims are split into Medicare FFS, capitation and fixed fee schedule. This split is critical, because claims reimbursed via capitation and fixed fee schedules are not impacted by MACRA.

Copyright © 2019 Society of Actuaries
38
It is assumed that 50% of the health plan’s physicians who treat FFS members will receive a MIPS score and 40% are assumed to participate in an AAPM. Additionally, it is assumed that 50% of the MIPS scores and AAPM bonuses will actually be recognized by the health plan’s reimbursement contracts.
Therefore, the original $810K will range from $810K to $814K depending on the average MIPS score of the physicians in the network.
Scenario 2: Medicaid
Let’s assume a health plan has annual Medicaid physicians’ claims in 2018 of $1,064,047. This health plan is in the early stages of predicting the impact of MACRA and therefore must estimate the average MIPS score of its physician network. Medicaid physician claims are split into Medicare FFS, capitation and fixed fee schedule. This split is critical, because claims reimbursed via capitation and fixed fee schedules are not impacted by MACRA.
It is assumed that 25% of the health plans Medicaid physicians that treat FFS members will receive a MIPS score and 25% are assumed to participate in an AAPM. Additionally, it is assumed that 100% of the MIPS scores and AAPM bonuses will actually be recognized by the health plan’s reimbursement contracts.
Therefore, the original $1,065,887 will range from $1,065,795 to $1,075,088 depending on the average MIPS score of the physicians in the network.
The output of the two scenarios appears in Exhibit 4 of the Appendix.
Health Care Ecosystem
MACRA has now been in place long enough for many providers to develop and begin execution of their initial game plans for success going forward. Meanwhile, most payers have also had the opportunity to study providers’ initial reactions and develop their own formulas for success. Providers are often frustrated by the potential decrease in income and overwhelmed by the volume and infrastructure required by MIPS scoring, so much that the Medicare Payment and Advisory Commission (MedPAC) voted 14 to 2 to recommend repealing the MIPS portion of MACRA. As noted in the introduction, MACRA is bipartisan and may continue to be softened over the next few years. But by stressing value over volume, MACRA is unlikely to be repealed by Congress.
MIPS originally drafted more than 250 quality metrics, while Stars ratings have consistently been in the upper 40s over the years. Currently there is roughly a 50% weighted overlap between the two systems. CMS has been working with the industry, and particularly the Association of Health Insurance Plans (AHIP), to simplify the measures. Payers learned numerous lessons in the early years of the Stars program, many of which are directly applicable to providers. MIPS compels payers and providers to carefully examine the volume and overlap of workflows not just between MIPS and Stars, but also in risk adjustment, HEDIS measures and care management programs. Significant opportunities exist for metric harmonization across all of these programs.
While some providers are looking for ways to collaborate with payers on MIPS, other providers have decided MIPS is not a viable option and have developed FFS exit strategies. MACRA was created with minimum membership, paid claim and claim count thresholds. As a result, many providers have encouraged their FFS patients to move to MA plans. Payers that did not anticipate this movement when developing their 2018 MA bids may find their underlying risk pool to be different than they assumed,

Copyright © 2019 Society of Actuaries
39
leading to potential deviations between actual and expected claims experience. The same challenges hold true for the development of the 2019 MA bids.
Providers may also be considering, or already participating in, the AAPM track. CMS is encouraging provider-payer collaboration in this track through the All-Payer APM option. Participation in non- Medicare APMs in 2019 and later can help providers meet the QP threshold to qualify for the AAPM 5% bonus payment and receive an exemption from MIPS.
Summary
As trusted advisors to the health care industry, actuaries need to provide guidance to payers and providers around the potential impacts of MACRA and the QPP. This white paper has provided insight and considerations for the profession so actuaries can assess the potential risk and opportunities for their organization across numerous areas, including the following:
• Financial implications and risk to providers, both MIPS and AAPM pathways
• Collaboration opportunities across providers and payers
• Implications on provider-payer contracting and relationships, including financial and reputational impacts
• Implications to MA, Medigap and commercial lines of business.
As MACRA continues to evolve, organizations—both provider and payer—need to respond and adapt with strategies that meet their business objectives and provide opportunities for growth and profitability. There is no one-size-fits-all strategy, but the goal is clear: improve patient outcomes and reduce health costs by rewarding value over volume.
Copyright © 2019 Society of Actuaries
40
Appendix
Exhibit 1: MIPS Measures
The Merit-Based Incentive Payment System (MIPS) is a measurement-based regime, which consolidates the three existing programs (PQRS, Value Modifier and Meaningful Use) into a single reporting system for providers. MIPS also adds a fourth component for reporting to promote and reward clinical practice improvement and innovation. Each of these components has specific measurement and reporting requirements. Clinicians can report at the group, Virtual Group (2–18+) or individual level. Participants in certain Alternative Payment Models (APMs) under the APM scoring standard, such as Medicare Shared Savings Plan (MSSP) Track 1, should report at the APM entity level.
Quality
For the Quality measure category in 2017, most clinicians had to choose up to six measures for their practice or specialty, including one outcome measure, from a list of 271 measures, or all from a specialty measure subset, for a minimum of 90 days. Groups using the CMS Web Interface must report on the 15 quality measures for a full year. Groups in APMs qualifying for special scoring under MIPS, such as Shared Savings Track 1 APM, report quality measures through the APM, and there is no additional reporting via MIPS quality. Scoring will vary based on submission method (i.e., claims, EHR or Registry).
Bonus points are awarded for reporting additional high-priority measures and use of Certified Electronic Health Record Technology (CEHRT). The list of measures will be updated before the start of each performance year. Starting in 2018, a score for measure improvement will be included, along with up to five points for complex patients and five points for small practices.
In choosing the measures to report, consideration should be given to high-performing measures, although the clinician will need to be aware if any of the measures are approaching “topped out” status, indicating there is little room for improvement. Also, providers can earn bonus points where available to increase their overall quality score.
Resource Use
The Resource Use category does not require data submission, because the measures are calculated from adjudicated claims. For 2017, this measure was not used. For 2018, this category will include only the Medicare Spending per Beneficiary (MSPB) and total per capita cost measures. For 2019, CMS is adding eight episode-based measures. CMS is planning to adopt more episode-based measures for future years. MIPS APMs are exempt from this scoring category.
Practice Improvement
Clinicians must choose from among 90+ potential activities with focus on care coordination, beneficiary engagement and patient safety. Clinicians choose a subset of these measures to meet the required threshold (as little as two activities). Most participants must attest that they have completed up to four improvement activities for a minimum of 90 days. The list of activities will be updated annually.

Copyright © 2019 Society of Actuaries
41
Participants in certified patient-centered medical homes, comparable specialty practices or an APM designated as an MHM will automatically earn full credit. Participants in certain APMs under the APM scoring standard, such as Shared Savings Program Track 1, will automatically receive points based on the requirements of participating in the APM. For all current APMs under the APM scoring standard, this assigned score will be full credit. For all future APMs under the APM scoring standard, the assigned score will be at least half credit.
Advancing Care/Promoting Interoperability
Clinicians are scored on measures that promote electronic health records (EHRs) and information exchange, security and patient access. For 2017 and 2018, the following measures had to be fulfilled for a minimum of 90 days: Security Risk Analysis, e-Prescribing, Provide Patient Access, Send Summary of Care and Request/Accept Summary of Care. Clinicians may also choose to submit up to nine additional measures for a minimum of 90 days for additional credit. For bonus credit, clinicians can either report Public Health and Clinical Data Registry Reporting measures or use certified EHR technology to complete certain improvement activities in the improvement activities performance category. However, this category may not apply to all clinicians.
For 2019, this category was renamed Promoting Interoperability. CMS will also be eliminating base, performance and bonus scores and moving to performance-based scoring at the individual measure level.
To maximize the score, providers can consider reporting on the additional measures, along with obtaining any credit for bonus points. Submitting only the minimum required information will result in only 50% credit for this category.
Bonus Points
For 2018, there is a Small Practice Bonus of five points. These points are added to the final score for MIPS eligible clinicians, groups, virtual groups and APM entities that meet the definition of small practice and submit data on at least one performance category in the 2018 performance period. Proposed for 2019, this bonus will be reduced to three points and will be added to the Quality category, rather than in the MIPS final score calculation.
Maximizing CPS Score
A clinician must consider all four measures for maximizing the CPS, including taking advantage of any opportunities for bonus points. The PT will reset each year and subsequently change the scoring measures. At a minimum, clinicians should be improving their scores on par with peers, or a positive result in one year may turn into a negative result the following year.

Copyright © 2019 Society of Actuaries
42
Exhibit 2: AAPM QP Thresholds
The threshold calculations to determine Qualified Participant (QP) status follow two methods: the Payment Amount Method and Patient Count Method. Each of these methods is depicted In Figure E2.1.
Figure E2.1 Calculations for Determining Payment Amount Method and Patient Count Method
Source: Medicare Shared Savings Program in the Quality Payment Program, Centers for Medicare and Medicaid Services, October 27, 2016, https://qpp-cm-prod-content.s3.amazonaws.com/uploads/191/APMs-in-The-Quality-Payment-Program-for-Shared-Savings-Program-SSP-webinar-slides.pdf
The Medicare-Only thresholds, used for 2017 and 2018 performance years, are outlined in Table E2.1. Table E2.1 Medicare-Only Thresholds for 2017 and 2018 Performance Years
Source: Medicare Shared Savings Program in the Quality Payment Program, Centers for Medicare and Medicaid Services, October 27, 2016, https://qpp-cm-prod-content.s3.amazonaws.com/uploads/191/APMs-in-The-Quality-Payment-Program-for-Shared-Savings-Program-SSP-webinar-slides.pdf

Copyright © 2019 Society of Actuaries
43
Source: Medicare Shared Savings Program in the Quality Payment Program, Centers for Medicare and Medicaid Services, October 27, 2016, https://qpp-cm-prod-content.s3.amazonaws.com/uploads/191/APMs-in-The-Quality-Payment-Program-for-Shared-Savings-Program-SSP-webinar-slides.pdf
For 2019 and beyond, the All-Payer thresholds will be introduced (see Table E2.2). The APM entity must meet both the Medicare and All-Payer thresholds for QP status.
Table E2.2 Medicare-Only and All-Payer Combination Options for 2019 and Beyond
Source: APMs 101 for the 2019 Performance Year of the Quality Payment Program, Centers for Medicare and Medicaid Services, February 21, 2019, https://qpp-cm-prod-content.s3.amazonaws.com/uploads/480/2019%20APMs%20Overview%20Webinar_Slides.pdf
Source: APMs 101 for the 2019 Performance Year of the Quality Payment Program, Centers for Medicare and Medicaid Services, February 21, 2019, https://qpp-cm-prod-content.s3.amazonaws.com/uploads/480/2019%20APMs%20Overview%20Webinar_Slides.pdf

44
Copyright © 2019 Society of Actuaries
Source: APMs 101 for the 2019 Performance Year of the Quality Payment Program, Centers for Medicare and Medicaid Services, February 21, 2019, https://qpp-cm-prod-content.s3.amazonaws.com/uploads/480/2019%20APMs%20Overview%20Webinar_Slides.pdf

45
Copyright © 2019 Society of Actuaries
Exhibit 3a—Scenario 1: MIPS to AAPM (Low Performer)
Input:
Source: MACRA provider model, Model Input tab

46
Revenue at Risk Summary:
Source: MACRA provider model, Revenue at Risk Summary tab
Charts Performance:
Source: Optum provider model, Charts Performance tab
Copyright © 2019 Society of Actuaries
200
($50)
$0
$50
$100
$150
$200
2018 2019 2020 2021 2022 2023 2024 2025 2026
Revenue at Risk (000) - Baseline
MIPS AAPM
$0
$50
$100
$150
$200
2018 2019 2020 2021 2022 2023 2024 2025 2026
Revenue at Risk (000) - Shift to AAPM
MIPS AAPM

47
Charts Revenue and Margin:
Source: MACRA provider model, Charts Rev & Margin tab
Copyright © 2019 Society of Actuaries
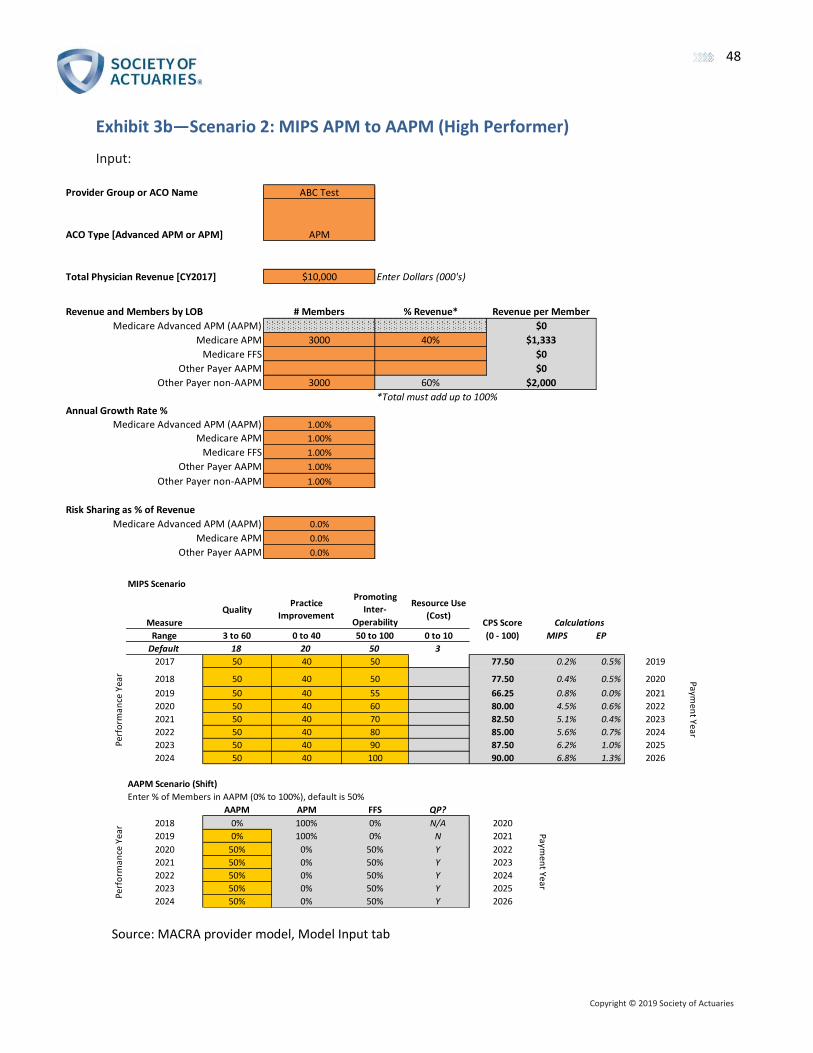
Copyright © 2019 Society of Actuaries
48
Exhibit 3b—Scenario 2: MIPS APM to AAPM (High Performer)
Input:
Source: MACRA provider model, Model Input tab
Provider Group or ACO Name ABC Test
ACO Type [Advanced APM or APM] APM
Total Physician Revenue [CY2017] $10,000 Enter Dollars (000's)
Revenue and Members by LOB # Members % Revenue* Revenue per Member
Medicare Advanced APM (AAPM) $0
Medicare APM 3000 40% $1,333
Medicare FFS $0
Other Payer AAPM $0
Other Payer non-AAPM 3000 60% $2,000
*Total must add up to 100%
Annual Growth Rate %
Medicare Advanced APM (AAPM) 1.00%
Medicare APM 1.00%
Medicare FFS 1.00%
Other Payer AAPM 1.00%
Other Payer non-AAPM 1.00%
Risk Sharing as % of Revenue
Medicare Advanced APM (AAPM) 0.0%
Medicare APM 0.0%
Other Payer AAPM 0.0%
MIPS Scenario
Measure
QualityPractice
Improvement
Promoting
Inter-
Operability
Resource Use
(Cost)CPS Score
Range 3 to 60 0 to 40 50 to 100 0 to 10 (0 - 100) MIPS EP
Default 18 20 50 3
2017 50 40 50 77.50 0.2% 0.5% 2019
2018 50 40 50 77.50 0.4% 0.5% 2020
2019 50 40 55 66.25 0.8% 0.0% 2021
2020 50 40 60 80.00 4.5% 0.6% 2022
2021 50 40 70 82.50 5.1% 0.4% 2023
2022 50 40 80 85.00 5.6% 0.7% 2024
2023 50 40 90 87.50 6.2% 1.0% 2025
2024 50 40 100 90.00 6.8% 1.3% 2026
AAPM Scenario (Shift)
Enter % of Members in AAPM (0% to 100%), default is 50%
AAPM APM FFS QP?
2018 0% 100% 0% N/A 2020
2019 0% 100% 0% N 2021
2020 50% 0% 50% Y 2022
2021 50% 0% 50% Y 2023
2022 50% 0% 50% Y 2024
2023 50% 0% 50% Y 2025
2024 50% 0% 50% Y 2026
Paymen
t Year
Paymen
t Year
Calculations
Perf
orm
ance
Yea
rPe
rfo
rman
ce Y
ear

Copyright © 2019 Society of Actuaries
49
Revenue at Risk Summary:
Source: MACRA provider model, Revenue at Risk Summary tab
Charts Performance:
Source: MACRA provider model, Chart Performance tab
400
$0
$50
$100
$150
$200
$250
$300
$350
$400
2018 2019 2020 2021 2022 2023 2024 2025 2026
Revenue at Risk (000) - Baseline
MIPS AAPM
$0
$50
$100
$150
$200
$250
$300
$350
$400
2018 2019 2020 2021 2022 2023 2024 2025 2026
Revenue at Risk (000) - Shift to AAPM
MIPS AAPM

Copyright © 2019 Society of Actuaries
50
Charts Revenue and Margin:
Source: MACRA provider model, Charts Rev & Margin tab

Copyright © 2019 Society of Actuaries
51
Exhibit 4—Payer Model Scenarios 1 and 2
Source: MACRA payer model, payer impact tab

Copyright © 2019 Society of Actuaries
52
Exhibit 5—Maps
Sources: 2018 MA Landscape Source Files: https://www.cms.gov/Medicare/Prescription-Drug-Coverage/PrescriptionDrugCovGenIn/Downloads/2018-MA-Landscape-Source- Files-v-10-14-17.zip.
Monthly Enrollment by CPSC 2018-11: https://downloads.cms.gov/files/CPSC_Enrollment_2018_11.zip.

Copyright © 2019 Society of Actuaries
53
Source: MA State/County Penetration—November 2018: https://www.cms.gov/Research-Statistics-Data-and-Systems/Statistics-Trends-and-Reports/MCRAdvPartDEnrolData/ Downloads/2018/Nov/State-County-Penetration-MA-2018-11.zip.

Copyright © 2019 Society of Actuaries
54
Source: 2018 MA County Benchmark Rates: https://www.cms.gov/Medicare/Health-Plans/MedicareAdvtgSpecRateStats/Downloads/ratebook2018.zip.

Copyright © 2019 Society of Actuaries
55
Source: Risk Adjustment Factors by County: https://www.cms.gov/Medicare/Medicare-Advantage/Plan-Payment/Downloads/2015-payment-data.zip
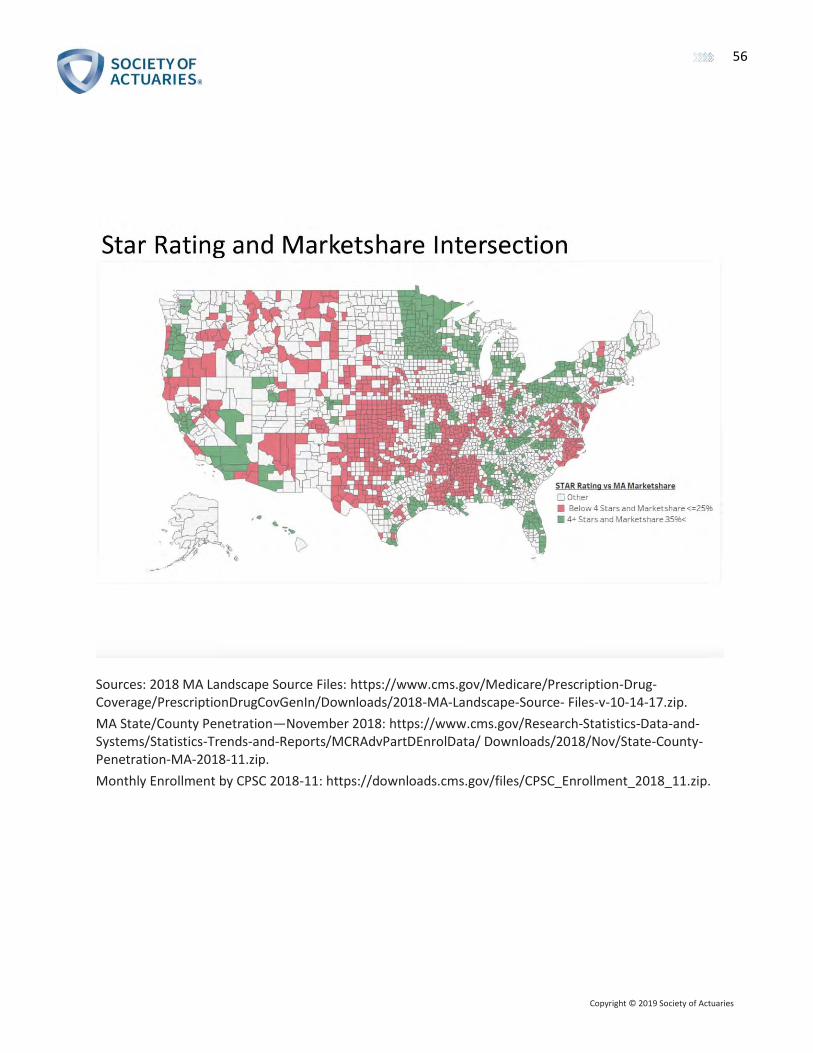
Copyright © 2019 Society of Actuaries
56
Sources: 2018 MA Landscape Source Files: https://www.cms.gov/Medicare/Prescription-Drug-Coverage/PrescriptionDrugCovGenIn/Downloads/2018-MA-Landscape-Source- Files-v-10-14-17.zip.
MA State/County Penetration—November 2018: https://www.cms.gov/Research-Statistics-Data-and-Systems/Statistics-Trends-and-Reports/MCRAdvPartDEnrolData/ Downloads/2018/Nov/State-County-Penetration-MA-2018-11.zip.
Monthly Enrollment by CPSC 2018-11: https://downloads.cms.gov/files/CPSC_Enrollment_2018_11.zip.

Copyright © 2019 Society of Actuaries
57
Sources: 2018 MA Landscape Source Files: https://www.cms.gov/Medicare/Prescription-Drug-Coverage/PrescriptionDrugCovGenIn/Downloads/2018-MA-Landscape-Source- Files-v-10-14-17.zip.
Monthly Enrollment by CPSC 2018-11: https://downloads.cms.gov/files/CPSC_Enrollment_2018_11.zip.
2018 MA County Benchmark Rates: https://www.cms.gov/Medicare/Health-Plans/MedicareAdvtgSpecRateStats/Downloads/ratebook2018.zip.

Copyright © 2019 Society of Actuaries
58
Sources: MA State/County Penetration—November 2018: https://www.cms.gov/Research-Statistics-Data-and-Systems/Statistics-Trends-and-Reports/MCRAdvPartDEnrolData/ Downloads/2018/Nov/State-County-Penetration-MA-2018-11.zip.
2018 MA County Benchmark Rates: https://www.cms.gov/Medicare/Health-Plans/MedicareAdvtgSpecRateStats/Downloads/ratebook2018.zip.

Copyright © 2019 Society of Actuaries
59
Sources: Risk Adjustment Factors by County: https://www.cms.gov/Medicare/Medicare-Advantage/Plan-Payment/Downloads/2015-payment-data.zip.
MA State/County Penetration—November 2018: https://www.cms.gov/Research-Statistics-Data-and-Systems/Statistics-Trends-and-Reports/MCRAdvPartDEnrolData/ Downloads/2018/Nov/State-County-Penetration-MA-2018-11.zip.

Copyright © 2019 Society of Actuaries
60
Sources: Risk Adjustment Factors by County: https://www.cms.gov/Medicare/Medicare-Advantage/Plan-Payment/Downloads/2015-payment-data.zip.
2018 MA Landscape Source Files: https://www.cms.gov/Medicare/Prescription-Drug-Coverage/PrescriptionDrugCovGenIn/Downloads/2018-MA-Landscape-Source- Files-v-10-14-17.zip.
Monthly Enrollment by CPSC 2018-11: https://downloads.cms.gov/files/CPSC_Enrollment_2018_11.zip.

Copyright © 2019 Society of Actuaries
61
About The Society of Actuaries The Society of Actuaries (SOA), formed in 1949, is one of the largest actuarial professional organizations in the world dedicated
to serving more than 32,000 actuarial members and the public in the United States, Canada and worldwide. In line with the SOA
Vision Statement, actuaries act as business leaders who develop and use mathematical models to measure and manage risk in
support of financial security for individuals, organizations and the public.
The SOA supports actuaries and advances knowledge through research and education. As part of its work, the SOA seeks to
inform public policy development and public understanding through research. The SOA aspires to be a trusted source of
objective, data-driven research and analysis with an actuarial perspective for its members, industry, policymakers and the
public. This distinct perspective comes from the SOA as an association of actuaries, who have a rigorous formal education and
direct experience as practitioners as they perform applied research. The SOA also welcomes the opportunity to partner with
other organizations in our work where appropriate.
The SOA has a history of working with public policymakers and regulators in developing historical experience studies and
projection techniques as well as individual reports on health care, retirement and other topics. The SOA’s research is intended
to aid the work of policymakers and regulators and follow certain core principles:
Objectivity: The SOA’s research informs and provides analysis that can be relied upon by other individuals or organizations
involved in public policy discussions. The SOA does not take advocacy positions or lobby specific policy proposals.
Quality: The SOA aspires to the highest ethical and quality standards in all of its research and analysis. Our research process is
overseen by experienced actuaries and nonactuaries from a range of industry sectors and organizations. A rigorous peer-review
process ensures the quality and integrity of our work.
Relevance: The SOA provides timely research on public policy issues. Our research advances actuarial knowledge while
providing critical insights on key policy issues, and thereby provides value to stakeholders and decision makers.
Quantification: The SOA leverages the diverse skill sets of actuaries to provide research and findings that are driven by the best
available data and methods. Actuaries use detailed modeling to analyze financial risk and provide distinct insight and
quantification. Further, actuarial standards require transparency and the disclosure of the assumptions and analytic approach
underlying the work.
Society of Actuaries 475 N. Martingale Road, Suite 600
Schaumburg, Illinois 60173 www.SOA.org