health promoting effects of bioactive compounds in plants: targeting...
TRANSCRIPT

0
Health promoting effects of bioactive compounds in plants:
Targeting Type 2 diabetes
PhD Thesis
Sumangala Bhattacharya
Department of food Science
Faculty of Science and Technology
Aarhus University
July, 2013

1
Main Supervisor:
Niels Oksbjerg
Senior scientist, Department of Food Science, Aarhus University, Denmark
Co-supervisor:
Jette Feveile Young
Associate Professor, Department of Food Science, Aarhus University, Denmark
Assessment committee:
Marianne Hammershøj (chairperson),
Associate Professor,
Department of Food Science,
Aarhus University,
Denmark.
Lars Bohlin,
Professor,
Department of Pharmacy,
University of Uppsala,
Sweden.
Charles S. Bestwick,
Rowett Institute of Nutrition and Health,
University of Aberdeen,
UK

2
Preface
The present PhD thesis is the outcome of research conducted to identify plants with anti-diabetic
properties, and their intrinsic bioactive compound(s) responsible for this activity. An effort to elucidate
the signaling pathways mediated by these compounds has also been made.
This project is part of the main project ‘Health promoting effects of bioactive compounds in
plants’, which was conceived to identify and isolate bioactive compounds from selected plants and
vegetables to address their possible role in lifestyle diseases like T2D and obesity, by exposing them to
a bioassay based screening platform and bioactivity guided fractionation and chromatographic
separation. The project consisted of 6 work packages, of which, this work belongs to the 5th
.
The work performed in this thesis on primary porcine myotube cultures was performed at the
Department of Food Science, Aarhus University (Denmark). As part of the PhD education, a 4-month
stay at The Department of Endocrinology, Aarhus University Hospital, resulted in the work on
pancreatic beta cells.
The project was financed by The Danish Council for Strategic Research (Grant no.: 09-063086)
and Graduate School of Agriculture, Food and Environment (SAFE).
Sumangala Bhattacharya
July 2013

3
Table of contents Abstract ..................................................................................................................................................... 5
Dansk resumé ............................................................................................................................................ 7
List of attached manuscripts ..................................................................................................................... 9
List of supporting manuscripts ................................................................................................................ 10
Abbreviations .......................................................................................................................................... 11
1. Introduction ..................................................................................................................................... 14
1.1. Muscle loss and T2D ................................................................................................................................ 14
1.2. Need for T2D drug discovery ............................................................................................................... 16
1.3. Tissues and organs involved in T2D ................................................................................................. 16
1.4. Pancreatic beta cells in T2D ................................................................................................................. 18
1.5. Skeletal muscles and insulin resistance .......................................................................................... 18
1.6. Oxidative stress and insulin resistance ........................................................................................... 19
1.7. The insulin signaling pathway ............................................................................................................ 20
1.8. The AMPK signaling pathway .............................................................................................................. 21
1.9. The Glucosamine pathway .................................................................................................................... 23
1.10. Plant kingdom as a drug depot ........................................................................................................... 23
1.11. Plants and experimental models used ............................................................................................. 23
1.11.1. Selected medicinal plants studied.................................................................................. 23
1.11.2. Primary porcine myotube cultures as a model for skeletal muscles ............................. 26
1.11.3. INS 1E cells as a model for pancreatic beta cells ......................................................... 27
1.12. Overview of the main project: Test for bioactivities in different work packages ........... 28
1.13. Hypothesis for WP5 ................................................................................................................................. 29
1.14. Study structure .......................................................................................................................................... 29
2. Study I: Study of plant extracts in satellite cell derived primary porcine myotube cultures .......... 31
2.1. Objective: ..................................................................................................................................................... 31
2.2. Methods: ...................................................................................................................................................... 31
2.2.1. Cell proliferation and myotube viability ........................................................................... 31
2.2.2. Statistics ............................................................................................................................ 32
2.3. Results: ......................................................................................................................................................... 33
2.4. Discussion ................................................................................................................................................... 51
2.5. Short summary:......................................................................................................................................... 55

4
3. Study II: Studying the influence of selected elderflower compounds and related polyphenols in
clonal beta cells ....................................................................................................................................... 56
3.1. Objective: ..................................................................................................................................................... 56
3.2. Methods: ...................................................................................................................................................... 56
3.3. Results: ......................................................................................................................................................... 56
3.4. Discussion: .................................................................................................................................................. 57
3.5. Short summary:......................................................................................................................................... 58
4. Study III: Study of the possible signaling pathways behind Naringenin and Falcarinol induced
glucose uptake ......................................................................................................................................... 59
4.1. Objective: ..................................................................................................................................................... 59
4.2. Methods: ...................................................................................................................................................... 59
4.3. Results: ......................................................................................................................................................... 59
4.4. Discussion: .................................................................................................................................................. 59
4.5. Short summary:......................................................................................................................................... 60
5. General Discussion ......................................................................................................................... 61
5.1. Screening of plant extracts, fractions and their secondary metabolites for bioactivity 61
5.1.1. Investigation of oxidative stress by intracellular ROS generation ................................... 61
5.1.2. Study of satellite cell proliferation inducing potential...................................................... 62
5.1.3. Fractionation and further screening of fractions and secondary metabolites .................. 63
5.2. Study of selected phenolic compounds on insulin secretion and gene expression in INS
1E cells 65
5.2.1. Insulin secretion under chronic exposure and glucotoxic conditions ............................... 65
5.2.2. Impact of selected phenolic compounds on beta cell gene expression under glucotoxic
conditions ........................................................................................................................................ 66
5.3. Studying the mechanism behind naringenin and falcarinol induced glucose uptake ... 68
5.3.1. Investigating the dependence on Glut4 and insulin/AMPK signalling ............................. 69
5.3.2. Impact on TBC1D4 and TBC1D1 phosphorylation .......................................................... 71
6. Conclusions and Future perspectives .............................................................................................. 73
7. Reference List ................................................................................................................................. 77
8. Acknowledgements ......................................................................................................................... 89
9. Manuscripts ..................................................................................................................................... 91
5
Abstract
Type 2 diabetes (T2D) is a metabolic disorder that has engulfed modern societies in both developed
and developing countries. Insulin resistance in skeletal muscles, resulting in diminished glucose is a
major feature of T2D. Often life-style interventions and exercise regimes are not sufficient to curb such
metabolic disorders, making medication an indispensable part of the treatment. Plant kingdom has
contributed immensely to the modern drug library, and several plants have been used as natural
remedies for diabetes since ancient times.
The primary objective of this study was to screen selected plants with medicinal and/or food
backgrounds for their potential for stimulating glucose uptake in primary porcine myotubes, identify
the inherent compounds responsible, and simultaneously provide a molecular basis for this bioactivity.
The overall study has been divided into three studies. Study I describes the screening of 22
extracts from 8 plants, of which 5 plants, namely, Thymus vulgaris, Daucus carota (bolero, carrots),
Echinacea purpurea, Rhodiola rosea, and Sambucus nigra (elderflowers) were found to stimulate
glucose uptake most prominently. Elderflowers and carrots were chosen for further fractionation, and
the fractions were tested for bioactivity. The bioactive fractions of elderflowers were then separated by
High performance liquid chromatography (by a collaborating group of scientists) and the constituent
compounds together with other related polyphenols were examined for their potential to enhance
glucose uptake. Among these, phenolic acids like caffeic acid, ferulic acid. p-coumaric acid and 5-O-
caffeoylquinic acid; and flavonoids like naringenin and kaempferol showed promising glucose uptake
stimulating potential. Two polyacetylenes know to be present in carrots were separately tested, and
found to be capable of stimulating glucose uptake in myotubes.
In Study II, the phenolic compounds, naringenin, kaempferol, caffeic acid, ferulic acid, p-
coumaric acid, quercetin, and quercetin-3-β-D-glucoside were examined for their insulin secreting
potential in clonal pancreatic beta cells (INS-1E) under acute exposure. Among them, naringenin,

6
caffeic acid and quercetin were selected for further investigation under hypoglycemic, hyperglycemic
and glucotoxic conditions. Gene expression studies under glucotoxic conditions were also performed to
analyze the regulation of genes involved in beta-cell functions, stress, survival/apoptosis, and glucose
sensitivity. The genes whose expression was studied were Glut2, Gck, Ins1, Ins2, Beta2, Pdx1, Akt1,
Akt2, Irs1, Acc1, Bcl2, Bax, Casp3, Hsp70, and Hsp90. All three phenolic compounds were found to
increase insulin secretion in INS-1E cells both under hyperglycemic and glucotoxic conditions; and
upregulated insulin, glucokinase, and Hsp 70 and down regulated Acc1 gene expression. The pro-
survival gene Bcl2 was upregulated under normoglycemic conditions but remained unaffected under
glucotoxic conditions by all the phenolic compounds. The phenolic compounds differentially regulated
the gene expression of the other genes studied.
Study III was conducted to provide clues, for elucidation of the mechanism behind the glucose
uptake stimulating potential of naringenin and falcarinol. Glut4 inhibitor indinavir, PI3K inhibitor
wortmannin, and AMPK inhibitor dorsomorphin used in the study indicated the dependence of
naringenin and falcarinol on PI3K and/or its downstream target p-38 MAPK. Their direct dependence
on Glut4 for glucose transport was also demonstrated in this study. The study also confirmed that
active AMPK was required for naringenin to induce glucose uptake in myotubes and revealed that the
same was not true for falcarinol. The phosphorylation/activation of key signaling proteins TBC1D1 and
TBC1D4 (directly involved in Glut4 translocation) by naringenin and falcarinol were also studied.
Naringenin and falcarinol were found to preferentially increase TBC1D1 phosphorylation, as compared
to that of TBC1D4. Wortmannin suppressed naringenin and falcarinol induced phosphorylation,
whereas dorsomorphin suppressed phosphorylation induced by naringenin only; which also confirms
the observation about AMPK-independent glucose uptake by falcarinol.
In conclusion, the results obtained during this PhD study, reveals the multifaceted potential of
certain bioactive plants and their constituent compounds in amelioration of T2D, and provides a
mechanistic clue to elucidate the basis of the observed bioactivity.

7
Dansk resumé
Type 2 diabetes (T2D) er en metabolisk sygdom, som omklamrer moderne samfund både i udviklede-
og i udviklende lande. Insulin resistens i skeletmuskulaturen, der resulterer i mindsket
glukoseoptagelse, spiller en stor rolle i T2D. Livsstilsændringer og fysik træning er ikke altid
tilstrækkelige interventioner til at forhindrer sygdommen hvilket gør medicinering nødvendig i
behandlingen af T2D. Planteriget har bidraget markant til en liste af plantemedicin, og i mange år har
adskillige planter været brugt som naturlige værktøjer til behandling af diabetes. Det primære formål
med dette arbejde var at screene udvalgte planter, med medicinsk og/eller fødevarebaggrund, for deres
potentiale m.h.t. at stimulere glukoseoptagelsen i primære porcine myorør i kultur. Videre var formålet,
at identificere plantestoffer som er ansvarlige og samtidig studere det molekylære grundlag for
bioaktivitet. Overordnet inddeles arbejdet i 3 studier.
Studie 1 beskriver screening af 22 ekstrakter fra 8 planter, af hvilke 5 planter, Thymus vulgaris, Daucus
carota (bolero carrots) Echinecia pupurcea, Rhadiola rosea, og Sambucus nigra (hyldeblomst) markant
stimulerede glukoseoptagelsen i myorør. Hyldeblomst og gulerødder blev valgt for yderligere
fraktionering og disse fraktioner blev testet for bioaktivitet. De bioaktive fraktioner af hyldeblomst blev
derefter separeret med højtryksvæske kromatografi (udført af samarbejdspartnere i projektet) og viste at
disse fraktioner sammen med andre relaterede polyfenoler, som caffeic acid, ferulic acid, p-coumaric
acid og 5-O-caffeolytic acid, og flavonoider, som naringinin og kaempferol stimulerede
glukoseoptagelse i myorør. To polyacetylener, som vides at være i gulerødder, stimulerede ligeledes
glukose optagelsen i myorør.
I studie II blev den akutte påvirkning af fenoler som naringinin, kaemferol, caffeic acid, ferulic acid, p-
coumaric acid, quercitin, og quercitin-3-β-D glucoside undersøgt for deres evne til at stimulere insulin
sekretion i pankreas celler (INS-1 celler). Blandt disse blev naringinin, caffeic acid, og quercetin
udvalgt til yderligere undersøgelser under hypo-glukæmiske og glukotoksiske betingelser.
Genekspression under glucotosisk betingelser blev også udført for at undersøge reguleringen af gener,

8
der er involveret i beta-celle funktion, stress, overlevelse/celledød og følsomhed over overfor glukose.
De undersøgte gener var: Glut2, Gck, Ins1, Ins2, Beta2, Pdx1, Akt1, Akt2, Irs1, Acc1, Bcl2, Bax,
Casp3, Hsp70 og Hsp90. Alle tre fenoler øgede insulin sekretionen i INS-1 celler under både
hyperglukæmiske og glukotoksiske tilstande, og opregulerede genudtrykkene af insulin, glukokinase og
Hsp70 og nedregulerede Acc1 genudtrykket. Udtrykket af Bcl2 blev opreguleret under
normoglykæmiske betingelser, men forblev uforandret under glukotoksiske betingelser. Fenolerne
regulerede udtrykkene af de øvrige gener i varierende grad.
Studie III blev udført med det formål at undersøge de bagved liggende mekanismer, der er årsag til at
naringinin and falcarinol stimulerer glukoseoptagelsen i myorør. Tilsætning af hæmmeren af Glut4,
indinavir, af PI3K, wortmanin og af AMPK, dorsomorphin antydede, at effekten af naringinin og
falcarinol på glukoseoptagelsen er afhængig af PI3K og/eller dets ”downstream target”, p-38 MAPK.
Betydning af Glut4 transport af glukose blev ligeledes vist efter behandling med naringini og
falcarinol. Studiet viste ligeledes, at aktiveret AMPK er en forudsætning for at stimulere
glukoseoptagelse i myorør efter tilsætning af naringinin og falcarinol. Fosforylering/aktivering af nøgle
signalerende proteiner TBC1D1 og TBC1D4 (påvirker direkte Glut4 translocation) blev også undersøgt
og naringinin og facarinol øgede hovedsageligt TBC1D1. Wortmanin reducerede naringinin og
falcarinol induceret fosforylering, hvorimod dorsomorphin kun reducerede fosphoryleringen efter
tilsætning af naringinin. Dette underbygger observationerne af, at AMPK ikke er nødvendig for
falcarinol induceret glukoseoptagelse.
Overordnet afslører resultaterne fra nærværende afhandling flersidige potentialer af visse planter og
deres indholdsstoffer til fremtidige behandling af T2D og giver desuden indsigt i
reguleringsmekanismer.

9
List of attached manuscripts
I. Bioactive components from flowers of Sambucus nigra L. increase glucose uptake in primary porcine
myotube cultures and reduce fat accumulation in Caenorhabditis elegans
Sumangala Bhattacharya1, Kathrine B. Christensen
2, Louise C. B. Olsen
3, Lars P. Christensen
2, Kai Grevsen
4,
Nils J. Færgeman3, Karsten Kristiansen
5, Jette F. Young
1, and Niels Oksbjerg
1*
(Submitted to ‘The Journal of Agricultural and Food Chemistry’)
II. Caffeic acid, Naringenin and Quercetin enhance glucose stimulated insulin secretion and glucose
sensitivity in INS-1E cells
Sumangala Bhattacharya1, Niels Oksbjerg
1, Jette F. Young
1, and Per Bendix Jeppesen
2
(Submitted to ‘Diabetes, Obesity and Metabolism’)
III. Naringenin and falcarinol stimulate glucose uptake and TBC1D1 phosphorylation in primary porcine
myotube cultures
Sumangala Bhattacharya1, Martin Krøyer Rasmussen
1, Jette F. Young
1, Lars P. Christensen
2, Karsten
Kristiansen2 and Niels Oksbjerg
1*
(To be submitted to ‘Biochemical and Biophysical Communications’)

10
List of supporting manuscripts
I. Screening for Bioactive Metabolites in Plant Extracts Modulating Glucose Uptake and Fat
Accumulation
Rime B. El-Houri,1*
Dorota Kotowska,2 Louise C. B. Olsen,
3 Sumangala Bhattacharya,
5 Kathrine B.
Christensen,1 Kai Grevsen,
4 Nils Oksbjerg,
5 Nils Færgeman,
3 Karsten Kristiansen
2 and Lars P. Christensen
1
(Submitted to ‘Plant foods for human nutrition’)
II. Effects of falcarinol and falcarindiol on glucose uptake in adipocytes and muscle cells, PPARγ
transactivation and adipocyte differentiation
Rime B. El-Houri,1*
Dorota Kotowska,2 Sumangala Bhattacharya,
3 Kathrine B. Christensen,
1 Nils Oksbjerg,
3
Karsten Kristiansen2 and Lars P. Christensen
1
(Submitted to ‘Food Chemistry’)

11
Abbreviations
5-O-C = 5-O-caffeoylquinic acid
α-LA = alpha-linolenic acid
Acc1 = acetyl CoA carboxylase 1
ADP = Adenosine diphosphate
AICAR = 5-Aminoimidazole-4-carboxamide ribonucleotide
Akt1 = RAC-alpha serine/threonine-protein kinase encoding gene
Akt2 = RAC-beta serine/threonine-protein kinase encoding gene
AMP = Adenosine monophosphate
AMPK = 5' adenosine monophosphate-activated protein kinase
ATP = Adenosine triphosphate
Bax = Bcl-2 associated X protein
Bcl2 = beta-cell lymphoma 2 protein
Beta2 = neurogenic differentiation protein 1
c-AMP = Cyclic adenosine monophosphate
CaA = caffeic acid
CaMKK = Calcium/calmodulin-dependent protein kinase kinase
Casp3 = caspase 3
DM = dorsomorphin
FeA = ferulic acid
FGF = fibroblast growth factor
Gck = glucokinase
GFAT = glutamine: fructose-6-phosphate aminotransferase
Glut1 = Glucose transporter type 1

12
Glut2 = Glucose transporter type 2
Glut4 = Glucose transporter type 4
Glut12 = Glucose transporter type 12
GTP = Guanosine triphosphate
HDL = High-density lipoprotein
HGF = Hepatocyte growth factor
Hsp 70 = heat shock protein 70
Hsp90 = heat shock protein 90
I-3-O-G = isorhamnetin-3-O-glucoside
I-3-O-R = isorhamnetin-3-O-rutinoside
Ins1 = insulin 1
Ins2 = insulin 2
IRM = insulin resistant myotubes
IRS = Insulin receptor substrate
IRS1 = insulin receptor substrate 1
K-3-O-R = kaempferol-3-O-rutinoside
LA = linoleic acid
LDL = Low-density lipoprotein
LKB1 = Liver Kinase B1
MAPK = Mitogen-activated protein kinase
p-CA = p-coumaric acid
Pdx1 = pancreatic and duodenal homeobox protein 1
PI3K = Phosphatidylinositide 3-kinase
PKB = Protein kinase B PPAR = Peroxisome proliferator-activated receptor
Q-3-O-6’’-A = quercetin-3-O-6’’-acetylglucoside

13
Q-3-O-G = quercetin-3-O-glucoside
Q-3-O-R = quercetin-3-O-rutinoside
ROS = reactive oxygen species
Sirt1 = NAD-dependent deacetylase sirtuin-1
T2D = Type 2 diabetes
TBC1D1 = TBC1 domain family member 1
TBC1D4 = TBC1 domain family member 4
TNF-α = tumor necrosis factor alpha

14
1. Introduction
Human beings have treaded the long path of evolution to create a mechanized world for a comfortable
life. However, it is unfortunately associated with its own challenges. Metabolic disorders have been a
part and parcel of developed societies for decades; but as very correctly called ‘an epidemic’ it is
spreading ever so rapidly to the developing countries as well. Type 2 diabetes (T2D) seems to be the
converging point of all the diseases born out of dysfunctional metabolism characterised by insulin
resistance, resulting in glucose intolerance, hyperinsulinemia, hypertension, dyslipidemia and
abdominal obesity (Zinn et al., 2008). T2D predisposes the patient to related ailments like myocardial
ischemia, renal failure, diabetic neuropathy and stroke (Cao and Cooper, 2011; Cheng et al., 2011).
Exercise and dietary restriction has been proved to reduce the detrimental effect of this disease to some
extent, depending on the stage of progression of the disease (Golubovic et al., 2013; Kelley and
Goodpaster, 2001; Potteiger et al., 2012). Nevertheless, anti-diabetic drugs are presently indispensable
for a comprehensive treatment of T2D, especially for physically weak and/or elderly patients and those
who have been detected at an advanced stage of the disease.
1.1. Muscle loss and T2D
Loss of muscle mass and strength is a serious problem, especially observed in the elderly population.
Muscle loss, occurring as a subsequent outcome of chronic diseases such as heart failure, chronic
obstructive pulmonary disorder, cancer, and terminal renal disorder is termed Cachexia (Sakuma and
Yamaguchi, 2012; Thomas, 2007). Loss of muscle mass resulting as a natural consequence of aging, is
known as Sarcopenia (Sakuma and Yamaguchi, 2012). Skeletal muscles, being a major site for glucose
disposal, play a key role in glucose homeostasis. Loss of muscle mass therefore has direct
consequences on glucose utilisation and blood glucose levels. Sarcopenia, together with its common
off-shoot, sarcopenic obesity (where a loss of muscle mass occurs with a simultaneous gain on fat

15
mass) has been found to be strongly associated with insulin resistance in adults, irrespective of their
age, implicating a reduction of muscle mass as an autonomous risk factor for T2D and other metabolic
diseases (Srikanthan et al., 2010).
In normal individuals, quiescent satellite cells localized between the basal lamina and
sarcolemma get activated by HGF and FGF during growth or as a response to muscle damage or
physical exercise. Upon activation, they up-regulate the myogenic master transcription factor MyoD
(Berkes and Tapscott, 2005), which marks the beginning of proliferation and finally, either fuse with
each other to form new muscle fibers replacing the damaged fibers, or merger with the existing fibers
to improve muscle protein turnover (Hawke and Garry, 2001). Lack of muscle regeneration and
turnover associated with a sedentary life style (even more so in the elderly), is caused by a decrease in
satellite cell proliferation and differentiation, and has been suggested as a major reason for muscle loss
(Sakuma and Yamaguchi, 2012). Insulin has been found to promote proliferation of skeletal muscle
satellite cell cultures (Dodson et al., 1985). Resistance or strength training, which causes muscle injury,
and thereby induces activation of satellite cells and muscle protein turnover, has also been found to be
beneficial in combating the loss of muscle mass (Evans, 2004). However, amino acid supplementation,
together with resistance training has been found to be more effective in promoting protein anabolism,
resulting in an increase in muscle mass, both in young adults and the elderly (Paddon-Jones et al.,
2004; Yarasheski et al., 1993).
Skeletal muscle consists of different muscle fiber types which differ in their constituent myosin
heavy chain isoforms, and metabolic characteristics. They have been classified into slow-twitch (type
1) and fast-twitch (type 2a, 2x, and 2b) fibers (Schiaffino and Reggiani, 2011). Type 1 and 2a fibers are
oxidative, whereas type 2x and 2b are mainly glycolytic. However the fiber-type characteristics vary
between species (Lefaucheur, 2010; Schiaffino and Reggiani, 2011). Major protein members of the
insulin signaling pathway have been found to be differentially expressed in muscles with different fiber
type combinations, leading to differences in insulin responsiveness (Song et al., 1999). The difference

16
in physiology and metabolic characteristics of the fiber types make them respond differentially to
pathophysiological conditions like diabetes, sarcopenia, ageing, denervation sepsis, kidney and heart
failure. The type 1 fibers are more affected by lack of physical activity and denervation-related atrophy.
On the other hand, type 2 fibers are more susceptible to diabetes, heart failure and aging (Macpherson
et al., 2011; Picard et al., 2011; Schiaffino and Reggiani, 2011; von Walden et al., 2012). However,
proteins like PGC1-α, have been found to play a protective role in preventing atrophy in slow-twitch
oxidative fibers (Takikita et al., 2010). Members of the FoxO family, and NF-κB signaling pathway
have also been found to play a key role in fiber-type specific skeletal muscle atrophy (Hunter and
Kandarian, 2004; Sandri et al., 2006).
1.2. Need for T2D drug discovery
Several insulin sensitising drugs, for example, a class of PPAR (peroxisome proliferator-activated
receptors) agonists, known as the thiazolidinediones have been found to be associated with major
adverse side-effects like weight gain, fluid retention in the body, and increased frequency of heart
failure (Shearer and Billin, 2007). Again, anti-diabetic therapies (using for example insulin,
sulfonylureas, or metformin) targeting T2D, by increasing insulin secretion in the secretory pancreatic
beta cells or by inducing glucose uptake in glucose utilizing tissues, have been associated with varying
degrees of contraindications like repeated events of hypoglycemia (Noh et al., 2011). Therefore, the
need for discovery of new compounds that have the potential to be developed into efficient and reliable
drugs is undeniable.
1.3. Tissues and organs involved in T2D
The study of T2D reveals a complex interplay of signals between organs and tissues that takes place in
a metabolically healthy individual, and how the disruption of these signals in T2D patients causes
precipitation of this disease. The skeletal muscles, the adipose tissue, the liver, and the pancreas (figure

17
1) are the most important tissues/organs involved in metabolic homeostasis and hence play a major role
in this disease (Corkey and Shirihai, 2012). In the diseased state, insulin resistance in the skeletal
muscles, together with an increase in gluconeogenesis in the liver results in elevated blood glucose
levels compelling the pancreatic beta cells to produce more insulin. This leads to beta cell exhaustion,
and upon prolonged hyperglycemia, beta cell apoptosis (Butler et al., 2003), causing the progression of
the disease. Adipose tissue in obese individuals is infiltrated with macrophages, which secrete certain
cytokines (e.g. TNF-α), that can directly cause insulin resistance in insulin responsive tissues
(Hotamisligil et al., 1993). Literature holds a huge amount of knowledge on this subject. To stay within
the scope of this thesis, only the cells and tissues relevant for the work done in this particular project
will be discussed.
Fig. 1 Major tissues and organs involved in glucose metabolism and T2D [Adopted and modified
from (Dove, 2002)]. Different organs are involved and affected by diabetes, and have been major drug
targets. This figure shows the production and uptake of glucose by different organs and tissues in the
body of healthy subjects. Glucose is released in blood after food intake. This causes insulin secretion
from the pancreas, leading to glucose uptake in skeletal muscles, liver, and adipocytes. Again, during
fasting conditions, glucose levels are maintained in the blood by hepatic gluconeogenesis and
glycogenolysis.

18
1.4. Pancreatic beta cells in T2D
Pancreatic islets (Islets of Langerhans) consist of five different kinds of endocrine cells: the glucagon
producing α-cells, the ghrelin producing ξ-cells, the pancreatic polypeptide producing pp- or γ-cells,
the somatostatin producing δ-cells and the insulin producing β-cells (Elayat et al., 1995).
One of the major players involved in the strict regulation of blood glucose levels is the
pancreatic β-cell and is therefore, of critical importance in T2D. In initial stages, the progression of the
disease is asymptomatic. Here, the development and progression of insulin resistance in skeletal muscle
is not manifested by an increase in blood glucose. During this phase of the disease progression, the
pancreatic β-cells compensate the growing insulin resistance by producing more insulin, keeping blood
glucose levels within normal limits (Polonsky, 2000). However, beyond this point, the growing insulin
insensitivity in the target tissues causes β-cell exhaustion, and under extreme insulin resistance, leads
to β-cell apoptosis (Butler et al., 2003), which further deteriorates the glycemic control.
1.5. Skeletal muscles and insulin resistance
Skeletal muscle is a major glucose utilizing tissue, responsible for 75 – 80 % of insulin stimulated
glucose uptake (Saltiel and Kahn, 2001; Thiebaud et al., 1982). Under normal conditions, a
postprandial increase in blood glucose level (usually during food intake), induce insulin secretion from
the pancreatic β-cells. Insulin binds to its receptors on target tissues (skeletal muscles, adipose tissue
and liver), triggering the insulin signalling cascade. This results in the translocation of the glucose
transporter 4 (Glut4; highly expressed in skeletal muscles) into the plasma membrane, where it
participates in the transport of glucose across the membrane into the cells (Huang and Czech, 2007).
The glucose in the cell is then used for energy production (glycolysis) or stored in the form of
19
glycogen. In T2D, the insulin responsive tissues (principally the skeletal muscles) become insulin
resistant, leading to an increase in blood glucose levels. Two other glucose transporters, namely Glut1
and Glut12 has been found to cause glucose uptake in skeletal muscles, where the former is responsible
for insulin independent basal transport of glucose and the latter for insulin stimulated glucose transport
(Klip et al., 1996; Stuart et al., 2009). It is thought that Glut12 is an ancestral predecessor of Glut4 and
now functions additionally to the principal Glut4-driven system of glucose transport.
Insulin resistance is a multi-factorial disease, affecting different tissues and is normally
triggered by chronic nutritional surplus. This state of over-nutrition leads to inflammation,
dyslipidemia, and/or gut microbial dysbiosis induced obesity, which feeds into a vicious cycle
contributing to the progression of the insulin resistant state (Johnson and Olefsky, 2013). In
understanding insulin resistance, of key importance are the three major signaling cascades regulating
cellular and whole-body glucose and lipid homeostasis; namely the Insulin, AMPK and Glucosamine
signaling pathway. These signaling pathways mediate a multitude of cellular responses, ranging from
cell growth, differentiation, protein synthesis, to glucose uptake, glycogen synthesis, fatty acid
oxidation, and more (Obici et al., 2002; Taniguchi et al., 2006; Viollet et al., 2009).
1.6. Oxidative stress and insulin resistance
Oxidative stress has been found to be correlated with insulin resistance (Meigs et al., 2007). Increasing
concentrations of glucose has been found to increase oxidative stress in human smooth muscle and
endothelial cells (Ceriello et al., 1996; Du et al., 2000). An increase in oxidative stress, was indicated
by elevated levels of 8-hydroxy-2´ deoxyguanosine (a major dna oxidation product), in mononuclear
cells isolated from whole blood (Dandona et al., 1996), as well as in the urine of diabetic patients, and
could be correlated with the levels of glycosylated hemoglobin (Leinonen et al., 1997). Again the
skeletal muscle of obese insulin resistant subjects showed increased lipid peroxidation (Russell et al.,
2003). Mitochondria, also called ‘the power house of the cell’, are a major source of reactive oxygen

20
species (ROS). ROS are an indispensable part of important cellular processes, normally required to
carry out routine cellular functions. ROS has also been found to function as signaling molecules (Rhee
et al., 2000). Again, anti-oxidant mediated quenching of ROS has been found to inhibit cellular
adaptation to hormetic stressors like physical exercise (Gomez-Cabrera et al., 2008). However
imbalance in the redox equilibrium, leading to elevated levels of ROS, can promote pro-inflammatory
pathways, contributing to abnormal insulin signaling (Wei et al., 2008).
1.7. The insulin signaling pathway
The insulin receptor, when bound to insulin, undergoes auto-phosphorylation, activating its kinase
domain; which leads to the phosphorylation and activation of the insulin receptor substrate (IRS)
proteins (figure 2). The activated IRS proteins are responsible for the initiation of two major signaling
cascades, namely the phosphatidylinositiol-3-kinase (PI3K)-Akt/protein kinase B (PKB) pathway and
the Ras-mitogen-activated protein kinase (MAPK) pathway. The PI3K/Akt pathway mediates most of
the metabolic responses of insulin, where PI3K activates Akt, which causes Glut4 translocation to the
plasma membrane via phosphorylation of Akt substrates of 160 kDa: AS160/TBC1D4 (and TBC1D1,
an isoform of As160) (Sakamoto and Holman, 2008), which is proposed to lead to the activation of a
Rab-GTPase (Sano et al., 2003). Rab proteins in their GTP bound state regulates fundamental
mechanisms in vesicle trafficking. On the other hand the MAPK pathway causes changes in gene
expression and protein activity leading to complex changes in cell behaviour (Avruch, 1998; Taniguchi
et al., 2006).

21
Fig. 2 The insulin signaling pathway [Adopted and modified from (Taniguchi et al., 2006)]. The key
regulatory proteins mediating insulin actions of glucose uptake, glycogen synthesis, inhibition of
gluconeogenesis, protein synthesis, cell growth and differentiation has been highlighted in this figure.
1.8. The AMPK signaling pathway
AMP–activated protein kinase (AMPK), also known as the ‘metabolic master switch’ mediates cellular
responses to the depletion of intracellular ATP levels, caused by hypoxia, heat shock, starvation or
exercise. AMPK when activated (figure 3) down regulates the anabolic pathways driving fatty acid,
cholesterol and protein synthesis; and simultaneously up-regulates the catabolic pathways like
glycolysis, fatty acid oxidation, and biogenesis of new mitochondria in muscles and several other
tissues, resulting in ATP production (Viollet et al., 2009). Two protein kinases, namely, LKB1 and the
β-isoform of Ca2+
/calmodulin-dependent kinase kinase (CaMkkβ) has been shown to be capable of
activating AMPK via phosphorylation of its Thr172 residue (Shaw et al., 2004; Woods et al., 2005).
Research has shown that activation of AMPK in muscles caused both by exercise and AICAR (AMPK
agonist) stimulation leads to an increase in glucose uptake in both diabetic and non-diabetic subjects,

22
through a signaling pathway, distinctly different from the insulin signaling pathway (Koistinen et al.,
2003). The fact that glucose uptake can be enhanced independent of insulin, has made AMPK an
attractive therapeutic target.
It is noteworthy, that in pancreatic β-cells (responsible for insulin secretion) activation of
AMPK causes reduction of glucose stimulated insulin secretion, causing an improvement in glucose
tolerance and β-cell function (Carr et al., 2003). Upon activation, AMPK has been found to
phosphorylate As160 /TBC1D4 and/or TBC1D1, based on the tissue-specific abundance of these
proteins (Cartee and Wojtaszewski, 2007; Taylor et al., 2008), causing an increase in GLUT4
translocation and thereby enhancing glucose uptake. Phosphorylation of the Akt-substrates TBC1D4
and TBC1D1 is therefore the converging point of insulin and AMPK signaling pathways.
Fig. 3 AMPK activation and signaling [Adopted from (Srivastava et al., 2012)]. The figure
demonstrates the activation of AMPK upon ADP or AMP binding by LKB1 and CAMKK2 kinases.
However, till date Thr-172 phosphorylation has only been documented to occur upon AMP binding.
The various cellular actions mediated by activation of AMPK have been depicted here.

23
1.9. The Glucosamine pathway
In insulin responsive tissues, like the skeletal muscles, hyperglycemia leads to the activation of the
Glucosamine pathway, where the enzyme GFAT (glutamine: fructose-6-phosphate amidotransferase)
catalyzes the rate limiting step of converting fructose -6-phosphate to glucosamine-6-phosphate.
Activation of GFAT or the glucosamine pathway acts as an intracellular energy sensor, signaling the
cell to reduce glucose uptake, even in presence of insulin (Marshall et al., 1991; Obici et al., 2002).
1.10. Plant kingdom as a drug depot
Since primitive to modern times, botanicals have been used as a rich source for traditional medicines,
and have served as the foundation of innumerable drug discoveries. Being a rich source of secondary
metabolites, plants have a high potential to influence different cellular mechanisms, including key
signalling pathways balancing energy utilization and storage. Till date, more than 1200 plant species
have been tested for their efficacy against diabetes (Marles and Farnsworth, 1995).
1.11. Plants and experimental models used
1.11.1. Selected medicinal plants studied
Several reviews have collectively described the anti-diabetic and hypo-lipidemic properties of many
natural products (Jung et al., 2006; Marles and Farnsworth, 1995; Yeh et al., 2003); although in many
cases the components and cellular mechanisms responsible for the bioactivity have not been elucidated.
In this study, eight plants were selected, based on either their medicinal background as
traditional anti-diabetics or their significance in the field of food and nutrition. The plants selected were
Echinacea purpurea (purple coneflower), Thymus vulgaris (thyme), Daucus carota (carrots), Brassica
oleracea (broccoli and cabbage), Sambucus nigra (elderflowers), Rhodiola rosea (roseroot), and
Satureja hortensis (summer savory).

24
Different plants of the genus ‘Echinacea’ (belonging to the family Asteraceae) have been
widely studied. Among them E. purpurea, E. pallida, and E. angustifolia are used for medicinal
purposes. These plants are indigenous to different parts of North America, where they are traditionally
used against infections, mild septicemia and snake bites. It has been shown to possess
immunomodulatory, anti-inflammatory, anti-viral, anti-fungal and anti-bacterial properties (Barnes et
al., 2005). In recent studies, extracts and metabolites of E. purpurea, has been found to activate the
peroxisome proliferator- activated receptor gamma (PPARγ, a type II nuclear receptor, regulating fat
storage and glucose metabolism, primarily in adipose tissue) and enhance insulin-stimulated glucose
uptake in adipocytes (Christensen et al., 2009a; Christensen et al., 2009b).
Thymus vulgaris (thyme) is one of the most commonly used aromatic herbs used to enhance the
flavor of food. Other than its use as a condiment, Thymus vulgaris has been used as an alternative
medicine for its anti-oxidant, anti-microbial, anti-spasmodic, and detoxifying properties
(Baranauskiene et al., 2003). Extracts of thyme has been found to ameliorate the lipid profile of
streptozotocin-induced type 1 diabetic rats (Ozkol et al., 2013). However, the ability of thyme extracts
to activate PPARγ and improve insulin-stimulated glucose uptake has been published recently
(Christensen et al., 2009a).
Sambucus nigra (elderflowers), belonging to the family Caprofoliaceae, is indigenous to
Northern Africa, Europe, as well as Western and Central Asia. It is generally used to make wine, juice
and preserves, and is thought to have several beneficial effects on health. Sambucus nigra concoctions
have been used as a traditional medicine as a diuretic, and as a treatment against common cold,
influenza, inflammation and diabetes (Kultur, 2007; Swanstonflatt et al., 1991). Elderberries have been
extensively studied in the past for their anti-viral and immunity boosting effects (Roxas and Jurenka,
2007). But elderflowers have also been found to contain several bioactive metabolites like flavonoids,
phenolic acids and triterpenoids (Christensen et al., 2008; Gray et al., 2000). Moreover, aqueous
25
extracts of elderflowers exhibited insulin-like and insulin–releasing effects in in vitro studies performed
with mouse abdominal muscle cells and clonal pancreatic beta (BRIN-BD11) cells (Gray et al., 2000).
Satureja hortensis (summer savory), belonging to the family Lamiaceae, is native to Atlantic
Canada. The essential oil of S. hortensis has been found to exhibit anti-oxidant, anti-microbial, anti-
nociceptive and anti-inflammatory properties (Dikbas et al., 2012; Hajhashemi et al., 2012; Kotan et
al., 2012). Very recently, supplements of savory plants native to Southern Iran (Satureja khuzestanica),
was used to assess changes in metabolic parameters of hyperlipidemic subjects with T2D. A significant
reduction in total and LDL cholesterol and an improvement in HDL cholesterol levels in blood were
observed (Vosough-Ghanbari et al., 2010).
Rhodiola rosea (rose root), belonging to the family Crassulaceae, is normally found in colder
parts of the world, like Northern and North-Eastern America, Central Asian mountains, and
mountainous regions of Europe. It has been used as a folk medicine in different parts of Asia and
Eastern Europe, and has been found to improve work performance, stimulate the nervous system, and
reduce depression and fatigue (El-Alfy et al., 2012; Ishaque et al., 2012; Mannucci et al., 2012; Noreen
et al., 2013). Moreover it has shown pronounced cardio-protective effects against arrhythmia,
hypertension, and exhibited marked improvement in coronary flow and contractility during post-
ischemic period, and prevention of stress induced cardiac damage (Lee et al., 2012; Li et al., 2006;
Maslov and Lishmanov, 2007). Roseroot extracts has also shown anti-oxidative and as an anti-diabetic
properties in diabetic mice (Kim et al., 2006).
Daucus carota (carrots), belonging to the family Apiaceae, is a commonly used vegetable in
both oriental and occidental cuisines. It contains a large variety of phytochemicals, like the phenolic
compounds, carotenoids, α-tocopherols and polyacetylenes. The relative concentrations of the
phytochemicals vary (among other parameters) within different varieties. For example the purple
carrots (purple haze) generally have relatively higher amounts of anthocyanins, which also contributes
to their higher antioxidant capacity (Metzger and Barnes, 2009). Bioactive secondary metabolites like

26
polyacetylenes have found to have potent antifungal activity, with neurotoxic effects at high
concentrations and cytotoxic effects on cancer cells (Greenwald et al., 2001). The polyacetylenes
falcarinol and falcarindiol have been found to exhibit anti-inflammatory effects and reduce platelet
aggregation (Teng et al., 1989). Moreover falcarinol has shown lipoxygenase inhibitory effects in
mammalian cells (Alanko et al., 1994).
Brassica oleracea (green cabbage and broccoli), belonging to the family Brassicaceae, is also a
commonly consumed vegetable. Broccoli sprouts have been found to exhibit a reduction in hepatic and
plasma cholesterol in hamsters, although a gender dependence was observed, where the reduction in
hepatic cholesterol was higher in females (Rodriguez-Cantu et al., 2011), and triglyceride levels in T2D
patients (Bahadoran et al., 2012) together with a cyto-protective effect against chemical and UV-light
induced carcinogenesis (Dinkova-Kostova et al., 2006; Fahey et al., 1997) in SKH-1 high risk mice.
Green cabbage, too has been shown to have anti-oxidative and anti-proliferative effects on HepG2
(human liver carcinoma) cells (Chu et al., 2002).
1.11.2. Primary porcine myotube cultures as a model for skeletal muscles
Primary cell cultures are believed to serve as better experimental models than cell lines. But obtaining
satellite cells from humans to set up a primary culture is problematic. Due the fact that it is difficult to
obtain a continuous source for human primary myotube cultures, we used porcine primary myotube
cultures (figure 6A) as our experimental model.
Porcine anatomical and physiological characteristics as well as the development of
pathophysiology are very similar to humans (Swindle and Smith, 1998). Moreover, comparable
nutrient requirements, together with metabolic and glycemic control (Larsen et al., 2007) makes it a
viable model for biomedical research.

27
1.11.3. INS 1E cells as a model for pancreatic beta cells
In biochemical research, human pancreatic tissue is scarce and is obtainable only during autopsy.
Moreover, the pancreatic tissue obtained in such conditions is substantially degraded (Butler et al.,
2003). Again the clinical history of the subject going through autopsy is often unavailable. The scarcity
of human pancreatic tissue in health research as well as the complexity involved in handling the fragile
pancreatic endocrine cells individually has led to the development of several beta and alpha cell lines
from rodents. The most commonly used insulin secreting cell lines in beta cell research are INS-1, RIN,
HIT, MIN, and βTC (Skelin et al., 2010). The cell lines vary among themselves in several aspects,
starting from glucose sensitivity, insulin secretion capacity, proliferation rate to sensitivity towards
secretagogues compared to the native pancreatic beta cells (Hohmeier et al., 2000).
The INS-1 cell line (figure 6B) has been used in this project as an experimental model for
pancreatic beta cells. A couple of decades ago, the cell-line was isolated from radiation-induced rat
insulinoma (Asfari et al., 1992).
Fig. 6 Differentiated porcine myotubes and INS-1E cells. Primary porcine myotubes (A) 8 days after
seeding, and INS-1E cells (B) 4 days after seeding.

28
1.12. Overview of the main project: Test for bioactivities in different work packages
The work presented in this thesis is a part of a more elaborate ‘main’ research project, which is
comprised of six work packages (WP). Most of the plants used in the main project was cultivated by
WP1; extraction, bio-assay guided fractionation, chromatographic separation, and characterization was
done by WP2; screening of the extracts were done by a platform of different bio-assays where they
were evaluated for their potential to induce: glucose uptake and PPARγ activation in mammalian
adipocytes (WP3), fat accumulation in C. elegans (WP4), glucose uptake in primary porcine myotube
cultures (WP5), and neuro-protection in organotypic brain slice cultures (WP6). Extracts and fractions
used in this work were made by WP2; otherwise, this thesis is based on independent research done in
WP5. The overview of the main project is given in figure 4. And work flow in WP5 and interlink with
WP2 has been shown in figure 5.
Fig. 4 Structure of the main project. The main project was comprised of six work packages. The
work presented in this thesis is based on the independent work done by WP5.

29
1.13. Hypothesis for WP5
It was hypothesized that the extracts of the plants Thymus vulgaris, Echinacea purpurea, Daucus
carota, Brassica oleracea, Sambucus nigra, Satureja hortensis, and Rhodiola rosea contain bioactive
compounds with anti-diabetic properties, capable of enhancing glucose uptake in skeletal muscles
(tested in myotube cultures) and stimulating insulin secretion in pancreatic beta cells (tested in INS 1E
cell line). The mechanism of action of the bioactive compounds could be related to insulin, AMPK, or
ROS induced glucose uptake, observed in muscles.
Fig. 5 Work flow in WP5. The figure describes the basic workflow and the aim of this project and the
steps where collaboration with WP2 was necessary.
1.14. Study structure
The work presented in the thesis has been divided into three studies. In Study I, majority of the work
involved screening of the plant extracts, and fractions of the selected extracts for glucose uptake in
primary porcine myotubes. The pure compounds present in the bioactive fractions, together with those
known to be inherently present in these plants, as well as some related compounds were screened for

30
their ability to enhance glucose uptake. Part of the work done in this study has resulted in Manuscript I
(attached). The remaining part of the work has been described here in ‘Study I’.
Various bioactive compounds were examined for their ability to increase insulin secretion in
INS 1E beta cell line in Study II. Based on initial screening, some of the compounds were selected for
studying insulin secretion and gene expression under glucotoxic conditions. Most of the work has been
explained in Manuscript II (attached), and the part not included in the manuscript, has been described
under ‘Study II’.
The mechanism of action behind the observed increase in glucose uptake caused by naringenin
and falcarinol was investigated in Study III. In this study, naringenin and falcarinol induced glucose
uptake was tested in presence of different inhibitors, and their impact on phosphorylation of proteins
responsible for Glut4 translocation was examined. This study has been incorporated in Manuscript III.
Additional information has been included, under ‘Study III’.
Studies I, II, and III, each contains a short summary highlighting their respective findings.

31
2. Study I: Study of plant extracts in satellite cell derived primary porcine myotube cultures
2.1. Objective:
To assess the potential of the crude extracts to enhance glucose uptake in primary porcine myotube
cultures, and examine their pro- / anti- oxidative and proliferative potential.
2.2. Methods:
Most of the methods used in Study I have been described in the Manuscript I. Those that have not been
described in Manuscript I have been included here.
2.2.1. Cell proliferation and myotube viability
The isolated satellite cells were seeded on Matrigel (1:50) in 96-well plates. After incubation with
Porcine Growth Medium (PGM; 10% foetal calf serum (FCS), 10% horse serum, 80% DMEM
(Dulbecco’s modified Eagles medium, Life Technologies, Naperville, IL) containing 25 mM Glucose,
and antibiotics (100 IU/mL penicillin, 100 IU/mL streptomycin sulphate, 3 µg/mL amphotericin B, 20
µg/mL gentamycin)), for 72 h, PGM (12.5 mM glucose) containing different treatments were added to
the cells. Fresh media (containing the treatments) was added to the cells during a proliferation period of
4 days. To measure proliferation, cell viability was measured by adding 10 µl of WST-1 reagent
(Roche) per well and incubated for 4hrs. The absorbance was then measured using a microplate reader
(EnVision 2103 multilabel reader, PerkinElmer) at 450 nm, with the reference wavelength being 650
nm. WST-1 is a formazan salt which is cleaved to formazan (dark red) by mitochondrial dehydrogenase
of viable cells. The data was corrected with background measurements of media and WST-1 alone.
In order to estimate cell viability alone, differentiated myotubes were incubated with different
treatments only for 24 h, before WST-1 reagent is added. The rest is performed as stated above.

32
2.2.2. Statistics
The glucose uptake data resulting from the screening of plant extracts were subjected to statistical
analyses, using the ‘Mixed procedure’ of SAS statistical programming software (Ver. 9.2; SAS
Institute Inc., Cary, NC, USA). The model included main effects of factors (plants, plant
extracts/fractions, concentration of plant extracts/fractions, and their interactions. As random effects,
satellite cell cultures from pigs and their replicates were nested within treatments. When overall effects
were significant, LSmeans were separated by pairwise comparison

33
2.3. Results:
Table 1. Plant extracts used in this study, together with the parts of the plants and the solvents used for
extraction*.
Extract
no.
Plant species (Latin) Plant Plant part Solvent Type of
extract
1 Thymus vulgaris Thyme Aerial parts DCM1
Crude
2 Thymus vulgaris Thyme Aerial parts MeOH2
Crude
3 Echinacea purpurea Purple coneflower Roots MeOH1
Crude
4 Echinacea purpurea Purple coneflower Roots DCM2
Crude
5 Echinacea purpurea Purple coneflower Roots DCM1
Crude
6 Echinacea purpurea Purple coneflower Roots MeOH2
Crude
7 Daucus carota (bolero) Carrot Roots DCM1
Crude
8 Daucus carota (bolero) Carrot Roots MeOH2
Crude
9 Daucus carota (purple haze) Carrot Roots DCM1
Crude
10 Daucus carota (purple Haze) Carrot Roots MeOH2
Crude
11 Brassica oleracea Broccoli Aerial parts DCM1
Crude
12 Brassica oleracea Broccoli Aerial parts MeOH2
Crude
13 Brassica oleracea Cabbage Aerial parts DCM1
Crude
14 Brassica oleracea Cabbage Aerial parts MeOH2
Crude
15 Sambucus nigra Elderflower Flowers DCM1
Crude
16 Sambucus nigra Elderflower Flowers MeOH2
Crude
17 Satureja hortensis Summer savory Aerial parts DCM1
Crude
18 Satureja hortensis Summer savory Aerial parts MeOH2
Crude
19 Rhodiola rosea Roseroot Flowers DCM1
Crude
20 Rhodiola rosea Roseroot Flowers MeOH2
Crude
21 Rhodiola rosea Roseroot Roots DCM1
Crude
22 Rhodiola rosea Roseroot Roots MeOH2
Crude
DCM = Dichloromethane, MeOH = Methanol, *Extraction was performed by WP2. 1 and 2 indicates the sequence in which the solvents
were used for extraction. For all plants, other than E. purpurea (where extraction was also made with MeOH as the first and DCM as the
second solvent), DCM was the first and MeOH the second solvent for extraction.

34
To examine the potential of the extracts to enhance glucose uptake, the differentiated myotubes were
either treated with 0.5, 0.7, and 1 mg/mL of the extracts separately, in presence of 750 pM insulin
(figure 6 – 9); or 1 mg/mL extract in absence of insulin (figure 10). A significant increase in glucose
uptake (p = 0.02) was observed when myotubes were treated with 750 pM insulin. All the extracts were
primarily screened on the satellite cells isolated from a single pig, with 6 replicates. The DCM extract
of thyme (T. vulgaris), carrots (D. carota, bolero and purple haze), elderflower (S. nigra) and Roseroot
(R. rosea, flowers) exhibited prominent effects (≥ 50 % at any concentration) on glucose uptake in the
presence of insulin compared to control (750 pM insulin only). An increase of 149.7, 186.6, and 173.5
% (p < 0.001) for thyme (DCM); 222.8, 142.0, and – 20.4 % (p < 0.001) for carrots (bolero, DCM);
67.8, -16.3, and – 68.0 % (p < 0.001) for carrots (purple haze, DCM); 25.6, 65.7, and 65.8 % (p <
0.001) for elderflowers (DCM); and 133.7, 148.0, and 110.5 % (p < 0.001) for roseroot (flowers,
DCM) extracts was observed at 0.5, 0.7, and 1 mg/mL concentrations. A more moderate increase (20 -
50 % at any concentration) of 36.1, 41.2, and 36.2 % (p < 0.001) for DCM2; – 4.1, 119.1, and 28.6 % (p
= 0.6, 0.01, and < 0.001) for MeOH1; and 10.5, 18.0 and 29.9 % (p = 0.1, 0.015, and < 0.001) for
MeOH2 extracts of purple coneflower, compared to control was observed at 0.5, 0.7, and 1 mg/mL
concentrations. Other plant extracts, also showing a moderate increase were elderflower MeOH, and
roseroot DCM extracts, showing an increase of -25.1, 9.4 and 20.4 % (p < 0.001, = 0.18, and 0.009);
and 22.1, 23.9, and 21.8 % (p < 0.002) for 0.5, 0.7, and 1 mg/mL concentrations, respectively.
Glucose uptake experiments when carried out in absence of insulin, the most prominent
increase (> 50 %) was observed for thyme DCM extract (149.4 %, p < 0.001); elderflower, DCM and
MeOH extracts (82.4 and 61.7 %, respectively; p < 0.001); and roseroot DCM extract (104.7 %, p <
0.001). However, a relatively moderate increase (20 - 50 %) was observed for purple coneflower
MeOH1 (21.9 %, p < 0.001) and MeOH
2 (24.3 %, p < 0.001) extracts; roseroot (root) DCM extracts
20.1 %, (p < 0.001). It is important to note here, that E. purpurea DCM2 extract increased glucose
uptake significantly in presence of insulin, but not in its absence.

35
Extracts (mg/mL)
0 0.5 0.7 1
2 -
DO
G u
pta
ke (
% o
f con
trol)
0
50
100
150
200
250
300
3501 T. vulgaris (DCM)
2 T. vulgaris (MeOH)
3 E. pupurea (MeOH1)
4 E. purpurea (DCM2)
5 E. purpurea (DCM1)
6 E. purpurea (MeOH2)
a
b
cd
b b b
a abb
a
bb
b b b
aa
b
Fig. 6 Effect of T. vulgaris and E. purpurea on glucose uptake in presence of 750 pM insulin.
The differentiated myotubes were incubated with 0.0, 0.5, 0.7, and 1 mg/mL of T. vulgaris DCM and
MeOH extract; and E. purpurea MeOH1, DCM
2, DCM
1 and MeOH
2 respectively, for 1 h with 750 pM
insulin, following which, 2-DOG uptake was measured. Values are given as LS means ± SEM of
experiments conducted with satellite cells from 1 pig, expressed as percent of control, where 6
replicates were used per treatment. 1
and 2 indicate the sequence in which the solvents were used for
extraction. For all plants, other than E. purpurea (where extraction was also made with MeOH as the
first and DCM as the second solvent), DCM was the first and MeOH the second solvent for extraction.
The letters a, b, c, and d shows the different significance levels within each extract.

36
Extracts (mg/mL)
0 0.5 0.7 1
2-D
OG
up
take
(%
of
co
ntr
ol)
0
50
100
150
200
250
300
3507 D. carota (bolero, DCM)
8 D. carota (bolero, MeOH)
9 D. carota (purple haze, DCM)
10 D. carota (purple haze, MeOH)
11 B. oleracea (broccoli, DCM)
12 B. oleracea (broccoli, MeOH)
b
c
d
aa a
a
b
c
d
a a
bbbc c
aa
a
Fig. 7 Effect of D. carota and B. oleracea on glucose uptake in presence of 750 pM insulin.
The differentiated myotubes were incubated with 0.0, 0.5, 0.7, and 1 mg/mL of D.carota (varieties
bolero and purple haze) DCM and MeOH extract; and B. oleracea DCM and MeOH extract,
respectively for 1 h with 750 pM insulin, following which, 2-DOG uptake was measured. Values are
given as LS means ± SEM of experiments conducted with satellite cells from 1 pig, expressed as
percent of control, where 6 replicates were used per treatment. The letters a, b, c, and d shows the
different significance levels within each extract.

37
Extract (mg/mL)
0 0.5 0.7 1
2-D
OG
up
take
(%
of
co
ntr
ol)
0
20
40
60
80
100
120
140
160
180 13 B. oleracea (cabbage, DCM)
14 B. oleracea (cabbage, MeOH)
15 S. nigra (DCM)
16 S. nigra (MeOH)
17 S. hortensis (DCM)
18 S. hortensis (MeOH)
a
b bc
c
b
bc
c
b
c c
ac
b
c
b b b
a a
a
Fig. 8 Effect of B. oleracea, S. nigra and S. hortensis on glucose uptake in presence of 750 pM insulin.
The differentiated myotubes were incubated with 0.0, 0.5, 0.7, and 1 mg/mL of DCM and MeOH
extracts of B. oleracea, S. nigra and S. hortensis, respectively, for 1 h with 750 pM insulin, following
which, 2-DOG uptake was measured. Values are given as LS means ± SEM of experiments conducted
with satellite cells from 1 pig, expressed as percent of control, where 6 replicates were used per
treatment. The letters a, b, c, and d shows the different significance levels within each extract.

38
Extracts (mg/mL)
0 0.5 0.7 1
2-D
OG
up
take (
% o
f con
trol)
0
50
100
150
200
250
30019 R. rosea (flowers, DCM)
20 R.rosea (flowers, MeOH)
21 R. rosea (roots, DCM)
22 R. rosea (roots, MeOH)
a
bc
d
b b b
b b b
b b b
Fig. 9 Effect of R. rosea on glucose uptake in presence of 750 pM insulin.
The differentiated myotubes were incubated with 0.0, 0.5, 0.7, and 1 mg/mL of DCM and MeOH
extracts of R. rosea flowers and roots, respectively, for 1 h with 750 pM insulin, following which, 2-
DOG uptake was measured. For R. rosea, two plant parts were used for extraction, as indicated in the
plot. Values are given as LS means ± SEM of experiments conducted with satellite cells from 1 pig,
expressed as percent of control, where 6 replicates were used per treatment. The letters a, b, c, and d
shows the different significance levels within each extract.

39
Extracts
C 1 2 3 4 5 6 7 8 9 10 11 12 13 14 15 16 17 18 19 20 21 22
2-D
OG
up
take
(%
of
co
ntr
ol)
0
50
100
150
200
250
300GU < 20 %
GU > 50 %
GU 20 - 50 %
***
***
***
***
***
***
***
***
***
***
***
***
**
***
*
***
***
***
**
Fig. 10 Effect of all the extracts on insulin independent glucose uptake
The differentiated myotubes were incubated with 1 mg/mL of all the plant extracts for 1 h, following
which 2-DOG uptake was measured. Values are given as LS means ± SEM of experiments conducted
with satellite cells from 1 pig, expressed as percent of control, where 6 replicates were used per
treatment. C = control (DMSO in media), GU = glucose uptake. Table 1 lists all the names of the
extracts used; *p < 0.05, **p <0.01, ***p < 0.001 vs. control.
The extracts showing > 50 % increase in the preliminary screening experiments were selected for the
verification of the observed bioactivity. Therefore, Thyme DCM extract, roseroot (flower) DCM
extract, carrot (bolero) DCM extract, and elderflower DCM extract were selected for further
experiments conducted on satellite cells of three pigs, using the same concentration range in presence
and absence of insulin (figure 10, 11). At 0.5, 0.7, and 1 mg/mL concentrations, the thyme DCM
extract enhanced glucose uptake by 59.1, 70.5, and 63.4 % (p < 0.001); the roseroot (flower) DCM

40
extract by 60.7, 64.4, and 33.5 % (p < 0.001); carrot (bolero) DCM extract by 79.8, 19.2, and - 62 % (p
< 0.001); and elderflower DCM extract by 48.2, 56.3, and 56.3 % (p < 0.001) respectively (figure 11)
in presence of 750 pM insulin. Here thyme and elderflower DCM extracts showed a stable increase at
all concentrations tested; whereas carrots (bolero) DCM extracts exhibited a sharp fall in glucose
uptake with increasing concentrations. For roseroot (flowers) DCM extract, the increase was stable for
0.5 and 0.7 mg/mL; after which there was a comparative decrease in glucose uptake, although it was
still significantly high compared to control. It can be expected, that a linear increase in glucose uptake
with increasing concentration of extracts could have been observed at a lower concentration range.
When examined independent of insulin at a concentration of 1 mg/mL (figure 12), the DCM extracts of
thyme, roseroot (flowers), carrots (bolero), and elderflowers increased glucose uptake by 65.2 % (p <
0.001), 38.2 % (p < 0.001), - 44.5 % (p < 0.001), and 72.8 % (p < 0.001). The glucose uptake at1
mg/mL concentration was found to be comparable in presence or absence of insulin for the DCM
extracts of thyme, roseroot (flowers), and carrots (bolero); with the exception of elderflowers, where
the insulin- independent glucose uptake was found to be considerably higher.
In order to verify, whether the DCM extracts of thyme, roseroot (flowers), carrots (bolero), and
elderflowers caused oxidative stress or were in any way detrimental to the myotubes, ROS generation
and cell viability in presence of the chosen extracts were determined. Generation of intracellular ROS
in presence of the DCM extracts of thyme, roseroot (flowers), and carrots (bolero) have been illustrated
in figure 13, and that for the elderflower DCM extract has been mentioned in Manuscript I. The
myotubes were treated with 100, 200 and 500 µg/mL of the extracts for both the assays. The thyme and
roseroot extracts reduced intracellular ROS significantly at all concentrations tested (p < 0.001),
whereas the carrots (bolero) decreased intracellular ROS generation only at the highest concentration
(500 µg/mL) tested (p < 0.001), compared to control. None of the extracts showed any significant
increase or decrease in myotube viability (figure 14) compared to their respective controls; except
carrots (bolero), which showed a significant increase and decrease in mitochondrial activity at the

41
concentrations of 200 µg/mL (p = 0.004) and 500 µg/mL (p < 0.001), respectively, where at the latter
concentration, a sharp reduction in myotube viability was observed. However, a tendency (p = 0.07) to
increase the mitochondrial activity of the myotubes was observed for elderflower DCM extract at the
concentration of 500 µg/mL.
Impact on satellite cell proliferation was studied for D. carota (purple haze) MeOH extract and
S. nigra DCM extract at the concentration of 100, 200 and 500 µg/mL for 4 days (figure 15). There was
a significant increase in myoblast proliferation in the presence of 500 µg/mL carrot (purple haze)
MeOH extract, all three days, i.e. after 24 (p = 0.006), 48 (p = 0.008), and 96 (p < 0.001) h of
incubation, compared to their respective controls. An increase was also observed at a concentration of
200 µg/mL (p = 0.02) but only after 96 h of incubation. The treatment containing 500 µg/mL of
elderflower DCM extract showed significant increase in proliferation compared to its control after 48
(p = 0.01) and 96 (p = 0.002) h of incubation.
Based on the results obtained from glucose uptake studies, D. carota (bolero) DCM extract, and
S. nigra DCM and MeOH extract, were selected for further investigation. To facilitate identification of
the potential bioactive components in these three extracts, they were separated by flash
chromatography (fractionation done by WP2). Fractionation of carrot (bolero) DCM extract resulted in
8 fractions (A to H). The elderflower DCM and MeOH extract resulted in 7 fractions each (A to G). All
the fractions were then screened for their potential to induce GU independently at the concentrations of
50 and 100 µg/mL. Subsequently, the bioactive fractions were separated and constituent compounds,
together with some other related polyphenols were tested for their ability to enhance glucose uptake in
myotubes. The results for elderflower extracts, fractions, its constituent compounds and related
polyphenols have been included and discussed in Manuscript I.
None of the carrot fractions showed any significant increase in glucose uptake (figure 16).
Therefore, it was difficult to identify the compounds behind the observed activity of carrot (bolero)
DCM extract with the help of fractionation based on this particular bioassay. However, in glucose

42
uptake experiments conducted in adipocytes (WP3), fractions C and F showed an increase in insulin
stimulated glucose uptake. Upon chromatographic separation, fraction C and F was found to contain
falcarinol and falcarindiol as major components (chromatographic separation done by WP2) and were
purified using semi-preparative HPLC (WP2). Hence, the two carrot polyacetylenes: falcarinol and
falcarindiol were chosen to be tested for their potential to induce glucose uptake in myotubes (figure
17) and were tested at the concentrations of 0.3, 1, 3, 10, and 30 µM in presence or absence of 10 nM
insulin. Falcarinol exhibited an insulin-independent increase in glucose uptake in a dose-dependent
manner, with a maximum increase of 32. 5 % (p < 0.001) at a concentration of 10 µM, compared to
control; whereas, in presence of insulin the highest increase (16.0 %, p < 0.001) was observed at a
concentration of 3 µM, compared to myotubes treated with 10 nM insulin only. Falcarindiol caused an
insulin-independent increase in glucose uptake at all concentrations tested, compared to control;
although the increase was not significantly different between the tested concentrations. At 0.3 and 30
µM (lowest and highest concentration tested), an increase of 11.5 % (p = 0.01), and at 1, 3, and 10 µM
concentrations, an increase of 17.7, 18.9, and 19.7 % (p < 0.001) was observed compared to control.
Like falcarinol, in presence of insulin, the highest increase was observed at 3 µM (12.8 %, p = 0.006)
compared to myotubes treated with 10 nM insulin only.
Naringenin was identified as one of the compounds present in the S. nigra DCM extract
fractions, which could enhance insulin independent glucose uptake in myotubes. Naringenin, at the
concentrations of 3, 10, 30, and 100 µM was examined for its potential to enhance glucose uptake in
presence and absence of 10 nM insulin (figure 18). A significant increase in glucose uptake was
observed at all concentrations tested, in presence or absence of insulin. The highest increase in absence
of insulin was 19.4 % (p < 0.001) at a concentration of 10 µM, compared to control. At all other
concentrations the increase was slightly less, but statistically equivalent to that observed at 10 µM.
However, in presence of insulin a highest increase of 22.9 % (p < 0.001) was observed at a
concentration of 3 µM compared to myotubes treated with 10 nM insulin only. Here, a significant

43
decrease in glucose uptake was observed with increasing concentrations of naringenin (10 and 30 µM)
compared to that observed at 3 µM; although the values were still significantly higher compared to
myotubes treated with 10 nM insulin only. At a concentration of 100 µM, there was a numerical
increase in glucose uptake, but the value was statistically equivalent to that observed at 3, 10 and 30
µM concentrations.
S. nigra (DCM) extract (mg/mL)
0 0.5 0.7 1
2 -
DO
G u
pta
ke
(%
co
ntr
ol)
0
25
50
75
100
125
150
175
200
T. vulgaris (DCM) extract (mg/mL)
0 0.5 0.7 1
2 -
DO
G u
pta
ke
(%
co
ntr
ol)
0
25
50
75
100
125
150
175
200
******
***
A
R. rosea (flower, DCM) extract (mg/mL)
0 0.5 0.7 1
2 -
DO
G u
pta
ke
(%
co
ntr
ol)
0
25
50
75
100
125
150
175
200
*** ***
**
B
D. carota (bolero, DCM) extract (mg/mL)
0 0.5 0.7 1
2 -
DO
G u
pta
ke
(%
co
ntr
ol)
0
25
50
75
100
125
150
175
200 ***
**
C
****** ***
D
Fig. 11 Effect of selected extracts on glucose uptake in presence of 750 pM insulin
The differentiated myotubes were incubated with 0.5, 0.7, and 1 mg/mL of (A) T. vulgaris DCM, (B)
R. rosea (flowers) DCM, (C) D. carota (bolero) DCM, and (D) S. nigra DCM extracts for 1 h,
following which, 2 - DOG uptake was measured. Values are given as LS means ± SEM of experiments
conducted with satellite cells from 3 pigs, expressed as percent of control, where 6 replicates were used
per pig per treatment, *p < 0.05, **p <0.01, ***p < 0.001 vs. control.

44
DCM extracts
C
T. vulga
ris
R. r
osea
(flower
s)
D. c
arot
a (b
oler
o)
S. n
igra
2 -
DO
G u
pta
ke (
% c
ontr
ol)
0
25
50
75
100
125
150
175
200
***
**
***
***
Fig. 12 Effect of selected extracts on insulin independent glucose uptake
The differentiated myotubes were incubated with 1 mg/mL of T. vulgaris DCM, R. rosea (flowers)
DCM, D. carota (bolero) DCM, and S. nigra DCM extracts for 1 h, following which, 2 - DOG uptake
was measured. Values are given as LS means ± SEM of experiments conducted with satellite cells from
3 pigs, expressed as percent of control, where 6 replicates were used per pig per treatment. C = control
(DMSO in media), *p < 0.05, **p <0.01, ***p < 0.001 vs. control.

45
Time (mins)
0 50 100 150 200 250
Flu
ore
scen
ce
15000
20000
25000
30000
35000
40000Control
H2O2
R. rosea flowers, DCM (100 ug / mL)
R. rosea flowers, DCM (200 ug / mL)
R. rosea flowers, DCM (500 ug / mL)
B
***
]***
Time (mins)
0 50 100 150 200 250
Flu
ore
scen
ce
15000
20000
25000
30000
35000
40000 Control
H2O2
T. vulgaris DCM (100 ug / ml)
T. vulgaris DCM (200 ug / ml)
T. vulgaris DCM (500 ug / ml)
A
***
]***
time (mins)
0 50 100 150 200 250
Flu
ore
scen
ce
15000
20000
25000
30000
35000
40000 Control
H2O2 (100 µM)
D. carota, DCM (100 µg / mL)
D. carota, DCM (200 µg / mL)
D. carota, DCM (500 µg / mL)
***
***
C
Fig. 13 Effect of selected extracts on reactive oxygen species generation
The effect of (A) T. vulgaris, (B) R. rosea (flower) and (C) D. carota DCM extracts on the generation
of reactive oxygen species (ROS) determined at three different concentrations by intracellular 2,7-
dichlorofluorescein oxidation. H2O2 was used as positive control. The x-axis shows every 5th data
point. Values are given as LS means ± SEM of experiments conducted with satellite cells from 3 pigs,
expressed as percent of control, where 6 replicates were used per pig per treatment. Control = DMSO
in media; *p < 0.05, **p <0.01, ***p < 0.001 vs. control.

46
DCM extracts (µg/mL)
0 100 200 500
Absorb
ance
0.0
0.2
0.4
0.6
0.8
1.0
1.2
1.4
1.6
T. vulgaris
R. rosea (flower)
D. carota (bolero)
S. nigra
***
**
Fig. 14 Effect of selected extracts on myotube viability
The effect of T. vulgaris, R. rosea (flower) and D. carota (bolero) DCM extracts on myotube viability,
where absorbance values (A450 nm-A650 nm) are proportional to the mitochondrial activity in viable
myotubes after exposure to treatment for 24h. Values are given as LS means ± SEM of experiments
conducted with satellite cells from 3 pigs, where 6 replicates were used per pig per treatment. Control =
DMSO in media; *p < 0.05, **p <0.01, ***p < 0.001 vs. control.

47
Day1 Day 2 Day 4
Absorb
ance
0.2
0.4
0.6
0.8
1.0
1.2
1.4
1.6
1.8 Control
Insulin
100 µg/mL
200 µg/mL
500 µg/mL
***
***
Day1 Day 2 Day 4
Absorb
ance
0.2
0.4
0.6
0.8
1.0
1.2
1.4
1.6
1.8 Control
Insulin
100 µg/mL
200 µg/mL
500 µg/mL
***
**
*
BA
*
Fig. 15 Effect of selected extracts on proliferation of myoblasts
The effect of (A) D. carota (purple haze) MeOH extract and (B) S. nigra DCM extracts on satellite
cells isolated from porcine skeletal muscles. The absorbance values (A450 nm-A650 nm) are proportional to
the mitochondrial activity in viable myoblasts after exposure to 100, 200 and 500 µg/mL of the
extracts. Fresh media containing the treatments were added to the cells every day for 4 days. Insulin
(100 nM) was used as a positive control. Values are given as LS means ± SEM of experiments
conducted with satellite cells from 3 pigs, where 6 replicates were used per pig per treatment. Control =
DMSO in media; *p < 0.05, **p <0.01, ***p < 0.001 vs. control. Here, the significant differences have
been indicated for day 4, compared to its respective control.
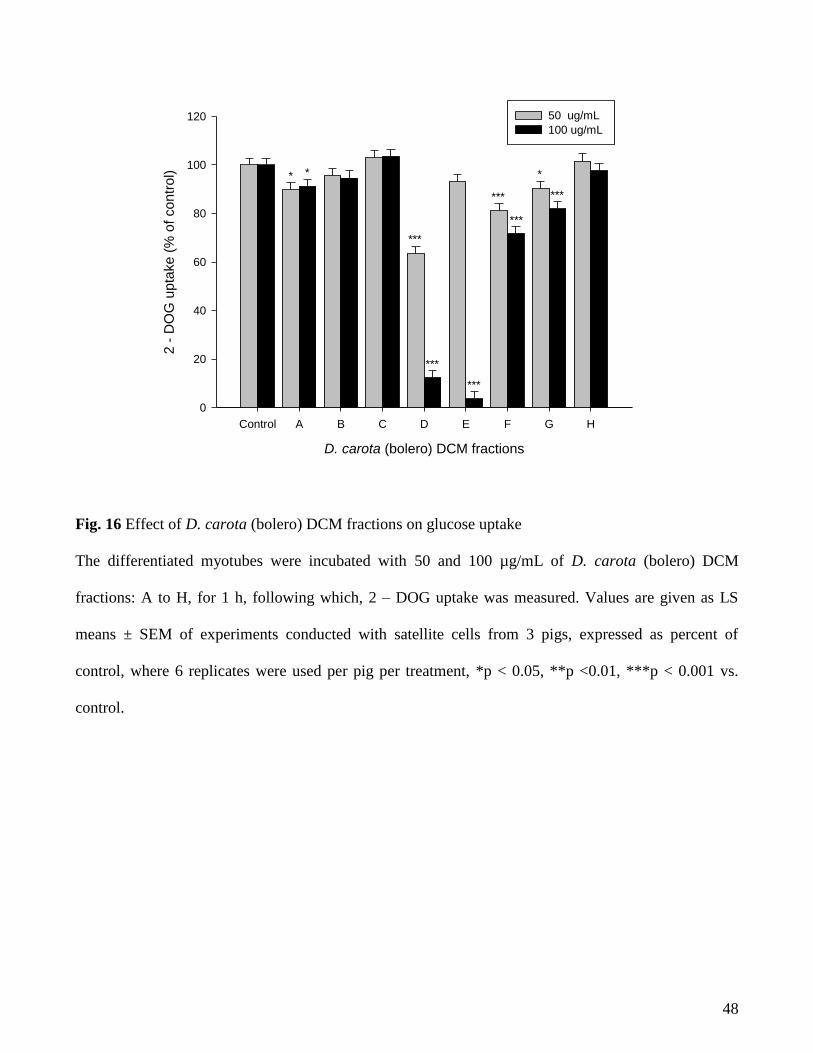
48
D. carota (bolero) DCM fractions
Control A B C D E F G H
2 -
DO
G u
pta
ke (
% o
f con
trol)
0
20
40
60
80
100
120 50 ug/mL
100 ug/mL
* *
***
***
***
***
*** ***
*
Fig. 16 Effect of D. carota (bolero) DCM fractions on glucose uptake
The differentiated myotubes were incubated with 50 and 100 µg/mL of D. carota (bolero) DCM
fractions: A to H, for 1 h, following which, 2 – DOG uptake was measured. Values are given as LS
means ± SEM of experiments conducted with satellite cells from 3 pigs, expressed as percent of
control, where 6 replicates were used per pig per treatment, *p < 0.05, **p <0.01, ***p < 0.001 vs.
control.

49
Falcarinol (µM)
0 0.3 1 3 10 30
2 D
OG
- u
pta
ke (
% o
f co
ntr
ol)
80
100
120
140
160
a
ccd
de
e e
e
Falcarindiol (µM)
0 0.3 1 3 10 30
2 -
DO
G u
pta
ke (
% o
f co
ntr
ol)
80
100
120
140
160
a
b b
bcbc bcbc
bc
cdd d
ddecd
b bbc
A B
Fig. 17 Effect of falcarinol and falcarindiol on glucose uptake in presence or absence of 10 nM insulin
The differentiated myotubes were incubated with different concentrations of (A) Falcarinol or (B)
Falcarindiol in presence (grey bars) or absence (black bars) of 10 nM insulin for 1 h, following which,
2 - DOG uptake was measured. Values are given as LS means ± SEM of experiments conducted with
satellite cells from 3 pigs, expressed as percent of control, where 6 replicates were used per pig per
treatment, *p < 0.05, **p <0.01, ***p < 0.001 vs. control. [This work has been contributed to the
supporting Manuscript II (Effects of falcarinol and falcarindiol on glucose uptake in adipocytes and
muscle cells, PPARγ transactivation and adipocyte differentiation)]

50
Naringenin (µM)
0 3 10 30 100
2-D
OG
up
take
(%
of
co
ntr
ol)
80
90
100
110
120
130
140
150
a
b b
bb b
c
d
cd
d
Fig. 18 Effect of naringenin on glucose uptake in presence or absence of 10 nM insulin
The differentiated myotubes were incubated with different concentrations of naringenin in presence
(grey bars) or absence (black bars) of 10 nM insulin for 1 h, following which, glucose uptake was
measured. Values are given as LS means ± SEM of experiments conducted with satellite cells from 3
pigs, expressed as percent of control, where 6 replicates were used per pig per treatment, *p < 0.05, **p
<0.01, ***p < 0.001 vs. control.

51
2.4. Discussion
Inadequate GU in major glucose utilizing tissues is a major aspect of T2D. Plants provide a rich source
of an array of potentially bioactive secondary metabolites and have contributed abundantly to the
pharmaceutical and nutraceutical industry.
To take advantage of the differential solubility of the plant compounds, DCM and MeOH were
chosen as extraction solvents, for their capacity to dissolve non-polar and polar compounds,
respectively. It was interesting to note that the extracts showing pronounced increase in glucose uptake
were primarily DCM extracts. DCM being a solvent of low polarity, this observation might indicate
that the compounds or group/class of compounds responsible for the enhancement of glucose uptake
are relatively non-polar.
In order to investigate any synergistic potential, these extracts were evaluated both in presence
and absence of insulin. In in vitro studies, an insulin concentration of ≥ 10 nM is considered to be
unphysiologically high (Li et al., 2005); therefore a biologically viable concentration of insulin (750
pM) (Iwase et al., 2001) was used in the screening studies to make the results physiologically relevant.
Most of the extracts that showed a prominent increase in glucose uptake in presence of insulin
also did the same when tested independently. Out of the 22 extracts screened in this study for increase
in glucose uptake in primary porcine myotube cultures, an impressive increase in glucose uptake was
observed by T. vulgaris (thyme) DCM extract, D. carota (carrot), bolero DCM extract, R. rosea
(roseroot), flower DCM extract and S. nigra (elderflower) DCM extract both in presence and absence
of insulin, with the exception of D. carota (carrot), bolero DCM extract, which did not show an
increase when tested in absence of insulin. This can be explained by the cytotoxicity of this extract at
the concentrations used in this particular experiment. Other plant extracts, which showed a relatively
moderate increase (> 20 % but < 50 %) in glucose uptake in the initial screening experiments, were: E.
purpurea (purple coneflower) MeOH1, DCM
2, and MeOH
2; and R. rosea (roseroot) root, DCM
extracts. E. purpurea DCM2 and DCM
1 are both DCM extracts of purple cone flower. In the case of

52
DCM2, the plant parts were first extracted with MeOH and later with DCM, and in case of DCM
1,
extraction was done in opposite order. But DCM2 is found to be more bioactive than DCM
1. The reason
behind this could be that, due to dissimilar extraction sequence, the fellow components present in the
extracted pool could be different, which means that the possible inhibitory effect of the fellow
compounds in the extracts are not comparable.
Based on the initial screening results, T. vulgaris (thyme) DCM extract, D. carota (carrot),
bolero DCM extract, R. rosea (roseroot), flower DCM extract and S. nigra (elderflower) DCM extract
were selected for further verification of their bioactivity. When verified using satellite cells from three
pigs, there was a reduction in the glucose uptake values for all the selected extracts (still showing an
increase of approx. 50 % and above) compared to those obtained in the initial screening experiments
carried out with satellite cells from one pig. This could be due to the biological variation introduced by
increasing the number of pigs used in the experiment.
Oxidative stress has been implicated as a contributing factor in insulin resistance. Therefore T.
vulgaris (thyme) DCM extract, D. carota (carrot), bolero DCM extract, R. rosea (roseroot), flower
DCM extract and S. nigra (elderflower) DCM extract were tested for their capacity to induce oxidative
stress based on the formation of ROS. Evaluation of intracellular ROS generation by these extracts
revealed significant anti-oxidative potential. The reduced production of intracellular ROS observed
here, could be attributed to the phenolic acid and flavonoid composition of these plants (Wojdylo et al.,
2007).
A decrease in satellite cell proliferation and differentiation is a major cause of Sarcopenia which
is caused by a reduction in skeletal muscle mass. The skeletal muscle being the primary site for glucose
disposal, muscle loss aggravates hyperglycemia, especially in the elderly. Insulin has been found to
enhance cell proliferation and growth (Malaguarnera et al., 2012). D. carota (purple haze) MeOH
extract and S. nigra DCM extract were examined for their potential to promote satellite cell

53
proliferation. Both the extracts were able to improve cell proliferation, also in comparison to insulin.
This is the first account showing effects of S. nigra extracts on cell proliferation.
Considering the priorities of work packages, and the fact that WP2 was responsible for
fractionation of all the prioritised extracts, we decided to continue with two of the four extracts that
showed pronounced effect on glucose uptake in myotubes. D. carota (bolero) DCM, and S. nigra
DCM and MeOH extracts were chosen for fractionation to aid identification of the constituent bioactive
compounds.
S. nigra DCM and MeOH extracts, their fractions, the constituent bioactive compounds, and related
polyphenols have been discussed in Manuscript I. Since among the carrot varieties screened, only
carrot (bolero) has been chosen for fractionation and further studies, carrot (bolero) will be indicated as
carrots, here onwards.
Generally fractionation is expected to concentrate and relatively separate the bioactive
component (s); but a complete loss of bioactivity in carrot fractions was observed compared to the
carrot DCM extract. The loss of bio-activity when fractionated might indicate that part of the increase
in glucose uptake exhibited by the extracts could be due to synergistic effects. Inhibition by some other
compounds present in relatively larger amounts in specific fractions, compared to the extract could also
be a possibility. Such synergistic interactions have been observed in previous studies (Atangwho et al.,
2012; Christensen et al., 2009a). Again the fact that the carrot fractions C and F induced glucose uptake
in adipocytes (in presence of insulin) but not in myotubes (tested independent of insulin), could
indicate that the mode of action of the compounds present in these fractions were cell-type specific,
and/or dependent on insulin stimulation for their bioactivity, and/or the inhibition/activation of the
constituent components are manifested differently in different cell types.
This is the first account, demonstrating the potential of the polyacetylenes, falcarinol and
falcarindiol (isolated from carrots) to enhance glucose uptake. Other than its prominent anti-microbial
properties (Xu et al., 2009), Falcarinol has been mostly studied in relation to its pro-apoptotic potential,

54
and has been shown to have remarkable anti-cancer properties (Zaini et al., 2012a). It has been found to
exhibit both cyto-protective and apoptotic effects on CaCo-2 cells at low and high concentrations,
respectively (Young et al., 2007). Again, both falcarinol and falcarindiol have been found to show
hormetic effects on myotubes; where at relatively high concentrations it caused oxidative stress, but at
low concentrations it showed a cyto-protective effect (Young et al., 2008). Very interestingly, it has
been reported to induce neurite formation, which is an essential process in neuronal development; by
increasing intracellular c-AMP and causing the activation of c-AMP dependent protein kinase A and
mitogen activated protein kinase (MAPK) in PC12D cells (Wang et al., 2006). It is well known that
increase in intracellular AMP levels during low cellular energy levels, activates AMPK, which induces
glucose uptake, glycolysis, and fat oxidation. The activation of AMPK by c-AMP is relatively unclear.
In a previous study, carried out in adipocytes, c-AMP has been found to activate AMPK, although
several other cellular mediators have been identified to be involved in this process (Omar et al., 2009).
Recently, p38 MAPK has been found to be activated by insulin, contraction and other cellular stimuli
that is thought to regulate the activity and not the translocation of Glut4 (Somwar et al., 2002). Again,
inhibition of p38 MAPK has been found to inhibit glucose uptake caused by the plant alkaloid
Barberine. It has recently been shown that p38 MAPK is a downstream target of AMPK, and is
involved in AMPK stimulated glucose uptake in L6 myotubes (Cheng et al., 2006). Therefore the effect
of falcarinol on activation of MAPK and increasing the c-AMP levels could provide a rationale for the
increased glucose uptake observed in primary myotubes. The similarity in the chemical structure of
falcarinol and falcarindiol, could explain the bioactivity observed for the latter, and at least partially
that observed in carrot DCM extract.
Naringenin, the bioactive component identified from S. nigra extracts has been discussed in
Manuscript I.

55
2.5. Short summary:
Out of the 8 different plants screened for their potential to increase glucose uptake, those showing an
increase of ≥ 20% were
T. vulgaris (thyme)
E. purpurea (purple coneflower)
D. carota (bolero)
R. rosea
S. nigra
Among these five bioactive plants, the two plants chosen for fractionation were
D. carota (bolero)
S. nigra
The S. nigra fractions showed bioactivity, whereas the D. carota (bolero) fractions did not.
Pure compounds known to be present in S. nigra and other related polyphenols, together with those
identified in the S. nigra bioactive fractions were studied for their bioactivity.
Among the tested compounds, naringenin and kaempferol showed maximum increase in glucose
uptake.
The two carrot polyacetylenes, falcarinol and falcarindiol were examined for their bioactivity.
It was shown for the first time that falcarinol and falcarindiol can enhance glucose uptake.

56
3. Study II: Studying the influence of selected elderflower compounds and related polyphenols in clonal beta cells
3.1. Objective:
To investigate any possible effect of the selected pure compounds on insulin secretion, and study their
effect on genes involved in beta cell function, survival, apoptosis and stress.
3.2. Methods:
All methods used have been described in Manuscript II. The RT-PCR analysis was done with the help
of Aros Applied Biotechnology A/S.
3.3. Results:
The pure compounds: FeA, CaA, p-CA, naringenin, kaempferol, quercetin and Q-3-O-G were tested
for their acute effects on insulin secretion in clonal INS-1E cells. The effect of FeA, p-CA, kaempferol,
and Q-3-O-G on insulin secretion has been illustrated in figure 19. All the compounds were tested at
0.01 and 1 µM concentrations in presence of 16.7 mM glucose. A significant increase of 13.4 (p =
0.002) and 22.3 (p < 0.001) % was observed at 0.01 and 1 µM concentrations for FeA; and that of 11.7
(p = 0.003) % was observed at 0.01 µM concentrations for Q-3-O-G, compared to their respective
controls (16.7 mM glucose). Kaempferol and p-CA did not show any significant increase in insulin
secretion. The difference in insulin secretion between cells treated with 3.3 and 16.7 mM glucose in
these experiments varied between 331 to 387 %, indicating the sensitivity of the INS-1E cells to
increase in glucose concentrations. Based on the insulin secretion results obtained from the acute-
exposure experiments, the phenolic compounds: CaA, naringenin and quercetin were chosen for further
studies. These phenolic compounds were investigated further for their effects on insulin secretion
following chronic exposure, in the presence of low (3.3 mM) or high (16.7 mM) glucose, and under
glucotoxic conditions. Moreover, the effect of the phenolic compounds on the expression of genes

57
involved in beta cell function, survival, apoptosis and stress were studied under normoglycemic and
glucotoxic conditions. All the studies investigating the effect of CaA, naringenin and kaempferol on
INS-1E cells have been described in Manuscript II.
3.3
mM
G
16.7
mM
G
16.7
mM
G +
0.0
1 uM
16.7
mM
G +
1 u
M
Insu
lin s
ecre
tion
(ng/m
L)
0
20
40
60
80
100
120
140
160 Ferulic acid
Kaempferol
p-Coumaric acid
Q-3-beta-D- glucoside
**
***
**
Fig. 19 Effect of phenolic compounds on insulin secretion in INS-1E cells after acute exposure.
INS-1E cells were grown in media containing 11 mM glucose for 72 h, thereafter incubated for 1 h in
either 3.3 mM glucose or 16.7 mM glucose in the presence or absence of the compounds at 10-8
and 10-
6 M concentrations, following which the supernatant was harvested and insulin content measured. Data
are shown as mean ± s.e.m. *p < 0.05, **p < 0.01, ***p < 0.001. The stars indicate significant
differences in insulin secretion within each compound, compared to their respective controls (16.7 mM
glucose).
3.4. Discussion:
Studies investigating the effect of CaA, naringenin and quercetin on INS-1E cells have been discussed
in Manuscript II.
58
3.5. Short summary:
Seven phenolic compounds among the S. nigra secondary metabolites and the related polyphenols
tested in Study I were selected for further examination of their insulin secreting capabilities in INS-1E
cells. They are:
CaA
p-CA
FeA
Kaempferol
Naringenin
Quercetin
Q-3-O-G
Based on the insulin secretion experiments conducted by acutely exposing the INS-1E cells to these
compounds, the following three compounds were selected for further studies:
CaA
Naringenin
Quercetin
These compounds increased insulin secretion both upon acute and chronic exposure at hyperglycemic,
as well as glucotoxic conditions.
In gene expression studies, these compounds indicated cyto protective effects on beta cells under
glucotoxic conditions.

59
4. Study III: Study of the possible signaling pathways behind Naringenin and Falcarinol induced glucose uptake
4.1. Objective:
To elucidate the possible signaling pathways involved in the observed increase in glucose uptake by
naringenin and falcarinol.
4.2. Methods:
All the methods used in Study III have been described in the Manuscript III. The information excluded
from Manuscript III has been given below.
Note: The antibodies against phosphorylated Akt and AMPK (pAkt and pAMPK) were bought from
Cell Signalling Technology (Danvers, MA, US).
4.3. Results:
The results obtained in Study III has been illustrated and described in Manuscript III. Additionally,
western blotting trials to detect pAkt and pAMPK were made. However, further optimization trials
would be required to obtain satisfactory results.
4.4. Discussion:
All the results obtained in Study III have been discussed in Manuscript III.

60
4.5. Short summary:
Naringenin and falcarinol stimulate glucose uptake in primary porcine skeletal myotube cultures
Naringenin can cause a greater increase in glucose uptake in insulin resistant myotubes compared to
insulin (10 nM)
Falcarinol stimulated glucose uptake in in insulin resistant myotubes is equivalent to that caused by
insulin (10 nM)
The Glut4 inhibitor indinavir and PI3K inhibitor wortmannin, greatly diminishes naringenin and
falcarinol stimulated glucose uptake
The AMPK inhibitor DM attenuated naringenin stimulated glucose uptake, but increases falcarinol
induced glucose uptake
Naringenin and falcarinol preferentially induced the phosphorylation of TBC1D1, compared to
TBC1D4
Naringenin induced TBC1D1 phosphorylation was suppressed by PI3K and p38MAPK inhibitor,
wortmannin; and the AMPK inhibitor DM. This indicates that an active PI3K and/or p38MAPK, as
well as an active AMPK is required for naringenin to enhance phosphorylation of TBC1D1 and
therefore glucose uptake
Falcarinol stimulated phosphorylation of TBC1D1 was inhibited by wortmannin, but not by DM. This
suggests a PI3K and/orp38 MAPK dependent but AMPK independent regulation of glucose uptake by
falcarinol

61
5. General Discussion
5.1. Screening of plant extracts, fractions and their secondary metabolites for
bioactivity
The primary goal of this PhD study was the identification of plants with a promising potential to
increase glucose uptake in primary porcine myotubes. Screening of 22 DCM and MeOH extracts from
8 medicinal and food related plants [T. vulgaris (thyme), E. purpurea (purple coneflower), D. carota
(carrot, varieties: bolero and purple haze), B. oleracea (broccoli and green cabbage), S. hortensis
(summer savory), S. nigra (elderflowers), and R. rosea (roseroot)] for glucose uptake both in presence
and absence of insulin, revealed 5 plants (thyme, purple coneflower, carrots (bolero), elderflowers and
roseroot) with major potential to increase glucose uptake in primary myotubes. Thyme, carrots
(bolero), elderflowers and roseroot (flowers) DCM extracts showed most pronounced increase in
glucose uptake, and were therefore chosen for further studies.
5.1.1. Investigation of oxidative stress by intracellular ROS generation
Plants possess a huge repertoire of secondary metabolites with varying polarity and chemical
structures, like terpenes, alkaloids, phenolic acids, polyisoprenes, plant amines, glycosides and rare
amino acids. Certain plant polyacetylenes like falcarinol and falcarindiol has shown the potential to
accelerate intracellular ROS generation (Young et al., 2008). Again, it has been previously
demonstrated that increase in ROS mediated oxidative stress can cause an increase in glucose uptake
(Lekas et al., 1999). It has been believed for several decades that elevation in ROS levels is detrimental
for cellular well-being, and influence aging, inflammation, dna-damage, and defects in insulin signaling
both in cell systems and in vivo (Harman, 1956; Vina et al., 2007; Vina et al., 2004; Wei et al., 2008).
But the relatively new research has indicated that ROS also function as signaling molecules, and are
necessary for cellular adaptation after physical activity. Therefore, suppression of these molecules with

62
anti-oxidants can prevent cellular adaptation, suggesting that a balance between ROS formation and
quenching is critical for harvesting the hormetic effects of (oxidative) stress (Gomez-Cabrera et al.,
2008; Ristow and Zarse, 2010; Ristow et al., 2009; Yang and Hekimi, 2010). In order to investigate
whether the reason behind the observed increase in glucose uptake is caused due to oxidative stress,
intracellular ROS generation was measured for the DCM extracts of thyme, carrots (bolero),
elderflowers and roseroot (flowers). None of the extracts were found to increase ROS formation in the
myotubes. On the contrary, the basal level of ROS in the myotubes was slightly but significantly
lowered.
At this stage, due to constraints in fractionation possibilities, elderflower and carrot extracts
were chosen for further studies.
5.1.2. Study of satellite cell proliferation inducing potential
Skeletal muscle atrophy is a persistent problem, especially in the elderly. It can also be an outcome of
chronic disorders like cancer, chronic heart failure, pulmonary obstructive disorders; and the loss of
skeletal muscles increases vulnerability towards diabetes (Sakuma and Yamaguchi, 2012; Srikanthan et
al., 2010; Thomas, 2007). However, activation of satellite cells often initiated by muscle damage (e.g.
that caused by strength training), can reduce severe muscle loss, by satellite cell proliferation and
differentiation (Hawke and Garry, 2001; Sakuma and Yamaguchi, 2012). DCM extract of elderflowers
and MeOH extract of carrots (purple haze) were examined for their impact on satellite cell
proliferation. Proliferation of the satellite cells was improved by both the extracts significantly. These
results open up the possibility of a new area of research, studying the effects of bioactive plant
compounds in alleviation of Sarcopenia.

63
5.1.3. Fractionation and further screening of fractions and secondary metabolites
In order to identify the constituent bioactive components, the extracts of the selected plants
(elderflower DCM and MeOH extract; and carrot (bolero) DCM extract) were fractionated by flash
chromatography (WP2). This resulted in 7 fractions (A-G) from each of the DCM and MeOH
elderflower extracts and 8 fractions (A-H) from carrot (bolero) DCM extract. All the fractions were
screened for their ability to independently enhance glucose uptake in myotubes.
Two elderflower DCM fractions D and E were found to increase glucose uptake significantly.
Neither the fractions obtained from elderflower MeOH extract, nor those obtained from carrot (bolero)
DCM extract showed any increase in glucose uptake. Normally it is expected that fractionation will
concentrate the bioactive component and therefore a further increase in bioactivity will be observed.
On the contrary, a loss of bioactivity was observed in elderflower MeOH and carrot (bolero) DCM
fractions. This could be attributed to the fact that fractionation can also lead to increase concentrations
of the inhibitors, increasing antagonism leading to the suppression or loss of bioactivity.
Chromatographic separation (WP2) of the bioactive fractions D and E of the elderflower DCM
extract mainly contained naringenin, α-LA and LA. These three compounds were selected for further
studies, as well as several other known elderflower metabolites (Christensen et al., 2008), together with
certain related polyphenols and carrot polyacetylenes. Overall, the elderflower metabolites tested were:
naringenin, 5-O-CA, Q-3-O-R, Q-3-O-G, Q-3-O-6’’-A, K-3-O-R, I-3-O-G, I-3-O-R, α-LA, and LA;
the related polyphenols tested were: kaempferol, CaA, FeA, and p-CA and the carrot polyacetylenes
tested were falcarinol and falcarindiol. All were tested for their effect on insulin-independent glucose
uptake. Among them, 5-O-CA, naringenin, kaempferol, CaA, FeA, p-CA, falcarinol and falcarindiol
were found to enhance glucose uptake significantly; whereas LA showed a strong tendency.
Most prominent increase in glucose uptake was observed for naringenin, kaempferol, falcarinol
and falcarindiol. Naringenin has been previously found to enhance glucose uptake via AMPK
activation in L6 myotubes (Zygmunt et al., 2010). Contradictory findings have reported inhibition of

64
glucose uptake in MCF-7 breast cancer and U937 cells (Harmon and Patel, 2004; Park, 1999).
However, this differential effect on glucose uptake could be indicative of a mode of action, that is cell-
type specific.
Amongst the related polyphenols tested, kaempferol showed the highest increase in GU. This
study reported for the first time, the glucose uptake enhancing potential of kaempferol in myotubes.
However, in separate studies, kaempferol has previously been shown to inhibit GU in HeLa cells
(Filomeni et al., 2010) but enhance GU in mature 3T3-L1 adipocytes (Fang et al., 2008). Another
contradictory finding reports that kaempferol-3-O-neohesperidoside (glycosylated natural derivative of
kaempferol) was found to increase glucose uptake in L6 myotubes, where the glycon was reported to
be the structure responsible for the activity (Yamasaki et al., 2011).
CaA and 5-O-CA (also known as chlorogenic acid) were both found to enhance glucose uptake
in this study. In an earlier study conducted in rat skeletal muscle in vitro, CaA but not 5-O-CA was
found to enhance glucose uptake by enhancing AMPK phosphorylation (Tsuda et al., 2012). However,
both CaA and 5-O-CA were found to reduce plasma glucose levels in animals and humans (Bassoli et
al., 2008; Hsu et al., 2000). FeA and p-CA (among the related polyphenols tested) were also found to
enhance glucose uptake. In separate studies p-CA has been shown to increase glucose uptake in L6
myotubes via AMPK-phosphorylation (Yoon et al., 2013); whiles FeA increased glucose uptake via a
PI3K-dependent mechanism (Prabhakar and Doble, 2009).
The carrot polyacetylenes falcarinol and falcarindiol were most commonly known for their
cytotoxic, antibacterial and anti-cancer properties (Xu et al., 2009; Zaini et al., 2012b). However, both
polyacetylenes were found to have concentration dependant biphasic effect on cyto-protection,
oxidative stress, dna-damage, cell proliferation and apoptosis (Young et al., 2008; Young et al., 2007).
This is the first study suggesting both falcarinol and falcarindiol are capable of stimulating glucose
uptake in myotubes. This could, at least partially explain the pronounced increase in glucose uptake,
caused by carrot (bolero) DCM extracts.

65
5.2. Study of selected phenolic compounds on insulin secretion and gene expression in
INS 1E cells
The progression of T2D is asymptomatic in its initial stages. This is due to compensation by increasing
insulin production by the pancreatic beta cells. Increasing insulin resistance beyond this point causes
beta cell exhaustion and if left un-intervened, can lead to beta cell failure and apoptosis. Flavonoids and
phenolic acids are known to possess multiple bioactivities. Therefore, it was interesting to investigate if
these bioactive compounds influence insulin secretion as well as expression of genes involved in
insulin secretion, stress and apoptosis in beta cells.
Seven phenolic compounds: CaA, FeA, naringenin, kaempferol, quercetin, Q-3-O-G, and p-CA
were tested for their ability to stimulate insulin secretion in the clonal pancreatic beta-cell line INS 1E,
after acute exposure in presence of low or high glucose (mimicking hypo- and hyperglycemic
conditions). Results obtained, indicated CaA, naringenin and quercetin to be the most promising
candidates and therefore, these compounds were chosen for further studies.
5.2.1. Insulin secretion under chronic exposure and glucotoxic conditions
Upon chronic exposure to the phenolic compounds, and thereafter to low and high glucose, all three
compounds stimulated insulin secretion significantly under exposure to high glucose; whereas a small
increase in insulin secretion was observed when exposed to low glucose in case of CaA and quercetin
at the highest concentration tested. Naringenin did not cause any increase in insulin secretion at low
glucose. This is an important and desirable property for drugs that stimulates insulin secretion in
pancreatic beta cells, as side-effects of insulin secretion stimulating drugs often involve hypoglycemia,
which can have lethal consequences among weak or elderly diabetic patients (Noh et al., 2011). Some
other insulin secretagogues known to have this differential, glucose dependant effect on insulin
secretion are GLP-1 (glucagon-like peptide 1); and the diterpenes, Stevioside and Steviol (Jeppesen et
al., 2000; Meloni et al., 2013).

66
In cells exposed to glucotoxic conditions, insulin secretion in response to increase in glucose
concentrations was significantly reduced. But those treated with the phenolic compounds showed
improved glucose sensitivity and insulin secretion. Prolonged glucotoxicity can lead to beta cell stress
and apoptosis (Kaiser et al., 2003; Robertson et al., 2003).
5.2.2. Impact of selected phenolic compounds on beta cell gene expression under glucotoxic
conditions
Glucotoxicity has been associated with accelerated apoptosis and faulty gene expression of key beta
cell specific genes (Robertson et al., 2004). Therefore, effect of these phenolic compounds on
expression of genes involved in beta cell function, stress, survival and apoptosis under glucotoxic
conditions were studied. The genes analysed were: Glut2, Gck, Ins1, Ins2, Beta2, Pdx1, Akt1, Akt2,
IRS1, Acc1, Bcl2, Bax, Casp3, Hsp70, and Hsp90.
A significant increase in the expression of the Ins1 gene was observed in the presence of
the phenolic compounds both under normoglycemic and glucotoxic condition. This observation was in
line with the increase in insulin secretion observed under these conditions. A significant increase in
Ins2 gene expression was also observed in cells treated with CaA and naringenin, under
normoglycemic but not under glucotoxic conditions. Glut2, has the highest capacity and the lowest
affinity for glucose, which allows glucose uptake in the beta cells only when glucose level is high and
insulin secretion is necessary (Efrat, 2003). Again, Gck (the enzyme involved in the phosphorylation of
glucose molecules) also acts as a glucose sensor (Doliba et al., 2012; Nakamura et al., 2009). A
significant increase in Glut2 expression (induced by naringenin and quercetin) under glucotoxic
conditions; and Gck expression under both glucotoxic and normoglycemic conditions indicates an
increased sensitivity towards glucose in presence of these phenolic compounds and is in line with the
increase observed in Ins1 gene expression.
The expression of the transcription factors Beta2 and Pdx1 was not changed significantly under
glucotoxic conditions (except by naringenin). However all three phenolic compounds significantly

67
increased their expression under normoglycemic conditions. Studying any increase in the activity of
these transcription factors could provide the fundament for the observed increase in Ins 1 gene
expression. However other beta cell specific transcription factors (e.g. Nkx2.2, Pax6, Foxa2, and
Nkx6.1) could also be responsible for such an effect (Habener et al., 2005).
Irs1, Akt1 and 2 are members of the insulin signalling pathway. Irs1 expression was not
increased by any of the phenolic compounds under glucotoxic conditions. Naringenin and quercetin
induced Akt1 gene expression under glucotoxic conditions; whereas CaA and naringenin under
normoglycemic conditions. All three phenolic compounds increased Akt2 expression under
normoglycemic conditions. However, naringenin enhanced Akt2 expression under glucotoxic
conditions. This suggests the augmentation of an otherwise down regulated insulin signalling pathway
by naringenin.
The INS 1E cells exposed to glucotoxic conditions exhibited an increase in the expression of
apoptotic genes like Casp3 and Bax, and down-regulation of the survival gene Bcl2. This could be
indicative of the apoptotic effects of glucotoxicity. In presence of the phenolic compounds, a reduction
in the pro apoptotic genes Casp3 and Bax (a member of the Bcl2 family) was observed, especially for
CaA and naringenin, suggesting a cyto-protective effect of these phenolic compounds on beta cells.
The Bcl2 family consists of both pro and anti-apoptotic proteins. The pro-survival members of this
family prevent apoptosis by inhibiting the pro-apoptotic proteins like Bax, Bak and BH3-only proteins
(Vogler, 2012). The gene expression of Bcl2 was significantly induced by all three phenolic
compounds under normoglycemic conditions, and naringenin showed a tendency under glucotoxic
conditions, indicating an induction of pro-survival genes by naringenin.
Heat shock proteins are molecular chaperones, induced as a response to cellular injury and
stress, and play an important role in cell survival. Hsp70 has been shown to be involved in combating
neurodegeneration, ischemic heart disease and diabetes, while inhibition of Hsp90 has recently been
recognised as an efficient approach in pacifying various forms of cancer (Soti et al., 2005), which

68
indicates its importance in cell survival. A significant increase in Hsp70 gene expression was observed
in presence of all the phenolic compounds at both normoglycemic and glucotoxic conditions, of which
quercetin caused the maximum (two-fold) increase; whereas the gene expression of Hsp90 was
significantly up-regulated by naringenin at both normoglycemic and glucotoxic conditions, indicating
the potential role of these phenolic compounds in beta cell survival during glucotoxicity.
The first step of lipogenesis is catalysed by the enzyme Acc1. Animals deficient in Acc1 show
loss of body weight and continuous lipid oxidation. Therefore reduction in Acc1 expression and
activity has been a therapeutic goal against obesity and related metabolic disorders like T2D (Tong,
2005). It has been found to play an important role in glucose stimulated insulin secretion in INS 1E
cells (Zhang and Kim, 1998). During hyperglycemia, an increase in Acc1 gene expression has been
observed, and is associated with decrease in fatty acid oxidation (Zhang and Kim, 1998). Our study
also exhibited a steep increase in Acc1 gene expression under glucotoxic compared to normoglycemic
conditions. Moreover, long-term inhibition of fatty acid oxidation, due to overexpression of Acc1 in
beta cells during glucotoxicity can induce beta cell dysfunction and apoptosis due to lipotoxicity
induced endoplasmic reticulum (ER) stress (Cnop et al., 2010). In the present study only naringenin
was found to cause a minute but significant increase in Acc1 expression under normoglycemic
conditions. However, under glucotoxic conditions, Acc1 expression was increased by more than 3 fold
(compared to normoglycemic conditions), but in presence of the phenolic compounds the expression
level was reduced to the same level as observed in cells grown under normoglycemic conditions. This
remarkable restoration of the Acc1 mRNA levels by CaA, naringenin, and quercetin underlines their
importance in the field of lipotoxicity induced beta cell dysfunction in T2D.
5.3. Studying the mechanism behind naringenin and falcarinol induced glucose uptake
As discussed earlier, several phenolic acids, polyacetylenes, and flavonoids were found to increase
glucose uptake in myotubes. Of them, the two secondary metabolites naringenin and falcarinol from

69
elderflowers and carrots respectively were chosen for further investigation. Initially, naringenin and
falcarinol were tested for their ability to enhance glucose uptake in presence or absence of insulin.
Glucose uptake caused by naringenin was significantly higher than control, but it did not vary much
between the concentrations tested. Moreover, in presence of insulin there was an increase in glucose
uptake for all the naringenin concentrations, although maximum increase was observed at the lowest
concentration of naringenin. The additive increase observed could indicate dependence on two different
pathways. However, the fact that the total increase in Glucose uptake was slightly reduced at higher
naringenin concentrations in presence of insulin, might suggest sharing of at least some pathway
proteins by naringenin and insulin.
In order to estimate their potential further, their effect on glucose uptake was tested in IRM, as
compared to normal myotubes. Basal and insulin stimulated glucose uptake was significantly reduced
in IRM. The increase in glucose uptake caused by naringenin was equivalent in both normal and insulin
resistant myotubes, indicating that insulin resistance has not affected its mode of increasing glucose
uptake. However, falcarinol behaved in a way similar to insulin, where there was a reduction in glucose
uptake in IRM, compared to normal myotubes. This might suggest dependence on the same signalling
pathway as insulin, or on one or more of the members of this pathway.
5.3.1. Investigating the dependence on Glut4 and insulin/AMPK signalling
To investigate the underlying mechanism behind the observed bioactivity of naringenin and falcarinol,
myotubes were separately incubated with the Glut4 inhibitor indinavir, PI3K inhibitor wortmannin, and
AMPK inhibitor DM.
Indinavir caused a major decrease in basal, as well as insulin and naringenin/falcarinol
stimulated glucose uptake. The level of glucose uptake in presence of insulin, naringenin and falcarinol
was comparable to the basal uptake in indinavir treated myotubes. This indicates that most of the
glucose uptake caused by naringenin and falcarinol is mediated by Glut4. A minute but significant
increase in naringenin treated myotubes was observed at a concentration of 10 µM in indinavir treated

70
myotubes. A possible explanation for this observation could either be that naringenin can use other
glucose transporters (like Glut1) to some extent or it might be capable of slightly increasing the activity
of the small number of uninhibited Glut4 transporters. A small but significant decrease in glucose
uptake was observed for falcarinol at the concentration of 30 µM in indinavir treated cells, indicating
inhibition of glucose uptake at this concentration.
Upon treatment with the PI3K inhibitor, wortmannin, basal, as well as insulin, naringenin and
falcarinol stimulated glucose uptake was significantly decreased. Glucose uptake caused by naringenin
and falcarinol was comparable to the reduced basal uptake in wortmannin treated myotubes; although
insulin induced glucose uptake was reduced to basal glucose uptake in normal myotubes. It can be
speculated that this difference is due the dependence of naringenin and/or falcarinol on one or more
proteins that is inhibited by wortmannin but is not necessary for insulin stimulated glucose uptake. It is
important to note that in earlier studies, wortmannin has also been found to inhibit MAPK (Ferby et al.,
1996a; Ferby et al., 1996b) with an IC50 of 300 nM. Therefore the protein involved in naringenin and/or
falcarinol induced glucose uptake could be a MAPK. It is to be considered, that p38-MAPK has been
implicated as a downstream target of AMPK (Cheng et al., 2006) and has been found to be involved in
full activation of Glut4 (Konrad et al., 2001).
In myotubes treated with the AMPK inhibitor DM, naringenin and AICAR stimulated glucose
uptake decreased and reached the basal level. DM treatment did not affect the basal glucose uptake. It
has been mentioned earlier, that naringenin can increase glucose uptake via AMPK activation in L6
myotubes (Zygmunt et al., 2010). Therefore an inhibition in glucose uptake caused by naringenin is an
expected outcome of AMPK inhibition. Falcarinol, on the other hand exhibited a significant increase in
presence of DM. The reason behind this is unclear, though cross-talk between signalling pathways, and
inhibition/activation of enzymes/pathways responsible for increasing glucose uptake could be a
possibility. Furthermore, DM has been shown to participate in other signalling cascades, independent
of the AMPK pathway (Jin et al., 2009). Nevertheless, further investigation is necessary to explain this

71
observation. However, this shows that unlike naringenin, falcarinol enhances glucose uptake by an
AMPK-independent mechanism. Previous research has shown that falcarinol at low concentrations can
increase ROS formation (Young et al., 2008). Again, ROS has been found to activate p38-MAPK (Kim
et al., 2013), which in turn plays an important role in glucose uptake (Konrad et al., 2001). This could
be a possible explanation to the AMPK-independent glucose uptake caused by falcarinol.
5.3.2. Impact on TBC1D4 and TBC1D1 phosphorylation
TBC1D4 and TBC1D1 are key Rab-GTPase activating proteins (GAPs), which are involved in the
regulation of Glut4 translocation to the plasma membrane. Upon phosphorylation these proteins bind
14-3-3 proteins, leaving the Rab proteins in a GTP bound active state (Sakamoto and Holman, 2008).
The active GAPs then lead to the translocation of Glut4 containing vesicles to the plasma membrane.
TBC1D4 and TBC1D1 have been found to participate both in insulin and contraction-induced glucose
uptake. They are targets of Akt, AMPK, as well as other kinases (Chen et al., 2008; Geraghty et al.,
2007; Kane et al., 2002; Roach et al., 2007; Taylor et al., 2008; Treebak et al., 2006) .
Phosphorylation of TBC1D4 and TBC1D1 by naringenin and falcarinol was studied to further
investigate their role in skeletal muscle glucose metabolism. The activation of TBC1D1 by naringenin
and falcarinol was reported for the first time in this study. An interesting observation of this study was
that insulin stimulated increase in phosphorylation was much higher for TBC1D4 compared to
TBC1D1, and naringenin and falcarinol solely stimulated TBC1D1 phosphorylation. Both TBC1D4
and TBC1D1 have calmodulin binding domains; mutations in which has been found to diminish
contraction induced but not insulin stimulated glucose uptake in TBC1D4 (Kramer et al., 2007). Such
studies are yet to be conducted on TBC1D1. Moreover, mass spectrometry analysis on TBC1D1 from
mouse skeletal muscle revealed several phosphorylation sites, of which majority were found to be
consensus or near consensus sites for AMPK; and AICAR was found to be a stronger regulator of
TBC1D1, causing more phosphorylation on TBC1D1 than insulin (Taylor et al., 2008). This is very
much in confirmation of our observation that naringenin (known to activate AMPK (Zygmunt et al.,

72
2010)) increases TBC1D1 phosphorylation to a much higher degree compared to insulin. Moreover, it
has been shown earlier, that TBC1D1 is abundantly expressed in fast-twitch muscles, while higher
levels of TBC1D4 is found in muscles with slow-twitch characteristics (Taylor et al., 2008).Overall, the
existence of the homologs, together with their altered expression in different muscle fibre types, as well
as the observed differences in the modulation of glucose uptake in TBC1D4 mutants (Kramer et al.,
2007; Thong et al., 2007) by insulin and contraction, and the many different phosphorylation sites in
TBC1D1 encouraging differential phosphorylation (Taylor et al., 2008), suggests the possibility of
differential regulation of these signalling proteins by various regulators like insulin, contraction
(AMPK), and other small molecule activators.
The observed phosphorylation of TBC1D1 by naringenin was inhibited by wortmannin
and DM; whereas that by falcarinol was inhibited by wortmannin, but increased in presence of DM.
This finding substantiates the diminished glucose uptake observed in presence of wortmannin for both
naringenin and falcarinol, and the increase and decrease in glucose uptake exhibited by falcarinol and
naringenin in presence of DM.

73
6. Conclusions and Future perspectives
Reduction in insulin sensitivity leading to diminished glucose transport into the target tissues is a key
feature of T2D. The screening study performed with eight medicinal and food plants brought into focus
five (Thymus vulgaris, Daucus carota (bolero), Sambucus nigra, Echinacea purpurea and Rhodiola
rosea) that exhibited promising potential to increase glucose uptake in myotubes. Some of these plants
were also found to possess potent anti-oxidant properties.
After completion of the screening studies, due to selection of plants based on joint priorities
between work packages it was not possible to investigate plants like Thymus vulgaris, Echinacea
purpurea and Rhodiola rosea, which also exhibited a huge anti-diabetic potential during screening
studies. Literatures validating the basis of the anti-diabetic properties of these plants are limited,
providing an interesting field for future research.
Daucus carota (bolero) (carrot) and Sambucus nigra (elderflower) were selected for fractionation.
Carrot fractions did not enhance glucose uptake in myotubes; but two elderflower fractions were found
to be potent. Separation of these fractions led to the composition of these fractions. On examination of
these and other known elderflower compounds, together with some related polyphenols, gave an
overview of the individual potential of a wide array of pure compounds to enhance glucose uptake in
myotubes (Manuscript I). Of these, glucose uptake exhibited by naringenin and kaempferol was most
pronounced. The polyacetylenes falcarinol and falcarindiol, found (among some other plants) in carrots
were tested separately. These compounds increased glucose uptake in dose dependent manner.
Separation of the constituent compounds in the bioactive extracts and fractions of elderflowers
revealed the presence of certain unknown flavonol glycosides and naringenin-derivatives. Further
investigation is necessary for identification and structure elucidate of these compounds.
Together with glucose uptake, insulin is also responsible for driving glycogen synthesis in
muscles. It would be interesting to assess the potential of the bioactive compounds (that has been found

74
to cause an increase in glucose uptake), to simultaneously stimulate glycogen formation, in order to
evaluate the extent of their insulin-mimetic properties. At the same time, evaluation of any increase in
glycolysis in the muscles would also provide understanding of the fate of glucose.
The elderflower DCM and carrot (purple haze) MeOH extract showed satellite cell proliferating
potential, which suggests that certain plants might possess bioactive compounds that can enhance
muscle cell proliferation. It would be highly interesting to confirm this finding in vivo. In general,
studying the proliferative potential of bioactive compounds, could generate new knowledge, that can be
useful in the mitigation of skeletal muscle atrophy/sarcopenia.
Phenolic compounds are known to possess several health promoting properties and multiple
bioactivities. Seven phenolic compounds were tested for their capacity to enhance insulin secretion
under acute exposure in INS 1E cells, and three (CaA, naringenin and quercetin) were selected for
further studies under chronic exposure, and glucotoxic conditions. Expression analysis of genes
involved in beta cell function, stress and apoptosis/survival was performed. These compounds had
prominent insulin secreting capacity both under hyperglycemic and glucotoxic conditions (Manuscript
II). They were also found to up-regulate the insulin1 gene, genes involved in glucose sensitivity, and
chaperones, and down-regulate the Acc1 gene, responsible for biosynthesis of fatty acids.
In diabetic patients, dysfunctional exocytosis in beta cells has also been reported to cause
defective insulin secretion. The effect of these phenolic compounds in rehabilitation of the exocytosis
machinery could provide vital information about the extent of their efficacy.
Similar to pancreatic beta cells (and other pancreatic cells e.g. alpha-cells), and myocytes
hepatocytes also play a major role in the progression of T2D. Investigating the effect of these
compounds on gluconeogenesis in hepatocytes could provide an important overview of the efficacy or
possible side-effects of these compounds, as supplementary medicines or nutraceuticals.
75
An in vivo study involving potent plant extracts (e.g. the plant extracts found to have anti-
diabetic properties in this study) and their secondary metabolites could be highly useful both for
providing valuable knowledge on their effect on many different tissues and organs (e.g. muscles, liver,
pancreas and adipose tissue) directly involved in T2D, and also for understanding the interactions or
cross talk between them.
Examination of glucose uptake potential of naringenin and falcarinol in myotubes in presence of
different inhibitors like indinavir, wortmannin, and DM, upheld certain mechanistic clues (Manuscript
III). The study indicated the dependence of naringenin and falcarinol on PI3K and/or p38 MAPK. But
further studies using specific inhibitors or small interfering RNAs (siRNAs) against PI3K or p38
MAPK could further ascertain this finding. Their direct dependence on Glut4 for glucose transport was
also demonstrated in this study. The study also confirmed that active AMPK was required for
naringenin to induce glucose uptake in myotubes and revealed that the same was not true for falcarinol.
Several compounds of plant origin, especially the flavonoids have been found to be AMPK
and/or PPAR agonists. A study screening the potent secondary metabolites (discussed in this study, e.g.
naringenin) for PPAR-δ (most abundant in muscles) or AMPK activation could identify compounds
with single/dual activity; and encourage investigation of their activity in different combinations.
Study on phosphorylation of key Rab-GTPase activating proteins TBC1D4 and TBC1D1 by naringenin
and falcarinol showed that these compounds significantly increase TBC1D1-phosphorylation. This
increase was inhibited by wortmannin and DM (except for falcarinol, where TBC1D1 phosphorylation
increased in presence of DM). On the other hand, TBC1D4 but not TBC1D1 phosphorylation was
significantly enhanced by insulin. It was also observed in glucose uptake experiments that glucose
uptake in presence of falcarinol is increased in DM treated cells. It is known that activation of different
kinases including AMPK, can lead to phosphorylation of TBC1D1. At the same time falcarinol is

76
known to increase intracellular ROS formation. Again p38MAPK, which is thought to play an
important role in glucose uptake, has also been found to be activated by ROS. Based on this
information, one might speculate, that an increase in falcarinol stimulated glucose uptake could occur
via ROS mediated p38MAPK activation. However, in order to substantiate the possibilities further
research is required in this area.
Activation of Sirt1 has been found to reduce insulin resistance. Small molecule activators of
Sirt1 are lucrative therapeutic targets for amelioration of the diabetic state. Earlier research has shown
that Sirt1 is not involved in naringenin stimulated glucose uptake. It would be interesting to find out if
falcarinol is capable of Sirt1 activation.
In entirety, the work presented in this thesis shows that plants contain bioactive compounds capable of
inducing glucose uptake in myotubes and enhancing glucose stimulated insulin secretion in beta cells,
via modulation of signaling pathways involved in the regulation of glucose transport.
Endeavors to study plant secondary metabolites for possible bioactivities and understanding of
the underlying mechanism responsible for such bioactivity could be useful in developing new tools to
build a future strategy for the treatment of metabolic disorders like T2D.

77
7. Reference List
Alanko, J., Kurahashi, Y., Yoshimoto, T., Yamamoto, S., Baba, K., 1994. Panaxynol, A Polyacetylene
Compound Isolated from Oriental Medicines, Inhibits Mammalian Lipoxygenases. Biochemical
Pharmacology 48, 1979-1981.
Asfari, M., Breant, B., Boissard, C., Rosselin, G., 1992. Effect of Glucose-Concentration on Insulin
and Glucose-Sensor Genes Expression in Ins-1 Cells. Diabetologia 35, A13.
Atangwho, I.J., Ebong, P.E., Eyong, E.U., Asmawi, M.Z., Ahmad, M., 2012. Synergistic antidiabetic
activity of Vernonia amygdalina and Azadirachta indica: Biochemical effects and possible
mechanism. Journal of Ethnopharmacology 141, 878-887.
Avruch, J., 1998. Insulin signal transduction through protein kinase cascades. Molecular and Cellular
Biochemistry 182, 31-48.
Bahadoran, Z., Mirmiran, P., Hosseinpanah, F., Rajab, A., Asghari, G., Azizi, F., 2012. Broccoli
sprouts powder could improve serum triglyceride and oxidized LDL/LDL-cholesterol ratio in
type 2 diabetic patients: A randomized double-blind placebo-controlled clinical trial. Diabetes
Research and Clinical Practice 96, 348-354.
Baranauskiene, R., Venskutonis, P.R., Viskelis, P., Dambrauskiene, E., 2003. Influence of nitrogen
fertilizers on the yield and composition of thyme (Thymus vulgaris). Journal of Agricultural and
Food Chemistry 51, 7751-7758.
Barnes, J., Anderson, L.A., Gibbons, S., Phillipson, J.D., 2005. Echinacea species (Echinacea
angustifolia (DC.) Hell., Echinacea pallida (Nutt.) Nutt., Echinacea purpurea (L.) Moench): a
review of their chemistry, pharmacology and clinical properties. Journal of Pharmacy and
Pharmacology 57, 929-954.
Bassoli, B.K., Cassolla, P., Borba-Murad, G.R., Constantin, J., Salgueiro-Pagadigorria, C.L., Bazotte,
R.B., da Silva, R.S.D.F., de Souza, H.M., 2008. Chlorogenic acid reduces the plasma glucose
peak in the oral glucose tolerance test: effects on hepatic glucose release and glycaemia. Cell
Biochemistry and Function 26, 320-328.
Berkes, C.A., Tapscott, S.J., 2005. MyoD and the transcriptional control of myogenesis. Seminars in
Cell & Developmental Biology 16, 585-595.
Butler, A.E., Janson, J., Bonner-Weir, S., Ritzel, R., Rizza, R.A., Butler, P.C., 2003. beta-cell deficit
and increased beta-cell apoptosis in humans with type 2 diabetes. Diabetes 52, 102-110.
Cao, Z.M., Cooper, M.E., 2011. Pathogenesis of diabetic nephropathy. Journal of Diabetes
Investigation 2, 243-247.
Carr, R.D., Brand, C.L., Bodvarsdottir, T.B., Hansen, J.B., Sturis, J., 2003. NN414, a SUR1/Kir6.2-
selective potassium channel opener, reduces blood glucose and improves glucose tolerance in
the VDF Zucker rat. Diabetes 52, 2513-2518.
Cartee, G.D., Wojtaszewski, J.F.P., 2007. Role of Akt substrate of 160 kDa in insulin-stimulated and
contraction-stimulated glucose transport. Applied Physiology Nutrition and Metabolism-
Physiologie Appliquee Nutrition et Metabolisme 32, 557-566.

78
Ceriello, A., delloRusso, P., Amstad, P., Cerutti, P., 1996. High glucose induces antioxidant enzymes
in human endothelial cells in culture - Evidence linking hyperglycemia and oxidative stress.
Diabetes 45, 471-477.
Chen, S., Murphy, J., Toth, R., Campbell, D.G., Morrice, N.A., Mackintosh, C., 2008. Complementary
regulation of TBC1D1 and AS160 by growth factors, insulin and AMPK activators.
Biochemical Journal 409, 449-459.
Cheng, H.T., Dauch, J.R., Hayes, J.M., Yanik, B.M., Feldman, E.L., 2011. Nerve growth factor/p38
signaling increases intraepidermal nerve fiber densities in painful neuropathy of type 2 diabetes.
Neurobiology of Disease 45, 280-287.
Cheng, Z., Pang, T., Gu, M., Gao, A.H., Xie, C.M., Li, J.Y., Nan, F.J., Li, J., 2006. Berberine-
stimulated glucose uptake in L6 myotubes involves both AMPK and p38 MAPK. Biochimica et
Biophysica Acta-General Subjects 1760, 1682-1689.
Christensen, K.B., Minet, A., Svenstrup, H., Grevsen, K., Zhang, H.B., Schrader, E., Rimbach, G.,
Wein, S., Wolffram, S., Kristiansen, K., Christensen, L.P., 2009a. Identification of plant
extracts with potential antidiabetic properties: effect on human peroxisome proliferator-
activated receptor (PPAR), adipocyte differentiation and insulin-stimulated glucose uptake.
Phytotherapy Research 23, 1316-1325.
Christensen, K.B., Petersen, R.K., Petersen, S., Kristiansen, K., Christensen, L.P., 2009b. Activation of
PPAR gamma by Metabolites from the Flowers of Purple Coneflower (Echinacea purpurea).
Journal of Natural Products 72, 933-937.
Christensen, L.P., Kaack, K., Fretté, X.C., 2008. Selection of elderberry (Sambucus nigra L.)
genotypes best suited for the preparation of elderflower extracts rich in flavonoids and phenolic
acids. European Food Research and Technology 227, 293-305.
Chu, Y.F., Sun, J., Wu, X.Z., Liu, R.H., 2002. Antioxidant and anti proliferative activities of common
vegetables. Journal of Agricultural and Food Chemistry 50, 6910-6916.
Cnop, M., Ladriere, L., Igoillo-Esteve, M., Moura, R.F., Cunha, D.A., 2010. Causes and cures for
endoplasmic reticulum stress in lipotoxic beta-cell dysfunction. Diabetes Obesity & Metabolism
12, 76-82.
Corkey, B.E., Shirihai, O., 2012. Metabolic master regulators: sharing information among multiple
systems. Trends in Endocrinology and Metabolism 23, 594-601.
Dandona, P., Thusu, K., Cook, S., Snyder, B., Makowski, J., Armstrong, D., Nicotera, T., 1996.
Oxidative damage to DNA in diabetes mellitus. Lancet 347, 444-445.
Dikbas, N., Karagoz, K., Dadasoglu, F., Kotan, R., 2012. Determination of Relationship Between
Satureja hortensis L. Essential Oil Susceptibility of Bacillus cereus Strains and Their Fatty Acid
Methyl Ester Profiles. Romanian Biotechnological Letters 17, 7564-7569.
Dinkova-Kostova, A.T., Jenkins, S.N., Fahey, J.W., Ye, L.X., Wehage, S.L., Liby, K.T., Stephenson,
K.K., Wade, K.L., Talalay, P., 2006. Protection against UV-light-induced skin carcinogenesis in
SKH-1 high-risk mice by sulforaphane-containing broccoli sprout extracts. Cancer Letters 240,
243-252.

79
Dodson, M.V., Allen, R.E., Hossner, K.L., 1985. Ovine Somatomedin, Multiplication-Stimulating
Activity, and Insulin Promote Skeletal-Muscle Satellite Cell-Proliferation Invitro.
Endocrinology 117, 2357-2363.
Doliba, N.M., Fenner, D., Zelent, B., Bass, J., Sarabu, R., Matschinsky, F.M., 2012. Repair of diverse
diabetic defects of beta-cells in man and mouse by pharmacological glucokinase activation.
Diabetes Obesity & Metabolism 14, 109-119.
Dove, A., 2002. Seeking sweet relief for diabetes. Nature Biotechnology 20, 977-981.
Du, X.L., Edelstein, D., Rossetti, L., Fantus, I.G., Goldberg, H., Ziyadeh, F., Brownlee, M., 2000.
Hyperglycemia-induced mitochondrial superoxide overproduction activates the hexosamine
pathway and induces PAI-1 and TGF beta expression by increasing Sp1 glycosylation. Diabetes
49, A55-+.
Efrat, S., 2003. Beta-cell expansion for therapeutic compensation of insulin resistance in type 2
diabetes. International Journal of Experimental Diabesity Research 4, 1-5.
El-Alfy, A.T., Abourashed, E.A., Matsumoto, R.R., 2012. Nature against depression. Current
Medicinal Chemistry 19, 2229-2241.
Elayat, A.A., Elnaggar, M.M., Tahir, M., 1995. An Immunocytochemical and Morphometric Study of
the Rat Pancreatic-Islets. Journal of Anatomy 186, 629-637.
Evans, W.J., 2004. Protein nutrition, exercise and aging. Journal of the American College of Nutrition
23, 601S-609S.
Fahey, J.W., Zhang, Y.S., Talalay, P., 1997. Broccoli sprouts: An exceptionally rich source of inducers
of enzymes that protect against chemical carcinogens. Proceedings of the National Academy of
Sciences of the United States of America 94, 10367-10372.
Fang, X.K., Gao, J., Zhu, D.N., 2008. Kaempferol and quercetin isolated from Euonymus alatus
improve glucose uptake of 3T3-L1 cells without adipogenesis activity. Life Science 82, 615-
622.
Ferby, I., Waga, I., Kume, K., Sakanaka, C., Shimizu, T., 1996a. PAF-induced MAPK activation is
inhibited by Wortmannin in neutrophils and macrophages.
Ferby, I.M., Waga, I., Hoshino, M., Kume, K., Shimizu, T., 1996b. Wortmannin inhibits mitogen-
activated protein kinase activation by platelet-activating factor through a mechanism
independent of p85/p110-type phosphatidylinositol 3-kinase. Journal of Biological Chemistry
271, 11684-11688.
Filomeni, G., Desideri, E., Cardaci, S., Graziani, I., Piccirillo, S., Rotilio, G., Ciriolo, M.R., 2010.
Carcinoma cells activate AMP-activated protein kinase-dependent autophagy as survival
response to kaempferol-mediated energetic impairment. Autophagy 6, 202-216.
Geraghty, K.M., Chen, S., Harthill, J.E., Ibrahim, A.F., Toth, R., Morrice, N.A., Vandermoere, F.,
Moorhead, G.B., Hardie, D.G., Mackintosh, C., 2007. Regulation of multisite phosphorylation
and 14-3-3 binding of AS160 in response to IGF-1, EGF, PMA and AICAR. Biochemical
Journal 407, 231-241.

80
Golubovic, M.V., Dimic, D., Antic, S., Radenkovic, S., Djindjic, B., Jovanovic, M., 2013. Relationship
of adipokine to insulin sensitivity and glycemic regulation in obese women - the effect of body
weight reduction by caloric restriction. Vojnosanitetski Pregled 70, 284-291.
Gomez-Cabrera, M.C., Domenech, E., Romagnoli, M., Arduini, A., Borras, C., Pallardo, F.V., Sastre,
J., Vina, J., 2008. Oral administration of vitamin C decreases muscle mitochondrial biogenesis
and hampers training-induced adaptations in endurance performance. American Journal of
Clinical Nutrition 87, 142-149.
Gray, A.M., Abdel-Wahab, Y.H.A., Flatt, P.R., 2000. The traditional plant treatment, Sambucus nigra
(elder), exhibits insulin-like and insulin-releasing actions in vitro. Journal of Nutrition 130, 15-
20.
Greenwald, P., Clifford, C.K., Milner, J.A., 2001. Diet and cancer prevention. European Journal of
Cancer 37, 948-965.
Habener, J.F., Kemp, D.M., Thomas, M.K., 2005. Minireview: Transcriptional regulation in pancreatic
development. Endocrinology 146, 1025-1034.
Hajhashemi, V., Zolfaghari, B., Yousefi, A., 2012. Antinociceptive and Anti-Inflammatory Activities
of Satureja hortensis Seed Essential Oil, Hydroalcoholic and Polyphenolic Extracts in Animal
Models. Medical Principles and Practice 21, 178-182.
Harman, D., 1956. Aging - A Theory Based on Free-Radical and Radiation-Chemistry. Journals of
Gerontology 11, 298-300.
Harmon, A.W., Patel, Y.M., 2004. Naringenin inhibits glucose uptake in MCF-7 breast cancer cells: a
mechanism for impaired cellular proliferation. Breast Cancer Research and Treatment 85, 103-
110.
Hawke, T.J., Garry, D.J., 2001. Myogenic satellite cells: physiology to molecular biology. Journal of
Applied Physiology 91, 534-551.
Hohmeier, H.E., Mulder, H., Chen, G.X., Henkel-Rieger, R., Prentki, M., Newgard, C.B., 2000.
Isolation of INS-1-derived cell lines with robust ATP-sensitive K+ channel-dependent and -
independent glucose-stimulated insulin secretion. Diabetes 49, 424-430.
Hotamisligil, G.S., Shargill, N.S., Spiegelman, B.M., 1993. Adipose Expression of Tumor-Necrosis-
Factor-Alpha - Direct Role in Obesity-Linked Insulin Resistance. Science 259, 87-91.
Hsu, F.L., Chen, Y.C., Cheng, J.T., 2000. Caffeic acid as active principle from the fruit of Xanthium
strumarium to lower plasma glucose in diabetic rats. Planta Medica 66, 228-230.
Huang, S.H., Czech, M.P., 2007. The GLUT4 glucose transporter. Cell Metabolism 5, 237-252.
Hunter, R.B., Kandarian, S.C., 2004. Disruption of either the Nfkb1 or the Bcl3 gene inhibits skeletal
muscle atrophy. Journal of Clinical Investigation 114, 1504-1511.
Ishaque, S., Shamseer, L., Bukutu, C., Vohra, S., 2012. Rhodiola rosea for physical and mental fatigue:
a systematic review. BMC Complementary and Alternative Medicine 12, 70.

81
Iwase, H., Kobayashi, M., Nakajima, M., Takatori, T., 2001. The ratio of insulin to C-peptide can be
used to make a forensic diagnosis of exogenous insulin overdosage. Forensic Science
International 115, 123-127.
Jeppesen, P.B., Gregersen, S., Poulsen, C.R., Hermansen, K., 2000. Stevioside acts directly on
pancreatic beta cells to secrete insulin: Actions independent of cyclic adenosine monophosphate
and adenosine triphosphate-sensitive K+-channel activity. Metabolism-Clinical and
Experimental 49, 208-214.
Jin, J.F., Mullen, T.D., Hou, Q., Bielawski, J., Bielawska, A., Zhang, X.M., Obeid, L.M., Hannun,
Y.A., Hsu, Y.T., 2009. AMPK inhibitor Compound C stimulates ceramide production and
promotes Bax redistribution and apoptosis in MCF7 breast carcinoma cells. The Journal of
Lipid Research 50, 2389-2397.
Johnson, A.M.F., Olefsky, J.M., 2013. The Origins and Drivers of Insulin Resistance. Cell 152, 673-
684.
Jung, M., Park, M., Lee, H.C., Kang, Y.H., Kang, E.S., Kim, S.K., 2006. Antidiabetic agents from
medicinal plants. Current Medicinal Chemistry 13, 1203-1218.
Kaiser, N., Leibowitz, G., Nesher, R., 2003. Glucotoxicity and beta-cell failure in type 2 diabetes
mellitus. Journal of Pediatric Endocrinology & Metabolism 16, 5-22.
Kane, S., Sano, H., Liu, S.C.H., Asara, J.M., Lane, W.S., Garner, C.C., Lienhard, G.E., 2002. A
method to identify serine kinase substrates - Akt phosphorylates a novel adipocyte protein with
a Rab GTPase-activating protein (GAP) domain. Journal of Biological Chemistry 277, 22115-
22118.
Kelley, D.E., Goodpaster, B.H., 2001. Effects of exercise on glucose homeostasis in Type 2 diabetes
mellitus. Medicine and Science in Sports and Exercise 33, S495-S501.
Kim, J.Y., An, J.M., Chung, W.Y., Park, K.K., Hwang, J.K., Kim, D.S., Seo, S.R., Seo, J.T., 2013.
Xanthorrhizol Induces Apoptosis Through ROS-Mediated MAPK Activation in Human Oral
Squamous Cell Carcinoma Cells and Inhibits DMBA-Induced Oral Carcinogenesis in Hamsters.
Phytotherapy Research 27, 493-498.
Kim, S.H., Hyun, S.H., Choung, S.Y., 2006. Antioxidative effects of Cinnamomi cassiae and Rhodiola
rosea extracts in liver of diabetic mice. Biofactors 26, 209-219.
Klip, A., Volchuk, A., He, L.J., Tsakiridis, T., 1996. The glucose transporters of skeletal muscle.
Seminars in Cell & Developmental Biology 7, 229-237.
Koistinen, H.A., Galuska, D., Chibalin, A.V., Yang, J., Zierath, J.R., Holman, G.D., Wallberg-
Henriksson, H., 2003. 5-amino-imidazole carboxamide riboside increases glucose transport and
cell-surface GLUT4 content in skeletal muscle from subjects with type 2 diabetes. Diabetes 52,
1066-1072.
Konrad, D., Somwar, R., Sweeney, G., Yaworsky, K., Hayashi, M., Ramlal, T., Klip, A., 2001. The
antihyperglycemic drug alpha-lipoic acid stimulates glucose uptake via both GLUT4
translocation and GLUT4 activation - Potential role of p38 mitogen-activated protein kinase in
GLUT4 activation. Diabetes 50, 1464-1471.

82
Kotan, R., Dikbas, N., Tozlu, E., Bagci, E., 2012. Changes of Membrane Fatty Acids of Salmonella
Enteritidis Treated with the Essential Oil of Satureja Hortensis. Fresenius Environmental
Bulletin 21, 1073-1077.
Kramer, H.F., Taylor, E.B., Witczak, C.A., Fujii, N., Hirshman, M.F., Goodyear, L.J., 2007.
Calmodulin-binding domain of AS160 regulates contraction- but not insulin-stimulated glucose
uptake in skeletal muscle. Diabetes 56, 2854-2862.
Kultur, S., 2007. Medicinal plants used in Kirklareli Province (Turkey). Journal of Ethnopharmacology
111, 341-364.
Larsen, M.O., Rolin, B., Raun, K., Knudsen, L.B., Gotfredsen, C.F., Bock, T., 2007. Evaluation of
beta-cell mass and function in the Gottingen minipig. Diabetes Obesity & Metabolism 9, 170-
179.
Lee, W.J., Chung, H.H., Cheng, Y.Z., Lin, H.J., Cheng, J.T., 2012. Rhodiola-Water Extract Induces
beta-endorphin Secretion to Lower Blood Pressure in Spontaneously Hypertensive Rats.
Phytotherapy Research DOI: 10.1002/ptr.4900.
Lefaucheur, L., 2010. A second look into fibre typing - Relation to meat quality. Meat Science 84, 257-
270.
Leinonen, J., Lehtimaki, T., Toyokuni, S., Okada, K., Tanaka, T., Hiai, H., Ochi, H., Laippala, P.,
Rantalaiho, V., Wirta, O., Pasternack, A., Alho, H., 1997. New biomarker evidence of oxidative
DNA damage in patients with non-insulin-dependent diabetes mellitus. Febs Letters 417, 150-
152.
Lekas, M.C., Fisher, S.J., El-Bahrani, B., Van Delangeryt, M., Vranic, M., Shi, Z.Q., 1999. Glucose
uptake during centrally induced stress is insulin independent and enhanced by adrenergic
blockade. Journal of Applied Physiology 87, 722-731.
Li, D.J., Lu, B., Mo, S.R., 2006. Effects of rhodiola on hemodynamics in acute myocardial ischemia
and heart failure in rats. Zhongguo Ying. Yong. Sheng Li Xue. Za Zhi. 22, 291-2, 297.
Li, G.L., Barrett, E.J., Wang, H., Chai, W.D., Liu, Z.Q., 2005. Insulin at physiological concentrations
selectively activates insulin but not insulin-like growth factor I (IGF-I) or insulin/IGF-I hybrid
receptors in endothelial cells. Endocrinology 146, 4690-4696.
Macpherson, P.C.D., Wang, X., Goldman, D., 2011. Myogenin Regulates Denervation-Dependent
Muscle Atrophy in Mouse Soleus Muscle. Journal of Cellular Biochemistry 112, 2149-2159.
Malaguarnera, R., Sacco, A., Voci, C., Pandini, G., Vigneri, R., Belfiore, A., 2012. Proinsulin Binds
with High Affinity the Insulin Receptor Isoform A and Predominantly Activates the Mitogenic
Pathway. Endocrinology 153, 2152-2163.
Mannucci, C., Navarra, M., Calzavara, E., Caputi, A.P., Calapai, G., 2012. Serotonin involvement in
Rhodiola rosea attenuation of nicotine withdrawal signs in rats. Phytomedicine 19, 1117-1124.
Marles, R.J., Farnsworth, N.R., 1995. Antidiabetic plants and their active constituents. Phytomedicine
2, 137-189.

83
Marshall, S., Garvey, W.T., Traxinger, R.R., 1991. New Insights Into the Metabolic-Regulation of
Insulin Action and Insulin Resistance - Role of Glucose and Amino-Acids. Faseb Journal 5,
3031-3036.
Maslov, L.N., Lishmanov, I., 2007. Cardioprotective and antiarrhythmic properties of Rhodiolae roseae
preparations. Eksperimental'naia i klinicheskaia farmakologiia 70, 59-67.
Meigs, J.B., Larson, M.G., Fox, C.S., Keaney, J.F., Vasan, R.S., Benjamin, E.J., 2007. Association of
oxidative stress, insulin resistance, and diabetes risk phenotypes - The framingham offspring
study. Diabetes Care 30, 2529-2535.
Meloni, A.R., DeYoung, M.B., Lowe, C., Parkes, D.G., 2013. GLP-1 receptor activated insulin
secretion from pancreatic ss-cells: mechanism and glucose dependence. Diabetes Obesity &
Metabolism 15, 15-27.
Metzger, B.T., Barnes, D.M., 2009. Polyacetylene Diversity and Bioactivity in Orange Market and
Locally Grown Colored Carrots (Daucus carota L.). Journal of Agricultural and Food Chemistry
57, 11134-11139.
Nakamura, A., Terauchi, Y., Ohyama, S., Kubota, J., Shimazaki, H., Nambu, T., Takamoto, I., Kubota,
N., Eiki, J., Yoshioka, N., Kadowaki, T., Koike, T., 2009. Impact of Small-Molecule
Glucokinase Activator on Glucose Metabolism and beta-Cell Mass. Endocrinology 150, 1147-
1154.
Noh, R.M., Graveling, A.J., Frier, B.M., 2011. Medically minimising the impact of hypoglycaemia in
type 2 diabetes: a review. Expert Opinion on Pharmacotherapy 12, 2161-2175.
Noreen, E.E., Buckley, J.G., Lewis, S.L., Brandauer, J., Stuempfle, K.J., 2013. The effects of an acute
dose of Rhodiola rosea on endurance exercise performance. Journal of Strength and
Conditioning Research 27, 839-847.
Obici, S., Wang, J.L., Chowdury, R., Feng, Z.H., Siddhanta, U., Morgan, K., Rossetti, L., 2002.
Identification of a biochemical link between energy intake and energy expenditure. Journal of
Clinical Investigation 109, 1599-1605.
Omar, B., Zmuda-Trzebiatowska, E., Manganiello, V., Goransson, O., Degerman, E., 2009. Regulation
of AMP-activated protein kinase by cAMP in adipocytes: Roles for phosphodiesterases, protein
kinase B, protein kinase A, Epac and lipolysis. Cellular Signalling 21, 760-766.
Ozkol, H., Tuluce, Y., Dilsiz, N., Koyuncu, I., 2013. Therapeutic Potential of Some Plant Extracts
Used in Turkish Traditional Medicine on Streptozocin-Induced Type 1 Diabetes Mellitus in
Rats. Journal of Membrane Biology 246, 47-55.
Paddon-Jones, D., Sheffield-Moore, M., Zhang, X.J., Volpi, E., Wolf, S.E., Aarsland, A., Wolfe, R.R.,
2004. Amino acid ingestion improves muscle protein synthesis in the young and elderly.
American Journal of Physiology-Endocrinology and Metabolism 286, E321-E328.
Park, J.B., 1999. Flavonoids are potential inhibitors of glucose uptake in U937 cells. Biochemical and
Biophysical Research Communications 260, 568-574.

84
Picard, M., Ritchie, D., Thomas, M.M., Wright, K.J., Hepple, R.T., 2011. Alterations in intrinsic
mitochondrial function with aging are fiber type-specific and do not explain differential atrophy
between muscles. Aging Cell 10, 1047-1055.
Polonsky, K.S., 2000. Dynamics of insulin secretion in obesity and diabetes. International Journal of
Obesity 24, S29-S31.
Potteiger, J.A., Claytor, R.P., Hulver, M.W., Hughes, M.R., Carper, M.J., Richmond, S., Thyfault, J.P.,
2012. Resistance exercise and aerobic exercise when paired with dietary energy restriction both
reduce the clinical components of metabolic syndrome in previously physically inactive males.
European Journal of Applied Physiology 112, 2035-2044.
Prabhakar, P.K., Doble, M., 2009. Synergistic effect of phytochemicals in combination with
hypoglycemic drugs on glucose uptake in myotubes. Phytomedicine 16, 1119-1126.
Rhee, S.G., Bae, Y.S., Lee, S.R., Lee, C., Kwon, J., Yang, K.S., 2000. Hydrogen peroxide in peptide
growth factor signaling. Faseb Journal 14, A1505.
Ristow, M., Zarse, K., 2010. How increased oxidative stress promotes longevity and metabolic health:
The concept of mitochondrial hormesis (mitohormesis). Experimental Gerontology 45, 410-
418.
Ristow, M., Zarse, K., Oberbach, A., Kloting, N., Birringer, M., Kiehntopf, M., Stumvoll, M., Kahn,
C.R., Bluher, M., 2009. Antioxidants prevent health-promoting effects of physical exercise in
humans. Proceedings of the National Academy of Sciences of the United States of America
106, 8665-8670.
Roach, W.G., Chavez, J.A., Miinea, C.P., Lienhard, G.E., 2007. Substrate specificity and effect on
GLUT4 translocation of the Rab GTPase-activating protein Tbc1d1. Biochemical Journal 403,
353-358.
Robertson, R.P., Harmon, J., Tran, P.O., Tanaka, Y., Takahashi, H., 2003. Glucose toxicity in beta-
cells: Type 2 diabetes, good radicals gone bad, and the glutathione connection. Diabetes 52,
581-587.
Robertson, R.P., Harmon, J., Tran, P.O.T., Poitout, V., 2004. beta-cell glucose toxicity, lipotoxicity,
and chronic oxidative stress in type 2 diabetes. Diabetes 53, S119-S124.
Rodriguez-Cantu, L.N., Gutierrez-Uribe, J.A., Arriola-Vucovich, J., Diaz-De La Garza, R., Fahey,
J.W., Serna-Saldivar, S.O., 2011. Broccoli (Brassica oleracea var. italica) Sprouts and Extracts
Rich in Glucosinolates and Isothiocyanates Affect Cholesterol Metabolism and Genes Involved
in Lipid Homeostasis in Hamsters. Journal of Agricultural and Food Chemistry 59, 1095-1103.
Roxas, M., Jurenka, J., 2007. Colds and influenza: A review of diagnosis and conventional, botanical,
and nutritional considerations. Alternative Medicine Review 12, 25-48.
Russell, A.P., Gastaldi, G., Bobbioni-Harsch, E., Arboit, P., Gobelet, C., Deriaz, O., Golay, A.,
Witztum, J.L., Giacobinob, J.P., 2003. Lipid peroxidation in skeletal muscle of obese as
compared to endurance-trained humans: a case of good vs. bad lipids? Febs Letters 551, 104-
106.

85
Sakamoto, K., Holman, G.D., 2008. Emerging role for AS160/TBC1D4 and TBC1D1 in the regulation
of GLUT4 traffic. American Journal of Physiology-Endocrinology and Metabolism 295, E29-
E37.
Sakuma, K., Yamaguchi, A., 2012. Sarcopenia and cachexia: the adaptations of negative regulators of
skeletal muscle mass. Journal of Cachexia Sarcopenia and Muscle 3, 77-94.
Saltiel, A.R., Kahn, C.R., 2001. Insulin signalling and the regulation of glucose and lipid metabolism.
Nature 414, 799-806.
Sandri, M., Lin, J.D., Handschin, C., Yang, W.L., Arany, Z.P., Lecker, S.H., Goldberg, A.L.,
Spiegelman, B.M., 2006. PGC-1 alpha a protects skeletal muscle from atrophy by suppressing
Fox03 action and atrophy-specific gene transcription. Proceedings of the National Academy of
Sciences of the United States of America 103, 16260-16265.
Sano, H., Kane, S., Sano, E., Miinea, C.P., Asara, J.M., Lane, W.S., Garner, C.W., Lienhard, G.E.,
2003. Insulin-stimulated phosphorylation of a Rab GTPase-activating protein regulates GLUT4
translocation. Journal of Biological Chemistry 278, 14599-14602.
Schiaffino, S., Reggiani, C., 2011. Fiber Types in Mammalian Skeletal Muscles. Physiological
Reviews 91, 1447-1531.
Shaw, R.J., Kosmatka, M., Bardeesy, N., Hurley, R.L., Witters, L.A., DePinho, R.A., Cantley, L.C.,
2004. The tumor suppressor LKB1 kinase directly activates AMP-activated kinase and regulates
apoptosis in response to energy stress. Proceedings of the National Academy of Sciences of the
United States of America 101, 3329-3335.
Shearer, B.G., Billin, A.N., 2007. The next generation of PPAR drugs: Do we have the tools to find
them? Biochimica et Biophysica Acta, Molecular and Cell Biology of Lipids 1771, 1082-1093.
Skelin, M., Rupnik, M., Cencic, A., 2010. Pancreatic Beta Cell Lines and their Applications in
Diabetes Mellitus Research. Altex-Alternatives to Animal Experimentation 27, 105-113.
Somwar, R., Koterski, S., Sweeney, G., Sciotti, R., Djuric, S., Berg, C., Trevillyan, J., Scherer, P.E.,
Rondinone, C.M., Klip, A., 2002. A dominant-negative p38 MAPK mutant and novel selective
inhibitors of p38 MAPK reduce insulin-stimulated glucose uptake in 3T3-L1 adipocytes
without affecting GLUT4 translocation. Journal of Biological Chemistry 277, 50386-50395.
Song, X.M., Ryder, J.W., Kawano, Y., Chibalin, A.V., Krook, A., Zierath, J.R., 1999. Muscle fiber
type specificity in insulin signal transduction. American Journal of Physiology-Regulatory
Integrative and Comparative Physiology 277, R1690-R1696.
Soti, C., Nagy, E., Giricz, Z., Vigh, L., Csermely, P., Ferdinandy, P., 2005. Heat shock proteins as
emerging therapeutic targets. British Journal of Pharmacology 146, 769-780.
Srikanthan, P., Hevener, A.L., Karlamangla, A.S., 2010. Sarcopenia Exacerbates Obesity-Associated
Insulin Resistance and Dysglycemia: Findings from the National Health and Nutrition
Examination Survey III. Plos One 5.
Srivastava, R.A., Pinkosky, S.L., Filippov, S., Hanselman, J.C., Cramer, C.T., Newton, R.S., 2012.
AMP-activated protein kinase: an emerging drug target to regulate imbalances in lipid and

86
carbohydrate metabolism to treat cardio-metabolic diseases. Journal of Lipid Research 53,
2490-2514.
Stuart, C.A., Howell, M.E.A., Zhang, Y., Yin, D.L., 2009. Insulin-Stimulated Translocation of Glucose
Transporter (GLUT) 12 Parallels That of GLUT4 in Normal Muscle. Journal of Clinical
Endocrinology & Metabolism 94, 3535-3542.
Swanstonflatt, S.K., Flatt, P.R., Day, C., Bailey, C.J., 1991. Traditional Dietary Adjuncts for the
Treatment of Diabetes-Mellitus. Proceedings of the Nutrition Society 50, 641-651.
Swindle, M.M., Smith, A.C., 1998. Comparative anatomy and physiology of the pig. Scandinavian
Journal of Laboratory Animal Science 25, 11-21.
Takikita, S., Schreiner, C., Baum, R., Xie, T., Ralston, E., Plotz, P.H., Raben, N., 2010. Fiber Type
Conversion by PGC-1 alpha Activates Lysosomal and Autophagosomal Biogenesis in Both
Unaffected and Pompe Skeletal Muscle. Plos One 5.
Taniguchi, C.M., Emanuelli, B., Kahn, C.R., 2006. Critical nodes in signalling pathways: insights into
insulin action. Nature Reviews Molecular Cell Biology 7, 85-96.
Taylor, E.B., An, D., Kramer, H.F., Yu, H., Fujii, N.L., Roeckl, K.S.C., Bowles, N., Hirshman, M.F.,
Xie, J.X., Feener, E.P., Goodyear, L.J., 2008. Discovery of TBC1D1 as an insulin-, AICAR-,
and contraction-stimulated signaling nexus in mouse skeletal muscle. Journal of Biological
Chemistry 283, 9787-9796.
Teng, C.M., Kuo, S.C., Ko, F.N., Lee, J.C., Lee, L.G., Chen, S.C., Huang, T.F., 1989. Antiplatelet
Actions of Panaxynol and Ginsenosides Isolated from Ginseng. Biochimica et Biophysica Acta
990, 315-320.
Thiebaud, D., Jacot, E., Defronzo, R.A., Maeder, E., Jequier, E., Felber, J.P., 1982. The Effect of
Graded Doses of Insulin on Total Glucose-Uptake, Glucose-Oxidation, and Glucose Storage in
Man. Diabetes 31, 957-963.
Thomas, D.R., 2007. Loss of skeletal muscle mass in aging: Examining the relationship of starvation,
sarcopenia and cachexia. Clinical Nutrition 26, 389-399.
Thong, F.S.L., Bilan, P.J., Klip, A., 2007. The rab GTPase-activating protein AS 160 integrates Akt,
protein kinase C, and AMP-activated protein kinase signals regulating GLUT4 traffic. Diabetes
56, 414-423.
Tong, L., 2005. Acetyl-coenzyme A carboxylase: crucial metabolic enzyme and attractive target for
drug discovery. Cellular and Molecular Life Sciences 62, 1784-1803.
Treebak, J.T., Glund, S., Deshmukh, A., Klein, D.K., Long, Y.C., Jensen, T.E., Jorgensen, S.B.,
Viollet, B., Andersson, L., Neumann, D., Wallimann, T., Richter, E.A., Chibalin, A.V., Zierath,
J.R., Wojtaszewski, J.F.P., 2006. AMPK-mediated AS160 phosphorylation in skeletal muscle is
dependent on AMPK catalytic and regulatory subunits. Diabetes 55, 2051-2058.
Tsuda, S., Egawa, T., Ma, X., Oshima, R., Kurogi, E., Hayashi, T., 2012. Coffee polyphenol caffeic
acid but not chlorogenic acid increases 5'AMP-activated protein kinase and insulin-independent
glucose transport in rat skeletal muscle. Journal of Nutritional Biochemistry 23, 1403-1409.
87
Vina, J., Borras, C., Miquel, J., 2007. Theories of ageing. Iubmb Life 59, 249-254.
Vina, J., Lloret, A., Orti, R., Alonso, D., 2004. Oxidative stress in Alzheimer's disease. Effectiveness of
treatment with antioxidants.
Viollet, B., Lantier, L., Devin-Leclerc, J., Hebrard, S., Amouyal, C., Mounier, R., Foretz, M.,
Andreelli, F., 2009. Targeting the AMPK pathway for the treatment of Type 2 diabetes.
Frontiers in Bioscience 14, U3380-U3864.
Vogler, M., 2012. BCL2A1: the underdog in the BCL2 family. Cell Death and Differentiation 19, 67-
74.
von Walden, F., Jakobsson, F., Edstrom, L., Nader, G.A., 2012. Altered autophagy gene expression and
persistent atrophy suggest impaired remodeling in chronic hemiplegic human skeletal muscle.
Muscle & Nerve 46, 785-792.
Vosough-Ghanbari, S., Rahimi, R., Kharabaf, S., Zeinali, S., Mohammadirad, A., Amini, S., Yasa, N.,
Salehnia, A., Toliat, T., Nikfar, S., Larijani, B., Abdollahi, M., 2010. Effects of Satureja
khuzestanica on Serum Glucose, Lipids and Markers of Oxidative Stress in Patients with Type
2 Diabetes Mellitus: A Double-Blind Randomized Controlled Trial. Evidence-Based
Complementary and Alternative Medicine 7, 465-470.
Wang, Z.J., Nie, B.M., Chen, H.Z., Lu, Y., 2006. Panaxynol induces neurite outgrowth in PC12D cells
via cAMP- and MAP kinase-dependent mechanisms. Chemico-Biological Interactions 159, 58-
64.
Wei, Y.Z., Chen, K.M., Whaley-Connell, A.T., Stump, C.S., Ibdah, J.A., Sowers, J.R., 2008. Skeletal
muscle insulin resistance: role of inflammatory cytokines and reactive oxygen species.
American Journal of Physiology-Regulatory Integrative and Comparative Physiology 294,
R673-R680.
Wojdylo, A., Oszmianski, J., Czemerys, R., 2007. Antioxidant activity and phenolic compounds in 32
selected herbs. Food Chemistry 105, 940-949.
Woods, A., Dickerson, K., Heath, R., Hong, S.P., Momcilovic, M., Johnstone, S.R., Carlson, M.,
Carling, D., 2005. Ca2+/calmodulin-dependent protein kinase kinase-beta acts upstream of
AMP-activated protein kinase in mammalian cells. Cell Metabolism 2, 21-33.
Xu, L.L., Han, T., Wu, J.Z., Zhang, Q.Y., Zhang, H., Huang, B.K., Rahman, K., Qin, L.P., 2009.
Comparative research of chemical constituents, antifungal and antitumor properties of ether
extracts of Panax ginseng and its endophytic fungus. Phytomedicine 16, 609-616.
Yamasaki, K., Hishiki, R., Kato, E., Kawabata, J., 2011. Study of Kaempferol Glycoside as an Insulin
Mimic Reveals Glycon To Be the Key Active Structure. Acs Medicinal Chemistry Letters 2,
17-21.
Yang, W., Hekimi, S., 2010. A Mitochondrial Superoxide Signal Triggers Increased Longevity in
Caenorhabditis elegans. Plos Biology 8 DOI: 10.1371/journal.pbio.1000556.
88
Yarasheski, K.E., Zachwieja, J.J., Bier, D.M., 1993. Acute Effects of Resistance Exercise on Muscle
Protein-Synthesis Rate in Young and Elderly Men and Women. American Journal of
Physiology 265, E210-E214.
Yeh, G.Y., Eisenberg, D.M., Kaptchuk, T.J., Phillips, R.S., 2003. Systematic review of herbs and
dietary supplements for glycemic control in diabetes. Diabetes Care 26, 1277-1294.
Yoon, S.A., Kang, S.I., Shin, H.S., Kang, S.W., Kim, J.H., Ko, H.C., Kim, S.J., 2013. p-Coumaric acid
modulates glucose and lipid metabolism via AMP-activated protein kinase in L6 skeletal
muscle cells. Biochemical and Biophysical Research Communications 432, 553-557.
Young, J.F., Christensen, L.P., Theil, P.K., Oksbjerg, N., 2008. The polyacetylenes falcarinol and
falcarindiol affect stress responses in myotube cultures in a biphasic manner. Dose-Response 6,
239-251.
Young, J.F., Duthie, S.J., Milne, L., Christensen, L.P., Duthie, G.G., Bestwick, C.S., 2007. Biphasic
effect of falcarinol on CaCo-2 cell proliferation, DNA damage, and apoptosis. Journal of
Agricultural and Food Chemistry 55, 618-623.
Zaini, R., Haywood, S., Brandt, K., Clench, M.R., Cross, N., Le Maitre, C., 2012a. Synergistic Action
of Falcarinol on Induction of Apoptosis on Human Lymphoid Leukaemia Cell Lines. Journal of
Pathology 228, S38.
Zaini, R.G., Brandt, K., Clench, M.R., Le Maitre, C.L., 2012b. Effects of Bioactive Compounds from
Carrots (Daucus carota L.), Polyacetylenes, Beta-Carotene and Lutein on Human Lymphoid
Leukaemia Cells. Anti-Cancer Agents in Medicinal Chemistry 12, 640-652.
Zhang, S.Y., Kim, K.H., 1998. Essential role of acetyl-CoA carboxylase in the glucose-induced insulin
secretion in a pancreatic beta-cell line. Cellular Signalling 10, 35-42.
Zinn, A., Felson, S., Fisher, E., Schwartzbard, A., 2008. Reassessing the cardiovascular risks and
benefits of thiazolidinediones. Clin. Cardiol. 31, 397-403.
Zygmunt, K., Faubert, B., MacNeil, J., Tsiani, E., 2010. Naringenin, a citrus flavonoid, increases
muscle cell glucose uptake via AMPK. Biochemical and Biophysical Research
Communications 398, 178-183.

89
8. Acknowledgements
I sincerely express my gratitude towards my main supervisor Niels Oksbjerg, Department of Food
Science, Aarhus University, for the encouragement, guidance and support he has given me all these
years, and for always being there to discuss any problem I had. I genuinely thank my co-supervisor
Jette F. Young, for her useful advice and able guidance and also for being very supportive during the
hard times. Per Bendix Jeppesen is gratefully thanked for his supervision during the beta-cell studies
at the Department of Endocrinology, Aarhus University Hospital.
Karsten Kristiansen, Department of Biology, University of Copenhagen, is gratefully
acknowledged for conjecturing the project and guiding us through it. I would also like to thank Xavier
Fretté for bringing me samples all the way from Odense on his way home.
I wholeheartedly thank Suresh Rattan and Stig Purup for the scientific as well as friendly
discussions.
Special thanks go to Anne-Grete Dyrvig Petersen, Inge lise Sørensen, Bente Andersen,
Kasper Bøgild Poulsen and Dorthe Rasmussen, for their exceptional technical assistance and
kindness.
My office mates Brita Ngum Che, Bjorn Melin Nielsen, Kasper Høck and Allesandro
Spanó are heartily thanked for all the discussions we had together, and for providing a friendly
atmosphere to work in.
During the course of this PhD, life presented me with several challenges. Among them, the
demise of both of my grandparents, who were very dear to me, and whom I had lived with all my life,
was the hardest to bear. Yet, their love and affection still gives me strength. I express my gratitude to
Helle Vestrup, Aase Karin Sørensen, Anne Hjørth Balling and Birthe Ømark Jensen, for lending a
helpful hand and for sharing their sorrows with me to lessen mine, during this period of grief and
hardship. I will always remember you for your kindness.

90
I offer heartfelt gratitude to my husband Kaustuv for taking the burden of running the house-
hold singlehandedly, so that I could concentrate in my work; and my daughter Surabhi, for
understanding when I did not have time to listen or play, and also for giving me a big hug that
rejuvenated me when I returned home late and exhausted. I cannot thank my parents enough for
encouraging me every step of the way, especially when I felt low; for taking the stake of travelling so
far and so often, just to help me when I needed them; and most importantly for believing in me and for
inculcating in me the tenacity to push against all odds.
I earnestly thank my dearest friends Lakshman, Anuja, Gitta, Per Bo, Ripu, Cecelia, Pratyay
and Madhubanti for all the babysitting they have done for me, for their encouragement, and for being
by my side as an integral part of my life.
Sumangala Bhattacharya
July 2013

91
9. Manuscripts

Manuscript I
Bioactive components from flowers of Sambucus nigra L. increase glucose uptake in primary porcine
myotube cultures and reduce fat accumulation in Caenorhabditis elegans
Sumangala Bhattacharya, Kathrine B. Christensen, Louise C. B. Olsen, Lars P. Christensen, Kai Grevsen, Nils
J. Færgeman, Karsten Kristiansen, Jette F. Young, and Niels Oksbjerg
Submitted to: The Journal of Agricultural and Food Chemistry

1
Bioactive components from flowers of Sambucus nigra L. increase glucose
uptake in primary porcine myotube cultures and reduce fat accumulation in
Caenorhabditis elegans
Sumangala Bhattacharya1, Kathrine B. Christensen
2, Louise C. B. Olsen
3, Lars P. Christensen
2, Kai
Grevsen4, Nils J. Færgeman
3, Karsten Kristiansen
5, Jette F. Young
1, and Niels Oksbjerg
1*
Author affiliations:
1Department of Food Science, Aarhus University, Blicher’s Allé 20, Postbox 50, 8830 Tjele, Denmark
2Department of Chemical Engineering, Biotechnology and Environmental Technology, University of
Southern Denmark, Niels Bohrs Allé 1, 5230 Odense M, Denmark
3Department of Biochemistry and Molecular Biology, Campusvej 55, 5230 Odense M, Denmark
4Department of Food Science, Aarhus University, Kirstinebjergvej 10, 5792 Aarslev, Denmark
5Department of Biology, University of Copenhagen, Ole Maaløes Vej 5, 2200 Copenhagen N, Denmark
*Corresponding author:
Niels Oksbjerg
Institute of Food Science, Aarhus University,
Blicher’s Allé 20, Postbox 50, 8830 Tjele, Denmark
E-mail: [email protected], Tel: + 45 8715 7809, Fax: +45 8715 4891
2
Abstract
Obesity and insulin resistance in skeletal muscles are major features of type 2 diabetes. In the present
study, we examined the potential of Sambucus nigra flower (elderflowers) extracts to stimulate glucose
uptake (GU) in primary porcine myotubes and reduce fat accumulation (FAc) in Caenorhabditis
elegans. Bioassay guided chromatographic fractionations of extracts and fractions resulted in the
identification of naringenin and 5-O- caffeoylquinic acid exhibiting a significant increase in GU. In
addition, polyphenols related to those found in elderflowers were also tested and among these,
kaempferol, ferulic acid, p-coumaric acid and caffeic acid increased GU significantly. FAc was
significantly reduced in C. elegans, when treated with elderflower extracts, their fractions and the
metabolites naringenin, quercetin-3-O-rutinoside, quercetin-3-O-glucoside, quercetin-3-O-5’’-
acetylglycoside, kaempferol-3-O-rutinoside, isorhamnetin-3-O-rutinoside and isorhamnetin-3-O-
glucoside and the related polyphenols kaempferol and ferulic acid. The study indicates that elderflower
extracts contain bioactive compounds capable of modulating glucose and lipid metabolism, suitable for
nutraceutical and pharmaceutical applications.
Keywords: Elderflowers, Elderflower extracts, Type 2 diabetes, Glucose uptake, Fat accumulation,
Obesity, Naringenin, Kaempferol, Polyphenols

3
Introduction
Type 2 diabetes (T2D) and visceral obesity have been strongly implicated in the occurrence of a
collection of interrelated metabolic abnormalities, commonly called the metabolic syndrome (MS) (1,
2). T2D is commonly characterized by hyperglycaemia and hyperinsulinemia; and are often
accompanied by β-cell failure and enhanced gluconeogenesis in the liver (3, 4). Again, insulin
sensitivity has been found to correlate negatively with fat accumulation (FAc), irrespective of age and
genetic background (5). Unfortunately, some of the available medications for T2D are associated with
several undesirable side effects (6). This has increased the need for the discovery of supplementary
nutraceuticals with anti-diabetic properties, capable of modulating both glucose and lipid metabolism.
Flowers of black elder are used in many European countries for their appealing flavour and
native flower aroma, to make extracts, which are consumed as a beverage (7, 8). Sambucus nigra L.
(black elder) concoctions have also been used as an alternative medicine against common cold and
influenza (9). Most of the studies on black elder have been performed on the fruits of the plant
(elderberries) which is known for its anti-viral and immunity-boosting effects (10, 11); but recent
research has revealed that the flowers of black elder (elderflowers) have potential anti-diabetic
properties (12). Elderflower extracts have been found to activate peroxisome proliferator-activated
receptors and enhance insulin-dependent glucose uptake (GU) in adipocytes (13). Moreover, in an
observational study, elderflowers in combination with Asparagus officinalis has shown significant
weight-reducing potential (14).
Skeletal muscle is the primary site for glucose disposal, where about 75 % of the insulin-driven
glucose disposal takes place (15). Therefore, in this study we have examined the potential of
elderflower extracts, fractions and secondary metabolites to stimulate GU in primary myotube cultures.

4
Our investigation resulted in the identification of potential bioactive flavonoids and phenolic acids
from elderflower extracts and fractions. This motivated us to test additional polyphenols that are
structurally related to the flavonoids and phenolic acids found in elderflowers and gather information
on their potential anti-diabetic effects. These additional polyphenols (kaempferol, ferulic acid, p-
coumaric acid and caffeic acid), has been referred to in the article as ‘related polyphenols’.
Stress can result in increased glucose utilization and uptake (16). Again, oxidative stress has
been implicated as a contributing factor in MS (17). We therefore monitored the effect of elderflower
extracts on (a) the transcription regulation of heme oxygenase 1 (HMOX1), a marker of oxidative stress
response; and heat shock protein 70 (HSP70), whose expression has been found to be induced by
different kinds of cellular stress conditions, including nutritional stress (18) and (b) generation of
reactive oxygen species (ROS).
Together with a reduction in blood glucose levels, reduction of body fat too is an important goal
for combating obesity and MS. In the worm Caenorhabditis elegans (C. elegans), most of the more
than 400 genes involved in fat storage are evolutionarily conserved and act in common cellular
pathways (19). It has been used in several studies to show the effect of nutritional perturbations on
obesity and other metabolic diseases (20). The wild type strain, N2, was used in this study to examine
the accumulation of the lipophilic dye, Nile Red. While feeding on E. coli bacteria, the fluorescent
compounds are primarily deposited in the fat storage compartments in the intestine (21). A measure of
the level of fat storage is obtained by comparing the fluorescence levels in untreated and treated
worms. The present study demonstrates the effect of elderflower extracts and its selected secondary
metabolites as well as some related polyphenols on GU in primary porcine myotubes and on FAc in C.
elegans.

5
Materials and Methods
Pigs used for the isolation of satellite cells were treated according to the Danish Ministry of Justice
Law, no. 382 (June 10, 1987).
Preparation of plant extracts
Elderflowers (Caprifoliaceae, Sambucus nigra L. cv. Haschberg; Holunderhof Helle, Thumby,
Germany) were picked in June 2007 and frozen immediately after harvest at -22 °C. The frozen flowers
(5 kg) were homogenized and extracted using dichloromethane (DCM, 12 L) and subsequently
methanol (MeOH, 10 L), overnight in the dark at 5 °C and filtered afterwards. The extracts were dried
under vacuum, yielding 28.4 g and 151.4 g of dry matter respectively. Liquid chromatography (LC)
with photodiode array detector (PDA) and mass spectrometric detection was performed with LC-PDA-
MS settings as previously described (22).
Fractionation of plant extracts
A part of the DCM extract (11 g) was separated by flash CC (70 mm i.d., 400 g silica gel 63-200 µm
Merck) using the following solvent gradient: 100 % hexane (1 L), 10-100 % ethyl acetate (EtOAc) in
hexane in 10 % steps (1 L each), 50:50 EtOAc-MeOH (1 L), yielding 112 fractions (100 mL each). The
collected fractions were analysed by normal phase thin layer chromatography (TLC) and then
combined into 7 fractions (DCM A-G). A part of the MeOH extract (5 g) was separated by flash CC
(40 mm i.d., 100 g RP-18 silica gel) using the following solvent gradient: 100 % H2O (200 mL), 10 %
acetonitrile in H2O (150 mL), 30-90 % acetonitrile in H2O in 20 % steps (300 mL each), 100 %
acetonitrile (300 mL), yielding 39 fractions (50 mL each). The collected fractions were analysed by
reverse phase TLC and then combined into 7 fractions (MeOH A-G).

6
Preparation of samples for bioassays
All extracts, chromatographic fractions and standards were dissolved in dimethyl sulfoxide (DMSO
99.9 %, Merck, Darmstadt, Germany) before they were tested for biological activity. Standards of
naringenin, quercetin-3-O-rutinoside (Q-3-O-R), quercetin-3-O-glucoside (Q-3-O-G), quercetin-3-O-
6’’-acetylglucoside (Q-3-O-6’’-A), kaempferol, kaempferol-3-O-rutinoside (K-3-O-R), isorhamnetin-3-
O-glucoside (I-3-O-G), isorhamnetin-3-O-rutinoside (I-3-O-R), 5-O-caffeoylquinic acid (5-O-C),
caffeic acid (CaA), p-coumaric acid (p-CA), and ferulic acid (FeA) were purchased from Sigma-
Aldrich Chemie GmbH (Steinheim, Germany) or Extrasynthese (Genay, France).
Preparation of myotube cultures
Satellite cells were isolated from semimembranosus muscles of female pigs weighing approx.12 Kg,
essentially as stated in (23) and stored in liquid nitrogen until used. To prepare myotube cultures, the
cells were thawed and evenly seeded on Matrigel matrix (BD Biosciences, cat no. 354230) coated (1:50
v/v) 24, 48, or 96 well plates for RT-PCR studies, GU assay, and 2’, 7’ dichlorodihydrofluorescein
diacetate (H2DCF-DA) oxidation studies, respectively. Cells were proliferated in Porcine Growth
Medium (PGM) consisting of 10 % foetal calf serum (FCS), 10 % horse serum, 80 % Dulbecco’s
modified Eagles medium (DMEM) with 25 mM glucose (Life Technologies, Naperville, IL) and
antibiotics (100 IU/mL penicillin, 100 IU/mL streptomycin sulphate, 3 µg/mL amphotericin B, 20
µg/mL gentamycin). The cells were grown in PGM until they were approximately 80 % confluent in a
CO2-regulated humidified incubator (95 % air and 5 % CO2 at 37°C). Thereafter, the cells were
proliferated to 100 % confluence in media containing DMEM (7 mM glucose), 10 % FCS, and
antibiotics for 24 h and subsequently differentiated into myotubes by incubating with differentiation
media (DMEM containing 7 mM glucose, 5 % FCS, antibiotics, and 1 µM cytosine arabinoside) for at
least 48 h.

7
Glucose uptake assay
The differentiated myotubes were treated with serum free media (DMEM with 7 mM, glucose,
antibiotics, and 1 µM cytosine arabinoside) overnight, followed by incubation with various treatments
for 1 h. The myotubes were then washed with (4-(2-hydroxyethyl)-1-piperazineethanesulfonic acid)
HEPES buffered saline (20 mM Hepes, 140 mM NaCl, 5 mM KCl, 2.5 mM MgSO4, 1 mM CaCl2,
adjusted to pH 7.4) and incubated with 0.1 mM 2-deoxy-[3H] glucose (2 DOG) (250 µL/well) for 30
min; following which they were quickly washed with ice cold phosphate buffered saline (500 µL/well)
and lysed by adding 0.05 M NaOH (37°C, 250 µL/well) and placed on a shaking board for 30 min. The
cell lysate was transferred to a scintillation tube, mixed with scintillation liquid (Ultima Gold,
PerkinElmer Inc.) in 1:10 ratio and counted in a Win spectral, 1414 liquid scintillation counter
(PerkinElmer, Life Sciences). The data was normalised with protein concentration per well.
mRNA extraction and RT-PCR
Twenty-four well plates containing differentiated primary myotubes were exposed to treatment (200
µg/mL of elderflower DCM extract in differentiation media) for different time points in duplicates.
After respective time intervals (1, 2 and 4 h), the myotubes were washed, harvested and stored for later
RNA extraction with RNeasy mini kit (Qiagen, Albertslund, Denmark). RT-PCR analysis was done
with defined primers and probes described elsewhere (24). The mRNA levels of HMOX1 and HSP70
were normalised against the reference gene glyceraldehyde 3-phosphate dehydrogenase (GAPDH). A
standard curve was generated by serial dilution. Wells containing either water or genomic DNA were
used as negative controls. All samples were measured in duplicate. The relative expression of HSP70
and HMOX1 were calculated according to the ‘Mathematical model for relative quantification in real-
time PCR’ (25).
8
Intracellular ROS
White-walled 96 well plates, containing differentiated primary myotubes were treated and the
measured data processed, essentially as has been mentioned elsewhere (24), with the following
changes. Background was measured before the addition of H2DCF-DA. Myotubes were incubated with
different concentrations of the elderflower DCM extract (0.1, 0.2, and 0.5 mg/mL) and H2O2 (100 µM
in KCl buffer) separately. The intracellular oxidation of H2DCF-DA in the wells was measured in
quadruplicates at 34°C for 4 h, at intervals of 4 min.
Fat accumulation in C. elegans
The wild-type C. elegans strain, N2 was used in this study. For fat staining experiments, Nile Red
(N3013, Sigma-Aldrich, dissolved in acetone (500 mg/mL)) was added to molten nematode growth
medium (NGM, ~55°C) to a final concentration of 0.05 mg/mL, and aliquoted in 24-well plates (1 mL/
well). The wells were seeded with E. coli bacteria (uracil auxotroph strain OP50) in 2 x Yeast extract
Tryptone medium (40 µL/ well). When dry, 25 µL M9 buffer (3 g KH2PO4, 6 g Na2HPO4, 5 g NaCl, 1
mL 1 M MgSO4, H2O to 1 L) and either 10 µL DMSO (control) or 10 µL sample in DMSO were
added. Synchronized L1 larvae were put on the plates and grown for 46 h at 20°C until mid-L4 stage.
Worms were then mounted in a drop of 10 mM tetramizole (T1512, Sigma-Aldrich) atop 2 % agarose
pads laid on a microscopy glass slide and overlaid with a cover slip. Fluorescence microscopy
(rhodamine channel) was done using a Leica DMI6000 B microscope equipped with an Olympus DP71
camera. Images were captured using Visiopharm Integrator System software (Visiopharm, Denmark).
All worms were photographed at 200 × magnification and 30 ms exposure time. Images were
quantified using ImageJ (http://rsbweb.nih.gov/ij/).
9
Data Analysis
For experiments on porcine myotubes, data was analysed, using the ‘Mixed procedure’ of SAS
statistical programming software (Ver. 9.2; SAS Institute Inc., Cary, NC, USA). The model consisted
of treatments and their interactions as fixed effects, and experiments, replicate determinations, and pigs
within treatments as random effects. The level of HSP70 and HMOX1 mRNA expression were
analysed with a model where time points were considered as fixed effects and replicates as random
effects. The number of pigs from which satellite cells were isolated varied between 3 and 4; the number
of replicates was 6.
For studies on C. elegans, Student’s unpaired t-test or Analysis of variance (ANOVA) were
used. Statistical analysis was done with Graph Pad Prism 5 software package (GraphPad Software,
Inc.) on the raw data before normalization of the data. Number of worms used for each treatment varied
between 13 and 19.
Results
The elderflower DCM and MeOH extracts obtained were characterized by LC-PDA-MS. Major
components in the MeOH extract corresponded to those previously reported (22, 26), and the most
prominent ones were 5-O-C, Q-3-O-R, K-3-O-R, and I-3-O-R. Major components of the DCM extract
were α–linolenic acid (α–LA), linoleic acid (LA), naringenin, and some unknown phenolic acid
derivatives. Separation of each of the two extracts resulted in 7 fractions (A to G). Only the DCM
fractions D and E exhibited both increase in GU and decrease in FAc and were analysed by LC-PDA-
MS. Fraction D contained some unknown phenolic acid derivatives, α-LA, LA and epoxy-linalool;
Fraction E contained naringenin and α-LA as the major components, together with minor amounts of
10
naringenin derivatives. When tested for any detrimental effect on prolonged exposure, neither DCM
nor MeOH extract showed any reduction on myotube viability (data not shown).
The DCM and MeOH extracts of elderflowers were tested for their effect on both insulin-
stimulated and insulin-independent GU in primary porcine myotube cultures (Figure 1). Both extracts
were able to increase GU in muscle cells in the presence and absence of insulin. The DCM extract in
particular, caused a significant increase in GU with respect to the control at all concentrations tested;
the only exception being at 1000 µg/mL where the increase was not statistically significant (Figure 1a).
The MeOH extract showed a small but significant increase in GU (other than at 600 and 1000 µg/mL)
in absence of insulin (Figure 1b). For the DCM extract, the increase in GU without insulin was
statistically consistent within the tested concentration range of 6-1000 µg/mL, with a numerical
maximum increase of 36 % (p < 0.0001) at 60 µg/mL compared to control. In the presence of insulin,
an increase of 21 % (p = 0.0006) at 200 µg/mL was observed for the DCM extract. At the highest
tested concentration (1000 µg/mL) of the DCM extract, the increase without insulin was 23 % (p <
0.0001), and there was no significant increase in the presence of insulin. The effect of the elderflower
MeOH extract was less prominent than that of the DCM extract. It did not show a significant increase
in GU in presence of 750 pM Insulin. However, a significant increase of 7 % (p = 0.04) to 11 % (p =
0.0003) in GU, compared to the control at 6 to 200 µg/mL was observed in the absence of insulin.
MeOH extract showed a significant decrease in GU at the maximum concentration used (1000 µg/mL),
both in the presence and absence of insulin. The DCM extract showed much higher response in GU
compared to MeOH, and was therefore chosen for further studies on stress responses.
To examine whether the observed effect of the extracts on GU was caused through the
induction of stress on the myotubes, mRNA abundance of HSP70 and HMOX1 was studied (Figure
2a). Exposure times of 1, 2 and 4 h and a concentration of 200 µg/mL were chosen in accordance with

11
the exposure time for the GU assay. No significant up or down regulation of either HSP70 or HMOX1
mRNA was observed. Additionally, the influence of the DCM extract on the generation of intracellular
ROS was determined at 100, 200, and 500 µg/mL (Figure 2b). A significant reduction in the formation
of ROS was observed with respect to control at all the concentrations tested.
To aid identification of the bioactive components in the two extracts, they were separated by
flash CC. All the 14 fractions obtained were then screened for their potential to induce GU
independently at concentrations of 50 and 100 µg/mL. Two DCM fractions D and E were able to
increase GU significantly at 100 µg/mL, by 17 and 26 %, respectively (Figure 3a). None of the MeOH
fractions showed any effect on GU. The DCM fractions D and E showed no reduction in myotube
viability (data not shown).
The bioactive fractions D and E of the DCM extract contained mainly naringenin, α-LA and
LA. These three compounds were selected for further studies, as well as several other known
elderflower metabolites (22) and related polyphenols to further explore the observed bioactivities of the
extracts and the fractions. Overall, the elderflower metabolites tested were: naringenin, 5-O-CA, Q-3-
O-R, Q-3-O-G, Q-3-O-6’’-A, K-3-O-R, I-3-O-G, I-3-O-R, α-LA, and LA; and the related polyphenols
tested were: kaempferol, CaA, FeA, and p-CA. All were tested for effects on insulin-independent GU
in primary porcine myotube cultures at the concentrations 0.1, 1.0, and 10 µM; other than α-LA and
LA, which were tested at 10, 30, 70 and 100 µM. The compounds exhibiting a significant increase in
GU are illustrated in Figure 3b. Among them, 5-O-CA was identified in the MeOH fractions;
naringenin in the DCM fractions and kaempferol, FeA, p-CA, and CaA belong to the related
polyphenols tested. None of the other compounds showed any effect on GU, although LA (in DCM
fraction) showed a strong tendency (p =0.056) at the concentration of 10 µM. The highest increase was
observed at the concentration of 10 µM for naringenin and kaempferol (24 % and 21 % respectively).

12
The effect of elderflower extracts, fractions, individual elderflower polyphenols as well as
related polyphenols on C. elegans fat storage is illustrated in Figure 4 & 5. Both MeOH and DCM
extracts (200 µg/mL) decreased the Nile Red Fluorescence (NRF) significantly by 25 % and 50 %
respectively, relative to control (Figure 4a & 5a). The DCM and MeOH fractions (A – G) were tested
further. The MeOH fractions C – G (100 µg/mL) showed significant reduction in NRF (23 to 55 %),
with the maximum reduction by fraction F (55 %, p < 0.0001) (data not shown). Among the DCM
fractions tested at three different concentrations (10, 50, and 100 µg/mL), B, C, F, and G exhibited
significant reduction in NRF (13 to 48 %) (data not shown). But the highest reduction in NRF was
observed for fractions D (78 %) and E (87 %) at a concentration of 100 µg/ml (Figure 4b & 5b). All the
elderflower metabolites (other than α-LA, and LA) and related polyphenols mentioned above were
tested for reduction in FAc at the concentration of 50 µM. The compounds exhibiting significant
decrease in NRF are illustrated in Figure 4c. Among them, Q-3-O-R, Q-3-O-G, Q-3-O-6’’-A, K-3-O-R,
I-3-O-G, and I-3-O-R were identified in the MeOH fractions; naringenin in the DCM fractions; FeA
and kaempferol belongs to the related polyphenols tested. None of the other compounds showed any
effect on FAc. The highest reduction was observed for naringenin and kaempferol (65 and 60 %
respectively) compared to control (Figure 4c & 5c).
Discussion
Insulin resistance, manifested by inadequate GU in major glucose utilizing tissues; and visceral obesity
are two key aspects of T2D and MS. Elderflower extracts have previously been shown to induce weight
loss and exhibit anti-diabetic properties. This study showed for the first time that elderflower extracts
can autonomously stimulate GU in primary myotube cultures and reduce FAc in vivo.
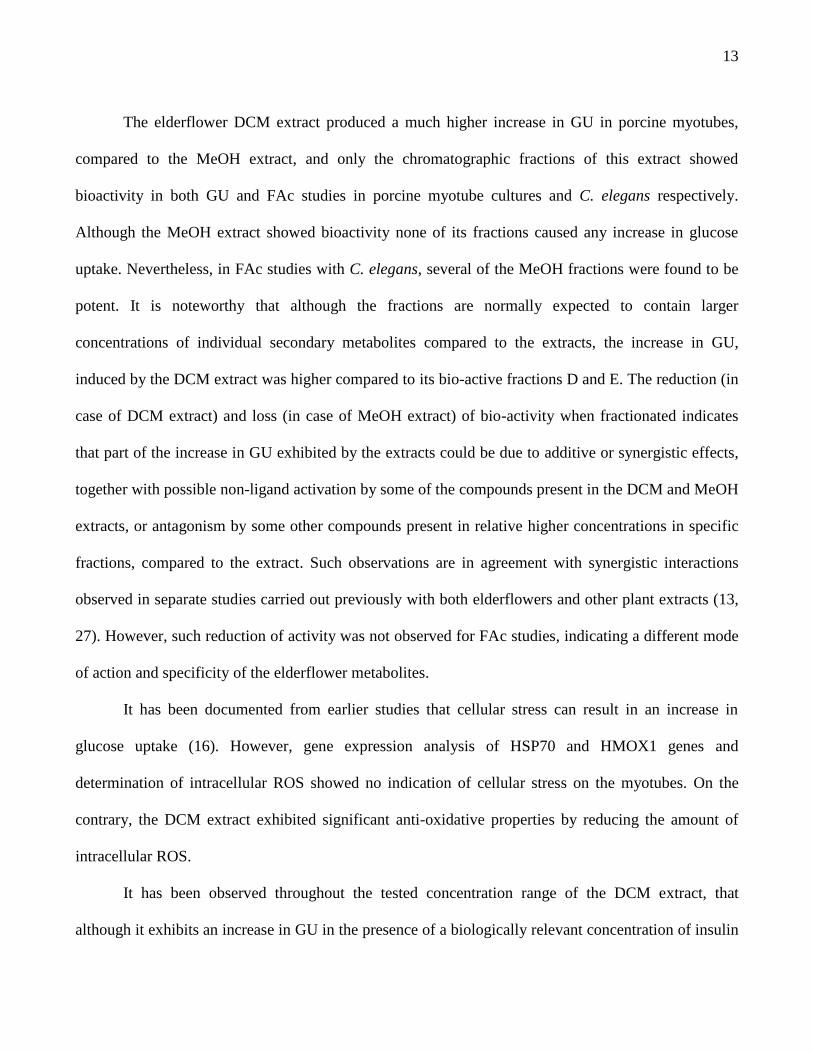
13
The elderflower DCM extract produced a much higher increase in GU in porcine myotubes,
compared to the MeOH extract, and only the chromatographic fractions of this extract showed
bioactivity in both GU and FAc studies in porcine myotube cultures and C. elegans respectively.
Although the MeOH extract showed bioactivity none of its fractions caused any increase in glucose
uptake. Nevertheless, in FAc studies with C. elegans, several of the MeOH fractions were found to be
potent. It is noteworthy that although the fractions are normally expected to contain larger
concentrations of individual secondary metabolites compared to the extracts, the increase in GU,
induced by the DCM extract was higher compared to its bio-active fractions D and E. The reduction (in
case of DCM extract) and loss (in case of MeOH extract) of bio-activity when fractionated indicates
that part of the increase in GU exhibited by the extracts could be due to additive or synergistic effects,
together with possible non-ligand activation by some of the compounds present in the DCM and MeOH
extracts, or antagonism by some other compounds present in relative higher concentrations in specific
fractions, compared to the extract. Such observations are in agreement with synergistic interactions
observed in separate studies carried out previously with both elderflowers and other plant extracts (13,
27). However, such reduction of activity was not observed for FAc studies, indicating a different mode
of action and specificity of the elderflower metabolites.
It has been documented from earlier studies that cellular stress can result in an increase in
glucose uptake (16). However, gene expression analysis of HSP70 and HMOX1 genes and
determination of intracellular ROS showed no indication of cellular stress on the myotubes. On the
contrary, the DCM extract exhibited significant anti-oxidative properties by reducing the amount of
intracellular ROS.
It has been observed throughout the tested concentration range of the DCM extract, that
although it exhibits an increase in GU in the presence of a biologically relevant concentration of insulin

14
(750 pM), it shows a higher increase in GU when administered in the absence of insulin. This indicates
the possibility that the signalling molecules responsible for the observed increase in GU, by the
elderflower metabolites might be shared to some extent with the insulin signalling pathway.
Several fractions of the MeOH and DCM extracts showed a reduction in FAc in C. elegans.
Unlike GU, further decrease in FAc was observed upon fractionation. Although many of the
elderflower metabolites present in the MeOH extract showed significant reduction in FAc, naringenin
(identified in the DCM extract) caused the highest reduction (Figure 4c).
The two fractions, D and E of the DCM extract both exhibited an increase in GU and a decrease
in FAc. Among the compounds present in these fractions, were unknown phenolic acids, and further
research is required to identify and elucidate their structures. However, amongst the compounds that
were identified in these fractions, the most prominent increase in GU and decrease in FAc were
observed for naringenin. Both confirming and contradictory findings exist, where naringenin was found
to enhance GU in L6 myotubes via adenosine monophosphate - activated protein kinase (AMPK)
activation (28) but reduce GU in MCF-7 breast cancer cells (29) and U937 cells (30). The reported
inhibitory effects of naringenin on GU can be explained by the different cell types used in these studies,
implying a cell-type specific effect of this compound.
Amongst the related polyphenols tested, kaempferol showed the highest increase in GU and
reduction in FAc. This is the first account demonstrating the ability of kaempferol to enhance GU in
myotubes and reduce FAc in vivo. However, in separate studies, kaempferol has previously been shown
to inhibit GU in HeLa cells (31), but enhance GU in mature 3T3-L1 adipocytes (32), which is similar to
the cell-type dependant response, observed for naringenin. It is important to note, that although
naringenin is a flavanone and kaempferol a flavonol, they are very similar in their chemical structures,

15
i.e., in size and the substitution pattern of their aromatic rings. This could signify the structural
importance of these molecules in their observed regulation of glucose and lipid homeostasis.
In entirety, it could be concluded that extracts, fractions and several secondary metabolites from
elderflowers possess pronounced bioactivities and can be used to modulate glucose and lipid
metabolism. Studies conducted with the extracts, fractions, and their constituent compounds revealed
that among the elderflower metabolites, naringenin is one of the most potent, with major effect on the
enhancement of GU and reduction in FAc. MS is characterized by elevated blood glucose levels and
increase in visceral obesity; and the fact that elderflower extracts exhibit the potential to amend both of
these metabolic defects, qualifies it for further investigation for its application as a supplementary
nutraceutical.
Abbreviations Used
CaA, caffeic acid; FeA, ferulic acid; I-3-O-G, isorhamnetin-3-O-glucoside; I-3-O-R, isorhamnetin-3-
O-rutinoside; K-3-O-R, kaempferol-3-O-rutinoside; 5-O-C, 5-O-caffeoylquinic acid; p-CA, p-coumaric
acid; Q-3-O-G, quercetin-3-O-glucoside; Q-3-O-6’’-A, quercetin-3-O-6’’-acetylglucoside; Q-3-O-R,
quercetin-3-O-rutinoside; ROS, reactive oxygen species; TLC, thin layer chromatography; NRF, nile
red fluorescence; DCM, dichloromethane; DMSO, dimethyl sulfoxide; EtOAc, ethyl acetate; H2DCF-
DA, 2’, 7’ dichlorodihydrofluorescein diacetate; MeOH, methanol; MS, metabolic syndrome; FAc, fat
accumulation; GU, glucose uptake;

16
Acknowledgements
The authors gratefully acknowledge Xavier Fretté, Department of Chemical Engineering,
Biotechnology and Environmental technology, University of Southern Denmark,
for his assistance during the LC-MS studies.
Reference List
1. Alberti, K. G. M. M.; Eckel, R. H.; Grundy, S. M.; Zimmet, P. Z.; Cleeman, J. I.; Donato, K. A.;
Fruchart, J. C.; James, W. P. T.; Loria, C. M.; Smith, S. C. Harmonizing the Metabolic
Syndrome. Circulation 2009, 120 (16), 1640-1645.
2. Bergman, R. N.; Kim, S. P.; Hsu, I. R.; Catalano, K. J.; Chiu, J. D.; Kabir, M.; Richey, J. M.;
Ader, M. Abdominal obesity: Role in the pathophysiology of metabolic disease and
cardiovascular risk. Am. J. Med. 2007, 120 (2A), S3-S8.
3. Leibowitz, G.; Bachar, E.; Shaked, M.; Sinai, A.; Ketzinel-Gilad, M.; Cerasi, E.; Kaiser, N.
Glucose regulation of beta-cell stress in type 2 diabetes. Diabetes Obes. Metab. 2010, 12,
66-75.
4. Miranda, P. J.; Defronzo, R. A.; Califf, R. M.; Guyton, J. R. Metabolic syndrome: Definition,
pathophysiology, and mechanisms. Am. Heart J. 2005, 149 (1), 33-45.
5. Wagenknecht, L. E.; Langefeld, C. D.; Scherzinger, A. L.; Norris, A. M.; Haffner, S. M.; Saad,
M. F.; Bergman, R. N. Insulin sensitivity, insulin secretion, and abdominal fat - The

17
Insulin Resistance Atherosclerosis Study (IRAS) Family Study. Diabetes 2003, 52 (10),
2490-2496.
6. Shearer, B. G.; Billin, A. N. The next generation of PPAR drugs: Do we have the tools to find
them? Biochem. Biophy.s Acta, Mol. Cell. Biol. Lipids 2007, 1771 (8), 1082-1093.
7. Jorgensen, U.; Hansen, M.; Christensen, L. P.; Jensen, K.; Kaack, K. Olfactory and quantitative
analysis of aroma compounds in elder flower (Sambucus nigra L.) drink processed from
five cultivars. J. Agric. Food Chem. 2000, 48 (6), 2376-2383.
8. Toulemonde, B.; Richard, H. M. J. Volatile Constituents of Dry Elder (Sambucus-Nigra L)
Flowers. J. Agric. Food Chem. 1983, 31 (2), 365-370.
9. Barak, V.; Birkenfeld, S.; Halperin, T.; Kalickman, I. The effect of herbal remedies on the
production of human inflammatory and anti-inflammatory cytokines. Isr. Med. Assoc. J.
2002, 4 (11), 919-922.
10. Roxas, M.; Jurenka, J. Colds and influenza: A review of diagnosis and conventional, botanical,
and nutritional considerations. Altern. Med. Rev. 2007, 12 (1), 25-48.
11. Zakay-Rones, Z.; Varsano, N.; Zlotnik, M.; Manor, O.; Regev, L.; Schlesinger, M.; Mumcuoglu,
M. Inhibition of several strains of influenza virus in vitro and reduction of symptoms by
an elderberry extract (Sambucus nigra L.) during an outbreak of influenza B Panama. J.
Altern. Complement Med. 1995, 1 (4), 361-369.
18
12. Gray, A. M.; Abdel-Wahab, Y. H. A.; Flatt, P. R. The traditional plant treatment, Sambucus nigra
(elder), exhibits insulin-like and insulin-releasing actions in vitro. J. Nutr. 2000, 130 (1),
15-20.
13. Christensen, K. B.; Minet, A.; Svenstrup, H.; Grevsen, K.; Zhang, H. B.; Schrader, E.; Rimbach,
G.; Wein, S.; Wolffram, S.; Kristiansen, K.; Christensen, L. P. Identification of plant
extracts with potential antidiabetic properties: effect on human peroxisome proliferator-
activated receptor (PPAR), adipocyte differentiation and insulin-stimulated glucose
uptake. Phytother. Res. 2009, 23 (9), 1316-1325.
14. Chrubasik, C.; Maier, T.; Dawid, C.; Torda, T.; Schieber, A.; Hofmann, T.; Chrubasik, S. An
observational study and quantification of the actives in a supplement with Sambucus nigra
and Asparagus officinalis used for weight reduction. Phytother. Res. 2008, 22 (7), 913-
918.
15. Baron, A. D.; Brechtel, G.; Wallace, P.; Edelman, S. V. Rates and tissue sites of non-insulin-
mediated and insulin-mediated glucose-uptake in humans. Am. J. Physiol. 1988, 255 (6),
E769-E774.
16. Lekas, M. C.; Fisher, S. J.; El-Bahrani, B.; Van Delangeryt, M.; Vranic, M.; Shi, Z. Q. Glucose
uptake during centrally induced stress is insulin independent and enhanced by adrenergic
blockade. J. Appl. Physiol. 1999, 87 (2), 722-731.
17. Whaley-Connell, A.; McCullough, P. A.; Sowers, J. R. The role of oxidative stress in the
metabolic syndrome. Rev. Cardvasc. Med. 2011, 12 (1), 21-29.

19
18. Rattan, S. I. S. Rationale and methods of discovering hormetins as drugs for healthy ageing.
Expert Opin. Drug. Discov. 2012, 7 (5), 439-448.
19. Ashrafi, K.; Chang, F. Y.; Watts, J. L.; Fraser, A. G.; Kamath, R. S.; Ahringer, J.; Ruvkun, G.
Genome-wide RNAi analysis of Caenorhabditis elegans fat regulatory genes. Nature
2003, 421 (6920), 268-272.
20. Brooks, K. K.; Liang, B.; Watts, J. L. The Influence of bacterial diet on fat storage in C. elegans.
Plos One 2009, 4 (10), 1-8.
21. Mckay, R. M.; Mckay, J. P.; Avery, L.; Graff, J. M. C. elegans: A model for exploring the
genetics of fat storage. Dev. Cell 2003, 4 (1), 131-142.
22. Christensen, L. P.; Kaack, K.; Fretté, X. C. Selection of elderberry (Sambucus nigra L.)
genotypes best suited for the preparation of elderflower extracts rich in flavonoids and
phenolic acids. Eur. Food Res. Technol. 2008, 227 (1), 293-305.
23. Theil, P. K.; Sorensen, I. L.; Nissen, P. M.; Oksbjerg, N. Temporal expression of growth factor
genes of primary porcine satellite cells during myogenesis. Anim. Sci. J. 2006, 77 (3),
330-337.
24. Young, J. F.; Christensen, L. P.; Theil, P. K.; Oksbjerg, N. The polyacetylenes falcarinol and
falcarindiol affect stress responses in myotube cultures in a biphasic manner. Dose-
Response 2008, 6 (3), 239-251.

20
25. Pfaffl, M. W. A new mathematical model for relative quantification in real-time RT-PCR. Nucleic
Acids Res. 2001, 29 (9), 2002-2007.
26. Christensen, K. B.; Petersen, R. K.; Kristiansen, K.; Christensen, L. P. Identification of bioactive
compounds from flowers of black elder (Sambucus nigra L.) that activate the human
peroxisome proliferator-activated receptor (PPAR) gamma. Phytother. Res. 2010, 24,
S129-S132.
27. Atangwho, I. J.; Ebong, P. E.; Eyong, E. U.; Asmawi, M. Z.; Ahmad, M. Synergistic antidiabetic
activity of Vernonia amygdalina and Azadirachta indica: Biochemical effects and
possible mechanism. J. Ethnopharmacol. 2012, 141 (3), 878-887.
28. Zygmunt, K.; Faubert, B.; MacNeil, J.; Tsiani, E. Naringenin, a citrus flavonoid, increases muscle
cell glucose uptake via AMPK. Biochem. Biophys. Res. Commun. 2010, 398 (2), 178-183.
29. Harmon, A. W.; Patel, Y. M. Naringenin inhibits glucose uptake in MCF-7 breast cancer cells: a
mechanism for impaired cellular proliferation. Breast Cancer Res. Treat. 2004, 85 (2),
103-110.
30. Park, J. B. Flavonoids are potential inhibitors of glucose uptake in U937 cells. Biochem. Biophys.
Res. Commun. 1999, 260 (2), 568-574.
31. Filomeni, G.; Desideri, E.; Cardaci, S.; Graziani, I.; Piccirillo, S.; Rotilio, G.; Ciriolo, M. R.
Carcinoma cells activate AMP-activated protein kinase-dependent autophagy as survival
response to kaempferol-mediated energetic impairment. Autophagy 2010, 6 (2), 202-216.

21
32. Fang, X. K.; Gao, J.; Zhu, D. N. Kaempferol and quercetin isolated from Euonymus alatus
improve glucose uptake of 3T3-L1 cells without adipogenesis activity. Life Sci. 2008, 82
(11-12), 615-622.
Funding bodies: This work was supported by The Danish Council for Strategic Research (Grant no.
09-063086) and The Graduate School of Agriculture, Food and Environment (SAFE), Aarhus
University.
22
Figure 1. Effect of elderflower extracts on insulin-stimulated (750 pM) and insulin-independent
glucose uptake in primary porcine myotube cultures exposed to (a) DCM extract and (b) MeOH
extract. Glucose uptake is indicated as per cent of the control (DMSO) which is set at 100. The plotted
values are LSMeans ± SEM. Ins = Insulin. The letters (a, b, c and d) on top of the bars indicate
significant differences in glucose uptake. Number of pigs used = 3; number of replicates taken per pig
= 6
Figure 2. Elderflower extracts on stress responses in the primary porcine myotubes (a) Effect of
elderflower DCM extract (200 µg/mL) on the expression of heme oxygenase 1 (HMOX1) and Heat
shock protein 70 (HSP70) after 1, 2 and 4 h of exposure. The mRNA levels of HMOX1 and HSP70
have been normalized against the reference gene glyceraldehyde 3-phosphate dehydrogenase (GAPDH)
and are given in fold change relative to their respective controls at the given time points. (b) Effect of
elderflower DCM extract on generation of reactive oxygen species (ROS) determined by intracellular
2,7-dichlorofluorescein oxidation. The DCM extract were tested at 100, 200 and 500 µg/mL
concentrations. H2O2 (100 µM) is used as a positive control. The x-axis shows every 5th
data point.
Plotted values are LSMeans ± SEM. Control = DMSO in media. Number of pigs used = 3; number of
replicates taken per pig = 6. *p < 0.05, **p <0.01, ***p < 0.001 vs. control
Figure 3. Effect of elderflower DCM fractions D and E, selected elderflower metabolites, and related
polyphenols on glucose uptake in porcine myotubes. (a) Influence of the fractions D and E from
elderflower DCM extract at the concentrations 50 and 100 µg/mL. (b) Effect of selected elderflower
metabolites and related polyphenols tested at the concentrations of 0.1, 1.0 and 10 µM. Glucose uptake

23
is indicated as per cent of control (DMSO) set at 100. The plotted values are LSMeans ± SEM. Number
of pigs used = 3; number of replicates taken per pig = 6. *p < 0.05, **p <0.01, ***p < 0.001 vs. control
Figure 4. Effect of elderflower extracts, fractions, selected elderflower metabolites and related
polyphenols on C. elegans fat accumulation. Wild type worms from larval stage L1 to L4 were treated
with extracts, fractions or pure compounds on standard NGM plates containing the lipophilic dye Nile
Red. Control worms only received DMSO. (a) Effect of DCM and MeOH extracts tested at the
concentrations of 200µg/ml. Number of treated worms = 13-19. (b) Effect of elderflower DCM extract
fractions D and E. Worms were treated with 10, 50, and 100 µg/mL of plant material from D and E
fractions. Number of treated worms = 5-10. (c) Effect of elderflower metabolites and related
polyphenols. Worms were treated with the compounds at the concentration of 50 µM. Number of
treated worms = 10. Fluorescence levels are shown as normalized means +/- normalized SEM. *p <
0.05, **p <0.01, ***p < 0.001 vs. control
Figure 5. Effect of elderflower extracts, fractions, and selected polyphenols on staining of lipid stores
in C. elegans. (a) Control (DMSO) and 20 µg/ml raw extracts of elderflower (b) Control (DMSO) and
100 µg/ml fraction D and E of the DCM extraction of elderflower (c) Control (DMSO) and 50 mM of
pure standards Naringenin and Kaempferol. Upper panel in each row show Differential Interference
Contrast microscopy images; lower panel is the corresponding fluorescence images (rhodamine filter).
Scale bar corresponds to 0.1 mm

24
Figure 1.
DCM extract (µg/ml)
0 6 20 60 200 600 1000
Glu
cose u
pta
ke (
% c
ontr
ol)
90
100
110
120
130
140
+ Ins
- Ins
a
b
d
c
cd
cd cd
cd
cd
b
cd cd
cd
cd
MeOH extract (µg/ml)
0 6 20 60 200 600 1000
Glu
cose u
pta
ke (
% c
ontr
ol)
90
100
110
120
130
140
aa
a
c
b b
b
b
bb
bb b
b
A B

25
Figure 2.
Time (mins)
0 50 100 150 200 250
Flu
ore
sce
nce
15000
20000
25000
30000
35000
40000Control
H2O2 (100 µM)
Dcm (100 µg/ml
Dcm (200 µg/ml)
Dcm (500 µg/ml)
b
***
***
******
Exposure time (h)
1 2 4
mR
NA
ab
un
da
nce
(fo
ld c
ha
nge
)
0.6
0.8
1.0
1.2
1.4Control
HMOX1
HSP70
a
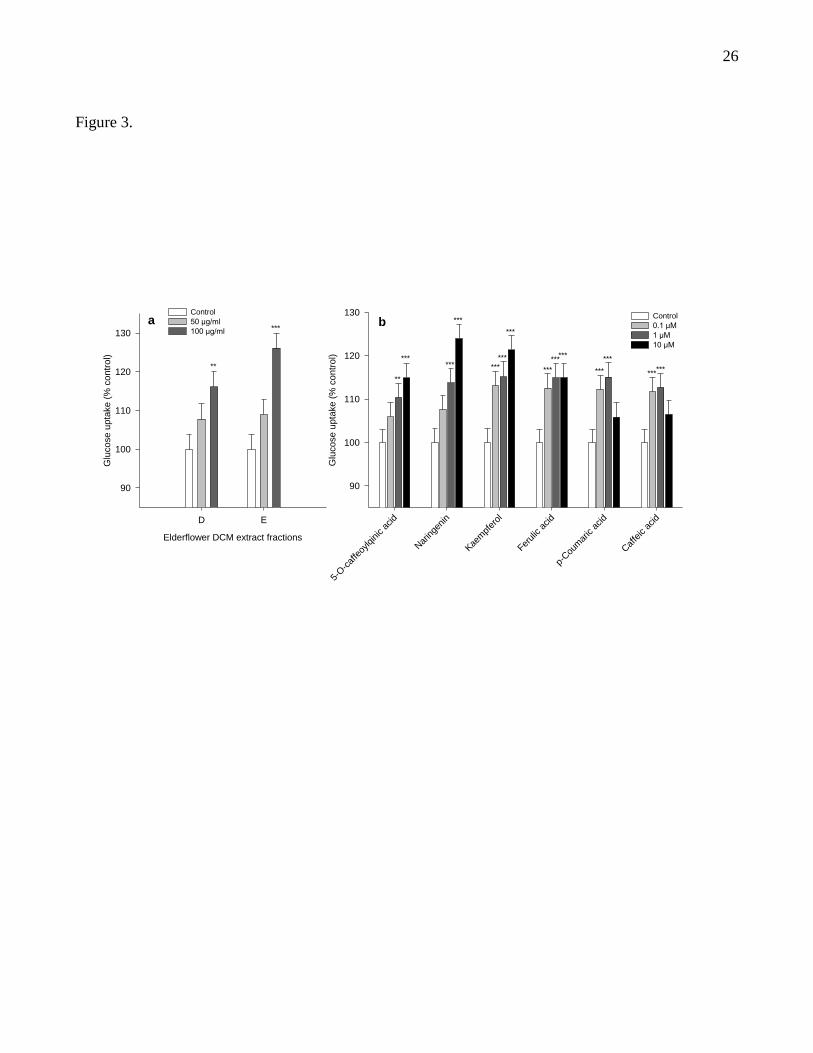
26
Figure 3.
Elderflower DCM extract fractions
D E
Glu
cose u
pta
ke (
% c
ontr
ol)
90
100
110
120
130
Control
50 µg/ml
100 µg/ml
a
5-O-c
affe
oylqinic a
cid
Nar
inge
nin
Kae
mpf
erol
Ferulic a
cid
p-Cou
mar
ic a
cid
Caf
feic a
cid
Glu
cose u
pta
ke (
% c
on
tro
l)
90
100
110
120
130 Control
0.1 µM
1 µM
10 µM
***
**
***
******
**
b
***
***
*** ***
******
***
***
******

27
Figure 4.
Elderflower DCM fractions
D E
Nile
Red F
luore
scence
0.0
0.2
0.4
0.6
0.8
1.0
1.2 Control
10 µg/mL
50 µg/mL
100 µg/mL
Control DCM MeOH
Nile
Red f
luore
scence
0.0
0.2
0.4
0.6
0.8
1.0
1.2a b
Con
trol
Ferulic a
cid
Que
rcet
in-3
-O-rut
inos
ide
Que
rcet
in-3
-O-g
luco
side
Que
rcet
in-3
-O-6
''-ac
etylglyc
oside
Kaem
pfer
ol-3
-O-rut
inos
ide
Kaem
pfer
ol
Isor
ham
netin
-3-O
-rut
inos
ide
Isor
ham
netin
-3-O
-gluco
side
Nar
inge
nin
Nile
Red F
luore
scence
0.0
0.2
0.4
0.6
0.8
1.0
1.2
*** *** ******
***
***
*** ***
***
c
***
***
*** ***
***
*
***
***
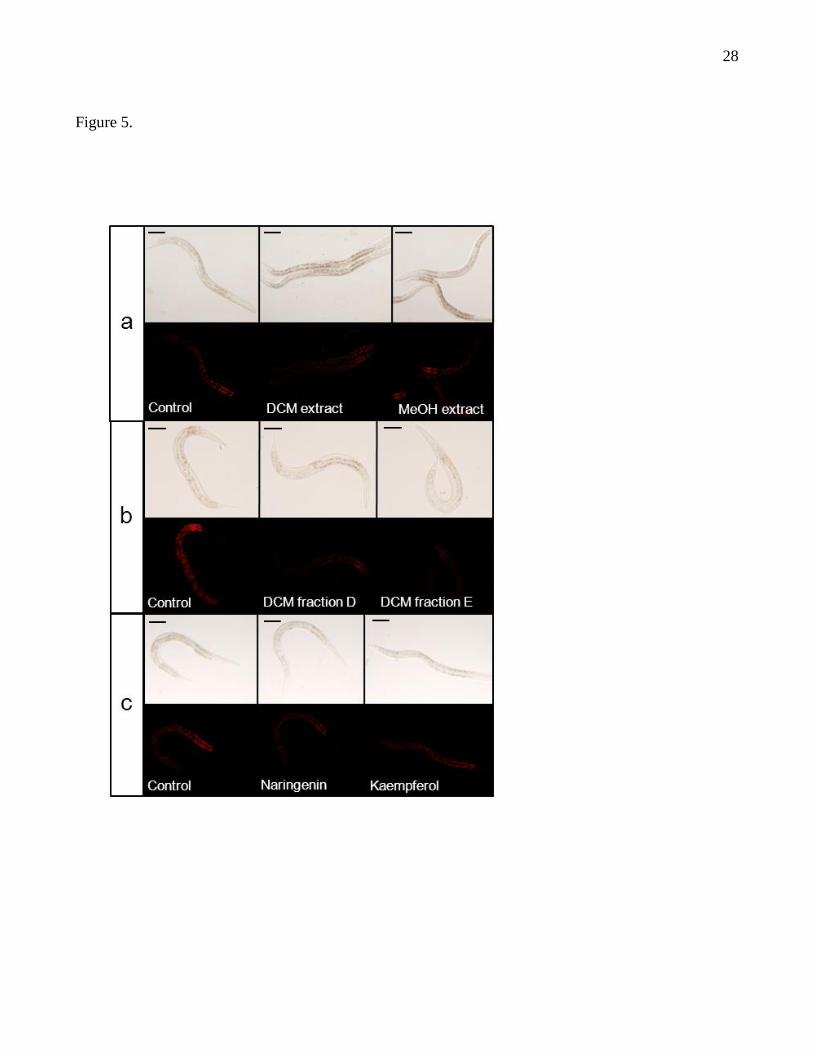
28
Figure 5.

Manuscript II
Caffeic acid, Naringenin and Quercetin enhance glucose stimulated insulin secretion and glucose
sensitivity in INS-1E cells
Sumangala Bhattacharya, Niels Oksbjerg, Jette F. Young, and Per Bendix Jeppesen
Submitted to: Diabetes, Obesity and Metabolism

1
Caffeic acid, Naringenin and Quercetin enhance glucose stimulated insulin
secretion and glucose sensitivity in INS-1E cells
Sumangala Bhattacharya1, Niels Oksbjerg
1, Jette F. Young
1, and Per Bendix Jeppesen
2
Author names and affiliations:
1Department of Food Science, Aarhus University, Blicher’s Allé 20, Postbox 50, 8830 Tjele, Denmark
2Department of Medicine and Endocrinology, Aarhus University Hospital, Aarhus University, Tage-
Hansens Gade 2, 8000 Aarhus C, Denmark
*Corresponding author:
Niels Oksbjerg
Institute of Food Science, Aarhus University,
Blicher’s Allé 20, Postbox 50, 8830 Tjele, Denmark
E-mail: [email protected]
Tel: + 45 8715 6000
Direct: + 45 8715 7809
Mobile: +45 3011 3204
Sponsor: The Danish Council for Strategic Research (Grant no. 09-063086)

2
Abstract
Aims: Caffeic acid, naringenin and quercetin are naturally occurring phenolic compounds (PCs)
present in many plants as secondary metabolites. The aim of this study was to investigate their effect on
glucose stimulated insulin secretion (GSIS) in INS-1E cells and to explore their effect on expression of
genes involved in beta cell survival and function under normoglycemic and glucotoxic conditions.
Methods: For acute studies, INS-1E cells were grown in 11 mM glucose (72 h) and then incubated
with the PCs (1 h) with 3.3/16.7 mM glucose; whereas, for chronic studies, the cells were grown in 11
mM glucose (72 h) with/without the PCs, and then incubated with 3.3/16.7 mM glucose (1 h);
thereafter, GSIS was measured. For GSIS and gene expression studies (GES) under glucotoxic
conditions, two sets of cells were grown in 11/25 mM glucose with/without the PCs (72 h): one was
used for GES, using real time RT-PCR, and the other was exposed to 3.3/16.7 mM glucose, followed
by measurement of GSIS.
Results: The study demonstrated that the PCs can enhance GSIS under hyperglycemic and glucotoxic
conditions in INS-1E cells. Moreover, these compounds can differentially, yet distinctly change the
expression profile of genes (Glut2, Gck, Ins1, Ins2, Beta2, Pdx1, Akt1, Akt2, IRS1, Acc1, Bcl2, Bax,
Casp3, Hsp70, and Hsp90) involved in beta cell stress, survival and function.
Conclusion: The results indicate that the PCs tested enhance GSIS and glucose sensitivity in INS-1E
cells. They also modulate gene expression profiles to improve beta cell survival and function during
glucotoxicity.
Keywords: Beta cells, gene expression, insulin secretion, type 2 diabetes, INS-1E cells, glucotoxicity,
hyperglycemia, phenolic compounds

3
Abbreviations: Glut2: glucose transporter 2; Ins1: insulin 1; Ins2: insulin 2; Akt1: RAC-alpha
serine/threonine-protein kinase encoding gene; Akt2: RAC-beta serine/threonine-protein kinase
encoding gene; IRS1: insulin receptor substrate 1; Pdx1: pancreatic and duodenal homeobox protein 1;
Beta2: neurogenic differentiation protein 1; Acc1: acetyl CoA carboxylase 1; Gck: glucokinase; Casp3:
caspase 3; Bax: Bcl-2 associated X protein; Bcl2: beta-cell lymphoma 2 protein; Hsp 70: heat shock
protein 70; Hsp90: heat shock protein 90

4
Introduction:
Over the past few decades, type 2 diabetes (T2D) has precipitated into a worldwide epidemic, now
spanning both developed and developing societies [1]. The insulin secreting pancreatic beta-cells have
an unequivocal role in the regulation of glucose homeostasis in mammals and therefore, malfunctions
in the insulin secretion patterns in pancreatic beta-cells is fundamental to the development of T2D.
Failure of the beta-cells to produce adequate amounts of insulin to overcome the growing insulin
resistance in muscles and other effector tissues is an essential pre-requisite in the occurrence of this
multi-faceted ailment [2]. Upon chronic exposure to hyperglycemic conditions, beta-cells experience a
state of impaired sensitivity towards fluctuations in glucose levels, which when left untreated can cause
permanent damage to beta-cell function [3]. During initial stages of hyperglycemic exposure, the beta-
cells are temporarily rendered insensitive to high glucose due to depletion of stored insulin caused by
continuous secretion. At this stage, the beta-cells regain their sensitivity towards glucose when allowed
to rest. Hyperglycemic exposure beyond this stage, initially leads to an adaptable expansion of the beta
cells [4,5]; but continuation of the hyperglycemic state without intervention can cause irreversible
damage, characterised among others by, flawed insulin gene expression and increased rate of apoptosis
[6] resulting in an impairment of beta cell survival and function, a process termed glucotoxicity [7].
Medications available for hyperglycemic therapy are associated with various contraindications [8]
including hypoglycemia, having severe consequences in physically weak or aged diabetic patients [9].
Therefore identification of novel, and more reliable insulin secretagogues remains a subject of major
interest.
The plant kingdom has served as a major source of drugs for innumerable ailments till date. As
a result more than a thousand species of plants have been examined for their efficacy against diabetes
alone [10]. In the current study we have evaluated the effect of three naturally occurring phenolic
compounds (PCs) on glucose stimulated insulin secretion (GSIS). These are: caffeic acid (a phenolic

5
acid; source: all plants e.g. Brussels sprouts (Brassica oleracea) [11], naringenin (a flavanone; source:
mainly citrus fruits e.g. grapefruits [12]) and quercetin (a flavonol; source: many fruits and vegetables
e.g. onions and apples [13]), in INS-1E cells. Naringenin and quercetin has been previously reported to
protect beta cells from cytokine induced cell death [14] and, caffeic acid has been found to have strong
anti-oxidant properties [15] making them interesting candidates for studying insulin secretion and gene
expression under glucotoxic conditions (GC).
The rat insulinoma cell line INS 1E has been used as an experimental model in this study for its
capability to secrete insulin under physiological glucose concentrations, and its susceptibility towards
glucotoxicity, as found in pancreatic beta cells in vivo [16,17]. Moreover, this cell line has been
isolated from the parental INS 1 cells based on their insulin content and secretion capabilities [18].
Among the PCs, caffeic acid has been found to induce glucokinase (Gck) mRNA in rat liver
cells in vitro [19]. Moreover, activation of Gck has been shown to have anti-hyperglycemic effects
[20]. It has also been reported to inhibit acetyl CoA carboxylase 1 (Acc1) in skeletal muscle, which
participates in biosynthesis of fatty acids [21] Again naringenin has shown anti-apoptotic effects by
regulating Bcl2/Bax ratio in HaCaT human keratinocytes[22]. Moreover, a down regulation of the
apoptotic effector protein Caspase 3(Casp 3) was exhibited in naringenin and quercetin treated murine
model of hypobaric hypoxia [23].
The effects of the PCs were studied for their effect on insulin secretion after acute and chronic
exposure to low and high glucose levels and under GC. Moreover, the PCs were tested for their
influence on gene expression in these cells under normoglycemic conditions (NC) and GC. Apoptotic
(Casp 3 and Bax), as well as cyto-protective gene expression (Bcl2, Hsp 70 and Hsp 90), together with
genes responsible for insulin secretion and beta-cell function including the glucose sensor Glut2 and
Gck, where the former is responsible for glucose transport and the latter is involved in the
preservation of beta-cell mass [24,25]. Two isoforms of insulin expressed in rats: Ins1 and Ins2; and

6
members of the insulin signaling pathway: Akt1, Akt2, and IRS1, where Akt1/2 are implicated in the
maintenance of beta-cell mass and function, were also analysed [26,27]. Besides, transcription factors
regulating beta-cell function and insulin gene expression: Pdx1, Beta2 [28]; genes involved in
lipogenesis: Acc1 [29] were studied.
Researchers have used different glucose concentrations to mimic GC in in vitro studies [30-32]
ranging from 16.7 to 30 mM. However, glucose concentrations of 30 mM and higher, have been found
to impair beta-cell functions in rodents [30]. In this study we chose to incubate the INS 1E cells in 25
mM glucose for 72 h to induce glucotoxicity. The glucose concentration characterising NC, was chosen
to be 11 mM, as the insulin secretion ability is best observed at this concentration [31].
Materials and Methods:
Incubation of INS-1E cells
Modified RPMI 1640 culture media (GIBCO), supplemented with antibiotics penicillin and
streptomycin (100 iu/ml and 100 µg/mL respectively, GIBCO), 10 % foetal calf serum (FCS), HEPES
(10 mM, Sigma) and β-mercaptoethanol (5 µM, Sigma)[16] and was used to culture the INS-1E cells.
The cells were incubated at a humified (95 %) atmosphere (5 % CO2) at 37°C. Early culture passages
were washed with PBS, trypsinised and incubated for 5 mins. Trypsinisation was stopped by adding
RPMI 1640 media (containing 11 mM glucose).The cells were then harvested and seeded in 6 (for gene
expression studies) or 24-well plates (for insulin secretion studies) (NUNC Brand Products, Roskilde,
Denmark) at a density of 106 or 3 × 10
5 cells/well, respectively. The cells used in the experiments were
from passage 72 to 78.

7
Secretion studies
The PCs, caffeic acid, naringenin, and quercetin were purchased from Sigma (Steinheim, Germany).
For acute studies, INS-1E cells were grown in modified RPMI 1640 media containing 11 mM glucose
for 72 h in absence of the PCs; whereas for chronic studies, with or without the PCs at the
concentrations of 10-10
, 10-8
, and 10-6
M (dissolved in DMSO). Modified Krebs-Ringer Buffer (KRB),
containing 125 mM NaCl, 5.9 mM KCl, 1.28 mM CaCl2, 1.2 mM MgCl2, 25 mM HEPES and 0.1 %
BSA (w/v) (all from Sigma) was used for further incubations. The cells were pre-incubated with 1 mL
of KRB for 15 mins, with subsequent incubation for 1 h in KRB, containing (a) 10-10
, 10-8
, and 10-6
M
concentrations of the PCs in 3.3 and 16.7 mM glucose separately for acute secretion studies and (b) 3.3
or 16.7 mM glucose for chronic secretion studies. Control treatments received DMSO.
For glucotoxicity experiments, the cells were incubated with modified RPMI 1640 containing
11 mM and 25 mM glucose with or without the PCs at the concentration of 10-6
M for 72 h. Control
treatments received DMSO. Thereafter, the cells were pre-incubated with KRB for 15 mins, and then
incubated with 3.3 or 16.7 mM glucose in KRB for 1 h. Incubation media (300 µL) was removed,
centrifuged, and 200 µL of the supernatant was frozen for subsequent analysis of insulin content. The
insulin secretion data was normalised with the number of cells present per well; which was determined
by using the fluorescent nucleic acid stain Syto 24 green.
Insulin content determination
Insulin content was measured by a radioimmunoassay, using a guinea pig anti-porcine insulin anti-body
(Novo Nordisk, Bagsvaerd, Denmark) and mono-125
I-(Tyr A14)-labelled human insulin as tracer and
rat insulin as standard (Novo Nordisk A/S). Ethanol was used to separate bound from free radioactivity
[33]. Naringenin, caffeic acid, and quercetin did not interfere with this assay at tested concentrations.

8
Isolation of total RNA
Cells were washed in phosphate buffered saline and RNA extraction was carried out using the RNeasy®
Plus Mini RNA extraction Kit (Qiagen, Sample & Assay Technologies, Copenhagen, Denmark)
following the manufacturer’s instructions. After extraction, the absorbance at 260 and 280 nm was
measured for quantification of the RNA. The quality of the RNA was ensured by visual examination of
the 18s and 28s ribosomal RNAs on an agarose gel.
Real-time RT PCR
We investigated the expression of Glut2, Ins1, Ins2, Akt1, Akt 2, IRS1, Pdx1, Beta2, Acc1, Gck,
Casp3, Bax, Bcl2, Hsp 70 and Hsp 90 by real time RT-PCR. The cells were incubated with modified
RPMI 1640 containing 11 mM and 25 mM glucose with or without the PCs at the concentration of 10-
6 M for 72 h. Control treatments received DMSO. Complimentary DNA (cDNA) was synthesized
using IScript (BioRad, Hercules, CA, USA), in accordance with the manufacturer’s guidelines. A total
RNA of 50 ng/10 µl reaction mixture was used for determining the abundance of the target mRNA.
The real time polymerase chain reaction (PCR) was performed using the ABI 7500 FAST machine
(ABI, Foster City, CA, USA). Ten microliters of real-time PCR reactions consisted of 5 µl 2 ×
TaqMan® FAST Universal Master Mix (P/N 43660783; ABI) 0.5 µl 20 × TaqMan Assay/probe (ABI)
and reverse transcribed cDNA, equivalent to 50 ng of total RNA in 4.5 µl H2O. The thermal FAST
cycle program was as follows: 20 s at 95°C, and subsequently, 40 cycles composed of 3s at 95°C and
30 s at 60°C. Triplicate reactions were set up for each sample and the mRNA abundance was
normalized to eukaryotic 18s ribosomal RNA (assay Hs99999901_s1) expression. No template controls
(NTC) and No enzyme controls (NEC) were used as negative controls for each gene. Assays were
carried out in 96-well plates and were covered with optical adhesive (P/N 4346906 and P/N4311971;
ABI). The 2-∆∆CT
method was used to calculate the relative gene expression. The TaqMan assays used
for the PCR were Glut2 (assay Rn00563565_m1), Ins1 (assay Rn02121433_g1), Ins2 (assay

9
Rn01774648_g1), Akt1 (assay Rn00583646_m1), Akt2 (assay Rn00690900_m1), IRS1 (assay
Rn02132493_s1), Pdx1 (assay Rn00755591_m1), Beta2 (assay Rn00824571_s1), Acc1 (assay
Rn00573474_m1), Gck (assay Rn00561265_m1), Casp3 (assay Rn00563902_m1), Bax (assay
Rn01480160_g1), Bcl2 (assay Rn99999125_m1), Hsp 70 (assay Rn04224718_u1) and Hsp 90 (assay
Rn00822023_g1).
Statistical Analysis
Data are expressed as means ± standard error of mean (s.e.m). Data analysis was performed and plots
were made using GraphPad Prism 4.0 (GraphPad Software Inc., San Diego, CA, USA). Statistical
significance between two treatment groups was evaluated by a two-tailed Student’s unpaired T-test.
Treatment conditions were compared with their respective controls. A p value of less than 0.05 was
considered to be statistically significant and that of less than 0.1 was considered a tendency.
Results:
Insulin secretion studies
Caffeic acid, naringenin and quercetin were tested on INS-1E cells for their influence on GSIS. Insulin
secretion was measured after acute or chronic exposure and after induction of glucotoxicity.
Acute exposure
Incubation with the PCs did not show any significant increase in insulin secretion in presence of low
glucose (figure 1A, C, and E). However, in the presence of 16.7 mM glucose (figure 1B, D, and F),
caffeic acid showed a significant rise in GSIS at all concentrations tested (figure 1A); showing an
increase of 14.3, 15.7, and 20 % at 10-10
, 10-8
, and10-6
M concentrations respectively. Naringenin
(figure 1D) induced a significant dose dependant increase of 36.8 and 55.4 % at 10-8
and 10-6
M

10
concentrations respectively; whereas a significant increase of 28.8 % was observed in presence of
quercetin at a concentration of 10-6
M (figure 1F).
Chronic exposure
At low glucose concentrations, caffeic acid and quercetin showed a small but significant increase in
insulin secretion at 10-6
M concentrations (figure 2A and E), but naringenin did not show any
significant increase in insulin secretion in presence of low glucose at any of the concentrations tested
(figure 2C). In the presence of high glucose, all the three PCs significantly increased GSIS at all
concentrations tested (figure 2 B, D, and F). Caffeic acid showed a highly significant increase (p <
0.0001) of 43.6, 53.2, and 54.5 % at 10-10
, 10-8
, and10-6
M concentrations, respectively. For naringenin
too, the increase in GSIS was highly significant for all concentrations tested, showing a 33.5, 30.8 and
32.6 % increase at 10-10
(p < 0.0001), 10-8
(p = 0.005), and 10-6
M (p < 0.0001) concentrations
respectively; whereas quercetin showed a significant increase of 22.8, 16.6, and 26.5 % increase in
GSIS at 10-10
, 10-8
(p < 0.05), and 10-6
M (p < 0.001), respectively.
Insulin secretion during glucotoxicity
The glucose concentration of 11 mM and 25 mM were considered as normoglycemic and glucotoxic,
respectively. The molar concentration of 10-6
was chosen for this study, because all the PCs showed
maximum increase in GSIS at this concentration in the chronic exposure experiments. The results have
been illustrated in figure 3.
As expected, the cells incubated with normoglycemic glucose levels, showed a steep rise in
GSIS in response to 16.7 mM glucose; whereas those incubated with glucotoxic levels of glucose,
showed a highly diminished and response to the same. For the cells incubated under NC, caffeic acid
(figure 3A) showed a small but significant increase (p < 0.01) of 21.1 and 29.7 % in GSIS in presence

11
of 3.3 and 16.7 mM glucose respectively. In case of naringenin (figure 3B), a significant increase (p <
0.05) of 46.2 % in GSIS was observed in presence of 16.7 mM glucose; whereas in cells incubated with
quercetin (figure 3C), a significant increase (p < 0.0001 and p < 0.01) of 33.4 and 47.1 % was
observed in presence of 3.3 and 16.7 mM glucose respectively.
For the cells incubated under GC, caffeic acid showed a significant increase (p < 0.0001) of
41.7 and 50.3 % in GSIS when treated with 3.3 and 16.7 mM glucose respectively. For the cells
incubated with naringenin, there was a significant increase (p < 0.05) of 28.6 and 36.2 % when treated
with 3.3 and 16.7 mM glucose respectively. The response of cells incubated with quercetin was similar
to those that were incubated with caffeic acid, where there was a significant increase (p < 0.0001) of
62.2 and 71.6 % in GSIS, when treated with 3.3 and 16.7 mM glucose.
Gene expression analysis
Gene expression analysis of 15 genes related to regulation of GSIS, beta-cell function, stress response,
and apoptosis inhibition and induction were studied under NC and GC in the presence or absence of the
PCs, as illustrated in figure 4, 5, and 6. The change in mRNA abundance of the genes in the PC treated
cells was compared with untreated control cells. The Glut 2 and Gck mRNA was significantly down
regulated under GC compared to that in NC (p = 0.01 and p = 0.003, respectively) indicating a
reduction in glucose sensitivity of the INS-1E cells during long term exposure to high glucose levels.
Under NC, caffeic acid and quercetin did not significantly affect Glut2 expression (although caffeic
acid showed a tendency, p = 0.08), whereas naringenin showed a highly significant increase (p <
0.0001). However, under GC, naringenin and quercetin showed a significant increase in Glut 2
expression, while caffeic acid did not. Again, under NC, caffeic acid showed a tendency (p = 0.1) but
naringenin and quercetin showed a significant increase in Gck expression; whereas a significant
increase in the presence of caffeic acid and quercetin; and a tendency in presence of naringenin (p =
0.06) was observed under GC. The Ins1 gene was up regulated by all three PCs at both NC and GC.

12
The observed increase in Ins1 gene expression correlates well with the observed up regulation of Glut2
and Gck genes. However, neither of the PCs up regulated Ins2 gene expression under GC, although
naringenin showed a tendency (p = 0.09). A significant up regulation of Gck by caffeic acid and
naringenin was observed under NC.
It is noteworthy that the expression of the transcription factors Beta2 was down regulated under
GC compared to NC. All the three PCs significantly increased the mRNA abundance of Beta2 and
Pdx1 under NC, but none of the PCs showed significant increase under GC, except naringenin. The
expression of Akt1 was found to be up regulated by caffeic acid and naringenin under NC, whereas
naringenin and quercetin significantly up-regulated Akt1 expression under GC. Again, Akt2 expression
was increased significantly in presence of all the three PCs under NC, but under GC, only naringenin
was capable of enhancing its expression significantly. Only caffeic acid caused a significant increase in
IRS1 expression under NC, and but none of the PCs caused any change in its expression under GC.
The expression of Casp3 was noticeably increased (1.5 fold) under GC compared to NC,
indicating a pro-apoptotic state of the beta cells under GC. In presence of caffeic acid, there was a
significant decrease in Casp3 expression under GC. Naringenin too showed a significant decrease
under GC. The expression of the anti-apoptotic gene Bcl2 was down regulated under GC compared to
NC, again suggesting a pro-apoptotic state under GC. All the three PCs were found to increase Bcl2
expression under NC, but showed no significant increase under GC; except naringenin, showing a
tendency (p = 0.05). A minute but significant increase in the pro-apoptotic protein Bax was observed in
the presence of naringenin and quercetin under NC, but a significant decrease was observed in presence
of naringenin and caffeic acid under GC. Gene expression of the chaperones Hsp70 and Hsp90, as
expected, were up regulated under GC compared to NC. All the three PCs increased the expression of
Hsp70 both under NC and GC. Caffeic acid caused a significant increase in Hsp90 expression under
NC and naringenin under both NC and GC, whereas quercetin did not have any effect on Hsp90 gene
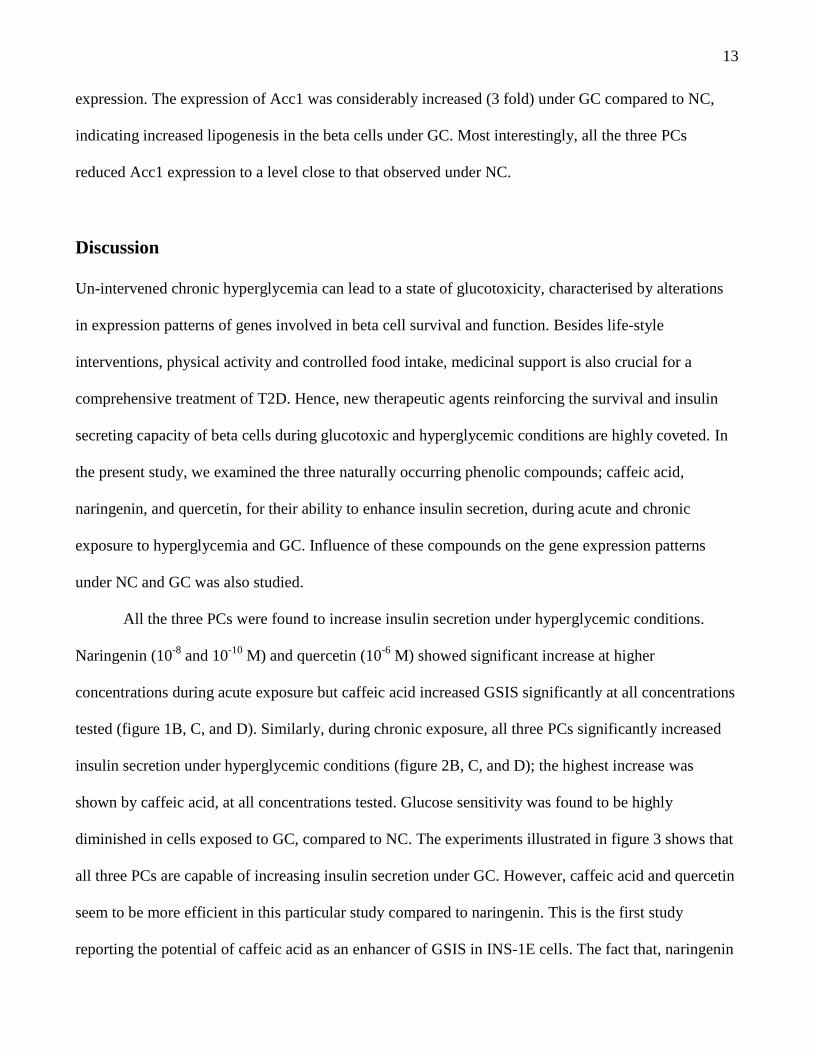
13
expression. The expression of Acc1 was considerably increased (3 fold) under GC compared to NC,
indicating increased lipogenesis in the beta cells under GC. Most interestingly, all the three PCs
reduced Acc1 expression to a level close to that observed under NC.
Discussion
Un-intervened chronic hyperglycemia can lead to a state of glucotoxicity, characterised by alterations
in expression patterns of genes involved in beta cell survival and function. Besides life-style
interventions, physical activity and controlled food intake, medicinal support is also crucial for a
comprehensive treatment of T2D. Hence, new therapeutic agents reinforcing the survival and insulin
secreting capacity of beta cells during glucotoxic and hyperglycemic conditions are highly coveted. In
the present study, we examined the three naturally occurring phenolic compounds; caffeic acid,
naringenin, and quercetin, for their ability to enhance insulin secretion, during acute and chronic
exposure to hyperglycemia and GC. Influence of these compounds on the gene expression patterns
under NC and GC was also studied.
All the three PCs were found to increase insulin secretion under hyperglycemic conditions.
Naringenin (10-8
and 10-10
M) and quercetin (10-6
M) showed significant increase at higher
concentrations during acute exposure but caffeic acid increased GSIS significantly at all concentrations
tested (figure 1B, C, and D). Similarly, during chronic exposure, all three PCs significantly increased
insulin secretion under hyperglycemic conditions (figure 2B, C, and D); the highest increase was
shown by caffeic acid, at all concentrations tested. Glucose sensitivity was found to be highly
diminished in cells exposed to GC, compared to NC. The experiments illustrated in figure 3 shows that
all three PCs are capable of increasing insulin secretion under GC. However, caffeic acid and quercetin
seem to be more efficient in this particular study compared to naringenin. This is the first study
reporting the potential of caffeic acid as an enhancer of GSIS in INS-1E cells. The fact that, naringenin

14
did not enhance GSIS in the INS-1E cells in the presence of low glucose after chronic exposure,
suggests its possible role in preventing hypoglycemia, and is reminiscent of GLP-1 (glucagon-like
peptide 1); and the diterpenes, Stevioside and Steviol, that has shown a glucose dependent effect on
insulin secretion [34,35].
In the gene expression analyses, a significant increase in the expression of the Ins1 gene in
presence of the PCs at both NC and GC was corroborated by the increase in GSIS observed under these
conditions. A significant increase in Ins2 gene was also observed under NC in cells treated with caffeic
acid and naringenin, but not under GC. Glut2, the glucose transporter in beta cells, has the highest
capacity and the lowest affinity for glucose, leading to glucose uptake in the beta cells only when
glucose level is high and insulin secretion is necessary [36]. On the other hand, Gck too acts as a
glucose sensor in pancreatic beta cells and its agonists can enhance GSIS and reduce gluconeogenesis
in the liver [24]. The significant increase in Glut2 expression (induced by naringenin and quercetin)
under GC; and Gck expression (naringenin, tendency) under GC and NC (caffeic acid, tendency)
indicates an increased sensitivity towards glucose and correlates well with the increase observed in Ins1
gene expression. These observations also suggest that there is a strong tendency of Gck up-regulation
in the PC treated cells under GC.
The expression of the transcription factors Beta2 and Pdx1 was not changed significantly under
GC (except by naringenin), although all three PCs significantly increased their expression under NC.
The increase in insulin gene expression by naringenin correlates well with the increase in the
expression of the transcription factors responsible for the regulation of insulin gene expression.
Several other transcription factors (e.g. Nkx2.2, Pax6, Foxa2, and Nkx6.1) responsible for insulin gene
expression and beta cell function exist [28]. Examination of the gene expression profiles of these
transcription factors under similar conditions could provide further insight into the increase in gene

15
expression of the beta cell specific genes (including insulin) observed in this study by caffeic acid and
quercetin.
Irs1, Akt1and 2 belong to the insulin signalling pathway. Irs1expression was not enhanced by
any of the PCs under GC. Naringenin and quercetin induced Akt1gene expression under GC and by
caffeic acid and naringenin under NC. Akt2 expression was only enhanced by naringenin under GC,
but by all three PCs under NC, suggesting augmentation of an otherwise down regulated insulin
signalling pathway most efficiently by naringenin.
Glucotoxicity has been associated with faulty gene expression of key beta cell specific genes
and accelerated apoptosis [6]. An increase in the expression of apoptotic genes like Caspase3 and Bax,
and down-regulation of the survival gene Bcl2 was observed under GC, compared to NC. This could be
an indication of the apoptotic effects of glucotoxicity. The reduction in the pro apoptotic gene Casp3
under GC suggests a cyto-protective effect of the PCs; especially caffeic acid and naringenin on beta
cells. The gene expression of another pro-apoptotic protein Bax, belonging to the Bcl2 family was
found to be down regulated by caffeic acid and naringenin under GC, indicating a cyto-protective effect
of these compounds under GC. Quercetin did not affect Bax expression under GC, but a minute, yet
significant increase in Bax expression was observed for naringenin and quercetin under NC. The Bcl2
family consists of both pro and anti-apoptotic proteins. The pro-survival members of this family
prevent apoptosis by inhibiting the pro-apoptotic proteins like Bax, Bak and BH3-only proteins [37].
The gene expression of the anti-apoptotic protein Bcl2 (belonging to the same family) was induced
significantly by all the three PCs under NC, and naringenin showed a tendency under GC indicating an
induction of pro-survival genes by naringenin.
The heat shock proteins are molecular chaperones that are induced as a response to cellular
injury and stress, and play an important role in cell survival. Induction of Hsp70 has been shown to be
helpful in combating neurodegeneration, ischemic heart disease and diabetes, while inhibition of Hsp90

16
has recently been recognised as an efficient approach to pacify various forms of cancer [38], indicating
its importance in cell survival. Hsp70 gene expression was significantly induced by all the three PCs
both at NC and GC, of which quercetin caused the maximum (two-fold) increase; whereas the gene
expression of Hsp90 was significantly up-regulated by naringenin at both NC and GC, indicating the
possible role of these PCs in beta cell survival during glucotoxicity.
Acc1 is an enzyme catalysing the first step of lipogenesis. Animals deficient in Acc1 show loss
of body weight and continuous lipid oxidation. Therefore reduction in Acc1 expression and activity has
been a therapeutic goal against obesity and related metabolic disorders like T2D [29]. On the other
hand hyperglycemic conditions have been found to cause an increase in Acc1 gene expression, as is
also observed in our study, where Acc1 gene is highly up-regulated under GC compared to NC. This
increase is found to suddenly increase malonyl coenzyme A in the cytosol, stopping the long chain
fatty acyl coenzyme As (LC FACoAs) from entering the mitochondria for oxidation. The increase of
these LC FACoAs in the cytosol, enhances insulin secretion [39]. As can be observed in the insulin
secretion studies under NC and GC, GSIS is diminished in cells grown under GC, compared to those
grown under NC, although Acc1 is highly expressed in the former group; indicating that an increase in
Acc1 does not improve glucose sensitivity in the beta cells during glucotoxicity. Again, the effect of a
long-term inhibition of fatty acid oxidation, due to constitutive overexpression of Acc1 in beta cells
during glucotoxicity can induce beta cell dysfunction and apoptosis due to lipotoxicity induced ER
stress [40]. In our study only naringenin was found to cause a minute but significant increase in Acc1
expression under NC. Under GC, Acc1 expression was increased by more than 3 fold, but in presence
of the PCs the expression level was reduced to the same level as found in cells grown under NC. This
remarkable restoration of the Acc1 mRNA levels by caffeic acid, naringenin, and quercetin underlines
their importance in the field of lipotoxicity induced beta cell dysfunction in T2D.

17
Previously, naringenin has been shown to induce glucose uptake via AMPK activation in L6
myotubes [41], whereas caffeic acid exhibited insulin mimetic effects on 3T3-L1 cells and insulin
resistant mouse hepatocytes [42,43]. Again, quercetin has been found to reduce insulin resistance in
primary human adipocytes [44]. It is interesting to observe, that these three PCs exhibit multi-potent
capabilities in the amelioration of T2D, making them promising candidates for drug research.
In conclusion, the three naturally occurring PCs used in this study, namely caffeic acid,
naringenin and quercetin appears to possess beneficial effects on insulin secretion under GC. As
expected, their influence on the gene expression levels of all the genes studied was not uniform; but
they appear to have a positive influence on the expression of key beta cell survival and regulatory
genes; improving glucose sensitivity and survival probabilities of INS-1E cells subjected to
glucotoxicity. Furthermore, the PCs have exhibited a promising potential of improving both insulin
secretion and insulin gene expression under GC, together with restoring the regulation of genes
associated with lipotoxicity in beta cells.
Acknowledgements
This work was supported by The Danish Council for Strategic Research (Grant no. 09-063086) and The
Graduate School of Agriculture, Food and Environment (SAFE), Aarhus University. The Institute of
Clinical Medicine, Aarhus University and The Aarhus University Research Foundation. We would like
to thank Dorthe Rasmussen, Lene Trudsø, Kim Glintborg Poulsen, and Ann Overgaard for their skilled
technical support. The authors declare no conflicts of interest.

18
Reference List
1. Ambady R., Snehalatha C., Shetty A.S., Nanditha A. Primary prevention of Type 2 diabetes in
South Asians challenges and the way forward. Diabetic Medicine 2013; 30:26-34.
2. Weyer C., Bogardus C., Mott D.M., Pratley R.E. The natural history of insulin secretory
dysfunction and insulin resistance in the pathogenesis of type 2 diabetes mellitus. Journal of
Clinical Investigation 1999; 104:787-794.
3. Bensellam M., Laybutt D.R., Jonas J.C. The molecular mechanisms of pancreatic beta-cell
glucotoxicity: Recent findings and future research directions. Molecular and Cellular
Endocrinology 2012; 364:1-27.
4. Butler A.E., Janson J., Bonner-Weir S., Ritzel R., Rizza R.A., Butler P.C. beta-cell deficit and
increased beta-cell apoptosis in humans with type 2 diabetes. Diabetes 2003; 52:102-110.
5. Efrat S. Beta-cell expansion for therapeutic compensation of insulin resistance in type 2 diabetes.
International Journal of Experimental Diabesity Research 2003; 4:1-5.
6. Robertson R.P., Harmon J., Tran P.O.T., Poitout V. beta-cell glucose toxicity, lipotoxicity, and
chronic oxidative stress in type 2 diabetes. Diabetes 2004; 53:S119-S124.
7. Kaiser N., Leibowitz G., Nesher R. Glucotoxicity and beta-cell failure in type 2 diabetes mellitus.
Journal of Pediatric Endocrinology & Metabolism 2003; 16:5-22.
8. Cheng A.Y.Y., Fantus I.G. Oral antihyperglycemic therapy for type 2 diabetes mellitus. Canadian
Medical Association Journal 2005; 172:213-226.

19
9. Noh R.M., Graveling A.J., Frier B.M. Medically minimising the impact of hypoglycaemia in type
2 diabetes: a review. Expert Opinion on Pharmacotherapy 2011; 12:2161-2175.
10. Marles R.J., Farnsworth N.R. Antidiabetic plants and their active constituents. Phytomedicine
1995; 2:137-189.
11. Lee I.S.L., Boyce M.C., Breadmore M.C. A rapid quantitative determination of phenolic acids in
Brassica oleracea by capillary zone electrophoresis. Food Chemistry 2011; 127:797-801.
12. Felgines C., Texier O., Morand C. et al. Bioavailability of the flavanone naringenin and its
glycosides in rats. American Journal of Physiology-Gastrointestinal and Liver Physiology 2000;
279:G1148-G1154.
13. Jan A.T., Kamli M.R., Murtaza I., Singh J.B., Ali A., Haq Q.M.R. Dietary Flavonoid Quercetin
and Associated Health BenefitsAn Overview. Food Reviews International 2010; 26:302-317.
14. Lin C.Y., Ni C.C., Yin M.C., Lii C.K. Flavonoids protect pancreatic beta-cells from cytokines
mediated apoptosis through the activation of PI3-kinase pathway. Cytokine 2012; 59:65-71.
15. He X., Liu R.H. Phytochemicals of Apple Peels: Isolation, Structure Elucidation, and Their
Antiproliferative and Antioxidant Activities. Journal of Agricultural and Food Chemistry 2008;
56:9905-9910.
16. Asfari M., Janjic D., Meda P., Li G.D., Halban P.A., Wollheim C.B. Establishment of 2-
Mercaptoethanol-Dependent Differentiated Insulin-Secreting Cell-Lines. Endocrinology 1992;
130:167-178.
20
17. Hohmeier H.E., Mulder H., Chen G.X., Henkel-Rieger R., Prentki M., Newgard C.B. Isolation of
INS-1-derived cell lines with robust ATP-sensitive K+ channel-dependent and -independent
glucose-stimulated insulin secretion. Diabetes 2000; 49:424-430.
18. Merglen A., Theander S., Rubi B., Chaffard G., Wollheim C.B., Maechler P. Glucose sensitivity
and metabolism-secretion coupling studied during two-year continuous culture in INS-1E
insulinoma cells. Endocrinology 2004; 145:667-678.
19. Valentova K., Truong N., Moncion A., De Waziers I., Ulrichova J. Induction of glucokinase
mRNA by dietary phenolic compounds in rat liver cells in vitro. Journal of Agricultural and
Food Chemistry 2007; 55:7726-7731.
20. Fyfe M.C.T., White J.R., Taylor A. et al. Glucokinase activator PSN-GK1 displays enhanced
antihyperglycaemic and insulinotropic actions. Diabetologia 2007; 50:1277-1287.
21. Tsuda S., Egawa T., Ma X., Oshima R., Kurogi E., Hayashi T. Coffee polyphenol caffeic acid but
not chlorogenic acid increases 5 ' AMP-activated protein kinase and insulin-independent glucose
transport in rat skeletal muscle. Journal of Nutritional Biochemistry 2012; 23:1403-1409.
22. El-Mahdy M.A., Zhu Q., Wang Q.E. et al. Naringenin protects HaCaT human keratinocytes
against UVB-induced apoptosis and enhances the removal of cyclobulane pyrimidine dimers from
the genome. Photochemistry and Photobiology 2008; 84:307-316.
23. Sarkar A., Angeline M.S., Anand K., Ambasta R.K., Kumar P. Naringenin and quercetin reverse
the effect of hypobaric hypoxia and elicit neuroprotective response in the murine model. Brain
Research 2012; 1481:59-70.

21
24. Doliba N.M., Fenner D., Zelent B., Bass J., Sarabu R., Matschinsky F.M. Repair of diverse
diabetic defects of beta-cells in man and mouse by pharmacological glucokinase activation.
Diabetes Obesity & Metabolism 2012; 14:109-119.
25. Nakamura A., Terauchi Y., Ohyama S. et al. Impact of Small-Molecule Glucokinase Activator on
Glucose Metabolism and beta-Cell Mass. Endocrinology 2009; 150:1147-1154.
26. Elghazi L., Rachdi L., Weiss A.J., Cras-Meneur C., Bernal-Mizrachi E. Regulation of beta-cell
mass and function by the Akt/protein kinase B signalling pathway. Diabetes Obesity &
Metabolism 2007; 9:147-157.
27. Garofalo R.S., Orena S.J., Rafidi K. et al. Severe diabetes, age-dependent loss of adipose tissue,
and mild growth deficiency in mice lacking Akt2/PKB beta. Journal of Clinical Investigation
2003; 112:197-208.
28. Habener J.F., Kemp D.M., Thomas M.K. Minireview: Transcriptional regulation in pancreatic
development. Endocrinology 2005; 146:1025-1034.
29. Tong L. Acetyl-coenzyme A carboxylase: crucial metabolic enzyme and attractive target for drug
discovery. Cellular and Molecular Life Sciences 2005; 62:1784-1803.
30. Bensellam M., Van Lommel L., Overbergh L., Schuit F.C., Jonas J.C. Cluster analysis of rat
pancreatic islet gene mRNA levels after culture in low-, intermediate- and high-glucose
concentrations. Diabetologia 2009; 52:463-476.
31. Chen J., Jeppesen P.B., Nordentoft I., Hermansen K. Stevioside improves pancreatic beta-cell
function during glucotoxicity via regulation of acetyl-CoA carboxylase. American Journal of
Physiology-Endocrinology and Metabolism 2007; 292:E1906-E1916.

22
32. Lin P., Chen L., Li D. et al. Adiponectin Reduces Glucotoxicity-Induced Apoptosis of INS-1 Rat
Insulin-Secreting Cells on a Microfluidic Chip. Tohoku Journal of Experimental Medicine 2009;
217:59-65.
33. Gregersen S., Hermansen K., Yanaihara N., Ahren B. Galanin Fragments and Analogs - Effects
on Glucose-Stimulated Insulin-Secretion from Isolated Rat Islets. Pancreas 1991; 6:216-220.
34. Jeppesen P.B., Gregersen S., Poulsen C.R., Hermansen K. Stevioside acts directly on pancreatic
beta cells to secrete insulin: Actions independent of cyclic adenosine monophosphate and
adenosine triphosphate-sensitive K+-channel activity. Metabolism-Clinical and Experimental
2000; 49:208-214.
35. Meloni A.R., DeYoung M.B., Lowe C., Parkes D.G. GLP-1 receptor activated insulin secretion
from pancreatic ss-cells: mechanism and glucose dependence. Diabetes Obesity & Metabolism
2013; 15:15-27.
36. Efrat S. Making sense of glucose sensing. Nature Genetics 1997; 17:249-250.
37. Vogler M. BCL2A1: the underdog in the BCL2 family. Cell Death and Differentiation 2012;
19:67-74.
38. Soti C., Nagy E., Giricz Z., Vigh L., Csermely P., Ferdinandy P. Heat shock proteins as emerging
therapeutic targets. British Journal of Pharmacology 2005; 146:769-780.
39. Zhang S.Y., Kim K.H. Essential role of acetyl-CoA carboxylase in the glucose-induced insulin
secretion in a pancreatic beta-cell line. Cellular Signalling 1998; 10:35-42.

23
40. Cnop M., Ladriere L., Igoillo-Esteve M., Moura R.F., Cunha D.A. Causes and cures for
endoplasmic reticulum stress in lipotoxic beta-cell dysfunction. Diabetes Obesity & Metabolism
2010; 12:76-82.
41. Zygmunt K., Faubert B., MacNeil J., Tsiani E. Naringenin, a citrus flavonoid, increases muscle
cell glucose uptake via AMPK. Biochemical and Biophysical Research Communications 2010;
398:178-183.
42. Bai N.S., He K., Roller M. et al. Active Compounds from Lagerstroemia speciosa, Insulin-like
Glucose Uptake-Stimulatory/Inhibitory and Adipocyte Differentiation-Inhibitory Activities in
3T3-L1 Cells. Journal of Agricultural and Food Chemistry 2008; 56:11668-11674.
43. Huang D.W., Shen S.C., Wu J.S.B. Effects of Caffeic Acid and Cinnamic Acid on Glucose
Uptake in Insulin-Resistant Mouse Hepatocytes. Journal of Agricultural and Food Chemistry
2009; 57:7687-7692.
44. Chuang C.C., Martinez K., Xie G.X. et al. Quercetin is equally or more effective than resveratrol
in attenuating tumor necrosis factor-alpha-mediated inflammation and insulin resistance in
primary human adipocytes. American Journal of Clinical Nutrition 2010; 92:1511-1521.

24
Fig. 1 Effect of the phenolic compounds, caffeic acid (A and B), naringenin (C and D), and quercetin
(E and F) on glucose stimulated insulin secretion after acute exposure. INS-1E cells were grown in
media containing 11 mM glucose for 72 h, thereafter incubated for 1 h in either 3.3 (A, C, and E) or
16.7 (B, D, and F) mM glucose in the presence or absence of the compounds at 10-10
, 10-8
and 10-6
M
concentrations, following which the supernatant was harvested and insulin content measured. Number
of replicates /treatment = 12. Control cells were incubated with DMSO (vehicle). Data are shown as
mean ± s.e.m. *p < 0.05, **p < 0.01, ***p < 0.001
Fig. 2 Effect of the phenolic compounds, caffeic acid (A and B), naringenin (C and D), and quercetin
(E and F) on glucose stimulated insulin secretion after chronic exposure. INS-1E cells were incubated
for 72 h in media containing 11 mM glucose in presence or absence of the compounds at 10-10
, 10-8
and
10-6
M concentrations. Thereafter, the cells were treated with either 3.3 (A, C, and E) or 16.7 (B, D,
and F) mM glucose for 1 h, following which the supernatant was collected and insulin content
measured. Number of replicates /treatment = 18. Control cells were incubated with DMSO (vehicle).
Data are shown as mean ± s.e.m. *p < 0.05, **p < 0.01, ***p < 0.001
Fig. 3 Effect of the phenolic compounds, caffeic acid (A), naringenin (B), and quercetin (C) on glucose
stimulated insulin secretion after exposure to normoglycemic and glucotoxic conditions. INS-1E cells
were incubated for 72 h in media containing 11 or 25 mM glucose in presence or absence of 10-6
M
concentration of the compounds. Thereafter, the cells were treated with 3.3 and 16.7 mM glucose for 1
h, following which the supernatant was harvested and insulin content measured. 11 and 25 mM
represents normoglycemic and glucotoxic condition. Number of replicates /treatment = 18. Control
cells were incubated with DMSO (vehicle). Data are shown as mean ± s.e.m. In the plot G = glucose;
ns = not significant. *p < 0.05, **p < 0.01, ***p < 0.001

25
Fig. 4 mRNA abundance of Glut2, Gck, Ins1, Ins2, Beta2 and Pdx1 in INS-1E cells treated with caffeic
acid, naringenin or quercetin in presence of 11 or 25 mM glucose for 72 h were studied by real time
RT-PCR using TaqMan®
assays. Duplicate samples were taken for each treatment and the samples
were measured in triplicates. Gene expressions were normalised to 18s ribosomal RNA. Difference in
the mRNA abundance was calculated compared to their respective untreated controls. Open and closed
bars represent the cells grown in 11 and 25 mM glucose. C, N, and Q represent caffeic acid, naringenin
and quercetin respectively. *p < 0.05, **p < 0.01, ***p < 0.001.
Fig. 5 mRNA abundance of Akt1, Akt2, and IRS1 genes in INS-1E cells treated with caffeic acid,
naringenin or quercetin in presence of 11 or 25 mM glucose for 72 h were studied by real time RT-PCR
using TaqMan® assays. Duplicate samples were taken for each treatment and the samples were
measured in triplicates. Gene expressions were normalised to 18s ribosomal RNA. Difference in the
mRNA abundance was calculated compared to their respective untreated controls. Open and closed
bars represent the cells grown in 11 and 25 mM glucose. C, N, and Q represent caffeic acid, naringenin
and quercetin respectively. *p < 0.05, **p < 0.01, ***p < 0.001.
Fig. 6 mRNA abundance of Casp3, Bcl2, Bax, Hsp70, Hsp90 and Acc1 genes in INS-1E cells treated
with caffeic acid, naringenin or quercetin in presence of 11 or 25 mM glucose for 72 h were studied by
real time RT-PCR using TaqMan® assays. Duplicate samples were taken for each treatment and the
samples were measured in triplicates. Gene expressions were normalised to 18s ribosomal RNA.
Difference in the mRNA abundance was calculated compared to their respective untreated controls.
Open and closed bars represent the cells grown in 11 and 25 mM glucose. C, N, and Q represent caffeic
acid, naringenin and quercetin respectively. *p < 0.05, **p < 0.01, ***p < 0.001.

26
Fig. 1
0 10-10
10-8
10-6
15
25
35
45
55
Caffeic acid (mol/L)
Insu
lin
(n
g/m
L)
0 10-10
10-8
10-6
80
100
120
140
160
* ***
Caffeic acid (mol/L)
Insu
lin
(n
g/m
L)
0 10-10 10-8 10-615
25
35
45
55
Naringenin (mol/L)
Insu
lin
(n
g/m
L)
0 10-10
10-8
10-6
80
100
120
140
160
180
200
*
**
Naringenin (mol/L)
Insu
lin
(n
g/m
L)
0 10-10
10-8
10-6
15
25
35
45
55
Quercetin (mol/L)
Insu
lin
(n
g/m
L)
0 10-10
10-8
10-6
80
100
120
140
160
180
200
*
Quercetin (mol/L)
Ins
uli
n (
ng
/mL
)
A B
C D
E F

27
Fig. 2
0 10-10 10-8 10-625
35
45
55
65
75
*
Caffeic acid (mol/L)
Insu
lin
(n
g/m
L)
0 10-10
10-8
10-6
80
100
120
140
160
180
****** ***
Caffeic acid (mol/L)
Insu
lin
(n
g/m
L)
0 10-10
10-8
10-6
25
35
45
55
65
75
Naringenin (mol/L)
Insu
lin
(n
g/m
L)
0 10-10
10-8
10-6
80
100
120
140
160
180
*** ** ***
Naringenin (mol/L)
Ins
uli
n (
ng
/mL
)
0 10-10
10-8
10-6
25
35
45
55
65
75
*
Quercetin (mol/L)
Insu
lin
(n
g/m
L)
0 10-10
10-8
10-6
80
100
120
140
160
180
*****
Quercetin (mol/L)
Ins
uli
n (
ng
/mL
)
A B
C D
E F

28
Fig. 3
0
20
40
60
80
100
120
140
160
180
Caffeic acid 72 h (10 -6 M) - + - + - + - +
Glucose 1h (mM) 3.3 3.3 16.7 16.7 3.3 3.3 16.7 16.7
**
**
***
***
11 mM G 25 mM G
***
ns
Insu
lin
(n
g/m
L)
0
20
40
60
80
100
120
140
Naringenin 72 h (10 -6 M) - + - + - + - +
Glucose 1h (mM) 3.3 3.3 16.7 16.7 3.3 3.3 16.7 16.7
**
11 mM G 25 mM G
****
ns
Insu
lin
(n
g/m
L)
0
20
40
60
80
100
120
140
160
Quercetin 72 h (10 -6 M) - + - + - + - +
Glucose 1h (mM) 3.3 3.3 16.7 16.7 3.3 3.3 16.7 16.7
***
*
******
25 mM G11 mM G
***
ns
Insu
lin
(n
g/m
L)
A
B
C

29
Fig. 4
Glut2
11 mM 11 mM+C 25 mM 25 mM+C0.0
0.5
1.0
1.5
p = 0.08
GL
UT
2 m
RN
A (
rela
tive u
nit
s)
Glut2
11 mM 11 mM+N 25 mM 25 mM+N0.0
0.5
1.0
1.5 ****
GL
UT
2 m
RN
A (
rela
tive u
nit
s)
Glut2
11 mM 11 mM+Q 25 mM 25 mM+Q0.0
0.5
1.0
1.5*
GL
UT
2 m
RN
A (
rela
tive u
nit
s)
Gck
11 mM 11 mM+C 25 mM 25 mM+C0.0
0.5
1.0
1.5*
p = 0.1
Gck m
RN
A (
rela
tive u
nit
s)
Gck
11 mM 11 mM+N 25 mM 25 mM+N0.0
0.5
1.0
1.5**
p=0.06
Gck m
RN
A (
rela
tive u
nit
s)
Gck
11 mM 11 mM+Q 25 mM 25 mM+Q0.0
0.5
1.0
1.5
2.0
**
*
Gck m
RN
A (
rela
tive u
nit
s)
Ins1
11 mM 11 mM+C 25 mM 25 mM+C0.0
0.5
1.0
1.5 * **
Ins1 m
RN
A (
rela
tive u
nit
s)
Ins1
11 mM 11 mM+C 25 mM 25 mM+C0.0
0.5
1.0
1.5 ** **
Ins1 m
RN
A (
rela
tive u
nit
s)
Ins1
11 mM 11 mM+Q 25 mM 25 mM+Q0.0
0.5
1.0
1.5*
*
Ins1 m
RN
A (
rela
tive u
nit
s)
Ins2
11 mM 11 mm+C 25 mM 25 mM+C0.0
0.5
1.0
1.5
2.0
*
Ins2 m
RN
A (
rela
tive u
nit
s)
Ins2
11 mM 11 mm+N 25 mM 25 mM+N0.0
0.5
1.0
1.5 **
p = 0.09
Ins2 m
RN
A (
rela
tive u
nit
s)
Ins2
11 mM 11 mm+Q 25 mM 25 mM+Q0.0
0.5
1.0
1.5
Ins2 m
RN
A (
rela
tive u
nit
s)
Beta2
11 mM 11 mM+C 25 mM 25 mM+C0.0
0.5
1.0
1.5
2.0 *
Beta
2 m
RN
A (
rela
tive u
nit
s)
Beta2
11 mM 11 mM+N 25 mM 25 mM+N0.0
0.5
1.0
1.5
**
p=0.07
Beta
2 m
RN
A (
rela
tive u
nit
s)
Beta2
11 mM 11 mM+Q 25 mM 25 mM+Q0.0
0.5
1.0
1.5 **
Beta
2 m
RN
A (
rela
tive u
nit
s)
Pdx1
11 mM 11 mM+C 25 mM 25 mM+C0.0
0.5
1.0
1.5
2.0 ***
Pd
x1 m
RN
A (
rela
tive u
nit
s)
Pdx1
11 mM 11 mM+N 25 mM 25 mM+N0.0
0.5
1.0
1.5
2.0 ****
Pd
x1 m
RN
A (
rela
tive u
nit
s)
Caffeic acid Naringenin Quercetin
Pdx1
11 mM 11 mM+Q 25 mM 25 mM+Q0.0
0.5
1.0
1.5
2.0 ***
Pd
x1 m
RN
A (
rela
tive u
nit
s)

30
Fig. 5
Akt1
11 mM 11 mM+C 25 mM 25 mM+C0.0
0.5
1.0
1.5
2.0 *
Akt1
mR
NA
(re
lati
ve u
nit
s)
Akt1
11 mM 11 mM+N 25 mM 25 mM+N0.0
0.5
1.0
1.5**
*
Akt1
mR
NA
(re
lati
ve u
nit
s)
Akt1
11 mM 11 mM+Q 25 mM 25 mM+Q0.0
0.5
1.0
1.5
2.0 *
Akt1
mR
NA
(re
lati
ve u
nit
s)
Akt2
11 mM 11 mM+C 25 mM 25 mM+C0.0
0.5
1.0
1.5
2.0
*
Akt2
mR
NA
(re
lati
ve u
nit
s)
Akt2
11 mM 11 mM+N 25 mM 25 mM+N0.0
0.5
1.0
1.5** **
Akt2
mR
NA
(re
lati
ve u
nit
s)
Akt2
11 mM 11 mM+Q 25 mM 25 mM+Q0.0
0.5
1.0
1.5 **
Akt2
mR
NA
(re
lati
ve u
nit
s)
Irs1
11 mM 11 mM+C 25 mM 25 mM+C0.0
0.5
1.0
1.5
2.0***
Irs1 m
RN
A (
rela
tive u
nit
s)
Irs1
11 mM 11 mM+N 25 mM 25 mM+N0.0
0.5
1.0
1.5
Irs1 m
RN
A (
rela
tive u
nit
s)
Irs1
11 mM 11 mM+Q 25 mM 25 mM+Q0.0
0.5
1.0
1.5
Irs1 m
RN
A (
rela
tive u
nit
s)
Caffeic acid Naringenin Quercetin

31
Fig. 6
Casp3
11 mM 11 mM+C 25 mM 25 mM+C0.0
0.5
1.0
1.5
2.0*
Casp
3 m
RN
A (
rela
tive u
nit
s)
Casp3
11 mM 11 mM+N 25 mM 25 mM+N0.0
0.5
1.0
1.5
2.0*
Casp
3 m
RN
A (
rela
tive u
nit
s)
Casp3
11 mM 11 mM+Q 25 mM 25 mM+Q0.0
0.5
1.0
1.5
2.0
Casp
3 m
RN
A (
rela
tive u
nit
s)
Bcl2
11 mM 11 mM+C 25 mM 25 mM+C0.0
0.5
1.0
1.5
2.0
2.5
3.0
*
Bcl2
mR
NA
(re
lati
ve u
nit
s)
Bcl2
11 mM 11 mM+N 25 mM 25 mM+N0.0
0.5
1.0
1.5**
p = 0.05
Bcl2
mR
NA
(re
lati
ve u
nit
s)
Bcl2
11 mM 11 mM+Q 25 mM 25 mM+Q0.0
0.5
1.0
1.5**
Bcl2
mR
NA
(re
lati
ve u
nit
s)
Bax
11 mM 11 mM+C 25 mM 25 mM+C0.0
0.5
1.0
1.5
2.0
*
Bax m
RN
A (
rela
tive u
nit
s)
Bax
11 mM 11 mM+N 25 mM 25 mM+N0.0
0.5
1.0
1.5 * *
Bax m
RN
A (
rela
tive u
nit
s)
Bax
11 mM 11 mM+N 25 mM 25 mM+N0.0
0.5
1.0
1.5 *
Bax m
RN
A (
rela
tive u
nit
s)
Hsp70
11 mM 11 mM+C 25 mM 25 mM+C0.0
0.5
1.0
1.5
2.0
2.5
3.0
*
*
Hsp
70 m
RN
A (
rela
tive u
nit
s)
Hsp70
11 mM 11 mM+N 25 mM 25 mM+N0.0
0.5
1.0
1.5
2.0
2.5
3.0
***
*
Hsp
70 m
RN
A (
rela
tive u
nit
s)
Hsp70
11 mM 11 mM+Q 25 mM 25 mM+Q0
1
2
3
4
5
*
***
Hsp
70 m
RN
A (
rela
tive u
nit
s)
Hsp90
11 mM 11 mM+C 25 mM 25 mM+C0.0
0.5
1.0
1.5
2.0
**
Hsp
90 m
RN
A (
rela
tive u
nit
s)
Hsp90
11 mM 11 mM+N 25 mM 25 mM+N0.0
0.5
1.0
1.5 **
*
Hsp
90 m
RN
A (
rela
tive u
nit
s)
Hsp90
11 mM 11 mM+Q 25 mM 25 mM+Q0.0
0.5
1.0
1.5
Hsp
90 m
RN
A (
rela
tive u
nit
s)
Acc1
11 mM 11 mM+C 25 mM 25 mM+C0.0
0.5
1.0
1.5
2.0
2.5
3.0
3.5
4.0***
AC
C1 m
RN
A (
rela
tive u
nit
s)
Acc1
11 mM 11 mM+N 25 mM 25 mM+N0
1
2
3
4
**
***
AC
C1 m
RN
A (
rela
tive u
nit
s)
Acc1
11 mm 11 mM+Q 25 mM 25 mM+Q0
1
2
3
4***
AC
C1 m
RN
A (
rela
tive u
nit
s)
Caffeic acid Naringenin Quercetin

Manuscript III
Naringenin and falcarinol stimulate glucose uptake and TBC1D1 phosphorylation in primary porcine
myotube cultures
Sumangala Bhattacharya, Martin Krøyer Rasmussen, Jette F. Young, Lars P. Christensen, Karsten
Kristiansen, and Niels Oksbjerg
To be submitted to: Biochemical and Biophysical Communications

1
Naringenin and falcarinol stimulate glucose uptake and TBC1D1
phosphorylation in primary porcine myotube cultures
Authors: Sumangala Bhattacharya1, Martin Krøyer Rasmussen
1, Lars P. Christensen
3, Jette F. Young
1,
Karsten Kristiansen2, and Niels Oksbjerg
1*
Institutional affiliations:
1Department of Food Science, Aarhus University, Blichers Allé 20, Postbox 50, 8830 Tjele, Denmark
2Department of Biology, University of Copenhagen, Ole Maaløes Vej 5, 2200 Copenhagen N,
Denmark
3Department of Chemical Engineering, Biotechnology and Environmental Technology, University of
Southern Denmark, Niels Bohrs Allé 1, 5230 Odense M, Denmark
*Corresponding author:
Niels Oksbjerg
Department of Food Science, Aarhus University,
Blichers Allé 20, Postbox 50, 8830 Tjele, Denmark
E-mail: [email protected], Tel: + 45 8715 7809, Fax: +45 8715 4891

2
Abstract
Insulin resistance in muscles is a major problem associated with Type 2 diabetes. Bioactive compounds
of plant origin have long been known for possessing anti-diabetic properties. We have studied the
effect of the bioactive compounds naringenin (dihydroflavonol) and falcarinol (polyacetylene) on
glucose uptake (GU) in normal and insulin resistant primary porcine myotubes, in the presence and
absence of insulin to identify signaling pathways mediating their effects on GU. The dependence on
glucose transporter type 4 (Glut4) activity, insulin signaling and AMP- activated protein kinase
(AMPK)-signaling was studied by using the Glut4 inhibitor indinavir, the phosphatidyl inositol-3
kinase (PI3K) and p38 mitogen activated protein kinase (MAPK) inhibitor wortmannin, and the AMPK
inhibitor dorsomorphin (DM), respectively. Naringenin and falcarinol stimulated GU was attenuated in
the presence of indinavir and wortmannin, indicating a dependence on Glut4 activity as well as
PI3Kand/or p38MAPK activity. By contrast, DM diminished GU induced by naringenin only,
indicating that falcarinol-stimulated GU was independent of AMPK activity. Finally, we show that
naringenin and falcarinol enhance phosphorylation of TBC1D1 suggesting that these compounds
enhance translocation of Glut4 containing vesicles and thereby glucose uptake via a TBC1D1-
dependent mechanism.
Keywords: Naringenin, Falcarinol, Glucose uptake, Type 2 diabetes, Insulin, TBC1D1, TBC1D4,
As160
3
1. Introduction
The initiation of insulin resistance in muscles, normally occurs asymptomatically, and is compensated
with increased insulin secretion by the pancreatic β-cells. If left uncontrolled, this condition leads to β-
cell exhaustion and failure, causing an increase in blood glucose level, leading to the manifestation of
T2D [1].
Skeletal muscle is the primary site for glucose uptake (GU) and utilisation. About 75 % of the
insulin stimulated glucose disposal takes place in the skeletal muscles [2], where insulin causes GU via
the translocation of glucose transporter type 4 (Glut4) vesicles to the plasma membrane [3]. Insulin
causes activation of the phosphatidyl inositol-3 kinase (PI3K)-Akt/protein kinase B pathway, which
mediates most of the metabolic actions of insulin [4].
Another major signaling pathway responsible for GU and fatty acid oxidation in muscles is the
AMP- activated protein kinase (AMPK) signaling cascade. In mammals, AMPK acts as a metabolic
energy sensor, maintaining the cellular energy balance [5]. It has been shown that activation of AMPK
by agonists such as AICAR (5-Aminoimidazole-4-carboxamide ribonucleotide) causes Glut4
translocation [6;7]. Moreover, thiazolidinediones and metformin, have been found to enhance GU in
skeletal muscle through AMPK phosphorylation [8].
The Rab-GTPase activating protein, TBC1D4 (also known as As160) and its homolog TBC1D1
have been found to play a major role in insulin and AICAR stimulated Glut4 translocation [9-11]. They
are also downstream targets for Akt. It has been suggested that phosphorylation of TBC1D4 and
TBC1D1(TBC1D4/1) lead to the activation of small Rab-GTPases which causes cytoskeletal re-
organization leading to the translocation and docking of the Glut4 vesicles to the plasma membrane
[12].

4
Secondary metabolites from different botanicals have been exploited successfully to provide
relief from several ailments, and are able to influence different cellular mechanisms, including key
signalling pathways balancing energy utilization and storage. Hence, more than a thousand plant
species have been tested for their efficacy against diabetes [13]. Naringenin, a flavonol, found in many
citrus fruits (such as grapefruits and oranges) has been found to enhance insulin sensitivity and reduce
plasma glucose levels in diabetic animal models [14], and cause AMPK activation in L6 myotubes
[15]. However, the different steps involved in its mode of action are yet to be elucidated. Falcarinol, a
polyacetylene present (among other plants) in carrots, is mostly known for its anti-cancer and anti-
inflammatory properties [16;17]. However, biphasic behaviour of falcarinol was reported, where it is
found to exhibit cyto protective [18] and growth-stimulatory effects [19]. Falcarinol has not been
studied yet for its efficacy against diabetes.
In the present study, primary porcine myotube cultures were used as a model for skeletal muscle
to test the GU enhancing potential of naringenin and falcarinol in normal and insulin resistant
myotubes. GU was measured in the presence of indinavir (a Glut4 inhibitor), a fungal metabolite
wortmannin (a PI3K-inhibitor), and dorsomorphin (DM; an AMPK inhibitor) separately.
Simultaneously, the effect of these inhibitors on naringenin and falcarinol induced phosphorylation of
TBC1D4/1 was studied.
2. Materials and methods
2.1. Materials
Falcarinol (> purity 98%) was isolated from carrots according to the procedure described elsewhere
[20] and identified by UV, mass spectrometry (MS) [gas chromatography (GC)-MS (EI, 70 eV)], NMR
(1H and
13C NMR, and
1H-
1H and
1H-
13C correlation spectroscopy recorded in CDCl3 with TMS as

5
internal standard), and optical rotation, and the complete spectral data set corresponded fully with
literature values for falcarinol [21-23]. Chemical structures of falcarinol and naringenin are shown in
Fig. 1. Dulbecco’s modified eagles medium (DMEM), fetal calf serum and horse serum (FCS and HS,
respectively) Trypsin-EDTA were from GIBCO Life technologies. The antibiotics (amphotericin,
penicillin/streptomycin and gentamycin), naringenin, DM and phosphatase inhibitor cocktail (PIC) 2
and 3 were from Sigma-Aldrich. [3H] 2-deoxy-D-glucose (2-DOG) and the scintillation mix (Ultima
Gold) were bought from Perkin Elmer Inc. Indinavir, wortmannin, and AICAR were from Santa Cruz
Biotechnology (Texas, USA). Antibodies against phosphorylated TBC1D4/1 were from Cell Signalling
Technology (Danvers, MA, US) and that against α-Tubulin was from Merck Millipore (Darmstadt,
Germany). Goat anti-rabbit and anti-mouse HRP-conjugated secondary antibodies were from Dako
Denmark A/S (Glostrup, Denmark). Enhanced chemiluminescence reagent (ECL) and High
performance chemiluminescence films were from GE healthcare (Buckinghamshire, UK). The
polyvinylidene difluoride (PVDF) membranes were from BioRad (CA, USA), protein molecular
weight markers from Thermo scientific Inc. (Ma, USA) and 4-12 % Bis-Tris gels from Life
technologies (Paisley, UK).
2.2. Preparation of myotube cultures
Satellite cells were isolated from semimembranosus muscles of female pigs weighing approximately12
kg, as described elsewhere [24] and stored in liquid nitrogen until used. For preparation of myotube
cultures, the cells were thawed and evenly seeded on Matrigel matrix (BD Biosciences, cat no. 354230)
coated (1:50 v/v) 6, 48, or 96 well plates for protein analysis, GU assay, and cell viability studies,
respectively. Cells were seeded and proliferated in Porcine Growth Medium (10 % fetal calf serum, 10
% horse serum (FCS and HS respectively, GIBCO Life technologies, Burlington, ON, Canada), 80 %

6
Dulbecco’s modified eagles medium (DMEM, Life Technologies, Naperville, IL), with 25 mM glucose
and antibiotics (100 IU/mL penicillin, 100 IU/mL streptomycin sulphate, 3 µg/mL amphotericin B, 20
µg/mL gentamycin)) in a CO2-regulated humidified incubator (95 % air and 5 % CO2 at 37°C). After
reaching 80 % confluence, the cells were proliferated in media containing DMEM (7 mM glucose), 10
% FCS, and antibiotics for 24 h to 100 % confluence, and subsequently differentiated into myotubes by
incubating with differentiation media (DMEM containing 7 mM glucose, 5 % FCS, antibiotics, and 1
µM cytosine arabinoside) for 48 h.
2.3. Glucose uptake assay
The differentiated myotubes were treated with serum free media (SFM; DMEM with 7 mM, glucose,
antibiotics, and 1 µM cytosine arabinoside, 1 % FCS) for 2-5 h, followed by incubation with various
treatments for 1 h. The myotubes were then washed with (4-(2-hydroxyethyl)-1-
piperazineethanesulfonic acid) HEPES buffered saline (20 mM Hepes, 140 mM NaCl, 5 mM KCl, 2.5
mM MgSO4, 1 mM CaCl2, adjusted to pH 7.4) and incubated with 250 µL/well 0.1 mM [3H] 2-deoxy-
D-glucose (2-DOG), for 30 min; washed thrice with ice cold phosphate buffered saline (PBS, 500
µL/well), lysed by adding 0.05 M NaOH (37°C, 250 µL/well) and placed on a shaking board for 30
min. The cell lysate was mixed with scintillation liquid (1:10) and counted in a Win spectral, 1414
liquid scintillation counter. Following serum deprivation, the differentiated cells were pre-incubated
with 1µM wortmannin for 1 h or 10 µM DM for 5 min, prior to treatment addition. Indinavir (100 µM)
was added 5 min prior to 2DOG addition. AICAR (1 mM) and insulin (10 nM) were used as positive
controls (1 h incubation). To make insulin resistant myotubes (IRM), myotubes were incubated with
differentiation media for 24 h and then with differentiation media containing 12 mM as compared to 7

7
mM glucose for the next 24 h. These myotubes were not treated with SFM, before treatment addition.
Controls received DMSO.
2.5. Western blotting
Differentiated cells were treated with various treatments for 2.5 h, washed with PBS, harvested using
0.25 % Trypsin-EDTA, and frozen at -80°C. Lysis buffer containing 4 % SDS, 10 mM Tris-HCl, and 1
mM EDTA was used to lyse the cells. PIC 2 and 3 were added to the lysis buffer to inhibit
phosphatases. Cell lysates were separated by SDS-PAGE using 4-12 % Bis-Tris gels. Lysates
containing equal amounts of protein were loaded during gel electrophoresis. Proteins were transferred
to a PVDF membrane, stained with Ponceau S and visually inspected for equal loading and blotting
efficiency [25]. The membranes were blocked using 2 % (w/v) BSA in 0.1 % TBS-T buffer (0.05 M
Tris-base, 0.5 M NaCl, 0.1 % (v/v) Tween-20, pH adjusted to 7.4) for 1 h, at room temperature, and
washed in 0.1 % TBS-T. The membrane was then incubated with primary antibody at 4 °C, overnight
or 1 h at room temperature (RT), washed, incubated with HRP-conjugated anti-mouse or anti-rabbit
secondary antibody for 1 h at RT, and washed again. All washing steps after blotting were done 6
times, 10 min each. ECL reagent was used to detect the primary antibody and visualised by exposure to
auto-radiographic films, which were scanned and bands were analysed using the ImageJ software. The
relative protein expression was normalised against the α-Tubulin as a reference protein.
2.6. Statistical analysis
Statistical analysis of data was conducted, using the ‘Mixed’ procedure of SAS statistical programming
software (Ver. 9.2; SAS Institute Inc., Cary, NC, USA). Overall the models used included the fixed
effects of treatments as well as their interactions. As random effects, porcine myotube culture (N=3)

8
and replicates nested within fixed and random effects. Data representing Fig. 2A-J were tested
separately. The model included fixed effects of insulin, glucose concentration, indinavir, wortmannin,
DM, AICAR, naringenin, falcarinol and insulin as well as their interactions. Porcine myotube cultures
(n=3) and replicates (n = 4) nested within treatments were included as random effects. When overall
effects were significant, LSMeans was separated by pairwise comparison (pdiff option in SAS).
For the western blot and cytotoxicity analysis, differences between treatments were determined
by Student’s unpaired t-test. Differences with a p < 0.05 were considered statistically significant.
3. Results
Any possible cytotoxic effects of the treatments on myotube viability were investigated. However, no
significant decrease in myotube viability in presence of 10 or 30 µM naringenin or falcarinol, or in
presence of the inhibitors (at concentrations used in this study) was observed.
GU was determined in differentiated myotubes incubated with 3, 10 or 30 µM of naringenin
and falcarinol separately, in presence or absence of 10 nM insulin (Fig. 2A and 2B) for 1 h.
Naringenin significantly increased GU in the absence of insulin at 3, 10 and 30 µM concentrations by
15.6 (p = 0.001), 19.5 (p < 0.001) and 16.4 % (p < 0.001), respectively compared to control (DMSO).
An increase of 23.0 (p < 0.001), 11.5 (p < 0.01), and 9.2 % (p = 0.02) in GU at 3, 10, and 30 µM
naringenin concentrations was observed compared to 10 nM insulin only. Falcarinol significantly
increased GU at 3, 10 and 30 µM concentrations in the absence of insulin by 26.5 (p = 0.001), 26.0 (p
< 0.001), and 7.6 (p < 0.01) %, respectively, compared to control (DMSO); whereas in presence of 10
nM insulin, an increase of 15.8 (p < 0.01), 4.0 (p = 0.1) and a decrease of 15.1 (p < 0.001) % in GU,
was observed at 3, 10 and 30 µM falcarinol, respectively, compared to 10 nM insulin only. Here, the

9
GU stimulating effect in the presence of insulin was only observed at 3 µM, while GU was inhibited at
concentration of 30 µM falcarinol.
Based on the results on glucose uptake in absence of insulin (Fig. 2A and 2B) the
concentrations 10 and 30 µM for both naringenin and falcarinol were chosen for further experiments.
The effects of naringenin and falcarinol on IRM are illustrated in Fig. 2C and 2D. In order to reduce
insulin sensitivity, myotubes were incubated in high glucose (12 mM) for 24 h before the experiment.
An extracellular glucose concentration of 12 mM was used to reduce the insulin sensitivity of the
myotubes, while keeping the cell viability unaffected, as demonstrated elsewhere [26]. Basal GU was
significantly reduced in IRM (18.1 %, p = 0.02) compared to control. A significant increase in GU was
observed in presence of 10 nM insulin (21.8 %, p =0.005), as well as 10 and 30 µM naringenin (37.7,
and 29.0 %; p < 0.001) in IRM. The increase in GU in presence of 10 but not 30 µM naringenin was
significantly higher (p = 0.03) than that caused by 10 nM Insulin. Falcarinol, at the concentration s of
10 (21.0 %, p = 0.007) and 30 µM (13.0 %, p = 0.09), significantly increased GU in IRM. At 10 µM
concentration, the increase in GU caused by falcarinol was not significantly different from that caused
by 10 nM Insulin.
Indinavir, a specific inhibitor of Glut4 mediated glucose transport, directly binds and blocks the
Glut4 transporter [27]. The IC50 of indinavir with respect to GU, for cells expressing Glut4 is 50 to 100
µM [28]. In order to examine whether the increased GU elicited by naringenin and falcarinol was
dependant on Glut4 transporters, myotubes were incubated in presence or absence of 100 µM indinavir
for 35 min (Fig. 2E and 2F). Incubation with indinavir significantly reduced basal GU by 44.7 % (p <
0.001). There was no significant increase in GU in presence of 10 nM insulin or 30 µM naringenin in
the indinavir treated cells; whereas 10 µM naringenin caused a minute, but significant increase in GU

10
(6 %, p = 0.03). GU was unaffected at 10 µM and further reduced at 30 µM falcarinol concentrations in
indinavir treated cells.
Activation of PI3K has been found to be necessary for both basal and insulin stimulated Glut4
translocation to the plasma membrane, which is inhibited by wortmannin [29]. In order to test whether
the GU induced by naringenin and falcarinol is affected by the inhibition of PI3K, myotubes were
incubated with 1 µM wortmannin for 1 h (Fig. 2G and 2H), which significantly decreased the basal and
insulin stimulated GU by 24.2 and 31.8 % (p < 0.001) respectively. Naringenin induced GU at 10 and
30 µM concentrations was reduced by 39.9 and 33.9 % (p < 0.001) respectively. A similar reduction in
GU for 10 and 30 µM falcarinol in wortmannin treated myotubes (40.0 and 31.2 %, p < 0.001) was
observed.
In order to test the AMPK dependence of naringenin and falcarinol, myotubes were incubated
with DM, at a concentration of 10 µM, for 65 min (Fig. 2I, J). The AMPK agonist AICAR (1 mM) was
used as a positive control. There was no reduction in basal GU, in DM treated myotubes, but AICAR
stimulated GU was significantly reduced (12.1 %, p < 0.001) in presence of DM. A significant
reduction of 23.7 and 13.4 % (p < 0.001) was observed for 10 and 30 µM naringenin compared to
vehicle at the same concentration. Both 10 and 30 µM falcarinol showed an increase of 5.0 and 24.3 (p
< 0.001) % in DM treated myotubes compared to vehicle at the same concentration.
Activation of TBC1D4/1 by naringenin and falcarinol was examined, with insulin (100 nM) as
a positive control. Naringenin and falcarinol was found to solely increase TBC1D1 phosphorylation
(Fig. 3), and a tendency to decrease in presence of wortmannin. Insulin was found to significantly
increase the phosphorylation of TBC1D4/1, where the former was induced to a higher degree. Insulin
stimulated TBC1D4 phosphorylation (but not that of TBC1D1) was significantly reduced by
wortmannin. In DM treated myotubes, naringenin stimulated TBC1D1 phosphorylation was

11
significantly reduced, and a similar tendency was observed for TBC1D4 phosphorylation; whereas
falcarinol showed a significant increase in TBC1D4 phosphorylation in the presence of DM.
TBC1D4/1 were found to have an approximate molecular weight of 70 kDa. TBC1D4/1 have a
molecular weight of 160 kDa in humans and mouse [30;31]. The molecular weights of these proteins in
pigs have not yet been established. However, according to Ensemble and NCBI sources, based on their
mRNA transcripts, porcine TBC1D4 and TBC1D1 is predicted to have an approximate molecular
weight of 65 to 70 kDa
(http://www.ensembl.org/Sus_scrofa/Gene/Summary?g=ENSSSCG00000009464;r=11:52202660-
52264604;t=ENSSSCT00000010375 , http://www.ncbi.nlm.nih.gov/nuccore/350587438,). Two other
studies [32;33] have tried to detect TBC1D4 in porcine muscles, but they used a different approach
where phosphorylated Akt substrate antibody was used to detect the protein.
4. Discussion
In the current study, naringenin and falcarinol were found to enhance GU in primary porcine myotube
cultures autonomously. In presence of insulin, both naringenin and falcarinol showed a higher increase
in GU at the lowest concentration tested (3 µM); which was reduced at 10 and 30 µM concentrations.
A possible explanation could be a shift in the sensitivity range of the compounds in the presence or
absence of insulin, due to competition for common pathway proteins at higher concentrations.
In IRM, basal GU was significantly reduced, while the naringenin induced effect was
maintained in IRM. This indicates an insulin-independent mechanism of GU which is in line with a
study on L6 muscle cells, where naringenin was found to activate AMPK [15], but in contrast, a
reduced GU was observed in naringenin exposed MCF-7 breast cancer cells and myelocytic U937 cells
[34;35], indicating a cell-type specific effect of this flavonol. Falcarinol induced GU on the other hand

12
was not maintained, in IRM after 10 µM exposure. This diminished GU induction in the presence of 10
µM falcarinol in IRM may be caused by down-regulation of signalling proteins required for falcarinol
stimulated GU.
A significantly reduced GU was observed in indinavir treated cells. In these cells, naringenin
(10 µM) caused a minute but significant increase in GU, although insulin treatment did not. A similar
observation was obtained for naringenin treated IRM, suggesting that although naringenin mostly
depends on Glut4, for GU, it might be capable of partially inducing other glucose transporters (like
Glut1), or enhancing the activity of the small number of Glut4 still available for transport. However,
falcarinol did not increase GU in the indinavir treated cells; which might be indicative of its complete
dependence on Glut4, as is also the case for insulin.
Neither naringenin nor falcarinol increased GU in wortmannin treated cells, suggesting PI3K
dependence. However, it is important to note that in earlier studies, wortmannin has also been found to
inhibit MAPK [36] with an IC50 of 300 nM. This could link GU by naringenin and falcarinol to
MAPK-inhibition as well; since, other than being a downstream target of AMPK [37], p38-MAPK is
involved in full activation of Glut4 [38].
Treatment of the myotubes with DM did not cause any significant change in basal GU; but
AICAR and naringenin mediated GU was diminished in its presence. This also corroborates well with
naringenin induced AMPK activation [15] and unchanged naringenin induced GU in IRM compared to
normal myotubes. The inability of DM to reduce falcarinol induced GU and TBC1D1 phosphorylation
indicates AMPK independence; while the significant DM induced increase in GU observed at 30 µM
falcarinol is surprising. However a cross talk between different signalling pathways could provide a
rationale. Moreover, DM has been shown to participate in other signalling cascades, independent of the
AMPK pathway [39]. Furthermore, intracellular reactive oxygen species (ROS) has been implicated in

13
GU during exercise/muscle contraction [40] and the activation of p38 MAPK [41], which stimulates
GU [38]. The fact that falcarinol induces ROS formation at low concentrations (1.6 to 25 µM) [18]
could explain the falcarinol stimulated AMPK-independent increase in GU.
The activation of TBC1D1 by naringenin and falcarinol was reported for the first time in this
study. TBC1D1 is more abundant in fast-twitch muscles, while higher levels of TBC1D4 is found in
muscles with slow-twitch characteristics [10]. However, TBC1D4 was more responsive to insulin
induced phosphorylation than TBC1D1. Mass spectrometry analysis on TBC1D1 from mouse skeletal
muscle has revealed several phosphorylation sites, most of which were consensus or near consensus
sites for AMPK; and AICAR was found to be a stronger regulator, causing more phosphorylation on
TBC1D1 than insulin [10]. This also explains the inhibition of naringenin induced
TBC1D1phosphorylation by DM, since naringenin is known to activate AMPK [15].
Overall, it can be concluded that both naringenin and falcarinol depend predominantly on Glut4
and PI3K and/or p38MAPK activity for the induction of GU. Naringenin (not falcarinol) induced GU,
is dependent on AMPK activation. Treatment with wortmannin and DM indicate that naringenin and
falcarinol differ in their mechanism of action, but both increase GU via TBC1D1 phosphorylation.
However, it would be interesting to investigate the complicated distribution and regulation patterns of
TBC1D4 and TBC1D1 in order to successfully understand the proximal steps in the regulation of Glut4
translocation.
ACKNOWLEDGEMENTS
This work has been supported by The Danish Council for Strategic Research (Grant no. 09-063086)
and The Graduate School of Agriculture, Food and Environment (SAFE), Aarhus University. The
authors declare no conflicts of interest.

14
Reference List
[1] K.S. Polonsky, Dynamics of insulin secretion in obesity and diabetes. Int. J. Obes. 24 (2000) S29-
S31.
[2] A.R. Saltiel, C.R. Kahn, Insulin signalling and the regulation of glucose and lipid metabolism.
Nature 414 (2001) 799-806.
[3] J.E. Pessin, A.R. Saltiel, Signaling pathways in insulin action: molecular targets of insulin
resistance. J. Clin. Invest. 106 (2000) 165-169.
[4] C.M. Taniguchi, B. Emanuelli, C.R. Kahn, Critical nodes in signalling pathways: insights into
insulin action. Nat. Rev. Mol. Cell Bio. 7 (2006) 85-96.
[5] B. Viollet, L. Lantier, J. Devin-Leclerc et al., Targeting the AMPK pathway for the treatment of
Type 2 diabetes. Front. Biosci. 14 (2009) U3380-U3864.
[6] H.A. Koistinen, D. Galuska, A.V. Chibalin et al., 5-amino-imidazole carboxamide riboside
increases glucose transport and cell-surface GLUT4 content in skeletal muscle from subjects with
type 2 diabetes. Diabetes 52 (2003) 1066-1072.
[7] M. Kristensen, M.K. Rasmussen, C. Juel, Na(+)-K (+) pump location and translocation during
muscle contraction in rat skeletal muscle. Pflugers Arch. 456 (2008) 979-989.
[8] N. Musi, L.J. Goodyear, AMP-activated protein kinase and muscle glucose uptake. Acta Physiol.
Scand. 178 (2003) 337-345.

15
[9] K. Sakamoto, G.D. Holman, Emerging role for AS160/TBC1D4 and TBC1D1 in the regulation of
GLUT4 traffic. Am. J. Physiol-Endoc. M. 295 (2008) E29-E37.
[10] E.B. Taylor, D. An, H.F. Kramer et al., Discovery of TBC1D1 as an insulin-, AICAR-, and
contraction-stimulated signaling nexus in mouse skeletal muscle. J. Biol. Chem. 283 (2008) 9787-
9796.
[11] J.T. Treebak, J.B. Birk, A.J. Rose et al., AS160 phosphorylation is associated with activation of
alpha(2)beta(2)gamma(1)- but not alpha(2)beta(2)gamma(3)-AMPK trimeric complex in skeletal
muscle during exercise in humans. Am. J. Physiol-Endoc. M. 292 (2007) E715-E722.
[12] W.G. Roach, J.A. Chavez, C.P. Miinea et al., Substrate specificity and effect on GLUT4
translocation of the Rab GTPase-activating protein Tbc1d1. Biochem. J. 403 (2007) 353-358.
[13] R.J. Marles, N.R. Farnsworth, Antidiabetic plants and their active constituents. Phytomedicine 2
(1995) 137-189.
[14] S. Kannappan, C.V. Anuradha, Naringenin enhances insulin-stimulated tyrosine phosphorylation
and improves the cellular actions of insulin in a dietary model of metabolic syndrome. Eur. J.
Nutr. 49 (2010) 101-109.
[15] K. Zygmunt, B. Faubert, J. MacNeil et al., Naringenin, a citrus flavonoid, increases muscle cell
glucose uptake via AMPK. Biochem. Biophys. Res. Commun. 398 (2010) 178-183.

16
[16] B.T. Metzger, D.M. Barnes, J.D. Reed, Purple carrot (Daucus carota L.) polyacetylenes decrease
lipopolysaccharide-induced expression of inflammatory proteins in macrophage and endothelial
cells. J. Agric. Food Chem. 56 (2008) 3554-3560.
[17] R.G. Zaini, K. Brandt, M.R. Clench et al., Effects of Bioactive Compounds from Carrots (Daucus
carota L.), Polyacetylenes, Beta-Carotene and Lutein on Human Lymphoid Leukaemia Cells.
Anticancer Agents Med.Chem. 12 (2012) 640-652.
[18] J.F. Young, L.P. Christensen, P.K. Theil et al., The polyacetylenes falcarinol and falcarindiol
affect stress responses in myotube cultures in a biphasic manner. Dose-Response 6 (2008) 239-
251.
[19] S.L. Hansen, S. Purup, L.P. Christensen, Bioactivity of falcarinol and the influence of processing
and storage on its content in carrots (Daucus carota L). J. Sci. Food Agric. 83 (2003) 1010-1017.
[20] U. Kidmose, S.L. Hansen, L.P. Christensen et al., Effects of genotype, root size, storage, and
processing on bioactive compounds in organically grown carrots (Daucus carota L.). J. Food Sci.
69 (2004) S388-S394.
[21] M.W. Bernart, J.H. Cardellina, M.S. Balaschak et al., Cytotoxic falcarinol oxylipins from
Dendropanax arboreus. J. Nat. Prod. 59 (1996) 748-753.
[22] A. Czepa, T. Hofmann, Structural and sensory characterization of compounds contributing to the
bitter off-taste of carrots (Daucus carota l.) and carrot puree. J. Agric. Food Chem. 51 (2003)
3865-3873.
17
[23] K. Hirakura, M. Morita, K. Nakajima et al., The Constituents of Panax Ginseng .3. 3 Acetylenic-
Compounds from Roots of Panax-Ginseng. Phytochemistry 31 (1992) 899-903.
[24] P.K. Theil, I.L. Sorensen, P.M. Nissen et al., Temporal expression of growth factor genes of
primary porcine satellite cells during myogenesis. Anim. Sci. J. 77 (2006) 330-337.
[25] M.K. Rasmussen, C. Juel, N.B. Nordsborg, Exercise-induced regulation of muscular N+-K+
pump, FXYD1, and NHE1 mRNA and protein expression: importance of training status,
intensity, and muscle type. Am. J. Physiol-Reg. I. 300 (2011) R1209-R1220.
[26] B.N. Che, N. Oksbjerg, L.I. Hellgren et al., Phytanic acid stimulates glucose uptake in a model of
skeletal muscles, the primary porcine myotubes. Lipids Health Dis. 12 (2013).
[27] J. Hertel, H. Struthers, C.B. Horj et al., A structural basis for the acute effects of HIV protease
inhibitors on GLUT4 intrinsic activity. J. Biol. Chem 279 (2004) 55147-55152.
[28] H. Murata, P.W. Hurz, M. Mueckler, Indinavir inhibits the glucose transporter isoform Glut4 at
physiologic concentrations. Aids 16 (2002) 859-863.
[29] T. Tsakiridis, H.E. Mcdowell, T. Walker et al., Multiple Roles of Phosphatidylinositol 3-Kinase
in Regulation of Glucose-Transport, Amino-Acid-Transport, and Glucose Transporters in L6
Skeletal-Muscle Cells. Endocrinology 136 (1995) 4315-4322.
[30] D.S. Gerhard, L. Wagner, E.A. Feingold et al., The status, quality, and expansion of the NIH full-
length cDNA project: the Mammalian Gene Collection (MGC). Genome Res. 14 (2004) 2121-
2127.

18
[31] R.L. Strausberg, E.A. Feingold, L.H. Grouse et al., Generation and initial analysis of more than
15,000 full-length human and mouse cDNA sequences. Proc. Natl. Acad. Sci. U.S.A 99 (2002)
16899-16903.
[32] B. Essen-Gustavsson, A. Granlund, B. Benziane et al., Muscle glycogen resynthesis, signalling
and metabolic responses following acute exercise in exercise-trained pigs carrying the PRKAG3
mutation. Exp. Physiol. 96 (2011) 927-937.
[33] A. Granlund, O. Kotova, B. Benziane et al., Effects of exercise on muscle glycogen synthesis
signalling and enzyme activities in pigs carrying the PRKAG3 mutation. Exp. Physiol. 95 (2010)
541-549.
[34] A.W. Harmon, Y.M. Patel, Naringenin inhibits glucose uptake in MCF-7 breast cancer cells: a
mechanism for impaired cellular proliferation. Breast Cancer Res. Treat. 85 (2004) 103-110.
[35] J.B. Park, Flavonoids are potential inhibitors of glucose uptake in U937 cells. Biochem. Biophys.
Res. Commun. 260 (1999) 568-574.
[36] I.M. Ferby, I. Waga, M. Hoshino et al., Wortmannin inhibits mitogen-activated protein kinase
activation by platelet-activating factor through a mechanism independent of p85/p110-type
phosphatidylinositol 3-kinase. J. Biol. Chem 271 (1996) 11684-11688.
[37] Z. Cheng, T. Pang, M. Gu et al., Berberine-stimulated glucose uptake in L6 myotubes involves
both AMPK and p38 MAPK. BBA. Gen-Subjects 1760 (2006) 1682-1689.

19
[38] D. Konrad, R. Somwar, G. Sweeney et al., The antihyperglycemic drug alpha-lipoic acid
stimulates glucose uptake via both GLUT4 translocation and GLUT4 activation - Potential role of
p38 mitogen-activated protein kinase in GLUT4 activation. Diabetes 50 (2001) 1464-1471.
[39] J.F. Jin, T.D. Mullen, Q. Hou et al., AMPK inhibitor Compound C stimulates ceramide
production and promotes Bax redistribution and apoptosis in MCF7 breast carcinoma cells. J.
Lipid Res. 50 (2009) 2389-2397.
[40] M.E. Sandstrom, S.J. Zhang, J. Bruton et al., Role of reactive oxygen species in contraction-
mediated glucose transport in mouse skeletal muscle. J. Physiol-London 575 (2006) 251-262.
[41] J.Y. Kim, J.M. An, W.Y. Chung et al., Xanthorrhizol Induces Apoptosis Through ROS-Mediated
MAPK Activation in Human Oral Squamous Cell Carcinoma Cells and Inhibits DMBA-Induced
Oral Carcinogenesis in Hamsters. Phytother. Res. 27 (2013) 493-498.

20
Fig. 1. Chemical structures of naringenin and falcarinol.
Fig. 2. Effect of naringenin and falcarinol on glucose uptake. The differentiated myotubes were
incubated with 3, 10 and 30 µM (A) naringenin and (B) falcarinol, in presence and absence of 10 nM
insulin (closed and open bars respectively) for 1 h; or incubated for 24 h with either 7 mM or 12 mM
glucose (open and closed bars respectively) and then treated with 10 and 30 µM of (C) naringenin and
(D) falcarinol for 1 h, following which glucose uptake was measured. Myotubes were incubated with
indinavir (100 µM) for 5 minutes prior to 2DOG addition (E & F); 1µM wortmannin for 1 h (G & H)
or 10 µM DM for 5 minutes (I & J), prior to treatment addition. For A – H, insulin (10 nM) and for I &
J, AICAR (1 mM) was used as the positive control. N10, N30 = 10 and 30 µM naringenin and F10, F30
= 10 and 30 µM falcarinol respectively; Vehicle = cells treated with DMSO only. In the plot DM =
dorsomorphin. Values are given as ls means ± sem of experiments conducted with satellite cells from 3
pigs, expressed as percent of control. Number of replicates per pig (n) = 6. Different letters indicate
significant differences.
Fig. 3. Stimulation of TBC1D4 and TBC1D1 phosphorylation by naringenin and falcarinol.
Differentiated myotubes were incubated for 2.5 h with 100 nM insulin (Ins), 10 µM naringenin (N10),
and 10 µM falcarinol (F10), in presence or absence of 1 µM wortmannin (W) and 10 µM dorsomorphin
(DM). Cells were harvested and lysed. Thereafter, equal amounts of protein were used for SDS-PAGE
followed by immunoblotting with specific antibodies recognizing phosphorylated (Thr642) TBC1D4
and (Thr590) TBC1D1 (A and B). α-Tubulin was used as the reference protein. Values are given as
Mean ± SEM of experiments conducted with satellite cells from 3 pigs. Levels of significance, *p <
0.05, **p < 0.01, ***p < 0.001.

21
Fig.1.

22
Fig.2.

23
Fig.3.