health services cost review … re: the partial rate * before the health services application of...
TRANSCRIPT

Toll Free 1-877-4MD-DHMH · TTY for the Disabled Maryland Relay Service 1-800-735-2258
Frederick W. Puddester Chairman
Kevin J. Sexton Vice Chairman
Joseph R. Antos, Ph.D.
George H. Bone, M.D.
C. James Lowthers
Herbert S. Wong, Ph.D.
Robert Murray Executive Director
Stephen Ports
Principal Deputy Director Policy & Operations
Gerard J. Schmith
Deputy Director Hospital Rate Setting
HEALTH SERVICES COST REVIEW COMMISSION 4160 PATTERSON AVENUE, BALTIMORE, MARYLAND 21215
Phone: 410-764-2605 · Fax: 410-358-6217 Toll Free: 1-888-287-3229 www.hscrc.state.md.us
STATE OF MARYLAND DEPARTMENT OF HEALTH AND MENTAL HYGIENE
472nd MEETING OF THE HEALTH SERVICES COST REVIEW COMMISSION
PUBLIC SESSION November 3, 2010
9:30 a.m. 1. Review of the Executive Session and Public Minutes of October 13, 2010 2. Executive Director’s Report 3. Docket Status - Cases Closed 2080A - MedStar Health 2081A - Johns Hopkins Health System 2089A - Maryland Physicians Care 2091A - University of Maryland Medical Center 2092A - Johns Hopkins Health System 2093A - Johns Hopkins Health System 2094A - Johns Hopkins Health System
4. Docket Status - Cases Open 2076R - St. Agnes Hospital
2087R - Memorial Hospital at Easton 2088R - Dorchester General Hospital 2090N - Memorial Hospital at Easton 2095A - Johns Hopkins Health System
5. Request to Rescind Prior ICC/ROC Recommendation Regarding Major Capital Projects
6. Final Recommendation Regarding Medicaid Current Financing Formula
7. Draft Recommendation on Potentially Preventable Readmissions Methodology
8. Summary of the FY 2009 Disclosure of Financial and Statistical Data
9. Hearing and Meeting Schedule


IN RE: THE PARTIAL RATE * BEFORE THE HEALTH SERVICES
APPLICATION OF MEMORIAL HOSPITAL* COST REVIEW COMMISSION
AT EASTON - QUEEN ANNE’S COUNTY * DOCKET: 2010
FREESTANDING EMERGENCY CENTER * FOLIO: 1900 GRASONVILLE, MARYLAND * PROCEEDING: 2090N
* * * * * * * * * * * * * * * * * * * * * * * * * * * * * * * * * * * * * * * * * * * *
Staff Recommendation
November 3, 2010

Introduction
On September 13, 2010, Memorial Hospital at Easton (the “Hospital”) submitted a partial
rate application to the Commission on behalf of the Queen Anne’s Freestanding Emergency
Medical Center (the “Center”) requesting a rate for emergency and related ancillary services
provided at the new Center. The Hospital is requesting that the rates be approved effective
October 4, 2010.
Chapters 505 and 506 of the 2010 Laws of Maryland require the Commission to set rates
for all payers for emergency services provided at two freestanding medical facilities operating as
pilot projects under legislation passed in 2005 and 2007. Those facilities are the Queen Anne’s
Freestanding Emergency Medical Center and the Germantown Emergency Center. The 2010
legislation also requires the Commission to set rates for all payers for emergency services
provided at the Bowie Health Center. Under the 2010 legislation, rates are to be effective for the
Center in October 2010, while the rates for the Germantown Emergency Facility and the Bowie
Health Center are to be effective on July 1, 2011. The rates for the Center are required to be set in
a manner that does not impact the State budget in fiscal 2011.
After the Germantown Emergency Center became the first pilot project in 2005, it
attempted to obtain provider-based status from Medicare in order to receive facility fee
reimbursement. Ultimately, after various administrative and legal proceedings, it was determined
that if the HSCRC does not set a rate for the freestanding medical facility, Medicare would not
pay a facility fee. Since the HSCRC will be setting rates for these facilities pursuant to the 2010
legislation, Medicare will begin paying the corresponding facility fee.

Staff Evaluation
The Commission typically provides a hospital with the lesser of the state-wide median rate or
the hospital’s requested rate based on projected cost for new services. The Commission currently sets
a Freestanding Emergency (FSE) rate solely for the Bowie Health Center, which is part of the
Dimensions Health System. However, Bowie only operates 16 hours per day, 7 days per week, while
the Queen Anne’s Freestanding Emergency Medical Center will operate 24 hours per day, 7 days per
week. Therefore, the Hospital requested that Bowie’s rate be approved for the Center after
adjustments to account for the differences in operating times. Staff reviewed the adjustments that the
Hospital made to Bowie’s FSE rate and determined that the adjustments appeared reasonable. This
resulted in a FSE rate of $283.76.
The Hospital also requested that it be allowed to charge the ancillary rates of the Memorial
Hospital of Easton for ancillary services provided at the freestanding facility. Staff believes that these
rates should be less than the Hospital’s rates, since the overhead associated with a freestanding facility
should be less than that of the Hospital. Therefore, staff attempted to produce a set of rates based on
the expected cost of the Center and a reasonable number of units provided. Staff used the projected
cost of the Center as provided by the Hospital; however, staff substituted debt service payments of
$789,000 per year for the depreciation and interest of $1,666,000 requested by the Hospital. This
resulted in total estimated cost of $5,128,615. However, if the units projected by the Hospital were
used, the resultant rates would be much higher than the state-wide median rates or Easton’s rates.
Thus, staff used the estimated ancillary volumes of Bowie adjusted for the additional hours of
operation at Queen Anne’s. The analysis (Exhibit I) performed by staff shows that these calculated
rates are less than those of the Hospital.

Recommendation
Staff recommends that the 60 day filing requirement for the opening of a new revenue center,
as per COMAR 10.37.10.07 be waived, and that the following provisional rates be approved by the
Commission.
Freestanding Emergency $283.76 per visit
Cat Scanner 2.55 per RVU
Laboratory 1.22 per RVU
Radiology Diagnostic 14.30 per RVU
EKG 2.57 per RVU
Medical Surgical Supplies and Drugs- Invoice Cost plus Overhead of $18,592 and $7,230 respectively
Finally, the 2010 statute required that the rates be set for the Center in a manner that does not
result in a fiscal impact to the Medical Assistance (MA) program. The Hospital provided an analysis
that showed that the expected cost to MA would be $528.60 per emergency visit, or $4,054,362 for
the first year’s expected emergency visits of 7,670 absent the Center. Staff estimates that the cost per
visit as recommended (including ancillaries) would be $333.38 per visit or $2,557,053 in total. Staff
has not attempted to estimate what, if any, additional supply induced demand might be. However,
staff believes that the Hospital must submit an analysis at the end of the fiscal year showing what the
actual cost of the freestanding facility was compared to the $4,054,362. If the cost of the freestanding
facility to MA was more, the Hospital will need to meet with MA to determine how much should be
paid back to MA.

The recommended rates are considered provisional at this time and will be revisited during the
end of the fiscal year when more data are available on actual experience. The Center and the
Commission will also revisit the rates approved herein to consider:
• Whether it would be appropriate to include the Center under a Total Patient Revenue
(TPR) structure;
• The impact on MA budget neutrality in FY 2011; and
• Rates set for the Germantown Emergency Center and the Bowie Health Center that
will be effective on July 1, 2011.

Queen Anne's County Freestanding Emergency Center Exhibit IRates Effective October 4, 2010
Lesser ofTotal Reasonable Rates after Easton's Calculated First Year
Salaries & Physician Other Direct Direct Overhead Total Uints of Cost Per Mark up of Approved and Easton's ExpectedFB's Supervision Expenses Expenses Expenses Expenses Service Unit 1.15109 Rates Rates Revenue
FSE $1,402,240 $443,500 $19,982 $1,865,722 $1,997,893 $3,863,615 13,146 $293.90 $338.31 $283.76 $283.76 2,176,439CAT $50,000 $1,914 $51,914 $10,724 $62,638 28,252 $2.22 $2.55 $5.77 $2.55 12,919LAB $446,811 $78,377 $525,188 $108,491 $633,679 599,820 $1.06 $1.22 $2.05 $1.22 130,692RAD $283,501 $32,206 $315,707 $65,217 $380,924 30,665 $12.42 $14.30 $32.14 $14.30 78,563EKG $30,000 $613 $30,613 $6,324 $36,937 16,559 $2.23 $2.57 $2.66 $2.57 7,618MSS $0 $90,000 $90,000 $18,592 $108,592 $108,592CDS $0 $35,000 $35,000 $7,230 $42,230 $42,230
Total $2,212,552 $443,500 $258,092 $2,914,144 $2,214,471 $5,128,615 $390.13 $5,903,497 $449.07 $304 $2,557,053
Note: Ancillary "Units of Service" Based on Bowie's adjustment 42,808 FY 2011 Estimated Visits 7,670 Per Visit $333.38

IN RE: THE APPLICATION FOR * BEFORE THE MARYLAND HEALTH
ALTERNATIVE METHOD OF RATE * SERVICES COST REVIEW
DETERMINATION * COMMISSION
JOHNS HOPKINS HEALTH * DOCKET: 2010
SYSTEM * FOLIO: 1905
BALTIMORE, MARYLAND * PROCEEDING: 2095A
Staff Recommendation
November 3, 2010

INTRODUCTION
Johns Hopkins Health System (ASystem@) filed a renewal application with the HSCRC on
October 22, 2010 on behalf of the Johns Hopkins Bayview Medical Center (the AHospital@) for an
alternative method of rate determination, pursuant to COMAR 10.37.10.06. The System requests
approval from the HSCRC for continued participation in a capitation arrangement serving persons
with mental health needs under the program title, ACreative Alternatives. The arrangement is
between the Johns Hopkins Health System and the Baltimore Mental Health Systems, Inc., with the
services coordinated through the Hospital. The requested approval is for a period of one year.
II. OVERVIEW OF APPLICATION
The parties to the contract include the System and the Baltimore Mental Health Systems,
Inc. Creative Alternatives provides a range of support services for persons diagnosed with mental
illness and covers medical services delivered through the Hospital. The System will assume the risks
under the agreement, and all Maryland hospital services will be paid based on HSCRC rates.
III. STAFF FINDINGS
Staff found the experience under this arrangement for FY 2010 was favorable.
IV. STAFF RECOMMENDATION
Based on its favorable performance for the last year, staff recommends that the
Commission approve the Hospital=s renewal application for an alternative method of rate
determination for a one year period commencing November 1, 2010.
Consistent with its policy paper regarding applications for alternative methods of rate
determination, the staff recommends that this approval be contingent upon the execution of the

standard Memorandum of Understanding ("MOU") with the Hospital for the approved contract.
This document would formalize the understanding between the Commission and the Hospital, and
would include provisions for such things as payments of HSCRC‐approved rates, treatment of losses
that may be attributed to the contract, quarterly and annual reporting, confidentiality of data
submitted, penalties for noncompliance, project termination and/or alteration, on‐going
monitoring, and other issues specific to the proposed contract. The MOU will also stipulate that
operating losses under the contract cannot be used to justify future requests for rate increases.


Final Recommendation for Revisions to the Reasonableness of Charges (ROC) Methodology
Health Services Cost Review Commission 4160 Patterson Avenue Baltimore, MD 21215
(410) 764-2605 Fax (410) 358-6217
June 9, 2010
This document represents a final recommendation to be presented to the Commission on June 9, 2010 for final action.

2
Background ICC/ROC Methodology: The Commission is required to approve reasonable rates for services offered by Maryland hospitals. The ‘Reasonableness of Charges’ (ROC) methodology is an analysis that allows for the comparison of charges at individual hospitals to those of their peer hospitals after various adjustments to the charge data have been applied. Hospitals with adjusted charges that are high compared to their peers are subject to rate decreases through spend-downs and/or negative scaling of the Update Factor. Conversely, hospitals with adjusted charges that are low compared to their peer hospitals may be allowed rate increases through positive scaling of the Update Factor based on their ROC position. The inter-hospital cost comparison (ICC) used for full rate reviews is based on the ROC methodology with additional adjustments for profit and productivity when establishing a peer standard for comparison. The ROC comparison is conducted annually in the spring or summer with ROC position scaling results impacting the July rate update for the following rate year. ICC/ROC Workgroup: Each year, the HSCRC solicits requests from the Maryland hospital industry for modifications to the ICC/ROC methodologies. A summary of the letters submitted on June 1, 2009 is included in Appendix A. Each fall, the ICC/ROC Workgroup, comprised of hospital, payer representatives and Commission staff, meets to discuss the ICC/ROC methodologies and the proposed modifications. This year, the ICC/ROC Workgroup met 13 times over a six month period and the following draft recommendations are the result of those deliberations. This document represents the final set of recommendations associated with the ROC for 2010. Once approved by the Commission, these provisions will apply for both the application of ROC and ICC policy. Issues and Draft Recommendations 1-Comprehensive Charge Target (CCT) As approved by the Commission last year, the CCT is the starting point for the ROC methodology and is established by blending the inpatient charge per case (CPC) target and outpatient charge per visit (CPV) target. Implementation of the CPV was delayed until FY2011 and, therefore, CPV targets were not established for FY2010. Recommendation: Staff recommends that the CPV used in the 2010 ROC be established as follows: Calculate a CPV for each hospital by using FY2009 outpatient data under the expanded CPV methodology that had been in place for FY2010. Inflate the established CPV by each hospital’s outpatient rate update for FY2010 and blend the CPV and CPC targets to establish the CCT under the blending methodology approved last year. Application of Indirect Medical Education (IME) and Disproportionate Share (DSH) Adjustment Under the current ROC methodology, the IME and DSH adjustments are applied as a deviation from the statewide average. Therefore, using IME as an example, non-teaching hospitals with no IME costs

3
receive an upward adjustment to their CCT for the percent that they differ from the statewide average IME amount. Staff believes that it is technically correct and makes more intuitive sense to apply the costs associated with IME and DSH as a direct strip from hospital charges. Under this change, again using IME as an example, non-teaching hospitals would have no ROC adjustment for IME costs. At the end of last year’s ICC/ROC Workgroup discussions, staff proposed this technical correction to the application of the IME and DSH adjustments. However, at that time, Workgroup members stated that it was too late in the discussion process to make this change. Recommendation: Staff recommends the implementation of a technical correction to the IME and DSH adjustments that applies the adjustment as a direct strip instead of a deviation from the average statewide costs associated with IME and DSH. 2-Capital Adjustment CareFirst and Kaiser proposed two changes to the HSCRC’s policy on capital: 1) changes to the current capital adjustment in the ROC; and 2) a change to how capital is handled in rates in terms of the variable cost factor. 1) With regard to the ROC adjustment, the current methodology adjusts for the percentage of costs that are related to capital using 50% of the hospital-specific capital costs plus 50% of the statewide capital costs. CareFirst and Kaiser proposed a ten year phase-in to move from the 50/50 standard to 100% statewide costs plus 0.5%. At the end of the ten year phase-in period, there would be no ROC adjustment for capital. The purpose of this proposal is to gradually reduce the amount of capital provision that is specific to any individual institution and instead transition the system to a 100% prospective system plus an additional 0.5%. The additional 0.5% is an added factor to cover any and all unusual circumstances and to add a buffer for hospitals undertaking capital projects. 2) With regard to capital and the variable cost factor (currently at 85%), Care First and Kaiser proposed that Certificate of Need (CON) eligible projects be allowed to receive a different variable cost factor for three years after first use of a newly constructed facility. By proposing this policy change, CareFirst and Kaiser are attempting to recognize the difficulty faced by hospitals who undertook major capital projects just prior to the Commission’s decision to move from a 100% variable cost adjustment to a more restrictive 85% variable cost adjustment for volume. Facilities who undertook these major projects when the variable cost factor was 100% were most certainly counting on these additional revenues as their volumes increased over time. Under the proposed policy change, the following variable cost factors would apply to hospitals as follows: a) 100% variable cost adjustment if a hospital takes “the Pledge” to not file rate application;1 b) 100% variable cost if the CON for the project in question was filed when variable cost factor was 100% and hospital did not file a rate application;
1 The “Pledge” refers to circumstances where a hospital agrees not to request from the HSCRC an increase in rates greater than $1.5 million associated with a capital project over the life of that project. In exchange for this Pledge, the hospital is exempt from Certificate of Need (CON) review by the Maryland Health Care Commission.

4
c) 100% variable cost for hospitals that filed a CON when the variable cost factor was 85%, and the hospital did not file a rate application; d) The current variable cost adjustment (85%) will be applied for hospitals that filed a rate application that generated additional dollars in rates for capital. Hospitals that filed a rate application and received additional funding in rates for their project through this process will not be eligible for the 100% variable cost adjustment.
Additional amounts provided to hospitals as a result of these circumstances, would be accounted for as slippage in future years system Update Factors – as per current Commission policy. Staff response: Item 1) Staff is supportive of the concept of moving to a statewide standard for capital over a ten year period. A phasing out of the hospital-specific portion of capital in rates will provide the industry with stronger incentives to control costs and improve efficiency. Members of the ROC/ICC did not voice objection to this proposal. Item 2) Staff also supports the idea of a less restrictive variable cost factor to fund capital projects in place of funding capital through rate increases. However, the staff would like to also recognize the impact that the policy change from 100% variable cost to 85% variable cost had on major capital projects. As noted, if a CON was filed and approved, along with the related comfort order, under the 100% variable cost policy, it was assumed the incremental margin on additional volume could be used to help fund the capital requirements. When the HSCRC changed the variable cost policy to 85%, this restricted hospitals ability to generate incremental margin on additional volume. In addition, staff would propose that the application of 100% variable cost factors to hospitals with major capital projects be extended on a forward-funded basis. Recommendation: Item 1) Staff recommends using a ten year phase-in to move from the current capital cost standard of 50% hospital-specific plus 50% statewide to 100% statewide plus 0.5%. Item 2) Additionally, in an attempt to recognize the impact that the change in the variable cost policy had on major capital projects, the Staff recommends that certain CON eligible projects, where no rate application that generated additional dollars for capital has been filed would be eligible for three years of 100% variable cost. 2a) Original Proposal: The three scenarios where 100% variable cost adjustment would apply to a hospital undertaking a major capital project and articulated in the original CareFirst/Kaiser proposal include: a) New CON and the hospital agrees to take the pledge; b) Previously filed CON, when the variable cost factor was 100%, and the hospital did not file a rate application;

5
c) Previously file CON, when the variable cost factor was 85%, and the hospital did not file a rate application. Note: hospitals that filed rate applications and received funding through this process will continue to receive the current variable cost factor of 85%. 2b) Proposed Forward Funding Modification: In addition to the requirements laid out in the baseline proposal above, the proposed forward funding modification would apply to the following hospitals (all falling under scenario b) above):
1. Hospital must have an approved CON that was filed prior to the 85% variable cost policy change;
2. Hospital must have a significant capital project, defined as: a. Capital project in excess of 50% of the hospital’s annual regulated gross patient
revenue 3. Hospital must be considered an efficient provider under the HSCRC’s ROC methodology.
If the above qualifying criteria are met, the hospital would be eligible to forward-fund a portion of the projected volume adjustments. The forward-funding amount would be determined by the HSCRC staff after considering the following factors:
Cumulative volume adjustment applied to the hospital since 85% policy went into effect; Cumulative volume adjustment applied to the state (average) for the same time period; Anticipated volume changes over prospective three year period.
Eligible amounts would be forward funded to fiscal year of opening. Volume adjustments (calculated under the baseline proposal) in excess of the forward-funded amounts would be awarded in the future under the same timeline as the baseline proposal. 3-Profit and Productivity Adjustment in the ICC The cost standard used for full rate reviews in the ICC methodology begins with the hospital’s peer group ROC-adjusted CCT and then excludes the peer group’s average profit, and includes a 2% productivity adjustment. The Maryland Hospital Association (MHA) contended that the current ICC policy is too restrictive for hospitals to access rate relief. The MHA proposed that during full rate setting the methodology should add back the lower of the target hospital’s profit or 2.75% (the Financial Condition Policy’s target for operating margins). The MHA also proposed that the 2% productivity adjustment be phased-in over a multi-year period, or that a national standard be identified and used for the productivity adjustment. Hospital payment levels and costs have increased more rapidly in Maryland compared to the rest of the nation over the last 5 years. In FY05, Maryland was 2.58% below the U.S. in Net Operating Revenue per EIPA and moved to 1.90% above the U.S. in FY09 for this measure. For the same time period, Maryland went from 4.28% to 0.38% below the U.S. for Net Patient Revenue per EIPA and 3.65% below to 0.71% above the U.S. for Cost per EIPA. Because of this erosion of Maryland hospital

6
payments and costs compared to the U.S., staff believes that it would not be the appropriate time to move to a less restrictive standard in the ICC methodology. Recommendation: Staff recommends no change to the profit and productivity adjustments in the ICC. However, during the deliberations of the ROC/ICC Work Group, representatives of the G-9 pointed out an apparent inconsistence between the HSCRC’s policy for Partial Rate Applications (most specifically the Commission’s policy regarding the profit strip for purposes of calculating the ICC standard) and the staff’s new recommendation on phasing the system to 100% prospective capital (as recommended above in section 2, Item 1). As a result, the staff will consider appropriate changes to the HSCRC’s Policy governing Partial Rate applications in next year’s ROC/ICC review. 4 - Exclusions Currently, liver transplants, heart and/or lung transplants, pancreas transplants, bone marrow transplants, and kidney transplants are excluded from the CPC constraint system because past analyses indicated that there was significant variation in charges within the corresponding APR-DRGs for these cases. Staff recently analyzed the charge variation for each of the transplant APR-DRGs using FY09 inpatient data. The liver, heart, pancreas, and bone marrow transplant cases continue to experience wide variations in charges and length of stay and should continue to be excluded from the CPC system. However, analyses of the kidney transplant cases indicate that there is very little variation in charges, as measured by the coefficient of variation, within the kidney transplant APR/SOI cells. At the March Commission Meeting, staff recommended that the kidney transplant cases be included under the CPC constraint system. In a meeting subsequent to the March recommendation, representatives from the Academic Medical Centers provided Commission Staff a more detailed review of the differences in costs associated with variations in recipient and donor types within the kidney transplant APR/SOI cells. Recommendation: Staff recommends that kidney transplant cases continue to be excluded from the CPC constraint system in FY2011 pending a review of case mix issues raised by the Academic Medical Centers. Staff is hopeful this review will address any remaining case mix comparison issues such that some or all of the kidney transplant cases can be included in CPC constraint in FY 2012. 5 - Case-mix Lag Under current Commission policy, case-mix is measured in “real time”, meaning that the calculation of case-mix change for the previous rate year and calculation of the base CMI for the new rate order use discharge data from the July-June period immediately prior to the new rate year. For example, the base CMIs in the rate orders for the fiscal year that began July 1, 2009 were calculated using discharge data from July 1, 2008 thru June 30, 2009. Discharge data from the previous rate year is not available until, at the earliest, 4 months after the beginning of the new fiscal year. Therefore, the measurement of case-mix in real time causes unavoidable delays in issuing rate orders which, in turn, impacts hospitals’ ability to achieve CPC compliance. Staff recommends that case-mix change and base CMI be measured using a three month lag in the data period. The data period used to calculate case-mix change for FY10 will remain the 12-months ending June 30, 2010. However, the base CMI for the FY11 rate orders will be based on discharge data from April 1, 2009 – March 31, 2010 and case-mix change for FY11 will be

7
measure using discharge data from April 1, 2010 – March 31, 2011. There are technical details associated with this change that Commission staff plan to discuss at MHA’s Technical Issues Workgroup over the next several months. Recommendation: Staff recommends incorporating a three month lag into the data periods used for case mix measurement. This change would go into effect the next rate year. For rate year 2011, the reweighted base case mix index for the Charge per Case Targets for each hospital will be the twelve month period April 1, 2009 through March 31, 2010. Further, the case mix base and future measurement will incorporate the most current methodologies such as denials and one day stays. The case mix changes for rate year 2011 will be calculated for the twelve month period April 1, 2010 through March 31, 2011 and applied to the Charge per Case Targets to determine the case mix adjusted Charge per Case for rate year 2011 compliance purposes. The results will be incorporated into the rate orders effective July 1, 2011 (FY 2012). Any technical implementation issues will be vetted with the MHA’s Financial Technical Issues Task Force. 6 - Outlier Methodology Under the current HSCRC high charge outlier methodology, a hospital-specific high charge outlier threshold is calculated for each APR/Severity cell. Charges above the established threshold are paid based on unit rates and not subject to the incentives of the HSCRC per case payment system. The G-9 hospitals proposed a change to the HSCRC outlier methodology to address the following issues that they cite as consequences of the current methodology:
- Hospital charges could be structured to increase outlier charge levels - Outlier patients are not protected by the financial incentives of the per case payment system - Compliance with HSCRC rate orders are complicated by the segregation of outlier charges in
compliance calculations The G-9’s proposed outlier methodology establishes a prospective allowance for outlier charges using a regression that is shown to predict each hospital’s percentage of outlier costs with substantial accuracy. The following independent variables are used from previous year’s data: the hospitals’ proportion of vent cases, the hospitals’ expected outlier proportion, and an AMC dummy variable. The result of the regression for each hospital would equal the hospital’s outlier allowance for the succeeding year. A hospital’s rate year CPC target would be increased by the prospective outlier allowance. In ROC comparisons, each hospital’s target would be adjusted for the amount of the prospective outlier charges. Although staff believes that certain aspects of the G-9 outlier proposal have merit, more study and deliberation is needed regarding this methodology. Recommendation: Staff recommends the continuation of the current outlier methodology in FY2011.

8
7 - Peer Groups The current peer group methodology uses 5 groups (based on size and location of hospital) for comparison including a virtual peer group for the Academic Medical Centers (AMCs). These peer groups were originally developed to adjust for differences in cost structures of hospitals which may not have been captured in the ROC adjustments used at that time. Because the Commission has implemented more refined adjustments for case-mix, labor market, and disproportionate share over the last several years, staff believes that this level of peer-grouping is no longer necessary. At the March Commission Meeting, staff proposed a move to three peer groups (major teaching, minor teaching, and non-teaching) based on the teaching intensity of the hospital as measured by residents per case-mix adjusted equivalent inpatient cases. In an ICC/ROC Workgroup meeting subsequent to the March recommendation, there was further discussion regarding the appropriate configuration of the two teaching peer groups. Because agreement was not reached regarding the appropriate division between major teaching and minor teaching, staff recommends that the current 5 peer groups be maintained. The payer representatives proposed that the Commission develop a national peer group for determination of reasonableness of charges for the Academic Medical Centers. Recommendation: Staff recommends some modifications of the current peer group methodology for the spring/summer 2010 ROC. The proposed modifications seek to form peer groups that compare teaching hospitals to teaching hospitals and non-teaching hospitals to non-teaching hospitals, where-ever possible. These proposed modifications to the peer groups are as follows: Unchanged Peer Groups: The State’s two Academic Medical Centers will continue to be grouped in the existing “virtual” peer group that includes the 2 AMCs plus other large, urban, teaching facilities. This group is labeled “Peer Group 4 – AMC Virtual.” The Urban and Urban teaching hospital group (which also includes Bon Secours hospital) will also remain unchanged. This group is no called, “Peer Group 3 – Urban Hospitals.” Changed Peer Groups: All non-teaching hospitals in the peer group previously referred to as Suburban and Rural Group 1 and smaller non-teaching hospitals (Atlantic General, McCready, Fort Washington, Memorial Easton, Dorchester and Chester River) previously in “Group 3,” shall be grouped together in a group now labeled Group 2 - Suburban/Rural Non-Teaching Group 2. One teaching hospital (Baltimore Washington Medical Center), previously in Suburban/Rural Group 2 will now be moved to Non-Urban Teaching Group 1. The ROC results (reflecting these recommended modifications) are shown in Appendix II. 8 - ROC Scaling and Spend-Downs At this time, staff recommends that the HSCRC not pursue spend-down arrangements with hospitals provided that the Commission approve a more aggressive ROC scaling methodology than has been applied in previous years. Scaling based on ROC rankings is an effective policy tool that rewards efficient hospitals (so called “stuck” hospitals – facilities that have been low on the ROC but otherwise unable to generate rate increases). Scaling also applies pressure to hospitals that have been high on the ROC. But the reductions that result from year-to-year scaling are less onerous than rate reductions applied to hospitals under spend-downs.

9
In the past, the HSCRC has scaled 0.5% of revenue (on a revenue neutral basis). Staff recommends that a significant portion of revenue be scaled for ROC position, and that the structure of scaling be continuous. The Payment Workgroup will ultimately decide the amount of revenue to be scaled. Staff also recommends that the Total Patient Revenue (TPR) hospitals (McCready and Garrett) be eligible for positive ROC scaling but would not be negatively scaled. Recommendation: Staff recommends that the amount of scaling for 2010 ROC results be significant and that the structure of the scaling be continuous. Staff also recommends that TPR hospitals should be eligible for positive scaling but not receive negative scaling based on ROC results. No spend-downs based on 2010 ROC results are recommended. If the Commission does not adopt a ROC scaling methodology that is more aggressive than what has been adopted in previous years, the staff would recommend the Commission initiate spend-down agreements with all hospital in excess of 3.0% above their peer group average. Other On-going Activity Physician Recruitment, Retention, and Coverage A subset of community hospitals, known as G-9, offered a review of the costs associated with providing physician subsidies for physician recruitment, retention and coverage costs at hospitals in non-urban areas. The G-9 hospitals proposed that the Commission consider defining reasonable recruitment, retention, and coverage expenditures as elements of regulated hospital cost and adjust for these costs in the ROC in a manner similar to the direct medical education adjustment. Because physician services are not regulated by the HSCRC, staff does not agree that physician subsidies associated with recruitment, retention, and coverage should be considered elements of cost which are adjusted for in the ROC. However, staff agrees that the issue of physician subsidies and the impact on community hospitals needs further study. Recommendation: Staff recommends no proposed adjustment in the ROC methodology associated with physician recruitment, retention, and coverage costs. Staff also recommends that a concerted study be initiated to better understand physician payments associated with physician recruitment, retention, and coverage at Maryland hospitals. Development of a Peer Group for Academic Medical Centers (AMCs) As noted, both the ROC and ICC methodologies contain a number of adjustments to hospital charges (case mix adjustment, labor market adjustment, direct strip, adjustment for Indirect Medical Education, etc.). These adjustments are necessary to ensure a fair comparison of hospital charges (the Commission has traditionally attempted to adjust for factors that influence hospital rates but that may be beyond the control of hospitals). The use of hospital peer groups (comparisons of hospitals that share similar characteristics) is another way the Commission has attempted to ensure a fair comparison of relative performance. This method of the use of extensive adjustments to hospital charges and peer group comparisons has worked well for the implementation of the ROC and ICC over time. However, the State’s two large Academic Medical Centers have consistently recommended that the HSCRC consider

10
the development of a national peer group of other AMCs outside of Maryland, as the basis of a ROC and ICC comparisons for Johns Hopkins Hospital and University of Maryland. It is argued that comparing the State’s two AMCs to other (non-AMC) teaching hospitals in Maryland does not adequately account for costs associated with the intensive teaching and research activities of AMCs. Recommendation: Staff recommends that the HSCRC begin to investigate the possibility of establishing a national peer group of AMCs outside of Maryland as the basis of comparison for Johns Hopkins Hospital and University of Maryland. This investigation will determine the feasibility of this proposal (i.e. identifying the existence of necessary cost data and data required for any necessary adjustments). If after this investigation staff believes the establishment of a national peer group is feasible, it will establish a Work Group to assist it in this exercise. Summary of Draft Recommendations for Changes to the ICC/ROC Methodology Peer Groups: Staff recommends no change to the Virtual and Urban Peer groups. Staff further recommendations the formation of a Suburban/Rural Non-Teaching Peer group and a Non-Urban Teaching Peer Group as described in the body of the Recommendation and shown in Appendix II. CPV in Blended CCT: Staff recommends that the CPV used in the 2010 ROC be established as follows: Calculate a CPV for each hospital by using FY2009 outpatient data under the expanded CPV methodology that had been in place for FY2010. Inflate the established CPV by each hospital’s outpatient rate update for FY2010 and blend the CPV and CPC targets to establish the CCT under the blending methodology approved last year. Application of IME and DSH Adjustment: Staff recommends the implementation of a technical correction to the IME and DSH adjustments that applies the adjustment as a direct strip instead of a deviation from the average statewide costs associated with IME and DSH. Capital: Staff recommends using a ten year phase-in to move from the current capital cost standard of 50% hospital-specific plus 50% statewide to 100% statewide plus 0.5%. CON eligible projects would be allowed 100% of variable costs for three years after first use if hospital pledges to not file a rate application or if hospital filed CON previously and did not file rate application and pledges not to file in future. Exclusions: Staff recommends that kidney transplant cases continue to be excluded from the CPC constraint system in FY2011 pending further review. Case-mix Lag: Staff recommends moving to a 3-month lag in the data period used to measure hospital case-mix. Outlier Methodology: Staff recommends the continuation of the current outlier methodology in FY2011.

11
Scaling and Spend-downs for 2010 ROC: Staff recommends that the amount of scaling for 2010 ROC results be significant and that the structure of the scaling be continuous. Staff also recommends that TPR hospitals should be eligible for positive scaling but not receive negative scaling based on ROC results. No spend-downs based on 2010 ROC results are recommended. Physician Recruitment, Retention, and Coverage: Staff recommends that a concerted study be initiated to better understand physician payments associated with physician recruitment, retention, and coverage at Maryland hospitals. Determining the Feasibility of Establishing a National Peer Group for AMCs: Staff recommendations it undertake an investigation of the feasibility of establishing a national peer group as the basis for the ROC and ICC comparison for Johns Hopkins and University of Maryland.
Appendix I

12
Summary of ICC/ROC Letters
The purpose of this document is to provide a brief overview of the issues addressed in letters submitted to the Commission June 1, 2009 regarding methodology issues to be discussed in the ICC/ROC Workgroup for the coming rate year. Peer Groups St. Joseph Medical Center requests that the current peer groups be replaced with a statewide comparison of hospitals. Atlantic General requests a change from the current peer groups to a statewide group or teaching/non-teaching groups. The hospitals in ‘G-9’ request that the current peer groups be considered for revision. CareFirst and Kaiser Permanente request that there be just two peer groups: 1) a statewide peer group excluding the Academic Medical Centers; and 2) a national peer group for Johns Hopkins Hospital and the University of Maryland Medical Center. MedStar Health and St. Agnes Hospital do not want peer groups eliminated but request that the current structure be reviewed to determine if the methodology meets the original goal. Outlier Methodology The Johns Hopkins Health System, University of MD Medical System, CareFirst and Kaiser request that the Commission staff revisit the outlier methodology to determine if the original objectives of this policy are being met and incentives are correct. G-9 hospitals believe that the low charge outliers system is unnecessary, and that the incentives related to the payment for high charge outliers exacerbate the problem of complying with the waiver and, therefore, they support a review of the outlier policy. Labor Market Adjustment The Johns Hopkins Health System, the University of MD Medical System, and MedStar Health request a systemic review of the policy as well as suggest that a more detailed review of submitted data be put in place to ensure that the data are reasonable. Disproportionate Share Adjustment MedStar Health and St. Agnes Hospital request that the current DSH adjustment be re-assessed in order to confirm the measure’s validity; to establish the stability over time; to understand if issues associated with urban locations are addressed; and to compare to possible alternatives. Direct Medical Education

13
The Johns Hopkins Health System and the University of Maryland Medical System request that the current methodology for calculating the direct strip for DME (based on costs reported in the P4 and P5 schedules) is re-assessed due to vague P4 & P5 instructions related to ACGME approved residents and fellows which results in inconsistent reporting across hospitals. Indirect Medical Education CareFirst and Kaiser request that any future adjustments to the IME coefficient be based on the Commission’s Update, and that the IME methodology be adjusted to support a greater amount of relative training of Primary Care Physicians who will provide care in Maryland. Physician Coverage The G-9 hospitals request that the differential accounting and treatment in ICC/ROC of the coverage costs at teaching hospitals (use of residents with costs carved out in DME adjustment) versus non-teaching hospitals (employed or subsidized attending staff costs not carved out) be addressed. Partial Rate Review for Capital and Full Rate Reviews CareFirst and Kaiser request that the partial rate process for capital be reviewed, and that the Commission consider transitioning to a statewide capital methodology that does not adjust rates for a hospital’s position in its capital cycle. The Johns Hopkins Health System and University of MD Medical System request that the partial rate process for capital be maintained; that a reasonable profit standard (2.75%) be included; and that productivity strips be eliminated from the partial rate and ICC methodologies. The G-9 hospitals request that the criteria governing partial and full rate applications be reviewed by the Workgroup. Scaling and Spend-Downs CareFirst and Kaiser request an increase in the level of scaling next year and that spend-downs are resumed no later than July 1, 2010. The G-9 hospitals request that the Workgroup review various approaches to scaling and spend-downs, including a discussion regarding the elimination of spend-downs. Clinic Volumes CareFirst and Kaiser request that clinic volumes, especially for multi-person behavioral health clinics, be reviewed. Non-Comparable Services

14
CareFirst and Kaiser request that the Workgroup discusses objective methods of identifying and evaluating the cost of a particular service when that service differs substantially at a particular hospital compared to the peer group. PPC Methodology The G-9 hospitals request that the Workgroup consider issues associated with the implementation of the PPC methodology. Case Mix Governor and Volume Adjustment The G-9 hospitals suggest that the case-mix governor, in combination with the volume adjustment, places an undue financial burden on hospitals with both case-mix and volume increases, and that consideration should be given to handling case-mix and volume through a single measure of the hospitals’ service level. MedStar Health requests that policy decisions that impact the ROC, such as the case-mix governor, be evaluated. Availability of Data MedStar Health, Johns Hopkins Health System, and the University of MD Medical System request that future reports, such as those pertaining to the ROC and UCC, include the data used by staff to conduct its calculations and that a two-week comment period be implemented to allow hospitals the opportunity to correct the data in the event that errors are present. Prospective Payment and System Stability St. Joseph Medical Center, the Johns Hopkins Health System and the University of MD Medical System state that certain policies, such as case-mix restrictions without clear prospective rules for how case-mix will be accrued, undermine the prospective nature of the Maryland system. These hospitals also state that constant change in the system, such as revisions to the CPV to include more revenue or the proposed implementation of the PPC methodology, undermine the stability of the system.

Staff Recommendation
Request by the Medical Assistance Program to Modify the Calculation
of Current Financing Deposits for FY 2011
November 3, 2010

Introduction The Medical Assistance Program (MAP) has been providing working capital advance monies (current financing) to hospitals for many years. As a result, MAP receives the prompt pay discount as per COMAR 10.37.10.26(B). MAP is unique among third-party payers in that it is a governmentally funded program that covers qualified poor residents of Maryland. As such, it deals, to a large extent, with retroactive coverage. Recognizing the uniqueness of MAP, the Commission allowed MAP to negotiate a special formula with the hospital industry to calculate its fair share of current financing monies. The Commission approved this alternative method of calculating current financing at its February 1, 1995 public meeting. Currently, MAP has approximately $96.3 million in current financing on deposit with Maryland hospitals. As a result of the budget crisis, MAP submitted a request on December 19, 2008 that the Commission approve an exception to the requirement that the amount of current financing on deposit with hospitals be re-calculated annually. MAP requested that for one year, FY 2009, the amount of current financing monies on deposit with Maryland for FY 2008 remain unchanged. In its request, MAP stated that it intended to re-institute the annual re-calculation of current financing for FY 2010. The MAP request was approved by the Commission at its January 14, 2009 public meeting. Because of the continuing budget crisis, MAP submitted a request on February 5, 2010 for modifying the calculation formula. MAP requested that rather than using the approved calculation, which would provide an additional $29.8 million to the $85 million current financing now on deposit with hospitals, a modified calculation be approved for FY 2010 that would only provide an additional $11.3 million. MAP reported that it met with representatives of the Maryland Hospital Association (MHA) on January 8, 2010 to outline its proposed modified calculation. At the meeting, MAP also committed to work with MHA’s Financial Technical Issues Task Force to review the existent current financing formula with the objective of improving the methodology before the FY 2011calculation. MAP’s Current Request In its request, MAP reported that it had met with representatives of MHA several times during 2010, and they have collectively concluded that any change to the formula would have significant and varying impacts on individual hospitals. Given the continuing State budget constraints, some hospitals could lose much of their current financing deposits. Therefore, they proposed that rather than adopting a new formula, the FY 2011 Medicaid current financing amounts for each hospital be its FY 2010 total increased by the final update factor as calculated by the HSCRC for the current rate setting year. MAP also proposed that changes in the current financing formula be delayed until it replaces its computer system, and its new claims system has been implemented and evaluated. Staff Recommendation

Based on the current condition of the economy and its effect on MAP=s budget, staff recommends that the Commission approve MAP=s request with the stipulation that MAP be required to report annually, at the Commission’s November public meeting, on the status of implementation of its new claims system and, if necessary, to apply for continuation of the application of the HSCRC’s update factor to hospital current financing deposits. In addition, staff recommends that the Commission direct MAP and MHA to begin development of a permanent current financing methodology for approval by the Commission for calculating current financing deposits for the first full fiscal year after MAP’s new claims system has been implemented. .

1
Draft Staff Recommendation on Rate Methods and Financial Incentives relating to Reducing Maryland Hospital Preventable Readmissions
(MHPRs)
Health Services Cost Review Commission
October 27, 2010
This document represents a revised draft recommendation to be presented to the Commission on November 3, 2010.

2
1.0 - Background
Inpatient hospitalizations are one of the most costly categories of health care costs in the United States accounting for between 20-25% percent of total health care expenditures.1 The Institute of Medicine has estimated that approximately 3% of US hospitalizations result in adverse events, and almost 100,000 patients die annually due to medical errors.2
Until recently, there has been limited information on the frequency and pattern of hospital readmissions and little ability to appropriately link hospital performance to payment in a responsible and meaningful way. Also, standard prospective payment systems, such as Medicare’s Inpatient Prospective Payment System (IPPS) or Maryland’s Charge per Case system (CPC) fail to provide incentives for hospitals to appropriately control the frequency of readmissions. Although the HSCRC incorporated a volume-related payment adjustment in 2008, there are few financial incentives for hospitals to invest in the necessary infrastructure to reduce unnecessary readmissions by reducing medical errors during the inpatient stay (that may lead to a repeat admission) or more actively cooperate with other providers to improve coordination of care post discharge.
Reducing rates of hospital readmissions has, thus, attracted considerable attention from policy-makers as a way of improving quality and reducing costs.
Cost Implications of Readmissions and Wide Variation of Readmission Performance
In the Medicare program, inpatient care accounts for 37 percent of spending, 3 and readmissions contribute significantly to that cost: 18 percent of all Medicare patients discharged from the hospital have a readmission within 30 days of discharge, accounting for $15 billion in spending.4
In Maryland, the rate of readmissions is based on analysis of 2007 readmission data using the Potentially Preventable Readmissions (PPR) methodology:
• The top performing hospitals had risk/severity adjusted 15-day rates of readmission just below 4%
• The bottom performing hospitals had risk/severity adjusted 15-day rates of readmission just above 8%
• The 15-day readmission rate overall was 6.74% • The 30-day readmission rate overall was 9.81% • For readmissions in 15 days, there were $430.4 million (5.3%) estimated associated charges • For readmissions in 30 days, there were $656.9 million (8.0%) estimated associated charges
1 Catlin, A. et al. “National Health Spending in 2006: A Year of Change for Prescription Drugs,” Health Affairs, January/February 2008, Vol. 27, No. 1, pp. 14-29. 2 To Err is Human, The Institute of Medicine, November, 1999. 3 Medicare Payment Advisory Commission. 2006. Healthcare Spending and the Medicare Program: A Data Book. Washington DC: Medicare Payment Advisory Commission, p.9. 4 Medicare Payment Advisory Commission. 2007. Report to the Congress: Promoting Greater Efficiency in Medicare. Washington, DC: Medicare Payment Advisory Commission, p. 103.

3
According to a recent national study on readmissions of Medicare patients, Maryland appeared to have the second highest readmission rate (22%) of any jurisdiction in the U.S., with the District of Columbia at 23.2% (see Appendix I for a copy of this article and analysis).5
Factors Contributing to Unnecessary Readmissions
Multiple factors contribute to the high level of hospital readmissions in the U.S. generally and in Maryland in particular. They may result from poor quality care or from poor transitions between different providers and care settings. Such readmissions may occur if patients are discharged from hospitals or other health care settings prematurely; if they are discharged to inappropriate settings; or if they do not receive adequate information or resources to ensure a continued progression of services. System factors, such as poorly coordinated care and incomplete communication and information exchange between inpatient and community-based providers, may also lead to unplanned readmissions.
Hospital readmissions may also adversely impact payer and provider costs and patient morale. Some hypothesized in the 1980s that Medicare’s implementation of IPPS would encourage physicians to discharge patients “sicker and quicker.” That did not turn out to be a significant problem for the quality of inpatient care; yet, patients were discharged earlier, which may theoretically increase the risk of readmissions, resulting in greater costs to payers. Moreover, preliminary analysis suggests that the majority of readmissions are for medical services rather than surgical procedures, suggesting that hospital readmissions may not be profitable to hospitals.6
Reducing readmissions, then, represents a unique opportunity for policymakers, payers, and providers to reduce health care costs while increasing the quality of patient care. Identifying best practices and policy levers to reduce avoidable readmissions would likely improve quality, reduce unnecessary health care utilization and costs, promote patient-centered care, and increase value in the health care system. Moreover, as some individuals are at greater risk of readmissions as a result of individual characteristics, care coordination efforts that reduce hospital readmissions may help eliminate disparities in health care.
Clearly, there is an urgent need at both a state and national level to develop a set of payment reforms that can provide strong financial incentives for hospitals to reduce their rates of Potentially Preventable Readmissions (PPRs).7
5 Jenks SF, Williams MV, Coleman EA, Rehospitalizations among Patients in the Medicare Fee-for-Service Program. New England Journal of Medicine. 360:1418-28, April 2, 2009.
The increasing focus in linking payment and quality (i.e., the
6 Interviews with Stephen F. Jencks, M.D., M.P.H., Mark V. Williams, M.D. and Eric A. Coleman, M.D., M.P.H. May 2005. 7 Potentially Preventable Readmissions (PPRs) represent a categorical model developed by 3M Health Information Systems which categorizes and identifies return hospitalizations that may have resulted from the process of care and treatment or lack of post admission follow-up rather than unrelated events that occur post discharge.

4
overall value of the care provided) is motivated by the dramatic escalation in health care costs and the past inability of policymakers to measure and compare health outcomes.
If readmission rates are to serve as an overall measure of both quality and cost, it is necessary to apply an analytic approach that focuses on those readmissions that could have potentially been prevented. As the nation’s only “All-Payer” rate setting system, and with its current use of the highly sophisticated All-Payer-Refined Diagnostic Related Grouping risk-adjustment and case mix classification system (APR-DRGs), the Maryland hospital payment system is uniquely positioned to make use of these readmission measurement systems and link relative hospital performance to financial incentives in a meaningful and productive way.
The following recommendation is intended to describe an approach for incorporating such a system of incentives into the Maryland hospital “All-Payer” payment system beginning in FY 2011.
2.0 - Using Payment Incentives to Reduce Unnecessary Readmissions in Maryland
Basic Principles for the Establishment of Payment Incentives
In developing its method for the incorporation of payment incentives for hospitals to reduce unnecessary readmissions, the HSCRC first identified a set of basic principles to help guide the Commission’s overall effort.
1) Fairness in Measurement: First, there should be a focus on the development of appropriate adjustment factors to take into account systematic and less-controllable issues and factors that influence readmission rates that all hospitals may experience. Factors that were found to significantly influence readmission rates include age, the presence of mental health and substance abuse secondary diagnoses, disproportionate share effects (Medicaid status), and hospital location (hospitals near the state border will naturally have a higher proportion of their patients readmitted to hospitals outside of Maryland).
2) Broad Level of Applicability and Fairness in the Application of Rewards and Penalties: As the HSCRC learned during the course of development of its Maryland Hospital Acquired Conditions (MHACs) initiative, basing payment rewards and penalties on a hospital’s relative rate of performance avoids problems generated by a focus on individual cases. Since readmissions are often the result of problems in the care processes relating to coordination and communication between hospitals and post-discharge care providers, a focus on systematic differences in readmission rates across hospitals (comparison of actual readmission rates relative to expected readmission rates by hospital) is appropriate and allows for a much broader level of application. However, a reward/penalty system that applies only to relative hospital performance in a given year does not address year to year changes in individual hospital readmission rates. The Commission may wish to consider the

5
application of a hybrid system of rewards and penalties, focusing both on relative hospital performance and year to year changes in hospital performance.
3) Prospective Application: During the process of the MHAC development, the HSCRC also realized the importance of prospective application of payment incentive programs linked to quality improvement. Individual hospital PPR rates should be compared to expected PPR rates (risk adjusted), and established targets should be set from a previous year so they are known in advance.
4) Emphasis on Infrastructure Development to Assist Hospitals in Reducing PPRs: A substantial effort should be made to facilitate hospitals’ development of infrastructure and knowledge regarding best PPR-reducing mechanisms/strategies. The HSCRC and other entities (the Hospital Association - as demonstrated in states like Florida) can play a vital role in providing infrastructure support to hospitals to help them identify and implement best practices associated with readmission reduction.
5) Appropriate Level of Financial Incentive: Another important realization from the MHAC policy development process was the need to arrive at an appropriate level of financial risk for providers when establishing the link between provider payment and performance. For MHACs, the Commission decided to place hospitals under only a moderate level of risk in the early stages of the initiative. This was because the HSCRC wanted to give hospitals sufficient time to understand the methodology and make use of the available data tools to analyze their performance and put in place the clinical and operational changes necessary to improve performance.
The same arguments also apply to the introduction of payment incentives related to reducing PPRs. However, unlike MHACs, the incentives for reducing readmissions must take into consideration the significant counter-incentives the hospital will face in lost revenue from fewer readmissions. Eventually, the amount of revenue at risk for reducing PPRs must be sufficiently large to counterbalance loss of revenue due to reduced readmissions.
3.0 - Maryland Uniquely Positioned to Link Payment to Reduced Readmissions
Given the HSCRC’s use of and experience with the APR-DRGs mechanism for both risk adjustment and revenue constraint, it is natural that the HSCRC might wish to consider the use of a complementary tool (Potentially Preventable Readmissions) as the basis for linking payment to performance related to the reduction of Maryland hospital readmissions. APR-DRGs and PPRs are products of 3M Health Information Systems and have been used in a number of other jurisdictions to measure and monitor rates of preventable hospital readmissions rates.
The following sections briefly identify and define the key components and steps involved in the application of the PPR methodology to measure relative hospital performance on their ability to reduce preventable readmissions.

6
Potentially Preventable Readmissions and PPR Logic
A Potentially Preventable Readmission is a readmission (return visit to a hospital within a specified period of time) that is clinically-related to an Initial Hospital Admission. For readmissions to be “Clinically-Related” to an initial admission, it is necessary that the underlying reason for readmission be plausibly related to the care rendered during or immediately following a prior hospital admission.
A clinically-related readmission may have resulted from the process of care and treatment during the prior admission (e.g., readmission for a surgical wound infection) or from a lack of post admission follow up (lack of follow-up arrangements with a primary care physician) rather than from unrelated events that occurred after the prior admission (broken leg due to a car accident) within a specified readmission window.
The Readmission Window (sometimes also referred to as the Readmission Interval) is the maximum number of days allowed between the discharge date of a prior admission and the admit date of a subsequent admission in order for the subsequent admission to be a readmission. Readmission analyses have traditionally focused on 30, 15, and 7 day readmission windows.
The Initial Admission is an admission that is followed by a clinically-related readmission within the specified readmission window. Subsequent readmissions relate back to the care rendered during or following the Initial Admission. The Initial Admission initiates a “Readmission Chain.”
Readmission Chains are a sequence of PPRs that are all clinically-related to the Initial Admission. A readmission chain may contain an Initial Admission and only one PPR, which is the most common situation, or may contain multiple PPRs following the Initial Admission. In addition to the “clinically-related” PPR APR-DRGs matrix, all readmissions with a principal diagnosis of trauma are considered not potentially preventable.
Use of APR-DRGs
Under this approach, APR-DRGs can be used as the basis for establishing the clinic relationship between the Initial Admission and the Readmission. In developing the PPR logic, a matrix was created in which there were 314 rows representing the possible base APR-DRGs of the Initial Admission, and 314 columns representing the base APR-DRGs of the readmission. Each cell in the matrix then represented a unique combination of a specific type of Initial Admission and readmission. Clinical panels applied criteria for clinical relevance and preventability to the combination of base APR-DRGs and each cell. The end result was that each of the 98,596 cells contain a specification of whether the combination of the base APR-DRGs for the Initial Admission and for the readmission were clinically-related, and, therefore, potentially preventable. This matrix operationalized the definition of “clinically-related” in the PPR logic.

7
Exclusions and Non-Events
There are certain circumstances in which a readmission cannot be considered potentially preventable. Some types of admissions require follow-up care that is intrinsically clinically-complex and extensive, and for which preventability is difficult to assess. For these reasons, admissions for major or metastatic malignancies, multiple trauma, and burns are not considered preventable and are globally excluded as an Initial Admission or readmission.
A second type of global exclusion relates to the discharge status of the patient in the Initial Admission. A hospitalization with a discharge status of “left against medical advice” is excluded as either an Initial Admission or readmission because under these circumstances, the hospital has limited influence on the care rendered to the patient. All types of globally-excluded admissions are classified as Excluded Admissions.
The following admissions are classified as Non-events: admissions to non-acute care facilities; Admissions to an acute care hospital for patients assigned to the base APR-DRG for rehabilitation, aftercare, and convalescence; Same-day transfers to an acute care hospital for non-acute care (e.g., hospice care).
Readmission Rates
The 3M PPR Grouper Software classifies each hospital admission as a PPR, Initial Admission, Transfer Admission, Non-event, Excluded Admission, or an Only Admission. The output from the PPR Grouper software can be used to compute PPR rates by computing the ratio of the number of PPR chains divided by the sum of admissions classified as an Initial Admission or an Only Admission.
Non-events, Transfer Admissions, Only Admissions that died, and Excluded Admissions are ignored in the computation of a PPR rate. PPR rates can be computed for readmission to any hospital or can be limited to readmissions to the same hospital only.
Since a hospital PPR rate can be influenced by a hospital’s mix of patient types and patient severity of illness during the Initial Admission, any comparison of PPR rates must be adjusted for case mix and severity of illness. A risk adjustment system such as APR-DRGs is necessary for proper comparisons of readmission rates. As discussed, higher than expected readmission rates can be an indicator of quality of care problems during the initial hospital stay or of the coordination of care between inpatient and outpatient settings.

8
Summary of PPR Logic
A readmission that is clinically-related to the prior Initial Admission or clinically-related to the Initial Admission in a readmission chain is a Potentially Preventable Readmission. A higher than expected rate of PPRs means that the readmissions could reasonably have been prevented through any of the following:
1) provision of quality care in the initial hospitalization;
2) adequate discharge planning;
3) adequate post discharge follow-up; and
4) coordination between the inpatient and outpatient health care team.
The end result of the application of the PPR logic is the identification of the subset of Initial Admissions that were followed by PPRs. Admissions that are at risk for having a readmission but were not followed by a subsequent readmission (such as Only Admissions) are also identified by the logic. The identification of Initial Admissions, PPRs, and at-risk Only Admissions allows meaningful PPR rates to be computed. A description of the PPR logic with definition of terms and concepts is provided in Appendix II to this recommendation.
4.0 – Primary Considerations in Deciding on a Payment Model
Evaluating Readmissions to the Same Hospital or All Hospitals?
The first question that should be addressed is whether to focus on readmissions to the same hospital that treated the initial admission or to evaluate readmissions to all hospitals. Using only readmissions to the same hospital (“intra-hospital admissions”) would capture most of the readmissions, and not require extensive additional risk-adjustments (given that the profile of a hospital’s patient population--age, mental health and indigent mix-- would likely be relatively stable from year to year). A focus on readmissions to the same hospital would also avoid most of the problems associated with attempting to track unique patients across different institutions and also encourage hospitals to improve their absolute rate of intra-hospital readmissions year to year. However, focus exclusively on intra-hospital readmissions does not capture patients who were so dissatisfied with the initial treatment that they decided to go to a different hospital. Using admissions to all hospitals (“inter-hospital” readmissions) is clearly a more comprehensive approach. In analyzing intra- and inter-hospital readmission rates, staff has identified patient-level data concerns that hinder the accurate tracking of patients over time within the same hospital, and

9
technical difficulties greater still across all hospitals. These concerns and technical difficulties encountered are discussed in the section below entitled Challenges to and Alternatives for Tracking Patients Within and Across Hospitals.
Challenges to and Alternatives for Tracking Patients Within and Across Hospitals
As noted above, data challenges have been identified and are a barrier to accurately tracking patient readmissions within and across hospitals, ultimately causing a delay in the implementation of the
MHPR initiative in 2010.
Within Hospital Data Issues
To calculate intra-hospital (within the same hospital) readmission rates staff ran the PPR grouper on data using the assigned medical record number (MRN) to match patients over time. Concurrent with the running of the grouper, staff learned that hospitals were not consistently assigning a unique MRN that is constant over time in compliance with HSCRC inpatient and outpatient data submission requirements. Multiple MRN assignments cause readmissions rates to be under-represented and render hospital specific rates inaccurate.
Across Hospital Data Issues
Since there is no unique identifier (ID) assigned for Maryland hospitalized patients, staff has developed a method for assigning unique IDs for matching patients across hospitals who are readmitted using a probabilistic matching approach. The core premise of the algorithm used is to identify unique patients and assign unique IDs to patients with the same gender, date of birth and zip code who are hospitalized within the window of time specified in the MHPR policy (e.g., 30 days).
To further validate the algorithm, the aggregate results yielded from the matching algorithm have been compared with patient matching results from Florida where a unique patient ID is used, and Maryland estimates of aggregate readmission rates fit within the expected relationships of statewide within vs. across hospital readmissions, total readmission rates, and differences by payer. Although these errors do not appear to disproportionately affect one group/class of hospitals over another, staff continues to have the following concerns:
• based on data analysis, the algorithm produces false negative (an individual patient is incorrectly assigned more than one ID) and false positive (different patients are incorrectly assigned the same unique ID) results;
• the data errors are further amplified to the extent that hospitals have assigned multiple MRNs to a unique patient, and have errors in the patients’ dates of birth (DOB), and zip code;
• the patient-level case mix data submitted to HSCRC by hospitals does not, staff believe, contain a sufficient amount of patient identifying information (e.g., last four digits of SSN, first

10
name, last name, etc.) to construct an algorithm that diminishes false negatives and false positives sufficiently to calculate statistically accurate hospital-specific readmission rates.
Out of State Data Issues Comparable data are not available for admissions out-of-state. As mentioned, failure to account for out-of-state readmissions would reduce the readmission rates for hospitals located close to the border with other states or for hospitals such as large academic centers that draw larger percentages of out-of-state patients for initial treatment who may be readmitted in their home states.
Staff Efforts to Address Identified Data Issues
To address multiple MRN assignments to unique individuals for FY 2010:
• Staff issued a memorandum to hospitals on 5/24/10 advising hospitals of the MRN error and directing hospitals to identify those patients with changed MRNs to HSCRC by 9/28/10, consistent with the final closing date for submission of the Qtr 4 of the case mix data.
• Hospitals were directed to identify patients for whom they purposefully changed the MRN (e.g., changing a social security number MRN to a number that does not contain patient identifying information) and for those whom they inadvertently assigned more than one MRN (e.g., the registration clerk did not identify the MRN previously assigned when the patient presents for care and assigns a new MRN, but the billing department reconciles the patient identity in the patient accounts system).
• Thus far, the results of the MRN data cleaning work are promising, however, certain hospitals still have high duplicate MRNs despite the improvement. Overall, the percentage of MRNs with the same date of birth, sex, and zip code declined by 2.12 as a result of the cleaning process; staff is working on creating an algorithm to link the patient records across the hospitals based on the new MRN data.
• Staff is continuing to work on establishing data mismatch thresholds to identify hospitals likely to have more than an acceptable number of unique patients with multiple MRNs assigned.
Regarding the across hospital readmission data concerns, staff has worked over the last several months to identifying best practices in constructing unique patient IDs and on considering what options are plausible in Maryland. Staff interviewed 15 states that use statewide unique patient ID numbers. Staff has also discussed with AHRQ Maryland’s interest in participating as one of ten states in an AHRQ technical assistance effort to support states in developing unique statewide patient IDs. If an algorithm cannot be constructed in the near term to identify patients such that the PPR grouper yields accurate hospitals-specific readmission rates across hospitals, a potential approach to address this is through the use of other comprehensive data that account for admissions and readmissions across hospitals in Maryland (see section entitled “Medicare and BlueCross Adjustment Factors” on Page 14).

11
To address the out of state readmission issue, staff again proposes the use of other comprehensive data that account for admissions and readmissions both in and out of Maryland (see section entitled “Medicare and BlueCross Adjustment Factors” on Page 14).
Additional Adjustment Considerations If the Commission is to use an analysis that ranks hospitals on the basis of relative rates of readmissions within a given year, it will need to apply a series of adjustments for variations in the rate of potentially preventable readmissions among hospitals. The rate of readmissions would be calculated using the PPR software developed by 3M, with additional adjustments that are described in this section. It would be appropriate to adjust for differences in age, mental health status, and Medicaid status, which have been found to be substantially correlated with the case mix adjusted readmission rate. Finally readmission rates should also be adjusted to reflect readmissions from Maryland hospitals to facilities outside of the State. This latter adjustment is necessary to account fairly for the natural outmigration of patients from Maryland hospitals located near the Maryland border. Failure to adjust for this outmigration would unfairly advantage Maryland hospitals in the Metropolitan DC area and other border areas of the State.
Calculation of Chain Weights
Previous PPR calculations were based on the number of readmissions, with all readmissions weighted equally. Clearly the costs associated with readmissions will vary by the type of initial admission. The calculation described in this section modifies the calculation of the relative PPR rates of the hospitals to take into account the chain weights as well as mix of initial admissions in chains by APR-DRG and Severity of illness (SOI).
The APR-DRG and SOI output by the PPR grouper are the standard ones, and not the groupings as modified by the HSCRC to split the mental health admissions based on voluntary/involuntary, and the splitting of the rehabilitation APR-DRGs. The weights developed for the HSCRC APR-DRGs were consolidated to produce weights that would be applicable to the standard APR-DRGs.
The weight for a re-admission chain was calculated by summing the APR-DRG/SOI weights for each readmission in the chain (not including the initial admission). These weights were then assigned to all readmission chains as the "actual" weight for the chain. The chain weights were then summarized by calculating the mean chain weight for all chains following an initial or only admission in a given APR-DRG/SOI. The resulting weight is the expected weight for readmissions following the initial or only admission in the particular APR-DRG/SOI. The rankings were then recalculated using these weights.

12
Options for Level of Adjustment to be Applied
1) Option 1 is to simply use the PPR rates themselves (counts of actual vs. expected readmissions). This is what has been presented in previous meetings.
2) Option 2 attempts to factor in the relative costliness of readmissions that follow an initial admission. As such it is most analogous to the MHAC methodology utilized by the Commission when attempting to differentiate hospital performance on the basis of Potentially Preventable Complications. In this instance, the PPR rate would be weighted by the expected weight associated with chains starting with the particular APR-DRG/SOI in the initial admission. This is the method used in the preceding discussion.
3) Option 3 would carry this logic of weighting the readmission chain by the actual weights of each readmission chain. In this option the PPR rate would be adjusted to account for the actual weight of readmissions in the subsequent chain.
4) Option 4, uses the Option 3 approach, but with some outlier threshold applied to limit the weight for which the initial hospital was accountable.
Each of the subsequent options beyond Option 1, are an attempt to refine the PPR rate analysis to make it fairer to individual hospitals and also to be a more accurate representation of actual and preventable additional resource use associated with preventable readmissions.
The HSCRC staff believes that Option 2 is the best compromise between accuracy and simplicity, and because it is the most consistent with the way in which the PPC calculations are being done. The following examples of each of these options should make them clearer. An expanded discussion of the four readmission chain weight options and the formulae for calculation of chain weights, and actual and expected values are shown in Appendix II.
Additional Adjustments Required
The following analysis used option 2 above for weighting purposes, data for fiscal years 2008 and 2009, the version 27.0 of the PPR grouper, and focused on readmissions within a 30-day readmission window. A longer readmission window would provide a more comprehensive approach to this analysis – as it captures cases that are potentially preventable but do not present immediately to hospitals in the form of a readmission.
PPR rates, adjusted by the weights of the readmission chains, were calculated by APR-DRG/SOI (risk adjusted) using the entire data set for both years. These statewide readmission rates were then used as the expected values in the analysis.

13
Adjustment for Age Category and Mental Health Status The actual to expected, chain weight adjusted, PPR rates were calculated by age category and mental health status, and the ratio of the two was used as an adjustment factor for age category and mental health status. The age categories used were 0-17, 18-64, and 65 and older. The adjustment factors were as follows in Table 1:
Table 1 – Adjustment Factors for Age, Mental Health/Substance Abuse Secondary Diagnosis, and
Medicaid Presence
Age category Mental health diagnosis Calculated factor
0 – 17 No 0.73
0 – 17* Yes 0.73
18 – 64 No 0.95
18 – 64 Yes 1.05
65 and older No 1.05
65 and older Yes 1.07
* There are a small number of cases in age category 0 with positive mental health status, so the difference between the values is not
significant. A combined factor of 0.73 should be used for all age category 0 cases independent of mental health status.
Adjustment for Medicaid as Primary of Secondary Payer
A chain was determined to be a Medicaid count if the principal or secondary payer was Medicaid or Medicaid HMO for any discharge for that patient in the data set. Using this definition of Medicaid, the Medicaid patients were found to have a substantially higher PPR rate than non-Medicaid patients. The adjustment factor for Medicaid was 1.188, and for non-Medicaid was 0.937 – a 25% difference. Given these results, adjustments should be made for age category, mental health status, and the patient's Medicaid status.

14
For patients with Medicaid as primary or secondary payer anywhere in the chain of readmissions, there was a significantly higher actual rate compared to the expected rate of readmissions than was explained solely by the APR DRG SOI category.
Medicare and Blue Cross Adjustment factors
In order to adjust for out-of-state readmissions, which would be expected to be higher for hospitals close to borders with other states, Medicare data was obtained for federal fiscal years 2007 and 2008.
The rate of PPRs was calculated by hospital, along with the expected rate using the statewide expected rates developed previously using all payers, and the age and mental health adjustment factors previously listed. The ratio of the actual to the expected was calculated by hospital, first using discharges to hospitals in any state, and then using just discharges from Maryland hospitals. The ratio of these two was the adjustment factor to be applied to adjust for out-of-state Medicare readmissions.
Staff also secured similar multi-state data from CareFirst Blue Cross of Maryland. This readmission factor calculated for Medicare data will be combined with the corresponding factor developed by Blue Cross to calculate an estimated adjustment factor for out-of-state readmissions.
For a majority of hospitals, the out of state readmission rates across the Medicare and CareFirst data were very consistent. In the case of a few hospitals, there are inconsistencies between the Medicare and CareFirst migration adjustment factors calculated. It may be necessary, therefore, to calculate an alternative out-of-state adjustment factor for these hospitals. Staff continues to work with the Department of Health and Mental Hygiene to develop a clean data set sufficient to calculate similar cross-state readmission rates from the Medicaid data. Thus far, it has not been possible to develop a similar adjustment using Medicaid data.
Staff can use the above-outlined methodology to calculate inter-hospital readmission rates within the state if an alternative to using HSCRC data is necessary in the short term, and will continue to work on these and other outstanding technical issues, but we believe that the data for out-of-state readmission rates will be sufficient to establish meaningful adjustment factors to allow for a fair and reasonable comparison across hospitals.
Proposed Payment Methodology
Staff believes that the first phase of a PPR-based payment policy in Maryland can be implemented with a structure similar to the payment structure used in linking payment to performance for MHACs and the Quality-Based Reimbursement (QBR) initiatives. This means that PPR payment would be structured by scaling a magnitude of at-risk system revenue, either positive or negative, across all hospitals at the time of the application of the annual update factor (in the case of MHACs, this
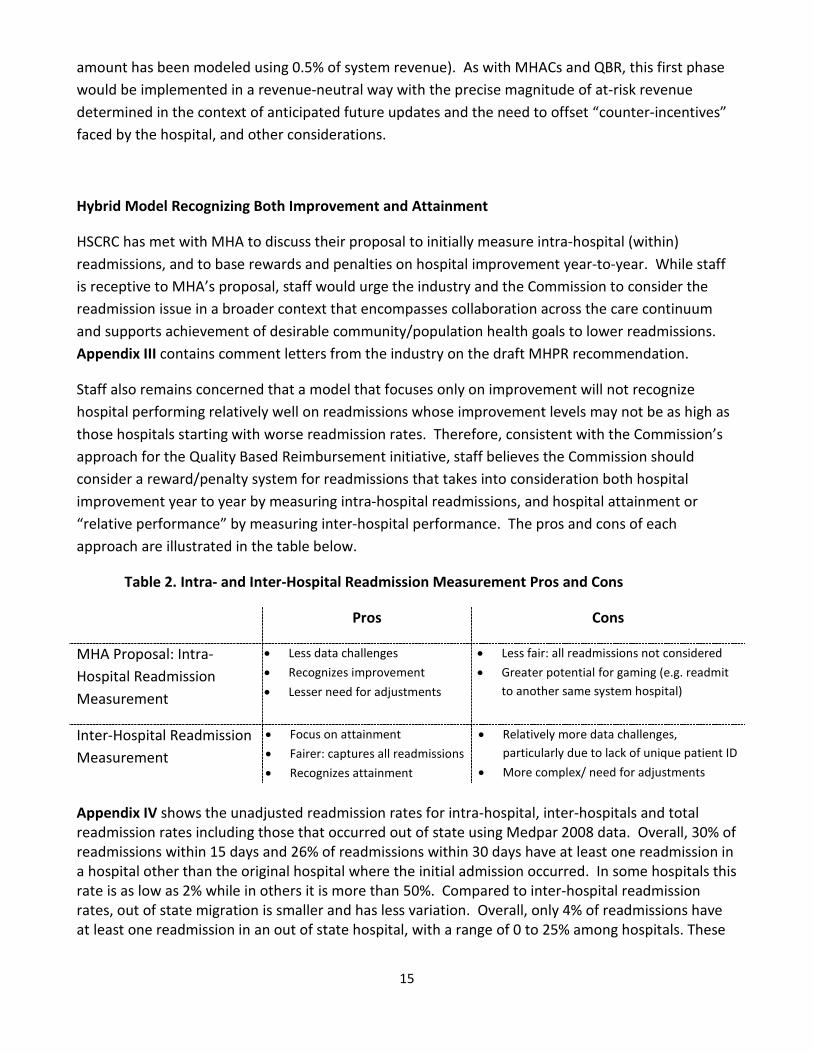
15
amount has been modeled using 0.5% of system revenue). As with MHACs and QBR, this first phase would be implemented in a revenue-neutral way with the precise magnitude of at-risk revenue determined in the context of anticipated future updates and the need to offset “counter-incentives” faced by the hospital, and other considerations.
Hybrid Model Recognizing Both Improvement and Attainment
HSCRC has met with MHA to discuss their proposal to initially measure intra-hospital (within) readmissions, and to base rewards and penalties on hospital improvement year-to-year. While staff is receptive to MHA’s proposal, staff would urge the industry and the Commission to consider the readmission issue in a broader context that encompasses collaboration across the care continuum and supports achievement of desirable community/population health goals to lower readmissions. Appendix III contains comment letters from the industry on the draft MHPR recommendation.
Staff also remains concerned that a model that focuses only on improvement will not recognize hospital performing relatively well on readmissions whose improvement levels may not be as high as those hospitals starting with worse readmission rates. Therefore, consistent with the Commission’s approach for the Quality Based Reimbursement initiative, staff believes the Commission should consider a reward/penalty system for readmissions that takes into consideration both hospital improvement year to year by measuring intra-hospital readmissions, and hospital attainment or “relative performance” by measuring inter-hospital performance. The pros and cons of each approach are illustrated in the table below.
Table 2. Intra- and Inter-Hospital Readmission Measurement Pros and Cons
Pros Cons
MHA Proposal: Intra-Hospital Readmission Measurement
• Less data challenges
• Recognizes improvement
• Lesser need for adjustments
• Less fair: all readmissions not considered
• Greater potential for gaming (e.g. readmit to another same system hospital)
Inter-Hospital Readmission Measurement
• Focus on attainment
• Fairer: captures all readmissions
• Recognizes attainment
• Relatively more data challenges, particularly due to lack of unique patient ID
• More complex/ need for adjustments
Appendix IV shows the unadjusted readmission rates for intra-hospital, inter-hospitals and total readmission rates including those that occurred out of state using Medpar 2008 data. Overall, 30% of readmissions within 15 days and 26% of readmissions within 30 days have at least one readmission in a hospital other than the original hospital where the initial admission occurred. In some hospitals this rate is as low as 2% while in others it is more than 50%. Compared to inter-hospital readmission rates, out of state migration is smaller and has less variation. Overall, only 4% of readmissions have at least one readmission in an out of state hospital, with a range of 0 to 25% among hospitals. These

16
data illustrate the need to include inter-hospital readmission rates as well as out of state adjustments in measuring hospital relative performance.
Timing Considerations Related to Base and Performance Measurement Periods
MHA and HSCRC staff agrees that it is of great import that we implement the MHPR initiative during the current fiscal year if it is technically possible to do so. Implementation of this initiative by January 1, 2011 necessitates that the initial measurement period begin this year starting December 1 using six months of performance. As the measurement period would be 12/1/10 to 6/30/11 (with one month additional in order to capture readmissions from the end of each period during the course of the 15-day readmission window), and the base period would be the same period the previous year, this would constitute overlap with the base and measurement periods recommended for the first full fiscal year. HSCRC staff will continue to work with the industry to identify and address the issues and implications of these potentially overlapping periods.
Infrastructure Development Considerations
The HSCRC staff believe it will be extremely appropriate and helpful to the MHPR initiative for the HSCRC to assist in the development of a MHPR Improvement Infrastructure to assist hospitals in their attempt to improve upon the processes of transitioning patients out of the hospital after an admission and otherwise decreasing the rates of readmission within the targeted Readmission Window (currently recommended to be 30 days post initial discharge).
The staff intends to recommend an approach that would at first be funded by means of a small assessment on hospital rates (0.01% is anticipated – generating approximately $1 -1.2 million per year for at least the first two years). These funds are proposed to be used to obtain the technical assistance the state would need to establish an infrastructure using the Institute for Healthcare Improvement’s STate Action on Avoidable Rehospitalizations (STAAR) approach.
STAAR Overview
In May 2009, the Institute for Healthcare Improvement (IHI) launched STate Action on Avoidable Rehospitalizations (STAAR). Initially funded through a grant from The Commonwealth Fund, STAAR is a multi-state, multi-stakeholder approach to dramatically improve the delivery of effective care at a regional scale. The initiative aims to reduce rehospitalizations by working across organizational boundaries in a state or region. The work requires not only front-line process improvement, but also identification and mitigation of barriers to system-wide improvement, especially policy and payment reforms that will reduce fragmentation and encourage coordination across the continuum of care. The initiative has three high leverage opportunities for action: • improving transitions for all patients, • proactively addressing the needs of high risk patients, and

17
• engaging patients and their caregivers in assuming a proactive role in their plans. STAAR was initially implemented in three states— Massachusetts, Michigan, and Washington— by engaging payers, state and national stakeholders, patients and families, and caregivers at multiple care sites and clinical interfaces. The work in the first three states is anticipated as a four year project. As this work has progressed for one year, IHI has offered to make programming and information learned from the initiative available to Maryland. The initiative would provide both technical assistance at the policy level and support provider efforts at the front line. Additional information about a proposed STAAR Initiative for Maryland may be found in Appendix V. During this two-year period of State support the HSCRC would contract with IHI to provide technical assistance to establish and run the initiative, a collaborative style model. After the first two years HSCRC would assess the ongoing need to fund ongoing technical assistance or other features of the STAAR initiative, and would seek matching and/or replacement funding from Federal or outside foundation sources as needed for the ongoing work..
Other Related Activity and Next Steps
Since the early spring of this year, HSCRC staff has convened a series of educational, technical and clinical vetting sessions for representatives of the Maryland hospital and payer industries.
HSCRC convened a clinical vetting session on September 24, 2010 with hospital clinical and coding personnel, HSCRC staff, and the developers of the 3M Health Information System tools utilized in the proposed MHPR methodology. The responses to comments requested and received in advance of the meeting were reviewed as well as other clinical questions raised. As a result of the session, a clinical subgroup of mental health and substance use clinical representatives, including the Maryland Psychiatric Society, will be convened by HSCRC on October 29th to focus on specific clinical issues raised by the group. In addition, a second clinical vetting session is scheduled for November 1st.
Starting this fall, staff is scheduling a series of meetings with MHA, DHMH and the Maryland Patient Safety Center, the first of which is October 14, 2010, to discuss the organization, development, and funding of the MHPR Infrastructure Initiative as described above that would be designed to establish a Quality Improvement Program to assist Maryland hospitals in analyzing their own PPR performance and reducing their readmissions.
Staff will also re-convene the MHPR Technical Finance Work Group beginning on October 28th in order to address the outstanding technical and payment model issues identified.
Staff anticipates presenting a final recommendation for implementation of the MHPR payment methodology at the December Commission meeting.

18
Staff Draft Recommendations
Based on the staff work chronicled above and the input received thus far from the Maryland Hospital Preventable Readmission Work Group, for Rate Year FY 2011, the HSCRC staff makes the following draft recommendations:
1. Implement a rate-based approach for measuring PPRs where hospitals are evaluated both on their relative ranking in a given on inter-hospital readmission rates and on their year-to-year performance on intra-hospital readmissions rates;
2. Implement a hybrid system of rewards and penalties that will give equal weight to absolute attainment and year-to-year improvement in readmission rates;
3. For measuring performance on annual attainment, base the calculation of relative performance on inter-hospital readmission rates on an actual vs. expected PPR rates on a 15-day Readmissions Window;
4. Adjust individual hospital inter-hospital PPR performance by adjustment factors relating to: a) age splits; b) presence of mental health/substance abuse secondary diagnoses; c) disproportionate share effects; and d) out-of-state migration;
5. Base the relative hospital performance for purposes of scaling at-risk revenue on the actual number of weighted readmissions over the expected number of weighted readmissions (weighted by the chain weight), divided by the total case mix weight associated with the included initial or only admission at the hospital;
6. Also use PPR rates for evaluating within-hospital (intra-hospital) readmissions rate of performance that measures hospital readmission rate improvement in the performance period compared with the base period;
7. Implement scaling of hospital payment adjustments so that a hospital’s performance on the PPR methodology, either positive or negative, is reflected at the time of its update factor - the magnitude of funds scaled (at-risk revenue) should be established in the context of future rate discussions;
8. Regarding base and performance measurement periods, consistent with the case mix lag recommendation approved by the Commission in the June 9, 2010 meeting, for future fiscal year adjustments, staff recommends incorporating a three month lag into the data periods used for readmission base and performance measurement. This would go into effect for rate year 2012. The base measurement period would be the thirteen month period of March 1, 2010 through March 31, 2011. The performance measurement period would be the thirteen month period from March 1, 2011 through March 31, 2012. Performance-based adjustments would be applied rate year 2013. The base and performance periods will be 13 months in duration, in order to capture readmissions from the end of each period during the course of the 15-day readmission window. Further, future measurement will recognize and incorporate needed adjustments related to the most current

19
methodologies such as denials and one day stays. Any technical implementation issues, including the implications of overlap in measurement periods with the initial implementation and first fiscal year that follows, will be vetted with the MHPR Technical Finance Work Group and MHA’s Financial Technical Issues Task Force as needed;
9. Consistent with the process for the establishment of the HSCRC’s MHAC initiatives, provide a mechanism on an ongoing basis to receive input and feedback from the industry and other stakeholders to refine and improve the PPR logic;
10. Make a tracking tool reasonably accessible to hospitals so that they may track their performance throughout the measurement year;
11. Beginning in the Fall of 2010 and forward, work with the Institute for Healthcare Improvement, MHA, DHMH, the Maryland Patient Safety Center and representatives of the Maryland hospital and payer industries to develop and secure funding for a state-wide initiative Maryland Hospital Preventable Readmission Infrastructure and Quality Improvement Project utilizing the STAAR initiative model, which will provide technical assistance to implement the best methods to reduce preventable readmissions, provide assistance to hospitals to improve processes of transitioning patients out of the hospital after an acute care admission, and otherwise decrease the rate of hospital readmissions within the specified readmission time intervals.

20
Appendix I – NEJM Jencks Article on Readmissions

special article
T h e n e w e ngl a nd j o u r na l o f m e dic i n e
n engl j med 360;14 nejm.org april 2, 20091418
Rehospitalizations among Patients in the Medicare Fee-for-Service Program
Stephen F. Jencks, M.D., M.P.H., Mark V. Williams, M.D., and Eric A. Coleman, M.D., M.P.H.
From an independent consulting prac-tice, Baltimore (S.F.J.); the Division of Hospital Medicine, Northwestern Uni-versity Feinberg School of Medicine, Chi-cago (M.V.W.); and the Care Transitions Program, Division of Health Care Policy and Research, University of Colorado at Denver, Denver (E.A.C.).
N Engl J Med 2009;360:1418-28.Copyright © 2009 Massachusetts Medical Society.
A BS TR AC T
Background
Reducing rates of rehospitalization has attracted attention from policymakers as a way to improve quality of care and reduce costs. However, we have limited informa-tion on the frequency and patterns of rehospitalization in the United States to aid in planning the necessary changes.
Methods
We analyzed Medicare claims data from 2003–2004 to describe the patterns of re-hospitalization and the relation of rehospitalization to demographic characteristics of the patients and to characteristics of the hospitals.
Results
Almost one fifth (19.6%) of the 11,855,702 Medicare beneficiaries who had been discharged from a hospital were rehospitalized within 30 days, and 34.0% were rehospitalized within 90 days; 67.1% of patients who had been discharged with medical conditions and 51.5% of those who had been discharged after surgical procedures were rehospitalized or died within the first year after discharge. In the case of 50.2% of the patients who were rehospitalized within 30 days after a medi-cal discharge to the community, there was no bill for a visit to a physician’s office between the time of discharge and rehospitalization. Among patients who were rehospitalized within 30 days after a surgical discharge, 70.5% were rehospitalized for a medical condition. We estimate that about 10% of rehospitalizations were likely to have been planned. The average stay of rehospitalized patients was 0.6 day longer than that of patients in the same diagnosis-related group whose most recent hospitalization had been at least 6 months previously. We estimate that the cost to Medicare of unplanned rehospitalizations in 2004 was $17.4 billion.
Conclusions
Rehospitalizations among Medicare beneficiaries are prevalent and costly.
Copyright © 2009 Massachusetts Medical Society. All rights reserved. Downloaded from www.nejm.org on March 9, 2010 . For personal use only. No other uses without permission.

Rehospitalizations among Patients in the Medicare Fee-for-Service Progr am
n engl j med 360;14 nejm.org april 2, 2009 1419
Medicare currently pays for all rehospitalizations, except those in which patients are rehospitalized within 24
hours after discharge for the same condition for which they had initially been hospitalized. Re-cent policy proposals would alter this approach and create payment incentives to reduce the rates of rehospitalization. The Medicare Payment Ad-visory Commission (MedPAC) recommended to Congress in its report in June 2008 that hospitals receive from the Centers for Medicare and Med-icaid Services (CMS) a confidential report of their risk-adjusted rehospitalization rates and that af-ter 2 years, rates should be published. MedPAC also recommended complementary changes in pay-ment rates, so that hospitals with high risk-adjust-ed rates of rehospitalization receive lower average per case payments. The commission reported that Medicare expenditures for potentially preventable rehospitalizations may be as high as $12 billion a year.1 In July 2008, the National Quality Forum adopted two measures of hospital performance based on the rate of rehospitalization,2 and the CMS indicated an interest in making the rehospi-talization rate a measure for value-based hospital payment.3 Reducing rehospitalization is an impor-tant element of President Barack Obama’s Feb-ruary 2009 proposal for financing health care re-form.4 Such proposals would radically change the accountability of hospitals for patients’ outcomes after discharge.
These proposals addressing all-cause rehospi-talization highlight the importance of under-standing the factors that influence the disparate causes of rehospitalization. Although there is ex-tensive literature on rehospitalization attributed to particular conditions, especially heart failure,5 there is very limited research addressing the broader issues involving the multitude of diseases and processes that contribute to rehospitalization. Until the 2007 MedPAC report (cited in the 2008 MedPAC report1), there was, to our knowledge, no follow-up of the measurement of the overall Medi-care rehospitalization rate that Anderson and Steinberg made in their seminal study in 1984.6 Building on the 2007 MedPAC report, we under-took this study to examine three key questions: What is the frequency of unplanned and planned rehospitalizations within 30 days after discharge? How long does the elevated risk of rehospitaliza-tion persist? What is the frequency of follow-up
outpatient visits with a physician after a patient’s discharge from a hospital?
Me thods
Data Sources
We used data from the Medicare Provider Analy-sis and Review (MEDPAR) file for the 15-month period from October 1, 2003, through Decem-ber 31, 2004; the MEDPAR file does not contain any discharges from 855 critical access hospitals or discharges of patients who were enrolled in managed-care plans. Inpatient claims for indi-vidual patients were linked with the use of the Health Insurance Claim Number–Beneficiary Iden-tification Code. To study follow-up visits, we used the 5% national sample of linked physician and hospital claims for 2003 that is maintained in the CMS Chronic Condition Data Warehouse.7 We used data from different intervals depending on the amount of previous or follow-up data that we needed for the analysis. The study design and procedures were approved by the Colorado Mul-tiple Institutional Review Board.
Assessment of Rehospitalization and Diagnoses
We defined the rate of rehospitalization in the following way: the number of patients who were discharged from an acute care hospital and read-mitted to any acute care hospital within 30 days divided by the total number of people who were discharged alive from acute care hospitals. We counted no more than one rehospitalization for each discharge. We excluded from the numerator and denominator patients who were transferred on the day of discharge to other acute care hos-pitals, including patients who were admitted to hospital specialty units, inpatient rehabilitation facilities, and long-term care hospitals (we includ-ed all other same-day rehospitalizations in our analyses). We also excluded patients who were rehospitalized for rehabilitation (diagnosis-related group [DRG] 462) within 30 days after discharge. We calculated rates over a 12-month period for the cohort that was discharged between October 1 and December 31, 2003, after determining that seasonal variation was less than 0.2 percentage point. In this calculation, data for a patient were censored when he or she was rehospitalized or died before hospitalization.
Copyright © 2009 Massachusetts Medical Society. All rights reserved. Downloaded from www.nejm.org on March 9, 2010 . For personal use only. No other uses without permission.

T h e n e w e ngl a nd j o u r na l o f m e dic i n e
n engl j med 360;14 nejm.org april 2, 20091420
To examine the patterns of diagnoses at dis-charge and rehospitalization, we identified the five medical and five surgical DRGs that account-ed for the largest number of rehospitalizations within 30 days after discharge and tabulated the 10 most frequent reasons for rehospitalization for each DRG. To estimate the fraction of rehospital-izations that might have been planned, we ex-amined the 100 DRGs that are most frequently assigned to rehospitalized patients and ranked them according to whether planning was clini-cally plausible (e.g., rehospitalization for pneumo-nia is very unlikely to have been planned, whereas rehospitalization for placement of a stent could well be) and whether the rate of rehospitaliza-tion for the DRG showed the exponential rate of decrease that is characteristic of most DRGs when planned rehospitalization is unlikely (for details, see the Supplementary Appendix, available with the full text of this article at NEJM.org).
We calculated a hospital’s expected rehospital-ization rate as the rehospitalization rate expect-ed if each of its Medicare discharges had the same rehospitalization risk as the national aver-age for Medicare discharges in the same DRG (indirect adjustment). We used the ratio of ob-served to expected hospitalizations to stratify hospitals into quartiles and calculated differences in rehospitalization rates among hospitals with 1000 or more Medicare discharges.
We used the Medicare provider number to as-sess whether the patient was readmitted to the same hospital from which he or she had been discharged. We also tabulated length of stay and Medicare payment weights for DRGs (which are based on the average use of hospital resources for treatment of Medicare patients) for rehospitalized patients and for those who had not been hospi-talized in the previous 6 months.
Reliability of Data
Published definitions of DRGs include a classifi-cation of the diagnosis as medical or surgical. The CMS systematically audits the coding of DRGs. Dates of admission and discharge are tied to hos-pital billing systems, and errors may trigger au-dits or payment reviews. Whether a beneficiary is receiving dialysis treatment or is disabled is de-termined in the Medicare eligibility process. Dis-charge disposition is generally not used for pay-ment and is often unreliable. We used black race, which is reported to be reliably coded, as a co-
variate but did not use Hispanic ethnic group, which is reported to be seriously undercoded.8,9
Statistical Analysis
We used the Cox proportional-hazards model to assess patient-level predictors of rehospitalization. The number of days before rehospitalization rep-resented the survival time, data were censored at the time of death or the end of the observation period, and covariates were the patient character-istics that were available in the MEDPAR file or that could be calculated from the information in it: the hospital’s ratio of observed to expected hos-pitalizations, the national rehospitalization rate for the patient’s DRG, race (black or nonblack), use or nonuse of dialysis, presence or absence of disability, sex, Supplemental Security Income (SSI) status, length of stay as compared with the na-tional average for the DRG, number of hospital-izations in the preceding 6 months, and age group. We included the hospital’s ratio of observed to expected hospitalizations as a covariate so that differences among hospitals would not obscure the effects of other predictors. Hospital-level characteristics, such as the number of beds, ur-ban or rural location, and teaching or nonteach-ing status — characteristics that Anderson and Steinberg used in their analyses6 — are not avail-able in the MEDPAR file, but their effect should be captured in the hospital’s ratio of observed to expected hospitalizations. For this analysis we used discharges from April 1 through September 30, 2004, to allow 6 months for identifying previ-ous hospitalizations. We performed all analyses with SAS software.10
R esult s
Frequency of Rehospitalization
A total of 13,062,937 patients enrolled in the Medi-care fee-for-service program were discharged from 4926 hospitals between October 1, 2003, and September 30, 2004; 516,959 of these patients were recorded as having died, and 690,276 went to other acute care settings, leaving 11,855,702 (90.8%) at risk for rehospitalization. Table 1 shows the cumulative percentage of rehospitalizations and outpatient deaths before rehospitalization by 30, 60, 90, 180, and 365 days after discharge for the cohort of Medicare patients discharged be-tween October 1 and December 31, 2003; 19.6% of the patients were rehospitalized within 30 days,
Copyright © 2009 Massachusetts Medical Society. All rights reserved. Downloaded from www.nejm.org on March 9, 2010 . For personal use only. No other uses without permission.

Rehospitalizations among Patients in the Medicare Fee-for-Service Progr am
n engl j med 360;14 nejm.org april 2, 2009 1421
34.0% within 90 days, and 56.1% within 365 days. About two thirds (62.9%) of Medicare fee-for-service beneficiaries who were discharged (67.1% after hospitalization for a medical condition and 51.5% after hospitalization for a surgical proce-dure) were rehospitalized or died within a year. To avoid double counting, we do not report deaths that occurred during or after rehospitalization. When we omitted cases of end-stage renal disease and included same-day readmissions, as Ander-son and Steinberg did,6 the 60-day rate of rehos-pitalization was 31.1%.
Reasons for Rehospitalization
Table 2 shows the five medical and five surgical reasons for the index (i.e., initial) hospitalization that were associated with the largest number of
rehospitalizations and the top 10 reasons for re-hospitalization for each index reason. Most rehos-pitalizations (84.4% among patients who were discharged after initial hospitalization for medi-cal conditions and 72.6% among patients who were discharged after surgical procedures) were for medical diagnoses. The 100 most frequent rehospitalization DRGs accounted for 73.2% of total rehospitalizations. Among the rehospitaliza-tions ascribed to these 100 DRGs, 10% belonged to 19 DRGs, such as chemotherapy and stent in-sertion, for which we estimated that planned re-hospitalizations were probably an important part of total rehospitalizations (see the Supplementary Appendix). We did not attempt to estimate the percentage of these rehospitalizations that were actually planned.
Table 1. Rehospitalizations and Deaths after Discharge from the Hospital among Patients in Medicare Fee-for-Service Programs.
Interval after DischargePatients at Risk at
Beginning of Period
Cumulative Rehospitalizations by End of Period
Cumulative Deaths without
Rehospitalization by End of Period
number (percent)
All discharges
0–30 days 2,961,460 (100.0) 579,903 (19.6) 103,741 (3.5)
31–60 days 2,277,816 (76.9) 834,369 (28.2) 134,697 (4.5)
61–90 days 1,992,394 (67.3) 1,006,762 (34.0) 151,901 (5.1)
91–180 days 1,802,797 (60.9) 1,325,645 (44.8) 177,234 (6.0)
181–365 days 1,458,581 (49.3) 1,661,396 (56.1) 200,852 (6.8)
>365 days 1,099,212 (37.1)
Discharges after hospitalization for medical condition
0–30 days 2,154,926 (100.0) 453,993 (21.1) 87,736 (4.1)
31–60 days 1,613,197 (74.9) 653,998 (30.3) 113,188 (5.3)
61–90 days 1,387,740 (64.4) 788,535 (36.6) 127,274 (5.9)
91–180 days 1,239,117 (57.5) 1,032,141 (47.9) 147,851 (6.9)
181–365 days 974,934 (45.2) 1,280,579 (59.4) 166,561 (7.7)
>365 days 707,786 (32.8)
Discharges after hospitalization for surgical procedure
0–30 days 806,534 (100.0) 125,910 (15.6) 16,005 (2.0)
31–60 days 664,619 (82.4) 180,371 (22.4) 21,509 (2.7)
61–90 days 604,654 (75.0) 218,227 (27.1) 24,627 (3.1)
91–180 days 563,680 (69.9) 293,504 (36.4) 29,383 (3.6)
181–365 days 483,647 (60.0) 380,817 (47.2) 34,291 (4.3)
>365 days 391,426 (48.5)
Copyright © 2009 Massachusetts Medical Society. All rights reserved. Downloaded from www.nejm.org on March 9, 2010 . For personal use only. No other uses without permission.

T h e n e w e ngl a nd j o u r na l o f m e dic i n e
n engl j med 360;14 nejm.org april 2, 20091422
Table 2. Highest Rates of Rehospitalization and Most Frequent Reasons for Rehospitalization, According to Condition at
Condition at IndexDischarge
30-Day Rehospitalization Rate
Proportion of All Rehospitalizations
Most Frequent 2nd Most Frequent
percent
Medical
All 21.0 77.6 Heart failure (8.6) Pneumonia (7.3)
Heart failure 26.9 7.6 Heart failure (37.0) Pneumonia (5.1)
Pneumonia 20.1 6.3 Pneumonia (29.1) Heart failure (7.4)
COPD 22.6 4.0 COPD (36.2) Pneumonia (11.4)
Psychoses 24.6 3.5 Psychoses (67.3) Drug toxicity (1.9)
GI problems 19.2 3.1 GI problems (21.1) Nutrition-related or metabolic issues (4.9)
Surgical
All 15.6 22.4 Heart failure (6.0) Pneumonia (4.5)
Cardiac stent placement 14.5 1.6 Cardiac stent (19.7) Circulatory diagno-ses (8.5)
Major hip or knee surgery 9.9 1.5 Aftercare (10.3) Major hip or knee problems (6.0)
Other vascular surgery 23.9 1.4 Other vascular sur-gery (14.8)
Amputation (5.8)
Major bowel surgery 16.6 1.0 GI problems (15.9) Postoperative in-fection (6.4)
Other hip or femur surgery 17.9 0.8 Pneumonia (9.7) Heart failure (4.8)
* Index conditions listed within medical and surgical groups are in order of decreasing total number of rehospitalizations within 30 days after discharge. The diagnosis-related group (DRG) numbers for the conditions listed are as follows: acute myocardial infarction: 121, 122, 123, 516, 526; arrhythmias: 138, 139; amputation: 113; cardiac stent: 517, 527; chest pain: 143; circulatory disorders: 124; COPD: 088; depression: 429; drug toxicity: 449; drug or alcohol misuse: 521; fracture of hip or pelvis: 236; gastrointestinal bleeding: 592; gastrointestinal problems: 182, 183, 184; heart failure: 127; major bowel surgery: 148, 149; major hip or knee problems: 209; nutrition-related or metabolic issues: 296, 297, 298; operation for infection: 415; organic mental conditions: 429; other hip or femur surgery: 210; other circulatory diagnoses: 144; other vascular surgery: 478, 479; pneumonia: 79, 80, 81, 89, 90, 91; postoperative infection: 418; psychoses: 430; pulmonary edema: 087; rehabilitation: 462; renal failure: 316; respiratory or ventilation issues: 475; septicemia: 416, 417; and urinary tract infection: 320, 321, 322. COPD denotes chronic obstructive pulmonary disease, and GI gastro-intestinal.
Copyright © 2009 Massachusetts Medical Society. All rights reserved. Downloaded from www.nejm.org on March 9, 2010 . For personal use only. No other uses without permission.
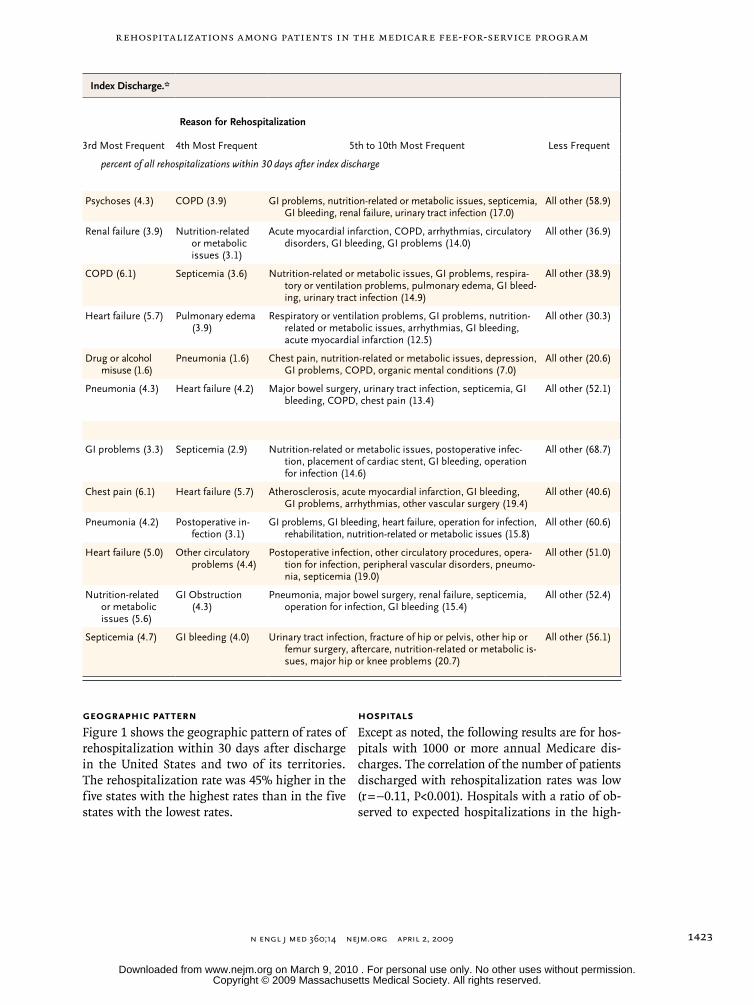
Rehospitalizations among Patients in the Medicare Fee-for-Service Progr am
n engl j med 360;14 nejm.org april 2, 2009 1423
Geographic Pattern
Figure 1 shows the geographic pattern of rates of rehospitalization within 30 days after discharge in the United States and two of its territories. The rehospitalization rate was 45% higher in the five states with the highest rates than in the five states with the lowest rates.
Hospitals
Except as noted, the following results are for hos-pitals with 1000 or more annual Medicare dis-charges. The correlation of the number of patients discharged with rehospitalization rates was low (r = −0.11, P<0.001). Hospitals with a ratio of ob-served to expected hospitalizations in the high-
Index Discharge.*
Reason for Rehospitalization
3rd Most Frequent 4th Most Frequent 5th to 10th Most Frequent Less Frequent
percent of all rehospitalizations within 30 days after index discharge
Psychoses (4.3) COPD (3.9) GI problems, nutrition-related or metabolic issues, septicemia, GI bleeding, renal failure, urinary tract infection (17.0)
All other (58.9)
Renal failure (3.9) Nutrition-related or metabolic issues (3.1)
Acute myocardial infarction, COPD, arrhythmias, circulatory disorders, GI bleeding, GI problems (14.0)
All other (36.9)
COPD (6.1) Septicemia (3.6) Nutrition-related or metabolic issues, GI problems, respira-tory or ventilation problems, pulmonary edema, GI bleed-ing, urinary tract infection (14.9)
All other (38.9)
Heart failure (5.7) Pulmonary edema (3.9)
Respiratory or ventilation problems, GI problems, nutrition-related or metabolic issues, arrhythmias, GI bleeding, acute myocardial infarction (12.5)
All other (30.3)
Drug or alcohol misuse (1.6)
Pneumonia (1.6) Chest pain, nutrition-related or metabolic issues, depression, GI problems, COPD, organic mental conditions (7.0)
All other (20.6)
Pneumonia (4.3) Heart failure (4.2) Major bowel surgery, urinary tract infection, septicemia, GI bleeding, COPD, chest pain (13.4)
All other (52.1)
GI problems (3.3) Septicemia (2.9) Nutrition-related or metabolic issues, postoperative infec-tion, placement of cardiac stent, GI bleeding, operation for infection (14.6)
All other (68.7)
Chest pain (6.1) Heart failure (5.7) Atherosclerosis, acute myocardial infarction, GI bleeding, GI problems, arrhythmias, other vascular surgery (19.4)
All other (40.6)
Pneumonia (4.2) Postoperative in-fection (3.1)
GI problems, GI bleeding, heart failure, operation for infection, rehabilitation, nutrition-related or metabolic issues (15.8)
All other (60.6)
Heart failure (5.0) Other circulatory problems (4.4)
Postoperative infection, other circulatory procedures, opera-tion for infection, peripheral vascular disorders, pneumo-nia, septicemia (19.0)
All other (51.0)
Nutrition-related or metabolic issues (5.6)
GI Obstruction (4.3)
Pneumonia, major bowel surgery, renal failure, septicemia, operation for infection, GI bleeding (15.4)
All other (52.4)
Septicemia (4.7) GI bleeding (4.0) Urinary tract infection, fracture of hip or pelvis, other hip or femur surgery, aftercare, nutrition-related or metabolic is-sues, major hip or knee problems (20.7)
All other (56.1)
Copyright © 2009 Massachusetts Medical Society. All rights reserved. Downloaded from www.nejm.org on March 9, 2010 . For personal use only. No other uses without permission.

T h e n e w e ngl a nd j o u r na l o f m e dic i n e
n engl j med 360;14 nejm.org april 2, 20091424
est quartile had an expected 30-day rehospital-ization rate of 20.6%, as compared with their observed rate of 26.1%. The corresponding rates for hospitals in the lowest quartile were 18.7% and 14.3%, respectively. One quarter (25.1%) of the admissions in hospitals in the highest quartile came from rehospitalizations within 30 days after discharge (as compared with 17.0% of admissions in all hospitals and 13.1% of admissions in hos-pitals in the lowest quartile).
The rehospitalization rate that was expected on the basis of DRGs strongly predicted the ob-served rate (R2 = 0.276, P<0.001). Unadjusted hos-pital rates correlated strongly with DRG-adjusted rates (r = 0.975, P<0.001); rehospitalization rates 30 and 90 days after discharge also correlated strongly (r = 0.953, P<0.001). In the case of hos-pitals with 1000 or more Medicare discharges, 24.4% (interquartile range, 17.4 to 29.5) of the
patients who were rehospitalized within 30 days were admitted to another hospital; in the case of hospitals with fewer than 1000 discharges, 44.2% (interquartile range, 23.6 to 60.0) of the patients were admitted to another hospital.
Patients
The average hospital stay for rehospitalized pa-tients was 0.6 day (13.2%) longer than the stay for patients in the same DRG who had not been hos-pitalized within the previous 6 months (2,962,208 patients) (P<0.001). The average Medicare payment weight is 1.41 for index hospitalizations and 1.35 for rehospitalizations. Table 3 shows the relative risk of rehospitalization within 30 days after dis-charge that was associated with each of the vari-ables we analyzed. The reason for the index hos-pitalization (i.e., the DRG), the number of previous hospitalizations, and the length of stay had more
20.2% to 23.2%
19.2% to 20.1%
17.6% to 19.1%
13.3% to 17.4%
16.4%
16.5% 19.0%
19.5%
17.3%
18.2%
17.0%
19.6%
19.4%
17.7%19.9%
19.7%
18.2%
18.1%20.2%
18.4%19.8%
21.9%18.0%22.0%
19.8%
19.5% 19.1%
19.0%
18.1%
18.5%
18.8%
20.8%
21.7%
21.2%
21.3%
20.7%
20.3%
21.9%21.1%
16.6%
14.2%
17.6%
16.2%
16.3%
19.4%
20.1%
17.4%
19.5%
13.3%
15.7%
16.2%19.2%
17.6%
17.1%
US Virgin Islands20.3%
Puerto Rico19.2%
1
Hamel
3/17/09
AUTHOR PLEASE NOTE:Figure has been redrawn and type has been reset
Please check carefully
Author
Fig #
Title
ME
DEArtist
Issue date
COLOR FIGURE
Draft 2Jencks
Knoper
State Rates of Rehospitalization
4/02/09
Figure 1. Rates of Rehospitalization within 30 Days after Hospital Discharge.
The rates include all patients in fee-for-service Medicare programs who were discharged between October 1, 2003, and September 30, 2004. The rate for Washington, DC, which does not appear on the map, was 23.2%.
Copyright © 2009 Massachusetts Medical Society. All rights reserved. Downloaded from www.nejm.org on March 9, 2010 . For personal use only. No other uses without permission.

Rehospitalizations among Patients in the Medicare Fee-for-Service Progr am
n engl j med 360;14 nejm.org april 2, 2009 1425
influence on the risk of rehospitalization than demographic factors such as age, sex, black race, SSI status, and presence or absence of disability.
Outpatient Visits
Figure 2 shows the percentage of patients dis-charged to the community after hospitalization for medical conditions and subsequently rehospi-talized for whom there was no bill for an outpa-tient physician visit between the time of discharge and rehospitalization; both the percentage on each day after discharge and the cumulative per-centage are shown. There was no associated bill for an outpatient visit for 50.1% of the patients who were rehospitalized within 30 days after dis-charge and for 52.0% of those who were rehospi-talized for heart failure within 30 days after dis-charge.
Discussion
The 19.6% rate of rehospitalization within 30 days after discharge that we report for Medicare bene-ficiaries in 2003–2004 is consistent with the rate in MedPAC’s 2008 report of 2005 data (17.6% at 30 days),1 and the difference probably reflects methodologic differences rather than a temporal trend. We found that the rehospitalization rate at 60 days was 31.1% when we analyzed the data in the same way as Anderson and Steinberg, who reported a rate of 22.5% at 60 days for the 1976–1978 period.6 This larger difference is more likely to indicate an actual increase in rehospitalization rates over time, perhaps owing to a shorter dura-tion of index hospitalization or to the increase in ambulatory surgery over the past 30 years. Fried-man and Basu found that among persons 18 to 64 years of age in five states, the rate of rehospi-talization for any reason within 6 months after discharge was 81% of the rate among those older than 64 years of age,11 which is consistent with our finding that the rehospitalization rate was only weakly related to age.
Our analysis also shows that the risk of re-hospitalization after discharge persists over time (Table 1). Further studies will be needed to un-derstand the relative contributions to this risk of failures in discharge planning, insufficient out-patient and community care, and severe progres-sive illness.
This study was limited by our reliance on Medicare billing data, which provide an incom-
plete picture and contain some unreliable ele-ments, and on DRGs, which are not fully adjust-ed for severity of illness. Unmeasured differences in severity of illness might bias comparisons of rehospitalization rates across states, hospitals, and demographic groups. However, DRG adjust-ment is a moderately strong predictor of the re-hospitalization rate (R2 = 0.276), so the very high
Table 3. Predictors of Rehospitalization within 30 Days after Discharge.*
Variable
Hazard Ratio (95% Confidence
Interval)
Hospital’s ratio of observed to expected hospital- izations†
1.097 (1.096–1.098)
National rehospitalization rate for DRG† 1.268 (1.267–1.270)
No. of rehospitalizations since October 1, 2003
0 1.00
1 1.378 (1.374–1.383)
2 1.752 (1.746–1.759)
≥3 2.504 (2.495–2.513)
Length of stay
>2 times that expected for DRG 1.266 (1.261–1.272)
0.5–2 times that expected for DRG 1.00
<0.5 times that expected for DRG 0.875 (0.872–0.877)
Race‡
Black 1.057 (1.053–1.061)
Other 1.00
Disability 1.130 (1.119–1.141)
End-stage renal disease 1.417 (1.409–1.425)
Receipt of Supplemental Security Income 1.117 (1.113–1.122)
Male sex 1.056 (1.053–1.059)
Age
<55 yr 1.00
55–64 yr 0.983 (0.978–0.988)
65–69 yr 0.999 (0.989–1.009)
70–74 yr 1.023 (1.012–1.035)
75–79 yr 1.071 (1.059–1.084)
80–84 yr 1.101 (1.089–1.113)
85–89 yr 1.123 (1.111–1.136)
>89 yr 1.118 (1.105–1.131)
* Data are for patients in Medicare fee-for-service programs who were discharged from the hospital between April 1, 2004, and September 30, 2004, and were followed until October 31, 2004. Data were analyzed with the use of the Cox proportional-hazards model. P<0.001 for all variables except an age of 65 to 69 years. DRG denotes diagnosis-related group.
† These estimates are standardized.‡ Race was determined from MEDPAR files.
Copyright © 2009 Massachusetts Medical Society. All rights reserved. Downloaded from www.nejm.org on March 9, 2010 . For personal use only. No other uses without permission.

T h e n e w e ngl a nd j o u r na l o f m e dic i n e
n engl j med 360;14 nejm.org april 2, 20091426
correlation between unadjusted and DRG-adjusted hospital-level rates suggests that additional ad-justment for risk may not add greatly to the analy-sis of rehospitalization rates. In addition, our assessment of outpatient follow-up was limited by the use of billing data that do not capture most visits to nonphysician providers.
Fisher et al.12 have argued that the availability of hospital beds induces demand without im-proving health and that the availability of a bed may also facilitate hospitalization if a patient’s condition deteriorates, but we were unable to link measures of the number of hospital beds in a community to the data analyzed here. Neverthe-less, their argument bears directly on the ques-tion of whether higher rehospitalization rates are evidence of better care or just more care. Similar-ly, better access to primary care and better con-tinuity of care may reduce the number of rehos-pitalizations, but we have no data on where in the United States these features are provided, nor do we know where a “medical home”13 — an enhanced primary care coordinator for all of a patient’s care — has been adopted.
Five lines of evidence suggest that rates of re-hospitalization might be reduced. First, controlled studies14-16 have shown that certain interventions at the time of discharge sharply reduce the rates
of rehospitalization among patients with heart failure and other Medicare beneficiaries, and pre-liminary reports suggest that these and other in-terventions are more effective when used more widely. In contrast, coordination-of-care interven-tions that are limited to community settings appear to be ineffective in reducing rehospitalization.17 Research also shows that supportive palliative care can reduce rehospitalization and increase patient satisfaction.18 In addition, the Quality Improvement Organizations appear to have reversed a national trend of increased hospitalizations from home set-tings by working with individual agencies that provide home health care.19
Second, the absence of a bill for an outpatient physician visit in the case of more than half of the patients with a medical condition who were readmitted within 30 days after discharge to the community is of great concern and suggests a considerable opportunity for improvement. Our concern is heightened by the same finding among patients with heart failure, who are known to have a response to intensified care.20 Hospitals and physicians may need to collaborate to improve the promptness and reliability of follow-up care.
Third, although claims data are less informa-tive about follow-up care after surgical procedures (because of the global surgical fee), many pa-tients who are discharged after a surgical proce-dure may benefit from earlier medical follow-up, since a substantial majority of postsurgical rehos-pitalizations are for medical conditions.
Fourth, our estimate that 90% of rehospital-izations within 30 days after discharge are un-planned suggests that rehospitalization is proba-bly not primarily driven either by clinical practices (e.g., staged surgery) that cannot be efficiently rendered in one hospitalization or by profit-seeking division of services into multiple hospi-talizations.
Fifth, the variation among states (Fig. 1) and hospitals suggests that improvement on a na-tional scale may be possible, but the data do not show which practices cause the differences or whether the differences are exportable.
Medicare payments for unplanned rehospital-izations in 2004 accounted for about $17.4 billion of the $102.6 billion in hospital payments from Medicare,21 making them a large target for cost reduction. (This cost estimate is derived by mul-tiplying the 19.6% rehospitalization rate by 90%,
22p3
100
Patie
nts
Reh
ospi
taliz
ed w
ith N
o In
teri
mB
ill fo
r a
Phys
icia
n V
isit
(%) 80
90
70
60
40
30
10
50
20
00 4010 70605020 10080 9030
Cumulative percentage of patientsrehospitalized through this date whohad not been seen by a physician
Percentage of patients rehospitalizedon this date who had not been seenby a physician
Days after Discharge
AUTHOR:
FIGURE:
JOB:
4-CH/T
RETAKE
SIZE
ICM
CASE
EMail LineH/TCombo
Revised
AUTHOR, PLEASE NOTE: Figure has been redrawn and type has been reset.
Please check carefully.
REG F
Enon
1st2nd
3rd
Jencks
2 of 2
04-02-09
ARTIST: ts
36014 ISSUE:
Figure 2. Patients for Whom There Was No Bill for an Outpatient Physician Visit between Discharge and Rehospitalization.
Data are for patients in fee-for-service Medicare programs who were dis-charged to the community between January 1, 2003, and December 31, 2003, after an index hospitalization for a medical condition. Data are de-rived from claims maintained in the Chronic Condition Data Warehouse of the Centers for Medicare and Medicaid Services.
Copyright © 2009 Massachusetts Medical Society. All rights reserved. Downloaded from www.nejm.org on March 9, 2010 . For personal use only. No other uses without permission.

Rehospitalizations among Patients in the Medicare Fee-for-Service Progr am
n engl j med 360;14 nejm.org april 2, 2009 1427
which represents the percentage of unplanned rehospitalizations, and multiplying that product by 96%, since DRG-based payments for rehospi-talizations are 4% lower than those for index hospitalizations.) Convincing estimates of poten-tial savings must await evaluation of large-scale improvement efforts.
Although the care that prevents rehospitaliza-tion occurs largely outside hospitals, it starts in hospitals. In a quarter of the hospitals, about 25% of the admissions are rehospitalizations that oc-cur within 30 days after discharge. Cynics may suggest that preventing rehospitalization is not in the financial interest of hospitals, but our analy-sis suggests a more complex picture. Rehospital-izations may not be profitable for many hospitals. Although the average length of stay for rehospi-talized patients was 0.6 day more than that for patients in the same DRG whose most recent hospitalization had been at least 6 months previ-ously, DRG-based payments would be largely the same. For a hospital with excess capacity, there may be as much financial benefit from rehospi-talizations as from first-time admissions, but for a hospital that manages its capacity more care-fully, there may not.
Almost all hospitals will need help in gauging their performance with respect to rehospitaliza-tions, because they have no access to data on the 20 to 40% of their patients who are rehospital-ized elsewhere. Only holders of all-hospital dis-charge data, such as governments and other third-party payers, have the ability to track patients across providers and systems. Medicare could help by providing data on all Medicare rehospi-talizations (suitably de-identified) to help hospi-tals and communities better understand their performance.
Our analysis generally confirms Anderson and Steinberg’s findings regarding the value of demo-graphic factors in predicting the risk of rehospi-talization,6 but it shows that previous rehospital-ization, a longer index hospitalization as compared with the norm for the DRG, the need for dialysis, and the DRG to which the patient is assigned at the end of the stay are more powerful predic-tors. However, when the typical patient has al-most two chances in three of being rehospital-ized or of dying within a year after discharge, it is probably wiser to consider all Medicare pa-
tients as having a high risk of rehospitalization. For example, ensuring that a follow-up appoint-ment with a physician is scheduled for every patient before he or she leaves the hospital is probably more efficient than trying to identify high-risk patients and arranging follow-up care just for them.
Rehospitalization is a frequent, costly, and sometimes life-threatening event that is associ-ated with gaps in follow-up care. We are begin-ning to understand that the rate of rehospitaliza-tion can be reduced with the implementation of more reliable systems, but it would be premature to predict how much reduction can be achieved. Although the rehospitalization rate is often pre-sented as a measure of the performance of hos-pitals, it may also be a useful indicator of the performance of our health care system.22 From a system perspective, a safe transition from a hos-pital to the community or a nursing home re-quires care that centers on the patient and tran-scends organizational boundaries. Our purpose in this report has been to strengthen the em-pirical foundation for designing and providing such care.
Supported in part by the Institute for Healthcare Improve-ment (a senior fellowship to Dr. Jencks) and the John A. Hartford Foundation (2006-0229 and 2005-0194 to Drs. Williams and Coleman, respectively).
Presented in part at the meeting, Reducing Hospital Readmis-sions, sponsored by the Commonwealth Fund and Academy-Health, in Washington, DC, January 25, 2008.
Dr. Jencks reports receiving consulting or speaking fees from the National Quality Forum, the Colorado Foundation for Medi-cal Care, IPRO, Qualidigm, the Commonwealth Fund, RTI Inter-national, and the Japanese Society for Quality and Safety in Health Care and having been employed by the Centers for Medi-care and Medicaid Services (CMS) until 2007; Dr. Williams, re-ceiving consulting fees from the Aetna Foundation through the University of Colorado, and being editor-in-chief of the Journal of Hospital Medicine; and Dr. Coleman, receiving grant support from the Aetna Foundation and the Atlantic Philanthropies and con-tract support from the California HealthCare Foundation and the Community Health Foundation of Central and Western New York. Drs. Jencks, Williams, and Coleman have served as faculty for the Institute for Healthcare Improvement. No other potential conflict of interest relevant to this article was reported.
We thank David Gibson and Spike Duzor of the CMS for help in obtaining the Chronic Conditions Data Warehouse files; Gary Schultheis of CMS for providing exploratory data files; Wato Nsa, Alan Ma, and Dale Bratzler of the Oklahoma Foundation for Medical Care for providing an early version of the DRG fre-quency table; Sarah Kier of Northwestern Memorial Hospital for assistance with the map; Jessica Kazmier of the Northwestern Medical Faculty Foundation for assistance with the references; and Glenn Goodrich of the University of Colorado at Denver for preparing the 2003–2004 MEDPAR files.
Copyright © 2009 Massachusetts Medical Society. All rights reserved. Downloaded from www.nejm.org on March 9, 2010 . For personal use only. No other uses without permission.

n engl j med 360;14 nejm.org april 2, 20091428
Rehospitalizations among Patients in the Medicare Fee-for-Service Progr am
References
A path to bundled payment around a 1. rehospitalization. In: Report to the Con-gress: reforming the delivery system. Washington, DC: Medicare Payment Advi-sory Commission, June 2005:83-103.
Candidate hospital care additional pri-2. orities: 2007 performance measure. Wash-ington, DC: National Quality Forum, 2007.
Application of incentives to reduce 3. avoidable readmissions to hospitals. Fed Regist 2008;73(84):23673-5.
Connolly C. Obama proposes $634 4. billion fund for health care. Washington Post. February 26, 2009:A1.
Ross JS, Mulvey GK, Stauffer B, et al. 5. Statistical models and patient predictors of readmission for heart failure: a system-atic review. Arch Intern Med 2008;168: 1371-86.
Anderson GF, Steinberg EP. Hospital 6. readmissions in the Medicare population. N Engl J Med 1984;311:1349-53.
Chronic Condition Data Warehouse 7. (CCW) home page. West Des Moines: Iowa Foundation for Medical Care, 2008. (Ac-cessed March 9, 2009, at http://ccwdata.org.)
Blustein J. The reliability of racial 8. classifications in hospital discharge ab-stract data. Am J Public Health 1994;84: 1018-21.
Eicheldinger C, Bonito A. More accu-9.
rate racial and ethnic codes for Medicare administrative data. Health Care Financ Rev 2008;29:27-42.
SAS for Windows, version 8.2. Cary, 10. NC: SAS Institute.
Friedman B, Basu J. The rate and cost 11. of hospital readmissions for preventable conditions. Med Care Res Rev 2004;61:225-40.
Fisher ES, Wennberg JE, Stukel TA, et 12. al. Associations among hospital capacity, utilization, and mortality of US Medicare beneficiaries, controlling for sociodemo-graphic factors. Health Serv Res 2000;34: 1351-62.
Barr M, Ginsburg J. The advanced 13. medical home: a patient-centered, physi-cian-guided model of health care. Phila-delphia: American College of Physicians, 2006.
Coleman EA, Parry C, Chalmers S, 14. Min S-J. The care transitions intervention: results of a randomized controlled trial. Arch Intern Med 2006;166:1822-8.
Naylor MD, Brooten DA, Campbell 15. RL, Maislin G, McCauley KM, Schwartz JS. Transitional care of older adults hospi-talized with heart failure: a randomized, controlled trial. J Am Geriatr Soc 2004; 52:675-84.
Jack BW, Chetty VK, Anthony D, et al. 16. A reengineered hospital discharge pro-gram to decrease rehospitalization: a ran-
domized trial. Ann Intern Med 2009;150: 178-87.
Peikes D, Chen A, Schore J, Brown R. 17. Effects of care coordination on hospital-ization, quality of care, and health care expenditures among Medicare beneficia-ries: 15 randomized trials. JAMA 2009; 301:603-18.
Brumley R, Enguidanos S, Jamison P, 18. et al. Increased satisfaction with care and lower costs: results of a randomized trial of in-home palliative care. J Am Geriatr Soc 2007;55:993-1000.
Rollow W, Lied TR, McGann P, et al. 19. Assessment of the Medicare quality im-provement organization program. Ann In-tern Med 2006;145:342-53.
Göhler A, Januzzi JL, Worrell SS, et al. 20. A systematic meta-analysis of the efficacy and heterogeneity of disease management programs in congestive heart failure. J Card Fail 2006;12:554-67.
Medicare & Medicaid statistical sup-21. plement. Baltimore: Centers for Medicare & Medicaid Services, 2007. (Accessed March 9, 2009, at http://www.cms.hhs.gov/MedicareMedicaidStatSupp/downloads/ 2007Table5.1b.pdf.)
Adeyemo D, Radley S. Unplanned 22. general surgical re-admissions — how many, which patients and why? Ann R Coll Surg Engl 2007;89:363-7.Copyright © 2009 Massachusetts Medical Society.
apply for jobs electronically at the nejm careercenter
Physicians registered at the NEJM CareerCenter can apply for jobs electronically using their own cover letters and CVs. You can keep track of your job-application
history with a personal account that is created when you register with the CareerCenter and apply for jobs seen online at our Web site.
Visit NEJMjobs.org for more information.
Copyright © 2009 Massachusetts Medical Society. All rights reserved. Downloaded from www.nejm.org on March 9, 2010 . For personal use only. No other uses without permission.

21
Appendix II – Chain Weight Options and formulae for calculation of chain weights, and actual and expected values
Formulae for calculation of chain weights, and actual and expected values
Let Wi be the case mix weight for a case in APR-DRG/SOI i.
If chain j has n readmissions with weights wjk, k=1,..,n, then:
cj = chain weight for chain j = Σk wjk
where the index k runs from 1 to n.
The expected chain weight for a chain starting with a discharge with an initial APR-DRG/SOI of i is:
ei = Σj cj / ni
where the summation runs over all the readmission chains starting with an initial APR-DRG/SOI of i and ni is the number of readmission chains starting with an initial APR-
DRG/SOI of i.
Assign an expected chain weight to each readmission chain , and an expected chain weight of zero to each only admission, call these gi.
Calculate the statewide expected chain weight for each only or initial admission in APR-DRG/SOI i. This is:
fi = ei x (# initial admissions with APR-DRG/SOI i) (# of initial or only admissions with i) For all APR-DRG/SOI i, assign fi to each initial or only admission i. The readmission index for a hospital is then:

22
Σ gn / Σ fn, where n runs over all initial or only admissions at the hospital. It should be noted that this calculation does not take account of the adjustment factors for age category, mental health status or Medicaid status. These factors can be applied to the individual expected numbers fi before the final summation.
Option 1: PPR rate
In this option all readmission chains are counted, and they all have equal weight. The APR-DRG/SOIs will have different proportions of readmissions associated with them, and the expected readmission rate for a hospital is adjusted using these different proportions.
In each of the options we will consider the same 2 cases with initial admissions in:
Case 1: APR-DRG/SOI 811.1 - allergic reaction / minor
Case 2: APR-DRG/SOI 161.4 - cardiac defibrillator and heart assist implant/ extreme.
Under Option 1 readmission chains following either of these initial admissions are counted as equal.
Option 2: Expected chain weight
The chain weight is the mean case mix weight associated with readmissions following a given APR-DRG/SOI. The chain weights are used to calculate both the actual and expected PPR rates for each hospital. Thus, the hospital is being held accountable for the proportion of readmission chains within each APR-DRG/SOI, and these are weighted by the expected chain weight for the APR-DRG/SOI, but not for the actual case mix weights of the readmissions.
The expected chain weights vary from .3 to 7.6. with a median value of 1.26.
APR-DRG/SOI 811.1 (minor allergic reaction) has a chain weight of 0.53, while 161.4 (cardiac defibrillator and heart assist implant) has a chain weight of 1.93. Under Option 1 a readmission chain following 811.1 would have the same impact as a readmission chain following an initial admission in 161.4. Under Option 2 the readmission chain following 161.4 would be weighted with the chain weight of 1.93.
In neither case would any account be taken of the actual case mix weights of the readmissions that occurred.
Case 1: Expected and actual weight is 0.53
Case 2: Expected and actual weight is 1.93

23
Option 3: Actual and expected chain weights
The chain weight is the mean case mix weight associated with readmissions following a given APR-DRG/SOI. The chain weights are used to calculate the expected PPR rates for each hospital. The actual case mix weights for the readmissions would be used to calculate the actual PPR rate for the hospital. Thus, the hospital is being held accountable for both the proportion of readmission chains within each APR-DRG/SOI, and the case mix weights for the actual readmissions.
A chain with an initial APR-DRG/SOI of 161.4 would have an expected chain weight of 1.93, but its actual chain weight would be the sum of the case mix weights for the readmissions that actually occurred following that particular initial admission.
Since some chains can be quite long, and the case mix weights associated with some of the readmissions can be high, it would be desirable to place a limit, or outlier threshold, on the chain weights used in the actual PPR rate calculation, which leads to option 4. The individual chain weights range from 0 to 35.
Case 1: Expected weight is 0.53, actual weight anywhere from 0.26 to 0.76.
Case 2: Expected weight is 1.93, actual weight anywhere from 0.45 to 8.5.
Option 4: Option 3 with an outlier
The non-zero individual chain weights range from 0.16 to 35. Only 1% have a chain weight greater than 10. To reduce the risk an outlier threshold should be applied if option 3 is selected.

24
Appendix III: Comment Letters on the MHPR Draft Recommendation


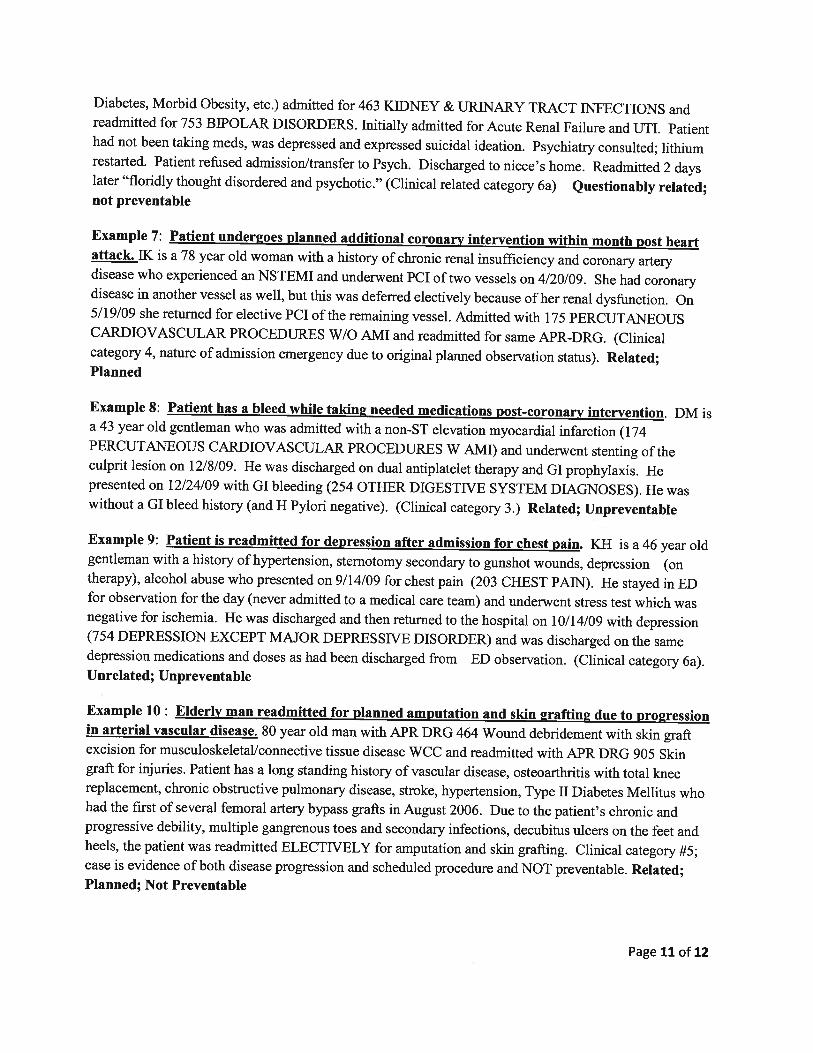

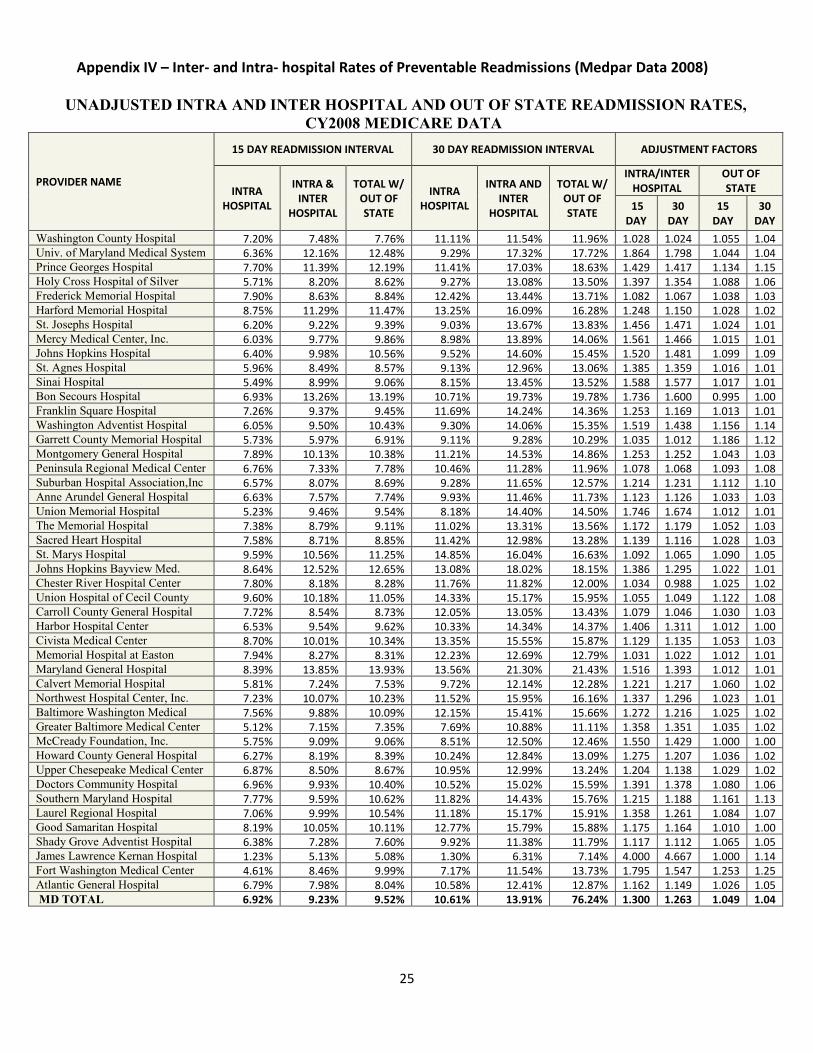
25
Appendix IV – Inter- and Intra- hospital Rates of Preventable Readmissions (Medpar Data 2008)
UNADJUSTED INTRA AND INTER HOSPITAL AND OUT OF STATE READMISSION RATES, CY2008 MEDICARE DATA
PROVIDER NAME
15 DAY READMISSION INTERVAL 30 DAY READMISSION INTERVAL ADJUSTMENT FACTORS
INTRA HOSPITAL
INTRA & INTER
HOSPITAL
TOTAL W/ OUT OF STATE
INTRA HOSPITAL
INTRA AND INTER
HOSPITAL
TOTAL W/ OUT OF STATE
INTRA/INTER HOSPITAL
OUT OF STATE
15 DAY
30 DAY
15 DAY
30 DAY
Washington County Hospital 7.20% 7.48% 7.76% 11.11% 11.54% 11.96% 1.028 1.024 1.055 1.04 Univ. of Maryland Medical System 6.36% 12.16% 12.48% 9.29% 17.32% 17.72% 1.864 1.798 1.044 1.04 Prince Georges Hospital 7.70% 11.39% 12.19% 11.41% 17.03% 18.63% 1.429 1.417 1.134 1.15 Holy Cross Hospital of Silver
5.71% 8.20% 8.62% 9.27% 13.08% 13.50% 1.397 1.354 1.088 1.06
Frederick Memorial Hospital 7.90% 8.63% 8.84% 12.42% 13.44% 13.71% 1.082 1.067 1.038 1.03 Harford Memorial Hospital 8.75% 11.29% 11.47% 13.25% 16.09% 16.28% 1.248 1.150 1.028 1.02 St. Josephs Hospital 6.20% 9.22% 9.39% 9.03% 13.67% 13.83% 1.456 1.471 1.024 1.01 Mercy Medical Center, Inc. 6.03% 9.77% 9.86% 8.98% 13.89% 14.06% 1.561 1.466 1.015 1.01 Johns Hopkins Hospital 6.40% 9.98% 10.56% 9.52% 14.60% 15.45% 1.520 1.481 1.099 1.09 St. Agnes Hospital 5.96% 8.49% 8.57% 9.13% 12.96% 13.06% 1.385 1.359 1.016 1.01 Sinai Hospital 5.49% 8.99% 9.06% 8.15% 13.45% 13.52% 1.588 1.577 1.017 1.01 Bon Secours Hospital 6.93% 13.26% 13.19% 10.71% 19.73% 19.78% 1.736 1.600 0.995 1.00 Franklin Square Hospital 7.26% 9.37% 9.45% 11.69% 14.24% 14.36% 1.253 1.169 1.013 1.01 Washington Adventist Hospital 6.05% 9.50% 10.43% 9.30% 14.06% 15.35% 1.519 1.438 1.156 1.14 Garrett County Memorial Hospital 5.73% 5.97% 6.91% 9.11% 9.28% 10.29% 1.035 1.012 1.186 1.12 Montgomery General Hospital 7.89% 10.13% 10.38% 11.21% 14.53% 14.86% 1.253 1.252 1.043 1.03 Peninsula Regional Medical Center 6.76% 7.33% 7.78% 10.46% 11.28% 11.96% 1.078 1.068 1.093 1.08 Suburban Hospital Association,Inc 6.57% 8.07% 8.69% 9.28% 11.65% 12.57% 1.214 1.231 1.112 1.10 Anne Arundel General Hospital 6.63% 7.57% 7.74% 9.93% 11.46% 11.73% 1.123 1.126 1.033 1.03 Union Memorial Hospital 5.23% 9.46% 9.54% 8.18% 14.40% 14.50% 1.746 1.674 1.012 1.01 The Memorial Hospital 7.38% 8.79% 9.11% 11.02% 13.31% 13.56% 1.172 1.179 1.052 1.03 Sacred Heart Hospital 7.58% 8.71% 8.85% 11.42% 12.98% 13.28% 1.139 1.116 1.028 1.03 St. Marys Hospital 9.59% 10.56% 11.25% 14.85% 16.04% 16.63% 1.092 1.065 1.090 1.05 Johns Hopkins Bayview Med.
8.64% 12.52% 12.65% 13.08% 18.02% 18.15% 1.386 1.295 1.022 1.01
Chester River Hospital Center 7.80% 8.18% 8.28% 11.76% 11.82% 12.00% 1.034 0.988 1.025 1.02 Union Hospital of Cecil County 9.60% 10.18% 11.05% 14.33% 15.17% 15.95% 1.055 1.049 1.122 1.08 Carroll County General Hospital 7.72% 8.54% 8.73% 12.05% 13.05% 13.43% 1.079 1.046 1.030 1.03 Harbor Hospital Center 6.53% 9.54% 9.62% 10.33% 14.34% 14.37% 1.406 1.311 1.012 1.00 Civista Medical Center 8.70% 10.01% 10.34% 13.35% 15.55% 15.87% 1.129 1.135 1.053 1.03 Memorial Hospital at Easton 7.94% 8.27% 8.31% 12.23% 12.69% 12.79% 1.031 1.022 1.012 1.01 Maryland General Hospital 8.39% 13.85% 13.93% 13.56% 21.30% 21.43% 1.516 1.393 1.012 1.01 Calvert Memorial Hospital 5.81% 7.24% 7.53% 9.72% 12.14% 12.28% 1.221 1.217 1.060 1.02 Northwest Hospital Center, Inc. 7.23% 10.07% 10.23% 11.52% 15.95% 16.16% 1.337 1.296 1.023 1.01 Baltimore Washington Medical
7.56% 9.88% 10.09% 12.15% 15.41% 15.66% 1.272 1.216 1.025 1.02
Greater Baltimore Medical Center 5.12% 7.15% 7.35% 7.69% 10.88% 11.11% 1.358 1.351 1.035 1.02 McCready Foundation, Inc. 5.75% 9.09% 9.06% 8.51% 12.50% 12.46% 1.550 1.429 1.000 1.00 Howard County General Hospital 6.27% 8.19% 8.39% 10.24% 12.84% 13.09% 1.275 1.207 1.036 1.02 Upper Chesepeake Medical Center 6.87% 8.50% 8.67% 10.95% 12.99% 13.24% 1.204 1.138 1.029 1.02 Doctors Community Hospital 6.96% 9.93% 10.40% 10.52% 15.02% 15.59% 1.391 1.378 1.080 1.06 Southern Maryland Hospital 7.77% 9.59% 10.62% 11.82% 14.43% 15.76% 1.215 1.188 1.161 1.13 Laurel Regional Hospital 7.06% 9.99% 10.54% 11.18% 15.17% 15.91% 1.358 1.261 1.084 1.07 Good Samaritan Hospital 8.19% 10.05% 10.11% 12.77% 15.79% 15.88% 1.175 1.164 1.010 1.00 Shady Grove Adventist Hospital 6.38% 7.28% 7.60% 9.92% 11.38% 11.79% 1.117 1.112 1.065 1.05 James Lawrence Kernan Hospital 1.23% 5.13% 5.08% 1.30% 6.31% 7.14% 4.000 4.667 1.000 1.14 Fort Washington Medical Center 4.61% 8.46% 9.99% 7.17% 11.54% 13.73% 1.795 1.547 1.253 1.25 Atlantic General Hospital 6.79% 7.98% 8.04% 10.58% 12.41% 12.87% 1.162 1.149 1.026 1.05 MD TOTAL 6.92% 9.23% 9.52% 10.61% 13.91% 76.24% 1.300 1.263 1.049 1.04

26
Appendix V-- Maryland Proposed STAAR Initiative
Proposed Approach for a Maryland STate Action on Avoidable Rehospitalizations (STAAR) Initiative
October 2010
Background
In May 2009, the Institute for Healthcare Improvement (IHI) launched STate Action on Avoidable Rehospitalizations (STAAR). Funded through a grant from The Commonwealth Fund, STAAR is a multi-state, multi-stakeholder approach to dramatically improve the delivery of effective care at a regional scale.
The initiative aims to reduce rehospitalizations by working across organizational boundaries in a state or region. The work requires not only front-line process improvement, but also identification and mitigation of barriers to system-wide improvement, especially policy and payment reforms that will reduce fragmentation and encourage coordination across the continuum of care. The initiative has three high leverage opportunities for action:
• improving transitions for all patients, • proactively addressing the needs of high risk patients, and • engaging patients and their caregivers in assuming a proactive role in their plans.
STAAR was initially implemented in three states— Massachusetts, Michigan, and Washington— by engaging payers, state and national stakeholders, patients and families, and caregivers at multiple care sites and clinical interfaces. The work in the first three states is anticipated as a four year project. As this work has progressed for one year, IHI has offered to make programming and information learned from the initiative available to Maryland. The initiative would provide both technical assistance at the policy level and support provider efforts at the front line.
ROLE AND OPTIONS FOR MARYLAND STAAR LEADERSHIP PARTNERS
The role of the key leadership group for STAAR is to identify strategies to address systemic barriers to improving transition of care and to establish an ongoing feedback loop with providers on the progress of addressing the barriers. Specifically, STAAR leaders are to address barriers in the following areas:
• State-wide data/ measurement, • Payment/policy reforms, • Financial implications on providers, and • Working / communicating across the care continuum.
To build upon the success of the initial group of states implementing STARR, a public-private partnership of four key stakeholders is proposed as the leadership group. The proposed entities include:
• The Health Services Cost Review Commission • The Maryland Hospital Association • Maryland Patient Safety Center
27
• DHMH Office of the Secretary or designee ROLE & POTENTIAL ENTITIES TO BE REPRESENTED ON THE STEERING COMMITTEE
The role of the Steering Committee for STAAR is to work with the key leadership group of STAAR to fully identify the systemic barriers and flesh out the potential strategies for addressing the barriers as well as engaging in the action steps to put the agreed upon strategies in place. Entities to consider for representation on the Steering Committee include:
• Maryland Health Care Commission • Key hospital industry representatives • Delmarva QIO • Institute for Healthcare Improvement • Health Services Cost Review
Commission Medicaid program operations and quality assurance
• Hospital association • Hospice and palliative care association • State medical society • State association of nurse executives • Maryland equivalent of osteopathic
association? • Large nursing home provider-Genesis or
Erickson? • Department of health • Consumer organizations • Blue Cross Blue Shield plan • Home health association • State association of health plans • Health Information exchange- CRISP • Aging services • Senior health organizations • Maryland Patient Safety Center
STAAR CORE SET UP FEATURES FOR PROVIDERS
For Maryland to implement a STAAR initiative, provider participants must agree to engaging in three areas of activity, including:
• Conducting initial and ongoing measurement of 30-day all-cause readmission rates; • Establishing cross-continuum teams comprising physician office, skilled nursing facility;
hospital, home care and patient/family members;8
• Performing a readiness diagnostic by conducting at least five interviews and root cause analysis where readmission has occurred within the 30 day window in the measurement “base” period.
and,
STAAR CORE IMPROVMENT PROCESSES FOR PROVIDERS
Key improvement processes that STARR participants must agree to implement include: • Conducting enhanced readmission assessment that includes social and logistic
information/factors for patients and families that impact risk for readmissions. • Employing enhanced learning and coaching “teach-back” techniques with patients and families
that includes facilitating their understanding and responding back regarding: o The reason they are admitted to the hospital. o How to do self care after discharge. o What to do if their symptoms worsen after they leave the hospital.
• Employing systematic methods to ensure timely communication with the next setting of care such that information is transferred the day of discharge.
8 To date, 67 cross continuum teams have been established across MA, MI and WA, 38 of which include patient and family representatives/participants.
28
• Employing systematic methods to ensure timely follow up with patients and families at moderate risk for readmission.
Next Steps To move forward in determining whether STAAR is an appropriate fit for Maryland, the following next steps and timelines are proposed:
• Meet with proposed key leadership entities to discuss the proposal and next steps. • Review and modify as needed the proposed list of leadership and steering committee
participants. • Should we determine it appropriate to go forward, convene a meeting with the proposed
key leadership organizations and IHI staff. **********************************************************************************************
Appendix A: IHI STAAR Resources Currently Available
The blue text below are URL links currently posted on STAAR to the IHI website.
How-to Guide: Creating an Ideal Transition Home
This guide was created to support participating organizations in their work over the course of the STAAR initiative and beyond to improve transitions in care.
• How-to Guide Summary and Strategies for Getting Started
STAAR Project Summary
A one-page summary of the STAAR initiative.
STAAR: A State-Based Strategy to Reduce Avoidable Rehospitalizations
This document reflects the work of IHI to date to develop a state-wide strategy for reducing avoidable rehospitalizations.
As part of the Effective Interventions to Reduce Rehospitalizations project, which preceded the STAAR initiative, IHI produced materials to highlight promising approaches to reduce avoidable rehospitalizations.
• A Survey of the Published Evidence This document is a survey of the published literature regarding the effective interventions to reduce avoidable rehospitalizations.
• A Compendium of Promising Interventions This companion document to the Published Evidence provides information regarding current best programs and practices to reduce rehospitalizations. STAAR: A Tool for State Policy Makers
The checklist provided in this tool focuses on aspects of the health care system that policy makers can influence and for which data is available to assess their state’s performance regarding hospital readmission rates.
Decreasing Avoidable 30-Day Rehospitalizations

29
This Minicourse presentation at the December 2009 IHI National Forum describes key drivers of rehospitalization rates, how national data compares to state and regional findings, high-leverage changes to reduce hospitalizations, and characteristics of the STAAR multistakeholder quality initiative that crosses organizational boundaries. STAAR Issue Briefs on Reducing Barriers to Care Across the Continuum
Measuring Rehospitalizations at the State Level
The Financial Impact of Readmisisons on Hospitals
Engaging Payers
Working Together in a Cross-Continuum Team

Toll Free 1-877-4MD-DHMH · TTY for the Disabled Maryland Relay Service 1-800-735-2258
Frederick W. Puddester Chairman
Kevin J. Sexton Vice Chairman
Joseph R. Antos, Ph.D.
George H. Bone, M.D.
C. James Lowthers
Herbert S. Wong, Ph.D.
Robert Murray Executive Director
Stephen Ports
Principal Deputy Director Policy & Operations
Gerard J. Schmith
Deputy Director Hospital Rate Setting
HEALTH SERVICES COST REVIEW COMMISSION 4160 PATTERSON AVENUE, BALTIMORE, MARYLAND 21215
Phone: 410-764-2605 · Fax: 410-358-6217 Toll Free: 1-888-287-3229
www.hscrc.state.md.us
STATE OF MARYLAND DEPARTMENT OF HEALTH AND MENTAL HYGIENE
TO: Commissioners FROM: Legal Department DATE: October 27, 2010 SUBJECT: Hearing and Meeting Schedule Public Session December 8, 2010 Time to be determined, 4160 Patterson Avenue, HSCRC Conference
Room January 12, 2011 Time to be determined, 4160 Patterson Avenue, HSCRC Conference
Room Please note, Commissioner packets will be available in Commission offices at 8:00 a.m. The agenda for the Executive and Public Sessions will be available for your review on the Commission’s Web Site, on the Thursday before the Commission Meeting. To review the agenda, visit the Commission’s web site at www.hscrc.state.md.us