health technology assessment report - moh.gov.my teknologi kesihatan... · hta report: breast...
TRANSCRIPT
HTA Report: Breast cancer risk prediction model for Health Risk Assessment (HRA) module
i
Breast Cancer Risk Prediction Model For Health Risk Assessment (HRA) Module
Health Technology Assessment Report
DISCLAIMER
This Health Technology Assessment has been developed from analysis, interpretation and synthesis of scientific research and/or technology assessment conducted by other organizations. It also incorporates, where available, Malaysian data, and information provided by experts to the Ministry of Health Malaysia. While effort has been made to do so, this document may not fully reflect all scientific research available. Additionally, other relevant scientific findings may have been reported since completion of the review.
Please contact: [email protected], if you would like further information.
Published by Malaysian Health Technology Assessment Section, (MaHTAS)Medical Development Division, Ministry of Health MalaysiaLevel 4, Block E1, Complex E, Precinct 1Federal Government Administrative Centre62590, Putrajaya, MalaysiaTel: 603 88831246Fax: 603 8883 1230
CopyrightThe copyright owner of this publication is the Malaysian Health Technology Assessment Section (MaHTAS), Medical Development Division, Ministry of Health Malaysia. Content may be reproduced in any number of copies and in any format or medium provided that a copyright acknowledgement to the Malaysian Health Technology Assessment Section (MaHTAS) is included and the content is not changed, not sold, nor used to promote or endorse any product or service, and not used in an inappropriate or misleading context.
ISBN: 978-967-0769-30-1
Available on the MOH website: http://www.moh.gov.my/v/hta
This Health Technology Assessment report was issued in June 2015.
HTA Report: Breast cancer risk prediction model for Health Risk Assessment (HRA) module
ii
AUTHORS
Dr. Roza Sarimin(Public Health Physician)Senior Principal Assistant DirectorHealth Technology Assessment Section (MaHTAS)Medical Development DivisionMinistry of Health Malaysia
Dr. Izzuna Mudla Mohamed Ghazali(Public Health Physician)Head of Health Technology Assessment UnitHealth Technology Assessment Section (MaHTAS)Medical Development Division Ministry of Health Malaysia
Dr. Khadijah Abdul RahimPrincipal Assistant Director Health Technology Assessment Section (MaHTAS)Medical Development DivisionMinistry of Health Malaysia
INFORMATION SPECIALIST
Dr. Nur Farhana MohamadAssistant Director /Information Specialist Health Technology Assessment Section (MaHTAS)Medical Development DivisionMinistry of Health Malaysia
EXPERT COMMITTEE
Dr. Nor Aina Emran Consultant Surgeon Breast and Endocrine Surgical UnitDepartment of SurgeryHospital Kuala Lumpur
Dr. Anita BaghawiConsultant Breast & Endocrine Surgeon Department of SurgeryHospital Putrajaya
Dr. Normayah KitanConsultant Breast & Endocrine Surgeon Department of SurgeryHospital Putrajaya

HTA Report: Breast cancer risk prediction model for Health Risk Assessment (HRA) module
iii
Dr. Keng Wee TeikConsultant Clinical GeneticistDepartment of GeneticHospital Kuala Lumpur
Dr. Ch’ng Gaik SiewConsultant Clinical GeneticistDepartment of GeneticHospital Kuala Lumpur
Dr. Suzaini Mat DaudFamily Medicine SpecialistKlinik Kesihatan Arau, Perlis
Dr. Nor Saleha bt. Ibrahim TaminPublic Health PhysicianCancer UnitDisease Control DivisionMinistry of Health Malaysia
Dr. Zaleha A.HamidPublic Health PhysicianAdult Health UnitFamily Health Development DivisionMinistry of Health Malaysia
En. Azman MohammedPrincipal Assistant DirectorHealth Education DivisionMinistry of Health Malaysia
Pn. Norhaslida Mohd NorAssistant DirectorHealth Education DivisionMinistry of Health Malaysia
Datin Dr. Rugayah BakriPublic Health PhysicianHead of Health Technology Assessment Section (MaHTAS)Deputy Director, Medical Development Division Ministry of Health Malaysia
Dr. Junainah SabirinPublic Health PhysicianHead of Health Technology Policy UnitHealth Technology Assessment Section (MaHTAS)Medical Development Division Ministry of Health Malaysia
HTA Report: Breast cancer risk prediction model for Health Risk Assessment (HRA) module
iv
EXTERNAL REVIEWERS
Dato’ Dr. Cheng-Har YipConsultant Breast SurgeonBreast Centre, Sime Darby Medical Centre
Professor Dr. Nur Aishah TaibConsultant Breast SurgeonHead of Breast Unit, Division of General Surgery, Faculty of Medicine,Head of Breast Cancer Resource Centre, University of Malaya Medical Centre,University of Malaya, Kuala Lumpur
Professor Dr. Teo Soo HwangChief Executive and Head of Breast Cancer Research Programme, Cancer Research Initiative Foundation (CARIF)Adjunct Professor, University MalayaFellow of Academy of Sciences Malaysia
ACKNOWLEDGEMENT
The authors for this Health Technology Assessment Report would like to express their gratitude and appreciation to the following for their contribution and assistance:
• Health Technology Assessment and Clinical Practice Guidelines Council.• Technical Advisory Committee for Health Technology Assessment.
DISCLOSURE
The authors of this report have no competing interest in this subject and the preparation of this report is totally funded by the Ministry of Health, Malaysia.
EXECUTIVE SUMMARY BackgroundBreast cancer is the commonest cancer among women and the commonest cause of cancer death worldwide. Similarly in Malaysia, it was reported to be the commonest cancer in women with overall age standardized incidence rate (ASR) of 29.1 per 100,000 population (National Cancer Registry 2007), higher than incidence in other developing countries (ASR of 20 per 100,000 population). About 30 to 40% of Malaysian women presented at a later stage of breast cancer (stage III and IV). Hence, affordable and effective approaches in cancer control are needed for early detection, diagnosis and treatment of breast cancer particularly in the less developed countries. The growing public awareness of breast cancer and its risk factors, with availability of medical and surgical risk reduction options has led consultation of many women on their breast cancer risk. Considerable effort has been directed at identifying risk factors and developing risk prediction models for breast cancer. Prediction model is a mathematical equation designed to quantify the risk an individual woman would develop a particular cancer in a defined period. It provides an estimation of disease risk that can be used to guide management for women at all level of risks. Multiple prediction models have been developed to assist with breast cancer risk prediction efforts. Reliable accurate prediction models can inform future disease burdens, health policies, individual decisions on future screening behaviour and adoption of risk reduction strategies, counsel those at risk, design prevention strategies for at risk populations and plan intervention trials. Subsequently, the adoption of such models should guide decision-making, improve patient outcomes and the cost-effectiveness of care. Given the variance in breast cancer risk, surveillance and primary prevention adapted to individual risk level may be the most effective use of resources for preventing, detecting and improving breast cancer survival.
HTA Report: Breast cancer risk prediction model for Health Risk Assessment (HRA) module
v
In Malaysia, currently there is no breast cancer risk assessment/prediction model in the prediction of individual risks of developing breast cancer in existing health risk assessment (HRA) module of Ministry of Health. An opportunistic screening policy is currently being practiced for breast cancer in Malaysia by means of both primary and secondary prevention approach as part of cancer control strategy. Therefore, there is a need to assess the feasibility of having a risk assessment/prediction model as a HRA module in enhancing early detection of breast cancer by capturing wider coverage of general population. Introduction of a risk assessment/risk prediction model for breast cancer is timely in addressing unmet needs of identifying high risk individuals in the Malaysian community, towards enhancing early detection of breast cancer in facilitating more effective cancer control strategies. This assessment was requested by a Senior Principal Assistant Director, Health Education Division, Ministry of Health.
Technical featuresA risk prediction model is a statistical tool for estimating the probability that a currently healthy individual with specific risk factors will develop a future condition, such as breast cancer, within a certain time. It uses multiple predictors (covariates) to estimate the probability or risk that a certain outcome is present. The goal of risk prediction is to provide individualised risk (absolute risk) with associated measures of uncertainty thus stratifying individuals by these risks. It is accomplished by combining the baseline risk of developing the condition with an individual’s risk score. The baseline risk of the condition represents the underlying population risk for patients whose risk factor values are not present, which is usually estimated from a prospective population-based cohort study. The risk-score component shows how much the baseline risk is multiplied for increasing values of the risk factors, which may also be estimated using a cohort study or for rare conditions, a case-control study. The variables in the model can be any combination of environmental, behavioural, genetic or psychological attributes of the person. Developed models need to provide accurate and validated (internally and externally; temporal, geographical and domain/setting) estimates of disease probabilities. Performance of predictive tests is commonly measured by means of calibration (the ability to predict the number of events in subgroups of the population) and discrimination (the ability to distinguish at the individual level between those who will develop the disease and those who will not). Calibration performance is commonly reported by E/O statistics comparing expected (E) and observed (O) number of events, and discrimination performance by concordance (c)-statistics. Performance of the model may also vary according to the population they are applied to. Cancer risk prediction model is classified into absolute risk prediction model aimed at assessing probability that an individual with given risk factors and a given age will develop cancer over a defined period of time (such as Gail model); and gene carrier status risk prediction models aimed at assessing mutation probability of an individual or carrying a gene mutation that predisposes to a particular cancer (such as BOADICEA, BRCAPRO, Cuzick-Tyrer (IBIS models) and Manchaster Scoring System). Each model has unique attributes stemming from the methodology, sample size and population characteristics used to create the model.
Policy question i. In Ministry of Health, should a breast cancer risk prediction model for health risk assessment
(HRA) module be introduced as one of the strategies in the prevention of breast cancer under the Malaysia National Cancer Control Programme?
ii. If breast cancer risk prediction model for HRA module is to be introduced, which risk prediction model should be adopted in Malaysia?
Objectives i. To assess the effectiveness in term of predictive accuracy of breast cancer risk assessment/
prediction models among women ii. To assess the safety, organizational, ethical issues and economic implications related to risk
assessment/prediction models for breast cancer among women
MethodsStudies were identified by searching electronic databases. The following databases were searched through the Ovid interface: MEDLINE(R) In-process and other Non-Indexed Citations and Ovid MEDLINE(R) 1946 to present. EBM Reviews-Cochrane Database of Systematic Reviews (2005 to May 2015), EBM Reviews-Cochrane Central Register of Controlled Trials (May 2014), EBM Reviews – Database of Abstracts of Review of Effects (2nd Quarter 2015), EBM Reviews-Health Technology Assessment (2nd Quarter 2015), EBM Reviews-NHS Economic Evaluation Database (2nd Quarter 2015). Parallel searches were run in PubMed. Appendix 3 showed the detailed search strategies. No limits were applied to the search. The last search was run on 20 March 2015. From cross referencing
HTA Report: Breast cancer risk prediction model for Health Risk Assessment (HRA) module
vi
of retrieved articles, additional articles were identified. All relevant literature was appraised using the Critical Appraisal Skills Programme (CASP) tool. All full text articles were graded based on guidelines from the U.S./Canadian Preventive Services Task Force.
Results A total of 830 titles were identified through Ovid interface, Pubmed and references of retrieved articles. A total of 123 abstracts were screened using the inclusion and exclusion criteria resulting in 58 potentially relevant articles. After the critical appraisal, only 14 full texts out of the above were finally included in this review comprising of two systematic reviews, one randomised controlled trial and eleven observational studies (eight cohorts and three cross sectional). No evidence on cost-effectiveness or cost-utility analysis was retrieved.
Of these, eleven articles were related to the effectiveness (predictive accuracy) of risk assessment/ risk prediction/ health risk assessment models for breast cancer, which were two systematic reviews and nine observational studies (eight cohort and two cross sectional). The other two articles were related to safety of risk prediction models for breast cancer. The articles were published between 2009 and 2015. The included systematic reviews were both published in 2012. Most of the observational studies were conducted in the U.S.A., with one each from Italy, Singapore, Thailand and Korea.The total pooled sample size of included studies was 437,049 subjects. Sample sizes for each of the observational studies ranged from 690 to 135,329 subjects. The length of follow-up ranged from five years to ten years.
Effectiveness (predictive accuracy) Models being assessed were Gail model (also known as Breast Cancer Risk Assessment Tool) including Gail 1 and Gail 2 (updated) model, Contraceptive and Reproductive Experience (CARE) model, model by Petracci, model by Pfeiffer, Vermont model, model by Anothaisintawee and BWHS model.
Performance of prediction model is commonly measured by means of calibration and discrimination. A well-fitted model has Expected/Observed (E/O) ratio close to 1, a number lower underestimates the condition’s incidence and a number higher overestimates the incidence. The concordance (c)-statistics measure model discrimination performance which is similar to area under the receiver operating characteristic curve (ROC). A c-statistics of 1.0 indicates perfect discrimination and 0.5 equivalents to no discrimination between people who develop the condition and those who do not.
Performance of Gail model (also known as Breast Cancer Risk Assessment Tool, BCRAT)Gail 1 model estimates the absolute risk for both invasive and insitu breast cancer (ductal and lobular), derived from data of the Breast Cancer Detection Demonstration project. Gail 2 model is a modification of Gail 1, used to estimate the risk of invasive breast cancer using data from Surveillance, Epidemiology and End Result (SEER) Programme of the US National Cancer Institute.
i. Calibration performance • Validation cross-population showed underestimation of breast cancer cases in two studies,
overestimation of breast cancer cases was observed in one study37 and pool result showed it has good calibration
• PoolE/Oratiowas1.13(95%CI0.80to1.60)forGail1model(I-squared:95.0%)and0.95(95%CI 0.92 to 1.02) for Gail 2 model (I-squared: 92.5%)
• E/O ratio ranges from 0.86(95% CI 0.82 to 0.90), 0.87(95% CI 0.85 to 0.89) in white post-menopausal women aged 50 to 74 years, to E/O ratio of 0.85(95% CI 0.83 to 0.88) in Hispanic and non-Hispanic post-menopausal women aged 50 to 79 years; both in US for Gail 2 model
• E/Oratiowas1.85(95%CI1.68to2.04)amongwomenaged50to64inSingaporeforGail2model
Updating the Gail 2 model improved models calibration • E/Oratioof1.03(95%CI1.00to1.05) [using Surveillance Epidemiology End Result (SEER) breast cancer incidence and mortality
1995 to 2003)]• E/Oratioof1.00(95%CI0.94to1.08)(usingSEER2003to2006)ii. Discriminative ability • Poolconcordance(c)-statisticswas0.63forGail2model(I-squared:94.5%)
HTA Report: Breast cancer risk prediction model for Health Risk Assessment (HRA) module
vii
• Overallareaundercurve(AUC)andc-statisticsrangesfrom0.54to0.63forGail2modelinthethree validation studies in the US
- [0.58 in the US white post-menopausal women aged 50 to 74 years, between 0.58 (95% CI 0.56 to 0.58) for non-Hispanic white and 0.63 (95% CI 0.58 to 0.67) for Hispanic US postmenopausal women aged 50 to 79and 0.54 (95% CI 0.52 to 0.56) among Vermont women aged 70 years and older]
Performance of Contraceptive and Reproductive Experience (CARE) modeli. Calibration performance• Validation in a single study showed underestimation of breast cancer cases with E/O ratio of
0.88 (95% CI 0.82 to 0.94) among black women aged 30 to 69 yearsii. Discriminative ability• Age-specific c-statistics for total invasive breast cancer was 0.57 (95% CI 0.55 to 0.59)• Age-adjusted c-statistics for specific breast cancer subtypes: 0.59 (95% CI 0.57 to 0.61)(Estrogen receptor positive (ER+) breast cancer) 0.54 (95% CI 0.50 to 0.57)(Estrogen receptor negative (ER-) breast cancer)
Performance of model by Petracci i. Calibration performance• Validation in a single study showed the model was well calibrated with E/O ratio of 1.10 (95% CI
0.96 to 1.26) among Italian women aged 35 to 64 yearsii. Discriminative ability • c-statistics was 0.62 (95% CI 0.55 to 0.69)(women younger than 50 years)• c-statistics was 0.57(95% CI 0.52 to 0.61)(women more than 50 years)
Performance of model by Pfeiffer i. Calibration performance• Validation in a single study showed the model was well calibrated with E/O ratio of 1.00 (95% CI:
0. 96 to1.04) among white women aged 30 to 55 yearsii. Discriminative ability • Overall AUC was 0.58 (95% CI 0.57 to 0.59) in the above validated population
Performance of Vermont modeli. Discriminative ability Validation in a single study showed the model discriminative power was modest with c-statistics
of 0.55 (95% CI 0.53 to 0.58) among Vermont women aged 70 years and older
Performance of model by Anothaisintaweei. Calibration performance• Validation in a single study showed the derived model was well calibrated with O/E ratio of 1.00
(95% CI 0.82 to 1.21) ii. Discriminative ability • C-statistics (overall) was 0.65 (95% CI 0.59 to 0.70) for prediction of breast cancer cases
Performance of BWHS modeli. Calibration performance• Validation in a single study showed the BWHS model was well calibrated with E/O ratio of 0.96
(95% CI 0.88 to 1.05) ii. Discriminative ability • AUC (overall) was 0.59 (95% CI 0.56 to 0.61)
Safety• The only reported adverse event was anxiety Women who had higher risk status had an odd of
having increased anxiety about 5 times greater than women who had lower risk status (OR 5.03; 95% CI 1.54 to 16.43)
• About 18.9% of subjects disagree with tailored risk associated with BCRAT (Gail model)
Cost implication• No evidence retrieved on breast cancer risk assessment/prediction model
HTA Report: Breast cancer risk prediction model for Health Risk Assessment (HRA) module
viii
• Potential direct cost implicated on the designing, developing, testing and commissioning of available one breast cancer risk prediction model into a health risk assessment module was given at approximately RM75,000
Organizational Computerized risk estimate using any model requires computer literate user/patient and internet access.
Cancer risk prediction model needs to be continually calibrated and revalidated. The complexity of prediction modelling research from developing and internally validating a prediction model, testing, adjusting or updating the model for other individuals (external validation); and assessing its impact on therapeutic management and patient outcomes need a dedicated research expertise. Uncertainties associated with risk estimates should be addressed and informed particularly when clinical decision has serious consequences.
Among ethical issues that arose following cancer risk assessment was psychological harms resulting from being labelled ‘at risk’, and additional diagnostic procedures that can artificially increase sense of risk. The ‘at risk’ label also has implication for future health care cost. Theoretically increased psychological distress from risk labelling may contribute to other healthcare demands and raising the health care cost.
ConclusionThere was sufficient good level of retrievable evidence for breast cancer risk prediction model. There were six models identified for predicting breast cancer risk with Gail model is the most widely studied and validated model in various population. The Gail model appeared to have good calibration in validation studies done cross-population; however there is considerable heterogeneity across studies. This model showed moderate performance in terms of discriminatory ability.
For other risk prediction models, there was insufficient good level of retrievable evidence with only one study each of those other models (CARE model, model by Petracci, model by Pfeiffer, Vermont model, model by Anothaisintawee and BWHS model). The models were well calibrated in the validated population however appeared modest in discriminating woman who will be having breast cancer, than for those who will not in the study population.
There was insufficient evidence on the safety related to cancer risk prediction models for the detection of women who will develop breast cancer. Although there was minor adverse psychological sequale reported among high risk women who demonstrated to be five times more likely to have increased anxiety, it may be considered relatively safe.
There was no retrievable evidence on economic evaluation of health risk assessment or risk prediction model for breast cancer, or cost implication involved in developing a new risk prediction model without genetic component for breast cancer retrieved. The cost involved in validating a model by a prospective cohort validation study could be very costly depending on the number of study participants and years of follow up. However potential direct cost implicated to the designing, developing, testing and commissioning of available one breast cancer prediction model was given approximately at RM75,000.
Cancer risk prediction models need continual validation to give meaningful risk estimate and to ensure its applicability in the setting it will be used. The complexity to develop and subsequently validate any breast cancer risk prediction model specifically models without genetic component is reflected in the necessary local data required and availability of dedicated research expertise to create a robust model with consistent performance.
RecommendationAlthough the above review showed that the Gail model had good calibration and moderate discriminative ability, it is not suitable to be introduced as one of the strategy in the prevention of breast cancer under the Malaysian National Cancer Control Programme yet as it needs further validation to develop a well-fitted model that would have better predictive ability tailored to Malaysian population. In addition, this model needs continual validation to determine the consistency of its performance.
HTA Report: Breast cancer risk prediction model for Health Risk Assessment (HRA) module
ix
TABLE OF CONTENTS
Disclaimer i
Authors and Information specialist ii
Expert committee ii
External reviewers iv
Acknowledgement and Disclosure iv
Executive summary iv
Abbreviations x
1 BACKGROUND 1
2 TECHNICAL FEATURES 3
3 POLICY QUESTION 7
4 OBJECTIVES 7
5 METHODS 8
6 RESULTS 9
6.1. Study description 10
6.1.1. Risk of bias 11
6.1.2. Review of Gail model 11
6.2. Effectiveness (predictive accuracy) of breast cancer risk prediction models 12
6.2.1. Gail model 12
6.2.2. CARE model 13
6.2.3 Other breast cancer risk prediction models 13
6.2.4. Comparison of breast cancer risk prediction models 27
6.3. Safety 32
6.4. Cost implication 35
6.5. Organizational 36
7 DISCUSSION 37
8 CONCLUSION 40
9 RECOMMENDATION 40
10 REFERENCES 41
APPENDICES
Appendix 1- Hierarchy of evidence for effectiveness studies 44
Appendix 2- Health Technology Assessment Protocol 45
Appendix 3- Search strategy 48
Appendix 4- CASP checklist 51
Appendix 5- Evidence Table (Included studies) 52
Appendix 6- List of excluded studies 69
HTA Report: Breast cancer risk prediction model for Health Risk Assessment (HRA) module
x
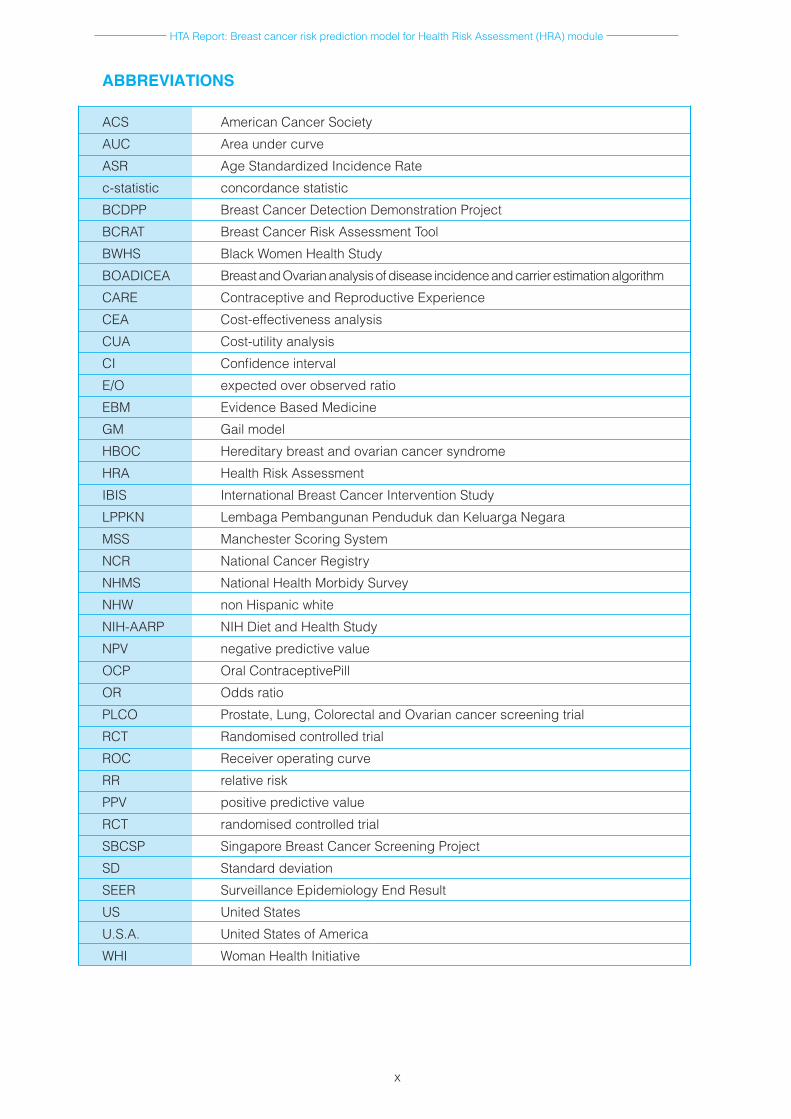
ABBREVIATIONS
ACS American Cancer Society
AUC Area under curve
ASR Age Standardized Incidence Rate
c-statistic concordance statistic
BCDPP Breast Cancer Detection Demonstration Project
BCRAT Breast Cancer Risk Assessment Tool
BWHS Black Women Health Study
BOADICEA Breast and Ovarian analysis of disease incidence and carrier estimation algorithm
CARE Contraceptive and Reproductive Experience
CEA Cost-effectiveness analysis
CUA Cost-utility analysis
CI Confidence interval
E/O expected over observed ratio
EBM Evidence Based Medicine
GM Gail model
HBOC Hereditary breast and ovarian cancer syndrome
HRA Health Risk Assessment
IBIS International Breast Cancer Intervention Study
LPPKN Lembaga Pembangunan Penduduk dan Keluarga Negara
MSS Manchester Scoring System
NCR National Cancer Registry
NHMS National Health Morbidy Survey
NHW non Hispanic white
NIH-AARP NIH Diet and Health Study
NPV negative predictive value
OCP Oral ContraceptivePill
OR Odds ratio
PLCO Prostate, Lung, Colorectal and Ovarian cancer screening trial
RCT Randomised controlled trial
ROC Receiver operating curve
RR relative risk
PPV positive predictive value
RCT randomised controlled trial
SBCSP Singapore Breast Cancer Screening Project
SD Standard deviation
SEER Surveillance Epidemiology End Result
US United States
U.S.A. United States of America
WHI Woman Health Initiative
HTA Report: Breast cancer risk prediction model for Health Risk Assessment (HRA) module
1
BREAST CANCER RISKPREDICTION MODEL FOR HEALTH RISK
ASSESSMENT MODULE
1 BACKGROUND
Breast cancer is the most commonly diagnosed cancer among women worldwide which represents 1 in 4 of all cancers and the most common cause of cancer death (522,000 deaths in 2012). World-wide, it is also the second most commonly diagnosed cancer. Globally, the incidence is rising with 1.7 million women were diagnosed with breast cancer in 2012 and mortality has increased by 14% since the 2008 estimates.1 Incidence rates is higher in more developed region, however mortality is much higher in less developed countries due to lack of early detection and access to treatment fa-cilities.1 In Malaysia, the National Cancer Registry (NCR) 2007 reported that breast cancer was the most commonly diagnosed cancer in women with overall age standardized incidence rate (ASR) of 29.1 per 100,000 population.2 Though ASR was dropped from 39.3 per 100,000 population in 2006,3 it was higher than incidence in other developing countries with ASR of 20 per 100,000 population.4 The rising incidence is worsened by the fact that about 30 to 40% of Malaysian women presented at a later stage of breast cancer (stage III and IV) compared to other counterparts in the developing countries.5 The increase has been said related to changes in dietary and reproductive pattern, ur-banization and ageing population.6,7 Hence, affordable and effective approaches in cancer control are needed for early detection, diagnosis and treatment of breast cancer particularly in the less developed countries.1
The growing public awareness of breast cancer and its risk factors with availability of med-ical and surgical risk reduction options has led consultation of many women on their breast cancer risk.8 The widely quoted general population lifetime risk of having breast cancer is one in eight to one in 12, and the risk in any given decade was never greater than one in 30. The proportion of all female deaths due to breast cancer per decade is never greater than 20% with the greatest propor-tion from the middle age group (35 to 55 years).9 For familial breast cancer, approximately five to ten percent of cases occur in women with Hereditary Breast Ovarian Cancer Syndrome (HBOC), which has mutation in BRCA1 and BRCA2 genes.10 Women with BRCA1 and BRCA2 mutation have a 50% to 80% lifetime risk of breast cancer. These women also have a 40% to 60% lifetime risk of having contralateral breast cancer.10,11 Specific BRCA mutation is clustered among certain ethnic groups such as Ashkenazi Jews, in the Netherlands, Iceland and Sweden. A woman’s breast cancer risk is an important consideration when making recommendation about screening mammography as screening is more beneficial for those at higher risk of developing the disease.12 The organized breast cancer screening programmes using mammography has been well established in Europe and Northern America resulting in improved five year survival rate, as high as 89%.13 Providing breast cancer screening programme using mammography to every woman in most developing countries is not feasible, thus identifying women with relatively higher risk of developing breast can-cer is a promising alternative.14
Considerable effort has been directed at identifying risk factors and developing risk pre-diction models for breast cancer. Multiple prediction models have been developed to assist with breast cancer risk prediction efforts.10 Prediction model of breast cancer is a mathematical equation designed to quantify the risk an individual woman would develop breast cancer in a defined peri-od.14 Accurate breast cancer risk assessment is vital to personalize screening and risk reduction strategies.8Reliably accurate prediction models can inform future disease burdens, health policies and individual decisions, as well as to counsel those at risk and determine eligibility for prospective prevention trial.15,16 These empirically derived models are used in clinical setting to guide decision making about future screening behaviour or adoption of risk reduction strategies.17 These models
HTA Report: Breast cancer risk prediction model for Health Risk Assessment (HRA) module
2
have been used to estimate the costs of population burden of cancer, plan intervention trials, cre-ate benefit-risk indices and design prevention strategies for at risk populations.18 It is also meant to personalize management strategies for all women with the aim of increasing survival in high-risk women while decreasing cost and complications in low-risk women.19 Given the variance in breast cancer risk, surveillance and primary prevention adapted to individual risk level may be the most effective use of resource for preventing, detecting and improving breast cancer survival.17
Risk factors are often required as input variables in the prediction model.14 These risk factors need to be assessed to evaluate its risk over time including family history, hormonal and reproduc-tive risk factors such as the use of exogenous hormones (estrogen and progesterone), endogenous hormonal factors (ages at menarche, menopause and first childbirth), and environmental risks such as alcohol intake, diet, exercise, obesity, as well as increase breast density.20 The Malaysian CPG on Management of breast cancer stratify risk factor as low (relative risk RR 1.0 to 1.4), moderate (RR 1.5 to 2.0) and high (RR of more than 2.0).21 Models containing modifiable risk factors are of particular interest to patients and those involved in reducing population incidence rates15 as 21% of all breast cancer deaths worldwide are attributable to alcohol use, overweight and obesity, and physical inactivity.22
Breast cancer risk assessment provides an estimation of disease risk that can be used to guide management for women at all level of risks. Risk may be assessed as likelihood of develop-ing breast cancer or as likelihood of detecting a BRCA1 or BRCA2 mutation.19 Types of cancer risk assessment models are; model aimed at assessing breast cancer risk over time or to predict proba-bility of being diagnosed with a cancer; and the other aimed at assessing mutation probability of an individual or carrying a gene mutation that predisposes to a particular cancer.6 The most commonly used models for the former type were the Gail and Claus model.19 Some of the latter models are the Breast and Ovarian Analysis Of Disease Incidence And Carrier Estimation Algorithm (BOADICEA), BRCAPRO, Couch, Shattuck Eiden, Frank, Tyrer-Cuzick (IBIS models) and Manchaster scoring.6, 19 Each model has unique attributes stemming from the methodology, sample size and population characteristics used to create the model. Understanding the strength and weaknesses of each model facilitates accurate breast cancer risk assessment.19 The Gail model provides five-year and lifetime risk estimate of having breast cancer and is accessible on the internet. The Claus model is useful for assessing breast cancer risk with a family history, similarly with BRCAPRO, BOADICEA and IBIS models which can produce both mutation probabilities and breast and ovarian cancer estimates.16
Identification of individual with a suspected heritable cancer syndrome (HBOC) has im-plications for evaluation and application of risk reducing options such as chemoprevention and prophylactic surgery.23 These underline the need for risk prediction model for breast cancer, not only to predict which women will develop the disease, but also to apply appropriate intervention and lifestyle measures in order to prevent the disease.6 Developed models first and foremost need to provide accurate and (internally and externally) validated estimates of probabilities of specific health conditions or outcomes in the targeted individuals. Subsequently, the adoption of such mod-els by professionals must guide their decision-making, improve patient outcomes and the cost-ef-fectiveness of care.24 Better understanding of these model performances, including the strengths and limitations is needed before applying them in clinical practice.
In Malaysia, currently there is no breast cancer risk assessment/prediction model in the prediction of individual risks of developing breast cancer in existing health risk assessment (HRA) module of Ministry of Health. An opportunistic screening policy is currently being practiced for breast cancer in Malaysia by means of both primary and secondary prevention approach as part of cancer control strategy.7 Therefore, there is a need to assess the feasibility of having a risk as-sessment/prediction model as a HRA module in enhancing early detection of breast cancer by cap-

HTA Report: Breast cancer risk prediction model for Health Risk Assessment (HRA) module
3
turing wider coverage of general population, in facilitating effective cancer control strategies in the country. This HTA was requested by a Senior Principal Assistant Director, Health Education Division, Ministry of Health.
TECHNICAL FEATURES
2.1 BREAST CANCER RISK PREDICTION MODEL
A risk prediction model is a statistical tool for estimating the probability that a currently healthy individual with specific risk factors (e.g. age, menopausal status) will develop a future condition, such as breast cancer, within a certain time period (such as within five years or lifetime).15 It uses multiple predictors (covariates) to estimate the probability or risk that a certain outcome is present.24
The goal of risk prediction is to provide individualized risk (absolute risk) with associated measures of uncertainty thus stratify individuals by these risks.24,25Other risk parameters of interest in clinical oncology are relative risk and survival probability.The absolute risk is an important estimate in clinical setting that assist in individual decision making. 24,25
These models are used/applied in planning cancer intervention and screening trials, assisting in creating benefit-risk indices, estimating the population burden, cost of cancer and impact of specific intervention, identifying individuals at high risk who may benefit from targeted screening or chemoprevention, designing population prevention strategies and improving clinical decision making.18
Developed models first and foremost need to provide accurate and (internally and externally) validated estimates of probabilities of specific health conditions or outcomes in the targeted individuals. Subsequently, the adoption of such models by professionals must guide their decision-making, and improve patient outcomes and the cost-effectiveness of care.24
2.2 DEVELOPING AND VALIDATING BREAST CANCER RISK PREDICTION MODEL
Risk prediction is accomplished by identifying characteristics that are associated with high or low risk of developing a disease and then combining those characteristics in a statistical model to produce probability estimate of developing the disease over a given period. 26
Risk models combine the baseline risk of developing the condition with an individual’s risk score, i.e. a score derived from their set of risk factor values multiplied by the ‘beta’ weights (e.g. log odds ratios) associated with these factors, as estimated from a statistical equation. The baseline risk of the condition represents the underlying population risk for patients whose risk factor values are all zero (or ‘not present’), and this is usually estimated from a prospective population-based cohort study. The risk-score component shows how much the baseline risk is multiplied for increasing values of the risk factors, and may also be estimated using a cohort study or, for rare conditions, a case-control study. 15
The two main statistical models used to identify important risk factors and to estimate their associated beta weights are logistic regression and Cox proportional hazards regression. 15
The variables in the model can be any combination of environmental, behavioural, genetic or psychological attributes of the person. As well as estimating risk estimates for specific individuals, risk predictions model can also make a population-based estimate of risk by using average risk factor values from the population. 15
HTA Report: Breast cancer risk prediction model for Health Risk Assessment (HRA) module
4
Initial effort at defining breast cancer risk were primarily empirical.Later estimates of breast cancer or probability of being BRCA1/2 carrier were derived using statistical techniques such as logistic regression, Bayesian analyses, genetic modelling using the method of maximum likelihood and log-incidence models.25
After a risk prediction model has been developed in a sample from a population, it then needs to be validated in further independent samples from the same population, and indeed within samples from different populations to ensure that it is reliable and generalisable. Frequently the predictive accuracy of the model is not as good in the validation sample as the original sample, and so adjustments are made leading to new or modified models being gradually developed over time. Even if the same risk factor variables are included, their beta weights may be changed which would then constitute a different model, as the risk score would then change. The performance of prediction models may also vary according to the population they are applied to, so that a model may have good accuracy in a high risk population and not in a low risk population and vice versa.15
Model validation is taking the original model or simplified score with its predictors and assigned weights (eg regression coefficient) as estimated from the development study, measuring the predictor and outcome values in the new individuals, applying the original model into these data and quantifying the model’s predictive performance. Developed models need to provide accurate and validated (internally and externally; temporal, geographical and domain/setting) estimates of disease probabilities. 24
2.3 PERFORMANCE OF CANCER RISK PREDICTION MODEL
Variety of ways is available to describe the performance of predictive tests. Many of the statistical measures used are well-known from diagnostic test studies, such as sensitivity, specificity and the AUC (area under the receiver operating characteristic curve (ROC)). In practice, only some of these statistics are reported in modelling and validation articles for risk prediction models. The two most common are the expected over observed ratio (E/O) statistic and the concordance (c) statistic, interpreted as follows:
• TheE/Ostatisticmeasuresthecalibrationperformanceof themodel.Calibrationorreliabilityassesses the ability of a model to predict the number of events in subgroups of the population.18
Calibration is most commonly evaluated by use of goodness of fit or chi-square statistic which compares the observed number (O) and expected numbers of events (E), so a well fitting model should have the number close to 1. A number lower underestimates the incidence of the condition whereas a number higher overestimates the incidence. Often E/O statistics are presented for deciles of the population defined by predicted risk, to see whether E/O is close to 1 in all deciles or not.15 Good calibration is important in all models, particularly in those used to estimate population disease burden and to plan population level intervention. Recalibration of a model can be performed when risk is systematically over or underestimated. 18
• The concordance (c) statistic which corresponds to the area under the receiver operatingcharacteristic curve measures the discrimination performance of the model. 15,18 Discrimination measures a model’s ability to distinguish at the individual level between those who will develop the disease and those who will not. It gives the proportion of randomly chosen pairs from the sample (i.e. a person with the condition paired with one without it), where the person with the condition has a higher predicted risk than the one without. AUC statistic of 0.5 is equivalent to no discrimination between people who develop the condition and those who do not, whereas 1.0 indicates perfect discrimination.15 Each point on the ROC curve shows the effect of a rule for turning of a risk estimate into a prediction of the development of breast cancer in woman. Good discrimination in a model is important for decisions made at individual level (clinical decision making and screening).18
Performance assessment of the models is commonly assessed in two ways; at the population level and at the level of individual woman. Model performance at population level is assessed by comparing the number of women in their study who the model estimated (E) would develop breast
HTA Report: Breast cancer risk prediction model for Health Risk Assessment (HRA) module
5
cancer with the number of women who actually were diagnosed with breast cancer (O) resulting in the overall E/O ratio. 26 Performance of the model could also be assessed at the individual level. At this level, a model that discriminates well should consistently predict a higher risk of breast cancer for woman who will be diagnosed with the disease, than for women who will not. Concordance statistic value ranges from 0.50 (equivalent to coin toss) to 1.0 (perfect discrimination).26
Accuracy scores including positive and negative predictive values can be used to evaluate how well a model categorizes specific individuals. This measure is especially helpful in evaluating models used for clinical decision making. However, even with good sensitivity and specificity, the positive predictive value may be low especially for rare disease.18
2.4 TYPES OF MODEL RELATED TO BREAST CANCER PREDICTION
2.4.1 Modeltodefinetheriskofdevelopingbreastcancer
Many risk prediction models have been developed that have looked at a variety of different risk factors for developing breast cancer.The number of models has grown steadily, with the most well-known is the Gail model and other available models are such as the Claus model, the Tyrer-Cuzick model and the Jonker model. 15
Among the published breast cancer risk prediction models (absolute risk prediction) are Ottman et al (1983), Anderson et al (1985), Gail et al (1989), Taplin et al (1993), Claus et al (1993), Rosner et al (1996), Colditz et al (2000), Ueda et al (2003) and Tyrer et al (2004).18
2.4.1.1 Gail model
Gail and colleagues (1989) described a risk assessment model that focuses primarily on nongenetic risk factors with limited information on family history. This model is used to estimate a woman’s risk of developing invasive breast cancer over specific periods of time. Health care providers may use this model to assess breast cancer risk, inform decision-making about chemoprevention strategies, or to help determine eligibility for clinical trials.27
The model was originally designed to determine eligibility for the Breast Cancer Prevention Trial and has been made available in the National Cancer Institute website. Individualised breast cancer probabilities from information on relative risk and baseline hazard rate are generated.6
The Gail model considers the following factors to assess breast cancer risk:- Personal medical history, including the number of previous breast biopsies and the presence of
atypical hyperplasia (a precancerous condition) in a previous biopsy- Reproductive history (age at the start of menstruation and age at the first live birth of a child)- Family history of breast cancer among first-degree relatives
Limitation:- The model considers limited information about family breast cancer history, which could
underestimate risk - It does not include several breast cancer-specific risk factors, such as personal history of
breast cancer, use of hormone replacement therapy, breast density, breast feeding, or age at menopause
- It does not include lifestyle factors that may increase risk, such as smoking, alcohol consumption, diet or physical inactivity
HTA Report: Breast cancer risk prediction model for Health Risk Assessment (HRA) module
6
2.4.1.2 Breast Cancer Risk Assessment Tool (BCRAT)
The Gail model 1 is publicly available in a slightly modified version as the Breast Cancer Risk Assessment Tool (http://www.cancer.gov/bcrisktool)27. The Breast Cancer Risk Assessment Tool is based on the Gail model. This tool has been tested (validated) using data from large studies of women and been shown to provide accurate estimates of breast cancer risks in white women as well as African American and Asian and Pacific Islander women in the United States.
This online tool estimates a woman’s risk of developing invasive breast cancer over a 5-year time period and over her lifetime.
The tool estimates breast cancer risk based on the following risk factors: - Age- Age at first period- Age at first live birth of a child- Family history of breast cancer- Personal history of breast cancer- Number of past breast biopsies, including number of breast biopsies that showed atypical
hyperplasia (a precancerous condition that increases breast cancer risk)- Race/ethnicity
Its score provides an estimate of the average risk for a group of women with similar risk factors. For example, if the tool gives a score of 1.7 per cent, this means that an estimated 1.7 per cent of women with similar risk factors will develop breast cancer in the next 5 years. Limitations of this model are similar to those of Gail model.
2.4.2 Modeltodefinetheriskofbeingacarrierofmutationinbreastcancersusceptibilitygene
Among the published breast cancer risk prediction models (for gene carrier status) or genetic risk models are Couch et al (1997),Shattuck-eidens et al (1997), Parmigiani et al (1998), Berry et al (1998), Frank et al (1998), Antoniou et al (2002), de la Hoya et al (2002), Vahteristo et al (2001), Apicella et al (2003), Jonker et al (2003) and others.18
Some of the widely used mutation carrier prediction algorithms are Breast and Ovarian Analysis of Disease Incidence and Carrier Estimation Algorithm (BOADICEA), BRCAPRO, IBIS and eCLAUS model. These models assume an underlying genetic model for breast cancer susceptibility.28
2.4.2.1 Breast and Ovarian Analysis of Disease Incidence and Carrier Estimation Algorithm (BOADICEA)
The BOADICEA is a computer program (risk prediction model) used to calculate the risks of breast and ovarian cancer in women based on their family history. It is also used to compute BRCA1 and BRCA2 mutation carrier probabilities and age specific risk of breast and ovarian cancer. It also estimates the likelihood of a woman developing breast cancer in five years, and over the course of her lifetime. The tool is used to help inform a woman’s decision-making about genetic counselling and testing. The programme is free for anyone to use and risk can be calculated using the BOADICEA Web application. It was developed using complex segregation analysis of breast and ovarian cancer based on a combination of families identified through population based studies of breast cancer and families with multiple affected individuals who had been screened for BRCA1/2 mutations.27
The tool estimates breast cancer risk based on:- Family cancer history- Genetic mutation status
HTA Report: Breast cancer risk prediction model for Health Risk Assessment (HRA) module
7
Results: A decision to go for genetic counselling is usually made when the model predicts a 10% or greater chance that the patient has a mutation of the BRCA1, BRCA2, or both genes. Limitation:- The major limitation of this tool is that it only considers genetic mutation status and family history.
It does not take any other breast cancer risk factors into account. - The tool was developed using data for the United Kingdom. It may be applicable to populations in
other high-income countries; however estimations of risk in other populations may be unreliable.
2.4.2.2 IBIS Breast Cancer Risk Evaluation Tool
The IBIS tool (also called the Tyrer-Cuzick model) is used to calculate a person’s likelihood of carrying the BRCA 1 or 2 mutations, which are associated with increased breast cancer risk. It estimates the likelihood of a woman developing breast cancer in 10 years and over the course of her lifetime. The tool is used to help inform a person’s decision-making about genetic counselling and testing. 29
The tool estimates breast cancer risk based on the following risk factors: - Age- Age at first live birth of a child- Age at menopause- Height and weight- Use of hormone replacement therapy- Comprehensive family history
Result: Genetic counselling is advised when the model predicts a 10% or greater chance that the person has a mutation of the BRCA1, BRCA2, or both genes. The tool does not include risk factors associated with lifestyle or breast density as its limitation.29 Major advantage over BRCAPRO is that this model allows for the presence of multiple genes of differing penetrance. It does produce a readout of BRCA1/2, but also allows for a lower penetrance of BRCAX.6
2.4.2.3 BRCAPRO model
This is a Bayesian model developed by Parmigani and colleagues that incorporated published BRCA1 and BRCA2 mutation frequencies, cancer penetrance in mutation carriers, cancer status (affected, unaffected or unknown) and age of consultees’ first degree and second degree relatives. An advantage of this model is that it includes information on both affected and unaffected relatives. It also provides estimates for the likdlihood of findingeither BRCA1 or BRCA2 mutation in the family. An output that calculates breast cancer risk using the likelihood of BRCA1/2 can be utilised. Major drawback from breast cancer risk assessment aspect is that no other ‘genetic’ element is allowed for. As such, this model will underestimate risk in breast-cancer-only families.6
3 POLICY QUESTION
i. In Ministry of Health, should a breast cancer risk prediction model for health risk assessment (HRA) module be introduced as one of the strategies in the prevention of breast cancer under the Malaysia National Cancer Control Programme?
ii. If breast cancer risk prediction model for HRA module is to be introduced, which risk prediction model should be adopted in Malaysia?
4 OBJECTIVES
i. To assess the effectiveness in term of predictive accuracy of breast cancer risk assessment/prediction models among women
ii. To assess the safety, organizational, ethical issues and economic implications related to risk assessment/prediction models for breast cancer among women

HTA Report: Breast cancer risk prediction model for Health Risk Assessment (HRA) module
8
4.1 RESEARCH QUESTIONS
i. What are the effectiveness in term of predictive accuracy of breast cancer risk assessment/prediction models among women
ii. What are the safety, organizational, ethical issues and economic implications related to the use of breast cancer risk assessment/prediction models among women
5 METHODS
5.1 LITERATURE SEARCH STRATEGY
Studies were identified by searching electronic databases. The following databases were searched through the Ovid interface: MEDLINE(R) In-process and other Non-Indexed Citations and Ovid MEDLINE(R) 1946 to present. EBM Reviews-Cochrane Database of Systematic Reviews (2005 to May 2015), EBM Reviews-Cochrane Central Register of Controlled Trials (May 2014), EBM Reviews – Database of Abstracts of Review of Effects (2nd Quarter 2015), EBM Reviews-Health Technology Assessment (2nd Quarter 2015), EBM Reviews-NHS Economic Evaluation Database (2nd Quarter 2015). Parallel searches were run in PubMed. Appendix 3 showed the detailed search strategies. No limits were applied to the search. The last search was run on 20 March 2015. Additional articles were identified from reviewing the references of retrieved articles.
5.2. STUDY SELECTION Based on the policy question the following inclusion and exclusion criteria were used:-
5.3. INCLUSION CRITERIA
• Population : Adultwomanmorethan18yearsold• Intervention : Breastcancerriskassessment/riskpredictionmodel/HealthRisk
Assessment models involving single or multiple risk factors• Comparators :-• Outcome : i. Performance of available breast cancer risk prediction models
in terms of its predictive accuracy - sensitivity, specificity, positive predictive value (PPV), and negative predictive value (NPV), calibration as measured by expected/observed ratio, discrimination as measured by AUC or c-statistic
ii. Strengths and weaknesses of retrieved risk prediction model (qualitative)
iii. Effectiveness/benefit of the breast cancer risk assessment/predictive model related to patient outcome as measured by detection rate, acceptance, awareness, receptiveness
iv. Organizational (operational, training, resources), ethical, legal and economic implication
• Study design : No restriction of study type. HTA report, Systematic Review, Randomised Controlled Trial (RCT), Non Randomised Controlled Trial, diagnostic accuracy studies, Observational Studies (Cohort study, Case Control study, Cross Sectional study with gold standard), and economic evaluation studies such as cost-effectiveness / cost-utility analysis.
• Full text articles published in English.
HTA Report: Breast cancer risk prediction model for Health Risk Assessment (HRA) module
9
5.4 EXCLUSION CRITERIA:-
• Study design: Animal study, laboratory study, narrative review, case reports. • Studies on risk assessment/ risk prediction/ health risk assessment models for breast cancer
with any genetic component as risk factor • Studies in women who already had breast cancer when recruited or studies involving male subjects• Non English full text article.
Based on the above inclusion and exclusion criteria, study selection were carried out independently by two reviewers. All identified citations (titles and abstracts) were assessed for the above eligibility criteria. If it was absolutely clear from the title and / or abstract that the study was not relevant, it was excluded. If it was unclear from the title and / or the abstract, the full text article was retrieved. Full text articles were ordered for all included and possibly included citations. Two reviewers assessed the content of the full text articles and did data extraction. Disagreements were resolved by discussion.
5.5. QUALITY ASSESSMENT STRATEGY The methodological quality of all the relevant full text articles retrieved was assessed using the Critical Appraisal Skills Programme (CASP) tool by two reviewers.30 For SR the criteria assessed include selection of studies, assessment of quality of included studies, heterogeneity of included studies. For cohort study, the criteria assessed were selection of the cohort, accurate measurement of exposure and outcome, confounding factors, follow-up adequacy and length. The CASP checklist is as in Appendix 4. All full text articles were graded based on guidelines from the U.S./Canadian Preventive Services Task Force (Appendix 1).31
5.6 DATA EXTRACTION STRATEGY
Data were extracted from the included studies by a reviewer using a pre-designed data extraction form (evidence table as shown in Appendix 6) and checked by another reviewer. Disagreements were resolved by discussion. Details on : (1) methods including study design, (2) study population (3) type of intervention, (4) comparators, (5) outcome measures including economic evaluation and organizational issues were extracted. Other information on author, journal and publication year, and study objectives were also extracted. The method to assess the model performance (predictive ability) which included calibration using a ratio of expected over observed value (O/E) with 95% confidence interval or goodness of fit test and discrimination using ROC analysis or concordance statistic were recorded. If studies had validated the prediction models, the type of validations, method used, and result of validation were also recorded. Modification of the previous prediction model by the author was recorded, either by removing or modifying standard variable or adding new variable. The extracted data were presented and discussed with the expert committee.
5.7 METHODS OF DATA SYNTHESIS Data on the effectiveness (predictive accuracy), related safety issues, organizational issues and cost implication of risk assessment/ risk prediction/ health risk assessment models for breast cancer were presented in tabulated format with narrative summaries. No meta-analysis was conducted for this review.
6 RESULTS
A total of 805 titles were identified through the Ovid interface: MEDLINE(R) In-process and other Non-Indexed Citations and Ovid MEDLINE(R) 1948 to present, EBM Reviews-Cochrane Database of Systematic Reviews (2005 to March 2015), EBM Reviews-Cochrane Central Register of Controlled Trials (July 2014), EBM Reviews – Database of Abstracts of Review of Effects (1st Quarter 2015), EBM Reviews-Health Technology Assessment (1st Quarter 2015), EBM Reviews-NHS Economic Evaluation Database (1st Quarter 2015), and PubMed. Twenty-five were identified from references of retrieved articles.
After removal of 170 duplicates, 626 titles were screened. A total of 181 titles were found to be potentially relevant and 123 abstracts were screened using the inclusion and exclusion criteria. Of these, 65 abstracts were found to be irrelevant. Fifty-eight potentially relevant abstracts were retrieved in full text.
HTA Report: Breast cancer risk prediction model for Health Risk Assessment (HRA) module
10
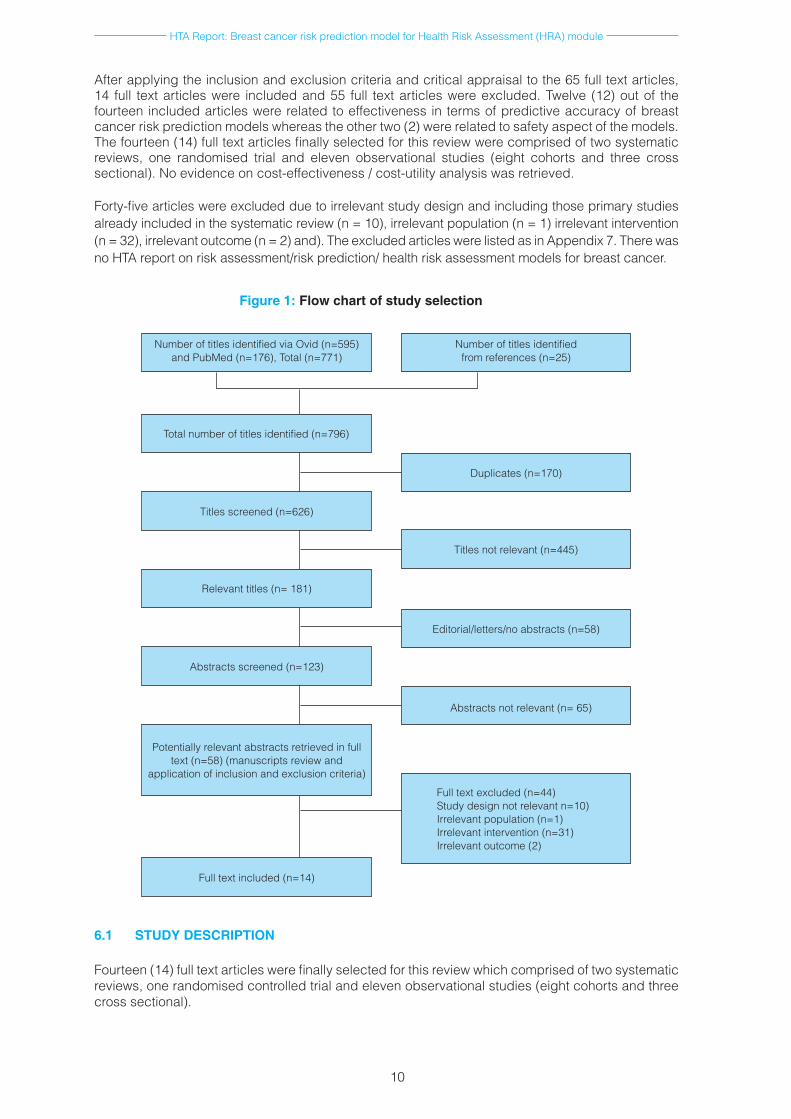
After applying the inclusion and exclusion criteria and critical appraisal to the 65 full text articles, 14 full text articles were included and 55 full text articles were excluded. Twelve (12) out of the fourteen included articles were related to effectiveness in terms of predictive accuracy of breast cancer risk prediction models whereas the other two (2) were related to safety aspect of the models. The fourteen (14) full text articles finally selected for this review were comprised of two systematic reviews, one randomised trial and eleven observational studies (eight cohorts and three cross sectional). No evidence on cost-effectiveness / cost-utility analysis was retrieved.
Forty-five articles were excluded due to irrelevant study design and including those primary studies already included in the systematic review (n = 10), irrelevant population (n = 1) irrelevant intervention (n = 32), irrelevant outcome (n = 2) and). The excluded articles were listed as in Appendix 7. There was no HTA report on risk assessment/risk prediction/ health risk assessment models for breast cancer.
Figure 1: Flow chart of study selection
Number of titles identified via Ovid (n=595) and PubMed (n=176), Total (n=771)
Total number of titles identified (n=796)
Titles screened (n=626)
Relevant titles (n= 181)
Abstracts screened (n=123)
Potentially relevant abstracts retrieved in full text (n=58) (manuscripts review and
application of inclusion and exclusion criteria)
Full text included (n=14)
Number of titles identified from references (n=25)
Duplicates (n=170)
Titles not relevant (n=445)
Editorial/letters/no abstracts (n=58)
Abstracts not relevant (n= 65)
Full text excluded (n=44)Study design not relevant n=10) Irrelevant population (n=1) Irrelevant intervention (n=31)Irrelevant outcome (2)
6.1 STUDY DESCRIPTION
Fourteen (14) full text articles were finally selected for this review which comprised of two systematic reviews, one randomised controlled trial and eleven observational studies (eight cohorts and three cross sectional).
HTA Report: Breast cancer risk prediction model for Health Risk Assessment (HRA) module
11
Of the 14 articles, twelve studies were eligible and met the inclusion criteria thus included in the effectiveness (predictive accuracy) of breast cancer risk prediction models in this review. They were two systematic reviews and ten observational studies (eight cohort studies and two cross sectional studies). The other two (2) articles were studies related to safety aspect of the models.
The included articles were published between 2009 and 2015. Both the included systematic reviews were published in 2012, in which their search were done up to June and October 2010. Most of the observational studies were conducted in the U.S.A., with one each from Italy, Singapore, Thailand and Korea. The total pooled sample size of all included studies was 437,049 subjects. Samples sizes for each of the observational studies ranged from 690 to 135,329 subjects. The length of follow-up ranged from five years to ten years.
Most of the study participants were general women without history of breast cancer at premenopausal and postmenopausal ages from white, African-American and Hispanic ethnicity. One study assessed the model performance in Asian women and one specific for Thai women. Most of the studied population were from various large cohort studies such as Black Women’s Health Study, NIH Diet & Health Study (NIH-AARP), US Prostate, Lung, Colorectal and Ovarian Screening Trial (PLCO) study; cohort of women in Vermont Breast Cancer Surveillance System underwent breast cancer screening programme, Woman Health Initiative (WHI) study, Italian Florence-EPIC cohort and Singapore Breast Cancer Screening Project.
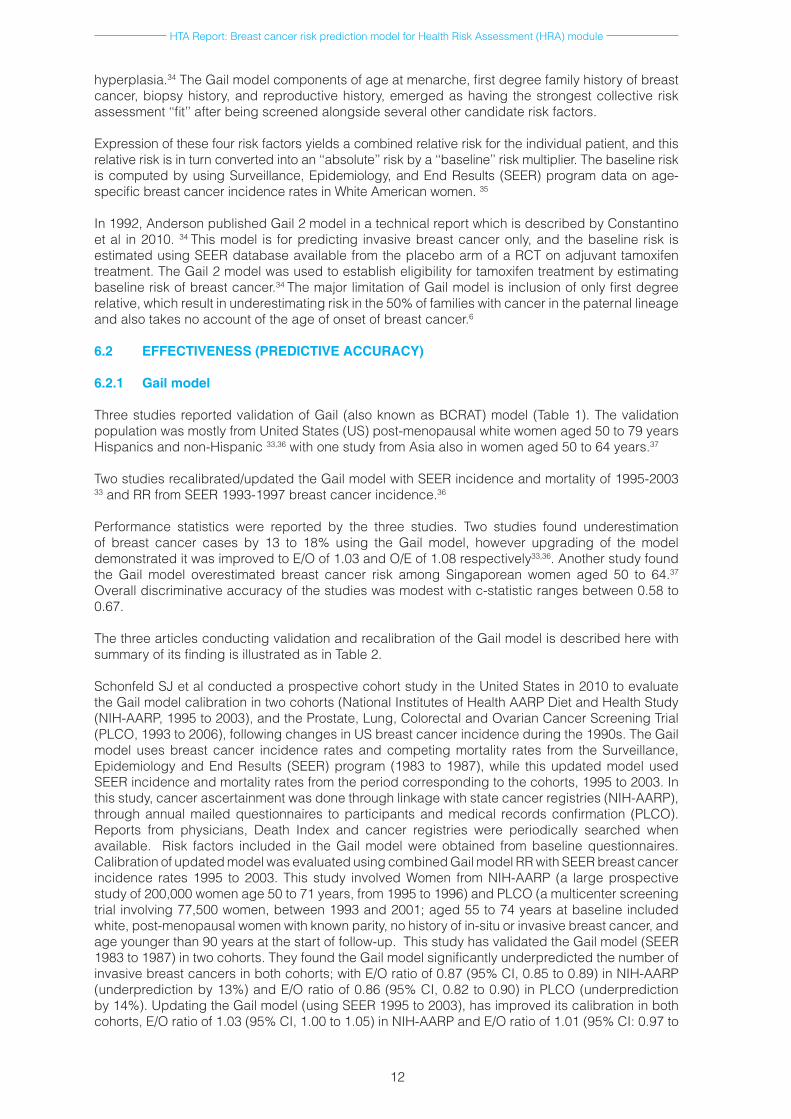
6.1.1 Risk of bias
Risk of bias in the included cohort studies are summarised as in Table 1.
Table 1: Assessment of risk of bias in included cohort studies
Criteria/Studies
Selection (cohort)
recruited in acceptable
way
Exposure accurately measured
Outcome accurately measured
Confounding factors taken into account
Follow-up complete and long enough
Schonfeld 2010 33 Yes Yes Yes Can’t tell Yes
Chay 2012 37 Yes Yes Yes Can’t tell Yes
Banegas 2012 36 Yes Yes Yes Can’t tell Yes
Boggs 2013 38 Yes Yes Yes Can’t tell Yes
Petracci 2010 40 Yes Yes Yes Can’t tell Yes
Pfeiffer 2013 41 Yes Yes Yes Yes Yes
Boggs 2015 42 Yes Yes Yes Can’t tell Yes
Vacek 2011 12 Yes Can’t tell Yes Can’t tell Yes
Cross sectional study have potentially higher risk of bias.
6.1.2 Review of Gail Model
Gail model was one of the earliest model, developed in 1989 and described here as Gail.32 It was developed through a case - control study of women participated in the American Cancer Society’s mammography feasibility study, the Breast Cancer Detection and Demonstration Project. It estimates the risk an American woman would develop invasive breast cancer over specified time interval e.g., five or ten years given age and risk factors. According to Schonfeld,33 the probability of developing breast cancer in the Gail 1 model is computed by combining relative risks (RRs) estimated from the Breast Cancer Detection Demonstration Project (BCDDP) with attributable risks, age-specific breast cancer incidence rates, and competing mortality rates from all other causes from the Surveillance, Epidemiology and End Results (SEER) program for the years 1983 to 1987.33
The six risk factors included in the model were age, age at first live birth, age at menarche, history of breast cancer in first-degree relatives, number of previous breast biopsies and history of atypical
HTA Report: Breast cancer risk prediction model for Health Risk Assessment (HRA) module
12
hyperplasia.34 The Gail model components of age at menarche, first degree family history of breast cancer, biopsy history, and reproductive history, emerged as having the strongest collective risk assessment ‘‘fit’’ after being screened alongside several other candidate risk factors.
Expression of these four risk factors yields a combined relative risk for the individual patient, and this relative risk is in turn converted into an ‘‘absolute’’ risk by a ‘‘baseline’’ risk multiplier. The baseline risk is computed by using Surveillance, Epidemiology, and End Results (SEER) program data on age-specific breast cancer incidence rates in White American women. 35
In 1992, Anderson published Gail 2 model in a technical report which is described by Constantino et al in 2010. 34 This model is for predicting invasive breast cancer only, and the baseline risk is estimated using SEER database available from the placebo arm of a RCT on adjuvant tamoxifen treatment. The Gail 2 model was used to establish eligibility for tamoxifen treatment by estimating baseline risk of breast cancer.34 The major limitation of Gail model is inclusion of only first degree relative, which result in underestimating risk in the 50% of families with cancer in the paternal lineage and also takes no account of the age of onset of breast cancer.6
6.2 EFFECTIVENESS (PREDICTIVE ACCURACY)
6.2.1 Gail model
Three studies reported validation of Gail (also known as BCRAT) model (Table 1). The validation population was mostly from United States (US) post-menopausal white women aged 50 to 79 years Hispanics and non-Hispanic 33,36 with one study from Asia also in women aged 50 to 64 years.37
Two studies recalibrated/updated the Gail model with SEER incidence and mortality of 1995-2003 33 and RR from SEER 1993-1997 breast cancer incidence.36
Performance statistics were reported by the three studies. Two studies found underestimation of breast cancer cases by 13 to 18% using the Gail model, however upgrading of the model demonstrated it was improved to E/O of 1.03 and O/E of 1.08 respectively33,36. Another study found the Gail model overestimated breast cancer risk among Singaporean women aged 50 to 64.37 Overall discriminative accuracy of the studies was modest with c-statistic ranges between 0.58 to 0.67.
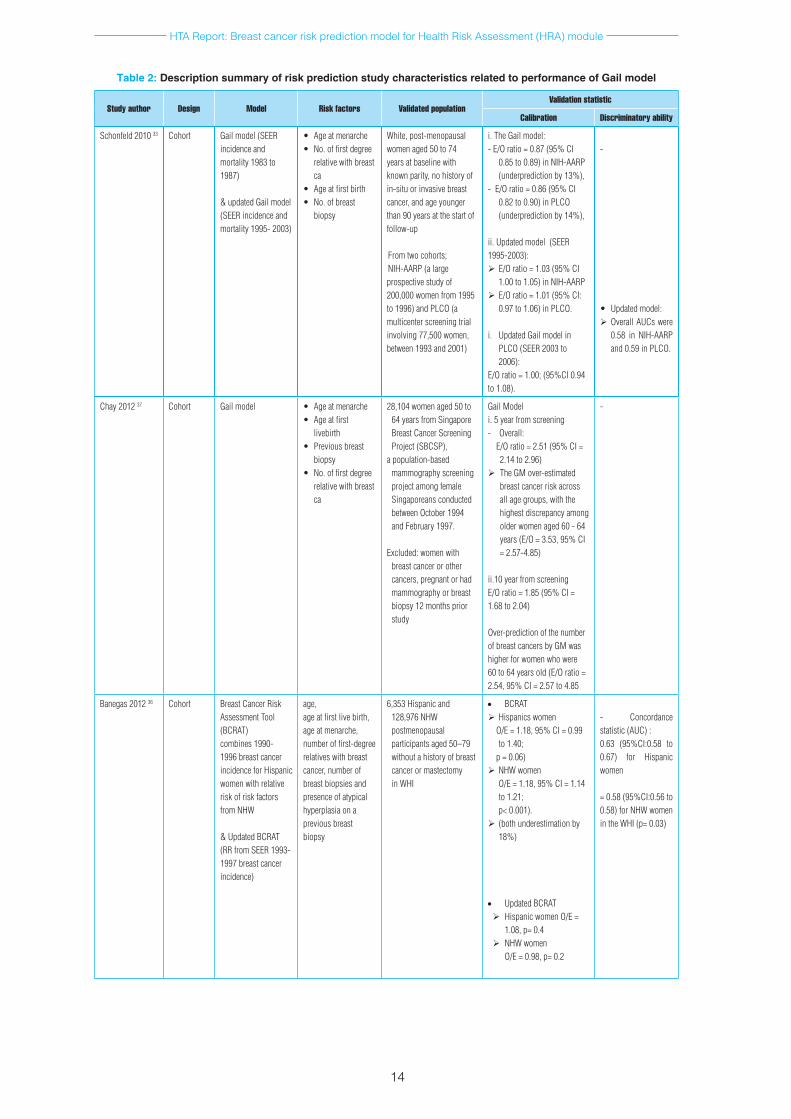
The three articles conducting validation and recalibration of the Gail model is described here with summary of its finding is illustrated as in Table 2.
Schonfeld SJ et al conducted a prospective cohort study in the United States in 2010 to evaluate the Gail model calibration in two cohorts (National Institutes of Health AARP Diet and Health Study (NIH-AARP, 1995 to 2003), and the Prostate, Lung, Colorectal and Ovarian Cancer Screening Trial (PLCO, 1993 to 2006), following changes in US breast cancer incidence during the 1990s. The Gail model uses breast cancer incidence rates and competing mortality rates from the Surveillance, Epidemiology and End Results (SEER) program (1983 to 1987), while this updated model used SEER incidence and mortality rates from the period corresponding to the cohorts, 1995 to 2003. In this study, cancer ascertainment was done through linkage with state cancer registries (NIH-AARP), through annual mailed questionnaires to participants and medical records confirmation (PLCO). Reports from physicians, Death Index and cancer registries were periodically searched when available. Risk factors included in the Gail model were obtained from baseline questionnaires. Calibration of updated model was evaluated using combined Gail model RR with SEER breast cancer incidence rates 1995 to 2003. This study involved Women from NIH-AARP (a large prospective study of 200,000 women age 50 to 71 years, from 1995 to 1996) and PLCO (a multicenter screening trial involving 77,500 women, between 1993 and 2001; aged 55 to 74 years at baseline included white, post-menopausal women with known parity, no history of in-situ or invasive breast cancer, and age younger than 90 years at the start of follow-up. This study has validated the Gail model (SEER 1983 to 1987) in two cohorts. They found the Gail model significantly underpredicted the number of invasive breast cancers in both cohorts; with E/O ratio of 0.87 (95% CI, 0.85 to 0.89) in NIH-AARP (underprediction by 13%) and E/O ratio of 0.86 (95% CI, 0.82 to 0.90) in PLCO (underprediction by 14%). Updating the Gail model (using SEER 1995 to 2003), has improved its calibration in both cohorts, E/O ratio of 1.03 (95% CI, 1.00 to 1.05) in NIH-AARP and E/O ratio of 1.01 (95% CI: 0.97 to
HTA Report: Breast cancer risk prediction model for Health Risk Assessment (HRA) module
13
1.06) in PLCO. Further updating of the Gail model (using SEER 2003 to 2006) demonstrated it was well calibrated in PLCO cohort (E/O ratio of 1.00; 95%CI, 0.94 to 1.08). The discriminatory ability was unchanged by the recalibration; with the overall AUCs for the updated model were 0.58 in NIH-AARP and 0.59 in PLCO.33
Chay WY et al had conducted a prospective cohort validation study in 2012 to evaluate the performance of the Gail Model (GM) as an appropriate breast cancer risk assessment tool in the Asian population. The study population consisted of 28,104 women aged 50 to 64 years who participated in the Singapore Breast Cancer Screening Project (SBSCP), a population-based mammography screening project among female Singaporeans conducted between October 1994 and February 1997 and did not have breast cancer during screening. Women with breast cancer or other cancers, pregnant or had mammography or breast biopsy 12 months prior study were excluded. Cancer ascertainment was done through the Singapore Cancer Registry and the National Death Register. To evaluate the performance of the GM, the expected number of invasive breast cancer cases were compared to number of actual cases observed within 5-year and 10-year follow-up. They found 144 and 409 incidence of invasive breast cancers within 5 years and 10 years from screening, respectively. In term of model calibration, The GM over-estimated the overall breast cancer risk at 5 year from screening with E/O ratio of 2.51 (95%CI 2.14 to 2.96); predicted invasive breast cancer cases were 362 cases and observed invasive breast cancer cases were 144 cases.The model was also over-estimated breast cancer risk across all age groups, with the highest discrepancy demonstrated among older women aged 60 to 64 years with E/O ratio of 3.53 (95%CI 2.57 to 4.85). Similarly at 10 year from screening the model also over-estimated overall breast cancer risk with E/O ratio of 1.85 (95%CI 1.68 to 2.04). The corresponding predicted and observed invasive breast cancer cases were 758 and 409 cases respectively. Over-prediction of the number of breast cancers by GM was higher for women who were 60 to 64 years old (E/O ratio of 2.54, 95% CI 2.57 to 4.85). Trends of E/O ratio by age group and predicted risk quintile group which were based on 10-year prediction were broadly similar to those based on 5-year prediction. The author concluded that this study validates the Gail model risk factors individually but it over-predicts the risk of invasive breast cancer in the setting of a developed Asian country, with the largest difference seen in older women aged between 60 and 64 years old. Consequently, it has become imperative to evaluate local breast cancer epidemiology in order to validate existing models of breast cancer risk. Future work should focus on the development of appropriately calibrated models for better prediction of risk, which would benefit individual counselling and cancer prevention research.37
Banegas et al in 2012 similarly carried out a cohort validation study to examine the performance of Breast Cancer Risk Assessment Tool (BCRAT) and updated BRCAT in Hispanic women in the United States. BCRAT combines 1990 to 1996 breast cancer incidences for Hispanic women with relative risk of risk factors from non Hispanic white (NHW). In this study, the relative risks, calibration and discriminatory accuracy of BCRAT risk projections for 6,353 Hispanic were compared to 128,976 NHW postmenopausal participants aged 50 to 79 in the Women’s Health Initiative study, a large longitudinal study involving Hispanic and NHW. BCRAT risk factors were obtained from the enrollment questionnaire. All reported invasive breast cancers were adjudicated locally and centrally. Calibration for an ‘updated BCRAT’ that combined BCRAT relative risks with 1993 to 2007 SEER breast cancer incidences that are simultaneous with the WHI was re-evaluated. 36
Calibration of BCRAT found that the model underestimated the number of breast cancer diagnoses by 18% among Hispanics (O/E of 1.18, 95%CI 0.99 to 1.40; p= 0.06) and by 18% as well for NHW women (O/E of 1.18, 95%CI 1.14 to 1.21; p< 0.001). The discriminatory ability of BRCAT was modest with c-statistic (AUC) of 0.63 (95%CI 0.58 to 0.67) for Hispanic women and 0.58 (95%CI: 0.56 to 0.58) for NHW women in the WHI. Validation of updated model however demonstrated an improved calibration for both Hispanic women (O/E of 1.08, p= 0.4) and NHW women (O/E of 0.98, p= 0.2). 36
6.2.2 Contraceptive and Reproductive Experience (CARE) model
We identified two studies reported on Contraceptive and Reproductive Experience (CARE) model in which one study did validation38 and another study did comparison of CARE model.39 (Table 3) The validation population was African-American women aged range from 30 to 69 years.
HTA Report: Breast cancer risk prediction model for Health Risk Assessment (HRA) module
14
Table 2: Description summary of risk prediction study characteristics related to performance of Gail model
Study author Design Model Risk factors Validated populationValidation statistic
Calibration Discriminatory ability
Schonfeld 2010 33 Cohort Gail model (SEER incidence and mortality 1983 to 1987)
& updated Gail model(SEER incidence and mortality 1995- 2003)
• Ageatmenarche• No.offirstdegree
relativewithbreastca
• Ageatfirstbirth• No.ofbreast
biopsy
White,post-menopausalwomenaged50to74yearsatbaselinewithknownparity,nohistoryofin-situorinvasivebreastcancer,andageyoungerthan90yearsatthestartoffollow-up
Fromtwocohorts;NIH-AARP(alargeprospectivestudyof200,000 women from 1995 to1996)andPLCO(amulticenterscreeningtrialinvolving77,500women,between 1993 and 2001)
i.TheGailmodel:-E/Oratio=0.87(95%CI
0.85to0.89)inNIH-AARP(underpredictionby13%),
-E/Oratio=0.86(95%CI0.82to0.90)inPLCO(underpredictionby14%),
ii.Updatedmodel(SEER1995-2003): E/Oratio=1.03(95%CI
1.00to1.05)inNIH-AARP E/Oratio=1.01(95%CI:
0.97to1.06)inPLCO.
i. UpdatedGailmodelinPLCO(SEER2003to2006):
E/Oratio=1.00;(95%CI0.94to1.08).
-
• Updatedmodel: OverallAUCswere
0.58 in NIH-AARPand0.59inPLCO.
Chay 2012 37 Cohort Gail model • Ageatmenarche• Ageatfirst
livebirth• Previousbreast
biopsy• No.offirstdegree
relativewithbreastca
28,104womenaged50to64yearsfromSingaporeBreastCancerScreeningProject(SBCSP),
apopulation-basedmammographyscreeningprojectamongfemaleSingaporeansconductedbetweenOctober1994andFebruary1997.
Excluded:womenwithbreastcancerorothercancers,pregnantorhadmammographyorbreastbiopsy12monthspriorstudy
Gail Model i.5yearfromscreening-Overall:E/Oratio=2.51(95%CI=
2.14to2.96) TheGMover-estimated
breastcancerriskacrossallagegroups,withthehighestdiscrepancyamongolderwomenaged60-64years(E/O=3.53,95%CI=2.57-4.85)
ii.10yearfromscreeningE/Oratio=1.85(95%CI=1.68to2.04)
Over-predictionofthenumberofbreastcancersbyGMwashigherforwomenwhowere60to64yearsold(E/Oratio=2.54,95%CI=2.57to4.85
-
Banegas201236 Cohort BreastCancerRiskAssessmentTool(BCRAT)combines1990-1996breastcancerincidenceforHispanicwomen with relative riskofriskfactorsfromNHW
&UpdatedBCRAT(RR from SEER 1993-1997breastcancerincidence)
age,ageatfirstlivebirth,ageatmenarche,numberoffirst-degreerelativeswithbreastcancer, number of breastbiopsiesandpresenceofatypicalhyperplasiaonapreviousbreastbiopsy
6,353Hispanicand128,976NHWpostmenopausalparticipantsaged50–79withoutahistoryofbreastcancerormastectomyinWHI
• BCRATHispanicswomenO/E=1.18,95%CI=0.99
to1.40;p=0.06)NHWwomen
O/E=1.18,95%CI=1.14to1.21;p<0.001).
(bothunderestimationby18%)
• UpdatedBCRATHispanicwomenO/E=
1.08,p=0.4NHWwomen
O/E=0.98,p=0.2
- Concordance statistic(AUC):0.63 (95%CI:0.58 to0.67) for Hispanicwomen
=0.58(95%CI:0.56to0.58)forNHWwomenintheWHI(p=0.03)
HTA Report: Breast cancer risk prediction model for Health Risk Assessment (HRA) module
15
Performance statistics were reported by one study (Boggs 2013)38 and they found underestimation of breast cancer cases by 12% using the CARE model with modest discriminative accuracy with c-statistic of 0.57 (overall), 0.59 for Estrogen Receptor positive (ER+) breast cancer and 0.54 for Estrogen Receptor negative (ER-breast cancer). Summary of these studies are illustrated in Table 3.Boggs et al in 2013 conducted a prospective cohort validation study to assess the calibration and discriminatory accuracy of the CARE model among both younger and older black women and to assess the model’s predictive ability for specific breast cancer subtypes (estrogen receptor positive (ER+) and estrogen receptor negative (ER−) breast cancer) in US. The study involved 45,942 Black women (from Black Women’s Health Study) aged 30 to 69 years at baseline, with majority (41.6%) were between 30 to 39 years at baseline. The Black Women’s Health Study (BWHS) was an ongoing follow-up study of black women (1995) involving women aged 21 to 69. Women who had a history of cancer (n = 1859) or died (n = 64) before start of follow-up or with missing information on any risk factors in the model (n = 215) were excluded in the analysis of this study. CARE model factors were obtained from the BWHS baseline questionnaire. Self-administered baseline questionnaire were collected. Biennial follow-up questionnaires ascertain incident breast cancer (self report) from 1997 to 2005, which was confirmed by medical record or by cancer registry. Median age at diagnosis was 52 years. The mean length of follow up was 9.5 years (end of follow up was 31 December 2005). They found The CARE model underestimated the number of invasive breast cancers overall by 12% in this BWHS cohort with overall E/O ratio of 0.88 (95%CI=0.82 to 0.94), predicted and observed breast cancer cases were 749.6 and 852 cases respectively. CARE model showed underprediction of breast cancer risks among all categories of age, age at menarche, number of biopsies and number of affected relatives (E/O of 0.78-0.96, 0.84-0.91, 0.76-0.91 and 0.85-1.00), underprediction was greatest among women with previous biopsy, however the differences were not statistically significant. The discriminatory power of the CARE model in black women was modest with average age-specific concordance (c) statistics for total invasive breast cancer was 0.57 (95%CI 0.55 to 0.59). The result demonstrated that discrimination was worse for ER− breast cancer with average age-adjusted c statistics of 0.59 (95%CI 0.57 to 0.61) for ER+ breast cancer and 0.54 (95%CI 0.50 to 0.57) for ER− breast cancer.38
Adams-Campbell et al in 2009 conducted a cross sectional study to compare breast cancer risk estimates using the Gail model and the CARE model. The Gail model has been used to predict invasive breast cancer risk in women, however it underestimates risk in African-American women. The Contraceptive and Reproductive Experience (CARE) model has been developed to replace the Gail model in predicting breast cancer risk in African-American women. The study population completed risk assessment forms based on age at menarche, age at first live birth, number of affected relatives and number of previous benign biopsy examinations, between 2002 and 2005 to determine risk estimates. 5-year breast cancer risk was calculated for both the Gail and CARE models in the study subjects. The proportion of women with elevated breast cancer risk (risk ≥ 1.67%) was also compared. The sudy involved 883 African-American women undergone mammography in the breast cancer screening program at Howard University Cancer Center, Washington with mean age of 53.8±10.8 years (minimum 35 years). They found the mean 5-year breast cancer risk was higher in CARE model, 1.29% (range: 0.20 to 4.50%) compared to Gail model, 0.88% (range: 0.18 to 6.60%). Similarly, the proportion of women with elevated breast cancer risk (risk ≥ 1.67%) was higher using the CARE model (21%) compared to Gail model (7%) (p< 0.0001). A large difference of proportion of elevated breast cancer risk was observed for women ≥60 years of age between CARE model (51.7%) and Gail model (14.2%). The CARE model risk predictions were higher than those from the Gail model in all risk factor categories namely age at menarche, breast biopsy, age at first live birth; and in women 40 years and older, and those with at least one or no relatives with breast cancer.39
6.2.3 Other breast cancer risk prediction model
In this section, four studies reported development of new risk prediction model and subsequent validation which has been conducted in Italy40, US41,42 and Thailand.43
The validation population varies from Italian women aged 20 to 74 years 40, non Hispanic white women with median age of 52 years 41, African American women aged between 30 and 69 years (mean age 39.9)42 and Thailand women median aged 54 years.43
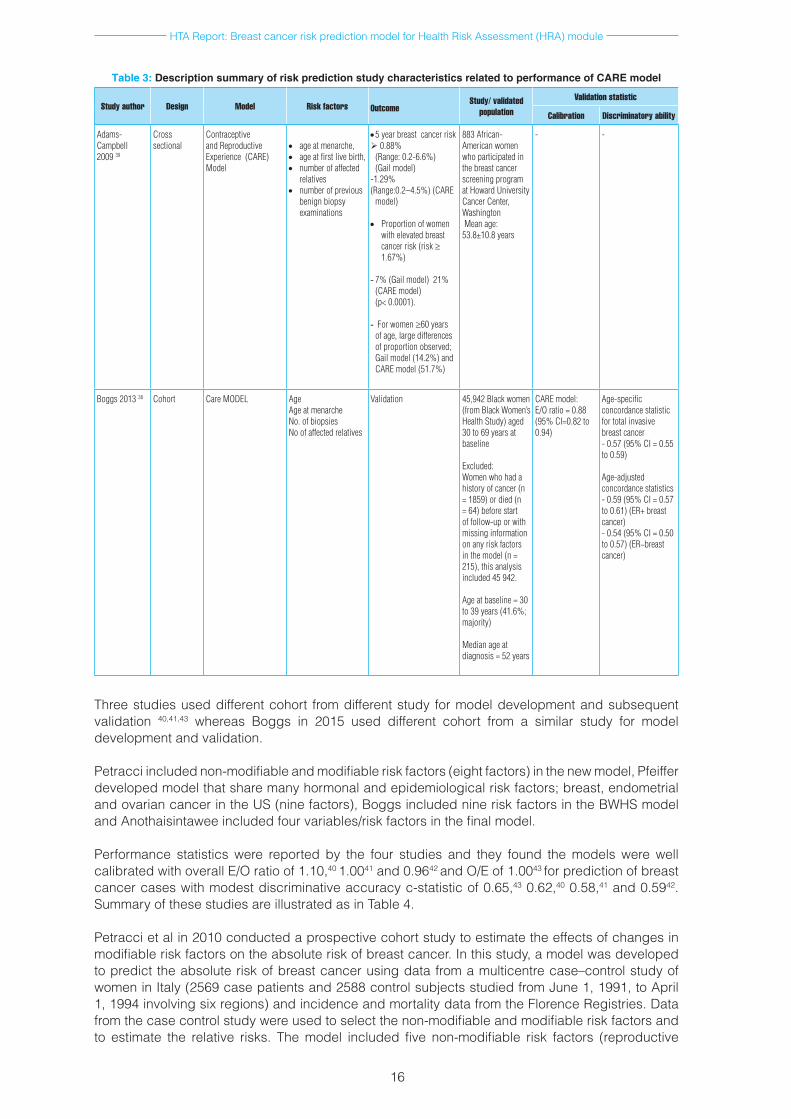
HTA Report: Breast cancer risk prediction model for Health Risk Assessment (HRA) module
16
Three studies used different cohort from different study for model development and subsequent validation 40,41,43 whereas Boggs in 2015 used different cohort from a similar study for model development and validation.
Petracci included non-modifiable and modifiable risk factors (eight factors) in the new model, Pfeiffer developed model that share many hormonal and epidemiological risk factors; breast, endometrial and ovarian cancer in the US (nine factors), Boggs included nine risk factors in the BWHS model and Anothaisintawee included four variables/risk factors in the final model.
Performance statistics were reported by the four studies and they found the models were well calibrated with overall E/O ratio of 1.10,40 1.0041 and 0.9642 and O/E of 1.0043 for prediction of breast cancer cases with modest discriminative accuracy c-statistic of 0.65,43 0.62,40 0.58,41 and 0.5942. Summary of these studies are illustrated as in Table 4.
Petracci et al in 2010 conducted a prospective cohort study to estimate the effects of changes in modifiable risk factors on the absolute risk of breast cancer. In this study, a model was developed to predict the absolute risk of breast cancer using data from a multicentre case–control study of women in Italy (2569 case patients and 2588 control subjects studied from June 1, 1991, to April 1, 1994 involving six regions) and incidence and mortality data from the Florence Registries. Data from the case control study were used to select the non-modifiable and modifiable risk factors and to estimate the relative risks. The model included five non-modifiable risk factors (reproductive
Table 3: Description summary of risk prediction study characteristics related to performance of CARE model
Study author Design Model Risk factors Outcome
Study/ validated population
Validation statistic
Calibration Discriminatory ability
Adams-Campbell 2009 39
Crosssectional
Contraceptive and Reproductive Experience(CARE)Model
• ageatmenarche,• ageatfirstlivebirth,• number of affected
relatives• numberofprevious
benignbiopsyexaminations
•5yearbreastcancerrisk0.88%
(Range:0.2-6.6%)(Gail model)
-1.29%(Range:0.2–4.5%)(CARE
model) • Proportionofwomen
withelevatedbreastcancerrisk(risk≥ 1.67%)
- 7%(Gailmodel)21%(CAREmodel)(p<0.0001).
- For women ≥60yearsofage,largedifferencesofproportionobserved;Gailmodel(14.2%)andCAREmodel(51.7%)
883African-Americanwomenwho participated in thebreastcancerscreeningprogramatHowardUniversityCancer Center, WashingtonMeanage:53.8±10.8years
- -
Boggs201338 Cohort CareMODEL AgeAgeatmenarcheNo.ofbiopsiesNoofaffectedrelatives
Validation 45,942Blackwomen(fromBlackWomen’sHealthStudy)aged30to69yearsatbaseline
Excluded:Women who had a historyofcancer(n=1859)ordied(n=64)beforestartof follow-up or with missinginformationonanyriskfactorsinthemodel(n=215),thisanalysisincluded45942.
Ageatbaseline=30to39years(41.6%;majority)
Medianageatdiagnosis=52years
CAREmodel:E/Oratio=0.88(95%CI=0.82to0.94)
Age-specificconcordancestatisticfortotalinvasivebreastcancer-0.57(95%CI=0.55to0.59)
Age-adjustedconcordancestatistics-0.59(95%CI=0.57to0.61)(ER+breastcancer)-0.54(95%CI=0.50to0.57)(ER−breastcancer)
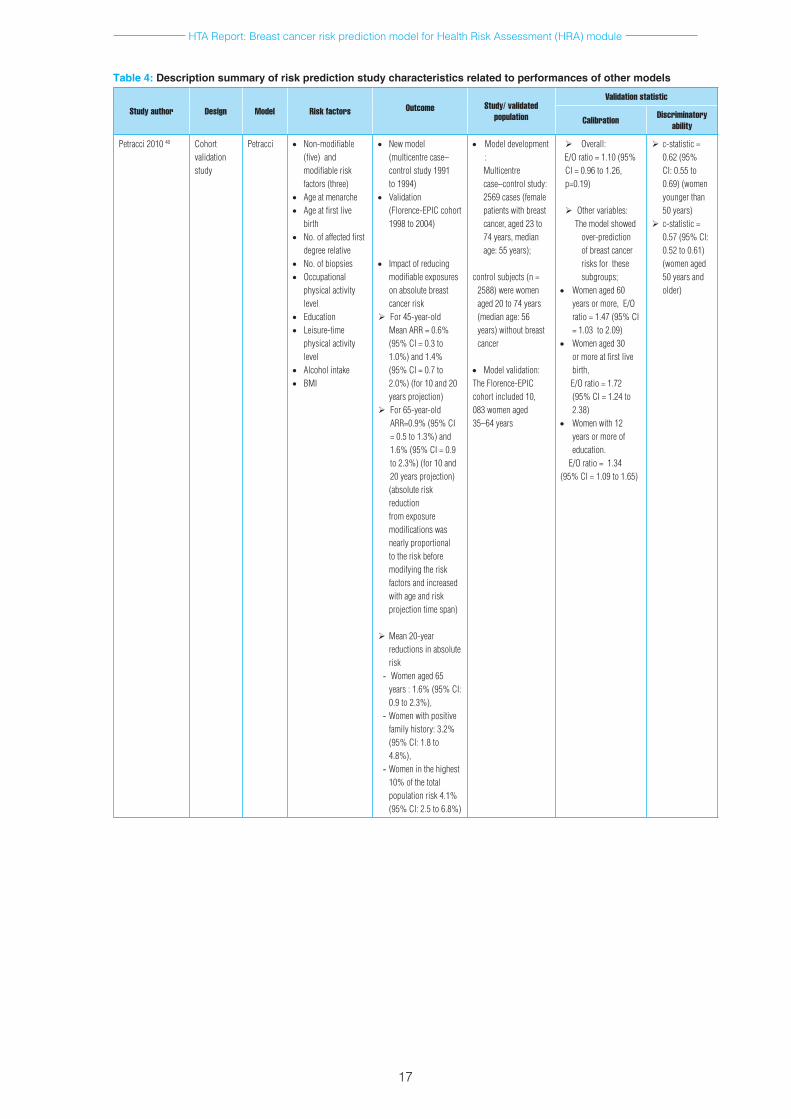
HTA Report: Breast cancer risk prediction model for Health Risk Assessment (HRA) module
17
Table 4: Description summary of risk prediction study characteristics related to performances of other models
Study author Design Model Risk factors
Outcome Study/ validated
population
Validation statistic
Calibration Discriminatory ability
Petracci201040 Cohort validation study
Petracci • Non-modifiable(five)andmodifiableriskfactors(three)
• Ageatmenarche• Ageatfirstlive
birth• No.ofaffectedfirst
degreerelative• No.ofbiopsies• Occupational
physicalactivitylevel
• Education• Leisure-time
physicalactivitylevel
• Alcoholintake• BMI
• Newmodel(multicentrecase–controlstudy1991to1994)
• Validation(Florence-EPICcohort1998to2004)
• Impactofreducing
modifiableexposuresonabsolutebreastcancerrisk
For45-year-oldMeanARR=0.6%(95%CI=0.3to1.0%)and1.4%(95%CI=0.7to2.0%)(for10and20yearsprojection)
For 65-year-old ARR=0.9%(95%CI=0.5to1.3%)and1.6%(95%CI=0.9to2.3%)(for10and20yearsprojection)(absoluteriskreduction fromexposuremodificationswasnearly proportional totheriskbeforemodifyingtheriskfactorsandincreasedwithageandriskprojectiontimespan)
Mean 20-year reductionsinabsoluterisk
- Womenaged65years:1.6%(95%CI:0.9to2.3%),
- Womenwithpositivefamilyhistory:3.2%(95%CI:1.8to4.8%),
- Womeninthehighest10%ofthetotalpopulationrisk4.1%(95%CI:2.5to6.8%)
• Model development :Multicentre case–controlstudy:2569cases(femalepatientswithbreastcancer,aged23to74years,medianage:55years);
controlsubjects(n=2588) were women aged20to74years(medianage:56years)withoutbreastcancer
• Modelvalidation:TheFlorence-EPICcohort included 10, 083womenaged35–64years
Overall:E/Oratio=1.10(95%
CI=0.96to1.26,p=0.19)
Othervariables:Themodelshowed
over-prediction ofbreastcancerrisksforthesesubgroups;
• Womenaged60yearsormore,E/Oratio=1.47(95%CI=1.03to2.09)
• Womenaged30ormoreatfirstlivebirth,
E/Oratio=1.72(95%CI=1.24to2.38)
• Women with 12 yearsormoreofeducation.
E/Oratio=1.34(95%CI=1.09to1.65)
c-statistic=0.62(95%CI:0.55to0.69)(womenyoungerthan50years)
c-statistic=0.57(95%CI:0.52to0.61)(womenaged50yearsandolder)
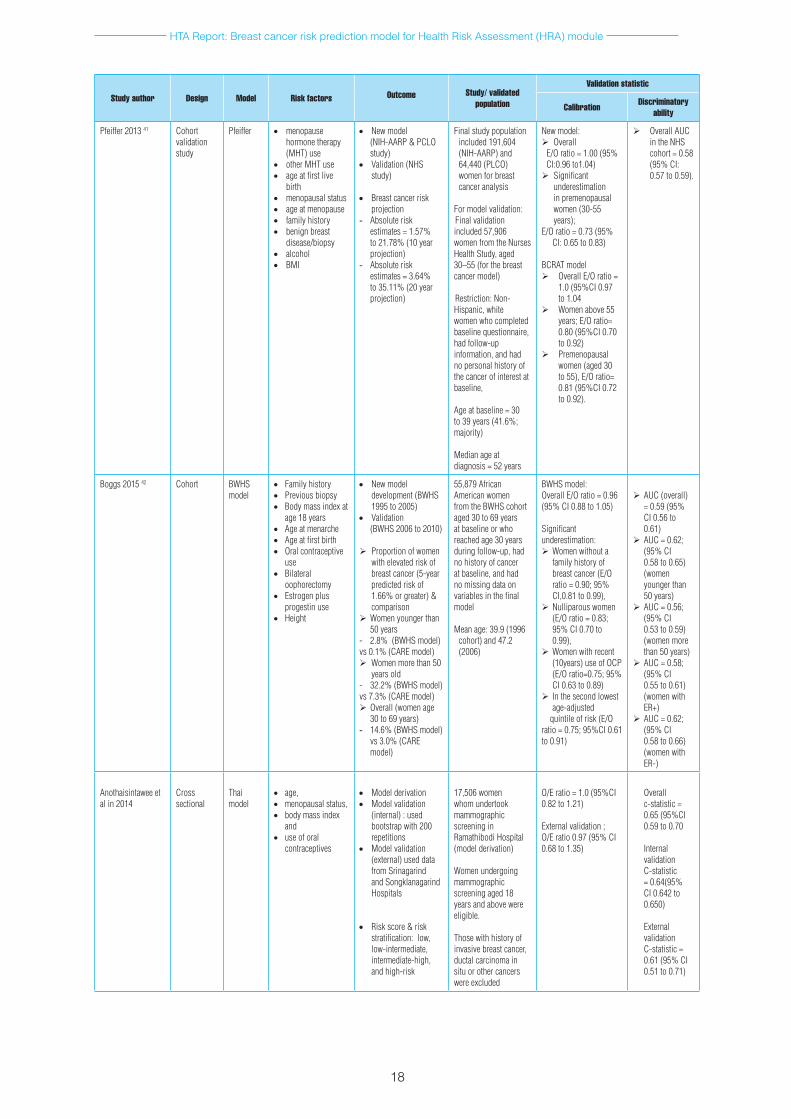
HTA Report: Breast cancer risk prediction model for Health Risk Assessment (HRA) module
18
Study author Design Model Risk factors
Outcome Study/ validated
population
Validation statistic
Calibration Discriminatory ability
Pfeiffer201341 Cohort validation study
Pfeiffer • menopausehormone therapy (MHT)use
• otherMHTuse• ageatfirstlive
birth• menopausalstatus• ageatmenopause• familyhistory• benignbreast
disease/biopsy• alcohol• BMI
• Newmodel(NIH-AARP&PCLOstudy)
• Validation(NHSstudy)
• Breastcancerriskprojection
- Absoluteriskestimates=1.57%to21.78%(10yearprojection)
- Absoluteriskestimates=3.64%to35.11%(20yearprojection)
Finalstudypopulationincluded191,604(NIH-AARP)and64,440(PLCO)womenforbreastcanceranalysis
Formodelvalidation:Final validation included 57,906 womenfromtheNursesHealthStudy,aged30–55(forthebreastcancer model)
Restriction:Non-Hispanic,whitewomen who completed baselinequestionnaire,had follow-up information, and had nopersonalhistoryofthecancerofinterestatbaseline,
Ageatbaseline=30to39years(41.6%;majority)
Medianageatdiagnosis=52years
Newmodel:Overall
E/Oratio=1.00(95%CI:0.96to1.04)Significant
underestimationinpremenopausalwomen (30-55 years);
E/Oratio=0.73(95%CI:0.65to0.83)
BCRATmodelOverallE/Oratio=
1.0(95%CI0.97to1.04
Women above 55 years;E/Oratio=0.80(95%CI0.70to0.92)
Premenopausalwomen(aged30to55),E/Oratio=0.81(95%CI0.72to0.92).
OverallAUCintheNHScohort=0.58(95%CI:0.57to0.59).
Boggs201542 Cohort BWHSmodel
• Familyhistory• Previousbiopsy• Bodymassindexat
age18years• Ageatmenarche• Ageatfirstbirth• Oralcontraceptive
use• Bilateral
oophorectomy• Estrogenplus
progestinuse• Height
• Newmodeldevelopment(BWHS1995 to 2005)
• Validation(BWHS2006to2010)
Proportionofwomenwithelevatedriskofbreastcancer(5-yearpredictedriskof1.66%orgreater)&comparison
Womenyoungerthan50years
- 2.8%(BWHSmodel)vs0.1%(CAREmodel)Women more than 50
yearsold- 32.2%(BWHSmodel)vs7.3%(CAREmodel)Overall(womenage
30to69years)- 14.6%(BWHSmodel)
vs3.0%(CAREmodel)
55,879AfricanAmericanwomenfromtheBWHScohortaged30to69yearsatbaselineorwhoreachedage30yearsduringfollow-up,hadnohistoryofcanceratbaseline,andhadnomissingdataonvariablesinthefinalmodel
Meanage:39.9(1996cohort)and47.2(2006)
BWHSmodel:OverallE/Oratio=0.96(95%CI0.88to1.05)
Significantunderestimation:Women without a
familyhistoryofbreastcancer(E/Oratio=0.90;95%CI,0.81to0.99),
Nulliparouswomen(E/Oratio=0.83;95%CI0.70to0.99),
Women with recent (10years)useofOCP(E/Oratio=0.75;95%CI0.63to0.89)
Inthesecondlowestage-adjusted
quintileofrisk(E/Oratio=0.75;95%CI0.61to0.91)
AUC(overall)=0.59(95%CI0.56to0.61)
AUC=0.62;(95%CI0.58to0.65)(women youngerthan50years)
AUC=0.56;(95%CI0.53to0.59)(women more than50years)
AUC=0.58;(95%CI0.55to0.61)(women with ER+)
AUC=0.62;(95%CI0.58to0.66)(women with ER-)
Anothaisintaweeetalin2014
Crosssectional
Thaimodel
• age,• menopausalstatus,• bodymassindex
and • useoforal
contraceptives
• Model derivation• Model validation
(internal):usedbootstrapwith200repetitions
• Model validation (external)useddatafromSrinagarindandSongklanagarindHospitals
• Riskscore&riskstratification:low,low-intermediate, intermediate-high,andhigh-risk
17,506 women whom undertook mammographicscreeninginRamathibodiHospital(model derivation)
Womenundergoingmammographicscreeningaged18yearsandabovewereeligible.
Thosewithhistoryofinvasivebreastcancer,ductal carcinoma in situorothercancerswere excluded
O/Eratio=1.0(95%CI0.82to1.21)
Externalvalidation;O/Eratio0.97(95%CI0.68to1.35)
Overallc-statistic=0.65(95%CI0.59to0.70
Internalvalidation C-statistic=0.64(95%CI0.642to0.650)
External validationC-statistic=0.61(95%CI0.51to0.71)
HTA Report: Breast cancer risk prediction model for Health Risk Assessment (HRA) module
19
characteristics, education, occupational activity, family history, and biopsy history) and three modifiable risk factors (alcohol consumption, leisure physical activity, and body mass index). The developed model was validated using independent data from the Italian cohort, Florence-EPIC cohort study from 1998 to 2004. This study involved 2569 cases (female patients with breast cancer, aged 23 to 74 years, median age: 55 years); and 2588 control subjects aged 20 to 74 years without breast cancer (median age: 56 years) from a case control study to develop the model and subsequently involved the Florence-EPIC cohort of 10, 083 women aged 35 to 64 years for model validation. The study found that the model was reasonably well calibrated with overall E/O ratio of 1.10 (95%CI 0.96 to 1.26, p=0.19). The model also showed over-prediction of breast cancer risks for other variables, women aged 60 years or more, women aged 30 or more at first live birth, and women with 12 years or more of education. The discriminatory accuracy was modest. It was demonstrated that the absolute risk reduction from exposure modifications was nearly proportional to the risk before modifying the risk factors and increased with age and risk projection time span. Mean 20-year reductions in absolute risk among women aged 65 years were 1.6% (95%CI 0.9 to 2.3%) in the entire population, 3.2% (95%CI 1.8 to 4.8%) among women with a positive family history of breast cancer, and 4.1% (95%CI 2.5 to 6.8%) among women who accounted for the highest 10% of the total population risk, as determined from the Lorenz curve. The author concluded that the new absolute risk prediction model for invasive breast cancer was reasonably well calibrated overall but overestimated the absolute risk of breast cancer in some subgroups such as women aged 60 years or older, and women whose first live birth occurred at age 30 years or later with modest discriminatory accuracy. These data give perspective on the potential reductions in absolute breast cancer risk from preventative strategies based on lifestyle changes. The methods are also useful for calculating sample sizes required for trials to test lifestyle interventions.40
Pfeiffer et al in 2013 conducted a prospective cohort study to develop a model in predicting risk of cancers that share many hormonal and epidemiological risk factors; breast, endometrial and ovarian cancer. This study involved different cohorts for model development and validation. The absolute risk prediction model was developed for breast, endometrial, and ovarian cancer by combining data from two large prospective cohorts; the National Cancer Institute (Prostate, Lung, Colorectal, and Ovarian Cancer Screening Trial (PLCO) and the National Institutes of Health–AARP Diet and Health Study (NIH-AARP)); and age-specific US population incidence and competing mortality rates from the NCI’s Surveillance, Epidemiology, and End Results Program (SEER). Study population for breast cancer analysis included 191,604 (NIH-AARP) aged 50 to 71 and 64,440 (PLCO) women aged 55 to 74. Model validation study population included 57,906 women from the Nurses Health Study, aged 30 to 55 (for the breast cancer model). Cancers were ascertained via annual study updates and death certificates, and verified via review of medical records (PLCO), through linkage with state cancer registries (NIH-AARP). Average follow up was 7.1years (starting one year after the entry mammogram, yielded 141,034 person years of follow-up). The final relative risk model for breast cancer included these risk factors; BMI, estrogen and progestin Menopause Hormone Therapy use, other MHT use, parity, age at first birth, premenopausal, age at menopause, benign breast diseases, family history of breast or ovarian cancer and alcohol consumption.41
The study found the new model is well calibrated with overall E/O ratio of 1.00 (95%CI 0.96 to1.04), however it significantly underestimated the number of breast cancers in premenopausal women (aged 30 to 55) with E/O ratio of 0.73 (95%CI 0.65 to 0.83). Peformance of BCRAT model showed it was well calibrated with E/O ratio of 1.0 (95%CI 0.97 to 1.04) and it significantly underestimated number of breast cancers in women above 55 years (E/O ratio of 0.80 (95%CI 0.70 to 0.92) and premenopausal women (aged 30 to 55) with E/O ratio of 0.81 (95%CI 0.72 to 0.92). Discriminatory power were modest for both new model and BCRAT in the NHS validation data with overall AUC of 0.58 (95%CI 0.57 to 0.59) and 0.56 (95% CI 0.55 to 0.58) respectively. Absolute risk estimates were 1.57% to 21.78% (for 10 year breast cancer projection) and 3.64% to 35.11% (20 year projection). The author concluded that these models predict absolute risks for breast, endometrial, and ovarian cancers from easily obtainable risk factors among white, non-Hispanic women aged 50+ years. The models may assist in clinical decision-making related to the risks of these cancers and might improve the ability to identify potential participants for research studies. Limitations are the modest discriminatory ability of the breast and ovarian models, and that these models may not generalize to women of other races.41
HTA Report: Breast cancer risk prediction model for Health Risk Assessment (HRA) module
20
Boggs et al recently in 2015 conducted a prospective validation study to develop a breast cancer risk prediction model for African American women using prospective data from the BWHS in follow-up from 1995 to 2005 and to validate the model in subsequent follow-up from 2006 to 2010, overall and by age and ER status. The BWHS is an ongoing follow-up study of African American women established in 1995 involving 59,000 African American women from across the US. A breast cancer risk model for the women was developed using relative risks (RR) of invasive breast cancer derived from 10 years of follow-up (1995 to 2005) of BWHS participants age 30 to 69 years at baseline by Cox proportional hazards models. In this study, an absolute risk was estimated using RRs and attributable risks from the BWHS model, age-specific SEER breast cancer rates for African American women (1994 to1998), and age specific competing mortality rates for African American women (1996 to 2000). Using the subsequent five years of follow-up data (2006 to 2010), calibration as the ratio of expected to observed number of breast cancers and discriminatory accuracy using the concordance statistic were evaluated.
Baseline questionnaire on BWHS risk factor were collected (age at menarche, height, weight at age 18 years, waist and hip circumference, educational attainment, family history of breast cancer, parity, age at first birth, duration of breastfeeding, oral contraceptive use, age at menopause, type of menopause, menopausal hormone use, previous diagnosis of benign breast disease). Incident diagnoses of breast cancer were ascertained through self-report on biennial follow-up questionnaires and, for non-respondents, through linkage with state cancer registries. Breast cancer deaths were identified through linkage with the National Death Index. They found the BWHS model was well calibrated overall with E/O ratio of 0.96 (95%CI 0.88 to 1.05), across a wide age range and across strata of risk factors. It significantly underestimated risk of breast cancer in these subgroups; women without a family history of breast cancer (E/O ratio of 0.90; 95% CI 0.81 to 0.99), nulliparous women (E/O ratio of 0.83; 95%CI 0.70 to 0.99), women who used oral contraceptives within the previous 10 years (E/O ratio of 0.75; 95% CI 0.63 to 0.89) and women in the second lowest age-adjusted quintile of risk (E/O ratio of 0.75; 95%CI 0.61 to 0.91). The discriminatory accuracy of the model remains modest but was higher for breast cancer overall and for ER-negative breast cancer than the discriminatory accuracy of a previous model with fewer risk factors. The predictive ability was best for younger women. The author concluded that the model was well calibrated overall with best predictive ability for younger women. The model may be a useful tool to identify women who may benefit from screening before age 50 years. The proportion of women predicted to meet the 1.66% cut point commonly used to determine eligibility for breast cancer prevention trials was greatly increased relative to previous models. It is unclear how well the model will perform in study populations with different distributions of risk factors; the calibration and discrimination of the BWHS model should be evaluated in independent studies.42
Anothaisintawee et al in 2014 conducted a cross sectional study to derive and validate breast cancer risk prediction model for Thai women. This study used data from Ramathibodi Hospital which involved 17,506 women whom undertook mammographic screening in the model derivation phase. Another data from Srinagarind and Songklanagarind Hospitals were used to externally validate the derived model. A bootstrap with 200 repetitions was applied for internal validation. Women undergoing mammographic screening aged 18 years and above were eligible and those with history of invasive breast cancer, ductal carcinoma in situ or other cancers were excluded. The study found four risk factors; age, menopausal status, body mass index and use of oral contraceptives were included in the model. C-statistic and O/E ratio were 0.65 (95%CI 0.59 to 0.70) and 1.0 (95%CI 0.82 to 1.21). Internal validation showed C-statistic of 0.64(95% CI 0.642 to 0.650) while external validation demonstrated O/E ratio and C-statistic of 0.97 (95% CI 0.68 to 1.35) and 0.61 (95% CI 0.51 to 0.71), respectively. The author also created risk scores which was stratified as low (0-0.86), low-intermediate (0.87-1.14), intermediate-high (1.15-1.52), and high-risk (1.53-3.40) groups. They concluded that the study had created a Thai breast cancer risk prediction model with good calibration and fair discrimination performance. The additional risk stratification should aid to prioritize high risk women to receive an organized breast cancer screening program in Thailand and other limited-resource countries.43
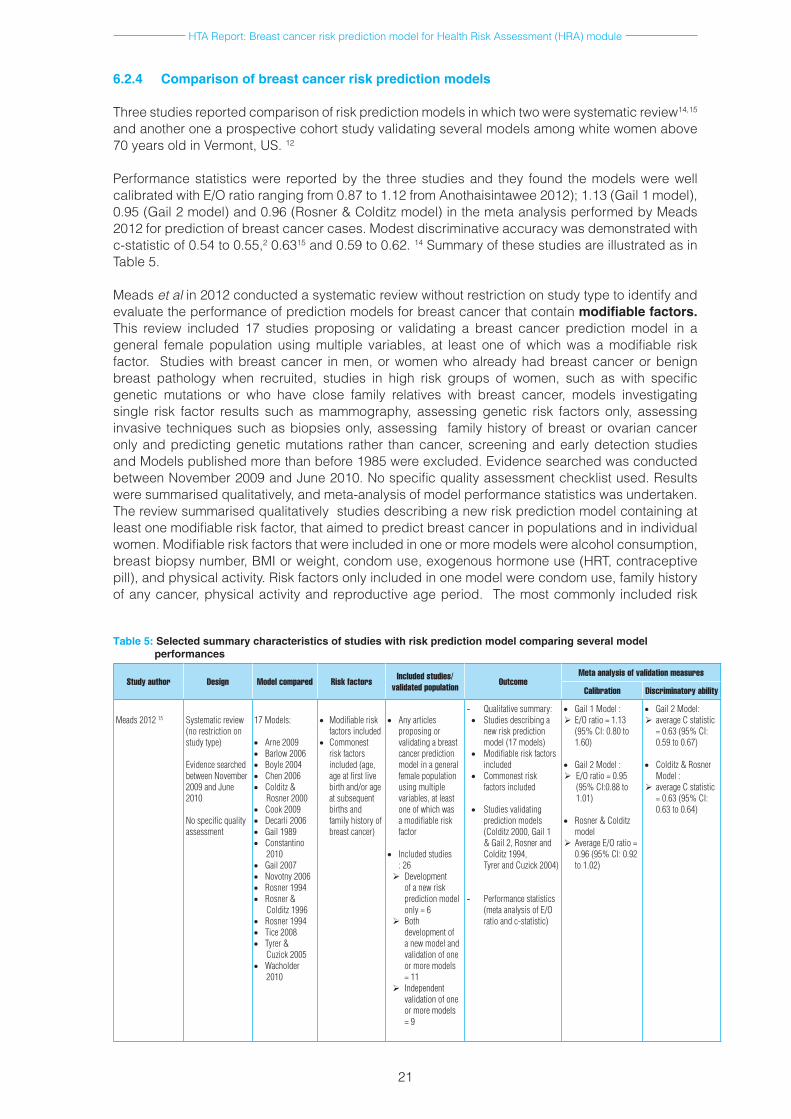
HTA Report: Breast cancer risk prediction model for Health Risk Assessment (HRA) module
21
6.2.4 Comparison of breast cancer risk prediction models
Three studies reported comparison of risk prediction models in which two were systematic review14,15 and another one a prospective cohort study validating several models among white women above 70 years old in Vermont, US. 12
Performance statistics were reported by the three studies and they found the models were well calibrated with E/O ratio ranging from 0.87 to 1.12 from Anothaisintawee 2012); 1.13 (Gail 1 model), 0.95 (Gail 2 model) and 0.96 (Rosner & Colditz model) in the meta analysis performed by Meads 2012 for prediction of breast cancer cases. Modest discriminative accuracy was demonstrated with c-statistic of 0.54 to 0.55,2 0.6315 and 0.59 to 0.62. 14 Summary of these studies are illustrated as in Table 5.
Meads et al in 2012 conducted a systematic review without restriction on study type to identify and evaluate the performance of prediction models for breast cancer that contain modifiable factors. This review included 17 studies proposing or validating a breast cancer prediction model in a general female population using multiple variables, at least one of which was a modifiable risk factor. Studies with breast cancer in men, or women who already had breast cancer or benign breast pathology when recruited, studies in high risk groups of women, such as with specific genetic mutations or who have close family relatives with breast cancer, models investigating single risk factor results such as mammography, assessing genetic risk factors only, assessing invasive techniques such as biopsies only, assessing family history of breast or ovarian cancer only and predicting genetic mutations rather than cancer, screening and early detection studies and Models published more than before 1985 were excluded. Evidence searched was conducted between November 2009 and June 2010. No specific quality assessment checklist used. Results were summarised qualitatively, and meta-analysis of model performance statistics was undertaken. The review summarised qualitatively studies describing a new risk prediction model containing at least one modifiable risk factor, that aimed to predict breast cancer in populations and in individual women. Modifiable risk factors that were included in one or more models were alcohol consumption, breast biopsy number, BMI or weight, condom use, exogenous hormone use (HRT, contraceptive pill), and physical activity. Risk factors only included in one model were condom use, family history of any cancer, physical activity and reproductive age period. The most commonly included risk
Table 5: Selected summary characteristics of studies with risk prediction model comparing several model performances
Study author Design Model compared Risk factors Included studies/ validated population Outcome
Meta analysis of validation measures
Calibration Discriminatory ability
Meads201215 Systematicreview(norestrictiononstudytype)
EvidencesearchedbetweenNovember2009 and June 2010
Nospecificqualityassessment
17Models:
• Arne2009• Barlow 2006• Boyle2004• Chen 2006• Colditz &
Rosner2000• Cook 2009• Decarli2006• Gail 1989• Constantino
2010• Gail 2007• Novotny2006• Rosner1994• Rosner&
Colditz 1996• Rosner1994• Tice2008• Tyrer&
Cuzick 2005• Wacholder
2010
• Modifiableriskfactorsincluded
• Commonestriskfactorsincluded(age,ageatfirstlivebirthand/orageatsubsequentbirthsandfamilyhistoryofbreastcancer)
• Anyarticlesproposingorvalidatingabreastcancer prediction modelinageneralfemale population usingmultiplevariables,atleastoneofwhichwasamodifiableriskfactor
• Includedstudies:26Development
ofanewriskprediction model only=6
Both development of a new model and validation of one ormoremodels=11
Independentvalidation of one ormoremodels=9
- Qualitativesummary:• Studiesdescribinga
newriskpredictionmodel(17models)
• Modifiableriskfactorsincluded
• Commonestriskfactorsincluded
• Studiesvalidatingpredictionmodels(Colditz 2000, Gail 1 &Gail2,RosnerandColditz1994,TyrerandCuzick2004)
- Performancestatistics(metaanalysisofE/Oratioandc-statistic)
• Gail1Model:E/Oratio=1.13
(95%CI:0.80to1.60)
• Gail2Model:E/Oratio=0.95
(95%CI:0.88to1.01)
• Rosner&Colditzmodel
AverageE/Oratio=0.96(95%CI:0.92to1.02)
• Gail2Model:averageCstatistic
=0.63(95%CI:0.59to0.67)
• Colditz&RosnerModel:
averageCstatistic=0.63(95%CI:0.63to0.64)
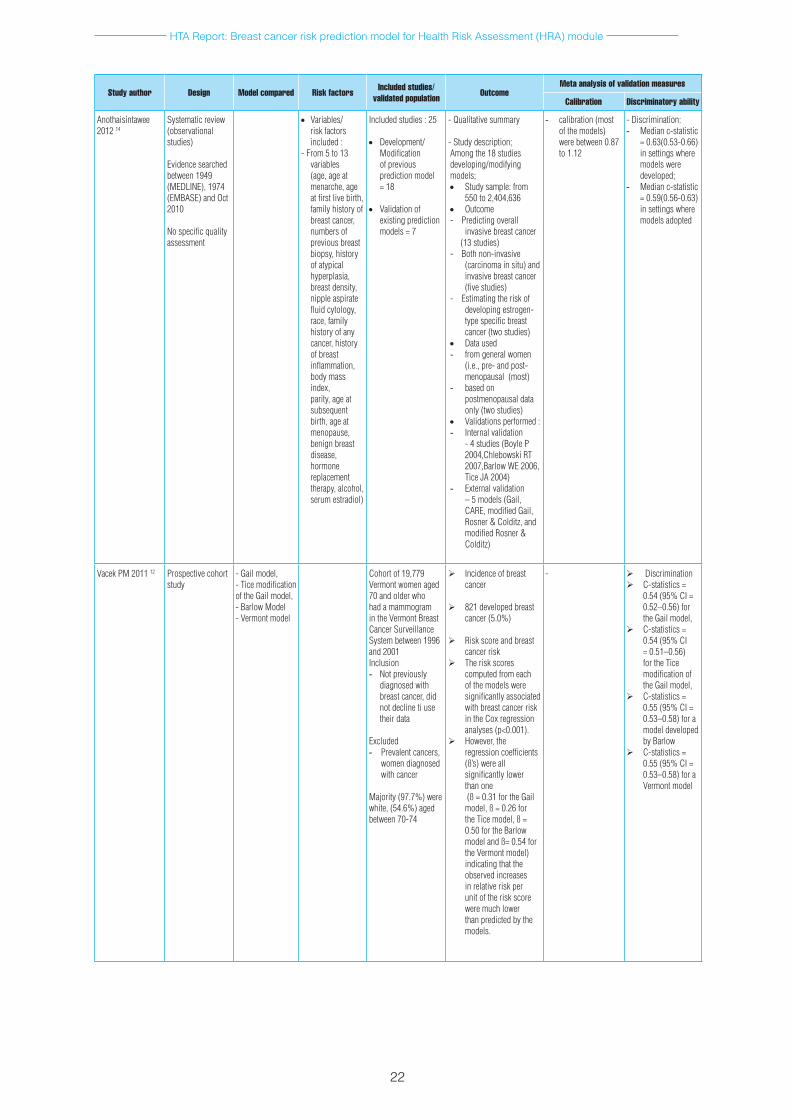
HTA Report: Breast cancer risk prediction model for Health Risk Assessment (HRA) module
22
Study author Design Model compared Risk factors Included studies/ validated population Outcome
Meta analysis of validation measures
Calibration Discriminatory ability
Anothaisintawee2012 14
Systematicreview(observationalstudies)
Evidencesearchedbetween1949(MEDLINE),1974(EMBASE)andOct2010
Nospecificqualityassessment
• Variables/riskfactorsincluded:
- From 5 to 13 variables(age,ageatmenarche,ageatfirstlivebirth,familyhistoryofbreastcancer,numbersofpreviousbreastbiopsy,historyof atypical hyperplasia,breastdensity,nippleaspiratefluidcytology,race, family historyofanycancer,historyofbreastinflammation, bodymassindex, parity,ageatsubsequentbirth,ageatmenopause,benignbreastdisease,hormone replacement therapy, alcohol, serumestradiol)
Includedstudies:25
• Development/Modificationofpreviousprediction model =18
• Validation of existingpredictionmodels=7
-Qualitativesummary
-Studydescription;Amongthe18studiesdeveloping/modifyingmodels;• Studysample:from
550to2,404,636• Outcome-Predictingoverall
invasivebreastcancer(13studies)-Bothnon-invasive
(carcinomainsitu)andinvasivebreastcancer(fivestudies)
-Estimatingtheriskofdevelopingestrogen-typespecificbreastcancer(twostudies)
• Dataused- fromgeneralwomen
(i.e.,pre-andpost-menopausal(most)
- basedonpostmenopausaldataonly(twostudies)
• Validationsperformed:- Internalvalidation
-4studies(BoyleP2004,ChlebowskiRT2007,Barlow WE 2006, TiceJA2004)
- External validation –5models(Gail,CARE,modifiedGail,Rosner&Colditz,andmodifiedRosner&Colditz)
- calibration(mostofthemodels)werebetween0.87to1.12
-Discrimination:- Medianc-statistic
=0.63(0.53-0.66)insettingswheremodelsweredeveloped;
- Medianc-statistic=0.59(0.56-0.63)insettingswheremodelsadopted
VacekPM201112 Prospectivecohortstudy
- Gail model, -Ticemodificationof the Gail model, - Barlow Model- Vermont model
Cohort of 19,779Vermontwomenaged70 and older who hadamammogramintheVermontBreastCancer Surveillance Systembetween1996and 2001Inclusion- Notpreviously
diagnosedwithbreastcancer,didnotdeclinetiusetheir data
Excluded- Prevalentcancers,
womendiagnosedwith cancer
Majority(97.7%)werewhite,(54.6%)agedbetween70-74
Incidenceofbreastcancer
821developedbreastcancer(5.0%)
Riskscoreandbreastcancerrisk
Theriskscorescomputed from each ofthemodelsweresignificantlyassociatedwithbreastcancerriskintheCoxregressionanalyses(p<0.001).
However,theregressioncoefficients(ß’s) were all significantlylowerthan one(ß=0.31fortheGailmodel,ß=0.26fortheTicemodel,ß=0.50fortheBarlowmodelandß=0.54forthe Vermont model) indicatingthattheobservedincreasesinrelativeriskperunitoftheriskscorewere much lower than predicted by the models.
- DiscriminationC-statistics=
0.54(95%CI=0.52–0.56)forthe Gail model,
C-statistics=0.54(95%CI=0.51–0.56)fortheTicemodificationofthe Gail model,
C-statistics=0.55(95%CI=0.53–0.58)foramodel developed by Barlow
C-statistics=0.55(95%CI=0.53–0.58)foraVermont model
HTA Report: Breast cancer risk prediction model for Health Risk Assessment (HRA) module
23
factors in the models were age, age at first live birth and/or age at subsequent births and family history of breast cancer. Of these, models with independent validations were Colditz 2000, Gail 1 (4 studies) and Gail 2 (12 studies), Rosner and Colditz 1994 and Tyrer and Cuzick 2004. Performance statistics performed demonstrated modest discriminatory ability of Gail 2 Model with average c-statistic of 0.63 (95%CI 0.59 to 0.67) and Colditz & Rosner model with average c-statistic of 0.63 (95%CI 0.63 to 0.64). 15
Meta analysis of these models showed none of the models were significantly well calibrated with E/O ratio of 1.13 (95%CI 0.80 to 1.60) for Gail 1 Model, 0.95 (95% CI 0.88 to 1.01) for Gail 2 Model and 0.96 (95%CI 0.92 to 1.02) for Rosner & Colditz model. The author concluded there is insufficient information to distinguish the most accurate model or models consistently accurate enough for clinical practice due to variable reporting and few validation studies. Further studies are needed; in particular primary studies that conduct a comparative valuation of all of the models on the same dataset. Further validation studies of existing prediction models, research to identify new risk factors, and to develop model with better predictive ability is needed, alongside clearer reporting and continual validation of new models as they develop. 15
Anothaisintawee et al in 2012 also conducted a systematic review to systematically review the development and performance of existing prediction models to identify the most reliable model and indicate their strength and weakness for guiding future model development.
The review included observational studies (cohort, case control or cross sectional study) with these criteria; considered more than one risk factor in the prediction model simultaneously, had the outcome as breast cancer vs non breast cancer, applied any regression equation (Logistic, Poisson or Cox) to build up prediction model and reported each model ‘s performance (E/O ratio or c-statistic). Evidence searched was conducted between 1949 from MEDLINE (PubMed) and 1974 from EMBASE (Ovid) until October 2010. No specific quality assessment used. Results were summarised qualitatively and meta-analysis was not undertaken. The review summarised qualitatively 25 studies in which 18 were studies on development/modification of previous prediction model and 7 studies on validation of existing prediction models. The review summarized qualitatively and majority of the studies were predicting overall invasive breast cancer (13 studies) and most of the studies used data from general women (pre- and post-menopausal). Up to 13 risk factors were included in the models. The Gail and Rosner and Colditz were two models that were modified by many scholars. They found calibration of most of the models were between 0.87 to 1.12, with reported poor to fair discrimination (c-statistic ranges between 0.53 to 0.66 in internal validation and 0.56 to 0.63 in external validation). The author concluded that most models yielded relatively poor discrimination in both internal and external validation with fair calibration performance of most models. The author stated a need to develop a reliable risk prediction model for breast cancer in future. 14
Vacek et al in 2011 conducted a cohort study to determine the models usefulness as risk assessment tools for women aged 70 and older, (the original Gail model, the Tice modification of the Gail model, the Barlow Model & the Vermont model), to examine their prediction ability to diagnose breast cancer and to compare model performances. This study involved a cohort of 19,779 Vermont women aged 70 and older who had a mammogram in the Vermont Breast Cancer Surveillance System between 1996 and 2001, who were not previously diagnosed with breast cancer. Majority of subjects were white (97.7%) between 70 to 74 years old (54.6%). This study utilized data from the Vermont Breast Cancer Surveillance System (VBCSS) to assemble a cohort, obtain risk factor information and identify subsequent cases of breast cancer. Invasive and in situ breast cancers diagnosed before January 1, 2010 were identified using both the pathology information in the VBCSS and the diagnosis codes in the Medicare & Medicaid Services claims data. Risk score then computed based on each of the four risk models. They found a 5.0% incidence of breast cancer (821 developed breast cancer). The risk scores computed from each of the models were significantly associated with breast cancer risk in the Cox regression analyses (p<0.001). The regression coefficients (ß’s) were all significantly lower than one (ß = 0.31 for the Gail model, ß = 0.26 for the Tice model, ß = 0.50 for the Barlow model and ß= 0.54 for the Vermont model) indicating that the observed increases in relative risk per unit of the risk score were much lower than predicted by the models. Comparison of model performances showed the discriminative ability were modest among the four models with c-statistics of 0.54 (95%CI 0.52 to 0.56) for the Gail model, 0.54 (95%CI 0.51 to 0.56) for the Tice
HTA Report: Breast cancer risk prediction model for Health Risk Assessment (HRA) module
24
modification of the Gail model, 0.55 (95%CI 0.53 to 0.58) for a model developed by Barlow and 0.55 (95%CI 0.53 to 0.58) for the Vermont model. The author concluded that the models are not useful for assessing risk in women aged 70 and older. The study stated that age-related attenuation of the effects of some risk factors makes the prediction of breast cancer in older women particularly difficult. New risk factors and biomarkers for breast cancer are needed as well as statistical models that allow their effects to vary with age. 12
6.3 SAFETY RELATED TO BREAST CANCER RISK PREDICTION MODELS
Only one study reported on safety or adverse event or unpleasant consequences related to breast cancer risk prediction model in term of its psychological effect namely anxiety. The other study reported subjective perception of belief in breast cancer risk prediction model. Summary is as illustrated in Table 6.
A randomized controlled trial conducted in Korea by Kye et al in 2012 aimed at exploring the psychological effect of health risk appraisal using epidemiological risk factor profile. In this study, participants were recruited through advertisements in the websites between October and November 2009. This study involved 60 eligible women aged between 30 to 48 years old without prior cancer diagnosis (median age were 38 years) who were randomized to either a numerical HRA or the HRA using personal risk factor list after completed a baseline interview. The HRA was done through telephone interview and the participants attended intervention sessions which consist of provision of HRA results, pre- and post-HRA assessment for psychological status, and counselling at one month after the interview. The variables measured in this study related to personal risk factor were height, weight, alcohol, vegetable consumption, past history of benign breast disease, menstruation and oral contraceptive pill (OCP). Risk factors for numerical HRA used the Gail model factors. Anxiety level was measured using Spielberger State Trait Anxiety Inventory YZ (Korean version). The study demonstrated that the mean anxiety level was slightly higher for trait (long term) anxiety with mean (SD) of 44.7(9.2) compared to state (temporary) anxiety with mean(SD) of 42.6(9.2). They also found women who had higher risk status, had an odd of having increased anxiety about five times greater than women who had lower risk status (OR 5.03, 95% CI 1.54 to 16.43, p=0.01). The author concluded that communicating the risk status by individual health risk appraisal service can induce psychological sequelae, especially in women having higher risk status. Hospitals, institutes, or medical schools that are operating or planning to operate the online health risk appraisal service should take side effects such as psychological sequelae into consideration. Further research on cancer risk communication strategies for HRA service are required to explore long term outcome and to evaluate more psychological outcome. 44
Subjective perception of belief in breast cancer risk prediction model was studied by Scherer et al in 2012. They conducted a cross sectional study to determine when and why women chose to disbelieve the personalized breast cancer risk numbers.In this study, women whose medical records indicated that they might be at above average risk of developing breast cancer were recruited from the Henry Ford Health System in Detroit and Group Health in Seattle. The subjects participated in an online program which presented tailored information about individual breast cancer risk after completing BCRAT questions and viewing decision aid on chemoprevention. They were presented with tailored absolute risk (BCRAT score) and estimate of risk reduction with chemoprevention. This study involved 690 women at or above average risk of developing breast cancer as estimated by the BCRAT(score range 1.7-19.1) age range 46 to 74 years with majority of the subjects were white (97.6%). The subjects were asked whether they believe the program was personalized and whether they believe the numbers. The BCRAT score was calculated using these factors: age, ethnicity, personal risk of breast cancer, age at first menses, age at first live birth, number of first degree relatives who have had breast cancer, history of breast biopsies. The study found 18.9% of study subjects were disagree with tailored risk (131 participants disagreed with both risk numbers). Among the documented reasons for disagreement (qualitative assessment) were their family history made them either more or less likely to develop breast cancer than their tailored risk number suggested (I have aunts that have had cancer); the risk number seemed too high or too low (It just seemed low, the percentage was low compared to my concern); health habits and lifestyle (I am in excellent health and I live an active healthy lifestyle) and others such as they thought the calculation failed to account for relevant personal information such as family history, medical history, lifestyle,
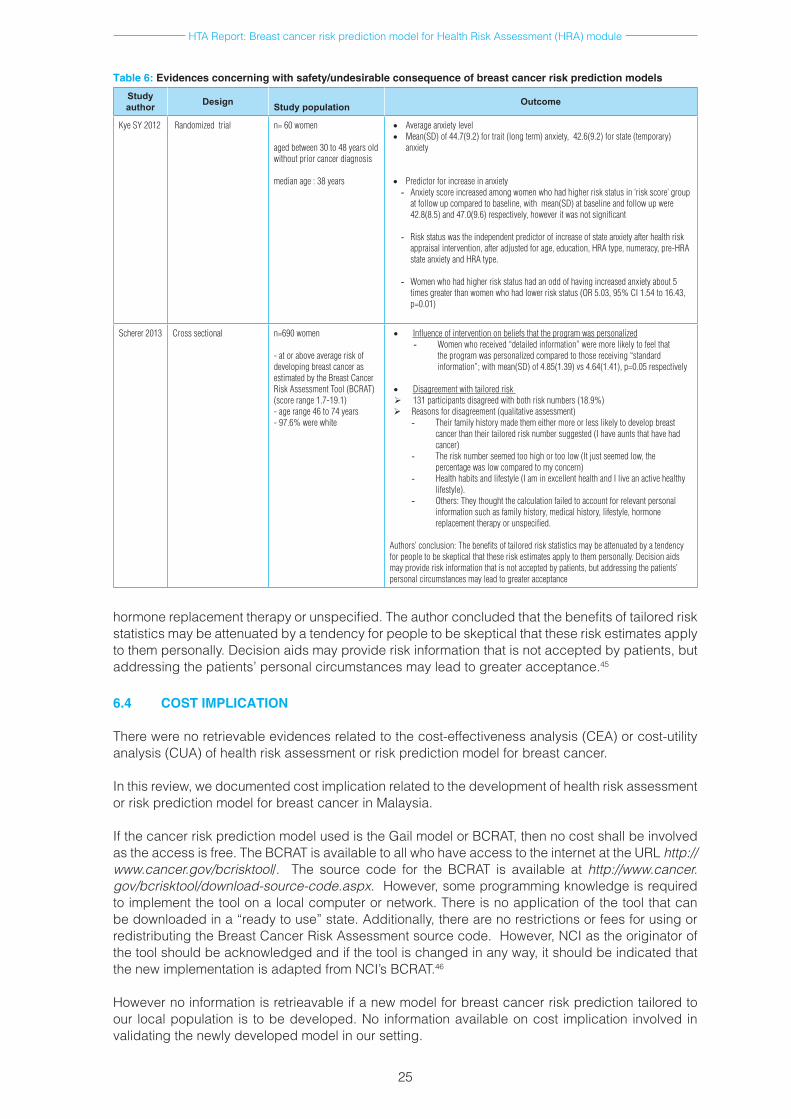
HTA Report: Breast cancer risk prediction model for Health Risk Assessment (HRA) module
25
Table 6: Evidences concerning with safety/undesirable consequence of breast cancer risk prediction models
Study author Design
Study population Outcome
Kye SY 2012 Randomized trial n=60women
agedbetween30to48yearsoldwithoutpriorcancerdiagnosis
medianage:38years
• Averageanxietylevel• Mean(SD)of44.7(9.2)fortrait(longterm)anxiety,42.6(9.2)forstate(temporary)
anxiety
• Predictorforincreaseinanxiety- Anxietyscoreincreasedamongwomenwhohadhigherriskstatusin‘riskscore’group
atfollowupcomparedtobaseline,withmean(SD)atbaselineandfollowupwere42.8(8.5)and47.0(9.6)respectively,howeveritwasnotsignificant
- Riskstatuswastheindependentpredictorofincreaseofstateanxietyafterhealthriskappraisalintervention,afteradjustedforage,education,HRAtype,numeracy,pre-HRAstateanxietyandHRAtype.
- Womenwhohadhigherriskstatushadanoddofhavingincreasedanxietyabout5
timesgreaterthanwomenwhohadlowerriskstatus(OR5.03,95%CI1.54to16.43,p=0.01)
Scherer 2013 Crosssectional n=690women
-atoraboveaverageriskofdevelopingbreastcancerasestimatedbytheBreastCancerRiskAssessmentTool(BCRAT)(scorerange1.7-19.1)-agerange46to74years-97.6%werewhite
• Influenceofinterventiononbeliefsthattheprogramwaspersonalized- Women who received “detailed information” were more likely to feel that
theprogramwaspersonalizedcomparedtothosereceiving“standardinformation”;withmean(SD)of4.85(1.39)vs4.64(1.41),p=0.05respectively
• Disagreementwithtailoredrisk 131participantsdisagreedwithbothrisknumbers(18.9%)Reasonsfordisagreement(qualitativeassessment)
- Theirfamilyhistorymadethemeithermoreorlesslikelytodevelopbreastcancerthantheirtailoredrisknumbersuggested(Ihaveauntsthathavehadcancer)
- Therisknumberseemedtoohighortoolow(Itjustseemedlow,thepercentagewaslowcomparedtomyconcern)
- Healthhabitsandlifestyle(IaminexcellenthealthandIliveanactivehealthylifestyle).
- Others:Theythoughtthecalculationfailedtoaccountforrelevantpersonalinformationsuchasfamilyhistory,medicalhistory,lifestyle,hormonereplacementtherapyorunspecified.
Authors’conclusion:Thebenefitsoftailoredriskstatisticsmaybeattenuatedbyatendencyforpeopletobeskepticalthattheseriskestimatesapplytothempersonally.Decisionaidsmayprovideriskinformationthatisnotacceptedbypatients,butaddressingthepatients’personalcircumstancesmayleadtogreateracceptance
hormone replacement therapy or unspecified. The author concluded that the benefits of tailored risk statistics may be attenuated by a tendency for people to be skeptical that these risk estimates apply to them personally. Decision aids may provide risk information that is not accepted by patients, but addressing the patients’ personal circumstances may lead to greater acceptance.45
6.4 COST IMPLICATION
There were no retrievable evidences related to the cost-effectiveness analysis (CEA) or cost-utility analysis (CUA) of health risk assessment or risk prediction model for breast cancer.
In this review, we documented cost implication related to the development of health risk assessment or risk prediction model for breast cancer in Malaysia.
If the cancer risk prediction model used is the Gail model or BCRAT, then no cost shall be involved as the access is free. The BCRAT is available to all who have access to the internet at the URL http://www.cancer.gov/bcrisktool/. The source code for the BCRAT is available at http://www.cancer.gov/bcrisktool/download-source-code.aspx. However, some programming knowledge is required to implement the tool on a local computer or network. There is no application of the tool that can be downloaded in a “ready to use” state. Additionally, there are no restrictions or fees for using or redistributing the Breast Cancer Risk Assessment source code. However, NCI as the originator of the tool should be acknowledged and if the tool is changed in any way, it should be indicated that the new implementation is adapted from NCI’s BCRAT.46
However no information is retrieavable if a new model for breast cancer risk prediction tailored to our local population is to be developed. No information available on cost implication involved in validating the newly developed model in our setting.
HTA Report: Breast cancer risk prediction model for Health Risk Assessment (HRA) module
26
Validation of the prediction models in the population could use the BRCAPRO and BOADICEA as the main tools specifically for models identifying mutation probability. The most appropriate validation for these tools will be a population-based cohort of patients who have been tested for germ line mutations in BRCA1, BRCA2 and other genes. Estimated potential direct cost of a genetic test is approximately RM4,000 to RM12, 000 per patient with the lowest could be at RM500 per patient. To re-validate this in another cohort would be expensive and it would depend on where (and how much) genetic testing would be provided. At the minimum cost of RM500 per patient, with assumption that 1,000 patients will be in the cohort, the minimal direct cost for validation of this tool would be around RM500, 000. (Communication with cancer researcher)
The cost involved in conducting a prospective cohort validation study which involved setting up cohorts to collect prospective occurrence of cancer can be very costly and the actual cost will depend on number of participants and years of follow up. Estimated potential direct cost implicated in designing, developing, testing and commissioning an available risk prediction model into a health risk assessment module is given approximately at RM75,000. (Communication with Programme Officer, Health Education Division). This amount encompasses sum of the relevant activities, in which the details are as listed below:
Services: • System development (1 lot) RM50,000• Installation and configuration (1 lot) RM5,000• Training and Training of Trainer (1 lot) RM15,000• Documentation (1 lot) RM1,000 Software: • Portal Management Application and Content Management System (CMS) (1 lot) RM4,000
6.5 ORGANIZATIONAL
The goal of of breast cancer risk assessment is to personalize management strategies for all women with the aim to increase survival in high risk women and to decrease cost and complication in low risk women. Estimated risk yielded by prediction models enables the stratification of individuals or groups of individuals by these risks. High risk women according to Gail is women with five year risk of at least 1.67% and use of tamoxifen is associated with 49% reduction in invasive breast cancer. Women at low risk may be best served with standard mammography and health maintenance recommendations.19 Intervention according to risk group has been addressed by several guidelines. The American Cancer Society (ACS)47 recommends mammography screening for average risk women before the age of 40, and the US Preventive Service Task Force48 recommended screening to be initiated at the age of 50 for average risk women. In 2006, ACS recommended annual MRI screening be used as an adjunct to mammography screening among women with known BRCA mutation, first degree relatives of BRCA carriers who have not been tested and women with lifetime risk of breast cancer of 20 to 25% or greater as defined by models that are largely dependent on complete multigenerational family histories on the maternal and paternal side such as BRCAPRO, Claus and Tyrer-Cuzick models. The Gail model was not recommended for risk assessment for MRI screening in the ACS Guideline because it does not incorporate family history of breast or ovarian cancer in second degree relatives.49
NICE in its guideline on Familial Breast Cancer (2013) stated that when available in secondary care, use of a carrier probability calculation method with demonstrated acceptable performance (calibration and discrimination) such as BOADICEA and the Manchester Scoring System as well as family history is recommended to determine who should be offered referral to specialist genetic clinic. Meanwhile in a specialist genetic clinic setting, NICE guideline recommended similarly the use of a carrier probability calculation method with demonstrated acceptable performance (calibration and discrimination) such as BOADICEA and the Manchaster Scoring System to assess probability of a BRCA1 or 2 mutation. Cancer risk communication should be offered as a personal risk estimate and uncertainties about the estimate should also be informed.50
HTA Report: Breast cancer risk prediction model for Health Risk Assessment (HRA) module
27
Computerized risk estimate using Gail model are available on the National Cancer Institute (NCI) website. The NCI website on Gail model is accessed 20,000 to 30,000 times per month.26 Other computerized risk estimates such as Claus and BRCAPRO models are available via the CancerGene program which needs internet access.25 Computerized risk estimate using any model requires computer literate patient and other computerized risk estimates available in the website needs internet access.
Prediction modelling research may distinguish three major phases namely developing and internally validating a prediction model; testing, adjusting or updating the model for other individuals (external validation); and assessing its impact on therapeutic management and patient outcomes.24 The conduct of this specialized research needs a dedicated team and expertise.
The goal of screening is to detect pre-symptomatic cancer early enough for effective treatment. Cancer risk assessment aims to characterize individuals’ chance of developing cancer over a specified period to guide decision making about future screening behaviour and adoption of risk reduction strategies. Among ethical issues arised was psychological harms resulted from being labelled ‘at risk’, and additional diagnostic procedure can artificially increase sense of risk.The ‘at risk’ label also has implication for future health care cost. Theoretically increase psychological distress from risk labelling may contribute to future non-adherence to screening and risk reduction recommendations. Uncertainty about risk and benefit of prevention option affect decision making in that depending upon their risk category patient may face difficult decision about managing or reducing risk. In some cases, the result may present women with information that contrast with previously held belief, requiring a period of acceptance and adjustment prior to consideration of preventive options.17
Breast cancer risk assessment and available intervention for prevention and early detection among women at increased risk seem to be underutilized in the US population. Only 48% had ordered or referred a patient for BRCA1/2 testing and only 18% had software programs to calculate breast cancer risk. 51 Breast cancer risk assessment, genetic testing and other interventions are utilized even less by racial and ethnic minority women, low income and uninsured women, likely contributing to higher rates of late stage diagnosis. 52 The lack of a single, simple and accessible data collection tool that can produce risk estimates used in various guidelines might hinder the widespread adoption of breast cancer risk assessment in primary care settings. As scientific knowledge improves on how to identifity women at increased risk of breast cancer, tools for risk assessment need to be updated, adapted and used to benefit largest number of women.50
Each of the models is derived using different data, study design and risk factors. Steps that may be used in future design and validation of new breast cancer risk prediction model were utilizing material available from either placebo arms of cohort or prior randomized, controlled trial or ongoing prospective observational studies where patients had been followed for a period up to 15 years after data collection to allow both univariate and multivariate analysis of risk factors. Nested case control study would provide the most efficient study design. Subsequent step will involve retrospective validation study and prospective validation study. Analysis of existing data offer possibility to identify risk factors that could be used to develop better risk prediction model.53 Improvements in the models require revalidation processes. Assessment of individual risk can be undertaken using a variety of models. Models are imperfect even within the fairly developed field of breast cancer risk assessment. Uncertainties associated with risk estimates should be addressed and informed particularly when clinical decision has serious consequences.25
There are a number of models available to predict breast cancer risks. The most appropriate validation for it will be a longitudinal study that is following a population attending screening and determining the sensitivity and specificity of the tool in predicting the individuals who develop breast cancer. This is quite difficult to be carried out in Malaysia at the moment since there is no population-based screening programme and there are few (if any) large enough longitudinal cohorts examining breast cancer. (Communication with breast cancer researcher)
HTA Report: Breast cancer risk prediction model for Health Risk Assessment (HRA) module
28
Additional practical concern is the issue of insurability of women found to be at high risk of breast cancer. This matter has risen for the measurement of BRCA1 and BRCA2 genes in women. Future legislation may be developed to protect those found to be at high risk.54
The lack of a single, simple and accessible data collection tool that can produce risk estimatesmight hinder the adoption of breast cancer risk assessment in healthcare setting. As scientific knowledge of how to identify premalignant and malignant disease earlier in the disease improves, tool for risk assessment need to be updated, adapted and used to benefit the largest number of women. In addition to creating tools that will allow clinicians to generate risk estimates for multiple purposes efforts are needed to ensure all women have access to those potentially life saving interventions.49
7 DISCUSSION
There was neither HTA report nor guidelines on health risk assessment or risk prediction model for the detection of breast cancer.
The systematic review found a total of seven breast cancer risk prediction models containing risk factors without genetic component. Some have been independently validated, most notably the Gail model with four validations (by Schonfeld 2010,33 Chay 2012,37 Banegas 201236 and Vacek 201112).
We have attempted to compare the model performances qualitatively according to the encountered model.
For Gail model, there were limited fair level of evidence from the four studies (Schonfeld 2010, Chay 2012, Banegas 2012 and Vacek 2011). Two studies found underestimation of breast cancer cases by 13 to 18% using the Gail model, however upgrading/recalibration of the model demonstrated it was well calibrated as the E/O improved to 1.0333 and underestimated breast cancer cases with O/E of 1.08.36 Another study found the Gail model overestimated breast cancer risk among Singaporean women aged 50 to 64.37 The studies overall discriminative accuracy was modest with c-statistic ranges between 0.54 to 0.67.33,6,37,12 The validation population was mostly from US post-menopausal white women aged 50 to 79 years Hispanics and non-hispanic 33,36 and post menopausal Vermont women more than 70 years.12
For CARE model, performance statistics were reported by one study 13 and they found underestimation of breast cancer cases by 12% using the CARE model with modest discriminative accuracy with c-statistic of 0.57 (overall), 0.59 (ER+breast cancer) and 0.54 (ER-breast cancer).The validation population was African-American women aged range from 30 to 69 years.
For other models, four studies reported development of new risk prediction model and subsequent validation which has been conducted in Italy40 the US41,42 and Thailand.43 The validated population varies from Italian women aged 20 to 74 years,40 non-Hispanic white women with median age of 52 years 41 and African American women aged between 30 and 69 years (mean age 39.9).42 Two studies used different study cohort for model development and subsequent validation 40,41 whereas Boggs42 used different cohort from similar study for model development and validation. Petracci40 included non-modifiable and modifiable risk factors (eight factors) in the new model, Pfeiffer41 developed model that share many hormonal and epidemiological risk factors; breast, endometrial and ovarian cancer in the US (nine factors), and Boggs42 includes nine risk factors in the BWHS model. Performance statistics reported by the three studies and they found their model were well calibrated with overall E/O ratio of 1.10, 40 1.00 41 and 0.9642 for prediction of breast cancer cases with modest discriminative accuracy (c-statistic of 0.62,40 0.5841 and 0.5942 )
For the three studies studies reporting comparison of few risk prediction models, performance statistics demonstrated the models were well calibrated with E/O ratio ranging from 0.87 to 1.12 from Anothaisintawee 2012); 1.13 (Gail 1 model), 0.95 (Gail 2 model) and 0.96 (Rosner & Colditz model) in the meta analysis performed by Meads 2012 for prediction of breast cancer cases. Modest discriminative accuracy were demonstrated with c-statistic of 0.54-0.55, 12 0.63 15 and 0.59 to 0.62.14
HTA Report: Breast cancer risk prediction model for Health Risk Assessment (HRA) module
29
With regard to safety, only one study with small study subjects reported on safety related to breast cancer risk prediction model in term of its psychological effect namely anxiety. They found women who had higher risk status had an odd of having increased anxiety about five times greater than women who had lower risk status (OR 5.03).44 The other study reported subjective perception of belief in breast cancer risk prediction model.45
There were two local studies published on validation of breast cancer prediction model; however these studies evaluate models predicting mutation probability using BOADICEA and Manchaster Scoring System conducted in Malaysia.54,55 These two studies demonstrated that the two models performed less well in our population in that it will underestimate the probability of mutation carriers. Therefore the use a lower cut-off may be considered in circumstances where decision to apply on our population been made.
A local study by Thirtagiri et al in 2007 evaluated BRCA1 and BRCA2 mutation and compared the accuracy of the BOADICEA and MSS. The study involved 187 breast cancer patients with either early onset breast cancer (age less than 40 years) or a personal and/or family history of breast or ovarian cancer recruited between 2003 and 2007 in University Malaya Medical Centre, Kuala Lumpur where full sequencing of BRCA1 and BRCA2 were carried out. The two prediction algorithms were evaluated. Mean age of diagnosis of all women was 43.8 years (range 22 to 78 years). The overall performance in discriminating between those with and without mutation were moderate as demonstrated by AUC of 0.74 (95%CI 0.67 to 0.81) and 0.82 (95%CI 0.75 to 0.88) for BRCA1, and 0.82 (95%CI 0.75 to 0.88) and 0.56 (95%CI 0.48 to 0.64) for BRCA2, for MSS and BOADICEA respectively. The AUC for combined BRCA1/2 was better for MSS compared to BOADICEA with AUC of 0.80 (95%CI 0.72 to 0.86) and 0.73 (95%CI 0.65 to 0.80) respectively. They found both models underestimated the number of mutation carriers in the cohort. They also found the score of greater than 15 for combined BRCA1/2 in MSS as an optimal threshold with sensitivity of 72%, specificity of 74%, PPV of 37% and NPV of 93%. They stated that testing could be offered to individuals with personal or family history of cancer if they have MSS score of 15 or above. Lower threshold could be used when resource is available.54
Another local study by Hassan N in 2014 also evaluated these two model performances among 1692 incident and prevalent breast cancer cases recruited to the Malaysian Breast Cancer Genetic Study between 2003 and 2012, of whom 665 with early age of onset and/or family history of breast cancer were screened for BRCA1/2 mutation. For 577 subjects where pathologic data were available the added values of ER negativity on the models were evaluated. They found at 10% threshold, AUC was similar for both models and higher for BRCA1 compared to BRCA2 (0.73 and 0.73 for BRCA1, and 066 and 0.64 for BRCA2 in BOADICEA and MMS respectively).The addition of ER status improved the AUC for BRCA1 from 0.73 to 0.81 in BOADICEA and to 0.79 in MMS. The addition of other pathologic features, pr and HER2 did not improve BRCA1 accuracy.55
Among the use of breast cancer risk prediction model is its use in stratifying risk among women hence subsequent intervention could be targeted for. Currently several risk stratification exist in our setting aiming at early detection of breast cancer. The Malaysia National Population and Family Development Board or better known as Lembaga Penduduk dan Pembangunan Keluarga Negara (LPPKN) categorise women as high risk if she has any one of these factors; family history of breast cancer, previous history of atypia on breast biopsy or previous history of breast or ovarian cancer or currently on hormone replacement therapy (criteria A), or any two of these factors; family history of breast cancer, nulliparous or women with first childbirth after 30 years, menarche before 12 years old, menopause after 55 years old or body mass index more than 30 (criteria B).56 This is in tandem with the recent Malaysian Guideline on National Breast Cancer Early Detection Programme indicating mammogram for high risk women (as criteria above) and those above 40 years old.57
The Malaysian CPG on Management of Breast Cancer on the other hand stratifies risk factor as low (RR between 1.0 and 1.4), moderate (RR between 1.5 and 2.0) and high (RR of more than 2.0).21 Currently, Malaysia is practicing opportunistic screening for breast cancer as its screening policy, targeting those women attending the wellness clinic, maternal and child health clinics and women attending outpatient clinic in MOH facilities. This involve three main activities for breast cancer screening namely breast self awareness, clinical breast examination and mammography
HTA Report: Breast cancer risk prediction model for Health Risk Assessment (HRA) module
30
screening.7The prevalence of overall breast examination in Malaysia was 70.3% in the third National Health Morbidity Survey;57 with highest for Breast Self Examination (57.1%), Clinical Breast Examination (51.7%) and mammogram (7.5%). To further promote greater awareness among women to do mammogram screening for early detection of breast cancer, the Ministry of Women, Family and Community Development provided a RM50 subsidy for every mammogram done in private clinics and hospitals registered with LPPKN for those who meet the eligible criteria which includes high risk women with household income below RM5, 000.7 None of the available guidelines did document on risk assessment or strafication using any of the existing breast cancer risk prediction model.
Though risk assessment tools can place breast cancer risk in context for women at all risk levels and allow for more focused management recommendations on the basis of the risk, ultimately risk assessment is only an estimate.19 Nevertheless, people should be offered a personal risk estimate for their cancer risk and carrier probability as well as uncertainties of the information.51 Risk assessment tools can place breast cancer risk in context for women at all risk levels and allow focused management on the basis of this risk.19 It is important to note that the risk factors and breast cancer rates in Malaysia are different than the risks and rates used in the existing model such as Gail, which are not comparable. Therefore, any model would have to be recalibrated to Malaysian facts of breast cancer to make it applicable. Cancer risk prediction model needs continual validation to give meaningful risk estimate and ensure its applicability in the setting it will be used. The complexity to develop and subsequently validate any breast cancer risk prediction model specifically models without genetic component is reflected in the data required and availability of dedicated research expertise that is required to come out with a model with consistently outstanding performance. 7.1 LIMITATIONS
The systematic review of literature has several limitations. There were limited validation studies on non-caucasian study population specifically from Asian region on breast cancer risk prediction models without genetic risk factor. A sizable study in Singapore showed gross overestimation of risk. Generalizability of the retrieved evidence is certainly restricted. There is currently no quality assessment tool or standard assessment of risk of bias for risk prediction modelling and validation studies. Altman has recently published a list of criteria nevertheless it was for prognostic modelling study though some factors relevant to prediction models described include components of study design, study population, sample size, completeness of data, variables and presentation.58 Systematic review of risk prediction studies is rare and difficult. There is also currently no standard reporting for risk prediction studies such as CONSORT guidelines for RCT. Therefore, there are variable reporting style by authors and single study reporting multiple model performances simultaneously are rare. No studies on economic evaluations of risk prediction models retrieved. Although there was no restriction in language during the search but only English full text articles were included in the report.
8 CONCLUSION
There was sufficient good level of retrievable evidence for breast cancer risk prediction model. There were six models identified for predicting breast cancer risk with Gail model is the most widely studied and validated model in various population. The Gail model appeared to have good calibration in validation studies done cross-population, however there is considerable heterogeneity across studies. This model showed moderate performance in terms of discriminatory ability.
For other risk prediction models, there was insufficient good level of retrievable evidence with only one study each of those other models (CARE model, model by Petracci, model by Pfeiffer, Vermont model, model by Anothaisintawee and BWHS model). The models were well calibrated in the validated population however appeared modest in discriminating woman who will be having breast cancer, than for those who will not in the study population.
There was insufficient evidence on the safety related to cancer risk prediction models for the detection of women who will develop breast cancer. Although there was minor adverse psychological sequale reported among high risk women who demonstrated to be five times more likely to have increased anxiety, it may be considered relatively safe.
HTA Report: Breast cancer risk prediction model for Health Risk Assessment (HRA) module
31
There was no retrievable evidence on economic evaluation of health risk assessment or risk prediction model for breast cancer, or cost implication involved in developing a new risk prediction model without genetic component for breast cancer retrieved. The cost involved in validating a model by a prospective cohort validation study could be very costly depending on the number of study participants and years of follow up. However potential direct cost implicated to the designing, developing, testing and commissioning of available one breast cancer prediction model was given approximately at RM75,000.
Cancer risk prediction models need continual validation to give meaningful risk estimate and to ensure its applicability in the setting it will be used. The complexity to develop and subsequently validate any breast cancer risk prediction model specifically models without genetic component is reflected in the necessary local data required and availability of dedicated research expertise to create a robust model with consistent performance.
9 RECOMMENDATION
Although the above review showed that the Gail model had good calibration and moderate discriminative ability, it is not suitable to be introduced as one of the strategy in the prevention of breast cancer under the Malaysian National Cancer Control Programme yet as it needs further validation to develop a well-fitted model that would have better predictive ability tailored to Malaysian population. In addition, this model needs continual validation to determine the consistency of its performance.
10 REFERENCES
1. World Health Organisation. International Agency for Research on Cancer. Globocan 2012; Estimated cancer incidence, mortality and prevalence worldwide in 2012. Available online at http://globocan.iarc.fr/Default.aspx accessed on 10 May 2014.
2. O Zainal Ariffin, IT Nor Saleha. National Cancer Registry Malaysia Report 2007, Cancer statistics: data and figure, Peninsular Malaysia. Ministry of Health, Malaysia. 2011
3. O Zainal Ariffin, MA Zainudin and IT Nor Saleha, eds. 2006. Malaysian cancer statistics – Data and figure Peninsular Malaysia 2006. Kuala Lumpur: National Cancer Registry, Ministry of Health Malaysia.
4. Ferlay J, Bray F, Parkin DM, Pisani P eds 2001. Globocan 2000. IARC Press, Lyon5. Yip CH, Ibrahim M. Epidemiology of breast cancer in Malaysia. Asian Pac J Cancer Prev
2006.7;7.6. Evans DGR & Howell A. Breast cancer risk assessment models. Breast Cancer Research
2007.9;213.7. Dahlui M, Ramli S, Bulgiba AM. Breast cancer prevention and control programs in Malaysia.
Asian Pacific Journal of Cancer Prevention 2011.12;1-4.8. Boughey JC, Hartmann LC, Anderson SS, et al. Evaluation of the Tyrer-Cuzick (International
Breast Cancer Intervention Study) Model for Breast Cancer Risk Prediction in Women With Atypical Hyperplasia. Journal of Clinical Oncology. 2010;28(22):3591-3596. doi:10.1200/JCO.2010.28.0784.
9. Parkin DM, Bray F, Ferlay J, et al. Global cancer statisticsa 2002. CA Cancer J Clin 2005.55;74-108
10. Familial breast cancer: collaborative reanalysis of individual data from 52 epidemiological studies including 58,209 women with breast cancer and 101,986 women without the disease. Lancet 2001.358;9291;1389-99.
11. Martin AM, Weber BL. Genetic and Hormonal Risk Factors in Breast Cancer. J Natl Cancer Inst 2000;92:1126–35
12. Vacek PM, Skelly JM, Geler BM. Breast cancer risk assessment in women aged 70 and older. Breast Cancer Res Treat.2011;130:291–299.DOI 10.1007/s10549-011-1576-1
HTA Report: Breast cancer risk prediction model for Health Risk Assessment (HRA) module
32
13. Ries LAG EM, Kosary CL. SEER cancer statistics review 2004 (1975-2001). National Cancer Institute. Accessed online at http://seer.cancer.gov/csr/1975_2001/.
14. Anothaisisntawee T, Teerawattananon Y, Wiratkapun C, et al. Risk prediction models of breast cancer: a systematic review of model performances. Breast Cancer Res Treat 2012. 133;1-10.
15. Meads C, Ahmed I, Riley RD. A systematic review of breast cancer incidence risk prediction models with meta analysis of their performance. Breast Cancer Res Treat 2012. 132; 365-377
16. Bondy ML & Newman LA. Breast cancer risk assessment models, applicability to African-American women. Cancer supplement 2003.97(1); 230-4.
17. Anderson EE, Hoskins K. Individual Breast Cancer risk assessment in Underserved Populations: Integrating empirical Bioethics and Health Disparities Research. Journal of health care for the poor and underserved. 2012;23(40):10.1353/hpu.2012.0178. doi:10.1353/hpu.2012.0178.
18. Freedman AN, Seminara D, Gail MH, et al. Cancer risk prediction models: a workshop on development, evaluation and application. J Natl Cancer Inst 2005;97:715-23.
19. Domchek SM, Eisen A, Calzone K. Application of Breast Cancer Risk Prediction Models in clinical practice. J Clin Oncol 2003; 21:593-601.
20. Wood ME. A clinician’s guide to breast cancer risk assessment. How best to apply the various tools available to help assess a woman’s risk for breast cancer. Cancer genetics 2010. February.8(1);15-20.
21. Ministry of Health Malaysia. Clinical Practice Guidelines.Management of Breast Cancer 2010.MOH/P/PAK/212.10(GU)
22. Danaei G, Vander Hoorn S, Lopez AD, et al. Causes of cancer in the world: comparative risk assessment of nine behavioral and environmental risk factors. Lancet 2005.366;1784-93.
23. Korde LA & Gadalla SM. Cancer risk assessment for primary care physician. Prim Care 2009. 36(3);471-88.doi:10.1016/j.pop.2009.04.006.
24. Moons KGM, Kengne AP, Grobbee DE, et al. Risk prediction models: II. External validation, model updating and impact assessment. Heart 2012. May;98(9):691-8. doi:10.1136/heartjnl-2011-301247
25. Claus EB 2001. Risk models used to counsel women for breast and ovarian cancer: a guide for clinicians. Familial Cancer 2001.1;197-206.
26. Elmore JG, Fletcher SW. The risk of cancer risk prediction: “What is my risk of getting breast cancer?” J Natl Cancer Inst. 2006;98:23:1673–1675
27. Canadian Breast Cancer Foundation. Risk assessment tool. Available at http://www.cbcf.org/central/aboutbreasthealth/preventionriskreduction/evaluatingbreastcancerrisk/pages/using-risk-assessment-tools.aspx. Accessed online on 10 January 2015
28. Fischer C, Kuchenbacker K, Engel, et al. Evaluating the performance of the breast cancer genetic risk models BOADICEA, IBIS, BRCAPRO and Claus for predicting BRCA1/2 mutation carrier probabilities: a study based on 7352 families from the German Hereditary Breast and Ovarian Cancer Consortium.2013;J Med Genet 50: 360–367.
29. Risk evaluator software. IBIS Breast Cancer Risk Evaluation Tool.Available at http://www.ems-trials.org/riskevaluator/ Accessed online on 15 January 2015
30. Critical Appraisal Skilled Programme Checklist.Making sense of evidence.Available at http://www.casp-uk.net/#!casp-tools-checklists/c18f8. Accesed online on 10 December 2014
31. Harris RP, Helfand M, Woolf SH, et al., for the Methods Work Group, third U.S. Preventive Services Task Force. Current methods of the U.S. Preventive Services Task Force: a review of the process. Am J Prev Med 2001;20(suppl 3):21-35.
32. Gail MH, Brinton LA, Byar DP et al Projecting individualized probabilities of developing breast cancer for white females who are being examined annually. 1989 J Natl Cancer Inst 81: 1879–1886
33. Schonfeld SJ, Pee D, Greenlee RT, et al. Effect of Changing Breast Cancer Incidence Rates on the Calibration of the Gail Model. J Clin Oncol 2010. 28:2411-2417
HTA Report: Breast cancer risk prediction model for Health Risk Assessment (HRA) module
33
34. Constantino JP, Gail MH, Pee D, Anderson S, Redmond CK, Benichou J et al. Validation studies for models projecting the risk of invasive and total breast cancer incidence. 2010. J Natl Cancer Inst 91(18):1541–1548
35. Newman LA 2010. Applicability of the Gail model for breast cancer risk assessment in Turkish female population and evaluation of breastfeeding as a risk factor. Breast Cancer Res Treat. 2010 Apr;120(2):425-6. doi: 10.1007/s10549-009-0614-8. Epub 2009 Dec 5.
36. Banegas MP, Gail MH, LaCroix A, et al. Evaluating breast cancer risk projections for Hispanic women. Breast Cancer Res Treat. 2012; February; 132(1): . doi:10.1007/s10549-011-1900-9.
37. Chay WY, Ong WS, Tan PH, et al.Validation of the Gail model for predicting individual breast cancer risk in a prospective nationwide study of 28,104 Singapore women. Breast Cancer Research 2012.14:R19
38. Boggs DA, Rosenberg L, Pencina MJ et al.Validation of a Breast Cancer Risk Prediction Model Developed for Black Women. J Natl Cancer Inst 2013.105:361–367
39. Adams-Campbell LL Makambi KH, Frederick WWI et al. Breast Cancer Risk Assessments Comparing Gail and CARE Models in African-American Women. Breast J. 2009; 15(0 1): S72–S75. doi:10.1111/j.15244741.2009.00824.x
40. Petracci E, Decarli A, Schairer C, et al. Risk Factor Modification and Projections of Absolute Breast Cancer Risk. J Natl Cancer Inst 2011;103:1–12
41. Pfeiffer RM, Park Y, Kreimer AR, et al. Risk Prediction for Breast, Endometrial, and Ovarian Cancer in White Women Aged 50 y or Older: Derivation and Validation from Population-Based Cohort Studies. PLoS Med 2013. 10(7): e1001492. doi:10.1371/journal.pmed.1001492
42. Boggs DA, Rosenberg L, Adams-Campbell LL, and Palmer JR. Prospective Approach to Breast Cancer Risk Prediction in African American Women: The Black Women’s Health Study Model. J Clin Oncol 2015.33; p1-7. DOI: 10.1200/JCO.2014.57.2750
43. Anothaisintawee T, Teerawattananon Y, Wiratkapun C, et al.Development and Validation of a Breast Cancer Risk Prediction Model for Thai Women: A Cross-Sectional Study. Asian Pac J Cancer Prev 2014. 15 (16), 6811-6817
44. Kye SY, Park K, Park HG et al. Psychological impact of health risk appraisal of Korean women at different levels of breast cancer risk: neglected aspect of the web-based cancer risk assessment tool. Asian Pacific J Cancer Prev. 2012;13:437-441
44. Scherer LD, Ubel PA, McClure J et al. Belief in numbers: when and why women disbelieve tailored breast cancer risk statistics. Patient education and counseling. 2013;92:253-259
45. Cancer.gov Inquiry. Email communication with US National Cancer Institute.Inquiry:141219-000001. Email date 23 December 2015
46. Smith RA, Saslow D, Sawyer KA, et al. American Cancer Society American Cancer Society Guidelines for Breast Cancer Screening: Update 2003. 2003; 53(3), 141–169. DOI: 10.3322/canjclin.53.3.141
47. HD Nelson, Huffman LH, Fu R et al. Genetic Risk Assessment and BRCA Mutation Testing for Breast and Ovarian Cancer susceptibility: Systematic Evidence Review for the US Preventive Service Task Force. Ann Intern Med 2005. 143(5);362-379.
48. Ward EM and Smith RA. Integrating tools for breast cancer risk assessment, risk reduction and early detection. Cancer Epidemiol Biomarkers Prev 2010.19(10);2428029. DOI:10.1158/1055-9965.EPI-10-0835
49. NICE clinical guideline 164.Familial Breast Cancer. Classification and care of people at risk of familial breast cancer and management of breast cancer and related risks in people with a family history of breast cancer 2013. guidance.nice.org.uk/cg164
50. Guerra CE, Sherman M, Armstrong K. Diffusion of breast cancer risk assessment in primary care. J Am Board Fam Med 2009.22;272-9.
51. Hall MJ, Olopade OI. Disparities in genetic testing: thinking outside the BRCA box. J Clin Oncol 2006. 24;2197-203.
HTA Report: Breast cancer risk prediction model for Health Risk Assessment (HRA) module
34
52. Santen RJ, Boyd NF, Chlebowski RT, et al. Critical assessment of new risk factors for breast cancer: considerations for development of an improved risk prediction model. Endocrine related cancer 2007.14; 169-187.
53. Thirtagiri E, Lee SY, Kang P, et al. Evaluation of BRCA1 and BRCA2 mutations and risk prediction models in a typical Asian country (Malaysia) with a relatively low incidence of breast cancer. Breast Cancer Research 2008;10;R59(doi:10.1186/bcr2118)
54. Evaluating the performance of BOADICEA and Manchaster Scoring System for Predicting the risk of having a BRCA mutation in an Asian Breast Cancer Cohort. Current Oncology 2014. 5th Conference International Symposium on Hereditary breast and ovarian cancer.ppe358-e391.21(2)(ppe389)
55. LPPKN Report 2011. Subsidi kesan barah payu dara. Lembaga Penduduk dan Pembangunan Keluarga Negara (subsidized screening for breast cancer) updated 2011.Available from http://www.lppkn.gov.my/lppkn/index.php?option accessed on 10 January 2015
56. Bahagian Pembangunan Kesihatan Keluarga, Kementerian Kesihatan Malaysia. Garispanduan Program Pengesanan Awal Kanser Payudara Kebangsaan 2011.
57. National Health and Morbidity Survey (NHMS III) 2006.Women’s Health. Breast Health Awareness. Available at http://www.nih.gov.my/NHMS/abstracts_11.html accessed on 16 February 2015
58. Altman D 2009. Prognostic models: a methodological framework and review of models for breast cancer. Cancer Invest 2009. 27;235-243.
HTA Report: Breast cancer risk prediction model for Health Risk Assessment (HRA) module
35
Appendix 1
HIERARCHY OF EVIDENCE FOR EFFECTIVENESS STUDIES
DESIGNATION OF LEVELS OF EVIDENCE
I Evidence obtained from at least one properly designed randomized controlled trial.
II-I Evidence obtained from well-designed controlled trials without randomization.
II-2 Evidence obtained from well-designed cohort or case-control analytic studies, preferably from more than one centre or research group.
II-3 Evidence obtained from multiple time series with or without the intervention. Dramatic results in uncontrolled experiments (such as the results of the introduction of penicillin treatment in the 1940s) could also be regarded as this type of evidence.
III Opinions or respected authorities, based on clinical experience; descriptive studies and case reports; or reports of expert committees.
SOURCE: US/CANADIAN PREVENTIVE SERVICES TASK FORCE (Harris 2001)

HTA Report: Breast cancer risk prediction model for Health Risk Assessment (HRA) module
36
Appendix 2
PTK – FM – 02
HEALTH TECHNOLOGY ASSESSMENT (HTA) PROTOCOL HEALTH RISK ASSESSMENT (HRA) MODULE FOR BREAST CANCER
1. BACKGROUND INFORMATION
Breast cancer is the second most commonly diagnosed cancer worldwide. Among women worldwide, it is the most commonly diagnosed cancer which represents 1 in 4 of all cancers and the most common cause of cancer death (522,000 deaths in 2012). The incidence is rising with 1.7 million women were diagnosed with breast cancer in 2012 and mortality has increased by 14% since the 2008 estimates.1 Incidence rates is higher in more developed region, however mortality is much higher in less developed countries due to lack of early detection and access to treatment facilities.1
In Malaysia, the National Cancer Registry (NCR) 2007 reported that breast cancer was the most commonly diagnosed cancer in women with overall age standardized incidence rate (ASR) of 29.1 per 100,000 population.2 It was however higher than incidence in other developing countries with ASR of 20 per 100,000 population.3 About 30 to 40% of Malaysian women presented at a later stage of breast cancer (stage III and IV) compared to other counterparts in the developing countries.4
The increase has been said related to changes in dietary and reproductive pattern, urbanization and ageing population.5,6 Hence, affordable and effective approaches in cancer control are needed for early detection, diagnosis and treatment of breast cancer particularly in the less developed countries.1
The widely quoted general population lifetime risk of having breast cancer is one in eight to one in 12, and the risk in any given decade was never greater than one in 30. The proportion of all female deaths due to breast cancer per decade is never greater than 20% with the greatest proportion from the middle age group (35 to 55 years).7 For familial breast cancer, approximately five to ten percent of cases occur in women with Hereditary Breast Ovarian Cancer Syndrome (HBOC), which has mutation in BRCA1 and BRCA2 genes.8 Women with BRCA1 and BRCA2 mutation have a 50% to 80% lifetime risk of breast cancer. These women also have a 40% to 60% lifetime risk of having contralateral breast cancer.8 The organized breast cancer screening programmes using mammography has been well established in Europe and Northern America resulting in improved five year survival rate, as high as 89%.9 Providing breast cancer screening programme using mammography to every woman in most developing countries is not feasible, thus identifying women with relatively higher risk of developing breast cancer is a promising alternative.10
Prediction model of breast cancer is a mathematical equation designed to quantify the risk an individual woman would develop breast cancer in a defined period.10 Reliably accurate prediction models can inform future disease burdens, health policies and individual decisions, as well as to counsel those at risk and determine eligibility for prospective prevention trial.11,12 All known breast cancer risk factors need to be assessed to evaluate its risk over time as accurately as possible including family history, hormonal and reproductive risk factors such as the use of exogenous hormones (estrogen and progesterone), endogenous hormonal factors (ages at menarche, menopause and first childbirth), and environmental risks such as alcohol intake, diet, exercise, obesity, as well as increase breast density.13 21% of all breast cancer deaths worldwide are attributable to alcohol use, overweight and obesity, and physical inactivity.14 Models containing modifiable risk factors are of particular interest to patients and those involved in reducing population incidence rates.11
Two main types of cancer risk assessment models are; model aimed at assessing breast cancer risk over time or to predict probability of being diagnosed with a cancer; and the other aimed at assessing mutation probability of an individual or carrying a gene mutation that predisposes to a particular cancer.5 Some available models are the Gail model, Claus model, Cuzick-Tyrer model, Breast and ovarian analysis of disease incidence and carrier estimation algorithm (BOADICEA), BRCAPRO, Couch, Shattuck Eiden, IBIS models and Manchaster scoring.5 The Gail model provides 5-year and lifetime risk estimate of having breast cancer and is accessible on the internet. The Claus model is useful for assessing breast cancer risk with a family history, similarly with BRCAPRO, BOADICEA and IBIS models which can produce both mutation probabilities and breast and ovarian cancer estimates.12
HTA Report: Breast cancer risk prediction model for Health Risk Assessment (HRA) module
37
Identification of individual with a suspected heritable cancer syndrome (HBOC) has implications for evaluation and application of risk reducing options such as chemoprevention and prophylactic surgery.15 These underline the need for risk prediction model for breast cancer, not only to predict which women will develop the disease, but also to apply appropriate intervention and lifestyle measures in order to prevent the disease.5 Better understanding of these model performances, including the strengths and limitations is needed before applying them in clinical practice.
In Malaysia, currently there is no risk assessment model/health risk assessment (HRA) for breast cancer in predicting probability of being diagnosed with a cancer and probability of carrying a gene mutation that predisposes individual to a particular cancer in existing cancer control approaches. Hence, this review was requested by a Senior Principal Assistant Director, Health Education Division, Ministry of Health to review the evidence on breast cancer risk assessment model as a tool in enhancing early detection and diagnosis of breast cancer, towards facilitating the implementation of affordable and effective cancer control approach in the country.
2 POLICY QUESTION
i. In Ministry of Health, should a health risk assessment (HRA) model for breast cancer be introduced as one of the strategies in the prevention of breast cancer under the Malaysia National Cancer Control Programme?
ii. If HRA model for breast cancer be introduced, which HRA for model breast cancer should be adopted in Malaysia?
2.1 OBJECTIVES
i. To assess the effectiveness, predictive accuracy, strengths and weaknesses of retrieved breast cancer risk assessment/prediction models among women
ii. To assess the safety, organizational and ethical issues, and economic implications related to risk assessment/prediction models for breast cancer among women
2.2 RESEARCH QUESTIONS
i. What are the effectiveness, predictive accuracy, strengths and weaknesses of retrieved breast cancer risk assessment/prediction models among women
ii. What are the safety, organizational and ethical issues and economic implications related to the use of breast cancer risk assessment/prediction models among women
3 METHODS
Systematic reviews following the principles used by Cochrane Collaboration will be conducted to achieve the objectives of this review
3.1 SEARCH STRATEGY
i. Electronic database will be searched for published literatures pertaining to breast cancer risk assessment/prediction models among women, its performance, accuracy, benefits, strengths and weaknesses, implications
ii. The following databases will be used to carry out the search of evidence:- MEDLINE, EBM Reviews-Cochrane Database of Systematic Review, EBM-Reviews-Cochrane Central Register of Controlled Trials, EBM Reviews-Health Technology Assessment, EBM Reviews-Cochrane Methodology Register, EBM Reviews-NHS Economic Evaluation Database, Database of Abstracts of Reviews of Effects (DARE), PubMed, Horizon Scanning, INAHTA Database, HTA database and FDA database.
iii. Additional literatures will be identified from the references of the relevant articles. iv. Expert in this area will be contacted when necessary to get further information. v. Handsearching of evidence will be conducted if necessary to find unpublished evidence vi. General search engine might be used to get additional web-based information if there is no
retrievable evidence from the scientific databases. vii. There will be no limitation applied in the search such as year and language. viii. The detail of the search strategy will be presented in the appendix.
HTA Report: Breast cancer risk prediction model for Health Risk Assessment (HRA) module
38
3.2 INCLUSION AND EXCLUSION CRITERIA
3.2.1 INCLUSION CRITERIA
• Population : Adultwomanmorethan18yearsold• Intervention : Breastcancerriskassessment/riskpredictionmodel/HealthRisk
Assessment models involving single or multiple risk factors• Comparators :-• Outcome : i. Performance of available breast cancer risk prediction models
in terms of its predictive accuracy - sensitivity, specificity, positive predictive value (PPV), and negative predictive value (NPV), calibration as measured by expected/observed ratio, discrimination as measured by AUC or c-statistic
ii. Strengths and weaknesses of retrieved risk prediction model (qualitative)
iii. Effectiveness/benefit of the breast cancer risk assessment/predictive model related to patient outcome as measured by detection rate, acceptance, awareness, receptiveness
iv. Organizational (operational, training, resources), ethical, legal and economic implication
• Study design : No restriction of study type. HTA report, Systematic Review, Randomised Controlled Trial (RCT), Non Randomised Controlled Trial, diagnostic accuracy studies, Observational Studies (Cohort study, Case Control study, Cross Sectional study with gold standard), and economic evaluation studies such as cost-effectiveness / cost-utility analysis.
• Full text articles published in English.
3.2.2 EXCLUSION CRITERIA
• Breastcancerprognosticmodelswillnotbeincludedinthisreview• Studieswiththesedesignwillbeexcluded:
i. Animal study ii. Narrative review iii. Laboratory study
•Studies on risk assessment/ risk prediction/ health risk assessment models for breast cancer with any genetic component as risk factor
•Studies in women who already had breast cancer when recruited or studies involving male subjects
•Non English full text article.
3.3 DATA EXTRACTION STRATEGY
Data will be extracted by a reviewer and checked by a second reviewer using a pre-tested data extraction form. Disagreements will be resolved through discussion. A third person, whose decision is final will be consulted when disagreements persists after discussion.
3.4 QUALITY ASSESSMENT STRATEGY/ASSESMENT OF RISK OF BIAS
The validity of the eligible studies will be assessed by two reviewers independently using Critical Appraisal Skill Programs checklists criteria according to the study designs. The quality of the evidence will be graded according to US/Canadian Preventive Services Task Force Grading System.
HTA Report: Breast cancer risk prediction model for Health Risk Assessment (HRA) module
39
3.5 METHODS OF ANALYSIS/SYNTHESIS
Data will be summarized in evidence table. If the data is suitable for statistical pooling, meta-analyses of the main outcomes will be performed. Otherwise data for the outcomes will be reported narratively.
4. REPORT WRITING
Appendix 3
Search strategy
MEDLINE ® In progress and other Non-Indexed Citations and Ovid Medline® 1946 to present.
1 human mammary neoplasm*.tw.2 neoplasm* human mammary.tw.3 breast adj1 neoplasm*.tw.4 cancer of the breast.tw.5 cancer of breast.tw6 mammary carcinoma* human.tw.7 mammary neoplasm* human.tw.8 carcinoma* human mammary.tw.9 human mammary carcinoma*.tw.10 breast adj1 tumor*.tw.11 malignant neoplasm of breast.tw.12 breast adj1 neoplasm*.tw.13 mammary cancer.tw.14 malignant tumor of breast.tw.15 breast adj1 cancer.tw.16 breast carcinoma.tw.17 or/1-1618 assessment* risk.tw.19 benefit-risk adj1 assessment*.tw.20 benefit risk assessment.tw.21 benefit-risk assessment.tw.22 risk benefit assessment.tw.23 risk-benefit adj1 assessment*.tw.24 risks and benefits.tw.25 risk assessment*.tw.26 benefits and risks.tw.27 health risk assessment model.tw.28 risk prediction.tw.29 prediction model.tw30 or/18-2931 Female.tw.32 wom*n.tw.33 wom* group*.tw.34 group wom*.tw.35 Adult*.tw.36 or/31-35
37 17 and 30 and 36
HTA Report: Breast cancer risk prediction model for Health Risk Assessment (HRA) module
40
EBM Reviews - Cochrane Database of Systematic Reviews
1 human mammary neoplasm*.tw.
2 neoplasm* human mammary.tw.
3 breast adj1 neoplasm*.tw.
4 cancer of the breast.tw.
5 cancer of breast.tw
6 mammary carcinoma* human.tw.
7 mammary neoplasm* human.tw.
8 carcinoma* human mammary.tw.
9 human mammary carcinoma*.tw.
10 breast adj1 tumor*.tw.
11 malignant neoplasm of breast.tw.
12 breast adj1 neoplasm*.tw.
13 mammary cancer.tw.
14 malignant tumor of breast.tw.
15 breast adj1 cancer.tw.
16 breast carcinoma.tw.
17 or/1-16
18 assessment* risk.tw.
19 benefit-risk adj1 assessment*.tw.
20 benefit risk assessment.tw.
21 benefit-risk assessment.tw.
22 risk benefit assessment.tw.
23 risk-benefit adj1 assessment*.tw.
24 risks and benefits.tw.
25 risk assessment*.tw.
26 benefits and risks.tw.
27 health risk assessment model.tw.
28 risk prediction.tw.
29 prediction model.tw
30 or/18-29
31 Female.tw.
32 wom*n.tw.
33 wom* group*.tw.
34 group wom*.tw.
35 Adult*.tw.
36 or/31-35
37 17 and 30 and 36
HTA Report: Breast cancer risk prediction model for Health Risk Assessment (HRA) module
41
Pubmed
(“breast neoplasms”[MeSH Terms] OR (“breast”[All Fields] AND “neoplasms”[All Fields]) OR “breast neoplasms”[All Fields] OR (“human”[All Fields] AND “mammary”[All Fields] AND “neoplasm”[All Fields])) AND (“humans”[MeSH Terms] OR “humans”[All Fields] OR “human”[All Fields]) AND (“mammary glands, human”[MeSH Terms] OR (“mammary”[All Fields] AND “glands”[All Fields] AND “human”[All Fields]) OR “human mammary glands”[All Fields] OR “mammary”[All Fields] OR “breast”[MeSH Terms] OR “breast”[All Fields]) AND (“breast neoplasms”[MeSH Terms] OR (“breast”[All Fields] AND “neoplasms”[All Fields]) OR “breast neoplasms”[All Fields] OR (“breast”[All Fields] AND “neoplasm”[All Fields]) OR “breast neoplasm”[All Fields]) AND (“breast neoplasms”[MeSH Terms] OR (“breast”[All Fields] AND “neoplasms”[All Fields]) OR “breast neoplasms”[All Fields] OR (“cancer”[All Fields] AND “breast”[All Fields]) OR “cancer of breast”[All Fields]) AND (“mammary glands, human”[MeSH Terms] OR (“mammary”[All Fields] AND “glands”[All Fields] AND “human”[All Fields]) OR “human mammary glands”[All Fields] OR “mammary”[All Fields] OR “breast”[MeSH Terms] OR “breast”[All Fields]) AND (“carcinoma”[MeSH Terms] OR “carcinoma”[All Fields] OR “carcinomas”[All Fields]) AND (“breast neoplasms”[MeSH Terms] OR (“breast”[All Fields] AND “neoplasms”[All Fields]) OR “breast neoplasms”[All Fields] OR (“human”[All Fields] AND “mammary”[All Fields] AND “neoplasm”[All Fields])) AND (“breast neoplasms”[MeSH Terms] OR (“breast”[All Fields] AND “neoplasms”[All Fields]) OR “breast neoplasms”[All Fields] OR (“human”[All Fields] AND “mammary”[All Fields] AND “neoplasm”[All Fields])) AND (“breast neoplasms”[MeSH Terms] OR (“breast”[All Fields] AND “neoplasms”[All Fields]) OR “breast neoplasms”[All Fields] OR (“human”[All Fields] AND “mammary”[All Fields] AND “carcinoma”[All Fields]) OR “human mammary carcinoma”[All Fields]) AND (“tumours”[All Fields] OR “neoplasms”[MeSH Terms] OR “neoplasms”[All Fields] OR “tumors”[All Fields]) AND (“breast neoplasms”[MeSH Terms] OR (“breast”[All Fields] AND “neoplasms”[All Fields]) OR “breast neoplasms”[All Fields] OR (“breast”[All Fields] AND “malignant”[All Fields] AND “neoplasm”[All Fields]) OR “breast malignant neoplasm”[All Fields]) AND (“breast neoplasms”[MeSH Terms] OR (“breast”[All Fields] AND “neoplasms”[All Fields]) OR “breast neoplasms”[All Fields] OR (“breast”[All Fields] AND “malignant”[All Fields] AND “neoplasm”[All Fields]) OR “breast malignant neoplasm”[All Fields]) AND (“breast neoplasms”[MeSH Terms] OR (“breast”[All Fields] AND “neoplasms”[All Fields]) OR “breast neoplasms”[All Fields] OR (“breast”[All Fields] AND “neoplasm”[All Fields]) OR “breast neoplasm”[All Fields]) AND (“breast”[MeSH Terms] OR “breast”[All Fields]) AND (“breast neoplasms”[MeSH Terms] OR (“breast”[All Fields] AND “neoplasms”[All Fields]) OR “breast neoplasms”[All Fields]) AND (“breast neoplasms”[MeSH Terms] OR (“breast”[All Fields] AND “neoplasms”[All Fields]) OR “breast neoplasms”[All Fields] OR (“breast”[All Fields] AND “neoplasm”[All Fields]) OR “breast neoplasm”[All Fields]) AND (“mammary glands, human”[MeSH Terms] OR (“mammary”[All Fields] AND “glands”[All Fields] AND “human”[All Fields]) OR “human mammary glands”[All Fields] OR “mammary”[All Fields] OR “breast”[MeSH Terms] OR “breast”[All Fields]) AND cancer.malignant[All Fields] AND (“breast neoplasms”[MeSH Terms] OR (“breast”[All Fields] AND “neoplasms”[All Fields]) OR “breast neoplasms”[All Fields] OR (“tumor”[All Fields] AND “breast”[All Fields]) OR “tumor of breast”[All Fields]) AND (“neoplasms”[MeSH Terms] OR “neoplasms”[All Fields] OR (“malignant”[All Fields] AND “tumor”[All Fields]) OR “malignant tumor”[All Fields]) AND breast.breast[All Fields] AND (“neoplasms”[MeSH Terms] OR “neoplasms”[All Fields] OR “cancer”[All Fields]) AND (“breast neoplasms”[MeSH Terms] OR (“breast”[All Fields] AND “neoplasms”[All Fields]) OR “breast neoplasms”[All Fields] OR (“breast”[All Fields] AND “carcinoma”[All Fields]) OR “breast carcinoma”[All Fields])AND (“Assessment”[Journal] OR “assessment”[All Fields]) AND (“risk”[MeSH Terms] OR “risk”[All Fields]) AND (“risk assessment”[MeSH Terms] OR (“risk”[All Fields] AND “assessment”[All Fields]) OR “risk assessment”[All Fields] OR (“benefit”[All Fields] AND “risk”[All Fields] AND “assessment”[All Fields]) OR “benefit risk assessment”[All Fields]) AND (“risk assessment”[MeSH Terms] OR (“risk”[All Fields] AND “assessment”[All Fields]) OR “risk assessment”[All Fields] OR (“benefit”[All Fields] AND “risk”[All Fields] AND “assessment”[All Fields]) OR “benefit risk assessment”[All Fields]) AND (“risk assessment”[MeSH Terms] OR (“risk”[All Fields] AND “assessment”[All Fields]) OR “risk assessment”[All Fields] OR (“benefit”[All Fields] AND “risk”[All Fields] AND “assessment”[All Fields]) OR “benefit risk assessment”[All Fields]) AND (“risk assessment”[MeSH Terms] OR (“risk”[All Fields] AND “assessment”[All Fields]) OR “risk assessment”[All Fields] OR (“risk”[All Fields] AND “benefit”[All Fields] AND “assessment”[All Fields]) OR “risk benefit assessment”[All Fields]) AND (“risk assessment”[MeSH Terms] OR (“risk”[All Fields] AND “assessment”[All Fields]) OR “risk assessment”[All Fields] OR (“risk”[All Fields] AND “benefit”[All Fields] AND “assessment”[All Fields]) OR “risk benefit assessment”[All Fields]) AND (“risk assessment”[MeSH Terms] OR (“risk”[All Fields] AND “assessment”[All Fields]) OR “risk assessment”[All Fields] OR (“risks”[All Fields] AND “benefits”[All Fields]) OR “risks and benefits”[All Fields]) AND (“risk assessment”[MeSH Terms] OR (“risk”[All Fields] AND “assessment”[All Fields]) OR “risk assessment”[All Fields]) AND (“risk assessment”[MeSH Terms] OR (“risk”[All Fields] AND “assessment”[All Fields]) OR “risk assessment”[All Fields] OR (“benefits”[All Fields] AND “risks”[All Fields]) OR “benefits and risks”[All Fields]) AND (“health”[MeSH Terms] OR “health”[All Fields]) AND (“risk assessment”[MeSH Terms] OR (“risk”[All Fields] AND “assessment”[All Fields]) OR “risk assessment”[All Fields]) AND model[All Fields] AND (“risk”[MeSH Terms] OR “risk”[All Fields]) AND prediction[All Fields] AND prediction[All Fields] AND model.[All Fields]
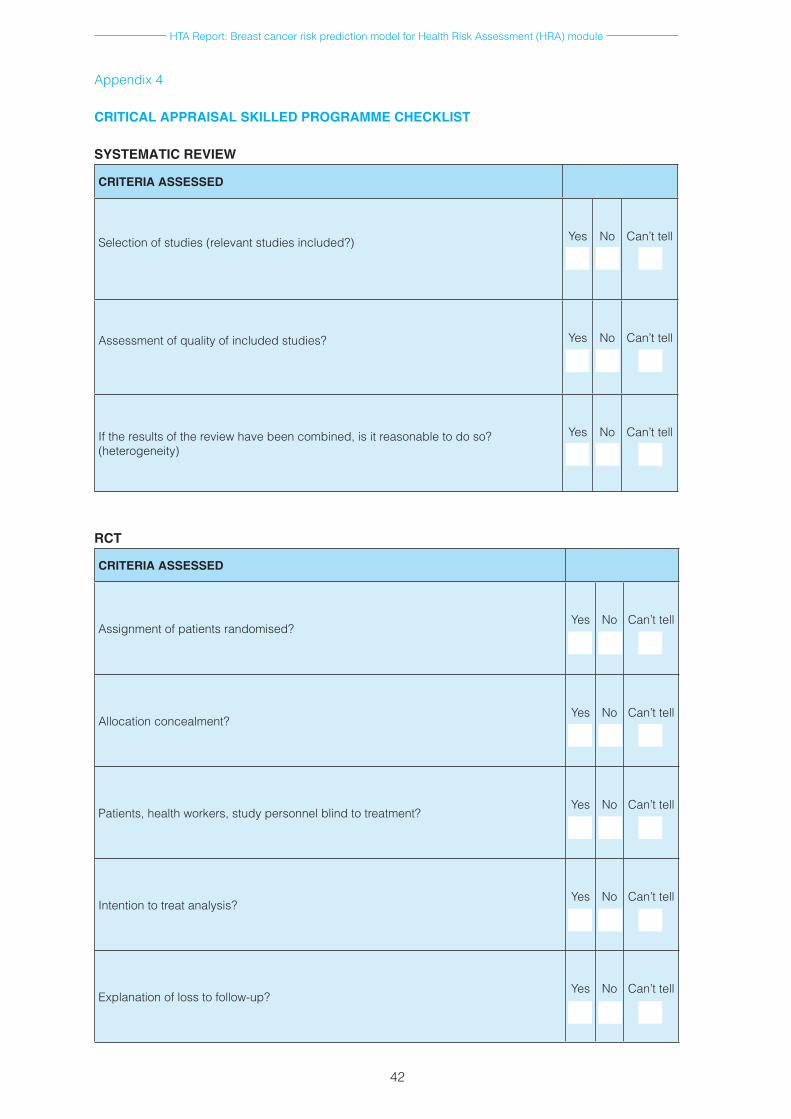
HTA Report: Breast cancer risk prediction model for Health Risk Assessment (HRA) module
42
Appendix 4
CRITICAL APPRAISAL SKILLED PROGRAMME CHECKLIST
SYSTEMATIC REVIEW
CRITERIA ASSESSED
Selection of studies (relevant studies included?) Yes No Can’t tell
Assessment of quality of included studies? Yes No Can’t tell
If the results of the review have been combined, is it reasonable to do so? (heterogeneity)
Yes No Can’t tell
RCT
CRITERIA ASSESSED
Assignment of patients randomised?Yes No Can’t tell
Allocation concealment?Yes No Can’t tell
Patients, health workers, study personnel blind to treatment?Yes No Can’t tell
Intention to treat analysis?Yes No Can’t tell
Explanation of loss to follow-up?Yes No Can’t tell
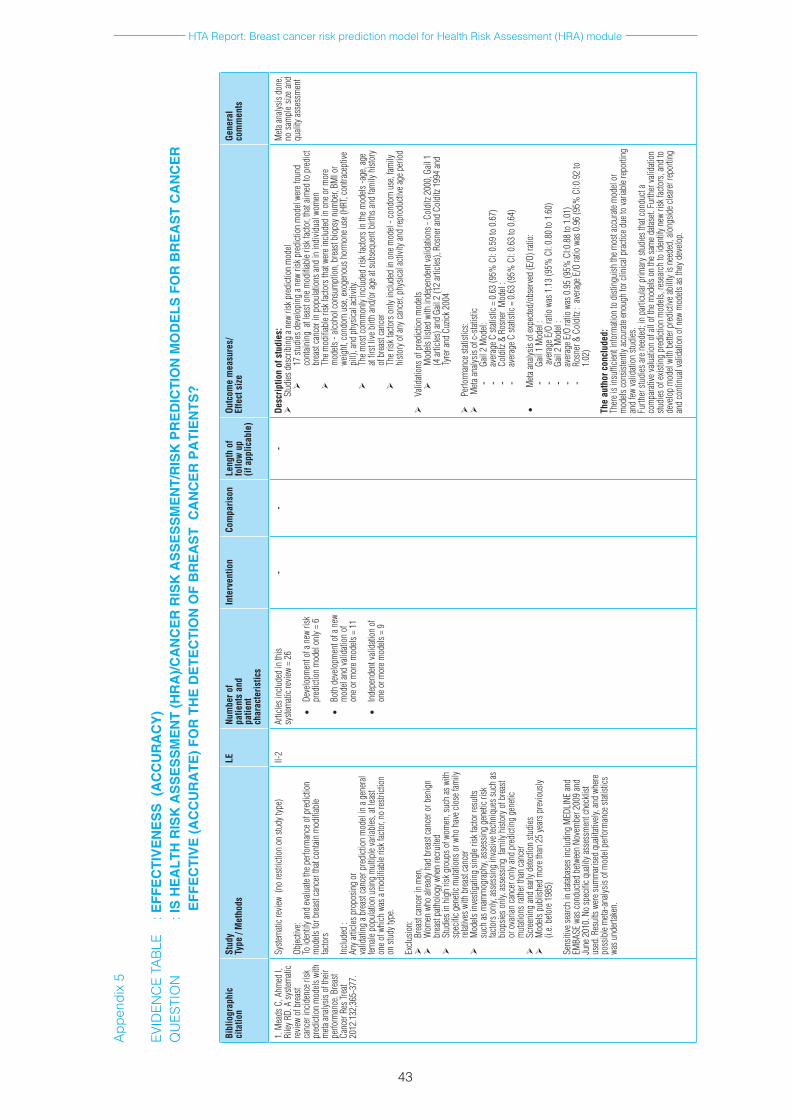
HTA Report: Breast cancer risk prediction model for Health Risk Assessment (HRA) module
43
Bibl
iogr
aphi
cci
tatio
nSt
udy
Type
/ M
etho
dsLE
Num
ber o
f pa
tient
s an
dpa
tient
ch
arac
teris
tics
Inte
rven
tion
Com
paris
onLe
ngth
of
follo
w u
p(if
app
licab
le)
Outc
ome
mea
sure
s/
Effe
ct s
ize
Gene
ral
com
men
ts
1.M
eads
C,A
hmed
I,
Riley
RD.
Asy
stem
atic
revie
wof
bre
ast
canc
erin
ciden
ceri
sk
pred
ictio
nm
odels
with
m
etaan
alysis
oft
heir
perfo
rman
ce.B
reas
tCa
ncer
Res
Trea
t20
12.1
32;3
65-3
77.
Syste
mati
crev
iew(
nore
strict
ion
onst
udyt
ype)
Objec
tive:
Toid
entif
yand
evalu
ateth
eper
form
ance
ofp
redi
ction
m
odels
forb
reas
tcan
cert
hatc
ontai
nm
odifi
able
facto
rs
Inclu
ded
:An
yarti
clesp
ropo
sing
orva
lidati
nga
brea
stca
ncer
pre
dicti
onm
odel
ina
gene
ral
female
pop
ulati
onu
sing
mul
tiple
varia
bles
,atl
east
oneo
fwhi
chw
asa
mod
ifiab
leris
kfac
tor,
nore
strict
ion
onst
udyt
ype.
Exclu
sion:
Brea
stca
ncer
inm
en,
Wom
enw
hoal
read
yhad
bre
astc
ance
rorb
enig
nbr
east
path
olog
ywhe
nre
crui
ted
Stud
iesin
hig
hris
kgro
upso
fwom
en,s
uch
asw
ith
spec
ificg
eneti
cmut
ation
sorw
hoh
avec
lose
fam
ily
relat
ivesw
ithb
reas
tcan
cer
Mod
elsin
vesti
gatin
gsin
gler
iskfa
ctorr
esul
tssu
chas
mam
mog
raph
y,as
sess
ing
gene
ticri
sk
facto
rso
nly,
asse
ssin
gin
vasiv
etec
hniq
uess
uch
as
biop
sieso
nly,
asse
ssin
gfa
mily
hist
oryo
fbre
ast
oro
varia
nca
ncer
onl
yand
pre
dicti
ngg
eneti
cm
utati
onsr
ather
than
canc
er
Scre
enin
gan
dea
rlyd
etecti
onst
udies
Mod
elsp
ublis
hed
mor
etha
n25
year
spre
vious
ly(i.
e.be
fore
198
5)
Sens
itive
sear
chin
data
base
sinc
ludi
ngM
EDLI
NEan
dEM
BASE
was
cond
ucted
betw
een
Nove
mbe
r200
9an
dJu
ne2
010.
No
spec
ificq
ualit
yass
essm
entc
heck
list
used
.Res
ults
were
sum
mar
ised
quali
tative
ly,an
dwh
ere
poss
ible
meta
-ana
lysis
ofm
odel
perfo
rman
cest
atisti
cs
wasu
nder
taken
.
II-2
Artic
lesin
clude
din
this
syste
mati
crev
iew=
26
•De
velo
pmen
tofa
new
risk
pr
edict
ion
mod
elon
ly=
6
•Bo
th d
evelo
pmen
t of a
new
m
odel
and
valid
ation
of
oneo
rmor
emod
els=
11
•In
depe
nden
tvali
datio
nof
on
eorm
orem
odels
=9
--
-De
scrip
tion
of s
tudi
es:
Stud
iesd
escr
ibin
gan
ewri
skp
redi
ction
mod
el
17st
udies
dev
elopi
nga
new
riskp
redi
ction
mod
elwe
refo
und
cont
ainin
gat
leas
tone
mod
ifiab
leris
kfac
tor,
that
aimed
top
redi
ctbr
east
canc
erin
pop
ulati
onsa
ndin
indi
vidua
lwom
en
Them
odifi
able
riskf
acto
rsth
atwe
rein
clude
din
one
orm
ore
mod
els-
alcoh
olco
nsum
ptio
n,b
reas
tbio
psyn
umbe
r,BM
Ior
weig
ht,c
ondo
mu
se,e
xoge
nous
hor
mon
euse
(HRT
,con
trace
ptive
pi
ll),a
ndp
hysic
alac
tivity
.
Them
ostc
omm
only
inclu
ded
riskf
acto
rsin
them
odels
-age
,age
at
first
liveb
irth
and/
orag
eats
ubse
quen
tbirt
hsan
dfam
ilyh
istor
yof
bre
astc
ance
r
Ther
iskfa
ctors
onl
yinc
lude
din
one
mod
el-c
ondo
mu
se,f
amily
hi
story
ofa
nyca
ncer,
phy
sical
activ
ityan
dre
prod
uctiv
eage
per
iod
Valid
ation
sofp
redi
ction
mod
els
Mod
elsli
sted
with
inde
pend
entv
alida
tions
-Co
lditz
200
0,G
ail1
(4
artic
les)a
ndG
ail2
(12
artic
les),
Rosn
eran
dCo
lditz
199
4an
dTy
rera
ndC
uzick
200
4
Perfo
rman
cest
atisti
cs:
Meta
analy
siso
fc-s
tatist
ic-
Gail
2M
odel:
-
aver
ageC
stati
stic=
0.6
3(9
5%C
I:0.
59to
0.6
7)
- Co
lditz
&R
osne
rM
odel
:-
aver
ageC
stati
stic=
0.6
3(9
5%C
I:0.
63to
0.6
4)
•M
etaan
alysis
ofe
xpec
ted/o
bser
ved
(E/O
)rati
o:-
Gail
1M
odel
:-
aver
ageE
/Ora
tiow
as1
.13
(95%
CI:
0.80
to1
.60)
-
Gail
2M
odel
:-
aver
ageE
/Ora
tiow
as0
.95
(95%
CI:0
.88
to1
.01)
-
Rosn
er&
Col
ditz
:av
erag
eE/O
ratio
was
0.9
6(9
5%C
I:0.9
2to
1.
02)
The
auth
or c
oncl
uded
:Th
erei
sins
uffic
ienti
nfor
mati
onto
dist
ingu
ishth
emos
tacc
urate
mod
elor
m
odels
cons
isten
tlyac
cura
teen
ough
forc
linica
lpra
ctice
due
tova
riabl
erep
ortin
gan
dfew
valid
ation
stud
ies.
Furth
erst
udies
aren
eede
d;in
par
ticul
arp
rimar
ystu
dies
that
cond
ucta
co
mpa
rativ
evalu
ation
ofa
llof
them
odels
on
thes
amed
atase
t.Fu
rther
valid
ation
stu
dies
ofe
xistin
gpr
edict
ion
mod
els,r
esea
rch
toid
entif
ynew
risk
facto
rs,a
ndto
de
velo
pm
odel
with
bett
erp
redi
ctive
abili
tyis
need
ed,a
long
sidec
leare
rrep
ortin
gan
dco
ntin
ualv
alida
tion
ofn
ewm
odels
asth
eyd
evelo
p.
Meta
analy
sisd
one,
nos
ampl
esiz
ean
dqu
ality
asse
ssm
ent
App
endi
x 5
EV
IDEN
CE
TAB
LE
: EFF
EC
TIV
EN
ES
S (
AC
CU
RA
CY
) Q
UES
TIO
N
: IS
HE
ALT
H R
ISK
AS
SE
SS
ME
NT
(HR
A)/C
AN
CE
R R
ISK
AS
SE
SS
ME
NT/
RIS
K P
RE
DIC
TIO
N M
OD
ELS
FO
R B
RE
AS
T C
AN
CE
R
E
FFE
CTI
VE
(AC
CU
RA
TE) F
OR
TH
E D
ETE
CTI
ON
OF
BR
EA
ST
CA
NC
ER
PA
TIE
NTS
?
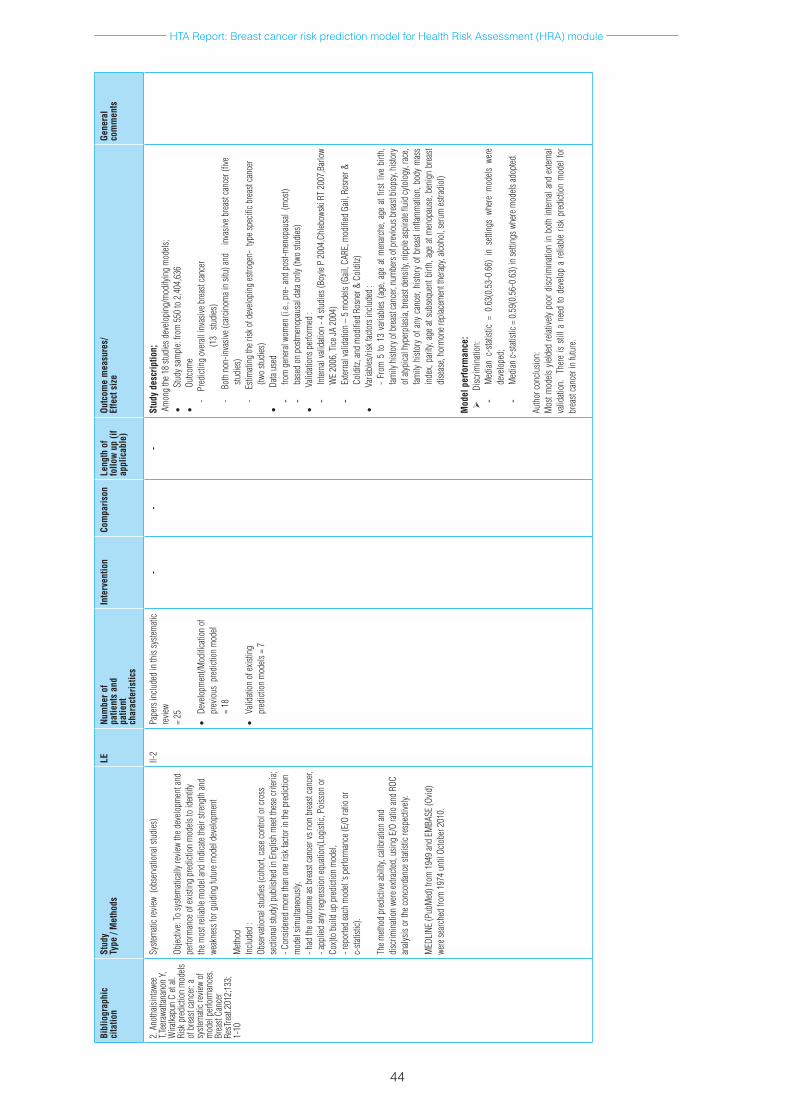
HTA Report: Breast cancer risk prediction model for Health Risk Assessment (HRA) module
44
Bibl
iogr
aphi
cci
tatio
nSt
udy
Type
/ M
etho
dsLE
Num
ber o
f pa
tient
s an
dpa
tient
ch
arac
teris
tics
Inte
rven
tion
Com
paris
onLe
ngth
of
follo
w u
p (if
ap
plic
able
)
Outc
ome
mea
sure
s/
Effe
ct s
ize
Gene
ral
com
men
ts
2.A
noth
aisin
tawee
T,T
eera
watta
nano
nY,
Wira
tkapu
nC
etal.
Ri
skp
redi
ction
mod
els
ofb
reas
tcan
cer:
asy
stem
aticr
eview
of
mod
elpe
rform
ance
s.Br
east
Canc
er
ResT
reat.
2012
;133
;1-
10
Syste
mati
crev
iew(
obse
rvati
onal
studi
es)
Objec
tive:
Tosy
stem
atica
llyre
view
thed
evelo
pmen
tand
pe
rform
ance
ofe
xistin
gpr
edict
ion
mod
elsto
iden
tify
them
ostr
eliab
lem
odel
and
indi
cate
their
stre
ngth
and
weak
ness
forg
uidi
ngfu
ture
mod
elde
velo
pmen
t
Meth
odIn
clude
d:
Obse
rvati
onal
studi
es(c
ohor
t,ca
seco
ntro
lorc
ross
se
ction
alstu
dy)p
ublis
hed
inE
nglis
hm
eett
hese
crite
ria;
-Con
sider
edm
oret
han
oner
iskfa
ctori
nth
epre
dicti
on
mod
elsim
ultan
eous
ly,
-had
theo
utco
mea
sbre
astc
ance
rvsn
onb
reas
tcan
cer,
-app
lied
anyr
egre
ssio
neq
uatio
n(Lo
gisti
c,Po
isson
or
Cox)
to b
uild
up
pred
ictio
n m
odel,
-r
epor
tedea
chm
odel
‘spe
rform
ance
(E/O
ratio
or
c-sta
tistic
).
Them
ethod
pre
dicti
veab
ility,
calib
ratio
nan
ddi
scrim
inati
onw
eree
xtrac
ted,u
sing
E/O
ratio
and
ROC
analy
siso
rthe
conc
orda
nces
tatist
icre
spec
tively
.
MED
LINE
(Pub
Med
)fro
m1
949
and
EMBA
SE(O
vid)
were
sear
ched
from
197
4un
tilO
ctobe
r201
0.
II-2
Pape
rsin
clude
din
this
syste
mati
cre
view
=25
•De
velo
pmen
t/Mod
ifica
tion
of
prev
ious
pre
dicti
onm
odel
=18
•Va
lidati
ono
fexis
ting
pred
ictio
nm
odels
=7
--
-St
udy
desc
riptio
n;
Amon
gth
e18
studi
esd
evelo
ping
/mod
ifyin
gm
odels
;•
Stud
ysam
ple:
from
550
to2
,404
,636
•Ou
tcom
e-
Pre
dicti
ngo
vera
llin
vasiv
ebre
astc
ance
r
(13
stu
dies
)-
Bo
thn
on-in
vasiv
e(ca
rcin
omai
nsit
u)an
d
inva
siveb
reas
tcan
cer(
five
studi
es)
-
Estim
ating
ther
isko
fdev
elopi
nges
troge
n-t
ypes
pecifi
cbre
astc
ance
r(tw
ostu
dies
)•
Data
used
- fro
mg
ener
alwo
men
(i.e.
,pre
-and
pos
t-men
opau
sal
(mos
t)-
base
don
pos
tmen
opau
sald
atao
nly(
two
studi
es)
•Va
lidati
onsp
erfo
rmed
:-
Inter
nalv
alida
tion
-4st
udies
(Boy
leP
2004
,Chl
ebow
skiR
T20
07,B
arlo
wW
E20
06,T
iceJA
200
4)-
Exter
nalv
alida
tion
–5
mod
els(G
ail,C
ARE,
mod
ified
Gail
,Ros
ner&
Co
lditz
,and
mod
ified
Ros
ner&
Col
ditz)
•Va
riabl
es/ri
skfa
ctors
inclu
ded
:-
From
5to
13
varia
bles
(age
,age
atm
enar
che,
age
atfir
stliv
ebi
rth,
family
hist
oryo
fbre
astc
ance
r,num
bers
ofp
revio
usb
reas
tbio
psy,
histo
ry
ofat
ypica
lhyp
erpl
asia,
bre
astd
ensit
y,ni
pple
aspi
rate
fluid
cyto
logy
,rac
e,fam
ilyh
istor
yof
any
can
cer,
histo
ryo
fbre
asti
nflam
mati
on,b
ody
mas
sin
dex,
parit
y,ag
eat
subs
eque
ntb
irth,
age
atm
enop
ause
,ben
ign
brea
stdi
seas
e,ho
rmon
erep
lacem
entt
hera
py,a
lcoho
l,se
rum
estra
diol
)
Mod
el p
erfo
rman
ce:
Disc
rimin
ation
:-
Med
ianc
-stat
istic
=0.
63(0
.53-
0.66
)in
sett
ings
whe
rem
odels
wer
ede
velo
ped;
- M
edian
c-sta
tistic
=0
.59(
0.56
-0.6
3)in
setti
ngsw
here
mod
elsad
opted
.
Auth
orco
nclu
sion:
M
ostm
odels
yiel
ded
relat
ively
poor
disc
rimin
ation
inb
oth
inter
nala
nde
xtern
alva
lidati
on.
Ther
eis
still
ane
edto
dev
elop
are
liabl
eris
kpr
edict
ion
mod
elfo
rbr
east
canc
erin
futu
re.
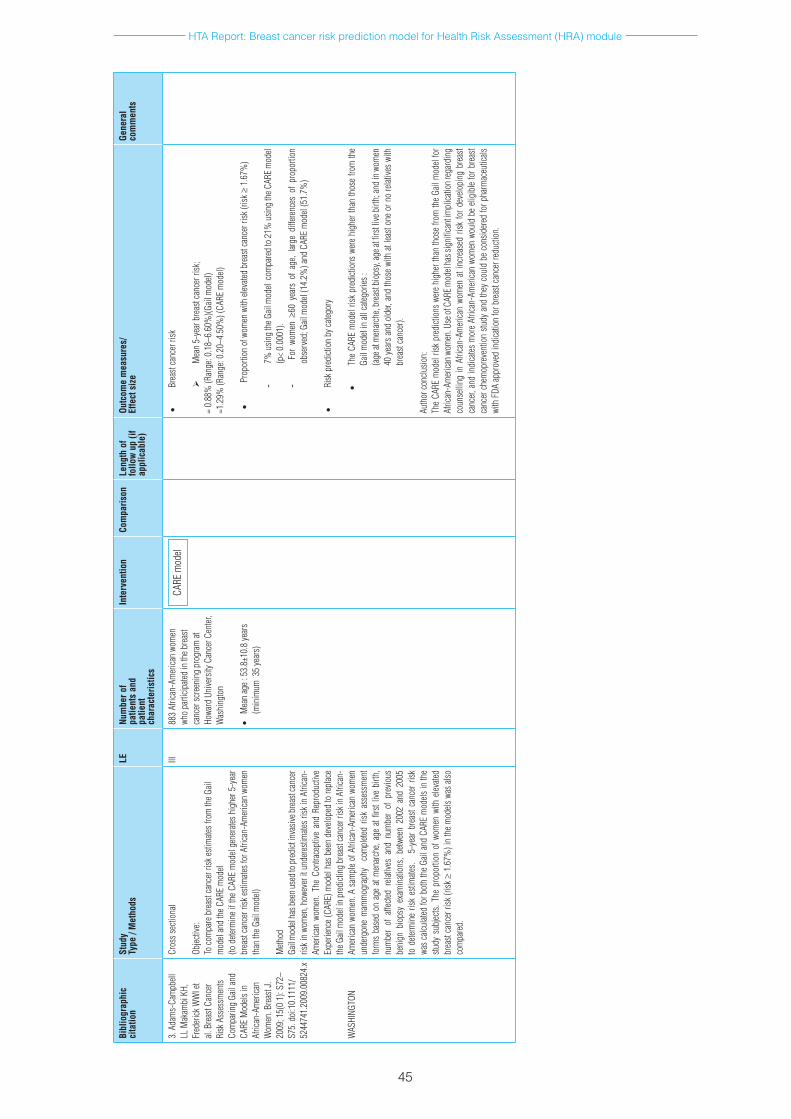
HTA Report: Breast cancer risk prediction model for Health Risk Assessment (HRA) module
45
Bibl
iogr
aphi
cci
tatio
nSt
udy
Type
/ M
etho
dsLE
Num
ber o
f pa
tient
s an
dpa
tient
ch
arac
teris
tics
Inte
rven
tion
Com
paris
onLe
ngth
of
follo
w u
p (if
ap
plic
able
)
Outc
ome
mea
sure
s/
Effe
ct s
ize
Gene
ral
com
men
ts
3.A
dam
s-Ca
mpb
ell
LLM
akam
biK
H,
Fred
erick
WW
Iet
al.B
reas
tCan
cer
Risk
Ass
essm
ents
Com
parin
gGa
ilan
dCA
REM
odels
in
Afric
an-A
mer
ican
Wom
en.B
reas
tJ.
2009
;15(
01)
:S72
–S7
5.d
oi:1
0.11
11/
5244
741.
2009
.008
24.x
WAS
HING
TON
Cros
ssec
tiona
l
Objec
tive:
Toco
mpa
reb
reas
tcan
cerr
iskes
timate
sfro
mth
eGail
mod
elan
dth
eCAR
Em
odel
(tod
eterm
ine
ifth
eCA
REm
odel
gene
rates
hig
her5
-yea
rbr
east
canc
erri
skes
timate
sfor
Afri
can-
Amer
ican
wom
en
than
the G
ail m
odel)
Meth
odGa
ilmod
elha
sbee
nuse
dtop
redi
ctin
vasiv
ebre
astc
ance
rris
kin
wom
en,h
owev
erit
und
eres
timate
srisk
inA
frica
n-Am
erica
nwo
men
.The
Con
trace
ptive
and
Rep
rodu
ctive
Ex
perie
nce
(CAR
E)m
odel
has
been
dev
elope
dto
repl
ace
theG
ailm
odel
inp
redi
cting
bre
astc
ance
rrisk
inA
frica
n-Am
erica
nwo
men
.As
ampl
eof
Afri
can-
Amer
ican
wom
en
unde
rgon
em
amm
ogra
phy
com
plete
dris
kas
sess
men
tfo
rms
base
don
age
atm
enar
che,
age
atfir
stliv
ebi
rth,
num
ber
ofa
ffecte
dre
lative
san
dnu
mbe
rof
pre
vious
be
nign
bio
psy
exam
inati
ons,
betw
een
2002
and
200
5to
dete
rmin
eris
kes
timate
s.
5-ye
arb
reas
tcan
cerr
isk
was
calcu
lated
forb
oth
the
Gail
and
CARE
mod
elsin
the
study
sub
jects.
The
pro
porti
ono
fwom
enw
ithe
levate
dbr
east
canc
erri
sk(r
isk≥
1.6
7%)i
nth
em
odels
was
also
co
mpa
red.
III88
3Af
rican
-Am
erica
nwo
men
wh
opa
rticip
ated
inth
ebre
ast
canc
ersc
reen
ing
prog
ram
at
Howa
rdU
nive
rsity
Can
cerC
enter
,W
ashi
ngto
n
•M
ean
age:
53.
8±10
.8ye
ars
(min
imum
35
year
s)
•Br
east
canc
erri
sk
Mea
n5-
year
bre
astc
ance
rrisk
;=
0.88
%(R
ange
:0.1
8–6.
60%
)(Gail
mod
el)
=1.2
9%(R
ange
:0.2
0–4.
50%
)(CA
REm
odel)
•P
ropo
rtion
ofw
omen
with
elev
ated
brea
stca
ncer
risk
(risk
≥1
.67%
)
- 7%
usin
gth
eGail
mod
elco
mpa
red
to2
1%u
sing
theC
ARE
mod
el(p
<0.
0001
).-
For
wom
en ≥
60y
ears
of
age,
large
diff
eren
ces
ofp
ropo
rtion
ob
serv
ed;G
ailm
odel
(14.
2%)a
ndC
ARE
mod
el(5
1.7%
)
•Ri
skp
redi
ction
byc
atego
ry
•Th
eCA
REm
odel
risk
pred
ictio
nsw
ere
high
erth
anth
ose
from
the
Gail
mod
elin
allc
atego
ries:
(age
atm
enar
che,
brea
stbi
opsy
,age
atfi
rstl
iveb
irth;
and
inw
omen
40
yea
rsa
ndo
lder,
and
thos
ewi
tha
tlea
ston
eor
no
relat
ives
with
br
east
canc
er).
Auth
orco
nclu
sion:
The
CARE
mod
elris
kpr
edict
ions
wer
ehi
gher
than
thos
efro
mth
eGa
ilm
odel
for
Afric
an-A
mer
icanw
omen
.Use
ofC
AREm
odel
hass
igni
fican
timpl
icatio
nreg
ardi
ng
coun
selli
ngin
Afri
can-
Amer
ican
wom
ena
tinc
reas
edr
iskfo
rde
velo
ping
bre
ast
canc
er,a
ndin
dica
tesm
ore
Afric
an-A
mer
ican
wom
enw
ould
be
eligi
ble
forb
reas
tca
ncer
che
mop
reve
ntio
nstu
dya
ndth
eyc
ould
be
cons
ider
edfo
rpha
rmac
eutic
als
with
FDA
appr
oved
indi
catio
nfo
rbre
astc
ance
rred
uctio
n.
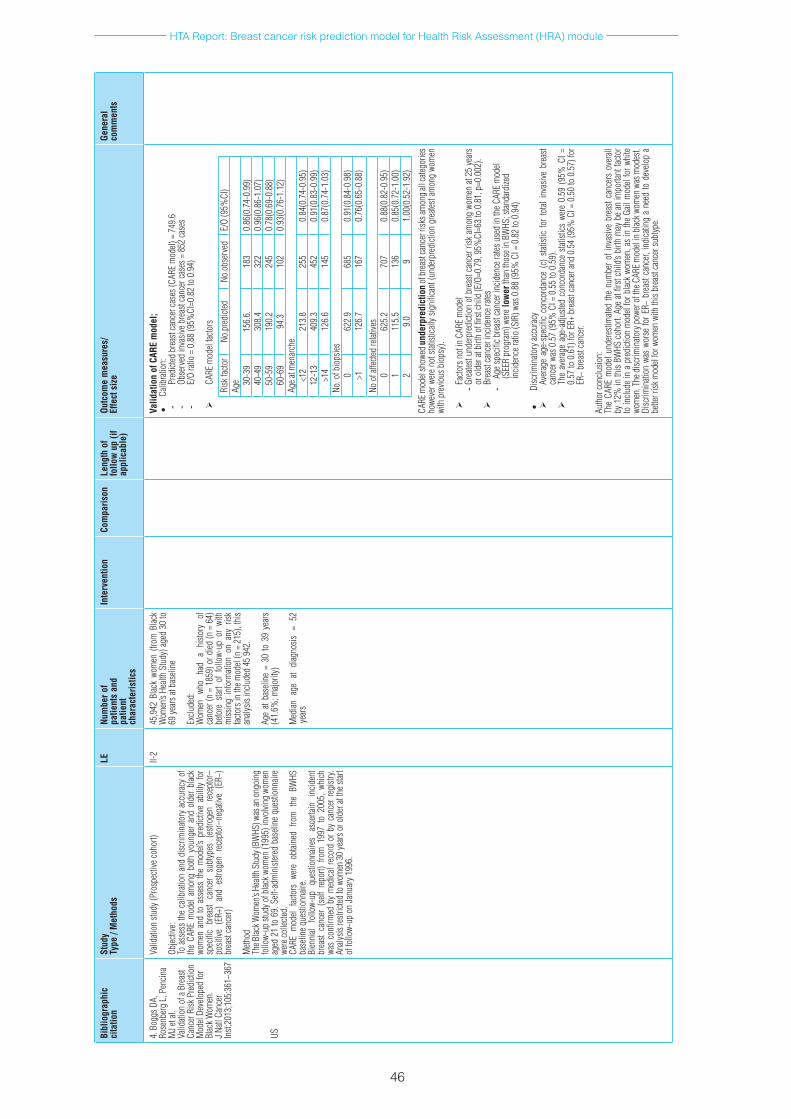
HTA Report: Breast cancer risk prediction model for Health Risk Assessment (HRA) module
46
Bibl
iogr
aphi
cci
tatio
nSt
udy
Type
/ M
etho
dsLE
Num
ber o
f pa
tient
s an
dpa
tient
ch
arac
teris
tics
Inte
rven
tion
Com
paris
onLe
ngth
of
follo
w u
p (if
ap
plic
able
)
Outc
ome
mea
sure
s/
Effe
ct s
ize
Gene
ral
com
men
ts
4.B
oggs
DA,
Ro
senb
erg
L,P
encin
aM
Jeta
l.Va
lidati
ono
faB
reas
tCa
ncer
Risk
Pre
dicti
on
Mod
elDe
velo
ped
for
Blac
kWom
en.
JNatl
Can
cer
Inst;
2013
;105
:361
–367
US
Valid
ation
stud
y(Pr
ospe
ctive
coho
rt)
Objec
tive:
Toa
sses
sth
eca
libra
tion
and
disc
rimin
atory
acc
urac
yof
th
eCA
REm
odel
amon
gbo
thy
oung
era
ndo
lder
blac
kwo
men
and
toa
sses
sth
em
odel’
spr
edict
ivea
bilit
yfo
rsp
ecifi
cbr
east
canc
ers
ubtyp
es(
estro
gen
rece
ptor
–po
sitive
(ER
+)a
nde
strog
enr
ecep
tor–
nega
tive
(ER−
)br
east
canc
er)
Meth
odTh
eBlac
kWom
en’s
Healt
hStu
dy(B
WHS
)was
anon
goin
gfo
llow-
upst
udyo
fblac
kwom
en(1
995)
invo
lving
wom
en
aged
21
to6
9.S
elf-a
dmin
ister
edb
aseli
neq
uesti
onna
ire
were
colle
cted.
CA
REm
odel
facto
rsw
ere
obtai
ned
from
the
BW
HS
base
lineq
uesti
onna
ire.
Bien
nial
follo
w-up
qu
estio
nnair
es
asce
rtain
in
ciden
tbr
east
canc
er(
self
repo
rt)f
rom
199
7to
200
5,w
hich
wa
sco
nfirm
edb
ym
edica
lrec
ord
orb
yca
ncer
regi
stry.
Analy
sisre
strict
edto
wom
en3
0ye
arso
rold
erat
thes
tart
offo
llow-
upo
nJa
nuar
y199
6.
II-2
45,9
42B
lack
wom
en(
from
Blac
kW
omen
’sHe
alth
Stud
y)a
ged
30to
69
year
satb
aseli
ne
Exclu
ded:
W
omen
wh
oha
da
histo
ry
of
canc
er(n
=1
859)
ord
ied(n
=6
4)
befo
res
tart
off
ollo
w-up
or
with
m
issin
gin
form
ation
on
any
risk
facto
rsin
them
odel
(n=
215
),th
isan
alysis
inclu
ded
459
42.
Age
atba
selin
e=
30to
39
year
s(4
1.6%
;majo
rity)
Med
iana
gea
tdi
agno
sis=
52
year
s
Valid
atio
n of
CAR
E m
odel
;•
Calib
ratio
n:-
Pred
icted
bre
astc
ance
rcas
es(C
ARE
mod
el)=
749
.6-
Obse
rved
inva
siveb
reas
tcan
cerc
ases
=8
52ca
ses
- E/
Ora
tio=
0.8
8(9
5%CI
=0.8
2to
0.9
4)
CARE
mod
elfac
tors
Risk
facto
rNo
.pre
dicte
dNo
.obs
erve
dE/
O(9
5%CI
)Ag
e 30-3
915
6.6.
183
0.86
(0.7
4-0.
99)
40-4
930
8.4
322
0.96
(0.8
6-1.
07)
50-5
919
0.2
245
0.78
(0.6
9-0.
88)
60-6
994
.310
20.
93(0
.76-
1.12
)Ag
eatm
enar
che
<12
213.
825
50.
84(0
.74-
0.95
)12
-13
409.
345
20.
91(0
.83-
0.99
)>1
412
6.6
145
0.87
(0.7
4-1.
03)
No.o
fbio
psies
062
2.9
685
0.91
(0.8
4-0.
98)
>112
6.7
167
0.76
(0.6
5-0.
88)
Noo
faffe
cted
relat
ives
062
5.2
707
0.88
(0.8
2-0.
95)
111
5.5
136
0.85
(0.7
2-1.
00)
29.
09
1.00
(0.5
2-1.
92)
CARE
mod
elsh
owed
und
erpr
edic
tion
ofbr
east
canc
erri
sksa
mon
gallc
atego
ries
howe
verw
ere
nots
tatist
ically
sig
nific
ant(
unde
rpre
dicti
ong
reate
stam
ong
wom
en
with
pre
vious
bio
psy)
.
Facto
rsn
otin
CAR
Em
odel
- Gre
atest
unde
rpre
dicti
ono
fbre
astc
ance
rrisk
am
ong
wom
ena
t25
year
sor
old
erat
birt
hof
firs
tchi
ld(E
/O=0
.79,
95%
CI=6
3to
0.8
1,p
=0.0
02).
Brea
stca
ncer
incid
ence
rates
- Ag
espe
cificb
reas
tcan
ceri
ncid
ence
rates
use
din
theC
ARE
mod
el(S
EER
prog
ram
)wer
e lo
wer
than
thos
ein
BWHS
;stan
dard
ized
incid
ence
ratio
(SIR
)was
0.8
8(9
5%C
I=0
.82
to0
.94)
•Di
scrim
inato
ryac
cura
cy
Aver
age
age-
spec
ific
conc
orda
nce
(c)
statis
ticfo
rto
talin
vasiv
ebr
east
canc
erw
as0
.57
(95%
CI=
0.5
5to
0.5
9).
The
aver
age
age-
adju
sted
conc
orda
nce
statis
tics
were
0.5
9(9
5%C
I=
0.57
to0
.61)
forE
R+b
reas
tcan
cera
nd0
.54
(95%
CI=
0.5
0to
0.5
7)fo
rER
−br
east
canc
er.
Auth
orco
nclu
sion:
The
CARE
mod
elun
dere
stim
ated
the
num
bero
finv
asive
bre
astc
ance
rso
vera
llby
12%
inth
isBW
HSc
ohor
t.Ag
eat
first
child
’sbi
rthm
ayb
ean
impo
rtant
facto
rto
inclu
dein
ap
redi
ction
mod
elfo
rblac
kwo
men
,as
inth
eGa
ilm
odel
forw
hite
wom
en.T
hed
iscrim
inato
ryp
ower
oft
heC
ARE
mod
elin
blac
kwom
enw
asm
odes
t.Di
scrim
inati
onw
asw
orse
forE
R−b
reas
tcan
cer,
indi
catin
ga
need
tod
evelo
pa
bette
rrisk
mod
elfo
rwom
enw
ithth
isbr
east
canc
ersu
btyp
e.

HTA Report: Breast cancer risk prediction model for Health Risk Assessment (HRA) module
47
Bibl
iogr
aphi
cci
tatio
nSt
udy
Type
/ M
etho
dsLE
Num
ber o
f pa
tient
s an
dpa
tient
ch
arac
teris
tics
Inte
rven
tion
Com
paris
onLe
ngth
of
follo
w u
p (if
ap
plic
able
)
Outc
ome
mea
sure
s/
Effe
ct s
ize
Gene
ral
com
men
ts
5.P
etrac
ciE,
Dec
arli
A,
Scha
irerC
,eta
l.Ri
sk
Facto
rMod
ifica
tion
and
Proj
ectio
nso
fAb
solu
teBr
east
Canc
erR
isk.J
Na
tlCa
ncer
Inst
2011
;103
:1–1
2
ITALY
Coho
rt
Objec
tive:
Toes
timate
thee
ffects
ofc
hang
esin
mod
ifiab
leris
kfac
tors
on
thea
bsol
uter
isko
fbre
astc
ance
r.
Meth
odA
mod
elwa
sde
velo
ped
top
redi
ctth
eab
solu
teris
kof
br
east
canc
eru
sing
data
from
am
ultic
entre
cas
e–co
ntro
lstu
dyo
fwom
enin
Italy
(25
69c
ase
patie
nts
and
2588
co
ntro
lsub
jects
studi
edfr
omJ
une
1,1
991,
toA
pril
1,
1994
invo
lving
six
regi
ons)
and
incid
ence
and
mor
tality
da
tafro
mt
heF
lore
nce
Regi
stries
.Da
tafro
mt
hec
ase
cont
rols
tudy
wer
eus
edto
sele
ctth
eno
n-m
odifi
able
and
mod
ifiab
leris
kfac
tors
and
toe
stim
ateth
ere
lative
risk
s.Th
em
odel
inclu
ded
five
non-
mod
ifiab
le r
isk
fact
ors
(repr
oduc
tive
char
acter
istics
,ed
ucati
on,
occu
patio
nal
activ
ity,
family
hist
ory,
and
biop
syh
istor
y)a
ndt
hree
m
odifi
able
risk
facto
rs(
alcoh
olc
onsu
mpt
ion,
leis
ure
phys
icala
ctivit
y,an
dbo
dym
assi
ndex
).
Them
odel
wasv
alida
tedu
sing
inde
pend
entd
atafr
omth
eIta
lian
coho
rt,F
lore
nce-
EPIC
coh
orts
tudy
from
199
8to
20
04.
II-2
Mod
elde
velo
pmen
t:Ca
se–c
ontro
lstu
dyin
clude
d25
69
case
s(fem
alep
atien
tswi
thb
reas
tca
ncer,
age
d23
to
74y
ears
,m
edian
age:
55ye
ars)
;
cont
rols
ubjec
ts(n
=2
588)
wer
ewo
men
age
d20
to
74y
ears
(m
edian
age
:56
yea
rs)
with
out
brea
stca
ncer
Mod
elva
lidati
on:
TheF
lore
nce-
EPIC
coho
rtin
clude
d10
,083
wom
enag
ed3
5–64
year
s.
--
-Fi
nal r
elat
ive
risk
mod
el:
Fina
lrela
tiver
iskm
odel:
Valid
atio
n•
Calib
ratio
n:
Over
all:
Pre
dicte
dbr
east
canc
erc
ases
=2
25.7
Obse
rved
inva
sive
brea
stca
ncer
cas
es
=20
6
E/
Ora
tio=
1.1
0(9
5%C
I=0
.96
to1
.26,
p=0
..19
)
Othe
rvar
iables
:
T
hem
odel
show
edo
ver-p
redi
ction
ofb
reas
tcan
cerr
isks
forw
omen
age
d60
ye
arso
rmor
e,wo
men
aged
30
orm
orea
tfirs
tlive
birt
h,an
dwo
men
with
12
year
sorm
oreo
fedu
catio
n.
•Di
scrim
inati
onC
onco
rdan
ce(c
)-stat
istic
=0.
62(9
5%C
I=0
.55
to0
.69)
forw
omen
youn
ger
than
50
year
s(
c)-s
tatist
ic=
0.57
(95%
CI=
0.5
2to
0.6
1)fo
rwom
ena
ged
50y
ears
and
ol
der
Abso
lute
risk
redu
ctio
n
Mea
nab
solu
teris
kre
ducti
ons
(ARR
)=0
.6%
(95%
CI=
0.3
to1
.0%
)and
1.
4%(9
5%C
I=0
.7to
2.0
%)f
or4
5-ye
ar-o
ldw
omen
(fo
r10
and
20ye
ars
proj
ectio
n)
ARR
=0.9
%(9
5%C
I=0
.5%
to1
.3%
)and
1.6
%(9
5%C
I=0
.9%
to2
.3%
)fo
r65-
year
-old
wom
en(f
or1
0an
d20
year
spro
jectio
n)
Estim
ated
mea
nab
solu
teris
ksa
ndm
ean
abso
lute
risk
redu
ction
s w
ere
larg
er in
wom
en w
ith a
fam
ily h
isto
ry o
f bre
ast c
ance
r
ARR
=1.
3%(9
5%C
I=0
.7to
2.1
%)a
nd2
.7%
(95%
CI=
1.4
to4
.2%
)for
45
-yea
r-old
wom
en(1
0an
d20
year
spro
jectio
n)
ARR
=1.9
%(9
5%C
I=1
.1%
to2
.9%
)and
3.2
%(9
5%C
I=1
.8%
to4
.8%
)fo
r65-
year
-old
wom
en(1
0an
d20
year
spro
jectio
n)
Auth
orco
nclu
sion:
The
new
abso
lute
risk
pred
ictio
nm
odel
for
inva
sive
brea
stca
ncer
was
well
ca
libra
tedo
vera
llbu
tove
resti
mate
dth
eab
solu
teris
kof
bre
astc
ance
rin
som
esu
bgro
ups
such
as
wom
ena
ged
60y
ears
oro
lder,
and
wom
enw
hose
firs
tlive
bi
rtho
ccur
red
atag
e30
year
sorl
ater.
Thed
iscrim
inato
ryac
cura
cyw
asm
odes
t.Th
eab
solu
teris
kre
ducti
on
inclu
ding
ex
posu
re
mod
ifica
tions
wa
sne
arly
prop
ortio
nalt
oth
erisk
with
outi
nclu
ding
thes
efac
tors
and
incr
ease
dwi
thag
eand
ris
kpro
jectio
ntim
e.Th
ese
data
give
per
spec
tive
onth
epo
tentia
lred
uctio
nsin
abs
olut
ebr
east
canc
er
risk
from
pre
vent
ative
stra
tegies
bas
edo
nlif
estyl
ech
ange
s.Th
em
ethod
sar
eals
ous
efulf
orca
lculat
ing
sam
ples
izesr
equi
red
fort
rials
tote
stlif
estyl
eint
erve
ntio
ns.
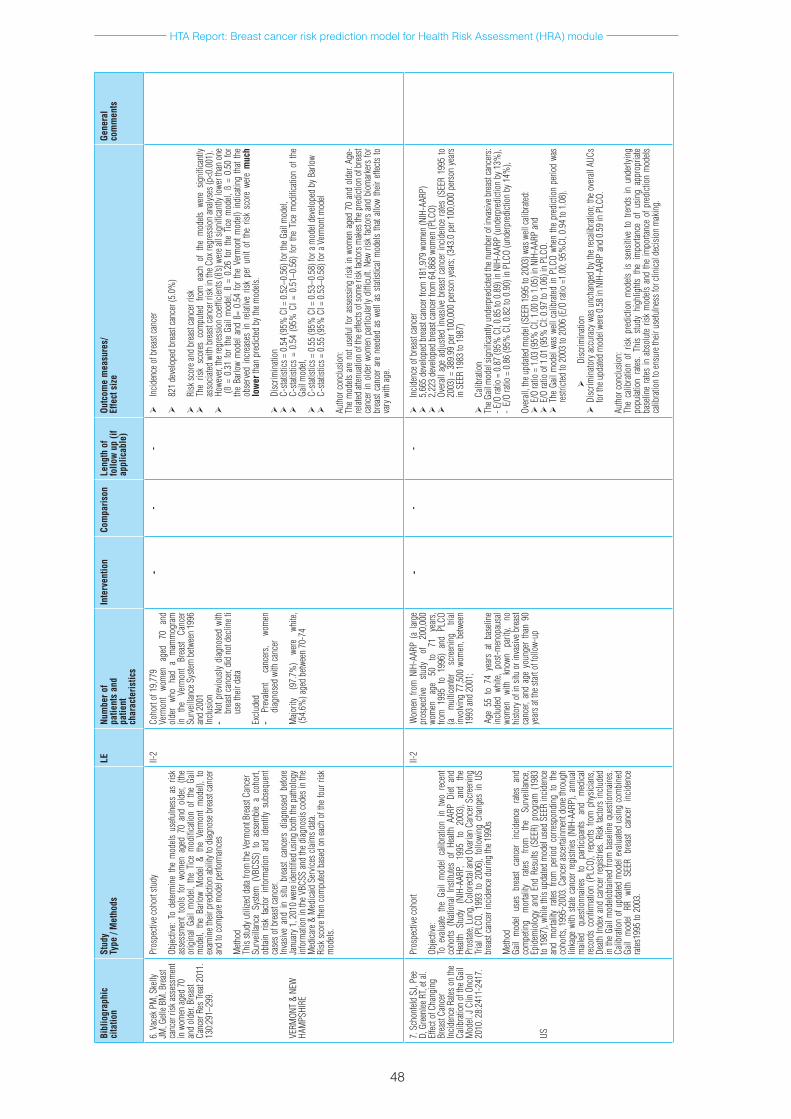
HTA Report: Breast cancer risk prediction model for Health Risk Assessment (HRA) module
48
Bibl
iogr
aphi
cci
tatio
nSt
udy
Type
/ M
etho
dsLE
Num
ber o
f pa
tient
s an
dpa
tient
ch
arac
teris
tics
Inte
rven
tion
Com
paris
onLe
ngth
of
follo
w u
p (if
ap
plic
able
)
Outc
ome
mea
sure
s/
Effe
ct s
ize
Gene
ral
com
men
ts
6.V
acek
PM
,Ske
lly
JM,G
elleB
M.B
reas
tca
ncer
risk
asse
ssm
ent
inw
omen
aged
70
and
olde
r.Br
east
Canc
erR
esTr
eat2
011.
13
0:29
1–29
9.
VERM
ONT
&NE
W
HAM
PSHI
RE
Pros
pecti
veco
hort
study
Objec
tive:
Tod
eterm
ine
the
mod
elsu
sefu
lnes
sas
risk
as
sess
men
tto
ols
for
wom
ena
ged
70a
ndo
lder,
(th
eor
igin
alGa
ilm
odel,
the
Tice
mod
ifica
tion
oft
heG
ail
mod
el, t
he B
arlo
w M
odel
& th
e Ve
rmon
t m
odel)
, to
ex
amin
ethe
irpr
edict
ion
abili
tyto
diag
nose
bre
astc
ance
ran
dto
com
pare
mod
elpe
rform
ance
s
Meth
od
This
study
util
ized
data
from
theV
erm
ontB
reas
tCan
cer
Surv
eillan
ceS
ystem
(VB
CSS)
to
asse
mbl
ea
coho
rt,
obtai
nris
kfac
tor
info
rmati
ona
ndi
dent
ifys
ubse
quen
tca
seso
fbre
astc
ance
r.In
vasiv
ean
din
situ
bre
ast
canc
ers
diag
nose
dbe
fore
Ja
nuar
y1,2
010
were
iden
tified
usin
gbo
thth
epath
olog
yin
form
ation
inth
eVBC
SSan
dth
ediag
nosis
code
sin
the
Med
icare
&M
edica
idS
ervic
escl
aimsd
ata.
Risk
sco
reth
enc
ompu
tedb
ased
on
each
oft
hefo
urri
sk
mod
els.
II-2
Coho
rt of
19,
779
Verm
ont
wom
en
aged
70
an
dol
der
who
had
am
amm
ogra
m
in
the
Verm
ont
Brea
stCa
ncer
Su
rveil
lance
Sys
temb
etwee
n19
96
and
2001
Inclu
sion
- No
tpre
vious
lydi
agno
sed
with
br
east
canc
er,d
idn
otd
eclin
eti
uset
heir
data
Exclu
ded
- Pr
evale
nt
canc
ers,
wom
en
diag
nose
dwi
thca
ncer
Majo
rity
(97.
7%)
were
wh
ite,
(54.
6%)a
ged
betw
een
70-7
4
--
-
Incid
ence
ofb
reas
tcan
cer
821
deve
lope
dbr
east
canc
er(5
.0%
)
Risk
scor
eand
bre
astc
ance
rrisk
The
risk
scor
esc
ompu
tedf
rom
eac
hof
the
mod
elsw
ere
signi
fican
tly
asso
ciated
with
bre
astc
ance
rrisk
inth
eCox
regr
essio
nan
alyse
s(p<
0.00
1).
Howe
ver,
ther
egre
ssio
nco
efficie
nts(
ß’s)w
erea
llsig
nific
antly
lowe
rtha
non
e(
ß=
0.31
for
the
Gail
mod
el,ß
=0
.26
for
the
Tice
mod
el,ß
=0
.50
for
the
Barlo
wm
odel
and
ß=0
.54
for
the
Verm
ontm
odel)
indi
catin
gth
atth
eob
serv
edin
crea
ses
inr
elativ
eris
kpe
run
itof
the
risk
scor
ewe
re m
uch
low
erth
anp
redi
cted
byth
emod
els.
Disc
rimin
ation
C-sta
tistic
s=0
.54
(95%
CI=
0.5
2–0.
56)f
orth
eGail
mod
el,
C-sta
tistic
s=
0.54
(95
%C
I=0
.51–
0.56
)fo
rth
eTi
cem
odifi
catio
nof
the
Gail
mod
el,
C-sta
tistic
s=0
.55
(95%
CI=
0.5
3–0.
58)f
ora
mod
elde
velo
ped
byB
arlo
w
C-sta
tistic
s=0
.55
(95%
CI=
0.5
3–0.
58)f
ora
Verm
ontm
odel
Auth
orco
nclu
sion:
Th
em
odels
are
not
use
fulf
ora
sses
sing
risk
inw
omen
age
d70
and
old
er.A
ge-
relat
edat
tenua
tion
ofth
eeffe
ctso
fsom
erisk
facto
rsm
akes
thep
redi
ction
ofb
reas
tca
ncer
ino
lder
wom
enp
artic
ular
lydi
fficu
lt.N
ewri
skfa
ctors
and
bio
mar
kers
for
brea
stca
ncer
are
nee
ded
asw
ella
ssta
tistic
alm
odels
that
allow
their
effe
ctsto
va
ryw
ithag
e.
7.S
chon
feld
SJ,P
ee
D,G
reen
leeR
T,et
al.
Effec
tofC
hang
ing
Brea
stCa
ncer
In
ciden
ceR
ateso
nth
eCa
libra
tion
of th
e Gail
M
odel.
JCl
inO
ncol
20
10.2
8:24
11-2
417.
US
Pros
pecti
veco
hort
Objec
tive:
Toe
valu
atet
heG
ailm
odel
calib
ratio
nin
two
rec
ent
coho
rts(
Natio
nal
Insti
tutes
of
Healt
hAA
RPD
ieta
nd
Healt
hSt
udy
(NIH
-AAR
P,19
95
to
2003
),an
dth
ePr
ostat
e,Lu
ng,C
olor
ectal
and
Ovar
ianC
ance
rScr
eeni
ng
Trial
(PL
CO,
1993
to
2006
),fo
llowi
ngc
hang
esi
nUS
br
east
canc
erin
ciden
ced
urin
gth
e199
0s
Meth
odGa
ilm
odel
uses
bre
ast
canc
eri
ncid
ence
rate
san
dco
mpe
ting
mor
tality
ra
tes
from
th
eSu
rveil
lance
,Ep
idem
iolo
gya
ndE
ndR
esul
ts(S
EER)
pro
gram
(19
83
to1
987)
,whi
leth
isup
dated
mod
elus
edS
EER
incid
ence
an
dm
ortal
ityr
ates
from
per
iod
corre
spon
ding
to
the
coho
rts,1
995-
2003
.Can
cera
scer
tainm
entd
onet
hrou
gh
linka
gew
iths
tate
canc
erre
gistr
ies(N
IH-A
ARP)
,ann
ual
ed
ques
tionn
aires
to
pa
rticip
ants
and
med
ical
reco
rds
confi
rmati
on(
PLCO
),re
ports
from
phy
sician
s,De
athIn
dex
and
canc
erre
gistr
ies.R
iskfa
ctors
inclu
ded
inth
eGa
ilm
odelo
btain
edfr
omb
aseli
neq
uesti
onna
ires.
Calib
ratio
nof
upd
ated
mod
elev
aluate
dus
ing
com
bine
dGa
ilm
odel
RRw
ithS
EER
brea
stca
ncer
inc
iden
ce
rates
1995
to2
003.
II-2
Wom
enf
rom
NIH
-AAR
P(a
lar
ge
pros
pecti
ve
study
of
20
0,00
0wo
men
ag
e50
to
71
ye
ars,
from
199
5to
199
6)a
ndP
LCO
(a
mul
ticen
ter
scre
enin
gtri
alin
volvi
ng7
7,50
0wo
men
,betw
een
1993
and
2001
;
Age
55t
o74
yea
rsa
tba
selin
ein
clude
dwh
ite,
post-
men
opau
sal
wom
en
with
kn
own
parit
y, no
hi
story
ofi
nsit
uor
inva
siveb
reas
tca
ncer,
and
age
you
nger
than
90
year
satt
hest
arto
ffol
low-
up
--
-
Incid
ence
ofb
reas
tcan
cer
5,66
5de
velo
ped
brea
stca
ncer
from
181
,979
wom
en(N
IH-A
ARP)
2,22
3de
velo
ped
brea
stca
ncer
from
64,
868
wom
en(P
LCO)
Over
alla
gea
djus
tedin
vasiv
ebr
east
canc
erin
ciden
cera
tes(S
EER
1995
to
2003
)=3
89.9
9pe
r100
,000
per
son
year
s;(3
43.0
per
100
,000
per
son
year
sin
SEE
R 19
83 to
198
7)
Calib
ratio
nTh
eGail
mod
elsig
nific
antly
und
erpr
edict
edth
enum
bero
finv
asive
bre
astc
ance
rs:
-E/O
ratio
=0
.87
(95%
CI,
0.85
to0
.89)
inN
IH-A
ARP
(und
erpr
edict
ion
by1
3%),
-E/
Ora
tio=
0.8
6(9
5%C
I,0.
82to
0.9
0)in
PLC
O(u
nder
pred
ictio
nby
14%
),
Over
all,t
heu
pdate
dm
odel
(SEE
R19
95to
200
3)w
asw
ellca
libra
ted:
E
/Ora
tio=
1.0
3(9
5%C
I,1.
00to
1.0
5)in
NIH
-AAR
Pan
dE
/Ora
tioo
f1.0
1(9
5%C
I:0.
97to
1.0
6)in
PLC
O.
T
heG
ailm
odel
was
well
calib
rated
inP
LCO
when
the
pred
ictio
npe
riod
was
restr
icted
to2
003
to2
006
(E/O
ratio
=1.
00;9
5%CI
,0.9
4to
1.0
8).
Disc
rimin
ation
D
iscrim
inato
rya
ccur
acy
was
unch
ange
dby
the
reca
libra
tion;
the
over
allA
UCs
fort
heu
pdate
dm
odel
were
0.5
8in
NIH
-AAR
Pan
d0.
59in
PLC
O.
Auth
orco
nclu
sion:
The
calib
ratio
nof
risk
pre
dicti
onm
odels
is
sens
itive
to
trend
sin
und
erlyi
ng
popu
latio
nra
tes.
This
study
hig
hlig
hts
the
impo
rtanc
eof
usin
gap
prop
riate
base
line
rates
ina
bsol
ute
risk
mod
elsa
ndth
eim
porta
nce
ofp
redi
ction
mod
els
calib
ratio
nto
ensu
reth
eiru
sefu
lnes
sfor
clin
icald
ecisi
onm
akin
g.
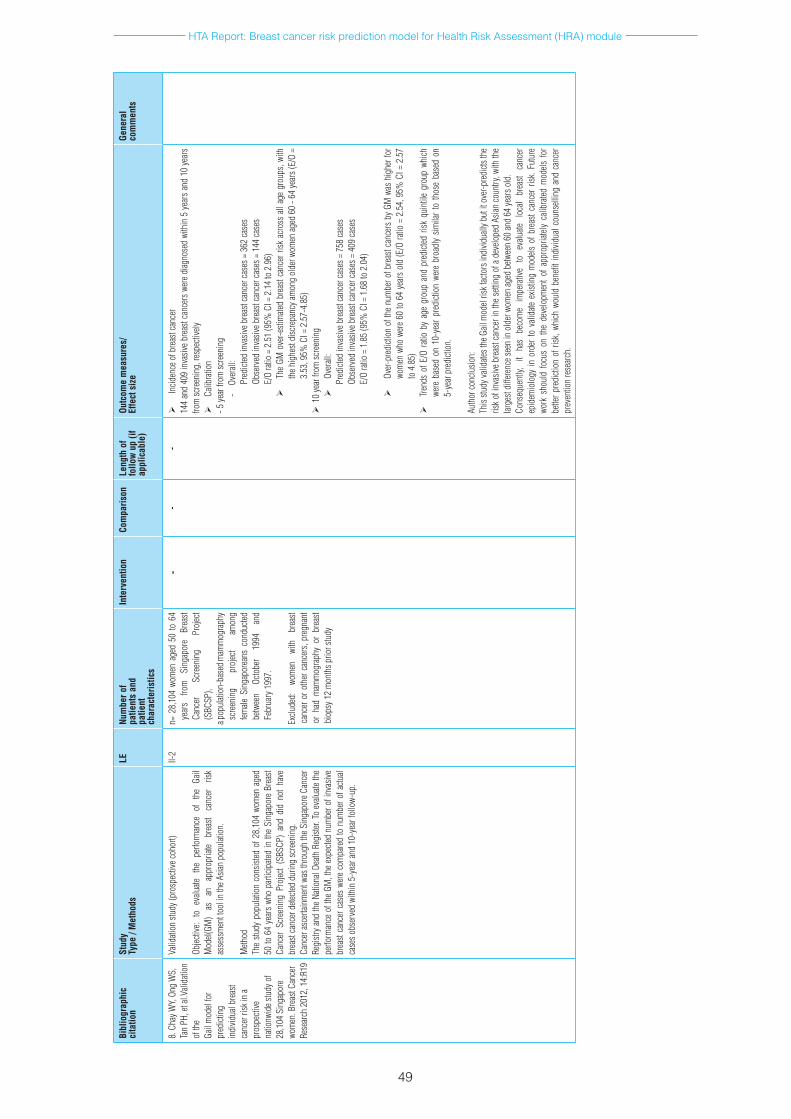
HTA Report: Breast cancer risk prediction model for Health Risk Assessment (HRA) module
49
Bibl
iogr
aphi
cci
tatio
nSt
udy
Type
/ M
etho
dsLE
Num
ber o
f pa
tient
s an
dpa
tient
ch
arac
teris
tics
Inte
rven
tion
Com
paris
onLe
ngth
of
follo
w u
p (if
ap
plic
able
)
Outc
ome
mea
sure
s/
Effe
ct s
ize
Gene
ral
com
men
ts
8.C
hayW
Y,On
gW
S,
Tan
PH,e
tal.V
alida
tion
of th
e Ga
il m
odel
for
pred
ictin
gin
divid
ualb
reas
tca
ncer
risk
ina
pros
pecti
vena
tionw
ides
tudy
of
28,1
04S
inga
pore
wo
men
.Bre
astC
ance
rRe
sear
ch2
012,
14:
R19
Valid
ation
stud
y(pr
ospe
ctive
coho
rt)
Objec
tive:
to
evalu
ate
the
perfo
rman
ce
of
the
Gail
Mod
el(GM
)as
an
ap
prop
riate
brea
stca
ncer
ris
kas
sess
men
ttoo
lin
theA
sian
popu
latio
n.
Meth
od
The
study
pop
ulati
onc
onsis
tedo
f28,
104
wom
ena
ged
50to
64
year
swh
opa
rticip
ated
inth
eSi
ngap
ore
Brea
stCa
ncer
Scr
eeni
ngP
rojec
t(S
BSCP
)an
ddi
dno
tha
ve
brea
stca
ncer
dete
cted
durin
gsc
reen
ing.
Ca
ncer
asc
ertai
nmen
twas
thro
ugh
the
Sing
apor
eCa
ncer
Re
gistr
yan
dth
eNa
tiona
lDea
thR
egist
er.T
oev
aluate
the
perfo
rman
ceo
fthe
GM
,the
exp
ected
num
bero
finv
asive
br
east
canc
erc
ases
wer
eco
mpa
red
ton
umbe
rofa
ctual
case
sobs
erve
dwi
thin
5-y
eara
nd1
0-ye
arfo
llow-
up.
II-2
n=2
8,10
4wo
men
age
d50
to6
4ye
ars
from
Si
ngap
ore
Brea
stCa
ncer
Sc
reen
ing
Proj
ect
(SBC
SP),
apop
ulati
on-b
ased
mam
mog
raph
ysc
reen
ing
proj
ect
amon
gfem
aleS
inga
pore
ans
cond
ucted
be
twee
nOc
tobe
r19
94
and
Febr
uary
199
7.
Exclu
ded:
wo
men
wi
th
brea
stca
ncer
oro
ther
can
cers
,pre
gnan
tor
had
mam
mog
raph
yor
bre
ast
biop
sy1
2m
onth
sprio
rstu
dy
--
-
Incid
ence
ofb
reas
tcan
cer
144
and
409
inva
sive
brea
stca
ncer
swe
red
iagno
sed
with
in5
yea
rsa
nd1
0ye
ars
from
scre
enin
g,re
spec
tively
Calib
ratio
n-5
year
from
scre
enin
g-
Ove
rall:
Pred
icted
inva
siveb
reas
tcan
cerc
ases
=3
62ca
ses
Obse
rved
inva
siveb
reas
tcan
cerc
ases
=1
44ca
ses
E/O
ratio
=2
.51
(95%
CI=
2.1
4to
2.9
6)
The
GMo
ver-e
stim
ated
brea
stca
ncer
risk
acr
oss
alla
geg
roup
s,wi
th
theh
ighe
stdi
scre
panc
yam
ong
olde
rwom
enag
ed6
0-6
4ye
ars(
E/O
=3.
53,9
5%C
I=2
.57-
4.85
)1
0ye
arfr
omsc
reen
ing
Over
all:
Pred
icted
inva
siveb
reas
tcan
cerc
ases
=7
58ca
ses
Obse
rved
inva
siveb
reas
tcan
cerc
ases
=4
09ca
ses
E/O
ratio
=1
.85
(95%
CI=
1.6
8to
2.0
4)
Over
-pre
dicti
ono
fthe
num
bero
fbre
astc
ance
rsb
yGM
was
hig
herf
or
wom
enw
how
ere
60to
64
year
sol
d(E
/Ora
tio=
2.5
4,9
5%C
I=2
.57
to4
.85)
Tren
dso
fE/O
rati
oby
age
gro
upa
ndp
redi
cted
risk
quin
tile
grou
pwh
ich
were
bas
edo
n10
-yea
rpr
edict
ion
were
bro
adly
simila
rto
thos
eba
sed
on
5-ye
arp
redi
ction
.
Auth
orco
nclu
sion:
Th
isstu
dyva
lidate
sthe
Gail
mod
elris
kfac
tors
indi
vidua
llyb
utit
ove
r-pre
dicts
the
risk
ofin
vasiv
ebr
east
canc
erin
the
setti
ngo
fad
evelo
ped
Asian
cou
ntry
,with
the
large
stdi
ffere
nces
een
ino
lder
wom
enag
edb
etwee
n60
and
64ye
arso
ld.
Cons
eque
ntly,
it
has
beco
me
impe
rativ
eto
ev
aluate
lo
cal
brea
stca
ncer
ep
idem
iolo
gyin
ord
erto
vali
date
exist
ing
mod
elso
fbre
astc
ance
rris
k.Fu
ture
wo
rks
houl
dfo
cus
ont
hed
evelo
pmen
tof
app
ropr
iately
cali
brate
dm
odels
for
be
tterp
redi
ction
ofr
isk,w
hich
wou
ldb
enefi
tind
ividu
alco
unse
lling
and
can
cer
prev
entio
nre
sear
ch.
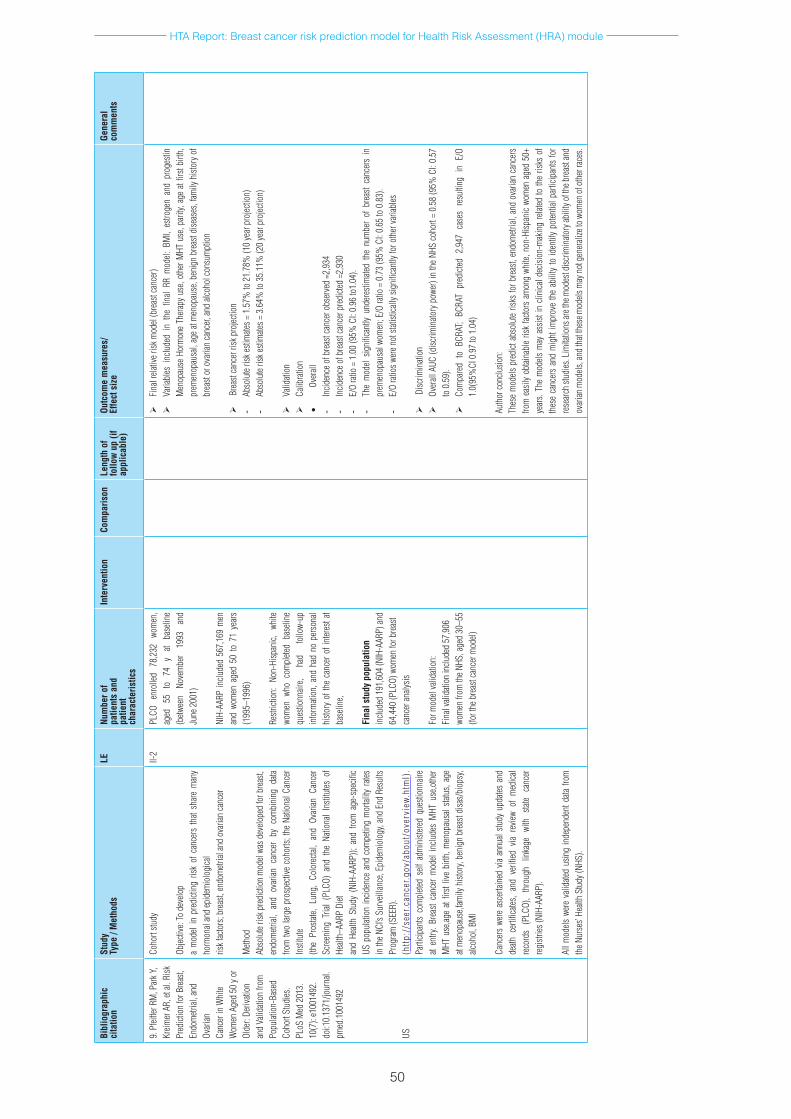
HTA Report: Breast cancer risk prediction model for Health Risk Assessment (HRA) module
50
Bibl
iogr
aphi
cci
tatio
nSt
udy
Type
/ M
etho
dsLE
Num
ber o
f pa
tient
s an
dpa
tient
ch
arac
teris
tics
Inte
rven
tion
Com
paris
onLe
ngth
of
follo
w u
p (if
ap
plic
able
)
Outc
ome
mea
sure
s/
Effe
ct s
ize
Gene
ral
com
men
ts
9.P
feiffe
rRM
,Par
kY,
Kreim
erA
R,et
al.R
isk
Pred
ictio
nfo
rBre
ast,
Endo
metr
ial, a
nd
Ovar
ianCa
ncer
in W
hite
Wom
enA
ged
50y
or
Olde
r:De
rivati
onan
d Va
lidati
on fr
om
Popu
latio
n-Ba
sed
Coho
rtSt
udies
.PL
oSM
ed2
013.
10
(7):
e100
1492
.do
i:10.
1371
/jour
nal.
pmed
.100
1492
US
Coho
rtstu
dy
Objec
tive:
Tod
evelo
pa
mod
elin
pre
dicti
ngr
isko
fcan
cers
that
shar
em
any
horm
onal
and
epid
emio
logi
cal
riskf
acto
rs;b
reas
t,en
dom
etrial
and
ovar
ianca
ncer
Meth
odAb
solu
teris
kpre
dicti
onm
odel
wasd
evelo
ped
forb
reas
t,en
dom
etrial
,an
dov
arian
can
cer
byc
ombi
ning
data
fro
mtw
olar
gep
rosp
ectiv
eco
horts
;the
Nati
onal
Canc
er
Insti
tute
(the
Pros
tate,
Lung
,Co
lore
ctal,
and
Ovar
ianC
ance
rSc
reen
ing
Trial
(PL
CO)
and
the
Natio
nal
Insti
tutes
of
Healt
h–AA
RPD
ietan
dHe
alth
Stud
y(N
IH-A
ARP)
);an
dfro
ma
ge-s
pecifi
cUS
pop
ulati
onin
ciden
cea
ndc
ompe
ting
mor
tality
rates
in
the
NCI’s
Sur
veill
ance
,Epi
dem
iolo
gy,a
ndE
ndR
esul
tsPr
ogra
m(S
EER)
.(h
ttp:
//se
er.c
ance
r.go
v/ab
out/
over
view
.htm
l).
Parti
cipan
tsco
mpl
eted
self
adm
inist
ered
que
stion
naire
at
entry
.Bre
astc
ance
rm
odel
inclu
des
MHT
use
,oth
er
MHT
use
,age
atfir
stliv
ebi
rth,m
enop
ausa
lstat
us,a
ge
atm
enop
ause
,fam
ilyh
istor
y,be
nign
bre
astd
isas/
biop
sy,
alcoh
ol,B
MI
Canc
ers
were
asc
ertai
ned
viaa
nnua
lstu
dyu
pdate
san
dde
athc
ertifi
cates
,an
dve
rified
via
revie
wof
med
ical
reco
rds
(PLC
O),
thro
ugh
linka
ge
with
sta
teca
ncer
re
gistr
ies(N
IH-A
ARP)
.
Allm
odels
wer
eva
lidate
dus
ing
inde
pend
entd
atafr
om
theN
urse
s’He
alth
Stud
y(NH
S).
II-2
PLCO
en
rolle
d78
,232
wo
men
,ag
ed
55
to
74
yat
base
line
(betw
een
Nove
mbe
r19
93
and
June
200
1)
NIH-
AARP
inclu
ded
567,
169
men
an
dwo
men
age
d50
to7
1ye
ars
(199
5–19
96)
Restr
ictio
n:N
on-H
ispan
ic,w
hite
wom
enw
hoc
ompl
eted
base
line
ques
tionn
aire,
had
follo
w-up
in
form
ation
,and
had
no
pers
onal
histo
ryo
fthe
can
cero
fint
eres
tat
base
line,
Fina
l stu
dy p
opul
atio
n in
clude
d19
1,60
4(N
IH-A
ARP)
and
64,4
40(P
LCO)
wom
enfo
rbre
ast
canc
eran
alysis
Form
odel
valid
ation
:Fi
nal v
alida
tion
inclu
ded
57,9
06
wom
enfr
omth
eNHS
,age
d30
–55
(fort
heb
reas
tcan
cerm
odel)
Fina
lrela
tiver
iskm
odel
(bre
astc
ance
r)
Varia
bles
inc
lude
din
the
fina
lRR
mod
el:B
MI,
estro
gen
and
prog
estin
M
enop
ause
Hor
mon
eTh
erap
yus
e,ot
herM
HTu
se,p
arity
,age
atfi
rstb
irth,
pr
emen
opau
sal,
age
atm
enop
ause
,ben
ign
brea
stdi
seas
es,f
amily
hist
ory
of
brea
stor
ova
rian
canc
er,an
dalc
ohol
cons
umpt
ion
Brea
stca
ncer
risk
pro
jectio
n-
Abso
lute
riske
stim
ates=
1.5
7%to
21.
78%
(10
year
pro
jectio
n)-
Abso
lute
riske
stim
ates=
3.6
4%to
35.
11%
(20
year
pro
jectio
n)
Valid
ation
Calib
ratio
n•
Over
all-
Incid
ence
ofb
reas
tcan
cero
bser
ved
=2,9
34-
Incid
ence
ofb
reas
tcan
cerp
redi
cted
=2,9
30-
E/O
ratio
=1
.00
(95%
CI:
0.96
to1.
04).
- Th
em
odel
signi
fican
tlyu
nder
estim
ated
the
num
ber
ofb
reas
tca
ncer
sin
pr
emen
opau
salw
omen
;E/O
ratio
=0
.73
(95%
CI:
0.65
to0
.83)
.-
E/O
ratio
swer
enot
stati
stica
llysi
gnifi
cant
lyfo
roth
erva
riabl
es
Disc
rimin
ation
Over
allA
UC(d
iscrim
inato
ryp
ower
)in
the
NHS
coho
rt=
0.58
(95%
CI:
0.57
to
0.5
9).
Com
pare
dto
BCR
AT;
BCRA
Tpr
edict
ed2
,947
cas
esr
esul
ting
inE
/O
1.0(
95%
CI0
.97
to1
.04)
Auth
orco
nclu
sion:
Thes
em
odels
pre
dict
abso
lute
risks
forb
reas
t,en
dom
etrial
,and
ova
rian
canc
ers
from
eas
ilyo
btain
able
risk
facto
rsa
mon
gwh
ite,n
on-H
ispan
icwo
men
age
d50
+ye
ars.
The
mod
elsm
aya
ssist
inc
linica
ldec
ision
-mak
ing
relat
edto
the
risks
of
thes
eca
ncer
san
dm
ight
impr
ove
the
abili
tyto
iden
tify
poten
tialp
artic
ipan
tsfo
rre
sear
chst
udies
.Lim
itatio
nsar
ethe
mod
estd
iscrim
inato
ryab
ility
ofth
ebre
asta
nd
ovar
ianm
odels
,and
that
thes
emod
elsm
ayn
otg
ener
alize
tow
omen
ofo
ther
race
s.
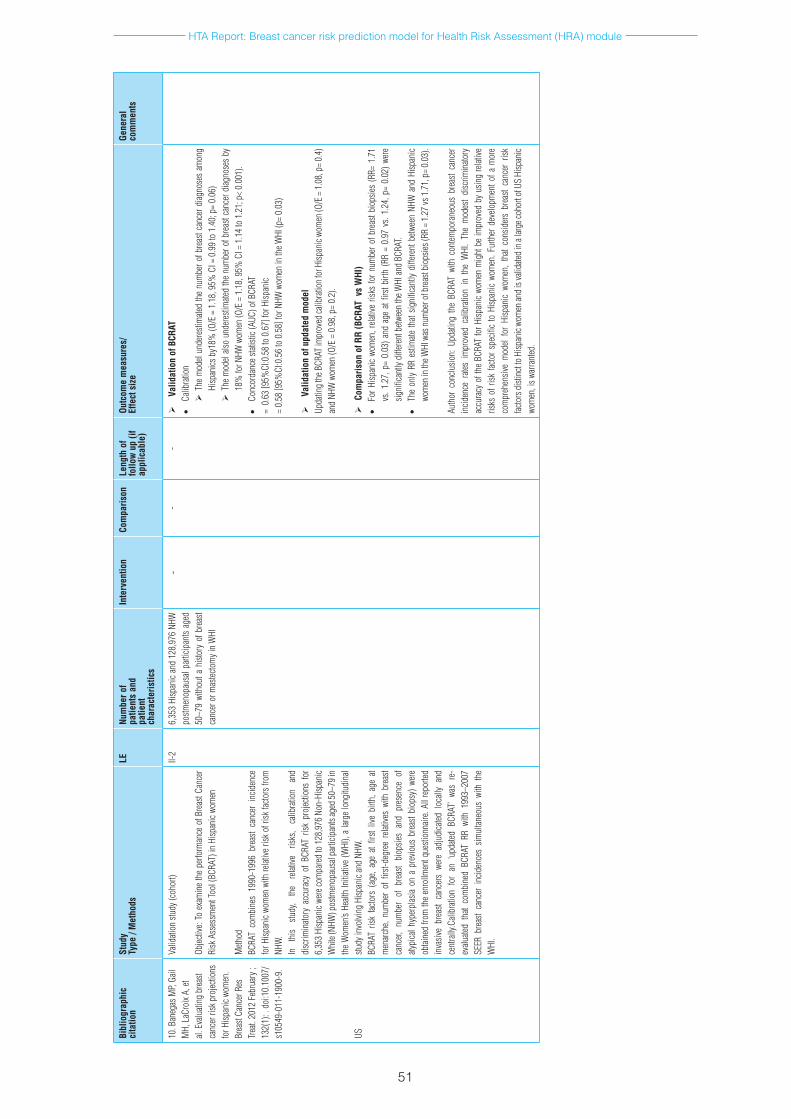
HTA Report: Breast cancer risk prediction model for Health Risk Assessment (HRA) module
51
Bibl
iogr
aphi
cci
tatio
nSt
udy
Type
/ M
etho
dsLE
Num
ber o
f pa
tient
s an
dpa
tient
ch
arac
teris
tics
Inte
rven
tion
Com
paris
onLe
ngth
of
follo
w u
p (if
ap
plic
able
)
Outc
ome
mea
sure
s/
Effe
ct s
ize
Gene
ral
com
men
ts
10.B
aneg
asM
P,Ga
ilM
H,L
aCro
ixA,
et
al.E
valu
ating
bre
ast
canc
erri
skp
rojec
tions
fo
rHisp
anic
wom
en.
Brea
stCa
ncer
Res
Tr
eat.
2012
Feb
ruar
y;
132(
1):.
doi
:10.
1007
/s1
0549
-011
-190
0-9.
US
Valid
ation
stud
y(co
hort)
Objec
tive:
Toe
xam
ine
the
perfo
rman
ceo
fBre
astC
ance
rRi
skA
sses
smen
tToo
l(BC
RAT)
inH
ispan
icwo
men
Meth
odBC
RAT
com
bine
s19
90-1
996
brea
stca
ncer
inc
iden
ce
forH
ispan
icwo
men
with
relat
iveri
sko
frisk
facto
rsfr
om
NHW
.In
th
isstu
dy,
the
relat
ive
risks
,ca
libra
tion
and
disc
rimin
atory
acc
urac
yof
BCR
ATr
iskp
rojec
tions
for
6,
353
Hisp
anic
were
com
pare
dto
128
,976
Non
-Hisp
anic
Whi
te(N
HW)p
ostm
enop
ausa
lpar
ticip
ants
aged
50–7
9in
the
Wom
en’s
Healt
hIn
itiati
ve(W
HI),
alar
gelo
ngitu
dina
lstu
dyin
volvi
ngH
ispan
ican
dNH
W.
BCRA
Tris
kfac
tors
(ag
e,ag
eat
first
live
birth
,age
at
men
arch
e,nu
mbe
rof
firs
t-deg
ree
relat
ives
with
bre
ast
canc
er,n
umbe
rof
bre
ast
biop
sies
and
pres
ence
of
atypi
calh
yper
plas
iaon
ap
revio
usb
reas
tbio
psy)
wer
eob
taine
dfro
mth
een
rollm
entq
uesti
onna
ire.A
llre
porte
din
vasiv
ebr
east
canc
ers
were
adj
udica
tedl
ocall
yan
dce
ntra
lly.C
alibr
ation
for
an
‘upda
tedB
CRAT
’wa
sre
-ev
aluate
dth
atco
mbi
ned
BCRA
TRR
with
199
3–20
07
SEER
bre
ast
canc
eri
ncid
ence
ssim
ultan
eous
with
the
W
HI.
II-2
6,35
3Hi
span
ican
d12
8,97
6NH
W
postm
enop
ausa
lpar
ticip
ants
aged
50
–79
with
outa
hist
ory
ofb
reas
tca
ncer
orm
astec
tom
yin
WHI
--
-
Valid
atio
n of
BCR
AT•
Calib
ratio
n T
hem
odel
unde
resti
mate
dth
enu
mbe
rofb
reas
tcan
cerd
iagno
ses
amon
gHi
span
icsb
y18%
(O/E
=1
.18,
95%
CI=
0.9
9to
1.4
0;p
=0.
06)
T
hem
odel
also
unde
resti
mate
dth
enu
mbe
rofb
reas
tcan
cerd
iagno
ses
by
18%
forN
HWw
omen
(O/E
=1
.18,
95%
CI=
1.1
4to
1.2
1;p
<0.
001)
.•
Conc
orda
nces
tatist
ic(A
UC)o
fBCR
AT=
0.6
3[9
5%CI
:0.5
8to
0.6
7]fo
rHisp
anic
=0.
58[9
5%CI
:0.5
6to
0.5
8]fo
rNHW
wom
enin
theW
HI(p
=0.
03)
Valid
atio
n of
upd
ated
mod
el
Upda
ting
theB
CRAT
impr
oved
calib
ratio
nfo
rHisp
anic
wom
en(O
/E=
1.0
8,p
=0.
4)
and
NHW
wom
en(O
/E=
0.9
8,p
=0.
2).
C
ompa
rison
of R
R (B
CRAT
vs
WHI
)•
ForH
ispan
icwo
men
,rela
tive
risks
forn
umbe
rofb
reas
tbio
psies
(RR=
1.7
1vs
.1.2
7,p
=0.
03)a
nda
gea
tfirs
tbirt
h(R
R=
0.97
vs.
1.24
,p=
0.02
)wer
esig
nific
antly
diff
eren
tbetw
een
theW
HIan
dBC
RAT.
•Th
eon
lyRR
esti
mate
that
signi
fican
tlyd
iffer
entb
etwee
nNH
Wa
ndH
ispan
icwo
men
inth
eWHI
was
num
bero
fbre
astb
iops
ies(R
R=
1.27
vs1
.71,
p=
0.03
).
Auth
orc
onclu
sion:
Upd
ating
the
BCR
ATw
ithc
ontem
pora
neou
sbr
east
canc
er
incid
ence
rate
sim
prov
edc
alibr
ation
in
the
WHI
.Th
em
odes
tdi
scrim
inato
ry
accu
racy
oft
heB
CRAT
forH
ispan
icwo
men
mig
htb
eim
prov
edb
yus
ing
relat
ive
risks
ofr
iskfa
ctors
pecifi
cto
Hisp
anic
wom
en.F
urth
erd
evelo
pmen
tofa
mor
eco
mpr
ehen
sive
mod
elfo
rHi
span
icwo
men
,th
atco
nsid
ers
brea
stca
ncer
risk
fac
tors
dist
inct
toH
ispan
icwo
men
and
isva
lidate
din
alar
geco
hort
ofU
SHi
span
icwo
men
,isw
arra
nted
.
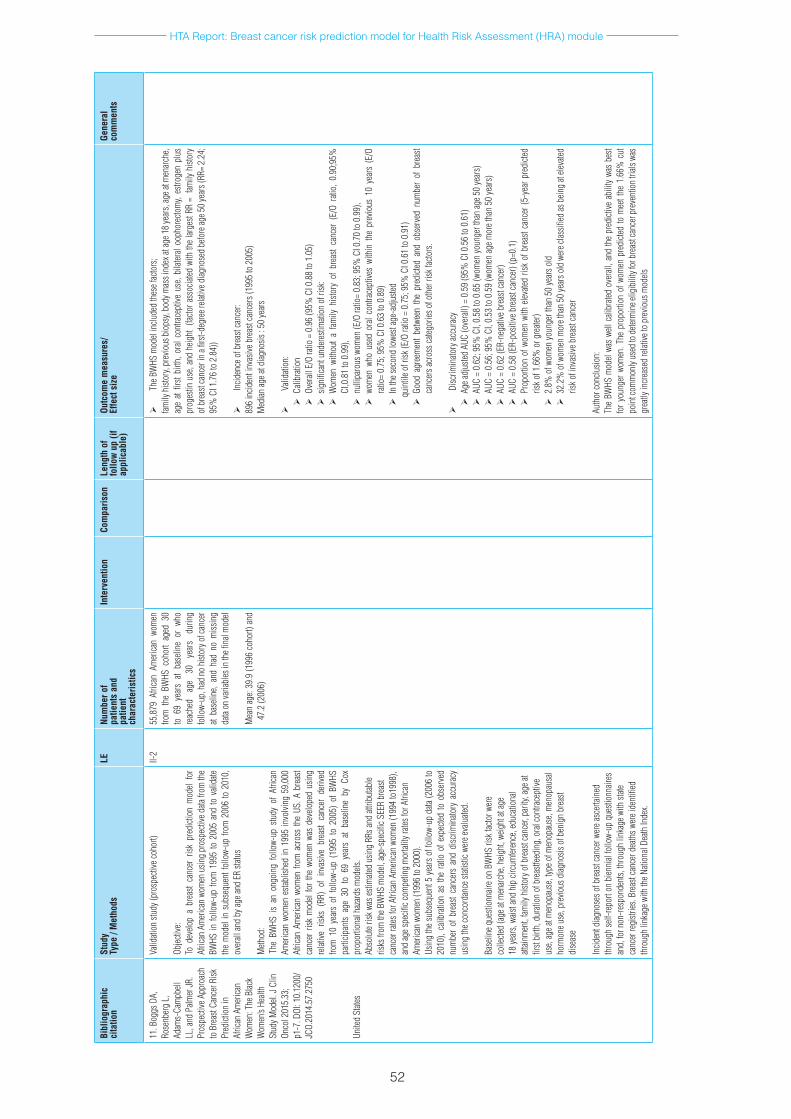
HTA Report: Breast cancer risk prediction model for Health Risk Assessment (HRA) module
52
Bibl
iogr
aphi
cci
tatio
nSt
udy
Type
/ M
etho
dsLE
Num
ber o
f pa
tient
s an
dpa
tient
ch
arac
teris
tics
Inte
rven
tion
Com
paris
onLe
ngth
of
follo
w u
p (if
ap
plic
able
)
Outc
ome
mea
sure
s/
Effe
ct s
ize
Gene
ral
com
men
ts
11.B
oggs
DA,
Ro
senb
erg
L,
Adam
s-Ca
mpb
ell
LL,a
ndP
almer
JR.
Pros
pecti
veA
ppro
ach
toB
reas
tCan
cerR
isk
Pred
ictio
nin
Afric
anA
mer
ican
Wom
en:T
heB
lack
Wom
en’s
Healt
hSt
udyM
odel.
JCl
in
Onco
l201
5.33
;p1
-7.D
OI:1
0.12
00/
JCO.
2014
.57.
2750
Unite
dSt
ates
Valid
ation
stud
y(pr
ospe
ctive
coho
rt)
Objec
tive:
Tod
evelo
pa
brea
stca
ncer
risk
pre
dicti
onm
odel
for
Afric
anA
mer
ican
wom
enu
sing
pros
pecti
ved
atafr
omth
eBW
HSin
follo
w-up
from
199
5to
200
5an
dto
vali
date
the
mod
elin
sub
sequ
entf
ollo
w-up
from
200
6to
201
0,
over
allan
dby
agea
ndE
Rsta
tus
Meth
od:
The
BWHS
is
ano
ngoi
ngf
ollo
w-up
stu
dyo
fAf
rican
Am
erica
nwo
men
esta
blish
edin
199
5in
volvi
ng5
9,00
0Af
rican
Am
erica
nwo
men
from
acr
oss
the
US.A
bre
ast
canc
err
iskm
odel
for
the
wom
enw
asd
evelo
ped
usin
gre
lative
risk
s(R
R)o
fin
vasiv
ebr
east
canc
erd
erive
dfro
m1
0ye
ars
off
ollo
w-up
(19
95t
o20
05)
ofB
WHS
pa
rticip
ants
age
30t
o69
yea
rsa
tba
selin
eby
Cox
pr
opor
tiona
lhaz
ards
mod
els.
Abso
lute
riskw
ases
timate
dus
ing
RRsa
ndat
tribu
table
risks
from
theB
WHS
mod
el,ag
e-sp
ecifi
cSEE
Rbr
east
canc
erra
tesfo
rAfri
can
Amer
ican
wom
en(1
994
to19
98),
and
ages
pecifi
ccom
petin
gm
ortal
ityra
tesfo
rAfri
can
Amer
ican
wom
en(1
996
to2
000)
.Us
ing
the
subs
eque
nt5
yea
rso
ffol
low-
upd
ata(2
006
to
2010
),ca
libra
tion
asth
era
tioo
fexp
ected
too
bser
ved
num
ber
ofb
reas
tcan
cers
and
disc
rimin
atory
acc
urac
yus
ing
thec
onco
rdan
cest
atisti
cwer
eeva
luate
d.
Base
lineq
uesti
onna
ireo
nBW
HSri
skfa
ctorw
ere
colle
cted
(age
atm
enar
che,
heig
ht,w
eight
atag
e18
year
s,wa
istan
dhi
pcir
cum
feren
ce,e
duca
tiona
latt
ainm
ent,
family
hist
oryo
fbre
astc
ance
r,pa
rity,
agea
tfir
stbi
rth,d
urati
ono
fbre
astfe
edin
g,o
ralc
ontra
cept
ive
use,
agea
tmen
opau
se,t
ypeo
fmen
opau
se,m
enop
ausa
lho
rmon
euse
,pre
vious
diag
nosis
ofb
enig
nbr
east
dise
ase
Incid
entd
iagno
seso
fbre
astc
ance
rwer
easc
ertai
ned
thro
ugh
self-
repo
rton
bien
nial
follo
w-up
que
stion
naire
san
d,fo
rnon
-resp
onde
nts,
thro
ugh
linka
gew
ithst
ate
canc
erre
gistr
ies.B
reas
tcan
cerd
eath
swer
eide
ntifi
ed
thro
ugh
linka
gew
ithth
eNati
onal
Death
Inde
x.
II-2
55,8
79A
frica
nAm
erica
nwo
men
fro
mt
heB
WHS
coh
ort
aged
30
to6
9ye
ars
atba
selin
eor
who
re
ache
dag
e30
ye
ars
durin
gfo
llow-
up,h
adn
ohi
story
ofc
ance
rat
base
line,
and
had
nom
issin
gda
taon
varia
bles
inth
efina
lmod
el
Mea
nag
e:39
.9(1
996
coho
rt)a
nd
47.2
(200
6)
TheB
WHS
mod
elin
clude
dth
esef
acto
rs;
family
hist
ory,
prev
ious
bio
psy,
body
mas
sind
exat
age1
8ye
ars,
agea
tmen
arch
e,ag
eat
first
birth
,ora
lcon
trace
ptive
use
,bila
teral
ooph
orec
tom
y,es
troge
npl
us
prog
estin
use
,and
heig
ht(
facto
rass
ociat
edw
ithth
elar
gest
RR=
fam
ilyh
istor
yof
bre
astc
ance
rin
afirs
t-deg
reer
elativ
ediag
nose
dbe
fore
age5
0ye
ars(
RR=
2.24
;95
%C
I1.7
6to
2.8
4))
Incid
ence
ofb
reas
tcan
cer:
896
incid
enti
nvas
iveb
reas
tcan
cers
(199
5to
200
5)M
edian
agea
tdiag
nosis
:50
year
s
Valid
ation
:C
alibr
ation
O
vera
llE/
Ora
tio=
0.9
6(9
5%C
I0.8
8to
1.0
5)
s
igni
fican
tund
eres
timati
ono
frisk
:W
omen
with
out
afam
ilyh
istor
yof
bre
ast
canc
er(
E/O
ratio
,0.
90;9
5%
CI,0
.81
to0
.99)
,n
ullip
arou
swom
en(E
/Ora
tio=
0.83
;95%
CI0
.70
to0
.99)
,w
omen
who
use
dor
alco
ntra
cept
ives
with
inth
epr
evio
us1
0ye
ars
(E/O
ra
tio=
0.75
;95%
CI0
.63
to0
.89)
I
nth
esec
ond
lowe
stag
e-ad
juste
d
qui
ntile
ofr
isk(E
/Ora
tio=
0.7
5;9
5%C
I0.6
1to
0.9
1)
G
ood
agre
emen
tbe
twee
nth
epr
edict
eda
ndo
bser
ved
num
ber
ofb
reas
tca
ncer
sacr
ossc
atego
rieso
foth
erri
skfa
ctors
.
Disc
rimin
atory
accu
racy
A
gead
juste
dAU
C(o
vera
ll)=
0.5
9(9
5%C
I0.5
6to
0.6
1)A
UC=
0.6
2;9
5%C
I,0.
58to
0.6
5(w
omen
youn
gert
han
age5
0ye
ars)
A
UC=
0.5
6;9
5%C
I,0.
53to
0.5
9(w
omen
agem
oret
han
50ye
ars)
A
UC=
0.6
2(E
R-ne
gativ
ebre
astc
ance
r)A
UC=
0.5
8(E
R-po
sitive
bre
astc
ance
r)(p
=0.1
)P
ropo
rtion
ofw
omen
with
elev
ated
risk
ofb
reas
tcan
cer(
5-ye
arp
redi
cted
risko
f1.6
6%o
rgre
ater)
2
.8%
ofw
omen
youn
gert
han
50ye
arso
ld3
2.2%
ofw
omen
mor
etha
n50
year
sold
wer
eclas
sified
asb
eing
atele
vated
ris
kofi
nvas
iveb
reas
tcan
cer
Auth
orco
nclu
sion:
The
BWHS
mod
elwa
swe
llca
libra
tedo
vera
ll,a
ndth
epr
edict
ivea
bilit
ywa
sbe
stfo
ryou
nger
wom
en.T
hep
ropo
rtion
ofw
omen
pre
dicte
dto
mee
tthe
1.6
6%c
ut
poin
tcom
mon
lyus
edto
dete
rmin
eelig
ibili
tyfo
rbre
astc
ance
rpre
vent
ion
trials
was
gr
eatly
incr
ease
dre
lative
top
revio
usm
odels

HTA Report: Breast cancer risk prediction model for Health Risk Assessment (HRA) module
53
Bibl
iogr
aphi
cci
tatio
nSt
udy
Type
/ M
etho
dsLE
Num
ber o
f pa
tient
s an
dpa
tient
ch
arac
teris
tics
Inte
rven
tion
Com
paris
onLe
ngth
of
follo
w u
p (if
ap
plic
able
)
Outc
ome
mea
sure
s/
Effe
ct s
ize
Gene
ral
com
men
ts
12.A
noth
aisin
tawee
,Te
eraw
attan
anon
Y,
Wira
tkapu
nc,
etal
.De
velo
pmen
tand
Va
lidati
ono
faB
reas
tCa
ncer
Risk
Pre
dicti
onM
odel
forT
haiW
omen
:A
Cros
s-Se
ction
alSt
udy.
Asia
nPa
cJC
ance
rPr
ev.2
014.
15
(16)
,68
11-6
817
Cros
ssec
tiona
l
Objec
tive:
tod
evelo
pan
dva
lidate
ab
reas
tcan
cer
risk
pred
ictio
nm
odel
forT
haiw
omen
.
Meth
od:
•M
odel
deriv
ation
(usin
gda
taco
llecte
dat
Ram
athib
odi
hosp
ital)
•M
ultip
lelo
gisti
cre
gres
sion
was
appl
iedto
con
struc
tth
e mod
el•
Mod
elva
lidati
on(i
nter
nal)
:use
db
ootst
rap
with
200
re
petit
ions
•
Mod
elva
lidati
on
(exte
rnal)
us
ed
data
from
Sr
inag
arin
dan
dSo
ngkla
naga
rind
Hosp
itals
•Pe
rform
ance
wer
eas
sess
edw
hich
wer
eca
libra
tion
and
disc
rimin
ation
per
form
ance
susin
gth
eobs
erve
d/ex
pecte
dra
tioa
ndc
onco
rdan
ces
tatist
ic(C
-stat
istic)
,re
spec
tively
.
III17
,506
wom
en w
hom
und
erto
ok
mam
mog
raph
icsc
reen
ing
in
Ram
athib
odi
Hosp
ital
(mod
elde
rivati
on)
Wom
en
unde
rgoi
ng
mam
mog
raph
icsc
reen
ing
aged
18
year
sand
abov
ewer
eelig
ible.
Thos
ewith
hist
oryo
finv
asive
br
east
canc
er,d
uctal
carc
inom
ain
situ
oro
ther
canc
ersw
ere
exclu
ded
•M
odel
deriv
ation
inclu
ded
thes
erisk
facto
rs;
- ag
e,-
men
opau
sals
tatus
,-
body
mas
sind
exan
d-
useo
fora
lcon
trace
ptive
s
•M
odel
perfo
rman
ce:
-
O/E
ratio
=1
.0(9
5%CI
0.8
2to
1.2
1)(o
vera
ll)-
O/E
ratio
0.9
7(9
5%C
I0.6
8to
1.3
5)(E
xtern
alva
lidati
on)
- Ov
erall
c-sta
tistic
=0
.65
(95%
CI0
.59
to0
.70
- C-
statis
tic=
0.6
4(95
%C
I0.6
4to
0.6
5)In
terna
lvali
datio
n-
C-sta
tistic
=0
.61(
95%
CI0
.51
to0
.71)
Exte
rnal
valid
ation
•Ri
sksc
ore&
risk
stra
tifica
tion:
lo
w,lo
w-in
term
ediat
e,in
term
ediat
e-hi
gh,a
ndh
igh-
risk
HTA Report: Breast cancer risk prediction model for Health Risk Assessment (HRA) module
54
Bibl
iogr
aphi
cci
tatio
nSt
udy
Type
/ M
etho
dsLE
Num
ber o
f pa
tient
s an
dpa
tient
ch
arac
teris
tics
Inte
rven
tion
Com
paris
onLe
ngth
of
follo
w u
p(if
app
licab
le)
Outc
ome
mea
sure
s/
Effe
ct s
ize
Gene
ral
com
men
ts
1. K
ye S
Y, P
ark
K, P
ark
HG
et
al. P
sych
olog
ical
im
pact
of h
ealth
ris
k ap
prai
sal o
f K
orea
n w
omen
at
diff
eren
t lev
els
of b
reas
t can
cer
risk:
neg
lect
ed
aspe
ct o
f the
w
eb-b
ased
ca
ncer
risk
as
sess
men
t too
l. A
sian
Pac
ific
J C
ance
r Pre
v.
2012
;13:
437-
441
KO
RE
A
Ran
dom
ized
tria
l
Obj
ectiv
e:To
exp
lore
the
psyc
holo
gica
l effe
ct o
f he
alth
risk
app
rais
al u
sing
epi
dem
iolo
gica
l ris
k fa
ctor
pro
file
Met
hod:
P
artic
ipan
ts w
ere
recr
uite
d th
roug
h ad
verti
sem
ents
in th
e w
ebsi
tes
betw
een
Oct
ober
and
Nov
embe
r 200
9.60
elig
ible
w
omen
com
plet
ed a
bas
elin
e in
terv
iew
, th
en ra
ndom
ized
to e
ither
a n
umer
ical
HR
A
or th
e H
RA
usi
ng p
erso
nal r
isk
fact
or li
st.
HR
A w
as d
one
thro
ugh
tele
phon
e in
terv
iew
. A
fter o
ne m
onth
, the
par
ticip
ants
atte
nded
in
terv
entio
n se
ssio
ns w
hich
con
sist
of
prov
isio
n of
HR
A re
sults
, pre
- and
pos
t-H
RA
ass
essm
ent f
or p
sych
olog
ical
sta
tus,
an
d co
unse
lling
. V
aria
bles
mea
sure
d in
per
sona
l ris
k fa
ctor
; hei
ght,
wei
ght,
alco
hol,
vege
tabl
e co
nsum
ptio
n, p
ast h
isto
ry o
f ben
ign
brea
st
dise
ase,
men
stru
atio
n an
d O
CP
. R
isk
fact
ors
for n
umer
ical
HR
A u
sed
Gai
l m
odel
fact
ors.
Anx
iety
leve
l was
mea
sure
d us
ing
Spi
elbe
rger
Sta
te T
rait
Anx
iety
In
vent
ory
YZ
(Kor
ean
vers
ion)
.
n= 6
0 w
omen
aged
bet
wee
n 30
to 4
8 ye
ars
old
with
out p
rior
canc
er d
iagn
osis
med
ian
age
: 38
year
s
Info
rmat
ion
on
indi
vidu
aliz
ed
risk
for b
reas
t ca
ncer
No
info
rmat
ion
1 m
onth
•
Ave
rage
anx
iety
leve
l•
Mea
n(S
D) 4
4.7(
9.2)
for t
rait
(long
term
) anx
iety
( 42
.6(9
.2)
for s
tate
(tem
pora
ry) a
nxie
ty•
Pre
dict
or fo
r inc
reas
e in
anx
iety
- A
nxie
ty s
core
incr
ease
d am
ong
wom
en w
ho h
ad h
ighe
r ris
k st
atus
in ‘r
isk
scor
e’ g
roup
at f
ollo
w u
p co
mpa
red
to
base
line,
with
mea
n(S
D) a
t bas
elin
e an
d fo
llow
up
wer
e 42
.8(8
.5) a
nd 4
7.0(
9.6)
resp
ectiv
ely,
how
ever
it w
as n
ot
sign
ifica
nt-
Ris
k st
atus
was
the
inde
pend
ent p
redi
ctor
of i
ncre
ase
of
stat
e an
xiet
y af
ter h
ealth
risk
app
rais
al in
terv
entio
n, a
fter
adju
sted
for a
ge, e
duca
tion,
HR
A ty
pe, n
umer
acy,
pre-
HR
A s
tate
anx
iety
and
HR
A ty
pe.
- W
omen
who
had
hig
her r
isk
stat
us h
ad a
n od
d of
hav
ing
incr
ease
d an
xiet
y ab
out 5
tim
es g
reat
er th
an w
omen
who
ha
d lo
wer
risk
sta
tus
(OR
5.0
3, 9
5% C
I 1.5
4 to
16.
43,
p=0.
01)
Aut
hors
’ con
clus
ion:
C
omm
unic
atin
g th
e ris
k st
atus
by
indi
vidu
al h
ealth
risk
ap
prai
sal s
ervi
ce c
an in
duce
psy
chol
ogic
al s
eque
lae,
es
peci
ally
in w
omen
hav
ing
high
er ri
sk s
tatu
s. H
ospi
tals
, in
stitu
tes,
or m
edic
al s
choo
ls th
at a
re o
pera
ting
or p
lann
ing
to o
pera
te th
e on
line
heal
th ri
sk a
ppra
isal
ser
vice
sho
uld
take
si
de e
ffect
s su
ch a
s ps
ycho
logi
cal s
eque
lae
into
con
side
ratio
n.
Furth
er re
sear
ch o
n ca
ncer
risk
com
mun
icat
ion
stra
tegi
es fo
r H
RA
ser
vice
are
requ
ired
to e
xplo
re lo
ng te
rm o
utco
me
and
to
eval
uate
mor
e ps
ycho
logi
cal o
utco
me.
EVID
ENC
E TA
BLE
: S
AFE
TY
QU
ESTI
ON
: I
S H
EA
LTH
RIS
K A
SS
ES
SM
EN
T M
OD
ULE
FO
R B
RE
AS
T C
AN
CE
R O
R C
AN
CE
R R
ISK
PR
ED
ICTI
ON
MO
DE
L S
AFE
TO
DE
TEC
T W
OM
EN
WH
O D
EV
ELO
P B
RE
AS
T C
AN
CE
R?
HTA Report: Breast cancer risk prediction model for Health Risk Assessment (HRA) module
55
Bibl
iogr
aphi
cci
tatio
nSt
udy
Type
/ M
etho
dsLE
Num
ber o
f pa
tient
s an
dpa
tient
ch
arac
teris
tics
Inte
rven
tion
Com
paris
onLe
ngth
of
follo
w u
p (if
ap
plic
able
)
Outc
ome
mea
sure
s/
Effe
ct s
ize
Gene
ral
com
men
ts
2. S
cher
er
LD, U
bel P
A,
McC
lure
J e
t al
. Bel
ief i
n nu
mbe
rs: w
hen
and
why
wom
en
disb
elie
ve
tailo
red
brea
st
canc
er ri
sk
stat
istic
s. P
atie
nt
educ
atio
n an
d co
unse
ling.
20
13;9
2:25
3-25
9
DE
TRO
IT &
S
EA
TTLE
, US
Cro
ss s
ectio
nal
Obj
ectiv
e:To
det
erm
ine
whe
n an
d w
hy w
omen
cho
se
to d
isbe
lieve
the
pers
onal
ized
bre
ast
canc
er ri
sk n
umbe
rs.
Met
hod:
W
omen
who
se m
edic
al re
cord
s in
dica
ted
that
they
mig
ht b
e at
abo
ve a
vera
ge ri
sk
of d
evel
opin
g br
east
can
cer w
ere
recr
uite
d fro
m th
e H
enry
For
d H
ealth
Sys
tem
in
Det
roit
and
Gro
up H
ealth
in S
eattl
e. T
he
subj
ects
par
ticip
ated
in a
n on
line
prog
ram
w
hich
pre
sent
ed ta
ilore
d in
form
atio
n ab
out i
ndiv
idua
l bre
ast c
ance
r ris
k af
ter
com
plet
ing
BC
RA
T qu
estio
ns a
nd v
iew
ing
deci
sion
aid
on
chem
opre
vent
ion.
The
y w
ere
pres
ente
d w
ith ta
ilore
d ab
solu
te
risk
(BC
RA
T sc
ore)
and
est
imat
e of
risk
re
duct
ion
with
che
mop
reve
ntio
n.Th
e su
bjec
ts w
ere
aske
d w
heth
er th
ey
belie
ve th
e pr
ogra
m w
as p
erso
naliz
ed
and
whe
ther
they
bel
ieve
the
num
bers
. Th
e B
CR
AT
scor
e w
as c
alcu
late
d us
ing
thes
e fa
ctor
s: a
ge, e
thni
city
, per
sona
l ris
k of
bre
ast c
ance
r, ag
e at
firs
t men
ses,
age
at
firs
t liv
e bi
rth, n
umbe
r of fi
rst d
egre
e re
lativ
es w
ho h
ave
had
brea
st c
ance
r, hi
stor
y of
bre
ast b
iops
ies.
Inte
rven
tion:
Per
sona
lized
risk
est
imat
e in
on
e of
two
diffe
rent
way
s:-
1. “
deta
iled
expl
anat
ion”
of
the
fact
ors
that
w
ere
used
to
calc
ulat
e th
eir
tailo
red
risk
num
bers
2.
“sta
ndar
d ta
ilorin
g”,
parti
cipa
nts
wer
e gi
ven
no i
nfor
mat
ion
abou
t ho
w t
heir
risk
num
ber w
as g
ener
ated
n=69
0 w
omen
- at o
r abo
ve a
vera
ge
risk
of d
evel
opin
g br
east
ca
ncer
as
estim
ated
by
the
Bre
ast C
ance
r R
isk
Ass
essm
ent T
ool
(BC
RA
T)(s
core
rang
e 1.
7-19
.1)
- age
rang
e 46
to 7
4 ye
ars
- 97.
6% w
ere
whi
te
•In
fluen
ce o
f int
erve
ntio
n on
bel
iefs
that
the
prog
ram
was
pe
rson
aliz
ed:
- W
omen
who
rece
ived
“det
aile
d in
form
atio
n” w
ere
mor
e lik
ely
to fe
el th
at th
e pr
ogra
m w
as p
erso
naliz
ed c
ompa
red
to th
ose
rece
ivin
g “s
tand
ard
info
rmat
ion”
; with
mea
n(S
D) o
f 4.
85(1
.39)
vs
4.64
(1.4
1), p
=0.0
5 re
spec
tivel
y
•D
isag
reem
ent w
ith ta
ilore
d ris
k :
131
parti
cipa
nts
disa
gree
d w
ith b
oth
risk
num
bers
(1
8.9%
)
Rea
sons
for d
isag
reem
ent (
qual
itativ
e as
sess
men
t)-
Thei
r fam
ily h
isto
ry m
ade
them
eith
er m
ore
or le
ss li
kely
to
dev
elop
bre
ast c
ance
r tha
n th
eir t
ailo
red
risk
num
ber
sugg
este
d (I
have
aun
ts th
at h
ave
had
canc
er)
- Th
e ris
k nu
mbe
r see
med
too
high
or t
oo lo
w (I
t jus
t see
med
lo
w, t
he p
erce
ntag
e w
as lo
w c
ompa
red
to m
y co
ncer
n)-
Hea
lth h
abits
and
life
styl
e (I
am in
exc
elle
nt h
ealth
and
I liv
e an
act
ive
heal
thy
lifes
tyle
).-
Oth
ers:
The
y th
ough
t the
cal
cula
tion
faile
d to
acc
ount
fo
r rel
evan
t per
sona
l inf
orm
atio
n su
ch a
s fa
mily
his
tory
, m
edic
al h
isto
ry, l
ifest
yle,
hor
mon
e re
plac
emen
t the
rapy
or
unsp
ecifi
ed.
Aut
hors
’ con
clus
ion:
The
ben
efits
of
tailo
red
risk
stat
istic
s m
ay
be a
ttenu
ated
by
a te
nden
cy f
or p
eopl
e to
be
skep
tical
tha
t th
ese
risk
estim
ates
app
ly t
o th
em p
erso
nally
. D
ecis
ion
aids
m
ay p
rovi
de r
isk
info
rmat
ion
that
is
not
acce
pted
by
patie
nts,
bu
t ad
dres
sing
the
pat
ient
s’ p
erso
nal c
ircum
stan
ces
may
lead
to
gre
ater
acc
epta
nce

HTA Report: Breast cancer risk prediction model for Health Risk Assessment (HRA) module
56
LIST OF EXCLUDED STUDIES
1. Brain K, Parsons E, Bennett P et al. The evolution of worry after breast cancer risk assessment: 6 year follow up of the TRACE study cohort. Psycho-oncology 2011.20;984-991.
2. Brain K, Norman P, Gray J et al. A randomized trial of specialist genetic assessment: psychological impact on women at different levels of familial breast cancer risk. British Journal of Cancer 2002.86;233-238.
3. Antoniou A, Hurdy R, Walker L, et al. Predicting the likelihood of carrying a BRCA1 or BRCA2 mutation: validation of BOADICEA, BRCAPRO, IBIS, Myriad and the Manchaster scoring system using data from UK genetics clinic. J Med Genet 2008. Doi:10.1136/jmg.2007.056556
4. Fischer C, Kuchenbäcker K, Engel C, et al. Evaluating the performance of the breast cancer genetic risk models BOADICEA, IBIS, BRCAPRO and Claus for predicting BRCA1/2 mutation carrier probabilities: a study based on 7352 families from the German Hereditary Breast and Ovarian Cancer Consortium. J Med Genet 2013; 50:360–367. doi:10.1136
5. McCarthy AM, Armstrong K, Handor E, et al. Incremental impact of breast cancer SNP panel on risk classification in a screening population of white and African American women. Breast Cancer Res Treat. 2013 April; 138(3): 889–898. doi:10.1007/s10549-013-2471-8.
6. Wacholder S, Hartge P, Prentice R, et al. Performance of common genetic variants in breast cancer risk models. N Engl J Med 2010.362;986-93
7. Mealiffe ME, Stokowski RP, Rhees BK, et al. Assessment of Clinical Validity of a Breast Cancer Risk Model Combining Genetic and Clinical Information. J Natl Cancer Inst 2010.102;1618–1627. DOI: 10.1093/jnci/djq388
8. Fasching PA, Bania MR, Carolin Nestle-Kra¨mling CN, et al. Evaluation of mathematical models for breast cancer risk assessment in routine clinical use. European Journal of Cancer Prevention 2007. 16;216-224
9. Sta°hlbom AK, Johansson H, Liljegren A, et al. Evaluation of the BOADICEA risk assessment model in women with a family history of breast cancer. Familial Cancer 2012.11:33–40. DOI 10.1007/s10689-011-9495-1
10. Darabi H, Czane K, Zhao W, et al. Breast cancer risk prediction and individualised screening based on common genetic variation and breast density measurement. Breast cancer research 2012.14;R25
11. Maclnnis RJ, Bickerstaffe A, Apicella C et al. Prospective validation of the breast cancer risk prediction model BOADICEA and a batch-mode version BOADICEACentre. British Journal of Cancer.2013;109:1296-1301
12. Zheng W, Wen W, Gao YT et al. Genetic and clinical predictors for breast cancer risk assessment and stratification among Chinese women. J Natl Cancer Inst. 2010;102:972-981
13. Dai J, Hu Z, Jiang Y, et al. Breast cancer risk assessment with five independent genetic variants and two risk factors in Chinese women. Breast Cancer Research 2012, 14:R17
14. Weisstock CR, Rajapakshe R, Bitgood C, et al. Assessing the Breast Cancer Risk Distribution for Women Undergoing Screening in British Columbia. Cancer Prev Res 2013. 6(10); 1084–92 DOI: 10.1158/1940-6207.CAPR-13-0027
15. Sharabi SE, Bullocks JM, Dempsey PJ, et al. The need for breast cancer screening in women undergoing elective breast surgery: an assessment of risk and risk factors for breast cancer in young women. Aesthetic Surgery Journal 2010. 30(6);821-831.DOI:10.1177/1090820X10386589
16. Smith RP, Ni X, Muram D. Breast caner risk assessment: positive predictive value of family history as a predictor of risk. Menopause 2011. 18(6);621-624.
17. Park S, Cochrane B, Koh SB, et al. Comparison of breast cancer risk estimations, risk perception and screening behaviour in obese rural Korean women. Oncology Nursing Forum 2011. 30(6);E394-401.
18. Boughey JC, Hartmann LC, Anderson SS, et al. Evaluation of the Tyrer-Cuzick (International Breast Cancer Intervention Study) Model for Breast Cancer Risk Prediction in Women With Atypical Hyperplasia. J Clin Oncol 2010. 28:3591-3596.
19. Ozanne EM, Drohan B, Bosinoff P, et al. Which Risk Model to Use? Clinical Implications of the ACS MRI Screening Guidelines. Cancer Epidemiol Biomarkers Prev; 22(1); 146–9.
20. Seyednoori T, Pakseresht S. Risk of developing breast cancer by utilizing Gail model. Women & Health. 2012;52:391-402
21. Gail MH, Constantino JP, Pee D, et al. Projecting Individualized Absolute Invasive breast cancer risk in African American women. J Natl Cancer Inst 2007.99;1782-92.
22. Rockhill B, Spiegelman D, Byrne C, et al. Validation of the Gail et al model of breast cancer risk prediction and implications for chemoprevention. J Natl Cancer Inst 2001.93(5);358-66.
HTA Report: Breast cancer risk prediction model for Health Risk Assessment (HRA) module
57
23. Tamimi RM, Rosner B, Colditz GA, et al. Evaluation of a breast cancer risk prediction model expanded to include category of prior benign breast disease lesion. Cancer 2010.116(21);4944-53.doi:10.1002/cncr.25386.
24. Decarli A, Calza S, Masala G, et al. Gail model for prediction of absolute risk of invasive breast cancer: independent evaluation in the Florence-European Prospective investigation into cancer and nutrition cohort. J Natl Cancer Inst 2006.98(23);1686-1693.
25. Newman LA. Applicability of the Gail model for breast cancer risk assessment in Turkish female population and evaluation of breast feeding as a risk factor. Breast cancer res treat 2010. 120;425-26.
26. Tice JA, Cummings SR, Smith-Bindman R, et al. Using clinical factors and mammographic breast density to estimate breast cancer risk: development and validation of a new prediction model. Ann Intern Med 2008.148(5);337-347.
27. Dorval M, Bouchard K, Chiquette, et al. A focus group study on breast cancer risk presentation: one format does not fit all. European Journal of human genetics 2013.21;719-724.
28. Quillin JM, Fries E, McClish D, et al. Gail model risk assessment and risk perceptions. Journal of behavioural medicine 2004.27(2);205-214.
29. Crepeau AZ, Willoughby L, Pinsky B, et al. Accuracy of personal breast cancer risk estimation in cancer free women during primary care visits. Women & Health 2008.47(2);113-130.DOI:10.1080/03630240802092431
30. Ceber E, Soyer MT, Ciceklioglu M, et al. Breast cancer risk assessment and risk perception on nurses and midwives in Bornova Health District in Turkey. Cancer Nursing 2006.29(3);244-249.
31. Neumann PJ, Cohen JT, Hammitt JK, et al. Willingness to pay for predictive test with no immediate treatment implications: a survey of US residents. Health Econ 2012.21;238-251.
32. Ozanne EM and Esserman LJ. Evaluation of breast cancer risk assessment techniques: a cost effectiveness analysis. Cancer epidemiol Biomarkers Prev 2004.13(12);2043-2051.
33. Panchal SM, Ennis M, Canon S, et al. Selecting a BRCA risk assessment model for use in a familial cancer clinic. BMC Medical Genetics 2008.9(116). doi:10.1186/1471-2350-9-116
34. Kwong A, Wong CHN, Suen DTK, et al. Accuracy of BRCA1/2 mutation prediction models for different ethnicities and genders: experience in a Southern Chinese cohort. World J Surg 2012.36;702-713.
35. Lin Y, Shao N, Zhang YJ, et al. Risk assessment of breast cancer in Guangdong, China: a community based survey. Asian Pacific Journal of Cancer Prevention 2012.13;2759-2763.
36. Brinton JT, Barke LD, Freivogel ME, et al. Breast cancer risk assessment in 64,659 women at a single high volume mammography clinic. Acad Radiol 2012.19(1);95-99.doi:10.1016/j.acra.2011.09.003
37. Mavaddat N, Peock S, Frost D, et al. Cancer risks for BRCA1 and BRCA2 mutation carriers: results from prospective analysis of EMBRACE. J Natl Cancer Inst 2013.105;812-822.
38. Rodrigues JJPC, Reis N, Moutinho JAF, et al. Breast alert: an online tool for predicting the lifetime risk of women breast cancer. J med Syst 2012.36;1417-1424.
39. Rupert DJ, Squiers LB, Renaud JM, et al. Communicating risk of hereditary breast and ovarian cancer with an interactive decision support tool. Patient education and counselling 2013.92;188-196
40. Brennan P, Claber O, Brennan T. Cancer family history triage: a key step in the decision to offer screening and genetic testing. Familial Cancer 2013.12;497-502.
41. Baer HJ, Schneider LI, Colditz GA, et al. Use of a web based risk appraisal tool for assessing family history and lifestyle factors in primary care.J Gen Intern Med 2013.28(6);817-24.
42. Mathieu E, Barratt AL, McGeehan K, et al. Helping women make choices about mammography screening: an online randomized trial of a decision aid for 40 year old women. Patient education and counselling 2010.81;63-72.
43. Rubinstein WS, Acheson LS, O’Neill SM, et al. Clinical utility of family history for cancer screening and referral in primary care: a report from the Family Healthware Impact Trial. Genet Med 2011. 13(11);956-65.
44. Hampel H, Sweet K, Westman JA, et al. Referral for cancer genetics consultation: a review and compilation of risk assessment criteria. J Med Genet 2004.41;81-91.doi:10.1136/jmg.2003.010908
45. Familial breast cancer: collaborative reanalysis of individual data from 52 epidemiological studies including 58,209 women with breast cancer and 101,986 women without the disease. Lancet 2001.358;9291;1389-99.