healthcare financial management … introductions community foundation of northwest indiana, inc....
TRANSCRIPT

1
HEALTHCARE FINANCIAL
MANAGEMENT
ASSOCIATION
CAPITAL CONFERENCE
April 10, 2014

2
Introductions
Community Foundation of Northwest Indiana, Inc. (“CFNI”)
John Gorski – Chief Operating Officer
Mary Ann Shacklett – Senior Vice President of Finance & Chief
Financial Officer

3
Community Foundation of Northwest Indiana Overview
Regional healthcare system provider serving Lake and Porter counties in northwest Indiana
Community Healthcare System (“CHS”):
3 acute care hospitals Community Hospital (“MMRF” or
“CH”) Munster, Indiana – 427 beds
St. Catherine Hospital (“SCH”) East Chicago, Indiana - 189
beds
St. Mary Medical Center (“SMMC”) Hobart, Indiana – 195 beds
1 CCRC facility
Community Village Inc. (Hartsfield Village) (“CV”) Munster Indiana 106 independent living units,
71 assisted living, 24 memory support and 112 beds in nursing care facility
St. Catherine
Hospital
East Chicago, Indiana
St. Mary Medical
Center
Hobart, Indiana
The Community
Hospital
Munster, Indiana

4
Corporate Structure
For FYE 2013, the Obligated Group members (assuming CV as part of Obligated Group)
accounted for over 99% of total operating revenues and total assets
Members of the Obligated Group, Nonprofit
501(c)(3) Corporations
Other Related Entities
CVPA
Holding
Corporation
Community
Resources,
Inc.
Community
Foundation of
Northwest Indiana,
Inc.
Munster Medical
Research
Foundation, Inc.
d/b/a The
Community
Hospital
St. Catherine
Hospital, Inc.
St. Mary
Medical
Center, Inc.
Theatre at
The Center,
Inc.
Community
Cancer Research
Foundation, Inc.
Community
Care
Network,
Inc. (“CCNI”)
Community
Village, Inc. d/b/a
Hartsfield Village

5
Facilities and Services offered CHS offers the following facilities:
3 acute care hospitals
1 CCRC
Extended care services
Rehabilitation services
Wellness/Fitness center
Outpatient surgery and diagnostic centers
Maintains high level of care with wide range of
inpatient and outpatient services
In FY 2013: 43,636 discharges, 10,293 observations,
483,999 outpatient visits, 128,757 ER visits, 9,352
inpatient surgeries, and 24,367 outpatient surgeries

6
Strategic Growth - Valparaiso Health Center
Opened February 11, 2013
High growth affluent area
Approximately 70% commercial payors
Revenue and earnings above or consistent with projections

7
Comprised of no more than 20 directors
Currently 20 active directors
Staggered 3 year terms
Appoints:
Directors to the Boards of all 3
Hospital Corporations and CVI
the President of the Board of each
Hospital Corporation and CVI
Hospital Administrator for each
Hospital Corporation
Specific experience:
Physicians
Health Care Executives
Bankers
Attorneys
Local Business Leaders
Responsible for establishing strategic
oversight for the System
Monthly Board meetings
Key committees include:
Real Estate
Audit
Development
Salary and Benefits
Corporate Compliance
Board of Directors approvals consist of:
Annual business plans and budgets
Capital expenditures, borrowing
and disposition of assets
Compliance activities
Governance Structure – CFNI Board Structure
Board Structure and Approvals Board Composition
Nominating
Executive
Strategic Plan
Bylaws

8
Each of the 3 Hospital Corporations
represented by a Board of Directors
Hospital Corporation Boards
Not less than 10, nor more than 20
Directors
Staggered 3 year terms
Directors appointed by CFNI board
2 members also CFNI board
Directors
Responsibilities:
Medical staff credentialing
Quality assurance
Monitoring patient care
CVI Board comprised of 7 Directors
Serve 1-year terms
CCNI Board comprised of no less than 7
and no more than 12 Directors
Comprised of CFNI Board Chairman,
President/CEO, COO, CFO of CFNI
and CEO of each Hospital
Corporation
Governance Structure – Hospital Corporation and CVI Board
Structure
CVI & CCNI Board Structure Hospital Corporation Board Structure

9
Geographic Dispersion

10
Medical Staff
June, 2013Community
Hospital
St. Catherine
Hospital
St. Mary
Medical Center
Total Active Members* 568 329 461
Average Age of Active Physicians 50 51 51
Privileges at Community Hospital 247 (75.0%) 176 (38.0%)
Privileges at St Catherine Hospital 247 (43.0%) 157 (34.0%)
Privileges at St Mary Medical Center 176 (31.0%) 157 (48.0%)
Number of Specialties 54 41 34
Report period is for June 2013
Medical Staff Profiles
Community Foundation of Northwest Indiana, Inc. – Munster, IN
*Record Status Active; excludes emeritus members

11
Specialty FY 2009 FY 2010 FY 2011 FY 2012 FY 2013 FY 2014
Family Practice 20 21 22 23 27 33
Internal Medicine 9 11 14 14 18 17
OB/GYN 2 7 9 10 13 14
Hospitalists 4 6
Cardiology 2 2 3 4
Pediatrics 3 3 3 2 3 4
Neurosurgery 2 2 3 3 3 3
Psychiatry 2 2 2 3 3 3
Surgery 1 3 3 3 3
Infectious Disease 2 2
Neurology 1 2 2
Occ Health 1 1 2 2 2 2
Orthopedics 1 1 1 2 2
ENT 1 1 1 1 1
Podiatry 1 1
Urology 1 1 1 1 1
Sub Total 39 51 63 66 88 98
% of Primary Care 87.2% 82.4% 76.2% 74.2% 69.3% 69.4%
Anesthesiology 20 21 22 20 23 25
Grand Total 59 72 85 86 111 123
Employed Physicians

12
• Low turnover
• FTE increase from growth
Xxand Medical Practices
• Controls on personnel
Xxcosts
• Steady revenue growth
Rates and Ratios FY 2006 FY 2007 FY 2008 FY 2009 FY 2010 FY 2011 FY 2012 FY 2013
CHS - RN/LPN
Turnover Rate11.7% 10.5% 11.1% 10.0% 9.6% 10.1% 10.0% 11.2%
RN/LPN Vacancy Rate FY 2006 FY 2007 FY 2008 FY 2009 FY 2010 FY 2011 FY 2012 FY 2013
CH 2.4% 2.3% 2.1% 2.3% 2.1% 2.7% 2.3% 2.4%
SC 4.0% 4.7% 3.1% 3.3% 3.0% 3.4% 3.1% 3.2%
SM 4.1% 2.4% 2.2% 2.2% 2.9% 3.5% 3.6% 3.9%
CHS - Salary &
Benefits/NPSR51.94% 52.50% 51.17% 51.01% 50.46% 52.26% 50.72% 51.58%
CHS - Total Operating
Revenue ($000s)$568,687 $590,605 $644,322 $685,722 $760,245 $806,586 $857,488 $887,300
Community Healthcare System
FTE Trends by Fiscal Year
5,2515,2125,115
4,8794,628
4,4774,3904,364
0
500
1,000
1,500
2,000
2,500
3,000
3,500
4,000
4,500
5,000
5,500
6,000
CCNI
CFNI
SM
SC
CH
CHS
IHA 2012 Q 4
Turnover 14.08%
Vacancy 4.71%
IHA 2013 Q 1
Turnover 13.24%
Vacancy 4.40%

13
Community Healthcare System
Discharges
30,000
32,000
34,000
36,000
38,000
40,000
42,000
44,000
46,000
48,000
50,000
52,000
54,000
56,000
CHS 38,109 40,504 41,252 41,500 43,613 42,477 51,602 52,221 52,608 52,529 54,437 53,929 52,838
% change 6% 2% 1% 5% -3% 21% 1% 1% 0% 4% -1% -2%
FY 2002 FY 2003 FY 2004 FY 2005 FY 2006 FY 2007 FY 2008 FY 2009 FY 2010 FY 2011 FY 2012 FY 2013
FYTD
2014
Annl
CAGR: 2.76%

14
Community Healthcare System
Total Emergency Department Visits
75,000
80,000
85,000
90,000
95,000
100,000
105,000
110,000
115,000
120,000
125,000
130,000
135,000
CHS 86,147 85,828 89,547 92,675 94,757 96,816 107,567 112,029 118,137 122,114 127,419 128,757 128,676
% change 0% 4% 3% 2% 2% 11% 4% 5% 3% 4% 1% 0%
FY 2002 FY 2003 FY 2004 FY 2005 FY 2006 FY 2007 FY 2008 FY 2009 FY 2010 FY 2011 FY 2012 FY 2013
FYTD
2014
Annl
CAGR: 3.40%

15
Community Healthcare System
Growth Statistics
FY 2008 FY 2009 FY 2010 FY 2011 FY 2012 FY 2013 *FYTD 2014
Average Daily Occupancy 575.7 574.2 574.8 601.1 610.0 600.1 545.7
Average Length of Stay 4.52 4.57 4.69 4.66 4.60 4.73 4.69
Medicare CMI_CH 1.5358 1.5378 1.5227 1.5511 1.5356 1.5703 1.6269
Medicare CMI_SC 1.4945 1.4300 1.5542 1.4953 1.4194 1.4839 1.5706
Medicare CMI_SM 1.4624 1.4665 1.5021 1.4513 1.4370 1.4822 1.5988
*ED visits 107,567 112,029 118,137 122,114 127,419 128,757 128,676
**Outpatient Visits 451,252 466,723 493,728 485,040 490,228 483,999 532,576
**Outpatient Surgeries 25,124 24,525 24,879 24,495 24,353 24,367 24,572
**Inpatient Surgeries 10,416 10,250 9,962 10,102 9,741 9,352 8,786
**Open Heart Procedures 435 445 411 422 333 367 394
**Births_CHS 3,810 3,847 3,847 3,596 3,377 3,002 2,816
*FYTD 2014 through December 2013
**FYTD 2014 Annualized

16
Community Healthcare System
Market Share Growth - Primary Service Areas
30.5% 31.9% 32.3% 32.2% 32.7% 32.3% 31.0% 30.1%34.2% 32.6%
14.4%14.3% 14.3% 14.1% 13.6% 14.6%
14.1% 14.8%
13.5% 14.6%
13.4%13.8%
16.1% 16.6% 15.9% 15.9%16.7% 18.0%
17.5% 18.5%
65.7%65.2%62.9%
61.8%62.8%
62.2%62.9%62.7%
60.0%58.3%
0.0%
10.0%
20.0%
30.0%
40.0%
50.0%
60.0%
70.0%
St. Mary Medical Center 13.4% 13.8% 16.1% 16.6% 15.9% 15.9% 16.7% 18.0% 17.5% 18.5%
St. Catherine Hospital 14.4% 14.3% 14.3% 14.1% 13.6% 14.6% 14.1% 14.8% 13.5% 14.6%
Community Hospital 30.5% 31.9% 32.3% 32.2% 32.7% 32.3% 31.0% 30.1% 34.2% 32.6%
System Market Share 58.3% 60.0% 62.7% 62.9% 62.2% 62.8% 61.8% 62.9% 65.2% 65.7%
2003 2004 2005 2006 2007 2008 2009 2010 2011 2012

17
• Continued market dominance
• Essential facilities for insurance products in region
Community Healthcare System
Market Share Growth - All Service Areas
22.5% 23.9% 24.4% 23.9% 24.6% 24.0% 22.8% 23.4%25.6% 24.7%
9.7%9.8% 10.3% 9.9% 9.4% 10.2%
9.7% 10.2%9.7% 10.4%
8.8%9.0%
11.2% 11.6% 11.0% 11.1%12.0%
12.0%12.2% 13.0%
48.1%47.5%45.6%44.5%45.3%45.0%45.4%45.9%
42.7%41.0%
0.0%
10.0%
20.0%
30.0%
40.0%
50.0%
60.0%
St. Mary Medical Center 8.8% 9.0% 11.2% 11.6% 11.0% 11.1% 12.0% 12.0% 12.2% 13.0%
St. Catherine Hospital 9.7% 9.8% 10.3% 9.9% 9.4% 10.2% 9.7% 10.2% 9.7% 10.4%
Community Hospital 22.5% 23.9% 24.4% 23.9% 24.6% 24.0% 22.8% 23.4% 25.6% 24.7%
CHS 41.0% 42.7% 45.9% 45.4% 45.0% 45.3% 44.5% 45.6% 47.5% 48.1%
2003 2004 2005 2006 2007 2008 2009 2010 2011 2012

18 18
Community Healthcare System
Awards and Accreditations
American Association of Blood Banks – Systemwide Laboratory Accreditation 2012 – 2013
Building Indiana – Swanky Office Award for Best Technology. Profiled were the da Vinci Surgical System, Dual-Source CT,
CartOSound Imaging, Wearable Therapy, and CyberKnife®, 2009
Commission on Accreditation of Rehabilitation Facilities (CARF) – The Acute Rehabilitation Centers at Community Hospital, St.
Catherine Hospital, and St. Mary Medical Center participated in a successful CARF reaccreditation survey, 2010
Commission on Laboratory Accreditation of the College of American Pathologists (CAP) – Systemwide Laboratory
Accreditation, 2010 – 11
Donate Life America – Award of Merit for the Flags Across America Program for honoring all donors and recipients by the creative
and widespread use of donate life flags. One of six national recipients; we were the only healthcare organization, 2010
Gift of Hope Organ & Tissue Donor Network – “Lifesaving Partner” for outstanding achievement in addressing the region’s
critical need for organ, eye, and tissue donations, 2010 – 11
Society of Innovators of Northwest Indiana – Chanute Prize for Team Innovation for the breast Care: Same Day Results project ,
2008 – 09
Studer Group – Fire Starter Award, November, 2009
The Joint Commission – The Gold Seal of ApprovalTM for demonstrating compliance with national standards for healthcare quality
and safety, 2009
Thomson Reuters – Nation’s Top 50 Best Healthcare Systems, 2009 – 10
U.S. News & World Report – Best Hospitals metro area rankings for the Chicago area, 2011

19 Patient Satisfaction Percentile Ranking Cash Flow
Net Income Days Cash On Hand
Millio
ns
Pe
rce
ntile
Ra
nk
COMMUNITY HEALTHCARE SYSTEM
80%88%82%
64%
32%
18%
84%
75%
0%
10%
20%
30%
40%
50%
60%
70%
80%
90%
100%
FY07
Q1
FY07
Q2
FY07
Q3
FY07
Q4
FY08
Q1
FY08
Q2
FY08
Q3
FY08
Q4
FY09
Q1
FY09
Q2
FY09
Q3
FY09
Q4
FY10
Q1
FY10
Q2
FY10
Q3
FY10
Q4
FY11
Q1
FY11
Q2
FY11
Q3
FY11
Q4
FY12
Q1
FY12
Q2
FY12
Q3
FY12
Q4
FY
13
1Q
FY
13
2Q
FY
13
3Q
FY
13
4Q
$0
$10
$20
$30
$40
$50
$60
$70
$80
$90
$100

20 Patient Satisfaction Percentile Ranking Cash Flow
Net Income Days Cash On Hand
Millio
ns
Pe
rce
ntile
Ra
nk
COMMUNITY HEALTHCARE SYSTEM
75%
84%
18%
32%
64%
82%88% 80%
$41.5$45.0
$31.0
$50.3
$36.5$38.2
$10.7$13.7
0%
10%
20%
30%
40%
50%
60%
70%
80%
90%
100%
FY07
Q1
FY07
Q2
FY07
Q3
FY07
Q4
FY08
Q1
FY08
Q2
FY08
Q3
FY08
Q4
FY09
Q1
FY09
Q2
FY09
Q3
FY09
Q4
FY10
Q1
FY10
Q2
FY10
Q3
FY10
Q4
FY11
Q1
FY11
Q2
FY11
Q3
FY11
Q4
FY12
Q1
FY12
Q2
FY12
Q3
FY12
Q4
FY
13
1Q
FY
13
2Q
FY
13
3Q
FY
13
4Q
$0
$10
$20
$30
$40
$50
$60
$70
$80
$90
$100

21 Patient Satisfaction Percentile Ranking Cash Flow
Net Income Days Cash On Hand
Millio
ns
Pe
rce
ntile
Ra
nk
COMMUNITY HEALTHCARE SYSTEM
75%
84%
18%
32%
64%
82%88% 80%
$41.5$45.0
$31.0
$50.3
$36.5$38.2
$10.7$13.7
$92.3
$96.4
$76.4
$92.1
$76.2
$78.1
$54.2
$50.4
0%
10%
20%
30%
40%
50%
60%
70%
80%
90%
100%
FY07
Q1
FY07
Q2
FY07
Q3
FY07
Q4
FY08
Q1
FY08
Q2
FY08
Q3
FY08
Q4
FY09
Q1
FY09
Q2
FY09
Q3
FY09
Q4
FY10
Q1
FY10
Q2
FY10
Q3
FY10
Q4
FY11
Q1
FY11
Q2
FY11
Q3
FY11
Q4
FY12
Q1
FY12
Q2
FY12
Q3
FY12
Q4
FY
13
1Q
FY
13
2Q
FY
13
3Q
FY
13
4Q
$0
$10
$20
$30
$40
$50
$60
$70
$80
$90
$100

22 Patient Satisfaction Percentile Ranking Cash Flow
Net Income Days Cash On Hand
Millio
ns
Pe
rce
ntile
Ra
nk
COMMUNITY HEALTHCARE SYSTEM
75%
84%
18%
32%
64%
82%88% 80%
$41.5$45.0
$31.0
$50.3
$36.5$38.2
$10.7$13.7
$92.3
$96.4
$76.4
$92.1
$76.2
$78.1
$54.2
$50.4
0%
10%
20%
30%
40%
50%
60%
70%
80%
90%
100%
FY07
Q1
FY07
Q2
FY07
Q3
FY07
Q4
FY08
Q1
FY08
Q2
FY08
Q3
FY08
Q4
FY09
Q1
FY09
Q2
FY09
Q3
FY09
Q4
FY10
Q1
FY10
Q2
FY10
Q3
FY10
Q4
FY11
Q1
FY11
Q2
FY11
Q3
FY11
Q4
FY12
Q1
FY12
Q2
FY12
Q3
FY12
Q4
FY
13
1Q
FY
13
2Q
FY
13
3Q
FY
13
4Q
$0
$10
$20
$30
$40
$50
$60
$70
$80
$90
$100
58
93
132
147
148 159
166 200

23
COMMUNITY HEALTHCARE SYSTEM
75%
84%
18%
32%
64%
82%88% 80%
$41.5$45.0
$31.0
$50.3
$36.5$38.2
$10.7$13.7
$92.3
$96.4
$76.4
$92.1
$76.2
$78.1
$54.2
$50.4
0%
10%
20%
30%
40%
50%
60%
70%
80%
90%
100%
FY07
Q1
FY07
Q2
FY07
Q3
FY07
Q4
FY08
Q1
FY08
Q2
FY08
Q3
FY08
Q4
FY09
Q1
FY09
Q2
FY09
Q3
FY09
Q4
FY10
Q1
FY10
Q2
FY10
Q3
FY10
Q4
FY11
Q1
FY11
Q2
FY11
Q3
FY11
Q4
FY12
Q1
FY12
Q2
FY12
Q3
FY12
Q4
FY
13
1Q
FY
13
2Q
FY
13
3Q
FY
13
4Q
$0
$10
$20
$30
$40
$50
$60
$70
$80
$90
$100
Patient Satisfaction Percentile Ranking Cash Flow
Net Income Days Cash On Hand
Millio
ns 58
93
132
147
148 159
166
Pe
rce
ntile
Ra
nk
200

24
Acute System Payor Mix
System Payor Mix
Payor FY 2008 FY 2009 FY 2010 FY 2011 FY 2012 FY 2013
Medicare 49.4% 47.8% 47.3% 47.7% 48.1% 46.6%
Managed Medicare 2.0% 1.9% 2.1% 2.3% 2.5% 4.4%
Medicaid 3.3% 3.4% 3.7% 4.8% 4.8% 5.3%
Managed Medicaid 8.0% 8.3% 9.1% 8.3% 7.2% 7.1%
Blue Cross 17.4% 17.5% 17.1% 16.7% 16.9% 16.6%
Commercial 1.7% 1.7% 1.5% 1.5% 1.7% 1.5%
Managed Care 15.7% 15.6% 15.0% 14.6% 14.1% 13.7%
Self pay 1.5% 2.2% 2.5% 2.6% 3.4% 3.4%
Other 1.0% 1.5% 1.7% 1.5% 1.4% 1.3%
Total 100.0% 100.0% 100.0% 100.0% 100.0% 100.0%
*Based on gross patient revenue
The system’s acute care payor mix trend is stable with stable Medicare, low self pay, moderate Medicaid, and a reasonably good and stable portion of patients reimbursed by insurance.

25
CFNI’s Balance Sheet Exhibits Strong Growth
Unlike most providers which experienced balance sheet erosion during the financial crisis, CFNI was able to grow its cash position from
$153 million at FYE 07 to $438 million at FYE 2013 driven primarily by strong operating cash flow and prudent investment management
Despite substantial capital investment and an increase in leverage, cash to debt grew from 43.4% in FY 2005 to 111.8% in FY 2013.
Unrestricted net assets grew by an impressive CAGR of 8.2% over the last three fiscal years.
Reclassifications were made for 2010 & 2011 combining notes payable, capital lease debt, & bonds payable to one line called Long Term
Debt. Prior to this the amounts in notes payable and capital lease debt were not material
Balance Sheet ($000s)
2006 2007 2008 2009 2010 2011 2012 2013
Assets
Unrestricted Cash & Invest $ 95,759 $ 153,275 $ 227,543 $ 260,548 $ 288,261 $ 310,707 $ 351,658 $437,878
Net Patient A/R $ 99,452 $ 88,838 $ 85,167 $ 85,448 $ 86,618 $ 96,933 $ 111,952 $101,931
PP&E (Net) $ 350,344 $ 342,975 $ 356,462 $ 392,290 $ 381,747 $ 402,414 $ 388,823 $399,265
Total Assets $ 612,264 $ 720,555 $ 757,982 $ 824,348 $ 854,283 $ 889,070 $ 947,443 $1,083,158
Liabilities & Net Assets
Long Term Debt $ 220,741 $ 318,484 $ 281,734 $ 339,114 $ 336,885 $ 323,238 $ 312,004 $391,746
Unrestricted Net Asset $ 258,071 $ 252,679 $ 287,581 $ 300,126 $ 310,560 $ 364,366 $ 380,614 $426,287

26
CFNI’s Income Statement Characterized by Accelerating
Profitability
As a result of strong top line growth and timely cost containment, CFNI was able to grow its operating profitability from
$13.2 million in FY 06 to $37.5 million in FY 2013. FY 2011 would have been $23.5 without EPIC expenses
Net Patient Revenue & Total Operating Revenue in 2011, 2012, and 2013 is net of bad debt. All earlier years bad
debt was in expenses.
Medicaid is paid at Medicare rate starting in fiscal 2012 offset by a Medicaid Assessment Fee this is a part of the DSH
program. Notes: Investment income included in net non-operating income. Net Patient Revenue excludes capitation revenue
Income Statement ($000s)
2006 2007 2008 2009 2010 2011 2012 2013
Net Patient Revenue $ 563,714 $ 586,478 $ 633,538 $ 676,258 $ 727,811 $ 721,762 $ 804,823 $ 824,041
Dis. Share Payments $ 9,858 $ 9,613 $ 24,911 $ 13,185 $ 12,000 $ 12,000 $ 48,861 $ 53,845
Total Operating Revenue $ 596,414 $ 625,386 $ 680,894 $ 730,030 $ 786,519 $ 773,164 $ 861,436 $ 890,912
Total Operating Expenses $ 583,167 $ 610,720 $ 647,325 $ 689,108 $ 753,311 $ 761,515 $ 823,963 $ 853,450
Salaries and Benefits $ 289,811 $ 302,901 $ 318,888 $ 338,012 $ 366,039 $ 395,218 $ 409,964 $ 427,184
Supplies $ 122,583 $ 124,774 $ 136,713 $ 142,932 $ 159,164 $ 157,504 $ 154,689 $ 164,418
Depreciation & Amortization $ 39,943 $ 41,470 $ 43,830 $ 43,852 $ 44,502 $ 45,829 $ 50,500 $ 51,082
Interest Expense $ 15,206 $ 14,457 $ 17,999 $ 14,037 $ 16,964 $ 15,936 $ 15,139 $ 18,213
Medicaid Assessment fee $ 36,751 $ 38,917
Other $ 115,624 $ 127,117 $ 129,895 $ 150,275 $ 166,642 $ 147,028 $ 157,540 $ 153,636
Operating Income $ 13,247 $ 14,666 $ 33,569 $ 40,922 $ 33,209 $ 11,649 $ 37,473 $ 37,462
Net Non-Operating Income $ 4,384 $ 6,431 $ 10,801 $ 8,392 $ 12,157 $ 12,197 $ 8,879 $ 12,924
Excess Rev Over Exp $ 11,195 $ 15,923 $ 37,205 $ 41,362 $ 43,332 $ 33,289 $ 44,845 $ 39,814

27
CFNI’s Operating and Balance Sheet Metrics Consistently
Stronger than A Medians
2009 2010 2011 2012 2013 S & P
A
Operating Margin 5.61% 4.22% 1.44% 4.31% 4.20% 2.50%
EBIDA Margin 13.59% 13.38% 11.78% 12.89% 13.24% 10.60%
Operating EBIDA
Margin 13.54% 12.04% 9.10% 11.93% 11.98% 8.90%
Debt-to-Capitalization 53.05% 51.78% 47.01% 45.00 % 47.89% 43.90%
Days Cash on Hand 147.0 days 148.0 days 158.5 days 165.8 days 200.0 days 157.1 days
MADS Coverage 4.21 x 4.38 x 3.50 x 4.55 x 4.33 x 4.10 x
Operating EBIDA
MADS coverage 3.88 x 3.72 x 3.04 x 4.22 x 3.87 x N/A
Average Age of Plant 8.6 years 9.0 years 9.6 years 9.4 years 10.2 years 10.8 years
NOTE: YELLOW = CFNI outperforming ratio, LIGHT BLUE = CFNI underperforming ratio

28
CFNI’s Six Months Ended December 31, 2013 Performance Highlights ($000s)

29
Investment Strategy
A formally adopted investment policy statement governs
CFNI’s general investment pool
A primary objective of the plan is to achieve an absolute
rate of return of 6% after fees, expenses and inflation.
Changes have been made to the strategy to mitigate
impact of rising interest rates
Reduce Core and Inflation Protected Fixed Income holdings and
increase exposure to Short-term and Total Return strategies
Addition of non-investment grade securities (with cap as to
percent of total pool)
Addition of alternative investments
Rebalance the total portfolio’s allocation towards Equity and
away from Fixed Income

30
Effective Capital Structure
Notes:
1) Excludes capital leases
2) Includes capital leases
Capital Structure: all fixed rate, no swaps
Fixed$375.962mm
100%
Variable$0.000mm
0%
Daily$0.000mm
0%
Projected Debt Service (2)
$0.0
$5.0
$10.0
$15.0
$20.0
$25.0
$30.0
$ in
Mill
ion
s
Series 2007 Commercial Loan Commercial Loan Series 2012 Series 2013 Capital Leases
Series (1)
Par Out.
($000)
Underlying
Structure
Bond
Maturity
Cost of
Capital
Series 2007 124,670 Fixed 2037 5.499%
Taxable Commercial Loan 18,785 Fixed 2025 5.400%
Taxable Commercial Loan 35,965 Fixed 2025 3.000%
Series 2012 171,130 Fixed 2041 4.797%
Series 2013 Placement 25,412 Fixed 2037 3.800%
Total $375,962 Par WACC 4.821%
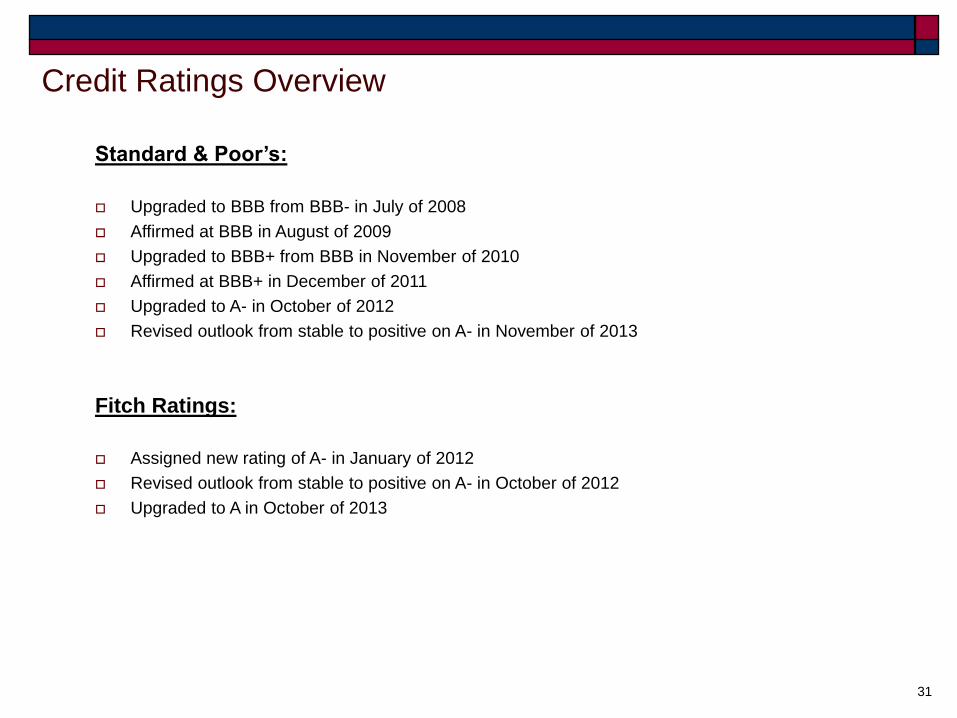
31
Standard & Poor’s:
Upgraded to BBB from BBB- in July of 2008
Affirmed at BBB in August of 2009
Upgraded to BBB+ from BBB in November of 2010
Affirmed at BBB+ in December of 2011
Upgraded to A- in October of 2012
Revised outlook from stable to positive on A- in November of 2013
Fitch Ratings:
Assigned new rating of A- in January of 2012
Revised outlook from stable to positive on A- in October of 2012
Upgraded to A in October of 2013
Credit Ratings Overview

32
Sound management strategies have led to financial success
Strong focus on quality paying dividends
Patient satisfaction scores show continued and steady improvement and correlate with outstanding operating performance and rating upgrade trend: 18% patient satisfaction in 1Q07 growing to 79% in 2Q14
Strong physician relationships, revenue diversity, risk dispersion and scale position CFNI to respond favorably to evolving healthcare landscape
FY 2013 results include EBIDA of 13.24%, operating margin of 4.2% and cash growth to 200 days; all of which exceed ‘A’ system medians
Driven by strong utilization and intelligent capital investment, CFNI has generated uncommon revenue growth over period of several years
Expansion to Valparaiso an early success
Promotes growth to an area where 70% of population is covered by commercial insurance
Helps offset business lines facing reimbursement pressures
Sound balance sheet management by deep and experienced senior management team
Prudent capital investment for revenue accretive projects
Maintain very little risk in capital structure and conservative investment strategy. Allowed CFNI to navigate financial crisis with minimal devaluation and no use of variable rate debt or swaps protect strong and growing balance sheet
Effective managed care contracting strategy
Appropriate and rationally aggressive use of leverage as market leader in NW Indiana
Organization represents value to insurance payers
Increases probability of strong future cash flow