healthgrades sixth annual
TRANSCRIPT


© Copyright 2009 Health Grades, Inc. All rights reserved. May not be reprinted or reproduced without permission from Health Grades, Inc
HealthGrades Sixth Annual Patient Safety in American Hospitals Study April 2009
In this sixth annual study, HealthGrades identifies patient safety incidence rates among Medicare patients at virtually all of the nation’s 5,000 non-federal hospitals. Additionally, HealthGrades identifies the best-performing hospitals to establish a best-practice benchmark against which other hospitals can be evaluated (Appendix A lists these best-performing hospitals). This study also examines trends in important patient safety issues among the nation’s hospitals. Specific results for each of the nation’s non-federal hospitals can be found at www.healthgrades.com.
Executive Summary For the sixth consecutive year, HealthGrades has analyzed patient safety among Medicare patients in all U.S. hospitals based on 15 indicators of patient safety. Patient safety has been an area of intense focus for hospitals over the last several years. In particular, hospitals have increasingly implemented strategies aimed at reducing preventable patient safety events. Of the nearly 5,000 hospitals nationwide, approximately 4,000 participated in the Institute for Healthcare Improvement (IHI) 5 Million Lives Campaign consisting of 12 strategies to reduce unintended harm to patients.1
While U.S. hospitals are diligently working to adopt safe practices, the federal government is also encouraging hospitals to adopt these safe practices by establishing a zero-tolerance policy for preventable hospital-acquired complications. As of October 2008, the Centers for Medicare and Medicaid (CMS) no longer reimburse hospitals for the care of 11 conditions if they are a direct result of the hospitalization. Nine additional conditions may be added to the list in the fall of 2009.2
With all this emphasis on patient safety in U.S. hospitals, consumers should be encouraged about the steps being taken to prevent medical mistakes. While hospitals have made progress, medical mistakes still occur at an alarming rate. The IHI estimates 40,000 instances of medical harm occur in the healthcare delivery system daily.1 For this reason, HealthGrades independently analyzes U.S. hospitals’ historical patient safety performance and makes that information available to patients and their families to consider when making difficult healthcare decisions.
HealthGrades used patient safety indicators from the Agency for Healthcare Research and Quality (AHRQ)3 to identify the patient safety incidence rates for every non-federal hospital in the country using three years of Medicare data (2005–2007). In addition to identifying the rates of patient safety events, HealthGrades created a composite score to identify the best-performing hospitals in the U.S. from 2005 through 2007. These hospitals were recognized with the HealthGrades 2009 Patient Safety Excellence AwardTM.
The Institute for Healthcare
Improvement estimates 40,000
instances of medical harm
occur in the healthcare
delivery system daily.

© Copyright 2009 Health Grades, Inc. All rights reserved. May not be reprinted or reproduced without permission from Health Grades, Inc
HealthGrades Patient Safety in American Hospitals Study 2009 - 2
Summary of Findings The Agency for Healthcare Research and Quality (AHRQ) developed the patient safety indicators (PSIs) based on the Institute of Medicine’s definition of patient safety—“freedom from accidental injury due to medical care, or medical errors.”4 Medical error is defined as “the failure of a planned action to be completed as intended or the use of a wrong plan to achieve an aim…[including] problems in practice, products, procedures, and systems.”5
In 2002 AHRQ, in collaboration with the University of California–Stanford Evidence-Based Practice Center, identified 20 indicators of potentially preventable patient safety events that could be readily identified in hospital discharge data. This tool set of 20 evidence-based PSIs was created and released to the public in 2003 to be used by various healthcare stakeholders to assess and improve patient safety in U.S. hospitals.3
For the first part of this study, HealthGrades used the Patient Safety Indicator QI Windows Software, version 3.2, developed by AHRQ.3 In addition to the PSI software application, HealthGrades used previous research by Zhan and Miller6 to study the attributable mortality and cost associated with each of 15 PSIs among Medicare beneficiaries from 2005 through 2007. The 15 PSIs we studied are listed in Appendix B. (Four obstetrics indicators and absence of foreign body indicator were not used in this study.)
For the second part of this study, using the rates calculated for 12 of the 15 PSIs studied (three are for regional use only and thus excluded from the comparative hospital analysis), we also calculated an overall patient safety composite score for each hospital to identify the best-performing hospitals in the U.S. from 2005 through 2007 (see Appendices A and C). These best-performing hospitals were recognized with the HealthGrades 2009 Patient Safety Excellence AwardTM.
From 2005 through 2007:
• There were 913,215 total patient safety events among 864,765 Medicare beneficiaries which represents 2.3 percent of the nearly 38 million Medicare hospitalizations.
• These patient safety events were associated with over $6.9 billion of excess cost. • The overall incidence rate remained virtually unchanged compared to last year’s study
(except the failure to rescue indicator for which there were major methodological changes). • Eight indicators showed improvement over the course of the study.
• Complications of anesthesia, death in low mortality DRGs, failure to rescue, iatrogenic pneumothorax, selected infections due to medical care, post-operative hip fracture, post-operative hemorrhage or hematoma, and transfusion reaction showed improvement ranging from 2.3 percent to 52.0 percent.
• These eight indicators accounted for 14.5 percent of the total patient safety events during the study period.
• Seven indicators worsened over the course of the study. • Decubitus ulcer (bed sores), post-operative physiological and metabolic derangements,
post-operative respiratory failure, post-operative pulmonary embolism (potentially fatal blood clots forming in the lungs) or deep vein thrombosis (blood clots in the legs), post-operative sepsis, post-operative abdominal wound dehiscence, and accidental puncture or laceration all worsened with changes ranging from a one-percent increase in events to 23.4 percent.
• These seven indicators accounted for 85.5 percent of the total patient safety events during the study period.
Patient safety events cost the
federal Medicare program $6.9
billion and resulted in 92,882
potentially preventable deaths from 2005 through
2007.

© Copyright 2009 Health Grades, Inc. All rights reserved. May not be reprinted or reproduced without permission from Health Grades, Inc
HealthGrades Patient Safety in American Hospitals Study 2009 - 3
• Medical errors with the highest incidence rates were failure to rescue (death among surgical inpatients with serious treatable complications), decubitus ulcer, post-operative respiratory failure, and post-operative sepsis. The event rates per 1,000 patients were: 96.2, 32.0, 17.2, and 14.9 respectively (see Appendix D).
• There were 97,755 actual inhospital deaths that occurred among patients who experienced one or more of the 15 patient safety events (Appendix D). • Note: In last year’s study, failure to rescue accounted for 188,329 patient deaths.7 Major
changes to this indicator (i.e., no longer including non-surgical patients or patients with acute renal failure) account for the drastic drop in mortality from last year’s study, making any conclusion about overall improvement between the two study periods problematic.
• Medicare patients who experienced one or more of the 15 patient safety events had approximately a one-in-ten chance of dying as a result of an event from 2005 through 2007.
• Applying previous research conducted by Zhan and Miller, 92,882 of these deaths could be directly attributable to a patient safety event.
• Wide and highly significant gaps in individual PSIs and overall performance exist between hospitals that were recognized with a Patient Safety Excellence Award™ versus bottom-ranked hospitals. • Medicare patients treated at hospitals recognized with a Patient Safety Excellence
Award™ had, on average, a 43-percent lower risk of experiencing one or more of the PSIs studied compared to patients treated at bottom-ranked hospitals (range: 30.04% to 52.67%, see Appendix F).
• If all hospitals had performed at the level of hospitals recognized with a Patient Safety Excellence Award™, approximately 211,697 patient safety events and 22,771 Medicare deaths could potentially have been avoided while saving the U.S. healthcare system approximately $2.0 billion from 2005 through 2007 (see Appendix F).
Methodology Brief HealthGrades used Medicare inpatient data from the Medicare Provider Analysis Review (MedPAR) data file (purchased from CMS; 2005 through 2007 data) and Patient Safety Indicator software (QI Windows Software, version 3.2) from AHRQ.
1 We first calculated the national rates for 15 of the 20 AHRQ PSIs—four of the obstetrics indicators and absence of foreign body left in during procedure indicator were not used (see Appendix B for a listing of indicators).
2 Secondly, in order to evaluate overall hospital performance and identify the best-performing hospitals for patient safety across the U.S., we used the same software to evaluate every hospital in the country on 12 PSIs (see Appendix C for a listing of indicators). To minimize the potential impact of variations in hospital coding of specific E-codes, we excluded three PSIs (complications of anesthesia, accidental puncture or laceration, and transfusion reaction) that included these specific E-codes in their numerator definition. We also excluded absence of foreign body, as changes to the AHRQ software now require a present on admission flag which isn’t available in the Medicare 2005 – 2007 data.
If all hospitals had performed at the
level of Patient Safety Excellence
Award™ hospitals, approximately
211,697 patient safety events and 22,771 Medicare
deaths could have been avoided,
saving approximately
$2.0 billion from 2005 through
2007.
Medicare patients who experienced
one or more patient safety events had a
one-in-ten chance of dying
from 2005 through 2007.

© Copyright 2009 Health Grades, Inc. All rights reserved. May not be reprinted or reproduced without permission from Health Grades, Inc
HealthGrades Patient Safety in American Hospitals Study 2009 - 4
3 We then developed a ranking methodology to evaluate overall patient safety performance for hospitals having a measure in a minimum of nine out of 12 indicators. In addition, hospitals had to be rated in at least 16 of 26 HealthGrades cohorts and have a current overall HealthGrades star rating of at least 2.5. These eligible hospitals’ relative performances were determined by calculating the z-score for each patient safety indicator and then averaging the 12 z-scores. These averaged z-scores by hospital were then rank ordered within their respective peer group (teaching and non-teaching) from most positive (best) to most negative (worst). The top 15 percent of eligible hospitals were identified as Patient Safety Excellence Award™ recipients (see Appendix C for complete details). This final group of 242 hospitals represents less than five percent of the nation’s nearly 5,000 hospitals initially studied.
4 Lastly, mortality and cost attributable to patient safety events were extrapolated using attributable charge and mortality associated with the development of a patient safety event from previous PSI research by Zhan and Miller.6
Detailed Findings
Patient Safety Events are Common in U.S. Hospitals HealthGrades identified a total of 913,215 patient safety events that occurred in 38,227,561 acute care hospitalizations in the Medicare population from 2005 through 2007 (see Appendix D). These events occurred among 864,765 unique patients. This means that among hospitalized Medicare patients, 2.26 percent experienced one or more of the 15 patient safety events. Medicare patients who experienced one or more patient safety events had a one-in-ten chance of dying. In fact, there were 97,755 actual inhospital deaths that occurred among patients who experienced one or more of the 15 patient safety events.
In last year’s study, the number of inhospital deaths attributable to patient safety events was almost 200,000.7 However, AHRQ redefined the failure to rescue indicator (no longer including non-surgical patients or patients with acute renal failure) which reduced the number of patients studied for this indicator from 1.5 million to 154,892. Excluding the failure to rescue indicator, there was virtually no change in the rate per 1,000 for each of the indicators studied compared to last year’s study.7
Common Patient Safety Events are Very Costly Three PSIs with the highest incidence rates – failure to rescue, decubitus ulcer, and post-operative respiratory failure – accounted for 57.80 percent of all patient safety events from 2005 through 2007 (see Table 1 below). Failure to rescue rates improved 5.54 percent during the study period while both decubitus ulcer and post-operative respiratory failure worsened by 7.78 and 2.45 percent respectively. For the incidence rates and associated rate change of all 15 PSIs, see Appendix D. For the excess mortality and costs attributable to each PSI, see Appendix E.
Table 1: Most Commonly Occurring Patient Safety Indicators per 1,000 At-Risk Hospitalizations
Patient Safety Indicator
Incidence Rate per 1,000 At-Risk Hospitalizations
Excess Cost Attributable to
PSI (Billion) Failure to rescue 96 NA* Decubitus ulcer 32 $2.41 Post-operative respiratory failure 17 $1.82
* By definition, all patients with the event died and were excluded from Zhan and Miller’s analysis on attributable mortality and cost associated with PSIs.
Medicare patients who experienced
one or more patient safety
events had a one-in-ten chance of dying from 2005
through 2007.

© Copyright 2009 Health Grades, Inc. All rights reserved. May not be reprinted or reproduced without permission from Health Grades, Inc
HealthGrades Patient Safety in American Hospitals Study 2009 - 5
Patient safety events are not only common, but costly. Using cost numbers from the Zhan and Miller research, we estimate that the 15 patient safety indicators studied cost the U.S. healthcare system $6.9 billion from 2005 through 2007 (see Appendix E). The two most common indicators, decubitus ulcer and post-operative respiratory failure, accounted for 61.2 percent of this $6.9 billion.
Less Improvement Seen Among Most Common Events Eight of 15 PSIs studied showed improvement from 2005 through 2007 (complications of anesthesia, death in low mortality DRGs, failure to rescue, iatrogenic pneumothorax, selected infections due to medical care, post-operative hip fracture, post-operative hemorrhage or hematoma, and transfusion reaction). These eight indicators improved, on average, 14.06 percent (range: 2.27% to 51.99%). Complications of anesthesia, failure to rescue, death in low mortality DRGs, and selected infections due to medical care were associated with the greatest improvements in 2007 compared to 2005, excluding the relative improvement associated with the very rare occurrence of transfusion reaction (see Appendix D). While these indicators showed improvement over the study period, these indicators combined accounted for only 14.51 percent of the total patient safety events.
Seven indicators (decubitus ulcer, post-operative physiologic and metabolic derangements, post-operative respiratory failure, post-operative pulmonary embolism or deep vein thrombosis, post-operative sepsis, post-operative abdominal wound dehiscence, and accidental puncture or laceration) showed worsening in 2007 when compared to 2005 (range: -23.40% to -0.59%) (see Appendix D). These seven indicators combined account for 85.49 percent of all the patient safety events during the study period.
Approximately One-in-Ten Medicare Patients with Patient Safety Events Died There were 97,755 actual inhospital deaths that occurred among patients who experienced one or more of the 15 patient safety events (Appendix D). These deaths represent all-cause mortality among patients that experienced one or more of these patient safety events. To examine the direct relationship between the event and mortality, we utilized previous work by Zhan and Miller6 to calculate the deaths directly attributed to these patient safety events. Applying Zhan and Miller’s research to the patient safety event rate, we estimate that 92,882 deaths could potentially have been avoided. This translates to a 10.74 percent potentially preventable mortality rate among hospitalized Medicare patients who experienced at least one patient safety event from 2005 through 2007 (see Appendix E).
Large Safety Gaps Identified Between Poorest- and Best-Performing Hospitals The first part of this study examined the overall impact of 15 patient safety indicators across the nation’s hospitals. The second part of this study identified the best-performing hospitals to establish a best-practice benchmark against which other hospitals could be evaluated. Best-performing hospitals were identified as the top 15 percent of ranked hospitals based on overall hospital performance and were recognized with the HealthGrades 2009 Patient Safety Excellence Award™.
To be considered for the overall patient safety performance assessment, hospitals had to be rated in nine of the 12 PSIs used in the study, be full service hospitals (rated in at least 16 of 26 HealthGrades cohorts), and have a current overall HealthGrades star rating of at least 2.5, with 5.0 being the best possible overall star rating. (For more details, see HealthGrades Hospital Report Cards™ Mortality and Complication Based Outcome Methodology at www.healthgrades.com.)
Eight patient safety indicators
showed improvement
while seven indicators
worsened in 2007 compared to
2005.

© Copyright 2009 Health Grades, Inc. All rights reserved. May not be reprinted or reproduced without permission from Health Grades, Inc
HealthGrades Patient Safety in American Hospitals Study 2009 - 6
The final ranking set included 749 teaching hospitals and 862 non-teaching hospitals. The top 15 percent, or 242 hospitals, were recognized with the HealthGrades 2009 Patient Safety Excellence Award™. These best-performing hospitals represent less than five percent of all U.S. hospitals examined in this study (see Appendices A and C).
Table 2: Best-Performing Hospitals by Hospital Type
Hospital Type
Number of Best-Performing Hospitals (Patient Safety Excellence Award™ Recipients)
Teaching Hospitals 112 Non-teaching Hospitals 130
We found that there were wide, highly significant gaps in individual PSI and overall performance between the hospitals recognized with the HealthGrades 2009 Patient Safety Excellence Award™ and the bottom-ranked hospitals. More specifically, we found that Patient Safety Excellence Award hospitals, as a group, significantly outperformed the bottom 15 percent hospitals on every PSI. We also found that Patient Safety Excellence Award hospitals, as a group, had an overall patient safety performance equating to, on average, a 42.82 percent lower risk of experiencing one or more patient safety events compared to the bottom 15 percent hospitals (see Appendix F). This finding of better performance was consistent across all 12 PSIs studied (range: 30.04% to 52.67% relative risk decrease) (see Appendix F).
Patient Safety Excellence Award™ Hospitals Associated with Significantly Fewer Safety Events, Associated Deaths and Cost If all hospitals had performed at the level of Patient Safety Excellence Award™ hospitals, approximately 211,697 patient safety events and 22,771 Medicare deaths could have been avoided while saving the U.S. approximately $2.0 billion from 2005 through 2007 (see Appendix F).
Interpretation of Results While many U.S. hospitals have taken extensive action to prevent medical errors, patient safety events are still common in U.S. hospitals. In this study, there were 913,215 patient safety events among Medicare beneficiaries from 2005 through 2007. While over half of the indicators studied showed improvement, the most commonly occurring events showed worsening rates during the three-year study period, indicating that there is still much work to be done.
The prevalence of likely preventable patient safety events is taking a costly toll on our healthcare systems—in both lives and dollars. Consider that in this study approximately two percent of Medicare patients experienced a preventable patient safety event during a hospitalization from 2005 through 2007. This two percent represents only 15 potential patient safety events. These 15 medical errors alone cost the federal Medicare program $6.9 billion and resulted in 92,882 potentially preventable deaths.
In a recent AHRQ survey about patient safety culture, caregivers from 519 hospitals, reported that:
• Mistakes made and caught before there was harm to the patient were reported 51 percent of the time.
• Mistakes made that were perceived to have no harm to the patient were reported 55 percent of the time.
• Mistakes that could harm the patient were reported 73 percent of the time.8
The top 15 percent, or 242 hospitals, were
recognized with a HealthGrades
2009 Patient Safety Excellence
Award™.
Patients treated at best-performing
hospitals had, on average, a 43% lower chance of
experiencing one or more medical
errors compared to poorest-performing
hospitals.
If all hospitals had performed at the
level of Patient Safety Excellence
Award™ hospitals, approximately
211,697 patient safety events and 22,771 Medicare
deaths could have been avoided,
saving approximately
$2.0 billion from 2005 - 2007.

© Copyright 2009 Health Grades, Inc. All rights reserved. May not be reprinted or reproduced without permission from Health Grades, Inc
HealthGrades Patient Safety in American Hospitals Study 2009 - 7
From this, one can surmise that the true impact of patient safety events in U.S. hospitals is much larger than this study represents. The 97,755 deaths and $6.9 billion likely represent a fraction of the number of avoidable patient safety deaths and associated costs. For this reason, patient safety continues to be an important focus for hospitals across the nation, national organizations such as IHI, and the federal government.
Additionally, in the AHRQ study, 60 percent of participants also reported that it is just by chance that more serious mistakes don’t happen in their hospital.8 Preventing mistakes by chance is no longer acceptable. When patients enter the healthcare system, they entrust their health and their lives to their caregivers. The healthcare system must continue to put systematic safe practices in place to ensure that the system created to save them doesn’t unintentionally harm them. Hospitals must continue to study patient safety, design and enhance patient safety processes until there are zero events, and recognize that a two-percent error rate can no longer be status quo. Hospitals must also look to and learn from the leading hospitals – those hospitals with the lowest patient safety event rates.
Rather than rely on chance, hospitals can look to Patient Safety Excellence Award™ hospitals as a benchmark. Medicare patients treated at these hospitals have a 42.82 percent lower probability of experiencing a patient safety event. This doesn’t happen by chance.
If all U.S. hospitals had performed at the same level as the Patient Safety Excellence Award™ hospitals, the U.S. healthcare system could have saved $2 billion and potentially prevented 22,771 deaths in just three years among Medicare cases alone.
© Copyright 2009 Health Grades, Inc. All rights reserved. May not be reprinted or reproduced without permission from Health Grades, Inc
HealthGrades Patient Safety in American Hospitals Study 2009 - 8
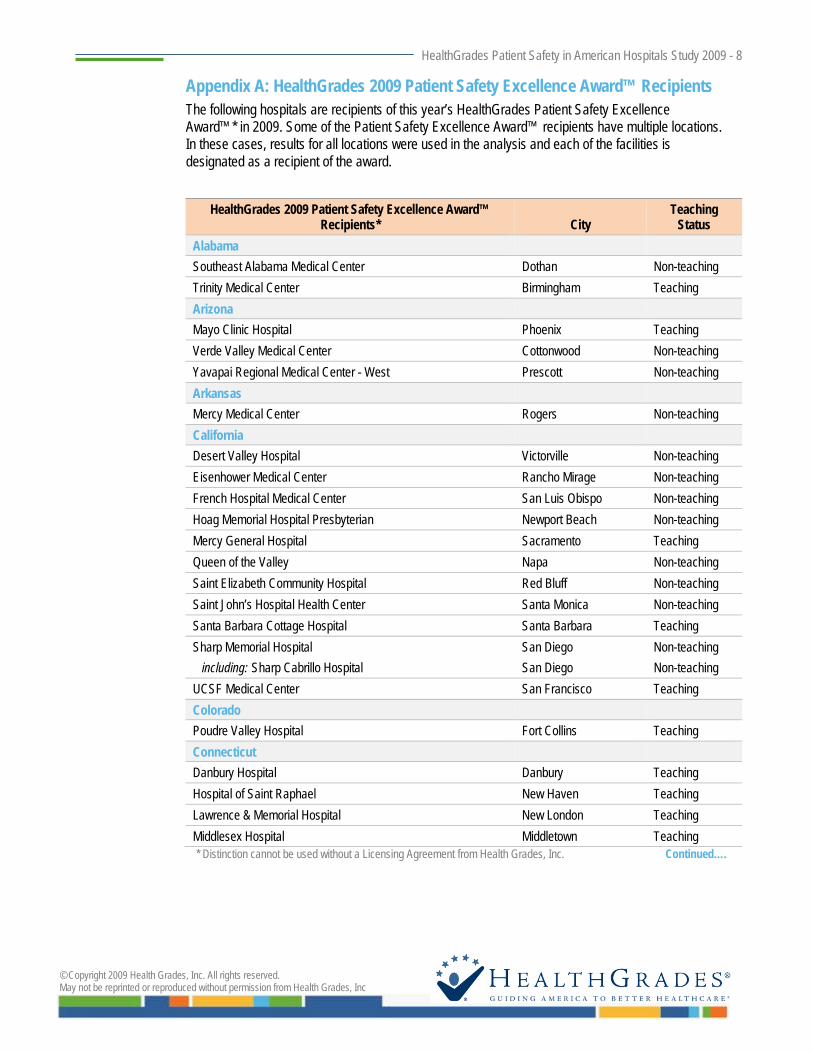
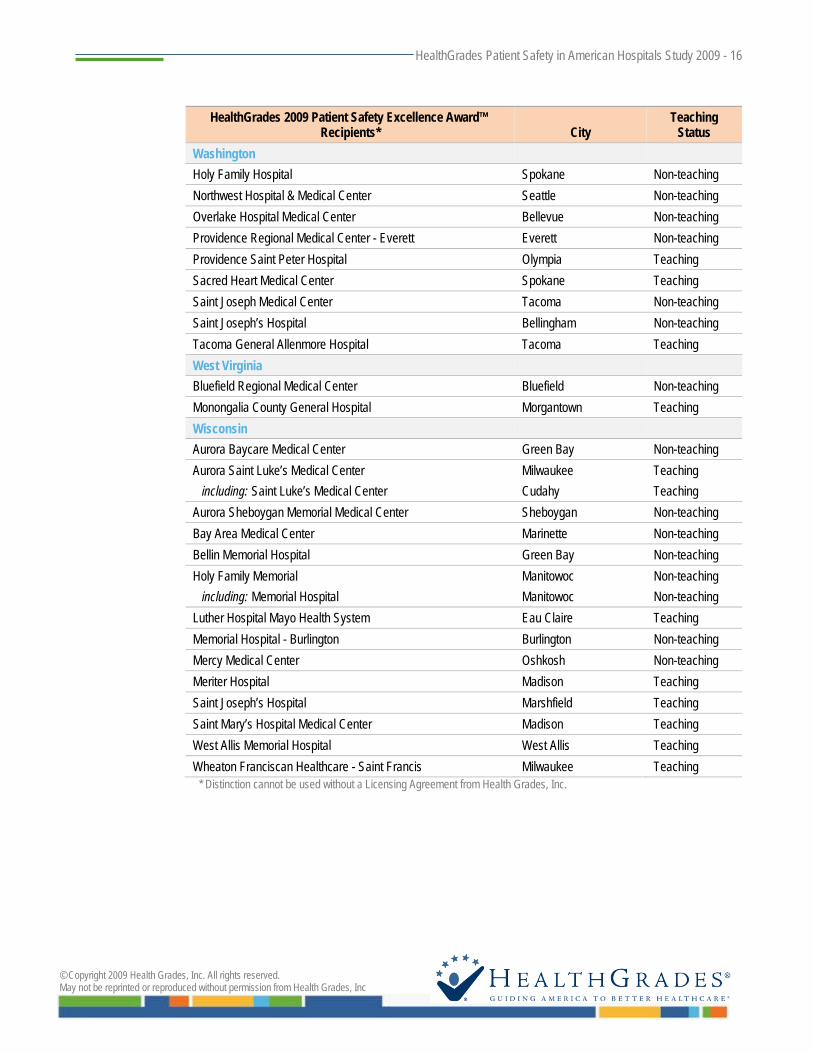
Appendix A: HealthGrades 2009 Patient Safety Excellence Award™ Recipients The following hospitals are recipients of this year’s HealthGrades Patient Safety Excellence Award™* in 2009. Some of the Patient Safety Excellence Award™ recipients have multiple locations. In these cases, results for all locations were used in the analysis and each of the facilities is designated as a recipient of the award.
HealthGrades 2009 Patient Safety Excellence Award™ Recipients* City
Teaching Status
Alabama Southeast Alabama Medical Center Dothan Non-teaching Trinity Medical Center Birmingham Teaching Arizona Mayo Clinic Hospital Phoenix Teaching Verde Valley Medical Center Cottonwood Non-teaching Yavapai Regional Medical Center - West Prescott Non-teaching Arkansas Mercy Medical Center Rogers Non-teaching California Desert Valley Hospital Victorville Non-teaching Eisenhower Medical Center Rancho Mirage Non-teaching French Hospital Medical Center San Luis Obispo Non-teaching Hoag Memorial Hospital Presbyterian Newport Beach Non-teaching Mercy General Hospital Sacramento Teaching Queen of the Valley Napa Non-teaching Saint Elizabeth Community Hospital Red Bluff Non-teaching Saint John’s Hospital Health Center Santa Monica Non-teaching Santa Barbara Cottage Hospital Santa Barbara Teaching Sharp Memorial Hospital San Diego Non-teaching including: Sharp Cabrillo Hospital San Diego Non-teaching UCSF Medical Center San Francisco Teaching Colorado Poudre Valley Hospital Fort Collins Teaching Connecticut Danbury Hospital Danbury Teaching Hospital of Saint Raphael New Haven Teaching Lawrence & Memorial Hospital New London Teaching Middlesex Hospital Middletown Teaching
* Distinction cannot be used without a Licensing Agreement from Health Grades, Inc. Continued….

© Copyright 2009 Health Grades, Inc. All rights reserved. May not be reprinted or reproduced without permission from Health Grades, Inc
HealthGrades Patient Safety in American Hospitals Study 2009 - 9
HealthGrades 2009 Patient Safety Excellence Award™ Recipients* City
Teaching Status
Florida Boca Raton Community Hospital Boca Raton Non-teaching Doctors Hospital of Sarasota Sarasota Non-teaching Flagler Hospital Saint Augustine Non-teaching Florida Hospital - Orlando Orlando Teaching including: Winter Park Memorial Hospital Winter Park Teaching Holy Cross Hospital Fort Lauderdale Non-teaching Indian River Medical Center Vero Beach Non-teaching JFK Medical Center Atlantis Teaching Manatee Memorial Hospital Bradenton Non-teaching Mercy Hospital Miami Teaching Morton Plant Hospital Clearwater Teaching Morton Plant Mease Healthcare Countryside Safety Harbor Non-teaching Munroe Regional Medical Center Ocala Non-teaching NCH Healthcare System Naples Non-teaching Palm Beach Gardens Medical Center Palm Beach Gardens Non-teaching Saint Luke's Hospital Jacksonville Teaching Sarasota Memorial Hospital Sarasota Non-teaching Venice Regional Medical Center Venice Non-teaching Georgia Athens Regional Medical Center Athens Non-teaching Houston Medical Center Warner Robins Non-teaching Memorial Health University Medical Center Savannah Teaching Northeast Georgia Medical Center Gainesville Non-teaching including: Northeast Georgia Medical Center - Lanier Park Campus Gainesville Non-teaching Northside Hospital Atlanta Non-teaching Piedmont Fayette Hospital Fayetteville Non-teaching Piedmont Hospital Atlanta Teaching Saint Joseph's Hospital of Atlanta Atlanta Non-teaching Idaho Saint Joseph Regional Medical Center Lewiston Non-teaching Saint Luke’s Regional Medical Center Boise Teaching
* Distinction cannot be used without a Licensing Agreement from Health Grades, Inc. Continued….

© Copyright 2009 Health Grades, Inc. All rights reserved. May not be reprinted or reproduced without permission from Health Grades, Inc
HealthGrades Patient Safety in American Hospitals Study 2009 - 10
HealthGrades 2009 Patient Safety Excellence Award™ Recipients* City
Teaching Status
Illinois Alton Memorial Hospital Alton Non-teaching Central DuPage Hospital Winfield Non-teaching Elmhurst Memorial Hospital Elmhurst Non-teaching St. Mary’s Good Samaritan Mount Vernon Non-teaching Morris Hospital and Healthcare Centers Morris Non-teaching Northwest Community Hospital Arlington Heights Non-teaching Palos Community Hospital Palos Heights Non-teaching Provena Covenant Medical Center Urbana Teaching Provena St. Mary’s Hospital Kankakee Teaching Riverside Medical Center Kankakee Non-teaching Rockford Memorial Hospital Rockford Non-teaching Saint Anthony's Health Center Alton Non-teaching including: Saint Joseph’s Hospital Alton Non-teaching Saint Anthony’s Memorial Hospital Effingham Non-teaching Saint John’s Hospital Springfield Teaching Indiana Clark Memorial Hospital Jeffersonville Teaching Community Hospital Munster Non-teaching Deaconess Hospital Evansville Teaching Lutheran Hospital of Indiana Fort Wayne Teaching Memorial Hospital and Health Care Center Jasper Non-teaching Memorial Hospital of South Bend South Bend Teaching Saint Anthony Medical Center of Crown Point Crown Point Teaching Saint Joseph Regional Medical Center - South Bend South Bend Teaching Iowa Great River Medical Center West Burlington Non-teaching Iowa Methodist Medical Center Des Moines Teaching Mercy Medical Center of Clinton Clinton Non-teaching Mercy Medical Center - Dubuque Dubuque Non-teaching Mercy Medical Center - North Iowa Mason City Teaching Kansas Hays Medical Center Hays Non-teaching Via Christi Regional Medical Center Wichita Teaching including: Saint Joseph Medical Center Wichita Teaching
* Distinction cannot be used without a Licensing Agreement from Health Grades, Inc. Continued….

© Copyright 2009 Health Grades, Inc. All rights reserved. May not be reprinted or reproduced without permission from Health Grades, Inc
HealthGrades Patient Safety in American Hospitals Study 2009 - 11
HealthGrades 2009 Patient Safety Excellence Award™ Recipients* City
Teaching Status
Kentucky ARH Regional Medical Center - Hazard Hazard Teaching St. Elizabeth Medical Center Edgewood Teaching Western Baptist Hospital Paducah Non-teaching Louisiana Lafayette General Medical Center Lafayette Non-teaching Rapides Regional Medical Center Alexandria Teaching St. Francis Medical Center Monroe Non-teaching Terrebonne General Hospital Houma Non-teaching Willis Knighton Medical Center Shreveport Teaching Maryland Sacred Heart Hospital Cumberland Non-teaching Saint Joseph Medical Center Towson Non-teaching Washington County Hospital Hagerstown Non-teaching Massachusetts Brigham and Women's Hospital Boston Teaching Cooley Dickinson Hospital Northampton Non-teaching Massachusetts General Hospital Boston Teaching Newton-Wellesley Hospital Newton Teaching North Shore Medical Center - Salem Hospital Salem Teaching including: North Shore Medical Center - Union Hospital Lynn Teaching Michigan Allegiance Health Jackson Non-teaching Alpena Regional Medical Center Alpena Non-teaching Crittenton Hospital Medical Center Rochester Non-teaching Genesys Regional Medical Center Grand Blanc Teaching Hackley Hospital Muskegon Non-teaching Holland Hospital Holland Non-teaching Marquette General Hospital Marquette Teaching McLaren Regional Medical Center Flint Teaching MidMichigan Medical Center - Midland Midland Teaching Munson Medical Center Traverse City Teaching Oakwood Heritage Hospital Taylor Non-teaching Port Huron Hospital Port Huron Non-teaching
* Distinction cannot be used without a Licensing Agreement from Health Grades, Inc. Continued….

© Copyright 2009 Health Grades, Inc. All rights reserved. May not be reprinted or reproduced without permission from Health Grades, Inc
HealthGrades Patient Safety in American Hospitals Study 2009 - 12
HealthGrades 2009 Patient Safety Excellence Award™ Recipients* City
Teaching Status
Minnesota Abbott - Northwestern Hospital Minneapolis Teaching Fairview Southdale Hospital Edina Non-teaching Healtheast Saint John's Hospital Maplewood Teaching Mercy Hospital Coon Rapids Teaching Methodist Hospital Minneapolis Teaching Ridgeview Medical Center Waconia Non-teaching Saint Cloud Hospital Saint Cloud Teaching Saint Joseph's Hospital Saint Paul Teaching Saint Luke’s Hospital Duluth Teaching United Hospitals Saint Paul Teaching Mississippi Jeff Anderson Regional Medical Center Meridian Non-teaching North Mississippi Medical Center Tupelo Teaching Missouri Boone Hospital Center Columbia Non-teaching Heartland Regional Medical Center St. Joseph Non-teaching Jefferson Memorial Hospital Crystal City Non-teaching Missouri Baptist Medical Center Saint Louis Teaching North Kansas City Hospital North Kansas City Non-teaching Northeast Regional Medical Center Kirksville Teaching including: Grim-Smith Hospital and Clinic Kirksville Teaching Saint John’s Mercy Hospital Washington Non-teaching Southeast Missouri Hospital Cape Girardeau Non-teaching Montana Benefis Health System Great Falls Non-teaching Billings Clinic Billings Teaching Kalispell Regional Hospital Kalispell Non-teaching Saint Patrick Hospital and Health Sciences Center Missoula Non-teaching including: Missoula General Hospital Missoula Non-teaching Saint Vincent Healthcare Billings Teaching Nebraska Alegent Health-Bergan Mercy Medical Center Omaha Teaching BryanLGH Medical Center - East Lincoln Teaching including: BryanLGH Medical Center - West Lincoln Teaching Fremont Area Medical Center Fremont Non-teaching Saint Elizabeth Regional Medical Center Lincoln Teaching
* Distinction cannot be used without a Licensing Agreement from Health Grades, Inc. Continued….

© Copyright 2009 Health Grades, Inc. All rights reserved. May not be reprinted or reproduced without permission from Health Grades, Inc
HealthGrades Patient Safety in American Hospitals Study 2009 - 13
HealthGrades 2009 Patient Safety Excellence Award™ Recipients* City
Teaching Status
New Jersey Jersey Shore University Medical Center Neptune Teaching Ocean Medical Center Brick Non-teaching New York Ellis Hospital Schenectady Teaching Saint Francis Hospital - Roslyn Roslyn Teaching St. Luke's Cornwall Hospital Newburgh Non-teaching North Carolina Carolinas Medical Center - Northeast Concord Teaching Halifax Regional Medical Center Roanoke Rapids Non-teaching Margaret R Pardee Memorial Hospital Hendersonville Teaching Mission Hospitals Asheville Teaching Rex Hospital Raleigh Non-teaching North Dakota Medcenter One Bismarck Teaching Saint Alexius Medical Center Bismarck Teaching Ohio Adena Regional Medical Center Chillicothe Non-teaching Atrium Medical Center Franklin Non-teaching Bethesda North Hospital Cincinnati Teaching EMH Regional Medical Center Elyria Non-teaching Holzer Medical Center Gallipolis Non-teaching Marietta Memorial Hospital Marietta Non-teaching Mercy Franciscan Hospital - Mt Airy Cincinnati Teaching Mercy Hospital - Clermont Batavia Non-teaching Mercy Medical Center Canton Teaching Mount Carmel Health Columbus Teaching Saint Elizabeth Health Center Youngstown Teaching Saint John West Shore Hospital Westlake Teaching St. Luke's Hospital Maumee Non-teaching Salem Community Hospital Salem Non-teaching The Toledo Hospital Toledo Teaching Union Hospital Dover Non-teaching
* Distinction cannot be used without a Licensing Agreement from Health Grades, Inc. Continued….

© Copyright 2009 Health Grades, Inc. All rights reserved. May not be reprinted or reproduced without permission from Health Grades, Inc
HealthGrades Patient Safety in American Hospitals Study 2009 - 14
HealthGrades 2009 Patient Safety Excellence Award™ Recipients* City
Teaching Status
Oklahoma Comanche County Memorial Hospital Lawton Teaching Duncan Regional Hospital Duncan Non-teaching Midwest Regional Medical Center Midwest City Non-teaching Saint Mary's Regional Medical Center Enid Non-teaching Oregon Mercy Medical Center Roseburg Non-teaching Rogue Valley Medical Center Medford Non-teaching Sacred Heart Medical Center - University District Eugene Non-teaching Saint Charles Medical Center - Bend Bend Teaching Pennsylvania Doylestown Hospital Doylestown Non-teaching Ephrata Community Hospital Ephrata Non-teaching Evangelical Community Hospital Lewisburg Non-teaching Geisinger South Wilkes-Barre Wilkes Barre Teaching Grand View Hospital Sellersville Non-teaching Hamot Medical Center Erie Teaching Hazleton General Hospital Hazleton Non-teaching Indiana Regional Medical Center Indiana Non-teaching Lancaster General Hospital Lancaster Teaching Lehigh Valley Hospital Allentown Teaching Mercy Hospital - Scranton Scranton Teaching Pennsylvania Hospital Philadelphia Teaching Pinnacle Health System Harrisburg Teaching The Medical Center - Beaver Beaver Teaching The Reading Hospital and Medical Center Reading Teaching Uniontown Hospital Uniontown Non-teaching Williamsport Hospital & Medical Center Williamsport Teaching South Carolina AnMed Health Anderson Teaching Greenville Memorial Hospital Greenville Teaching McLeod Regional Medical Center Florence Teaching Sisters of Charity Providence Hospitals Columbia Non-teaching Waccamaw Community Hospital Murrells Inlet Non-teaching
* Distinction cannot be used without a Licensing Agreement from Health Grades, Inc. Continued….

© Copyright 2009 Health Grades, Inc. All rights reserved. May not be reprinted or reproduced without permission from Health Grades, Inc
HealthGrades Patient Safety in American Hospitals Study 2009 - 15
HealthGrades 2009 Patient Safety Excellence Award™ Recipients* City
Teaching Status
South Dakota Avera McKennan Hospital and University Health Center Sioux Falls Teaching Sanford USD Medical Center Sioux Falls Teaching Tennessee Baptist Riverside Hospital Knoxville Non-teaching Centennial Medical Center Nashville Non-teaching Memorial Healthcare System Chattanooga Non-teaching Northcrest Medical Center Springfield Non-teaching Saint Thomas Hospital Nashville Teaching Vanderbilt University Hospital Nashville Teaching Williamson Medical Center Franklin Non-teaching Texas Baptist St. Anthony's Health System Amarillo Teaching CHRISTUS St. Michael Health System Texarkana Teaching CHRISTUS Santa Rosa Hospital - New Braunfels New Braunfels Non-teaching CHRISTUS Spohn Hospital Corpus Christi - Memorial Corpus Christi Teaching including: CHRISTUS Spohn Hospital Corpus Christi-South CHRISTUS Spohn Hospital Corpus Christi-Shoreline Southside Health Center
Corpus Christi Corpus Christi Corpus Christi
Teaching Teaching Teaching
Citizens Medical Center Victoria Non-teaching East Texas Medical Center - Athens Athens Non-teaching Hill Country Memorial Hospital Fredericksburg Non-teaching Mother Frances Hospital - Tyler Tyler Teaching Providence Healthcare Network Waco Teaching Saint David’s Hospital Austin Non-teaching San Angelo Community Medical Center San Angelo Non-teaching United Regional Healthcare System Wichita Falls Teaching Valley Baptist Medical Center Harlingen Teaching Virginia Martha Jefferson Hospital Charlottesville Non-teaching Winchester Medical Center Winchester Teaching
* Distinction cannot be used without a Licensing Agreement from Health Grades, Inc. Continued….
© Copyright 2009 Health Grades, Inc. All rights reserved. May not be reprinted or reproduced without permission from Health Grades, Inc
HealthGrades Patient Safety in American Hospitals Study 2009 - 16
HealthGrades 2009 Patient Safety Excellence Award™ Recipients* City
Teaching Status
Washington Holy Family Hospital Spokane Non-teaching Northwest Hospital & Medical Center Seattle Non-teaching Overlake Hospital Medical Center Bellevue Non-teaching Providence Regional Medical Center - Everett Everett Non-teaching Providence Saint Peter Hospital Olympia Teaching Sacred Heart Medical Center Spokane Teaching Saint Joseph Medical Center Tacoma Non-teaching Saint Joseph’s Hospital Bellingham Non-teaching Tacoma General Allenmore Hospital Tacoma Teaching West Virginia Bluefield Regional Medical Center Bluefield Non-teaching Monongalia County General Hospital Morgantown Teaching Wisconsin Aurora Baycare Medical Center Green Bay Non-teaching Aurora Saint Luke’s Medical Center Milwaukee Teaching including: Saint Luke’s Medical Center Cudahy Teaching Aurora Sheboygan Memorial Medical Center Sheboygan Non-teaching Bay Area Medical Center Marinette Non-teaching Bellin Memorial Hospital Green Bay Non-teaching Holy Family Memorial Manitowoc Non-teaching including: Memorial Hospital Manitowoc Non-teaching Luther Hospital Mayo Health System Eau Claire Teaching Memorial Hospital - Burlington Burlington Non-teaching Mercy Medical Center Oshkosh Non-teaching Meriter Hospital Madison Teaching Saint Joseph’s Hospital Marshfield Teaching Saint Mary’s Hospital Medical Center Madison Teaching West Allis Memorial Hospital West Allis Teaching Wheaton Franciscan Healthcare - Saint Francis Milwaukee Teaching
* Distinction cannot be used without a Licensing Agreement from Health Grades, Inc.

© Copyright 2009 Health Grades, Inc. All rights reserved. May not be reprinted or reproduced without permission from Health Grades, Inc
HealthGrades Patient Safety in American Hospitals Study 2009 - 17
Appendix B: Patient Safety Indicators Used in this HealthGrades Study The following 15 patient safety indicators were used in this HealthGrades study.
Patient Safety Indicator Translated as… Complications of anesthesia* excluded
Death in low mortality Diagnostic Related Groupings (DRGs)
Prevention of death in procedures where mortality is usually very low
Decubitus ulcer Lack of pressure sores or bed sores acquired in the hospital
Failure to rescue (known as, Death among surgical inpatients with serious treatable complications)
Ability to diagnose and treat in time
Iatrogenic pneumothorax Avoidance of collapsed lung due to a procedure or surgery in or around the chest
Selected infections due to medical care Lack of infections acquired at the hospital
Post-operative hip fracture Absence of hip fracture after surgery
Post-operative hemorrhage or hematoma Avoidance of excessive bruising or bleeding as a consequence of a procedure or surgery
Post-operative physiologic and metabolic derangements
Adequate organ function and electrolyte and fluid imbalance after surgery
Post-operative respiratory failure Avoidance of respiratory failure following surgery
Post-operative pulmonary embolism or deep vein thrombosis
Lack of deep blood clots in the lungs or legs after surgery
Post-operative sepsis Avoidance of severe infection following surgery
Post-operative abdominal wound dehiscence Lack of surgical wound site breakdown
Accidental puncture or laceration* excluded
Transfusion reaction* excluded * Complications of anesthesia, accidental puncture or laceration, and transfusion reaction were excluded from the overall
performance calculation to identify the Patient Safety Excellence Award™ recipients.

© Copyright 2009 Health Grades, Inc. All rights reserved. May not be reprinted or reproduced without permission from Health Grades, Inc
HealthGrades Patient Safety in American Hospitals Study 2009 - 18
Appendix C: HealthGrades Patient Safety Methodology 2009 To help consumers evaluate and compare hospital patient safety performance, HealthGrades analyzed patient data for virtually every hospital in the country to determine patient safety outcomes.
HealthGrades used Medicare inpatient data from the Medicare Provider Analysis Review (MedPAR) data file (purchased from the Centers for Medicare and Medicaid Services; 2005 through 2007 data) and Patient Safety Indicator software (QI Windows Software, version 3.2) from the Agency for Healthcare Research and Quality (AHRQ) to analyze the following 12 patient safety indicators (PSIs).
Patient Safety Indicator Translated as… Death in low mortality Diagnostic Related Groupings (DRGs)
Prevention of death in procedures where mortality is usually very low
Decubitus ulcer Lack of pressure sores or bed sores acquired in the hospital
Failure to rescue (known as, Death among surgical inpatients with serious treatable complications)
Ability to diagnose and treat in time
Iatrogenic pneumothorax Avoidance of collapsed lung due to a procedure or surgery in or around the chest
Selected infections due to medical care Lack of infections acquired at the hospital
Post-operative hip fracture Absence of hip fracture after surgery
Post-operative hemorrhage or hematoma Avoidance of excessive bruising or bleeding as a consequence of a procedure or surgery
Post-operative physiologic and metabolic derangements
Adequate organ function and electrolyte and fluid imbalance after surgery
Post-operative respiratory failure Avoidance of respiratory failure following surgery
Post-operative pulmonary embolism or deep vein thrombosis
Lack of deep blood clots in the lungs or legs after surgery
Post-operative sepsis Avoidance of severe infection following surgery
Post-operative abdominal wound dehiscence Lack of surgical wound site breakdown
For most indicators, the AHRQ software uses advanced statistical algorithms that can predict the number of patient safety events that are likely to occur at a hospital based on the mix of types of cases treated at that hospital. For those indicators without predicted results from the AHRQ software, predicted results were generated by grouping the populations according to risk and assigning average group values to patients in each group. This information is used, in part, to determine a HealthGrades individual rating for each patient safety indicator and an overall patient safety rating for a hospital.
Data Acquisition HealthGrades uses the MedPAR data file from the Centers for Medicare and Medicaid Services (CMS) for several reasons:
• First, it includes virtually every hospital in the country, with the exception of military and Veterans Administration hospitals.

© Copyright 2009 Health Grades, Inc. All rights reserved. May not be reprinted or reproduced without permission from Health Grades, Inc
HealthGrades Patient Safety in American Hospitals Study 2009 - 19
• Second, hospitals are required by law to submit complete and accurate information with substantial penalties for those that report inaccurate or incomplete data.
• Third, the Medicare population represents a majority of the adult inpatient admissions.
HealthGrades used the QI Windows Software, version 3.2, developed by the Agency for Healthcare Research and Quality (AHRQ) and downloaded from www.qualityindicators.ahrq.gov/software.htm. Two major changes were documented by AHRQ for the update to version 3.2:
• Non-surgical patients and patients with acute renal failure are no longer in the inclusion requirements for ability to diagnose and treat in time, resulting in fewer patients included and fewer events.
• In the 2009 analysis, absence of foreign body left in during procedure was not utilized as one of the indicators. Absence of foreign body left in during procedure now requires a present on admission indicator, which will not be available in MedPAR data until the 2008 data set.
Following all AHRQ guidelines for using PSI software, HealthGrades applied it to all short-term acute care hospitals in the MedPAR file for three years (2005 through 2007).
Data Exclusions Given that the MedPAR data set applies mostly to patients over the age of 65, HealthGrades excluded the following PSIs from the analysis:
• Birth trauma – injury to neonate • Obstetric trauma – cesarean delivery • Obstetric trauma – vaginal delivery with instrument • Obstetric trauma – vaginal delivery without instrument
Due to coding variation in the use of E-codes, HealthGrades excluded three additional indicators:
• Complications of anesthesia • Accidental puncture or laceration • Transfusion reaction
Additionally, HealthGrades modified the failure to rescue patient group by excluding cancer patients–patients having any ICD-9 code between 140.0 and 208.9 or between 230.0 and 239.9. (AHRQ now refers to failure to rescue as death among surgical inpatients with serious treatable complications.) HealthGrades also removed hospitals in the U.S. territories and Puerto Rico from the data set.
Individual Patient Safety Indicator Rating To determine a patient safety indicator score for each of the 12 PSIs for each hospital, HealthGrades statistically compared the actual rate of individual patient safety events to the predicted rate. HealthGrades then displays if the PSI was Best, As Expected, or Poor.
Best – Fewer patients were affected than expected. As Expected – About the same number of patients were affected as expected. Poor – More patients were affected than expected.
• When a hospital is not rated, it means the hospital had too few cases to be eligible to receive a patient safety rating.

© Copyright 2009 Health Grades, Inc. All rights reserved. May not be reprinted or reproduced without permission from Health Grades, Inc
HealthGrades Patient Safety in American Hospitals Study 2009 - 20
HealthGrades also reports the number of patients (out of 1,000 patients that met the inclusion criteria) who experienced the problem. For example, 10 per 1,000 means that for every 1,000 patients only 10 were affected; whereas zero (0) indicates that no patients were affected. Each patient safety indicator is rated independently and some indicators apply to more patients than others. Some patient safety events occur more frequently than others. As a result, the number of patients affected for each indicator may vary substantially.
Overall Patient Safety Score To be eligible for an overall patient safety score, a hospital must have had outcomes in nine of the 12 patient safety indicators. Hospitals with eight or fewer patient safety ratings were not eligible to receive an overall patient safety score, but may have individual patient safety indicator ratings.
To determine the overall patient safety score by hospital, HealthGrades performed the following steps:
1 AHRQ software calculated observed and expected rates for each hospital and PSI, provided that the PSI had at least three cases. (HealthGrades used a stratification process to calculate expected rates for those PSIs where AHRQ software only provided observed rates.)
2 HealthGrades identified significant bias in the expected rates for larger hospitals (which had consistently higher observed rates than expected). Therefore, HealthGrades performed further risk adjustment using the Medicare Case Mix Index (CMI). The case mix index adjustment compensates for the fact that within a given DRG the most severely ill will probably be clustered at larger hospitals. To perform the case mix index adjustment and remove the bias, HealthGrades stratified hospitals into one of eight categories according to their case mix index, and then adjusted the expected values so that the sum of the expected equaled the sum of the observed for each PSI for each combination of CMI group and year.
CMI Index CMI Group 0.00 < CMI < 1.25 1 1.25 < CMI < 1.35 2 1.35 < CMI < 1.45 3 1.45 < CMI < 1.55 4 1.55 < CMI < 1.65 5 1.65 < CMI < 1.75 6 1.75 < CMI < 1.90 7 CMI > 1.90 8
3 HealthGrades statistically compared the observed rate to the expected rate to produce a z-score for each PSI. To normalize the effect of the 12 indicators, these z-scores were rescaled to a mean of zero and standard deviation of one. The average of the 12 resulting scores determined a hospital’s ranking.

© Copyright 2009 Health Grades, Inc. All rights reserved. May not be reprinted or reproduced without permission from Health Grades, Inc
HealthGrades Patient Safety in American Hospitals Study 2009 - 21
4 HealthGrades divided the hospitals into two peer groups: teaching and non-teaching. To identify the teaching peer group, HealthGrades used data from the Medicare Cost Reports (Form CMS-2552-96). A facility was considered a teaching hospital if they answered “yes” to the question:
“Does the hospital have a teaching program approved in accordance with CMS publication 15-1, Chapter 4?” As a further confirmation, the hospital was required to report either Indirect Medical Education (IME) payments or FTEs for residents on the Cost Report. When the Cost Report data were unavailable or contradictory, IME from the MedPAR file and the COTH (Council of Teaching Hospitals) list were used to determine status.
5 The average of the resulting scores determined a hospital’s ranking within the teaching and non-teaching groups. Star ratings were then assigned as follows:
Best (Top 15%) As Expected (Middle 70%) Poor (Bottom 15%) • When a hospital is rated Best in patient safety, it means that their patient safety record is
better than expected given their patient population and that they scored within the top 15 percent of hospitals that qualify for a patient safety rating.
• When a hospital is rated As Expected, their patient safety record is as expected given their patient population and they scored within the middle 70 percent of hospitals that qualify for a patient safety rating.
• When a hospital is rated Poor, their patient safety record is worse than expected and they rated within the bottom 15 percent of hospitals that qualify for a patient safety rating.
• When a hospital is not rated, it means the hospital had too few cases to be eligible to receive a patient safety rating.
Limitations of the Data Models It must be understood that while these models may be valuable in identifying hospitals that perform better than others, one should not use this information alone to determine the quality of care provided at each hospital. The models are limited by the following factors:
• Cases may have been coded incorrectly or incompletely by the hospital. • The models can only account for risk factors that are coded into the billing data. Therefore, if
a particular risk factor was not coded into the billing data (such as a patient's socioeconomic status and health behavior), then it was not accounted for with these models.
• Although HealthGrades has taken steps to carefully compile these data, no techniques are infallible; therefore, some information may be missing, outdated or incorrect.
Please note that if more than one hospital reported to CMS under a single provider ID, HealthGrades analyzed patient safety data for those hospitals as a single unit. Throughout this document, therefore, "hospital" refers to one hospital or a group of hospitals reporting under a single provider ID.

© Copyright 2009 Health Grades, Inc. All rights reserved. May not be reprinted or reproduced without permission from Health Grades, Inc
HealthGrades Patient Safety in American Hospitals Study 2009 - 22
Appendix D: Patient Safety Incidence Rates and Associated Mortality Among Medicare Beneficiaries (2005 – 2007)
Patient Safety Indicator Year Number of
Events Total Cases Evaluated
Rate per 1,000
Associated Mortality*
% Change in Rate
(2005 – 2007)
Complications of anesthesia**
2005 674 3,471,872 0.194 6
15.14% 2006 649 3,414,533 0.190 4 2007 539 3,271,930 0.165 5
2005-2007 1,862 10,158,335 0.183 15
Death in low mortality DRGs
2005 3,562 1,908,678 1.866 3,562
14.63% 2006 2,499 1,565,215 1.597 2,499 2007 2,449 1,537,199 1.593 2,449
2005-2007 8,510 5,011,092 1.698 8,510
Decubitus ulcer
2005 149,064 4,823,206 30.906 15,030
-7.78% 2006 147,420 4,624,060 31.881 13,979 2007 148,544 4,459,564 33.309 13,204
2005-2007 445,028 13,906,830 32.001 42,213
Failure to rescue
2005 5,239 52,735 99.346 5,239
5.54% 2006 4,898 51,371 95.346 4,898 2007 4,766 50,786 93.845 4,766
2005-2007 14,903 154,892 96.215 14,903
Iatrogenic pneumothorax
2005 8,161 12,351,767 0.661 1,365
8.17% 2006 7,542 12,007,857 0.628 1,183 2007 7,064 11,642,577 0.607 1,101
2005-2007 22,767 36,002,201 0.632 3,649
Selected infections due to medical care
2005 19,733 8,419,293 2.344 1,844
9.55% 2006 17,308 7,903,105 2.190 1,562 2007 17,516 8,262,010 2.120 1,457
2005-2007 54,557 24,584,408 2.219 4,863
Post-operative hip fracture
2005 1,120 2,156,028 0.519 109
5.16% 2006 988 2,101,100 0.470 101 2007 975 1,979,071 0.493 99
2005-2007 3,083 6,236,199 0.494 309
Post-operative hemorrhage or hematoma
2005 9,195 3,452,351 2.663 631
2.27% 2006 8,987 3,394,782 2.647 661 2007 8,465 3,252,201 2.603 495
2005-2007 26,647 10,099,334 2.638 1,787
Post-operative physiologic and metabolic derangements
2005 2,352 1,826,423 1.288 478
-0.59% 2006 2,209 1,799,895 1.227 459 2007 2,239 1,728,436 1.295 411
2005-2007 6,800 5,354,754 1.270 1,348
Continued…

© Copyright 2009 Health Grades, Inc. All rights reserved. May not be reprinted or reproduced without permission from Health Grades, Inc
HealthGrades Patient Safety in American Hospitals Study 2009 - 23
Patient Safety Indicator Year Number of
Events Total Cases Evaluated
Rate per 1,000
Associated Mortality*
% Change in Rate
(2005 – 2007)
Post-operative respiratory failure
2005 22,888 1,347,615 16.984 5,421
-2.45% 2006 22,619 1,324,034 17.083 5,229 2007 22,434 1,289,242 17.401 4,850
2005-2007 67,941 3,960,891 17.153 15,500
Post-operative pulmonary embolism or deep vein thrombosis
2005 43,436 3,421,095 12.697 4,166
-14.51% 2006 46,640 3,360,843 13.877 3,942 2007 46,764 3,216,572 14.538 3,661
2005-2007 136,840 9,998,510 13.686 11,769
Post-operative sepsis
2005 6,829 504,510 13.536 1,862
-23.40% 2006 6,768 463,211 14.611 1,774 2007 7,544 451,629 16.704 1,839
2005-2007 21,141 1,419,350 14.895 5,475
Post-operative wound dehiscence in abdominopelvic surgical patients
2005 1,801 466,050 3.864 229
-2.39% 2006 1,706 434,171 3.929 256 2007 1,694 428,116 3.957 219
2005-2007 5,201 1,328,337 3.915 704
Accidental puncture or laceration**
2005 33,165 12,895,156 2.572 2,371
-1.20% 2006 33,003 12,522,616 2.635 2,247 2007 31,613 12,145,470 2.603 2,039
2005-2007 97,781 37,563,242 2.603 6,657
Transfusion reaction**
2005 75 13,105,788 0.006 3
51.99% 2006 45 12,746,448 0.004 1 2007 34 12,375,267 0.003 1
2005-2007 154 38,227,503 0.004 5
Totals - 913,215 - - 117,707
Less Double Counts - 864,765^ - - 97,755
* The mortality reported is all-cause inhospital mortality among all U.S. patients that experienced one or more patient safety events during hospitalization from 2005 through 2007.
** Complications of anesthesia, accidental puncture or laceration, and transfusion reaction were excluded from the overall performance calculation to identify the Patient Safety Excellence Award™ recipients.
^ This is the number of patients with one or more patient safety events.

© Copyright 2009 Health Grades, Inc. All rights reserved. May not be reprinted or reproduced without permission from Health Grades, Inc
HealthGrades Patient Safety in American Hospitals Study 2009 - 24
Appendix E: Patient Safety Events and Their Attributable Mortality and Excess Charge Among Medicare Beneficiaries by PSI (2005 – 2007)
Patient Safety Indicator
Actual Number of National Events
Percentage of Total
Number of Events
Attributable Mortality Rates**
Number of Deaths
Attributable to PSI
(Attributable Mortality**)
Attributable Charge**
Excess Charge
Attributable to PSI**
(Millions)
Excess Cost
Attributable to PSI ^^ (Millions)
Decubitus ulcer 445,028 48.73% 7.23% 32,176 $10,845 $4,826.33 $2,413.16
Post-op pulmonary embolism or deep vein thrombosis
136,840 14.98% 6.56% 8,977 $21,709 $2,970.66 $1,485.33
Accidental puncture or laceration 97,781 10.71% 2.16% 2,112 $8,271 $808.75 $404.37
Post-op respiratory failure 67,941 7.44% 21.84% 14,838 $53,502 $3,634.98 $1,817.49
Selected infections due to medical care 54,557 5.97% 4.31% 2,351 $38,656 $2,108.96 $1,054.48
Post-op hemorrhage or hematoma 26,647 2.92% 3.01% 802 $21,431 $571.07 $285.54
Iatrogenic pneumothorax 22,767 2.49% 6.99% 1,591 $17,312 $394.14 $197.07
Post-op sepsis 21,141 2.32% 21.92% 4,634 $57,727 $1,220.41 $610.20
Failure to rescue* 14,903 1.63% NA* 14,903 NA* NA* NA*
Death in low mortality DRGs* 8,510 0.93% NA* 8,510 NA* NA* NA*
Post-op physiologic and metabolic derangements
6,800 0.74% 19.81% 1,347 $54,818 $372.76 $186.38
Post-op abdominal wound dehiscence 5,201 0.57% 9.63% 501 $40,323 $209.72 $104.86
Post-op hip fracture 3,083 0.34% 4.52% 139 $13,441 $41.44 $20.72
Complications of anesthesia 1,862 0.20% 0.00% 0 $1,598 $2.98 $1.49
Transfusion reaction 154 0.02% 0.00% 0 $18,929 $2.92 $1.46
Totals 913,215 - - 92,882 - $13,821.68 $6,910.84 * By definition, all patients with the event died and were excluded from Zhan and Miller's analysis on attributable mortality and cost
associated with patient safety events. ** Based on previous research done by Zhan and Miller. Excess Length of Stay, Charges, and Mortality Attributable to Medical Injuries
During Hospitalization. JAMA. 2003; 290(14):1868-1874. Insufficient data to estimate attributable mortality rates for Complications of Anesthesia and Transfusion Reaction.
^^ Assuming an average cost to charge ratio of 0.5 (Friedman, La Mare, Andrews, McKenzie, Practical Options for Estimating Cost of Hospital Inpatient Stays. J Health Care Finance. 2002; 29(1): 1-13.

© Copyright 2009 Health Grades, Inc. All rights reserved. May not be reprinted or reproduced without permission from Health Grades, Inc
HealthGrades Patient Safety in American Hospitals Study 2009 - 25
Appendix F: Comparing Different Performance Categories (2005-2007) Observed-to-Expected Ratios (O/E) by PSI and Associated Outcomes As Compared to the Top 15% Performance
Patient Safety Indicator ALL
Hospitals Recognized with Patient Safety
Excellence Award™ O/E Ratios
(95% CI)
Middle 70% O/E Ratios
Bottom 15% Hospitals O/E Ratios
(95% CI)
Relative Risk
Decrease Associated with Patient
Safety Excellence Hospitals Compared to Bottom Hospitals
# of Excess Patient Safety
Events** Among All
Non-Patient Safety Award
Hospitals
# Potentially Avoidable Deaths**
Associated with Excess
Patient Safety Events Among
All Non-Patient Safety
Award Hospitals
Excess Charge^ (Millions)
Associated with Excess
Patient Safety Events
Among All Non-Patient
Safety Award Hospitals
Excess Cost^^
(Millions) Associated with Excess
Patient Safety Events Among
All Non-Patient Safety
Award Hospitals
Death in low mortality DRGs* 1.000 .713 ( .673- .754) 1.019 1.231 (1.172-1.291) 42.06% 2,438 2,438 NA* NA*
Decubitus ulcer 1.000 .703 ( .697- .709) 1.003 1.287 (1.279-1.295) 45.39% 132,187 9,557 $1,434 $717
Failure to rescue* 1.000 .806 ( .777- .836) 1.005 1.153 (1.119-1.186) 30.04% 2,885 2,885 NA* NA*
Iatrogenic pneumothorax 1.000 .837 ( .812- .862) .999 1.203 (1.170-1.237) 30.47% 3,717 260 $64 $32 Selected infections due to medical care 1.000 .746 ( .730- .761) .979 1.412 (1.389-1.435) 47.18% 13,878 598 $536 $268
Post-op hip fracture 1.000 .661 ( .602- .720) 1.016 1.369 (1.270-1.469) 51.74% 1,045 47 $14 $7 Post-op hemorrhage or hematoma 1.000 .817 ( .795- .839) .999 1.229 (1.199-1.260) 33.53% 4,874 147 $104 $52 Post-op physiologic and metabolic derangements 1.000 .696 ( .657- .734) .986 1.470 (1.406-1.535) 52.67% 2,067 409 $113 $57
Post-op respiratory failure 1.000 .781 ( .767- .794) .997 1.281 (1.262-1.300) 39.05% 14,891 3,252 $797 $398
Post-op pulmonary embolism or deep vein thrombosis 1.000 .809 ( .799- .819) .988 1.307 (1.293-1.321) 38.10% 26,148 1,715 $568 $284
Post-op sepsis 1.000 .718 ( .695- .740) .980 1.476 (1.438-1.513) 51.37% 5,969 1,308 $345 $172 Post-op wound dehiscence in abdominopelvic surgical patients 1.000 .693 ( .644- .741) .992 1.447 (1.367-1.528) 52.15% 1,598 154 $64 $32 Average relative risk increase in and number of potentially avoidable patient safety events, death, charge and cost associated with All Non-Patient Safety Award hospitals compared to Patient Safety Excellence Award™ hospitals. 42.81% 211,697 22,771 $4,040 $2,020 * By definition, all patients with the event died and were excluded from Zhan and Miller's analysis on attributable mortality and cost associated with patient safety events. ** Excess events are determined by applying the Patient Safety Excellence Hospital event rates to all other hospitals and subtracting from their actual event rate. ^ Based on previous research done by Zhan and Miller . Excess Length of Stay, Charges, and Mortality Attributable to Medical Injuries During Hospitalization. JAMA. 2003; 290(14):1868-1874. ^^ Assuming an average cost to charge ratio of 0.5 (Friedman, La Mare, Andrews, and McKenzie. Practical Options for Estimating Cost of Hospital Inpatient Stays. J Health Care Finance. 2002; 29(1): 1-13).

© Copyright 2009 Health Grades, Inc. All rights reserved. May not be reprinted or reproduced without permission from Health Grades,
HealthGrades Patient Safety in American Hospitals Study 2009 - 26
Acknowledgements Health Grades, Inc., 500 Golden Ridge Road, Suite 100, Golden, Colorado 80401
We thank the following people for their significant contributions to the study: Kristin Reed, M.P.H., co-author, analysis and writing; Rick May, M.D., co-author; Harold Taylor, Ph.D., statistical analysis; Carol Nicholas, M.S.T.C., writing, editing and publishing; and Sue Bond, Carol Brinson, Alex Brown, Deanna Dzikowski, Marigene Hartker M.D., Jody Hereford, and John Stephan for their helpful suggestions and reviews.
Health Grades Inc. is the leading independent healthcare ratings organization, providing quality ratings, profiles and cost information on the nation's hospitals, physicians, nursing homes and prescription drugs.
References 1 Institute for Healthcare Improvement. 5 Million Lives Campaign.
http://www.ihi.org/IHI/Programs/Campaign/Campaign.htm?TabId=6. Downloaded 2/11/2009.
2 Centers for Medicare and Medicaid Services. Medicare Takes New Steps to Make Your Hospital Safer. Available at: http://www.cms.hhs.gov/apps/media/fact_sheets.asp. Accessed 2/11/2009.
3 Patient Safety Indicators Download. AHRQ Quality Indicators. Updated March 2008. Agency for Healthcare Research and Quality, Rockville, MD. http://www.qualityindicators.ahrq.gov/psi_download.htm. Downloaded September 2008.
4 Kohn L. T., Corrigan J. M., and Donaldson M. S., eds. To Err Is Human: Building a Safer Health System. (Washington: National Academy Press, 1999).
5 Quality Interagency Coordination Task Force. Doing What Counts for Patient Safety: Federal Actions to Reduce Medical Errors and Their Impact. (Washington: QuIC Task Force, 2000).
6 Zhan C., and Miller M. R. Excess Length of Stay, Charges, and Mortality Attributable to Medical Injuries during Hospitalization. JAMA. 2003; 290(14):1868-74.
7 Health Grades, Inc. The Fifth Annual HealthGrades Patient Safety in American Hospitals Study 2008. April 2008. Available at http://www.healthgrades.com/media/DMS/pdf/PatientSafetyInAmericanHospitalsStudy2008.pdf.
8 Sorra J, Famolaro T, Dyer N, et al. Hospital Survey on Patient Safety Culture: 2008 Comparative Database Report. Agency for Healthcare Research and Quality. Department of Health and Human Services. AHRQ Publication No. 08-0039. March 2008.
9 Pronovost, P. et al. An Intervention to Decrease Catheter-Related Bloodstream Infections in the ICU. NEJM. 2006;355(26):2725-2732.
10 2007 National Healthcare Quality Report. Rockville, Md: Agency for Healthcare Research and Quality; 2007.
11 Friedman B., La Mare J., Andrews R., McKenzie D. Practical Options for Estimating Cost of Hospital Inpatient Stays. J Health Care Finance. 2002; 29(1): 1-13.