healthy and safe swimming week norovirus outbreak … · jonathan e. fielding, md, mph, mba, los...
TRANSCRIPT

Continuing Education examination available at http://www.cdc.gov/mmwr/cme/conted_info.html#weekly.
U.S. Department of Health and Human ServicesCenters for Disease Control and Prevention
Morbidity and Mortality Weekly ReportWeekly / Vol. 64 / No. 18 May 15, 2015
INSIDE491 Decrease in Rate of Opioid Analgesic Overdose
Deaths — Staten Island, New York City, 2011–2013495 Preliminary Incidence and Trends of Infection with
Pathogens Transmitted Commonly Through Food — Foodborne Diseases Active Surveillance Network, 10 U.S. Sites, 2006–2014
500 Controlling the Last Known Cluster of Ebola Virus Disease — Liberia, January–February 2015
505 Initiation of a Ring Approach to Infection Prevention and Control at Non-Ebola Health Care Facilities — Liberia, January–February 2015
509 Announcement511 QuickStats
Healthy and Safe Swimming Week — May 18–24, 2015
May 18–24, 2015, marks the 11th annual Healthy and Safe Swimming Week (formerly known as Recreational Water Illness and Injury Prevention Week). This observance highlights ways in which swimmers, parents, pool owners and operators, beach managers, and public health can maximize the health benefits of water-based physical activity, while minimizing the risk for recreational water–associated illness and injury. More information is available at http://www.cdc.gov/healthywater/observances/hss-week/index.html.
This year’s theme, “Make a Healthy Splash: Share the Fun, Not the Germs,” focuses on a few easy and effective steps swimmers and parents can take to protect themselves and their families and friends from infectious pathogens in pools, waterparks, hot tubs, spas, and water playgrounds. These steps are highlighted in CDC’s new Healthy Swimming brochure, available with other free promotional materials at http://www.cdc.gov/healthywater/swimming/resources/index.html.
CDC also released the 1st Edition of the Model Aquatic Health Code in August 2014 (1), a voluntary guidance document that can help state and local authorities and the aquatics sector make swimming and other water activities healthier and safer. The first Conference for the Model Aquatic Health Code (CMAHC) will be held October 6–7, 2015, in Scottsdale, Arizona, where CMAHC members* can vote on potential MAHC changes. A public health com-munications toolkit for Healthy and Safe Swimming Week is available at http://www.cdc.gov/healthywater/observances/hss-week/response-tools-public-health.html.
* More information on how to become a CMAHC member is available at http://www.cmahc.org/membership.php.
Reference1. CDC. The Model Aquatic Health Code (MAHC): a model public
swimming pool and spa code. Washington, DC: US Health and Human Services, CDC; 2014. Available at http://www.cdc.gov/healthywater/swimming/pools/mahc/.
Norovirus Outbreak Associated with a Natural Lake Used for Recreation — Oregon, 2014
Amy Zlot, MPH1, Maayan Simckes, MPH1,2, Jennifer Vines, MD1, Laura Reynolds, MPH1, Amy Sullivan PhD1, Magdalena Kendall
Scott, MPH3, J. Michael McLuckie1, Dan Kromer, MPA4, Vincent R. Hill, PhD5, Jonathan S. Yoder, MPH5, Michele C. Hlavsa, MPH5
(Author affiliations at end of text)
In July 2014, Multnomah County public health officials investigated a norovirus outbreak among persons visiting Blue Lake Regional Park in Oregon. During the weekend of the reported illnesses (Friday, July 11–Sunday, July 13) approximately 15,400 persons visited the park. The investigation identified 65 probable and five laboratory-confirmed cases of norovirus infection (70 total cases). No hospitalizations or deaths were reported. Analyses from a retrospective cohort study revealed that swimming at Blue Lake during July 12–13 was significantly associated with illness during July 13–14 (adjusted

Morbidity and Mortality Weekly Report
486 MMWR / May 15, 2015 / Vol. 64 / No. 18
The MMWR series of publications is published by the Center for Surveillance, Epidemiology, and Laboratory Services, Centers for Disease Control and Prevention (CDC), U.S. Department of Health and Human Services, Atlanta, GA 30329-4027.Suggested citation: [Author names; first three, then et al., if more than six.] [Report title]. MMWR Morb Mortal Wkly Rep 2015;64:[inclusive page numbers].
Centers for Disease Control and PreventionThomas R. Frieden, MD, MPH, Director
Harold W. Jaffe, MD, MA, Associate Director for Science Joanne Cono, MD, ScM, Director, Office of Science Quality
Chesley L. Richards, MD, MPH, Deputy Director for Public Health Scientific ServicesMichael F. Iademarco, MD, MPH, Director, Center for Surveillance, Epidemiology, and Laboratory Services
MMWR Editorial and Production Staff (Weekly)Sonja A. Rasmussen, MD, MS, Editor-in-Chief
Charlotte K. Kent, PhD, MPH, Executive Editor Jacqueline Gindler, MD, Acting Editor Teresa F. Rutledge, Managing Editor
Douglas W. Weatherwax, Lead Technical Writer-EditorTeresa M. Hood, MS, Jude C. Rutledge, Writer-Editors
Martha F. Boyd, Lead Visual Information SpecialistMaureen A. Leahy, Julia C. Martinroe,
Stephen R. Spriggs, Visual Information SpecialistsQuang M. Doan, MBA, Phyllis H. King,
Terraye M. Starr, Information Technology Specialists
MMWR Editorial BoardWilliam L. Roper, MD, MPH, Chapel Hill, NC, Chairman
Matthew L. Boulton, MD, MPH, Ann Arbor, MIVirginia A. Caine, MD, Indianapolis, IN
Jonathan E. Fielding, MD, MPH, MBA, Los Angeles, CADavid W. Fleming, MD, Seattle, WA
William E. Halperin, MD, DrPH, MPH, Newark, NJ
King K. Holmes, MD, PhD, Seattle, WATimothy F. Jones, MD, Nashville, TNRima F. Khabbaz, MD, Atlanta, GA
Patricia Quinlisk, MD, MPH, Des Moines, IAPatrick L. Remington, MD, MPH, Madison, WI
William Schaffner, MD, Nashville, TN
relative risk = 2.3; 95% confidence interval [CI] = 1.1–64.9). Persons who swam were more than twice as likely to become ill compared with those who did not swim in the lake. To control the outbreak, Blue Lake was closed for 10 days to prevent further illness. This investigation underscores the need for guidance for determining when to reopen untreated recreational water venues (e.g., lakes) associated with outbreaks, and communication tools to inform the public about the risks associated with swimming in untreated recreational water venues and measures that can prevent illness.
On July 14, Multnomah County Health Department (MCHD) was notified of 13 cases of acute gastrointestinal illness among members of three separate groups who had visited Blue Lake Regional Park over the previous weekend, July 11–13. MCHD began to investigate the potential outbreak to identify risk factors for illness, and develop and implement control measures to prevent additional illness.
The park, located just outside of Portland (Multnomah County), is a popular destination for city residents during the summer. The park has a lake for swimming, picnic grounds, paddleboats, and a splash pad (a chlorinated spray ground with features that shower and pour water). During the weekend of the reported illnesses, approximately 1,700 persons visited the park on Friday, July 11; 7,700 on Saturday, July 12; and 6,000 on Sunday, July 13, thousands more visitors compared with an average summer weekend.
Epidemiologic InvestigationTo control the outbreak, Blue Lake was closed for 10 days
to prevent other illness. Telephone interviews of both ill and non-ill persons were conducted as part of a retrospective cohort study using contact information for persons on the reservations list for the park picnic grounds during the weekend of interest, July 11–July 13. Persons who had made the reservations were contacted by MCHD and asked to provide contact information for up to eight persons in their group; 139 persons were identified. State and Portland metro-area local health departments (Clackamas, Clark, Multnomah, and Washington counties) interviewed 109 (78%) of the 139 persons. A probable case was defined as any vomiting or diarrhea with onsets 7–45 hours after visiting the park, in a person who visited the park on July 11, 12, or 13. A confirmed case was defined as meeting the probable case definition and having laboratory-confirmed norovirus infection. Because this was a high profile outbreak and was heavily covered in the media, MCHD received 52 additional reports of illness from persons who contacted MCHD and other local health departments with symptoms consistent with norovirus infection but they were not included in the retrospective cohort study because they were not identified through the reservation list. The investigation identified 65 probable and five laboratory-confirmed cases of norovirus infection (70 total cases).
In the cohort study, approximately 17% (18 of 109) of participants met the case definition; 10 (56%) reported having

Morbidity and Mortality Weekly Report
MMWR / May 15, 2015 / Vol. 64 / No. 18 487
any diarrhea and 14 (78%) reported vomiting. The median incubation period was 31 hours (range = 7–45 hours), and the median duration of illness was 10 hours (range = 4–24 hours). However, at the time of their interview, three persons reported that their symptoms had not yet resolved. No hospitalizations or deaths were reported.
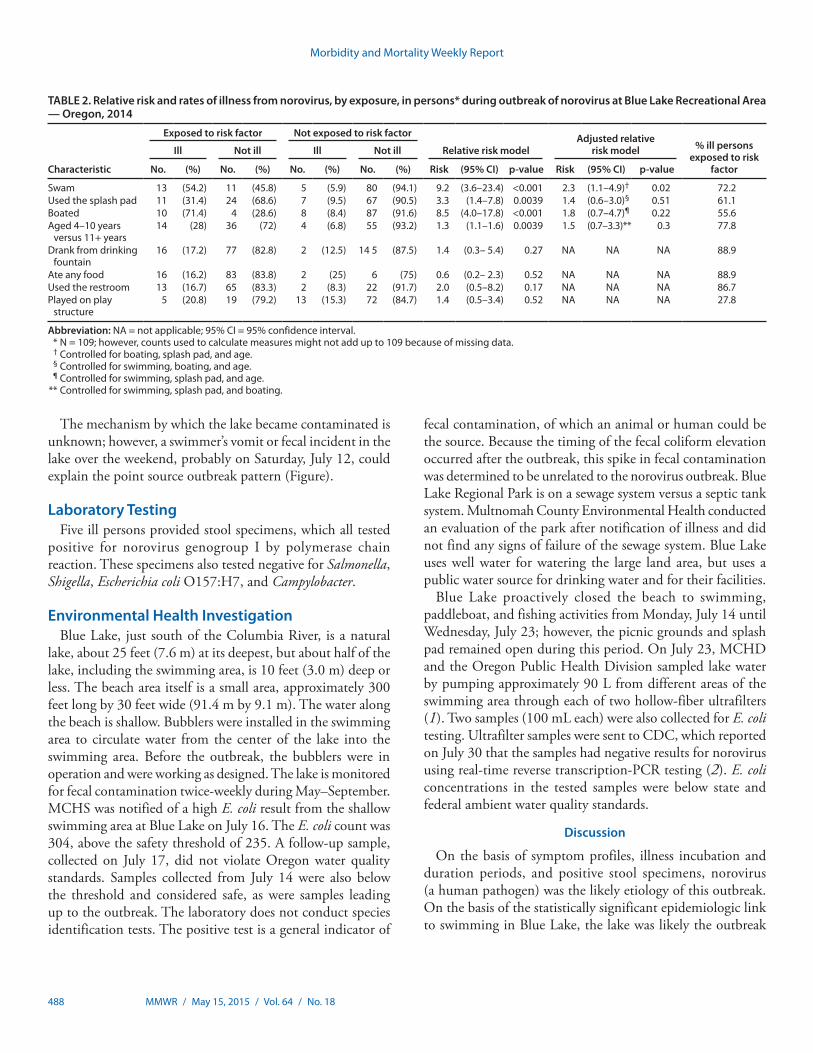
The percentage of visitors who were at the lake on Saturday, July 12 and became ill was 25% (17 of 68 persons) (Figure). Only one person who visited the lake on Sunday became ill, and no Friday visitors became ill. Those who became ill were significantly younger than those who were not ill (Table 1). Swimming (including immersion under water or wading in the lake), using the splash pad, boating, and younger age (aged 4–10 years) were each significantly associated with becoming ill in bivariate analyses (Table 2). However, when all of these risk factors were assessed simultaneously in one logistic regression
model to calculate adjusted relative risk estimates, only swim-ming remained significantly associated with illness. Persons who swam were 2.3 times (95% CI = 1.1–4.9) more likely to become ill compared with those who did not swim in the lake (Table 2). The attributable risk for swimming in the lake was 91.3% (95% CI = 87.9%–93.2%).
TABLE 1. Demographic characteristics of cases and non-cases,* outbreak of norovirus at Blue Lake Recreational Area — Oregon, 2014
Chacteristic
Age† (yrs) Gender§ (%)
Median Range Female Male
Cases 10 4–27 72.2 27.8Non-cases 31 1–68 62.9 37.1
* N = 109 persons interviewed; cases are defined as persons reporting onset of illness (vomiting or diarrhea) and non-cases are defined as those persons not reporting illness.
† p-value = 0.0002.§ p-value = 0.45.
FIGURE. Cases of norovirus infection* associated with recreational activities at Blue Lake Regional Park, Multnomah County, by date and time of onset of symptoms — Oregon, July 11–14, 2014
0
2
4
6
8
10
12
12:01 am–8:00 am
4:01pm–12:00 am
8:01 am–4:00 pm
Friday (7/11) Saturday (7/12) Sunday (7/13) Monday (7/14)
Date and time of symptom onset
No.
of c
ases
7,770 visitors†
12:01 am–8:00 am
4:01pm–12:00 am
8:01 am–4:00 pm
12:01 am–8:00 am
4:01pm–12:00 am
8:01 am–4:00 pm
12:01 am–8:00 am
4:01pm–12:00 am
8:01 am–4:00 pm
* N = 18.† On Saturday, July 7, there were thousands more visitors compared to an average summer Saturday.
Morbidity and Mortality Weekly Report
488 MMWR / May 15, 2015 / Vol. 64 / No. 18
The mechanism by which the lake became contaminated is unknown; however, a swimmer’s vomit or fecal incident in the lake over the weekend, probably on Saturday, July 12, could explain the point source outbreak pattern (Figure).
Laboratory TestingFive ill persons provided stool specimens, which all tested
positive for norovirus genogroup I by polymerase chain reaction. These specimens also tested negative for Salmonella, Shigella, Escherichia coli O157:H7, and Campylobacter.
Environmental Health InvestigationBlue Lake, just south of the Columbia River, is a natural
lake, about 25 feet (7.6 m) at its deepest, but about half of the lake, including the swimming area, is 10 feet (3.0 m) deep or less. The beach area itself is a small area, approximately 300 feet long by 30 feet wide (91.4 m by 9.1 m). The water along the beach is shallow. Bubblers were installed in the swimming area to circulate water from the center of the lake into the swimming area. Before the outbreak, the bubblers were in operation and were working as designed. The lake is monitored for fecal contamination twice-weekly during May–September. MCHS was notified of a high E. coli result from the shallow swimming area at Blue Lake on July 16. The E. coli count was 304, above the safety threshold of 235. A follow-up sample, collected on July 17, did not violate Oregon water quality standards. Samples collected from July 14 were also below the threshold and considered safe, as were samples leading up to the outbreak. The laboratory does not conduct species identification tests. The positive test is a general indicator of
fecal contamination, of which an animal or human could be the source. Because the timing of the fecal coliform elevation occurred after the outbreak, this spike in fecal contamination was determined to be unrelated to the norovirus outbreak. Blue Lake Regional Park is on a sewage system versus a septic tank system. Multnomah County Environmental Health conducted an evaluation of the park after notification of illness and did not find any signs of failure of the sewage system. Blue Lake uses well water for watering the large land area, but uses a public water source for drinking water and for their facilities.
Blue Lake proactively closed the beach to swimming, paddleboat, and fishing activities from Monday, July 14 until Wednesday, July 23; however, the picnic grounds and splash pad remained open during this period. On July 23, MCHD and the Oregon Public Health Division sampled lake water by pumping approximately 90 L from different areas of the swimming area through each of two hollow-fiber ultrafilters (1). Two samples (100 mL each) were also collected for E. coli testing. Ultrafilter samples were sent to CDC, which reported on July 30 that the samples had negative results for norovirus using real-time reverse transcription-PCR testing (2). E. coli concentrations in the tested samples were below state and federal ambient water quality standards.
Discussion
On the basis of symptom profiles, illness incubation and duration periods, and positive stool specimens, norovirus (a human pathogen) was the likely etiology of this outbreak. On the basis of the statistically significant epidemiologic link to swimming in Blue Lake, the lake was likely the outbreak
TABLE 2. Relative risk and rates of illness from norovirus, by exposure, in persons* during outbreak of norovirus at Blue Lake Recreational Area — Oregon, 2014
Characteristic
Exposed to risk factor Not exposed to risk factor
Relative risk modelAdjusted relative
risk model % ill persons exposed to risk
factor
Ill Not ill Ill Not ill
No. (%) No. (%) No. (%) No. (%) Risk (95% CI) p-value Risk (95% CI) p-value
Swam 13 (54.2) 11 (45.8) 5 (5.9) 80 (94.1) 9.2 (3.6–23.4) <0.001 2.3 (1.1–4.9)† 0.02 72.2Used the splash pad 11 (31.4) 24 (68.6) 7 (9.5) 67 (90.5) 3.3 (1.4–7.8) 0.0039 1.4 (0.6–3.0)§ 0.51 61.1Boated 10 (71.4) 4 (28.6) 8 (8.4) 87 (91.6) 8.5 (4.0–17.8) <0.001 1.8 (0.7–4.7)¶ 0.22 55.6Aged 4–10 years
versus 11+ years14 (28) 36 (72) 4 (6.8) 55 (93.2) 1.3 (1.1–1.6) 0.0039 1.5 (0.7–3.3)** 0.3 77.8
Drank from drinking fountain
16 (17.2) 77 (82.8) 2 (12.5) 14 5 (87.5) 1.4 (0.3– 5.4) 0.27 NA NA NA 88.9
Ate any food 16 (16.2) 83 (83.8) 2 (25) 6 (75) 0.6 (0.2– 2.3) 0.52 NA NA NA 88.9Used the restroom 13 (16.7) 65 (83.3) 2 (8.3) 22 (91.7) 2.0 (0.5–8.2) 0.17 NA NA NA 86.7Played on play
structure5 (20.8) 19 (79.2) 13 (15.3) 72 (84.7) 1.4 (0.5–3.4) 0.52 NA NA NA 27.8
Abbreviation: NA = not applicable; 95% CI = 95% confidence interval. * N = 109; however, counts used to calculate measures might not add up to 109 because of missing data. † Controlled for boating, splash pad, and age. § Controlled for swimming, boating, and age. ¶ Controlled for swimming, splash pad, and age. ** Controlled for swimming, splash pad, and boating.

Morbidity and Mortality Weekly Report
MMWR / May 15, 2015 / Vol. 64 / No. 18 489
source.* Although, the mechanism by which the lake became contaminated is unknown, the most likely cause, based on the point source outbreak pattern, was a swimmer’s vomit or fecal incident in the lake over the weekend, probably on Saturday, July 12. If a swimmer had a vomit or fecal incident in the lake on Saturday, July 12, the illness counts, by day of visit to the lake, suggest that the bubblers might have helped limit transmission to primarily Saturday, July 12 via dilution.†
During the previous 15 years, Blue Lake has been the source of other acute gastrointestinal illness outbreaks during the summer months. In 1991, Blue Lake was linked to a dual-pathogen outbreak (21 cases of E. coli O157:H7 and 59 cases of Shigella infection). In 2004, norovirus caused an outbreak associated with swimming in Blue Lake; this outbreak affected >100 persons (3,4). In addition, in the summer months Blue Lake often closes because of the presence of blue-green algae that can produce toxins harmful to humans and animals.
Because of the small beach area and the sheer numbers of park visitors, the bather load was high the weekend of the outbreak exposure. The effects of high bather load were likely exacerbated by the high temperatures (upwards of 90°F or 32°C), the potentially poor water circulation within the beach area, and the fact that shallow beach areas attract young children, among whom norovirus is the leading cause of medically attended acute gastroenteritis in the United States (5,6). Children also can be
at higher risk for exposure because they are more likely to ingest water while swimming (7). In addition, there is no method to chemically treat the lake, allowing contamination and the potential of transmission to persist.
Because there are no evidence-based remediation steps for untreated recreational water venues as there are for treated recreational water venues (e.g., pools), public health officials found it challenging to come to a clear consensus on when to reopen the lake. There is evidence that noroviruses can survive in water for several months and possibly years (8). Consequently, MCHD relied on commonsense strategies (e.g., waiting multiple incubation periods to ensure illness had subsided) and the expertise of health officers to decide when to reopen the lake. Public health agencies could benefit from the development of evidence-based criteria to determine when to reopen untreated recreational water venues associated with outbreaks (e.g., venue-specific water quality regression models).
Preventing and controlling such outbreaks also calls for engaging the swimming public, who represent a key source of recreational water contamination. Blue Lake has policies in place to prevent high-risk situations, including biweekly water testing for fecal contamination, installing bubblers to increase water circulation, and banning children aged <5 years§ from the beach area to limit vomiting and fecal incidents in the water, policies which existed before the outbreak. However, these strategies alone cannot eliminate the risk of contamination of recreational water, and more proactive (i.e., pre-outbreak) dissemination of messages that promote healthy swimming are needed. Because of the disproportionate reporting of outbreaks associated with treated recreational water venues, CDC has historically focused on developing healthy swimming promotion resources for treated venues.¶ However, as this outbreak highlights, healthy swimming promotion resources for untreated recreational water venues are also needed. Such resources would need to balance raising awareness of the health benefits of aquatic-based physical activity and outdoor recreation with informing the swimming public of steps that it can take to minimize potential risks of swimming in untreated recreational water (9). To optimize the effectiveness of healthy swimming messages specific to untreated recreational water venues, public health experts need to better understand how the swimming public perceives these venues and their associated risk of infection, particularly given the communal nature of swimming. Thus, understanding the public’s knowledge, attitudes, and practices surrounding untreated recreational water could be the first step to preventing illness.
* The water, and thus the tested samples, might have no longer been contaminated by norovirus 11 days after Saturday, July 12, or the contamination levels in the samples might have fallen below the level of detection.
† Based on the hypothesis that a swimmer had a vomit or fecal incident in the lake on Saturday, July 12, and 17 of 18 illnesses occurred in persons who visited the lake Saturday, but only one illness occurred in a person who visited the lake on Sunday.
§ CDC does not recommend banning children aged <5 years from recreational water venues as a strategy to prevent recreational water–associated illness outbreaks.
¶ More information is available at http://www.cdc.gov/healthywater/swimming/resources/index.html.
What is already known on this topic?
Nationally and internationally, norovirus outbreaks have been associated with untreated recreational water venues, such as lakes. During 2009–2010, the most recent years for which finalized data are available, there were 81 recreational water–associated disease outbreaks, 24 of them associated with untreated recreational water.
What is added by this report?
In July 2014, a norovirus outbreak associated with Blue Lake Regional Park in Oregon affected 70 persons. Swimming in the lake was significantly associated with illness; thus, the lake was closed for 11 days to swimming, paddleboat, and fishing activities.
What are the implications for public health practice?
Public health officials could greatly benefit from guidance for determining when to reopen untreated recreational water venues associated with outbreaks and public-facing health communication resources that promote healthy swimming and prevent recreational water–associated illness.

Morbidity and Mortality Weekly Report
490 MMWR / May 15, 2015 / Vol. 64 / No. 18
Acknowledgments
This study was supported in part by an appointment to the Applied Epidemiology Fellowship Program administered by the Council of State and Territorial Epidemiologists (CSTE) and funded by CDC Cooperative Agreement Number 5U38HM000414-5.
1Multnomah County Health Department; 2CDC/CSTE Applied Epidemiology Fellowship Program; 3Oregon Public Health Division; 4Metro, Blue Lake Regional Park, Fairview, Oregon; 5Division of Foodborne, Waterborne, and Environmental Diseases, National Center for Emerging and Zoonotic Infectious Diseases, CDC.
Corresponding author: Amy Zlot, [email protected], 503-988-3406.
References1. Environmental Protection Agency. Method 1623: Cryptosporidium and
Giardia in water by filtration/IMS/FA. Washington, DC: US Environmental Protection Agency, Office of Water; 2005. Available at http://water.epa.gov/scitech/methods/cwa/upload/1623-crypto-giardia-EPA-815-05-002-Dec2005.pdf.
2. Hill VRMB, Mull B, Jothikumar N, Ferdinand K, Vinje J. Detection of GI and GII noroviruses in ground water using ultrafiltration and TaqMan real-time RT-PCR. Food Environ Virol 2010;2:218–24.
3. Oregon Public Health Authority. Selected Reportable Communicable Disease Summary. Portland, OR: Oregon Public Health Authority;2011. Available at http://public.health.oregon.gov/DiseasesConditions/CommunicableDisease/DiseaseSurveillanceData/AnnualReports/arpt2011/Documents/ACD_report2011forWEB.pdf.
4. Rangel JM, Sparling PH, Crowe C, Griffin PM, Swerdlow DL. Epidemiology of Escherichia coli O157:H7 outbreaks, United States, 1982-2002. Emerg Infect Dis 2005;11:603–9.
5. Payne DC, Vinjé J, Szilagyi PG, et al. Norovirus and medically attended gastroenteritis in U.S. children. N Engl J Med 2013;368:1121–30.
6. Dziuban EJ, Liang JL, Craun GF, et al.; Surveillance for waterborne disease and outbreaks associated with recreational water—United States, 2003–2004. MMWR Surveill Summ 2006;55(No. SS-12):1–30.
7. Dufour AP, Evans O, Behymer TD, Cantú R. Water ingestion during swimming activities in a pool: a pilot study. J Water Health 2006;4:425–30.
8. Seitz SR, Leon JS, Schwab KJ, et al. Norovirus infectivity in humans and persistence in water. Appl Environ Microbiol 2011;77:6884–8.
9. Schets FM, De Roda Husman AM, Havelaar AH. Disease outbreaks associated with untreated recreational water use. Epidemiol Infect 2011;139:1114–25.

Morbidity and Mortality Weekly Report
MMWR / May 15, 2015 / Vol. 64 / No. 18 491
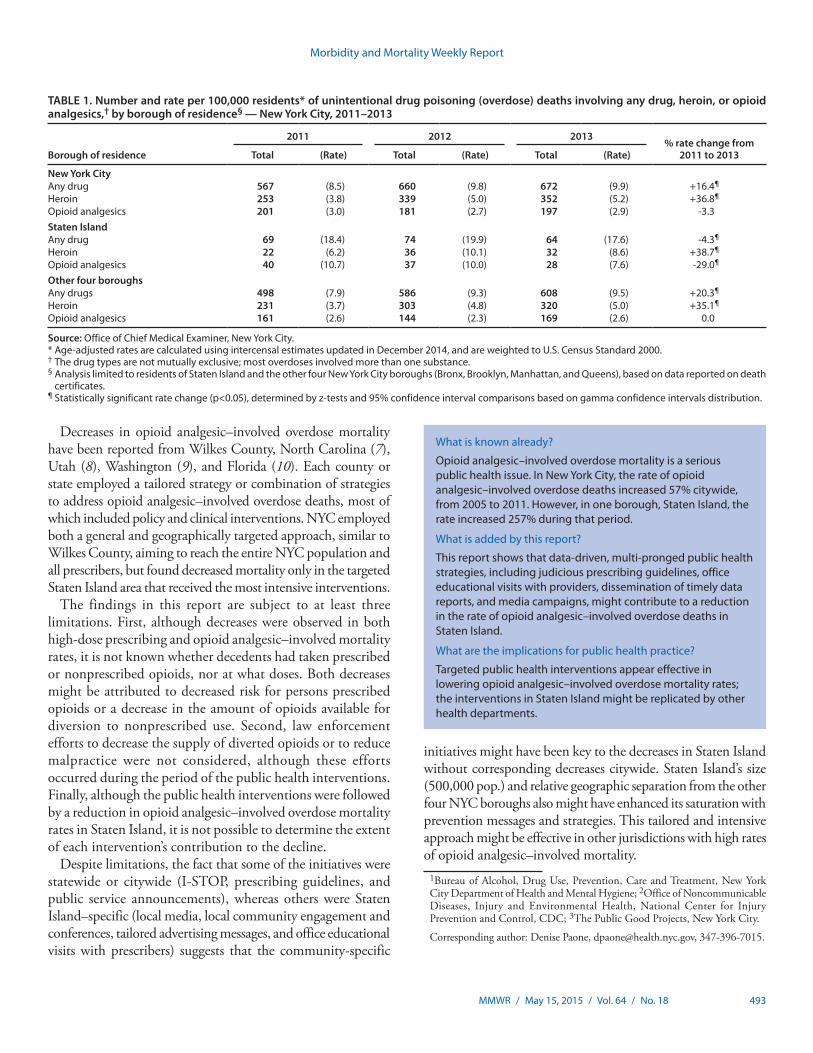
From 2000 to 2011, the rate of unintentional drug poison-ing (overdose) deaths involving opioid analgesics increased 435% in Staten Island, from 2.0 to 10.7 per 100,000 residents. During 2005–2011, disparities widened between Staten Island and the other four New York City (NYC) boroughs (Bronx, Brooklyn, Manhattan, and Queens) (1); in 2011, the rate in Staten Island was 3.0–4.5 times higher than in the other boroughs. In response, the NYC Department of Health and Mental Hygiene (DOHMH) implemented a comprehensive five-part public health strategy, with both citywide and Staten Island–targeted efforts: 1) citywide opioid prescribing guide-lines, 2) a data brief for local media highlighting Staten Island mortality and prescribing data, 3) Staten Island town hall meetings convened by the NYC commissioner of health and meetings with Staten Island stakeholders, 4) a Staten Island campaign to promote prescribing guidelines, and 5) citywide airing of public service announcements with additional airing in Staten Island. Concurrently, the New York state legislature enacted the Internet System for Tracking Over-Prescribing (I-STOP), a law requiring prescribers to review the state prescription monitoring system before prescribing controlled substances. This report describes a 29% decline in the opioid analgesic–involved overdose death rate in Staten Island from 2011 to 2013, while the rate did not change in the other four NYC boroughs, and compares opioid analgesic prescribing data for Staten Island with data for the other boroughs. Targeted public health interventions might be effective in lowering opioid analgesic–involved overdose mortality rates.
In NYC, the rate of opioid analgesic–involved overdose deaths increased 57% from 2005 to 2011, from 2.1 to 3.3 per 100,000 residents. While rates increased citywide, the rate in Staten Island increased 257% during the same period, from 3.0 to 10.7 per 100,000 residents (Figure). In April 2011, DOHMH reported citywide opioid analgesic–involved overdose mortality, highlighting the disproportionately high rates in Staten Island (2). This report received substantial media coverage, particularly among Staten Island local news outlets. In November 2011, DOHMH published opioid prescribing guidelines for general medical providers with the following key messages: 1) a 3-day supply of short-acting opioid analgesic is usually sufficient for acute pain, 2) avoid prescribing opioid analgesics for chronic noncancer pain, 3) avoid high-dose opioid analgesic prescrip-tions, and 4) avoid prescribing opioid analgesics to patients
taking benzodiazepines (3). In January 2013, DOHMH released opioid prescribing guidelines for emergency departments (4) that were adopted citywide by 39 emergency departments, including both of Staten Island’s hospitals.
Throughout 2013, DOHMH met in Staten Island with local hospital, addiction treatment, and syringe exchange programs, as well as local politicians to share overdose mortality trends and guidelines. In June 2013, the commissioner of health held two conferences for Staten Island physicians on judicious opioid prescribing. These guidelines were promoted to Staten Island prescribers via one-to-one office educational visits in which DOHMH recommendations, resources, and tools were disseminated. During 2012–2014, DOHMH aired two television advertisements highlighting the risks of opioid analgesics citywide, with additional airtime in Staten Island. These interventions occurred in close temporal proximity to the enactment and media coverage of I-STOP, state legislation implemented in August 2013 that requires providers to consult the state Prescription Monitoring Program, a registry of controlled-substance prescriptions filled by New Yorkers, before prescribing or dispensing Schedule II, III, or IV controlled substances.
To evaluate the impact of the public health interventions, DOHMH assessed changes in unintentional opioid analgesic–involved overdose mortality rates and changes in opioid analgesic prescribing patterns. Mortality data were derived from two linked sources, NYC death certificates and toxicology findings from the Office of the Chief Medical Examiner. Deaths were defined as unintentional drug poisoning (overdose) if the medical examiner determined manner of death as accidental and the underlying or multiple cause code was assigned an ICD-10 code of X40–X44, F11–F16, or F18–F19 (excluding F-codes with 0.2 or 0.6 third digit). Toxicology metabolites were abstracted from medical examiner files and linked to death certificate data.
Toxicology findings were used to describe the drugs involved in overdose deaths. Methadone-involved overdose deaths were reported separately, because there are approximately 30,000 New Yorkers maintained on methadone for opioid use disorders. Staten Island opioid analgesic–involved overdose rates were compared with the other four NYC boroughs combined. Overall, overdose rates also were assessed to determine whether changes in opioid analgesic–involved overdose rates were offset by changes in other drug poisonings, principally heroin.
Decrease in Rate of Opioid Analgesic Overdose Deaths — Staten Island, New York City, 2011–2013
Denise Paone, EdD1, Ellenie Tuazon, MPH1, Jessica Kattan, MD1, Michelle L. Nolan, MPH1, Daniella Bradley O’Brien1, Deborah Dowell, MD2, Thomas A. Farley, MD3, Hillary V. Kunins, MD1 (Author affiliations at end of text)

Morbidity and Mortality Weekly Report
492 MMWR / May 15, 2015 / Vol. 64 / No. 18
Data for opioid analgesic prescriptions filled by NYC residents were derived from the New York State Prescription Monitoring Program. DOHMH assessed median day supply and the fill rates of prescriptions and high morphine equivalent–dose prescriptions (>100 morphine milligram equivalents) (5) by borough of patient residence.
Age-adjusted rates were calculated using NYC population estimates for the period 2000–2013 and the U.S. Census 2000 standard population. To evaluate the impact of the public health interventions, prescription rates were compared annually and for the fourth quarters (October–December) during 2011–2013. Given that both office educational visits with Staten Island prescribers and implementation of I-STOP occurred in the third quarter of 2013, the fourth quarter of 2013 was compared with the fourth quarters of 2011 and 2012. Rate changes were tested using z-tests and 95% confidence intervals; comparisons were based on gamma confidence intervals distribution (6).
From 2000 to 2011, Staten Island residents had the highest rate of opioid analgesic–involved overdose mortality
in NYC. From 2005 to 2011, the rate increased 257% in Staten Island, compared with a 44% increase in the other four boroughs combined. After implementation of the public health initiatives, opioid analgesic mortality rates decreased 29% from 2011 to 2013, from 10.7 to 7.6 per 100,000 Staten Island residents (Table 1). In comparison, the rate for the other four boroughs combined did not change from 2011 to 2013 (2.6 per 100,000 residents, for both years). Among Staten Island residents, the rate of heroin-involved overdose deaths fluctuated but had a net increase of 39% from 2011 to 2013, from 6.2 in 2011 to 8.6 per 100,000 residents in 2013. Among the other four boroughs combined, heroin-involved overdose deaths increased 35% during the same period (from 3.7 in 2011 to 5.0 per 100,000 residents in 2013). In Staten Island, overall drug-involved overdose deaths decreased 4% from 2011 to 2013, from a rate of 18.4 to 17.6 per 100,000 residents. During that period, the rate for the other four boroughs increased 20%, from 7.9 to 9.5 per 100,000.
The median day supply for filled opioid analgesic prescriptions for Staten Island residents was unchanged during 2011–2013 (30 days). In contrast, the median day supply for the other four boroughs was lower, but increased from 2011 to 2013, from 15 to 20 days (Table 2).
In 2011, Staten Island residents filled opioid analgesic prescriptions at a higher rate (502.0 per 1,000 residents) than did residents of the other four boroughs (236.7) and filled high-dose prescriptions at rates three times higher (132.4) than residents of the other boroughs (40.7) (Table 2). In 2012, the rate of opioid analgesic prescriptions filled decreased in all boroughs, whereas rates of high-dose prescriptions increased slightly. Compared with 2011, in 2013 the opioid analgesic prescriptions fill rate continued to decrease for residents of all boroughs, by 9.8% in Staten Island (to 452.9 per 1,000 residents) and by 8.2% (to 217.2) elsewhere. The rate of high dose prescriptions decreased 8.2% (to 121.6 per 1,000 residents) in Staten Island while increasing 4.7% (to 42.6) in the other four boroughs. The decrease in Staten Island rates of high dose prescriptions continued in the final quarter of 2013.
Discussion
After implementation of targeted and general public health initiatives, Staten Island saw 2 years of decreases in opioid analgesic high-dose prescribing and opioid analgesic–involved overdose mortality; the decreases followed 11 years of increases. In contrast, high-dose prescribing in the other four NYC boroughs increased without changes in opioid analgesic–involved overdose mortality rates. In addition, the decreases in opioid analgesic overdoses on Staten Island were not offset by increases in heroin-involved overdose mortality.
FIGURE. Age-adjusted rate of unintentional drug poisoning (overdose) deaths involving opioid analgesics, by borough of residence, and New York City public health interventions — 2007–2013
Staten IslandAll other boroughs
* † § ¶ ** †† §§ ¶¶
0
2
4
6
8
10
12
Age
-adj
uste
d de
aths
per
100
,000
resi
dent
s
Year201220112010200920082007 2013
14
Source: New York City Office of the Chief Medical Examiner and New York City Department of Health and Mental Hygiene 2007–2013. * April 2011: Distributed a data brief citywide that highlighted overdose
mortality and prescription use in Staten Island. † November 2011: Distributed opioid prescribing guidelines to all providers citywide. § May 2012: Ran first public service announcement campaign citywide. ¶ August 2012: State legislation passed mandating use of the prescription
monitoring program. ** January 2013: Distributed opioid prescribing guidelines to emergency
departments citywide. †† June 2013: Town halls convened in Staten Island by New York City
commissioner of health and meeting held with Staten Island stakeholders. Implemented detailing campaign to promote opioid prescribing guidelines to prescribers in Staten Island.
§§ August 2013: Statewide mandatory prescriber use of prescription monitoring program begun.
¶¶ December 2013: Ran second public service announcement campaign citywide with additional targeted airing in Staten Island.
Morbidity and Mortality Weekly Report
MMWR / May 15, 2015 / Vol. 64 / No. 18 493
Decreases in opioid analgesic–involved overdose mortality have been reported from Wilkes County, North Carolina (7), Utah (8), Washington (9), and Florida (10). Each county or state employed a tailored strategy or combination of strategies to address opioid analgesic–involved overdose deaths, most of which included policy and clinical interventions. NYC employed both a general and geographically targeted approach, similar to Wilkes County, aiming to reach the entire NYC population and all prescribers, but found decreased mortality only in the targeted Staten Island area that received the most intensive interventions.
The findings in this report are subject to at least three limitations. First, although decreases were observed in both high-dose prescribing and opioid analgesic–involved mortality rates, it is not known whether decedents had taken prescribed or nonprescribed opioids, nor at what doses. Both decreases might be attributed to decreased risk for persons prescribed opioids or a decrease in the amount of opioids available for diversion to nonprescribed use. Second, law enforcement efforts to decrease the supply of diverted opioids or to reduce malpractice were not considered, although these efforts occurred during the period of the public health interventions. Finally, although the public health interventions were followed by a reduction in opioid analgesic–involved overdose mortality rates in Staten Island, it is not possible to determine the extent of each intervention’s contribution to the decline.
Despite limitations, the fact that some of the initiatives were statewide or citywide (I-STOP, prescribing guidelines, and public service announcements), whereas others were Staten Island–specific (local media, local community engagement and conferences, tailored advertising messages, and office educational visits with prescribers) suggests that the community-specific
initiatives might have been key to the decreases in Staten Island without corresponding decreases citywide. Staten Island’s size (500,000 pop.) and relative geographic separation from the other four NYC boroughs also might have enhanced its saturation with prevention messages and strategies. This tailored and intensive approach might be effective in other jurisdictions with high rates of opioid analgesic–involved mortality. 1Bureau of Alcohol, Drug Use, Prevention, Care and Treatment, New York
City Department of Health and Mental Hygiene; 2Office of Noncommunicable Diseases, Injury and Environmental Health, National Center for Injury Prevention and Control, CDC; 3The Public Good Projects, New York City.
Corresponding author: Denise Paone, [email protected], 347-396-7015.
TABLE 1. Number and rate per 100,000 residents* of unintentional drug poisoning (overdose) deaths involving any drug, heroin, or opioid analgesics,† by borough of residence§ — New York City, 2011–2013
Borough of residence
2011 2012 2013% rate change from
2011 to 2013Total (Rate) Total (Rate) Total (Rate)
New York CityAny drug 567 (8.5) 660 (9.8) 672 (9.9) +16.4¶
Heroin 253 (3.8) 339 (5.0) 352 (5.2) +36.8¶
Opioid analgesics 201 (3.0) 181 (2.7) 197 (2.9) -3.3Staten IslandAny drug 69 (18.4) 74 (19.9) 64 (17.6) -4.3¶
Heroin 22 (6.2) 36 (10.1) 32 (8.6) +38.7¶
Opioid analgesics 40 (10.7) 37 (10.0) 28 (7.6) -29.0¶
Other four boroughsAny drugs 498 (7.9) 586 (9.3) 608 (9.5) +20.3¶
Heroin 231 (3.7) 303 (4.8) 320 (5.0) +35.1¶
Opioid analgesics 161 (2.6) 144 (2.3) 169 (2.6) 0.0
Source: Office of Chief Medical Examiner, New York City.* Age-adjusted rates are calculated using intercensal estimates updated in December 2014, and are weighted to U.S. Census Standard 2000.† The drug types are not mutually exclusive; most overdoses involved more than one substance.§ Analysis limited to residents of Staten Island and the other four New York City boroughs (Bronx, Brooklyn, Manhattan, and Queens), based on data reported on death
certificates.¶ Statistically significant rate change (p<0.05), determined by z-tests and 95% confidence interval comparisons based on gamma confidence intervals distribution.
What is known already?
Opioid analgesic–involved overdose mortality is a serious public health issue. In New York City, the rate of opioid analgesic–involved overdose deaths increased 57% citywide, from 2005 to 2011. However, in one borough, Staten Island, the rate increased 257% during that period.
What is added by this report?
This report shows that data-driven, multi-pronged public health strategies, including judicious prescribing guidelines, office educational visits with providers, dissemination of timely data reports, and media campaigns, might contribute to a reduction in the rate of opioid analgesic–involved overdose deaths in Staten Island.
What are the implications for public health practice?
Targeted public health interventions appear effective in lowering opioid analgesic–involved overdose mortality rates; the interventions in Staten Island might be replicated by other health departments.

Morbidity and Mortality Weekly Report
494 MMWR / May 15, 2015 / Vol. 64 / No. 18
References1. Paone D, Tuazon E, Bradley O’Brien D. Unintentional opioid analgesic
poisoning (overdose) deaths in New York City, 2011. New York City Department of Health and Mental Hygiene: Epi Data Brief no. 27; May 2013.
2. Paone D, Bradley O’Brien D, Shah S, Heller D. Opioid analgesics in New York City: misuse, morbidity, and mortality update. New York City Department of Health and Mental Hygiene: Epi Data Brief no. 3; April 2011.
3. Paone D, Dowell D, Heller D. Preventing misuse of prescription opioid drugs. City Health Information 2011;30:23–30.
4. Kunins HV, Farley TA, Dowell D. Guidelines for opioid prescription: why emergency physicians need support. Ann Intern Med 2013;158:841–2.
5. Bohnert AS, Valenstein M, Bair MJ, et al. Association between opioid prescribing patterns and opioid overdose-related deaths. JAMA 2011;305:1315–21.
TABLE 2. Number and rate per 1,000 residents* of annual and quarterly (October–December) opioid analgesic prescriptions and high morphine equivalent dose prescriptions received,† by borough of residence§ — New York City, 2011–2013
Borough of residence
2011 2012 2013% rate change from
2011 to 2013¶Total (Rate) Total (Rate) Total (Rate)
New York CityOpioid analgesic prescriptions 2,172,238 (251.9) 2,167,719 (248.4) 2,029,541 (230.6) -8.5%High morphine equivalent dose
prescriptions395,605 (45.8) 419,476 (48.1) 413,801 (47.0) +2.6%
Staten IslandOpioid analgesic prescriptions 251,705 (502.0) 245,449 (487.3) 231,139 (452.9) -9.8%High morphine equivalent dose
prescriptions65,310 (132.4) 66,007 (133.7) 60,866 (121.6) -8.2%
Other four boroughsOpioid analgesic prescriptions 1,920,544 (236.7) 1,922,270 (234.1) 1,798,402 (217.2) -8.2%High morphine equivalent dose
prescriptions330,276 (40.7) 353,469 (43.1) 352,935 (42.6) +4.7%
Median days supply of drugNew York City 16 — 20 — 20 — —Staten Island 30 — 30 — 30 — —Other four boroughs 15 — 17 — 20 — —
Borough of residence
October–December 2011 October–December 2012 October–December 2013 % rate change from October–December 2011 to October–December 2013¶Total (Rate) Total (Rate) Total (Rate)
New York CityOpioid analgesic prescriptions 553,650 (64.2) 531,109 (60.9) 496,100 (56.3) -12.3%High morphine equivalent dose
prescriptions107,013 (12.4) 105,477 (12.1) 104,886 (11.9) -4.0%
Staten IslandOpioid analgesic prescriptions 63,676 (127.0) 58,234 (115.3) 56,769 (110.7) -12.8%High morphine equivalent dose
prescriptions17,098 (34.7) 15,611 (31.5) 15,011 (29.9) -13.8%
Other four boroughsOpioid analgesic prescriptions 489,974 (60.4) 472,875 (57.6) 439,331 (53.0) -12.3%High morphine equivalent dose
prescriptions89,915 (11.1) 89,866 (11.0) 89,875 (10.9) -1.8%
Source: Bureau of Narcotic Enforcement, Prescription Drug Monitoring Program, New York State Department of Health, 2011–2013.* Age-adjusted rates are calculated using intercensal estimates updated in December 2014, and are weighted to U.S. Census Standard 2000.† Analysis includes prescriptions written for Schedule II (excluding codeine-2) and hydrocodone. Prescriptions written by veterinarians, or written under institutional
licenses, or prescriptions with missing prescriber ID, or missing patient ID are excluded. Morphine equivalent dose (MED) is the equivalent of 1 mg of morphine; high MED prescriptions are greater than 100 MED.
§ Analysis limited to residents of Staten Island and the other four New York City boroughs (Bronx, Brooklyn, Manhattan, and Queens).¶ All rate changes were statistically significant (p<0.05).
6. Fay MP, Feuer EJ. Confidence intervals for directly standardized rates: a method based on the gamma distribution. Stat Med 1997;16:791–801.
7. Albert S, Brason FW 2nd, Sanford CK, Dasgupta N, Graham J, Lovette B. Project Lazarus: community-based overdose prevention in rural North Carolina. Pain Med 2011;12(Suppl 2):S77–85.
8. Cochella S, Bateman K. Provider detailing: an intervention to decrease prescription opioid deaths in Utah. Pain Med 2011;12(Suppl 2):S73–6.
9. Franklin GM, Mai J, Turner J, Sullivan M, Wickizer T, Fulton-Kehoe D. Bending the prescription opioid dosing and mortality curves: impact of the Washington State opioid dosing guideline. Am J Ind Med 2012;55:325–31.
10. Johnson H, Paulozzi L, Porucznik C, Mack K, Herter B. Decline in drug overdose deaths after state policy changes—Florida, 2010–2012. MMWR Morb Mortal Wkly Rep 2014;63:569–74.
Morbidity and Mortality Weekly Report
MMWR / May 15, 2015 / Vol. 64 / No. 18 495
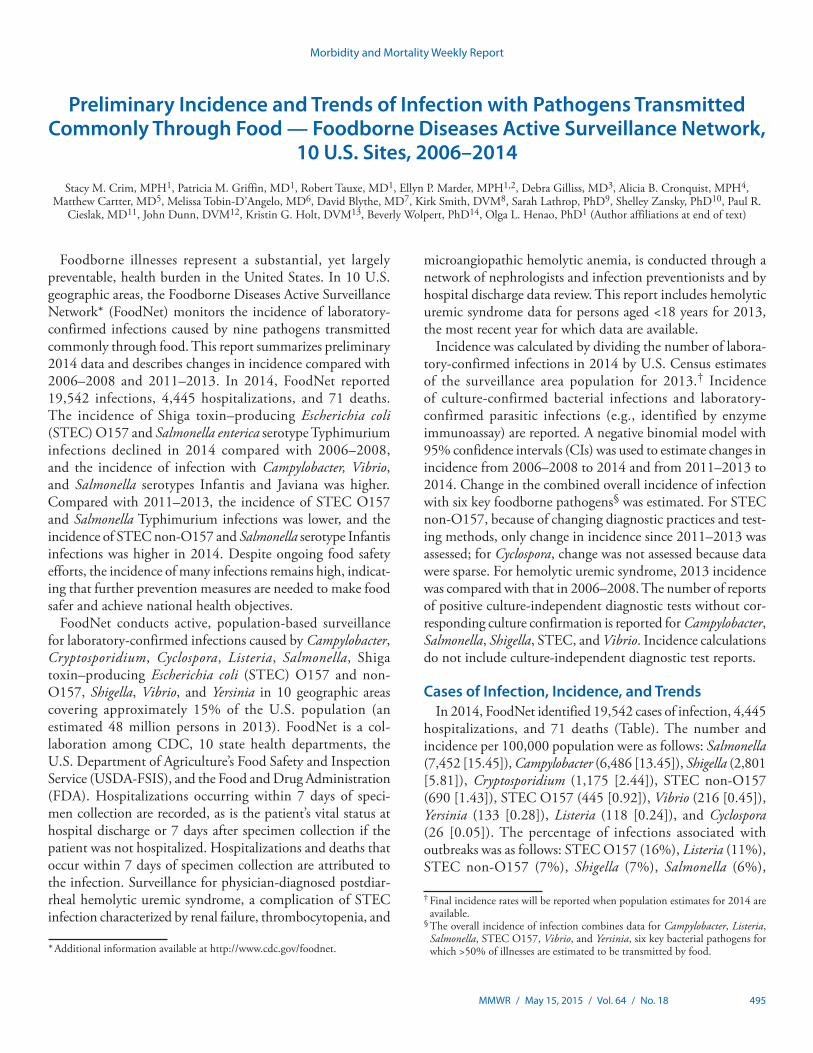
Foodborne illnesses represent a substantial, yet largely preventable, health burden in the United States. In 10 U.S. geographic areas, the Foodborne Diseases Active Surveillance Network* (FoodNet) monitors the incidence of laboratory-confirmed infections caused by nine pathogens transmitted commonly through food. This report summarizes preliminary 2014 data and describes changes in incidence compared with 2006–2008 and 2011–2013. In 2014, FoodNet reported 19,542 infections, 4,445 hospitalizations, and 71 deaths. The incidence of Shiga toxin–producing Escherichia coli (STEC) O157 and Salmonella enterica serotype Typhimurium infections declined in 2014 compared with 2006–2008, and the incidence of infection with Campylobacter, Vibrio, and Salmonella serotypes Infantis and Javiana was higher. Compared with 2011–2013, the incidence of STEC O157 and Salmonella Typhimurium infections was lower, and the incidence of STEC non-O157 and Salmonella serotype Infantis infections was higher in 2014. Despite ongoing food safety efforts, the incidence of many infections remains high, indicat-ing that further prevention measures are needed to make food safer and achieve national health objectives.
FoodNet conducts active, population-based surveillance for laboratory-confirmed infections caused by Campylobacter, Cryptosporidium, Cyclospora, Listeria, Salmonella, Shiga toxin–producing Escherichia coli (STEC) O157 and non-O157, Shigella, Vibrio, and Yersinia in 10 geographic areas covering approximately 15% of the U.S. population (an estimated 48 million persons in 2013). FoodNet is a col-laboration among CDC, 10 state health departments, the U.S. Department of Agriculture’s Food Safety and Inspection Service (USDA-FSIS), and the Food and Drug Administration (FDA). Hospitalizations occurring within 7 days of speci-men collection are recorded, as is the patient’s vital status at hospital discharge or 7 days after specimen collection if the patient was not hospitalized. Hospitalizations and deaths that occur within 7 days of specimen collection are attributed to the infection. Surveillance for physician-diagnosed postdiar-rheal hemolytic uremic syndrome, a complication of STEC infection characterized by renal failure, thrombocytopenia, and
microangiopathic hemolytic anemia, is conducted through a network of nephrologists and infection preventionists and by hospital discharge data review. This report includes hemolytic uremic syndrome data for persons aged <18 years for 2013, the most recent year for which data are available.
Incidence was calculated by dividing the number of labora-tory-confirmed infections in 2014 by U.S. Census estimates of the surveillance area population for 2013.† Incidence of culture-confirmed bacterial infections and laboratory-confirmed parasitic infections (e.g., identified by enzyme immunoassay) are reported. A negative binomial model with 95% confidence intervals (CIs) was used to estimate changes in incidence from 2006–2008 to 2014 and from 2011–2013 to 2014. Change in the combined overall incidence of infection with six key foodborne pathogens§ was estimated. For STEC non-O157, because of changing diagnostic practices and test-ing methods, only change in incidence since 2011–2013 was assessed; for Cyclospora, change was not assessed because data were sparse. For hemolytic uremic syndrome, 2013 incidence was compared with that in 2006–2008. The number of reports of positive culture-independent diagnostic tests without cor-responding culture confirmation is reported for Campylobacter, Salmonella, Shigella, STEC, and Vibrio. Incidence calculations do not include culture-independent diagnostic test reports.
Cases of Infection, Incidence, and TrendsIn 2014, FoodNet identified 19,542 cases of infection, 4,445
hospitalizations, and 71 deaths (Table). The number and incidence per 100,000 population were as follows: Salmonella (7,452 [15.45]), Campylobacter (6,486 [13.45]), Shigella (2,801 [5.81]), Cryptosporidium (1,175 [2.44]), STEC non-O157 (690 [1.43]), STEC O157 (445 [0.92]), Vibrio (216 [0.45]), Yersinia (133 [0.28]), Listeria (118 [0.24]), and Cyclospora (26 [0.05]). The percentage of infections associated with outbreaks was as follows: STEC O157 (16%), Listeria (11%), STEC non-O157 (7%), Shigella (7%), Salmonella (6%),
Preliminary Incidence and Trends of Infection with Pathogens Transmitted Commonly Through Food — Foodborne Diseases Active Surveillance Network,
10 U.S. Sites, 2006–2014Stacy M. Crim, MPH1, Patricia M. Griffin, MD1, Robert Tauxe, MD1, Ellyn P. Marder, MPH1,2, Debra Gilliss, MD3, Alicia B. Cronquist, MPH4,
Matthew Cartter, MD5, Melissa Tobin-D’Angelo, MD6, David Blythe, MD7, Kirk Smith, DVM8, Sarah Lathrop, PhD9, Shelley Zansky, PhD10, Paul R. Cieslak, MD11, John Dunn, DVM12, Kristin G. Holt, DVM13, Beverly Wolpert, PhD14, Olga L. Henao, PhD1 (Author affiliations at end of text)
* Additional information available at http://www.cdc.gov/foodnet.
† Final incidence rates will be reported when population estimates for 2014 are available.
§ The overall incidence of infection combines data for Campylobacter, Listeria, Salmonella, STEC O157, Vibrio, and Yersinia, six key bacterial pathogens for which >50% of illnesses are estimated to be transmitted by food.

Morbidity and Mortality Weekly Report
496 MMWR / May 15, 2015 / Vol. 64 / No. 18
Vibrio (6%), Cryptosporidium (5%), Yersinia (0.8%), and Campylobacter (0.6%).
Among 6,565 (88%) serotyped Salmonella isolates in 2014, the number and incidence per 100,000 population of the top six serotypes were as follows: Enteritidis (1,401 [2.90]), Typhimurium (806 [1.67]), Newport (724 [1.50]), Javiana (639 [1.32]), I 4,[5],12:i:- (381 [0.79]), and Infantis (235 [0.49]). Among 208 (96%) speciated Vibrio isolates, 131 (63%) were V. parahaemolyticus, 27 (13%) were V. alginolyticus, and 19 (9%) were V. vulnificus. Among 546 (79%) serogrouped STEC non-O157 isolates, the top serogroups were O26 (31%), O103 (24%), and O111 (19%).
Compared with 2006–2008, the 2014 incidence was signifi-cantly lower for STEC O157 (32% decrease; CI = 18%–43%) and Yersinia (22% decrease; CI = 1%–39%) infections, higher for Vibrio (52% increase; CI = 22%–89%) and Campylobacter (13% increase; CI = 5%–21%) infections, and not significantly changed for other pathogens (Figure 1). Among the six most commonly identified Salmonella serotypes, the incidence was significantly lower in 2014 for Typhimurium (27% decrease; CI = 18%–35%) compared with 2006–2008, but significantly higher for Infantis (162% increase; CI = 100%–244%) and Javiana (131% increase; CI = 83%–191%). Incidence for the three serotypes with significant changes in 2014 was calculated for the period 2006–2014 (Figure 2). Compared with 2011–2013, the 2014 incidence was significantly lower for STEC O157 and Salmonella serotype Typhimurium infections and higher for STEC non-O157 and Salmonella serotype Infantis infections. The overall incidence of infection with the six key foodborne pathogens was not significantly different from either of the comparison periods.
In 2013, a total of 87 cases of postdiarrheal hemolytic uremic syndrome were reported among children aged <18 years (0.79 cases per 100,000). Of these, 46 (53%) occurred in children aged <5 years (1.55 cases per 100,000). The incidence of hemolytic uremic syndrome was not significantly different than during 2006–2008 for either age group. No deaths were reported.
In addition to culture-confirmed infections (some with positive culture-independent diagnostic test results), there were 1,597 reports of positive culture-independent diagnostic tests that were not confirmed by culture, either because a cul-ture did not yield the pathogen or because the specimen was not cultured. These reports were not included in the overall count of cases. Among 1,070 Campylobacter reports in this category, 553 (52%) had no culture, and 517 (48%) were culture-negative. Among 146 STEC reports, 62 (42%) had no culture, and 84 (58%) were culture-negative. The Shiga toxin–positive result was confirmed for 65 (48%) of 135 broths sent to a public health laboratory. The other reports of positive culture-independent diagnostic tests where culture was negative or not performed were of Salmonella (193), Shigella (186), and Vibrio (two).
Discussion
In 2014, the incidence of laboratory-confirmed Shiga toxin–producing E. coli O157 and Salmonella serotype Typhimurium infections was significantly lower than during 2006–2008, whereas the incidence of Campylobacter, Vibrio, and Salmonella serotypes Javiana and Infantis infections was higher. Compared with 2011–2013, incidence of STEC non-O157 and Salmonella serotype Infantis infection was significantly higher.
TABLE. Number of cases of culture-confirmed bacterial and laboratory-confirmed parasitic infection, hospitalizations, and deaths, by pathogen — Foodborne Diseases Active Surveillance Network, United States, 2014*
Pathogen
Cases Hospitalizations Deaths
No. Incidence† Objective§ No. (%) No. (%)
BacteriaCampylobacter 6,486 13.45 8.5 1,080 (17) 11 (0.2)Listeria 118 0.24 0.2 108 (92) 18 (15.3)Salmonella 7,452 15.45 11.4 2,141 (29) 30 (0.4)Shigella 2,801 5.81 N/A¶ 569 (20) 2 (0.1)STEC O157 445 0.92 0.6 154 (35) 3 (0.7)STEC non-O157 690 1.43 N/A 104 (15) 0 (0.0)Vibrio 216 0.45 0.2 40 (19) 2 (0.9)Yersinia 133 0.28 0.3 30 (23) 1 (0.8)ParasitesCryptosporidium 1,175 2.44 N/A 217 (18) 4 (0.3)Cyclospora 26 0.05 N/A 2 (8) 0 (0.0)Total 19,542 4,445 71
Abbreviations: N/A = not available; STEC = Shiga toxin–producing Escherichia coli.* Data for 2014 are preliminary.† Per 100,000 population.§ Healthy People 2020 objective targets for incidence of Campylobacter, Listeria, Salmonella, STEC O157, Vibrio, and Yersinia infections per 100,000 population.¶ No national health objective exists for these pathogens.

Morbidity and Mortality Weekly Report
MMWR / May 15, 2015 / Vol. 64 / No. 18 497
The decrease in the incidence of STEC O157 infections could be attributable to several factors related to food safety efforts. Today, because isolates are routinely sent to public health departments for subtyping by PulseNet,¶ and epidemi-ologists rapidly investigate clusters of illnesses in which bacteria have similar DNA fingerprints, the sources of outbreaks are identified faster than in the past, which allows contaminated products to be removed from the marketplace before more
persons become ill. The most common sources of STEC O157 infection are beef and leafy vegetables (1). After STEC O157 was declared an adulterant in ground beef in 1994, public health officials identified many STEC O157 outbreaks that resulted in ground beef recalls. Substantial changes in beef industry practices and government policy** led to a decrease in ground beef contamination (2). Contamination of ground beef with STEC O157 has decreased.†† Producers of leafy vegetables have also made improvements after a large outbreak in 2006 (3). It is also possible that a portion of the decrease is related to the increasing use of culture-independent diagnostic tests without confirmatory culture.
The increasing incidence of non-O157 STEC infections is attributable, in part, to an increase in the number of labo-ratories testing for Shiga toxin and, consequently, increased recognition of non-O157 STEC infections (4). Six serogroups (O26, O45, O103, O111, O121, and O145) are considered adulterants in non-intact beef products or the components of these products. In 2012, USDA-FSIS began testing for non-O157 STEC in domestic and imported beef manufacturing trimmings.§§
Salmonella serotypes are diverse in reservoirs and sources. The unchanged overall incidence of salmonellosis masks substantial changes in infection with individual serotypes. Typhimurium, the most common serotype reported to FoodNet until 2009, has contaminated a wide variety of food sources, including cattle and poultry. The incidence of Typhimurium infections nationwide has been declining since the mid-1980s, for reasons that are unclear (5). An analysis of outbreak data from 1998 to 2008 estimated that 34% of Typhimurium infections were related to consumption of poultry (1). Decreases in contamina-tion of whole chickens with Salmonella serotype Typhimurium, as reported by USDA-FSIS¶¶ (Kristin Holt, USDA-FSIS; personal communication, 2013–2014 data, 2015), might have contributed to the decline. In July 2011, USDA-FSIS tightened the performance standards for Salmonella on poul-try carcasses, and, in December 2013, released an action plan to decrease contamination in regulated products.*** Poultry vaccines against Salmonella have been used increasingly, first
FIGURE 1. Relative rates of culture-confirmed infections with Campylobacter, STEC* O157, Listeria, Salmonella, and Vibrio compared with 2006–2008 rates, by year — Foodborne Diseases Active Surveillance Network, United States, 2006–2014†
0.5
1.0
2.0
VibrioListeriaCampylobacterSalmonellaSTEC O157
3.0
Rela
tive
rate
(log
sca
le)
2006–2008 2009 2010 2011 2012 2013 2014Year
* Shiga toxin–producing Escherichia coli.† The position of each line indicates the relative change in the incidence of that
pathogen compared with 2006–2008. The actual incidences of these infections cannot be determined from this figure.
FIGURE 2. Incidence per 100,000 population of culture-confirmed infection with Salmonella serotypes Typhimurium, Javiana, and Infantis, by year — Foodborne Diseases Active Surveillance Network, United States, 2006–2014
TyphimuriumJavianaInfantis
0
0.5
1.0
1.5
2.0
2.5
3.0
2006 2007 2008 2009 2010 2011 2012 2013 2014
Inci
denc
e pe
r 100
,000
pop
ulat
ion
Year
¶ PulseNet is the national molecular subtyping network for foodborne bacterial pathogens.
** The Federal Register notice is available at http://www.fsis.usda.gov/wps/wcm/connect/ed6d4959-a499-4e6e-af86-ae8a419ba156/00-022N.htm?MOD=AJPERES.
†† Data on ground beef contamination by year are available at http://www.fsis.usda.gov/wps/portal/fsis/topics/data-collection-and-reports/microbiology/ec/positive-results-current-cy/positive-results-current-cy.
§§ More information is available at http://www.fsis.usda.gov/wps/portal/frame-redirect?url=http://www.fsis.usda.gov/OPPDE/rdad/FRPubs/2010-0023FRN.htm.
¶¶ FSIS serotype report through 2012 available at http://www.fsis.usda.gov/wps/wcm/connect/180fc804-0311-4b4d-ae42-d735e8232e1c/Salmonella-Serotype-Annual-2012.pdf?MOD=AJPERES.
*** More information is available at http://www.fsis.usda.gov/wps/wcm/connect/aae911af-f918-4fe1-bc42-7b957b2e942a/SAP-120413.pdf?MOD=AJPERES.

Morbidity and Mortality Weekly Report
498 MMWR / May 15, 2015 / Vol. 64 / No. 18
in egg-laying flocks, and to a lesser extent in broiler breeder flocks.††† Salmonella serotype Javiana infection is concentrated in southeastern states; the number of counties with annual infection rates above one case per 100,000 both inside and out-side the southeast has increased markedly since the 1990s (5).
Additional regulations and ongoing industry efforts are likely to improve food safety. In January 2015, USDA-FSIS proposed new pathogen-reduction performance standards for Salmonella and Campylobacter in comminuted (reduced to minute particles) chicken and turkey products as well as raw chicken parts, such as chicken breasts, thighs, and wings.§§§ In 2015, FDA plans to publish regulations for safer produce, processed foods, and imported foods, as mandated by the Food Safety Modernization Act (6). Vaccination of breeder poultry flocks, in combination with biosecurity measures, has been shown to reduce contamination of poultry meat (7).
The findings in this report are subject to at least four limitations. First, increasing use of culture-independent tests by clinical laboratories might affect the number of culture-confirmed infections reported; culture-independent testing might increase (as observed for STEC non-O157 infections) or decrease (because fewer cases might be diagnosed through traditional methods) reported incidence (8). Second, health care–seeking behaviors and other characteristics of the popula-tion in the surveillance area might affect the generalizability of the findings. Third, the proportion of illnesses transmitted by nonfood routes differs by pathogen; data provided in this report are not limited to infections from food. Finally, changes in incidence between periods can reflect year-to-year variation during those periods rather than sustained trends, and the number of infections and patterns observed might change as final data become available.
Progress has been made in decreasing contamination of some foods and reducing illness caused by some pathogens. However, little or no recent reductions for most infections have occurred. For example, Campylobacter and Vibrio rates are still higher than during 2006–2008, a pattern also observed in 2013 (9). More information is needed to understand sources of infection and changes in incidence, and to help determine where to target prevention efforts.
Acknowledgments
Workgroup members, Foodborne Diseases Active Surveillance Network (FoodNet), Emerging Infections Program. Elizabeth Pembleton, MPH, Staci Dixon, MA, Mandip Kaur, MPH, Martha Iwamoto, MD, Enteric Diseases Epidemiology Branch, Division of Foodborne, Waterborne, and Environmental Diseases, National Center for Emerging and Zoonotic Infectious Diseases, CDC. Communications team, Division of Foodborne, Waterborne, and Environmental Diseases, National Center for Emerging and Zoonotic Diseases, CDC. Joanna Zablotsky Kufel, PhD, Alice Green, DVM, Food Safety and Inspection Service, US Department of Agriculture.
1Division of Foodborne, Waterborne, and Environmental Diseases, National Center for Emerging and Zoonotic Infectious Diseases, CDC; 2Atlanta Research and Education Foundation; 3California Department of Public Health; 4Colorado Department of Public Health and Environment; 5Connecticut Department of Public Health; 6Georgia Department of Public Health; 7Maryland Department of Health and Mental Hygiene; 8Minnesota Department of Health; 9University of New Mexico; 10New York State Department of Health; 11Oregon Health Authority; 12Tennessee Department of Health; 13Food Safety and Inspection Service, US Department of Agriculture; 14Center for Food Safety and Applied Nutrition, Food and Drug Administration.
Corresponding author: Olga L. Henao, [email protected], 404-639-3393.
What is already known on this topic?
The incidence of many foodborne infections, including Salmonella, has been largely unchanged for many years. Salmonella infection is a complicated problem because infection can be acquired by many types of foods and from nonfood sources, so many different control methods are needed.
What is added by this report?
The 2014 data show progress in reducing infections from Escherichia coli O157 and Salmonella serotype Typhimurium. However, the incidence of infection with Salmonella serotypes Infantis and Javiana has increased.
What are the implications for public health practice?
Infections caused by E. coli serogroup O157 declined after targeted interventions to reduce contamination of ground beef were implemented. Similarly, to reduce the incidence of Salmonella infection, serotype-specific approaches are required. Public health, regulatory agencies, industry, and consumers can all play a role.
††† More information is available at https://www.avma.org/News/JAVMANews/Pages/101215x.aspx.
§§§ The Federal Register notice is available at http://www.fsis.usda.gov/wps/wcm/connect/b711839a-c0b9-420f-9d74-8568310a1352/2014-0023.htm?MOD=AJPERES.

Morbidity and Mortality Weekly Report
MMWR / May 15, 2015 / Vol. 64 / No. 18 499
References1. Painter JA, Hoekstra RM, Ayers T, et al. Attribution of foodborne illnesses,
hospitalizations, and deaths to food commodities by using outbreak data, United States, 1998–2008. Emerg Infect Dis 2013;19:407–15.
2. Naugle AL, Holt KG, Levine P, Eckel R. Sustained decrease in the rate of Escherichia coli O157:H7-positive raw ground beef samples tested by the food safety and inspection service. J Food Prot 2006;69:480–1.
3. CDC. Ongoing multistate outbreak of Escherichia coli serotype O157:H7 infections associated with consumption of fresh spinach—United States, September 2006. MMWR Morb Mortal Wkly Rep 2006;55:1045–6.
4. Gould LH, Mody RK, Ong KL, et al. Increased recognition of non-O157 Shiga toxin–producing Escherichia coli infections in the United States during 2000-2010: epidemiologic features and comparison with E. coli O157 infections. Foodborne Pathog Dis 2013;10:453–60.
5. CDC. An atlas of Salmonella in the United States, 1968–2011: laboratory-based enteric disease surveillance. Atlanta, GA: US Department of Health and Human Services, CDC; 2013. Available at http://www.cdc.gov/salmonella/reportspubs/salmonella-atlas.
6. Food and Drug Administration. FDA Food Safety Modernization Act. Washington, DC: US Department of Health and Human Services, Food and Drug Administration; 2011. Available at http://www.fda.gov/food/guidanceregulation/fsma/ucm247548.htm.
7. Dórea FC, Cole DJ, Hofacre C, et al. Effect of Salmonella vaccination of breeder chickens on contamination of broiler chicken carcasses in integrated poultry operations. Appl Environ Microbiol 2010;76:7820–5.
8. Iwamoto M, Huang JY, Cronquist AB, et al. Bacterial enteric infections detected by culture-independent diagnostic tests—FoodNet, United States, 2012–2014. MMWR Morb Mortal Wkly Rep 2015;64:252–7.
9. Crim SM, Iwamoto M, Huang JY, et al. Incidence and trends of infection with pathogens transmitted commonly through food—Foodborne Diseases Active Surveillance Network, 10 U.S. sites, 2006–2013. MMWR Morb Mortal Wkly Rep 2014;63:328–32.

Morbidity and Mortality Weekly Report
500 MMWR / May 15, 2015 / Vol. 64 / No. 18
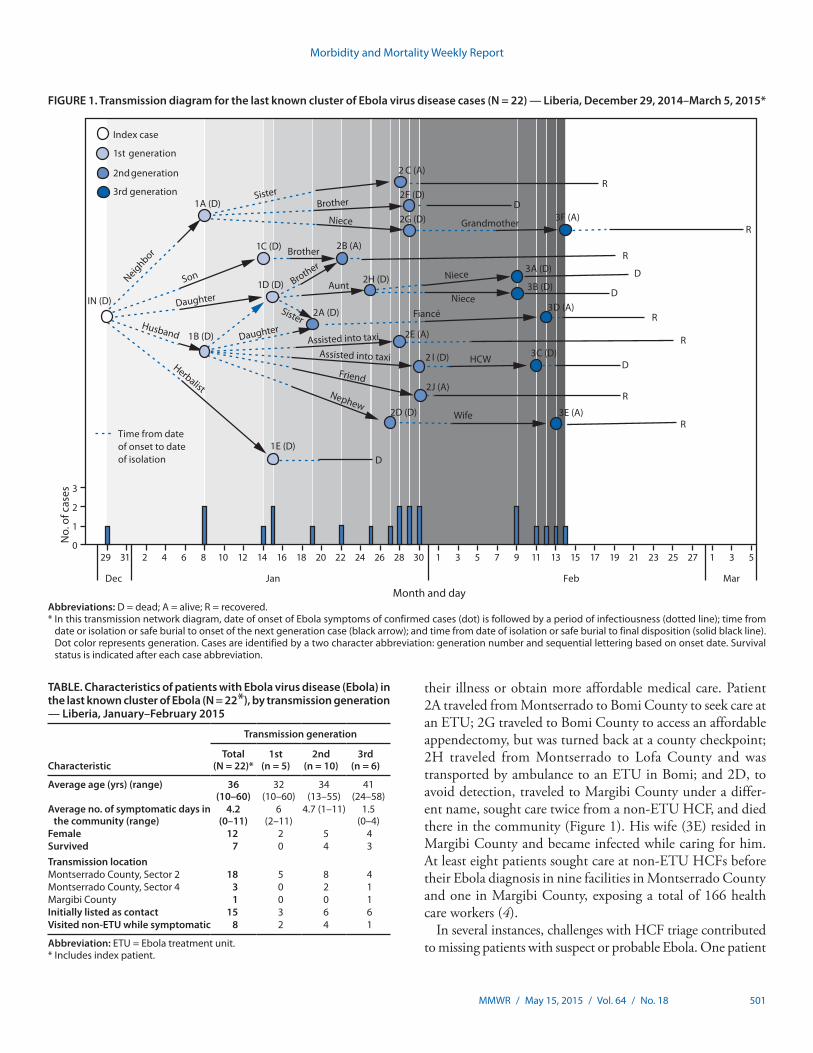
As one of the three West African countries highly affected by the 2014–2015 Ebola virus disease (Ebola) epidemic, Liberia reported approximately 10,000 cases (1). The Ebola epidemic in Liberia was marked by intense urban transmission, multiple community outbreaks with source cases occurring in patients coming from the urban areas, and outbreaks in health care facilities (HCFs) (2,3). This report, based on data from rou-tine case investigations and contact tracing, describes efforts to stop the last known chain of Ebola transmission in Liberia. The index patient became ill on December 29, 2014, and the last of 21 associated cases was in a patient admitted into an Ebola treatment unit (ETU) on February 18, 2015. The chain of transmission was stopped because of early detection of new cases; identification, monitoring, and support of contacts in acceptable settings; effective triage within the health care sys-tem; and rapid isolation of symptomatic contacts. In addition, a “sector” approach, which divided Montserrado County into geographic units, facilitated the ability of response teams to rapidly respond to community needs. In the final stages of the outbreak, intensive coordination among partners and engage-ment of community leaders were needed to stop transmission in densely populated Montserrado County. A companion report describes the efforts to enhance infection prevention and control efforts in HCFs (4). After February 19, no addi-tional clusters of Ebola cases have been detected in Liberia.* On May 9, the World Health Organization declared the end of the Ebola outbreak in Liberia.
Evolution of the ClusterThe index patient in this cluster was a woman aged 50 years
who became ill on December 29, 2014, in a community near St. Paul River Bridge in Montserrado County (Monrovia). After seeking care from an herbalist in her community, the patient presented to an HCF on January 4 with high fever, red eyes, and cough. Ebola was suspected, but she refused referral to an ETU and was sent home with antibiotics and antipyret-ics. On January 5, she was admitted to an ETU and died later that day. A postmortem swab of oral fluids tested positive for Ebola virus by polymerase chain reaction. Her family reported
no known contact with other Ebola patients, although other Ebola cases had been reported in the same neighborhood. In addition, before her illness, the woman had traveled to Grand Cape Mount County, where Ebola virus transmission was ongoing.
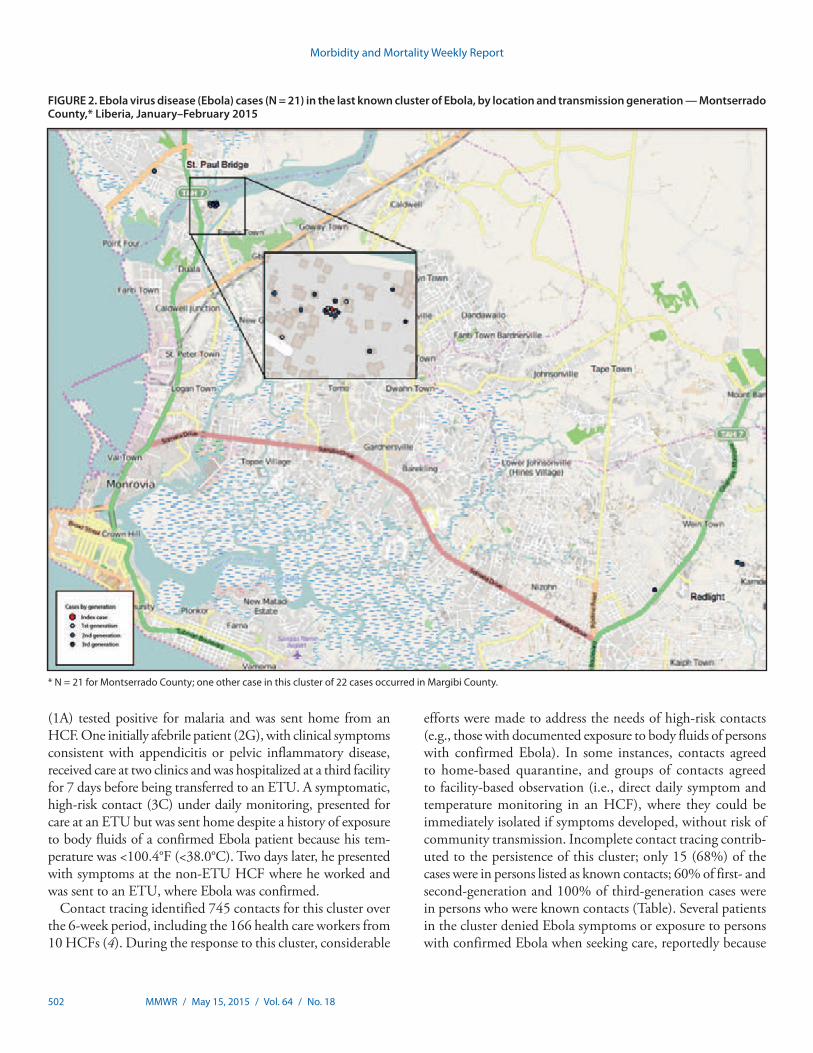
Over the following 7 weeks, 21 additional persons with laboratory-confirmed Ebola were linked to this case: 11 family members, six neighbors, two community members, one health care worker, and an herbalist (Figure 1). These cases occurred in three generations, all epidemiologically linked to the index case. The time interval from onset of illness to admission to an ETU decreased with each generation of cases. Twenty patients (including the index patient) received treatment at an ETU, including 13 patients who died. The two associated Ebola-infected persons who did not seek care in an ETU died in the community. Five first-generation patients were admit-ted to an ETU on average 6.0 days (range = 2–11 days) after illness onset. Ten second-generation patients averaged 4.7 days (range = 1–11 days) from symptom onset to ETU admission or death in the community. The six third-generation patients averaged 1.5 days (range = 0–4 days) from symptom onset to ETU admission (Table). The case-fatality rates among the suc-cessive generations were 100%, 60%, and 50%, respectively. Probable transmission for 18 of the cases (86%) occurred within 1 kilometer of St. Paul River Bridge in Montserrado County, whereas transmission for three cases occurred near Red Light, 15 kilometers southeast of St. Paul River Bridge (Figure 2).
Five patients worked in an HCF, three as cleaners (1A, 2C, and 3D) and two as health care providers (3A and 3C). However, the cleaners and one health care provider (3A) had significant household exposures with persons with confirmed Ebola that could account for their infection (Figure 1). One patient (1B) traveled to Red Light while symptomatic, became incapacitated in the community, and exposed two persons (2E and 2I) who assisted him into a taxi. One of these men later exposed patient 3C, a health care provider working in Red Light.
According to information provided by patients or their fam-ily during case investigations, several symptomatic patients sought care in counties outside of Montserrado to conceal * Another single case occurred in a person who received a diagnosis of Ebola on
March 20, 2015, and was not connected to this cluster (5).
Controlling the Last Known Cluster of Ebola Virus Disease — Liberia, January–February 2015
Tolbert Nyenswah1, Mosoka Fallah1, Sonpon Sieh1, Karsor Kollie1, Moses Badio1, Alvin Gray1, Priscilla Dilah1, Marnijina Shannon1, Stanley Duwor1, Chikwe Ihekweazu2, Thierry Cordier-Lasalle2, Shivam A. Shinde2, Esther Hamblion2, Gloria Davies-Wayne2, Murugan Ratnesh2, Christopher Dye2, Jonathan S. Yoder3, Peter McElroy3, Brooke Hoots3, Athalia Christie3, John Vertefeuille3, Sonja J. Olsen3, A. Scott Laney3, Joyce J. Neal3, Thomas R.
Navin3, Stewart Coulter3, Paran Pordell3, Terrence Lo3, Carl Kinkade3, Frank Mahoney3 (Author affiliations at end of text)
Morbidity and Mortality Weekly Report
MMWR / May 15, 2015 / Vol. 64 / No. 18 501
their illness or obtain more affordable medical care. Patient 2A traveled from Montserrado to Bomi County to seek care at an ETU; 2G traveled to Bomi County to access an affordable appendectomy, but was turned back at a county checkpoint; 2H traveled from Montserrado to Lofa County and was transported by ambulance to an ETU in Bomi; and 2D, to avoid detection, traveled to Margibi County under a differ-ent name, sought care twice from a non-ETU HCF, and died there in the community (Figure 1). His wife (3E) resided in Margibi County and became infected while caring for him. At least eight patients sought care at non-ETU HCFs before their Ebola diagnosis in nine facilities in Montserrado County and one in Margibi County, exposing a total of 166 health care workers (4).
In several instances, challenges with HCF triage contributed to missing patients with suspect or probable Ebola. One patient
FIGURE 1. Transmission diagram for the last known cluster of Ebola virus disease cases (N = 22) — Liberia, December 29, 2014–March 5, 2015*
Time from date of onset to date of isolation
Index case
1st generation
2nd generation
3rd generation
IN (D)
1D (D)
1B (D)
1C (D) 2B (A)
1A (D)
2A (D)
2 C (A)
2F (D)
2J (A)
1E (D)
2H (D)
2D (D)
2 I (D)
2E (A)
2G (D)
3A (D)
3B (D)
D
D
3D (A)
3C (D)
3E (A)
R
3F (A)
D
D
R
R
D
R
R
R
R
Neighbor
Son
Daughter
Husband
Herbalist
Sister
Sister
Brother
Aunt
Assisted into taxi
Assisted into taxi
Friend
NephewWife
HCW
Grandmother
Brother
Niece
BrotherNiece
NieceFiancé
Daughter
No.
of c
ases
0
1
2
3
Month and day
32117131197531302826242220181614121086 5423129 251915 23 127
Dec MarFebJan
Abbreviations: D = dead; A = alive; R = recovered.* In this transmission network diagram, date of onset of Ebola symptoms of confirmed cases (dot) is followed by a period of infectiousness (dotted line); time from
date or isolation or safe burial to onset of the next generation case (black arrow); and time from date of isolation or safe burial to final disposition (solid black line). Dot color represents generation. Cases are identified by a two character abbreviation: generation number and sequential lettering based on onset date. Survival status is indicated after each case abbreviation.
TABLE. Characteristics of patients with Ebola virus disease (Ebola) in the last known cluster of Ebola (N = 22*), by transmission generation — Liberia, January–February 2015
Characteristic
Transmission generation
Total (N = 22)*
1st (n = 5)
2nd (n = 10)
3rd (n = 6)
Average age (yrs) (range) 36 (10–60)
32 (10–60)
34 (13–55)
41 (24–58)
Average no. of symptomatic days in the community (range)
4.2 (0–11)
6 (2–11)
4.7 (1–11) 1.5 (0–4)
Female 12 2 5 4Survived 7 0 4 3Transmission locationMontserrado County, Sector 2 18 5 8 4Montserrado County, Sector 4 3 0 2 1Margibi County 1 0 0 1Initially listed as contact 15 3 6 6Visited non-ETU while symptomatic 8 2 4 1
Abbreviation: ETU = Ebola treatment unit.* Includes index patient.
Morbidity and Mortality Weekly Report
502 MMWR / May 15, 2015 / Vol. 64 / No. 18
(1A) tested positive for malaria and was sent home from an HCF. One initially afebrile patient (2G), with clinical symptoms consistent with appendicitis or pelvic inflammatory disease, received care at two clinics and was hospitalized at a third facility for 7 days before being transferred to an ETU. A symptomatic, high-risk contact (3C) under daily monitoring, presented for care at an ETU but was sent home despite a history of exposure to body fluids of a confirmed Ebola patient because his tem-perature was <100.4°F (<38.0°C). Two days later, he presented with symptoms at the non-ETU HCF where he worked and was sent to an ETU, where Ebola was confirmed.
Contact tracing identified 745 contacts for this cluster over the 6-week period, including the 166 health care workers from 10 HCFs (4). During the response to this cluster, considerable
efforts were made to address the needs of high-risk contacts (e.g., those with documented exposure to body fluids of persons with confirmed Ebola). In some instances, contacts agreed to home-based quarantine, and groups of contacts agreed to facility-based observation (i.e., direct daily symptom and temperature monitoring in an HCF), where they could be immediately isolated if symptoms developed, without risk of community transmission. Incomplete contact tracing contrib-uted to the persistence of this cluster; only 15 (68%) of the cases were in persons listed as known contacts; 60% of first- and second-generation and 100% of third-generation cases were in persons who were known contacts (Table). Several patients in the cluster denied Ebola symptoms or exposure to persons with confirmed Ebola when seeking care, reportedly because
FIGURE 2. Ebola virus disease (Ebola) cases (N = 21) in the last known cluster of Ebola, by location and transmission generation — Montserrado County,* Liberia, January–February 2015
* N = 21 for Montserrado County; one other case in this cluster of 22 cases occurred in Margibi County.

Morbidity and Mortality Weekly Report
MMWR / May 15, 2015 / Vol. 64 / No. 18 503
of fear of community stigma and apprehension of ETUs. At least one child (1D) was hidden from contact tracers when they visited. Persons who initially presented to non-ETU HCFs were less likely to be listed as contacts; two (25%) of eight persons who initially presented to non-ETUs were known contacts, compared with 13 (93%) of 14 who first presented for care at an ETU. Although guidance called for immediate isolation of symptomatic contacts, nine (75%) known contacts were isolated ≥2 days after symptom onset. The last confirmed case in this cluster (3F) was in a person admitted to an ETU on February 18 and discharged on March 5. The last cluster-associated contacts who did not become ill exited monitoring on March 11.
Discussion
This network of Ebola transmission in Liberia illustrated numerous challenges that persisted throughout the epidemic: fear of stigmatization in the community, delays in seeking treat-ment, inadequate triage in HCFs, lack of recognition of Ebola cases, and incomplete identification and follow-up of some contacts. The motivations for denying Ebola symptoms and resisting treatment are complex, but include stigma, fear, and denial related to possible Ebola infection, mistrust of ETUs, and low medical literacy. Despite the widespread availability of ETUs in Montserrado County, some persons opted for care at distant ETUs or care in non-ETU settings, where, conse-quently, large numbers of health care workers were exposed. Delayed treatment might have contributed to worse outcomes in the first two transmission generations compared with the last generation, when patients sought care more promptly.
Triage systems did not fully prevent Ebola patients from being admitted to HCFs rather than ETUs. Despite these challenges, the last cluster of Ebola in Liberia was controlled because of successful implementation of known effective Ebola control strategies, including early detection of new cases; identifica-tion, daily monitoring, and support of contacts in acceptable settings; effective triage within the health care system; and rapid isolation of symptomatic contacts (2,3).
To improve case investigations and contact tracing, Montserrado County had coincidentally decentralized man-agement of outbreak activities in the four geographic sectors. This decentralized, “sector” approach might have reduced the risk for community transmission. Each geographic sector had multidisciplinary teams led by coordinators located in each sector to manage and coordinate outbreak response activities at the sector, zone, and block level. Sector teams were empow-ered to make decisions related to control activities locally, and this enabled flexible adaptation of accepted outbreak control principles to fit local circumstances. Strategies included the use of home-based and community quarantine and facility-based observation, with provision of basic needs and psychosocial support, active case-finding, and outreach to religious and community leaders to allay the fears of affected households and community members. Although decentralization of sector management presented initial communication and coordina-tion challenges, the enhanced sector-based efforts resulted in more complete contact tracing, more prompt isolation of symptomatic patients in the second and third generations of transmission, increased survival, and reduced transmission in the community.
As the threat of Ebola wanes, much needed non-Ebola health services are resuming in Liberia. However, comprehen-sive triage for Ebola (3) and appropriate personal protective equipment are crucial but cannot completely eliminate risk for Ebola transmission at HCFs. At least eight cases in the cluster described in this report were in patients who sought care at non-ETU HCFs; six (75%) of these were not listed as contacts, highlighting the critical importance of comprehensive contact tracing. These eight patients were treated by HCFs despite the universal requirement of triage. At least four patients in this cluster did not have fever when presenting for care; some HCFs and contact tracers used lack of fever as a de facto indicator to rule out Ebola (i.e., rather than completing a comprehensive triage), highlighting the limitations of temperature-based triage. Conversely, many non-Ebola patients had illnesses that met the case definition but could not be tested without transfer to an ETU, where care for their non-Ebola medical conditions would not be offered. Despite these challenges, only one of the exposed health care workers in this cluster became infected with Ebola, and no additional transmission occurred
What is already known on this topic?
During the initial phases of the 2014-2015 Ebola virus disease (Ebola) epidemic in Liberia, there was intense urban transmis-sion, multiple community outbreaks with source cases occur-ring in patients coming from the urban areas, and outbreaks in health care facilities.
What is added by this report?
The last cluster of Ebola in Liberia included 22 cases, with three generations of transmission. Through enhanced control efforts, patients in successive generations were admitted to Ebola treatment units more quickly, mortality decreased, and community transmission was interrupted.
What are the implications for public health practice?
The last chain of transmission was controlled because of successful implementation of known strategies to control Ebola, including early detection of new cases; identification, monitor-ing, and support of contacts in acceptable settings; effective triage within the health care system; and rapid isolation of symptomatic contacts.

Morbidity and Mortality Weekly Report
504 MMWR / May 15, 2015 / Vol. 64 / No. 18
in HCFs, possibly because of timely, targeted infection preven-tion and control training and provision of personal protective equipment (4). Additionally, the most recent Ebola patient was appropriately triaged to an ETU when she presented to a non-ETU HCF (5).
In contrast to earlier in the Ebola epidemic, sector-based inten-sified contact tracing and in-depth case investigation, widespread infection prevention and control efforts (3), and coordination of case investigation and contact tracing activities between Montserrado and other counties (6) were key to stopping this final chain of Ebola transmission. The risk for re-introduction of Ebola into Liberia will remain high as long as transmission con-tinues in the region. National efforts to strengthen surveillance, alert and response, border screening, and triage and infection prevention and control in HCFs are high-priority activities in the government of Liberia’s recovery plan.
Acknowledgments
The county health teams of Montserrado and Margibi, Liberia. The Ministry of Health and Social Welfare, Liberia. CDC Liberia Ebola Response Team. World Health Organization. The Africa Union. Action Contre la Faim. Médecins Sans Frontières. Global Communities. International Rescue Committee. International Medical Corps.
1Ministry of Health and Social Welfare, Liberia; 2World Health Organization; 3CDC.
Corresponding author: Jonathan S. Yoder, [email protected], 404-718-4696.
References1. CDC. 2014 Ebola outbreak in West Africa—case counts. Available at http://
www.cdc.gov/vhf/ebola/outbreaks/2014-west-africa/case-counts.html.2. Nyenswah T, Fahnbulleh M, Massaquoi M, et al. Ebola epidemic—Liberia,
March–October 2014. MMWR Morb Mortal Wkly Rep 2014;63:1082–6.3. Matanock A, Arwady MA, Ayscue P, et al. Ebola virus disease cases among
health care workers not working in Ebola treatment units—Liberia, June–August, 2014. MMWR Morb Mortal Wkly Rep 2014;63:1077–81.
4. Nyenswah T, Massaquoi M, Gbanya MZ, et al. Initiation of a ring approach to infection prevention and control—Liberia, January–February 2015. MMWR Morb Mortal Wkly Rep 2015;64(18).
5. Christie A, Davies-Wayne GJ, Cordier-Lasalle T, et al. Possible sexual transmission of Ebola virus—Liberia, 2015. MMWR Morb Mortal Wkly Rep 2015;64:479–81.
6. Kateh F, Nagbe T, Kieta A, et al. Rapid response to Ebola outbreaks in remote areas—Liberia, July–November 2014. MMWR Morb Mortal Wkly Rep 2015;64:188–92.

Morbidity and Mortality Weekly Report
MMWR / May 15, 2015 / Vol. 64 / No. 18 505
Overall, 166 non-Ebola treatment unit health care work-ers in 10 HCFs possibly were exposed to the eight Ebola patients (Figure). The nature of their possible exposures varied, including providing treatment or performing labora-tory tests on blood specimens of Ebola patients, or cleaning a room or mattress where an Ebola patient had slept. All 166 were placed on contact lists. Of these, 86 (52%) were placed under home-based quarantine or precautionary observation at an HCF because of relatively higher risk exposures, while the remainder were monitored by contact tracers, either at home or at their place of employment (Figure). One clinic was closed entirely (clinic D) (Figure) during the postexposure period of observation, and one inpatient section of a hospital was closed (hospital D) (Figure). One health care worker developed Ebola after debriding and suturing the lacerations of an Ebola patient who had sought care for treatment of injuries sustained in a fight, and both the patient and the health care worker died. None of the other 165 health care workers developed Ebola.
Observations of the 10 HCFs found that health care worker exposures could have occurred for multiple reasons. Triage systems were inadequate with limited or no triage or isolation structures, no use or inappropriate use of infrared thermom-eters, limited ability to elicit accurate contact exposure his-tory, and an incomplete understanding of the case definition (suspected or probable) by some staff members. Additional challenges included no use or inappropriate use of personal protective equipment, insufficient staff to support IPC activi-ties, and inconsistent oversight by IPC partners.
Ring IPC StrategyRing IPC was a collaboration of the Liberian Ministry of
Health National and Montserrado Incident Management Systems, Montserrado and Margibi county health teams, CDC, WHO, the African Union, and nongovernmental organization partners under the Liberia IPC Task Force. On January 30, members of the IPC Task Force met to formalize components of the Ring IPC approach, including identification of target HCFs, a focus on triage, involvement of external staff members to support triage, and coordination and definition of roles among partners. The purpose of Ring IPC was to provide intensive IPC support (3,4) to HCFs in areas of active Ebola
Initiation of a Ring Approach to Infection Prevention and Control at Non-Ebola Health Care Facilities — Liberia, January–February 2015
Tolbert Nyenswah1, Moses Massaquoi1, Miatta Zenabu Gbanya1, Mosoka Fallah2, Fred Amegashie3, Adolphus Kenta3, Kumblytee L. Johnson4, Disu Yahya5, Mehboob Badini6, Lacina Soro6, Carmem L. Pessoa-Silva6, Isabelle Roger6, Linda Selvey6, Kristin VanderEnde7,8, Matthew Murphy7, Laura A.
Cooley7, Sonja J. Olsen7, Athalia Christie7, John Vertefeuille7, Thomas Navin7, Peter McElroy7, Benjamin J. Park7, Eric Esswein9,10, Ryan Fagan7, Frank Mahoney7 (Author affiliations at end of text)
From mid-January to mid-February 2015, all confirmed Ebola virus disease (Ebola) cases that occurred in Liberia were epide-miologically linked to a single index patient from the St. Paul Bridge area of Montserrado County (1). Of the 22 confirmed patients in this cluster, eight (36%) sought and received care from at least one of 10 non-Ebola health care facilities (HCFs), includ-ing clinics and hospitals in Montserrado and Margibi counties, before admission to an Ebola treatment unit. After recognition that three patients in this emerging cluster had received care from a non-Ebola treatment unit, and in response to the risk for Ebola transmission in non-Ebola treatment unit health care settings (2), a focused infection prevention and control (IPC) rapid response effort for the immediate area was developed to target facilities at increased risk for exposure to a person with Ebola (Ring IPC). The Ring IPC approach, which provided rapid, intensive, and short-term IPC support to HCFs in areas of active Ebola transmission, was an addition to Liberia’s proposed longer term national IPC strategy, which focused on providing a comprehensive package of IPC training and support to all HCFs in the country. This report describes possible health care worker exposures to the cluster’s eight patients who sought care from an HCF and implementation of the Ring IPC approach. On May 9, 2015, the World Health Organization (WHO) declared the end of the Ebola outbreak in Liberia.*
St. Paul Bridge ClusterThe eight Ebola patients who sought care from an HCF
ranged in age from 10 to 56 years; three were female. Only two of the eight were on a contact tracing list of persons with known prior Ebola exposure when they went to the HCF. Two patients died in the community and were never admitted to an Ebola treatment unit. For the other six, a median of 1 day passed (range = 0–9 days) between the first visit to an HCF and their admission to an Ebola treatment unit. For three patients with available data, a fever (defined as a temperature >100.4°F [>38°C] taken with an infrared thermometer) was not recorded on arrival at the HCF. Of the eight patients, seven subsequently died from Ebola.
* Additional information available at http://www.who.int/mediacentre/news/statements/2015/liberia-ends-ebola/en/.

Morbidity and Mortality Weekly Report
506 MMWR / May 15, 2015 / Vol. 64 / No. 18
FIGURE. Health care workers (HCWs) with exposure to eight Ebola patients at non-Ebola treatment units and targeted infection prevention and control (Ring IPC) initiation — Montserrado and Margibi counties, Liberia, January–February 2015
Montserrado County Margibi County
IN Clinic A
11 HCWs
Jan 4
Hospital A
8 HCWs, 4 under home-based
quarantine
Jan 17
1D
Clinic B
13 HCWs*
Jan 17–19
Ring no. 1
(Jan 23) 18 clinics 1A
Feb 3–4
27 HCWs, all under voluntary
observationat health care facility
2E Clinic D
5 HCWs
Jan 30–31
Ring no. 2
(Feb 3) 4 clinics, 2 health centers, 1 hospital
2D Clinic C
2I
Jan 30–31
6 HCWs, all under home-based
quarantine
6 HCWs, 4 under voluntary observation
at health care facility; 2 under home-based
quarantine
Jan 30
Feb 13
40 HCWs, 3 under home-based
quarantine§
Ring no. 3
(Feb 6)28 clinics,
2 health centers, 1 hospital
3C 1 HCW†
Clinic E Hospital B
Hospital B
2G
7 HCWs,4 under home-based
quarantine
33 HCWs, 31 under voluntary
observation at health care facility,
2 in US
Jan 29
8 HCWs,3 under home-based
quarantine
Feb 1
Feb 1–7
5 HCWs,all under home-based
quarantine
Feb 7
Ring no. 4
(Feb 9)1 clinic,
2 hospitals
Clinic F
Hospital C
Hospital D
Ambulance team
Abbreviations: IN = index patient for St. Paul Bridge cluster; 1A and 1D = other patients identified as first generation of cluster; 2D, 2E, 2G, and 2I = patients identified as second generation; 3C = patients identified as third generation.* A sister of patient 1A who worked at Clinic B was exposed in her role as family caregiver.† 3C, one of the 2 HCWs under quarantine at home, sought care at his place of employment while symptomatic. § The home-based quarantine period was extended for 3 patients previously under home-based quarantine from exposure to 3C.

Morbidity and Mortality Weekly Report
MMWR / May 15, 2015 / Vol. 64 / No. 18 507
transmission, thus forming a strategically placed protective ring of intensified IPC attention around persons with known Ebola to help break the chain of transmission. This strategy entailed selecting target HCFs for Ring IPC intervention based on known health care worker exposure to an Ebola patient, neighboring HCFs around the HCF that treated a patient, or HCFs in close proximity to the residence of a patient with confirmed Ebola. Next, rapid IPC needs assessments were conducted at these HCFs using Ministry of Health and Social Work (MOHSW) approved assessment tools (5). These assess-ments focused on triage procedures and personal protective equipment use, and found inadequate or absent triage and isolation structures, gaps in the personal protective equipment supply chain, and a need for general IPC training in addition to specialized triage training.
Training and EquipmentIdentified challenges were addressed by the national IPC
Task Force developing training that targeted key personnel. Triage training, based on existing MOHSW-approved IPC training materials, was developed and provided to 47 African Union clinicians. These clinicians were deployed to 36 target HCFs in Monteserrado County to provide onsite daily triage mentoring and support for the duration of the high-risk expo-sure monitoring period, or for at least 2 weeks. Three nurses,
previously employed by an Ebola treatment unit, provided similar triage support for one hospital. In addition, three 1-day triage training sessions were provided for more than 125 staff members working in three target HCFs. In Margibi County, a 1-day triage training session was conducted for 11 staff members working in five target HCFs, and African Union staff and nurses or other county health staff members provided ongoing triage mentoring and IPC support to seven target HCFs. This intensive IPC approach served to alert health care workers to recent Ebola virus transmission in their com-munities, identify additional contacts at HCFs where Ebola virus exposure had occurred, and provide a secondary source (in addition to contact tracing) of information on the health status of exposed health care workers.
In response to heightened awareness of clinic needs, partners provided personal protective equipment and other essential IPC supplies to target facilities. Ring IPC partners in Montserrado County and the national IPC Task Force initiated an emergency release of a 1-month supply of personal protective equipment to priority clinics. Nongovernmental organization partners assessed and constructed triage structures when needed.
Initiation of RingsDuring January 23–February 9, in response to the ongoing
St. Paul Bridge cluster, four IPC rings were initiated in Liberia, three in Montserrado County and one in Margibi County (Figure). The first ring was initiated 4 days after recognition that a facility had provided care to an Ebola patient; subsequent rings were initiated within 2 days after recognition of other Ebola patients. In total, 59 target HCFs were identified, 52 in Montserrado County (out of a total of 294 HCFs) and seven (out of a total of 32) in Margibi County. There was an average of 15 HCFs per ring (range = 3–31).
Overall, Ring IPC efforts appeared to be associated with an increase in the identification and isolation of suspected or probable Ebola patients. For example, three probable Ebola patients were identified through triage during training con-ducted at one target HCF in Montserrado County. Only one of the 166 exposed health care workers in the St. Paul Bridge cluster became infected with Ebola. This low prevalence of secondary infection among health care workers suggests that basic infection prevention principles were being observed by health care workers during this period. Nevertheless, triage was not always completely successful; the one health care worker who became infected with Ebola after Ring IPC activities were initiated actually sought care at his place of employment, an identified target HCF, and was permitted to enter without first being properly triaged as a probable or suspect Ebola patient.
What is already known on this topic?
The adoption of essential infection prevention and control (IPC) practices among health care workers, such as hand washing and proper use of personal protective equipment, is crucial to interrupting the transmission of Ebola.
What is added by this report?
From mid-January to mid-February 2015, all confirmed Ebola cases in Liberia were epidemiologically linked to a single index patient. Of the 22 confirmed patients in this cluster, eight (36%) sought and received care from at least one of 10 non-Ebola health care facilities. During this time, a focused IPC response effort, termed Ring IPC, was developed collaboratively to target health care facilities at increased risk for exposure to a person with Ebola. Rapid, intensive, and short-term IPC support was provided at these health care facilities following rapid needs assessments focused on triage procedures and personal protective equipment use.
What are the implications for public health practice?
The implementation of Ring IPC in Liberia might offer a useful model for rapid response to Ebola virus transmission and health care worker exposure in other settings. A comprehensive strategy remains critical to raising the level of IPC capacity nationwide; however, an appropriately targeted Ring IPC approach might be an effective supplemental strategy to focus IPC support in response to clusters of disease.

Morbidity and Mortality Weekly Report
508 MMWR / May 15, 2015 / Vol. 64 / No. 18
Discussion
Included among the Ebola response efforts in Liberia was the creation in early September 2014 of a national IPC Task Force to support the MOHSW. The IPC Task Force served as a coordinating body to facilitate IPC planning and imple-mentation of activities in both health care and non–health care facilities, as well as providing IPC guidance and technical assis-tance through policy development and standardization of IPC training and implementation tools consistent with MOHSW priorities. The national IPC strategy had focused on providing a comprehensive package of IPC training and support, through trained IPC specialists, at major health facilities throughout the country because of widespread Ebola transmission occurring at the time. This strategy includes promoting essential IPC practices among health care workers, such as hand washing and proper use of personal protective equipment. Although a comprehensive strategy remains critical to raising the level of IPC capacity nationwide, an appropriately targeted Ring IPC approach might be an effective supplemental strategy to focus IPC support in response to clusters of disease.
The public health intervention described in this report was rapidly implemented and integrated into Liberia’s national Ebola response as a result of coordinated, collaborative efforts by multiple partners. Coordination and collaboration among the national Incident Management System, county health teams, CDC, WHO, African Union and nongovernmental organization partners was key to identifying gaps in IPC needs and preventing duplication of efforts. The initial ring was coordinated by the IPC Task Force under MOHSW leadership. In subsequent rings, the national Incident Management System and county health departments joined efforts with CDC, WHO, African Union, and multiple nongovernmental organization partners participat-ing in initial discussions, planning, and rapid IPC assessments. In general, HCFs welcomed additional training, personal protective equipment provision, and triage mentoring and support. The placement of IPC staff members trained in triage at target HCFs following training was readily adopted by clinic staff.
The implementation of Ring IPC in Liberia might offer a useful model for rapid response to Ebola virus transmission and health care worker exposure in other settings. This approach, however, might be most appropriate at the beginning or near the end of an outbreak, when specific chains of transmission can be identified and when HCFs can be identified and targeted based on their risk for encountering an Ebola patient when there is known active transmis-sion in their geographical area. Urban settings present challenges to this approach, because persons might seek care at HCFs outside of their immediate community. Although limitations in both supplies (personal protective equipment and infrared thermometers) and human resources (appropriately trained personnel) might inhibit a
timely response to initiating IPC activities, the Ring IPC approach might be used to prioritize these limited resources.
The Ring IPC approach was developed rapidly and collab-oratively in response to an urgent public health need; as such, data were not collected and aggregated systematically across all facilities, potentially limiting the generalizability of these results. Nonetheless, as a result of Ring IPC efforts, health care workers at HCFs in areas with recent active transmission are now better equipped and trained to rapidly triage, isolate, and refer suspected and probable Ebola patients to appropriate Ebola treatment unit facilities. As Liberia looks ahead, a new culture of IPC can be incorporated into the health system; a Ring IPC approach might be useful in minimizing the trans-mission in non-Ebola HCFs should new cases of Ebola occur.
Acknowledgments
Bernice Dahn, Catherine Cooper, Faith Kamara, Saye Baawo, Ministry of Health and Social Work, Liberia; Sonpon Sieh, Karsor Kollie, Dan Hymowitz, Moses Badio, Montserrado Incident Management System; Margaret Togba, Dash Kwayon, Montserrado County Health Team; Adolphus Yeiah, Margibi County Health Team; Joshua Obasanya, Kabba Joiner, Shikanga O-Tipo, Hentsa Haddush Desta, Justin Maeda, Daniel Sokoya, Uwah Aniekeme, African Union; Sharon Salmon, Urmila Sharma, Dale Fisher, Mo Lin, World Health Organization; Rose Macauley, Catherine Gbozee, Yvonne Kodl, Luigi Ciccio, John Snow, Inc.; Peter Williams, Medical Teams International; Julie Pontarollo, David Luke, The MENTOR Initiative; Sara Phillips, International Medical Corps; Miriam Czech, Medecins Sans Frontieres, France; Brooke Hoots, Jonathan Yoder, Joyce Neal, Kwame Asamoa, Neil Gupta, Paul Malpiedi, Rachel Bailey, Amy Peterson, Erica Bushong, Carl Kinkade, CDC.
1Ministry of Health and Social Work, Liberia; 2Montserrado Incident Management System; 3Montserrado County Health Team; 4C.H. Rennie Hospital; 5African Union; 6World Health Organization; 7CDC; 8Epidemic Intelligence Service; 9National Institute for Occupational Safety and Health, CDC; 10University of Witwatersrand.
Corresponding author: Kristin VanderEnde, [email protected].
References1. Nyenswah T, Fallah M, Sieh S. Controlling the last known cluster of Ebola
virus disease—Liberia, January–February 2015. MMWR Morb Mortal Wkly Rep 2015;64(18).
2. Matanock A, Arwady MA, Ayscue P, et al.; Centers for Disease Control and Prevention (CDC). Ebola virus disease cases among health care workers not working in Ebola treatment units—Liberia, June-August, 2014. MMWR Morb Mortal Wkly Rep 2014;63:1077–81.
3. World Health Organization. Infection prevention and control guidance for care of patients in health-care settings, with focus on Ebola. Geneva, Switzerland: World Health Organization; 2014. Available at http://www.who.int/csr/resources/publications/ebola/filovirus_infection_control/en/.
4. Republic of Liberia, Ministry of Health and Social Welfare. Keep safe, keep serving training package; December 2014.
5. Republic of Liberia, Ministry of Health and Social Welfare. Liberia health system minimum standards for safe care provision by health care facilities in the context of Ebola; January 2015.

Morbidity and Mortality Weekly Report
MMWR / May 15, 2015 / Vol. 64 / No. 18 509
Announcement
Click It or Ticket Campaign — May 18–31, 2015Click It or Ticket, a national campaign coordinated annually by
the National Highway Traffic Safety Administration to increase the proper use of seat belts, takes place May 18–31, 2015.
Using a seat belt is one of the most effective ways to prevent serious injury or death in the event of a crash. Using lap/shoul-der seat belts can reduce the risk of fatal injury by almost 50% (1). In 2013, more than 21,000 passenger vehicle occupants died in motor vehicle crashes in the United State; 49% were unrestrained at the time of the crash (2). An additional 2.4 million nonfatal injuries were treated in emergency depart-ments in 2013 (3). Yet, millions of persons continue to travel unrestrained (4).
During the 2015 Click it or Ticket campaign,* law enforce-ment agencies across the nation will conduct intensive, high-visibility enforcement of seat belt laws, during both daytime and nighttime hours. Nighttime enforcement of seat belt laws is encouraged because seat belt use is lower at night (2).
* Additional information is available at http://www.nhtsa.gov/Driving+Safety/Occupant+Protection.
Additional information from CDC on preventing motor vehicle crash-related injuries is available at http://www.cdc.gov/Motorvehiclesafety. Information on state-specific seat belt use and strategies to improve it is available at http://www.cdc.gov/motorvehiclesafety/seatbelts/states.html.
References1. Pickrell TM, Liu C. Seat belt use in 2013—overall results. Washington,
DC: US Department of Transportation, National Highway Traffic Safety Administration; 2014. Report No. DOT HS 822 875. Available at http://www-nrd.nhtsa.dot.gov/Pubs/811875.pdf.
2. National Center for Statistics and Analysis. 2013 motor vehicle crashes: overview Washington, DC: US Department of Transportation, National Highway Traffic Safety Administration; 2014. Report no. DOT HS 812 101. Available at http://www-nrd.nhtsa.dot.gov/Pubs/812101.pdf.
3. CDC. Injury prevention and control: data & statistics (WISQARS™). Washington DC: US Department of Health and Human Services, CDC. Available at http://www.cdc.gov/injury/wisqars.
4. Pickrell TM, Liu C. Occupant restraint use in 2013: results from the national occupant protection use survey controlled intersection study. Washington, DC: US Department of Transportation, National Highway Traffic Safety Administration; 2015. Report No. DOT HS 812 080. Available at http://www-nrd.nhtsa.dot.gov/Pubs/812080.pdf.

Morbidity and Mortality Weekly Report
510 MMWR / May 15, 2015 / Vol. 64 / No. 18
Announcement
American Stroke Month and National High Blood Pressure Education Month — May 2015
May 2015 is American Stroke Month and National High Blood Pressure Education Month. American Stroke Month raises awareness of the signs and symptoms of stroke and encourages persons to act F.A.S.T.* (Face drooping, Arm weakness, Speech difficulty, Time to call 9–1–1) if someone is having a stroke. Stroke is the fifth leading cause of death in the United States and a leading cause of severe disability (1,2). In the United States, on average, one person dies from stroke every 4 minutes (2).
Stroke is largely preventable. You may be able to prevent stroke or reduce your risk through healthy lifestyle changes. High blood pressure is one of the major risk factors for stroke. Others include high cholesterol, smoking, diabetes, heart disease, obesity, physical inactivity, and unhealthy diet.†
National High Blood Pressure Education Month focuses on saving lives by increasing awareness and educating the public about cardiovascular disease risks and how to prevent them. High blood pressure, also known as hypertension, is considered the “silent killer” because it can damage the heart, brain, and kidneys without any symptoms (2). In the United States, nearly one in three adults has hypertension, and only about half have their condition under control (3). Hypertension is the leading risk
factor for stroke and heart attacks. Each day in the United States, more than 1,000 deaths are associated with hypertension (2).
To control hypertension and reduce their risk for stroke, patients can take medications as directed, monitor their blood pressure, and eat a lower-sodium diet and more fruits and vegetables. Health care providers can use electronic health records, blood pressure measurement, and a team-based care approach to help improve their patients’ hypertension control. Patients and providers can find more information at http://millionhearts.hhs.gov/abouthds/prevention.html.
CDC focuses on promoting cardiovascular health, improving quality of care for all, and eliminating disparities associated with heart disease and stroke. Additional information is avail-able at http://www.cdc.gov/bloodpressure and http://www.cdc.gov/stroke.
References1. Kochanek KD, Murphy SL, Xu J, Arias E. Mortality in the United States,
2013. Washington, DC: US Department of Health and Human Services, CDC, National Center for Health Statistics; 2014. NCHS Data Brief No. 178. Available at http://www.cdc.gov/nchs/data/databriefs/db178.pdf.
2. Mozzafarian D, Benjamin EJ, Go AS, et al. Heart disease and stroke statistics—2015 update: a report from the American Heart Association. Circulation 2015;131:e1.
3. Nwankwo T, Yoon SS, Burt V, Gu Q. Hypertension among adults in the United States: National Health and Nutrition Examination Survey, 2011–2012. Washington, DC: US Department of Health and Human Services, CDC, National Center for Health Statistics; 2013. NCHS data brief No. 133. Available at http://www.cdc.gov/nchs/data/databriefs/db133.htm.
* More information is available at http://www.strokeassociation.org/STROKEORG/AboutStroke/AmericanStrokeMonth/American-Stroke-Month_UCM_459942_SubHomePage.jsp.
† More information is available at http://www.cdc.gov/stroke/risk_factors.htm.
Morbidity and Mortality Weekly Report
MMWR / May 15, 2015 / Vol. 64 / No. 18 511
* Information on health insurance coverage is collected at the time of interview. Three of the four categories (any private, including workplace; public only [Medicare, Medicaid, military, and state/local government plans]; and uninsured) are mutually exclusive, but might not sum to 100% because of rounding.
† Estimates are based on household interviews of a sample of the civilian noninstitutionalized U.S. population and are derived from the National Health Interview Survey family core.
§ 95% confidence interval.
In 2012–2013, persons aged 55–64 years were less likely to have private health insurance coverage (69.8%) than persons in the same age group in 2002–2003 (76.7%); persons in the 2012–2013 age group also were less likely to have private coverage through the workplace (62.0%) than persons in the same age group in 2002–2003 (69.5%). Also, in 2012–2013, a greater percentage aged 55–64 years had only public health insurance coverage (16.9%) than in 2002–2003 (12.1%) and a greater percentage were uninsured (13.4%) than in 2002–2003 (11.2%).
Source: Health, United States, 2014 with special feature on the health of the current 55–64 year age group who within the next 10 years will enter the Medicare program. Available at http://www.cdc.gov/nchs/hus.htm.
Reported by: Virginia M. Freid, MS, [email protected], 301-458-4220; Mary Ann Bush, MS.
2002–20032012–2013
0
20
40
60
80
100
UninsuredPublic onlyPrivate through workplace only
Any private, including workplace
§
Type of coverage
Perc
enta
ge
QuickStats
FROM THE NATIONAL CENTER FOR HEALTH STATISTICS
Health Insurance Coverage Among Adults Aged 55–64 Years, by Type of Coverage* — National Health Interview Survey, United States,
2002–2003 and 2012–2013†

ISSN: 0149-2195
The Morbidity and Mortality Weekly Report (MMWR) Series is prepared by the Centers for Disease Control and Prevention (CDC) and is available free of charge in electronic format. To receive an electronic copy each week, visit MMWR’s free subscription page at http://www.cdc.gov/mmwr/mmwrsubscribe.html. Paper copy subscriptions are available through the Superintendent of Documents, U.S. Government Printing Office, Washington, DC 20402; telephone 202-512-1800.
Readers who have difficulty accessing this PDF file may access the HTML file at http://www.cdc.gov/mmwr/index2015.html. Address all inquiries about the MMWR Series, including material to be considered for publication, to Executive Editor, MMWR Series, Mailstop E-90, CDC, 1600 Clifton Rd., N.E., Atlanta, GA 30329-4027 or to [email protected].
All material in the MMWR Series is in the public domain and may be used and reprinted without permission; citation as to source, however, is appreciated.
Use of trade names and commercial sources is for identification only and does not imply endorsement by the U.S. Department of Health and Human Services.
References to non-CDC sites on the Internet are provided as a service to MMWR readers and do not constitute or imply endorsement of these organizations or their programs by CDC or the U.S. Department of Health and Human Services. CDC is not responsible for the content of these sites. URL addresses listed in MMWR were current as of the date of publication.
Morbidity and Mortality Weekly Report