healthy beverages community action kit yes o no o not sure, and here ... the goal of the healthy...
TRANSCRIPT

Healthy Beverages Community Action
Kit
Indian Health Service September 2006
IHS Nutrition Program IHS Clinical Support Center
IHS Head Start Program Nutrition & Dietetics Training Program
IHS Division of Oral Health, IHS National Oral Health Council IHS Division of Diabetes Treatment and Prevention
IHS Community Health Representative Program IHS National Nursing Leadership Council
HHS Emerging Leaders Program

2
Water Prayers
“We give thanks to all the Water of the world for quenching our thirst and providing us with strength. Water is life. We know its power in many forms- waterfalls and rain, mists and streams, rivers and oceans. With one mind, we send greetings and thanks to the spirit of water.” Mohawk Thanksgiving Address
“Water is a prayer. Water is life. To destroy the land and water is to destroy the people.” Tony Skrelunas, Navajo

3
Table of Contents Water prayers………….…………………..…………..……………………………………….………………….…………………………………….………………………………………………………………….…………………………..… 2 Table of Contents…….…….……………….…….…………….……………………………………………………………….……………………….………….…………………………………………………………….………………………3 Foreword……….……….………….……………..…………………….…………………………………………………………………………….………………………………………………….……………………………………………………………4 Introduction…………….………………………….…………………..……………………….…………………………………………………………………………………………………………………………………………………………………5 Purpose of the Action Kit……………….……………………………………….………………………..…………….…………………………………………………………………………………………………..……………………6 Become a healthy Beverage expert in your community/school………………………………….…………………………………………………………………………..………………7 Develop action plan and plan your strategy…….………………………..……………………………………….………………….………….……………………………………………………….…………….8 Put plan into action …….……………………………….……..…………….……………….….………………………………………………………………………………………………………………………………….…..………..…...9 Evaluate……………….………………………………………...…………………….………..……...………….….………….……………………………………………………………………………….……………………………………………… 10 What is in this Toolkit?.............................................................................................................................................................……………………………………………………………………..…………….11 Community Beverage Assessment Forms……………………………………...................................................................................................................................................…..12-13 Sample 1: Assessment forms……………………………………………..…………………………………………………………………………………………….…………………………………………………………………….14 Sample 2: Vending Machine………………………………………………………………………………………………………………………………………………………………………………………………………………..15 Sample 3: Vending Machine Survey…………….…………………..……………………………..………………….…………………………………………………………………………………..……….………….16 Sample 4: Community Beverages Assessment Form or Progress Report……………………………………………………………………………………………….....17-19 Sample 5: Community Beverage Assessment Form (blank)……………………….………………..………………….………………………………………………………….……………20 How to start planning for a healthy beverage community action campaign…………………….…………………………………………………….…………………….21 ◊ Agenda sample ……………………………………………..…………………………………………………..……………………………………………………………………………………………………………….………….22 ◊ Sample letter to a Tribal leader…………….……….….…….…………….……………………………………………………………………………………………………………………………..…………….23 ◊ Sample fact sheets……………………………….……………………………...……………………………………………………………………………………………………………………………………………….24-25 ◊ Soda Pop Consumption Increasing……………………..….…..………………………………………………………………………………………………………………………………………………..…..26 ◊ Detailed Fact Sheet……………………………………………...………………………..……………………………………….………………………………………………………………………………………….27-29 A New Proposed Guidance System for Beverage Consumption in the US …………………………………………………………………………………………………..30 The Daily Healthy Beverage Guidelines …………………………………………………….……………………………..………….…………………………………………………………..………..………….31 The Daily Healthy Beverage Guidelines Recommendation…………………………………………………………………………………………………………………………………....32 Beverage Caffeine Content ………………………………………………………………..…………………………………………………………………………………………………………………………………..33-34 Caffeine Content Examples………………………………………………………………………………………………………………………………………………………………………………………………………………..35 What are you and your family drinking ……………..……...…….……….….……………………….……………………………………………………………………………………….…………..………….36 Alternative Herbal Teas (Indian Tea)……………………………….……………….……………….………………………………………………………………………………………………………..……………..37 Alternative teas (Black, green and Oolong) …………….………………….……………………………………………………………………………………………………………………….………………38 Who can I ask to be involved?........................................................................................................................................................................................................................................39 Issues and Topics……………..……………………………….………………………….……………..….……………………………………………………………………………………………………………………..……………………..40 ◊ Focus groups……………………………….………………………………………..……………………………………………………………………..……………………………………………………………….……………………..40 ◊ Focus group questions…………………..……………………….……………………..………………………………..………………….…………………………………………………………………………...................41 ◊ Community survey and Partners……………….……………………….…………………………………………………………….…………………………………………………………………………..…….42 ◊ Sample of community action…………………….……………….…………………………………………………………………………………..……………………………………………………………………...43 Check list for Healthy Beverage Campaign.................................................................................................................................................................................................44 Partners……………………..…………………….…………………………………..............................................................................................................................................................................................45-46 Implementation process…………………………………………………………………....………………………………………………………………………..…………………………..………………………………….………...47 ◊ Proposal for a healthy beverage policy……………….…………………..……..………………………………………….…..…………………….….….………………………………………………..48 ◊ Sample: Stop the Pop! resolution…………………….……………….…………………………………………………………….…….….…………………….…..……………………………………………..…49 Take action tools: Sound bites…………………………………………………….….……………….………………………………………………….……………..…………………………………………….………………..50 Native American Communities Making It Happen….………………………..……………..……………………………………..………………………………………………………….………….51 ◊ New Mexico Tribes ……………………..………….……………………….……………………….…………………………………………...………………………………….………………………………………………….52 ◊ Zuni Pueblo of New Mexico……………………………….…………………………….……….….…………………………………..……………………………………………………………………………..…….52 ◊ California Unified School District…………….…..……………………..……………………………………………………….………………………………………………………………………………….53 Recommendations for action……………….……………….…………………………………................................................................................………………………………………………….…………...….54 Directors Director’s Health Promotion/Disease Prevention Initiative …….………………………………………………………………………………………………………55 Sample 6: Customized your Power point presentations……………………………………………………………………………………………………………………………………...56- 80 Healthy beverages Team Leaders and Healthy Beverage Team ………………………………..……………….…….………………...……………………………………..…….….81 Acknowledgement…………..………..……………………….…….………………………………………………………………………………………….………….……....……………………………………………………………….82 References…..............................................................................................................................................................................................................................................................................83-84 Web Resources…………………………………………………………………..………………………………………….…………………………………….……………………………………………………………..……….………85-87 Photo References: Photos Courtesy of Google Imagery………………………………………………………………………………………………………………………………………………..88 Water is the best medicine for everyone………………………….…………………………………………….…………….…………………………………………………………………………………………..88

4
Foreword
Congratulations on your interest in promoting healthy beverages in your community. Many tribal groups have recognized the negative impact that the current high level of soda consumption has on the health of American Indian and Alaska Native people. In fact, this was the spark that inspired the development of the Action Kit to help people like you promote a healthier future in tribal communities. This Action Kit we created outlines an action plan to promote increased consumption of healthier beverages in Indian Communities. The plan has built-in flexibility so you can incorporate modifications specific for your own community. The Kit also provides contact information for resources that you may find useful when designing your own community plan. Additionally, there are also some fact sheets on youth soda consumption and the related health consequences as well as some success stories to inspire you. As you work towards a healthier future for American Indian and Alaska Native communities, please share your experiences with us so we can all benefit from your successes and challenges and use your experiences to help other communities in their promotions. Please contact me directly at my email address [email protected] or contact Elaine Little at [email protected] We look forward to hearing about your progress. Sincerely, Jean Charles-Azure, MPH, RD Healthy Beverages Action Team IHS Principal Nutrition Consultant, Rockville, MD
Elaine Little, MS, RD IHS Public Health Nutritionist Phoenix Area Clinical Support Center, Phoenix, AZ
Acknowledgements This Action Kit was developed by The Indian Health Service (IHS) Healthy Beverages Action Team to help people promote increased consumption of healthy beverages. Many people from numerous disciplines generously contributed to completion of this kit. Candace Jones and Richard Olson from the Indian Health Service Office of Clinical and Preventative Services provided the initial funding. Additionally, the Indian Health Service Head Start Program provided their valuable advice and expertise. The Clinical Support Center and the Nutrition and Dietetics Training Program staff also helped on this project. The Kit is based on a literature search, focus groups, expert opinions, and input from tribal members, without whom this project would not have been possible. All this input and support is sincerely appreciated.
5
Introduction
Why is choosing a healthy beverage important?
Tribal leaders, community action groups, and others are concerned about growing epidemics of obesity and diabetes in American Indian and Alaska Native communities.
These double epidemics are linked with “liquid sugar”.
You can take steps in your personal life and in the community to increase your intake of healthy beverages and decrease intake of unhealthy beverages, especially those with extra sugar.
I believe it is important because:_______________________________________________________________________________________ Are healthy beverage choices available in your school, community, and hospital, and health center?
o Yes o No o Not sure, and here are my questions and
concerns: ________________________________________
________________________________________
Answering these questions will unfold a picture of beverages that are available in your community.

6
Purpose of the Action Kit:
Why are we doing this?
The goal of the Healthy Beverages Community Action Kit is to assist tribal communities to work together to promote healthy beverages, and to decrease intake of sugary beverages of soft drinks to combat health risks for American Indian and Alaska Native community members. The Action Kit will guide Health Promotion/Disease Prevention staff, schools, and tribal health paraprofessionals to advocate for and implement policies that support a healthier environment through a coordinated community framework.
This toolkit will help you to:
• take action to increase access to healthy beverages in your tribal community,
• develop an action plan for you and other action team
members to create, implement and evaluate a community model healthy beverage policy,
• brainstorm ideas for getting activities started, • identify, recruit and work with groups/team members you
want to be actively involved on your team, and • find resources to improve beverages offered in your
community
7
Become A Healthy Beverages Expert In Your Community And School
Step 1: Familiarize yourself with the facts and information on childhood obesity and soda pop consumption. Step 2: Learn more about which beverages are healthy by reading nutrition labels on the nutrition content of the beverage your family drink or that are offered in schools, communities and health centers. Step 3: Make a note if your school has a resolution or policy, and find out what beverages are sold in your community. List healthy beverages that are sold or served in your school
� Low-fat, 1% or fat-free- milk � Water � Fruit juice (100% real juice) � Soy milk
Which unhealthy beverages are sold or provided in your school, clinic, and tribal offices?
� Regular soda � Diet soda, ice tea and artificially sweetened beverages � Iced tea or other sweetened drinks � Fruit drink, sports drinks � Sports drinks
Are unhealthy beverages sold in any of the following locations?
� Vending machines � Sporting events � Cafeteria line � Fundraising drives � Schools store � other
Step 4: Research or seek other school policies or resolutions that may affect the development of a Healthy Beverage policy. Step 5: Learn about the finances of removing soda and other sweetened beverages. Step 6:
Coordinate a poll of parents and health care providers in your school district and community.
PA Department of Agriculture “Healthy Beverage Tool Kit” The Food Trust, 2004 Philadelphia, PA. www.Thefoodtrust.org
8
DEVELOP AN ACTION PLAN AND PLAN YOUR STRATEGY
• Your team will need to decide which areas to
challenge first and which to do later. You will meet some resistance to the ideas of restricting sweetened beverages to water, low-fat milk, diet sodas, and 100% fruit juices. Perhaps decide on specific activities that will bring about improvements.
• Keep in mind you will also need a timeframe leading
to a specific date. Both your plans of action and timeline may change as events develop; therefore, be flexible. React to opportunities when they come up. Remember some steps may be unworkable to implement and you may need to add other steps. Keep working towards your major goal.
• Your needs assessment will identify priorities and
determine which should be addressed first. Assign responsibilities to team members to get activities going.
9
PUT THE PLAN INTO ACTION
• The person who is the team leader will need to give a short
presentation of the Healthy Beverage project’s history, progress, and major findings.
• Briefly explain meeting format.
• Give details on roles and process.
• Assign responsibilities to team members and get it going.
• Activities may include:
1. Focus groups: conduct focus groups to understand knowledge, attitude and beliefs about health, nutrition, and soda pop consumption.
2. Conduct literature review on soda pop and health. 3. Identify problems and develop goals and priorities.
4. Title the toolkit and package it in a canvas bag with Indian design.
Distribute with a water carafe for families and water bottle for individual(s) (gather creative people – they can be called the creative team - to come up with the design, water carafe, and “package).
5. Mobilize stakeholder communities. 6. Work with stakeholders to develop new nutrition and health
education materials. 7. Develop counter-marketing techniques to reduce soda pop
consumption. 8. Establish initiatives to identify alternative funding for school
activities. 9. Monitor and evaluate
10
Evaluate
Review your progress and recognize your successes. Your plan may need to be revised to accomplish your goals and objectives.
List barriers and challenges
What are some of the barriers to successfully solving
these problems? What are some of the changes that created a
challenge? What else can keep you from solving these problems?

11
What is in this Toolkit?
PowerPoint presentations that you can edit and make your own. This will provide you with a wealth of information that you can utilize in your efforts to replace soda and other sweetened beverages with water, 100% juice and low-fat milk.
Sample Disks: Healthy Beverages Action in American Indian and Alaska Native Communities.
“Strengthen the Family Circle” – One pager emotion based behavior change strategy
“Honoring the Gift of Children” – One pager emotion based behavior change strategy.
12
To improve the community nutrition environment, complete the
Community Beverage Assessment Forms
This assessment will allow you to evaluate the extent to which your community implements the kinds of procedures, guidelines and/or policies that are recommended as part of a healthier community environment. It will help you identify a place to start making healthier changes!
It will help American Indian and Alaska Native communities to:
Assess the current status of their community and schools. (See samples on Page 12, 13 and 15) Gain support of the community, school administrators, community members, tribal leaders, parents, and health care providers. The assessment will help identify who is going to support your efforts. Create an action plan for improving the quality of beverages sold. Promote community awareness of soda pop’s detrimental effects on health.

13
Community Beverages Assessment
There are several sample assessment forms applicable to vending machines, grocery stores, cafes, restaurants, and school cafeterias. We suggest that you print the sample assessments, designate a team of people to survey the community, a team leader to coordinate the responses, and submit the assessment to tribal leaders, school officials, health centers etc, once you have gathered the information. Combine the results for all community health centers, clinics, hospitals, schools, and tribal offices and report total results. Use the results to attract attention to the beverages sold out of vending machines. The information gathered from the assessment on healthy beverage practices will be used to generate support among your school, hospitals, health centers, tribal offices, and community members in the future phases of the Action Kit for Change. The opportunities to improve your community environment are limitless. Consider what will work best in your area. What score do your Community Buildings/Centers (schools,
hospitals, health centers, tribal offices, etc) earn on offering healthy beverages?
Assess the community beverages environment of the children in
your tribal community. Have a team of students and/or health providers sample the schools and childcare sites to see how the environment scores.
Share your results with tribal council, school board, teachers,
parents, and health professionals.
14
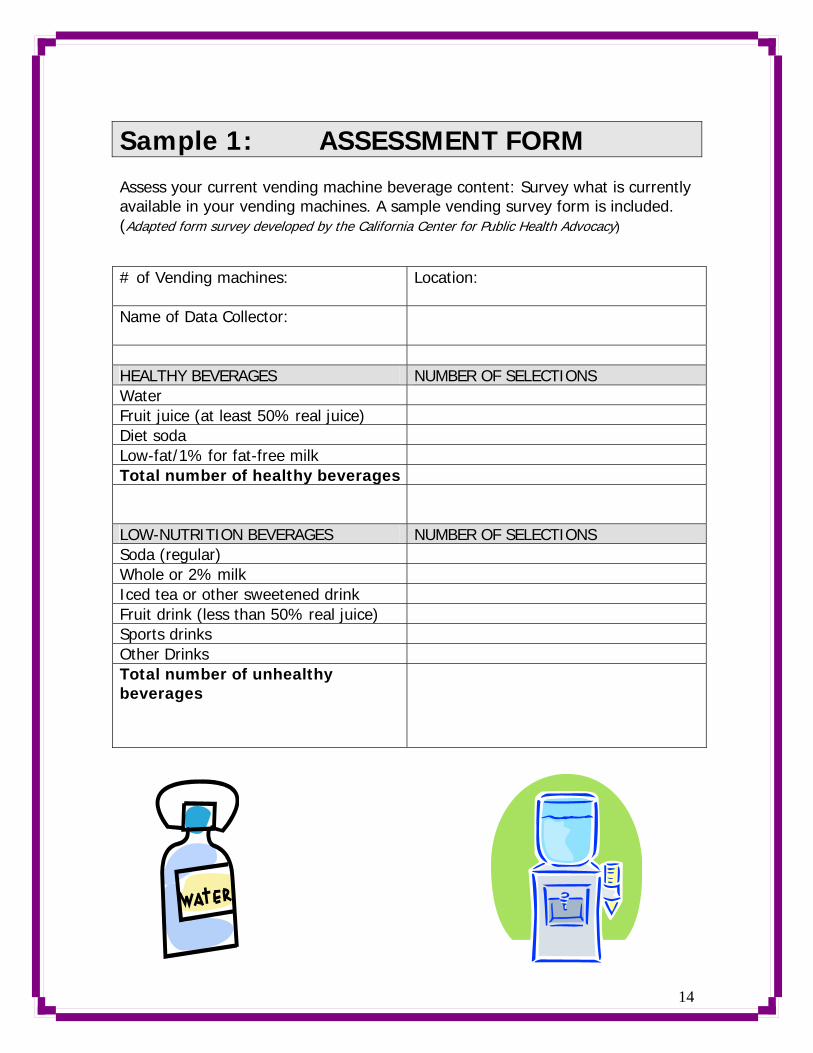
Sample 1: ASSESSMENT FORM
Assess your current vending machine beverage content: Survey what is currently available in your vending machines. A sample vending survey form is included. (Adapted form survey developed by the California Center for Public Health Advocacy) # of Vending machines:
Location:
Name of Data Collector:
HEALTHY BEVERAGES NUMBER OF SELECTIONS Water Fruit juice (at least 50% real juice) Diet soda Low-fat/1% for fat-free milk Total number of healthy beverages
LOW-NUTRITION BEVERAGES NUMBER OF SELECTIONS Soda (regular) Whole or 2% milk Iced tea or other sweetened drink Fruit drink (less than 50% real juice) Sports drinks Other Drinks Total number of unhealthy beverages
15
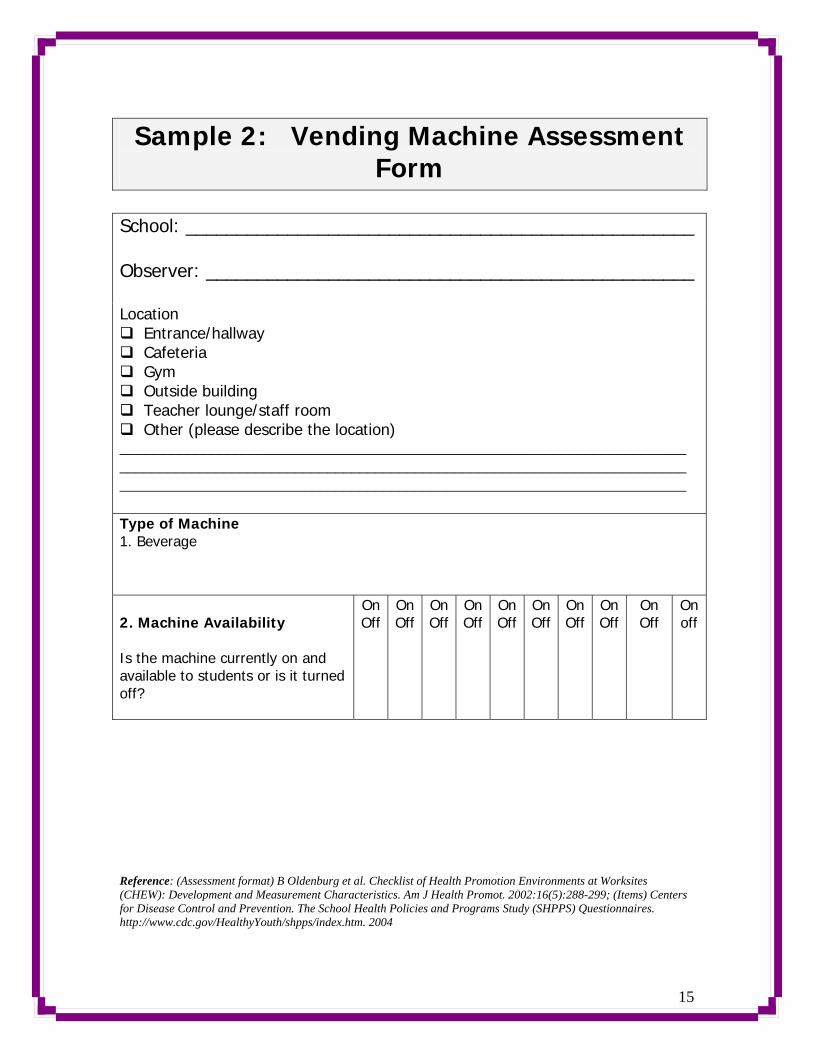
Sample 2: Vending Machine Assessment Form
School: __________________________________________________ Observer: ________________________________________________ Location
Entrance/hallway Cafeteria Gym Outside building Teacher lounge/staff room Other (please describe the location)
_______________________________________________________________________ _______________________________________________________________________ _______________________________________________________________________ Type of Machine 1. Beverage
2. Machine Availability Is the machine currently on and available to students or is it turned off?
On Off
On Off
On Off
On Off
On Off
On Off
On Off
On Off
On Off
On off
Reference: (Assessment format) B Oldenburg et al. Checklist of Health Promotion Environments at Worksites (CHEW): Development and Measurement Characteristics. Am J Health Promot. 2002:16(5):288-299; (Items) Centers for Disease Control and Prevention. The School Health Policies and Programs Study (SHPPS) Questionnaires. http://www.cdc.gov/HealthyYouth/shpps/index.htm. 2004
Sample 3: Vending Machine Survey The (your organization) would like to know the opinions about beverage choices in the vending machines located ________. The information gathered from this survey will be used to assess if there is a need for healthier options in vending machines, and if so we will implement a plan to make such healthy beverages available to you. Please take a few minutes to fill out this survey and return it to ____________ in______________ department.
1. I purchase regular soda, diet soda, ice tea and artificially sweetened beverages, fruit drink, and sports drinks from the vending machine at work: (check one) Almost every day ____ A few times a week ____ A few times a month ____ Never ____
2. Please rate the current selections in vending machines located on the ______________.
1. Variety of beverages 1 2 3 4 Poor Excellent 4. Reliability of machine 1 2 3 4 Poor Excellent
3. Drinking Healthy beverage is important to me Yes____ No____ 4. The current vending machines offer healthy beverage. Yes____ No____
5. What would you like to see added in the vending machines?
Water ___ diet sodas ___ Skim milk ___ Gatorade ___ 100% fruit juice/vegetable juice ___ Other (please describe) ____________________________________________
6. Would you purchase healthier beverage items if offered? Yes ___ No___ 7. Would you be willing to pay more for healthier beverage items? Yes ___ No ___ Comments __________________________________________________________
References: Food Surveys Rutgers University, Riverland Community College, and Boise State University.

17
Sample 4: Community Beverages Assessment Form or Progress Report or Report Card) (adapted from California LEAN)
Location and Description of Beverages: (for example, 4 vending machines in high school cafeteria; 26 beverage choices sold in tribal grocery store)
Name of Data Collector: __________________ Date: _________________________________
Please rate on a scale of four to one: “Above Standard” (4), “At Standard” (3), “Approaching Standard” (2), and "Beginning" (1), below:
4 Excellent/
Above Standard
3 Very Good/ At Standard
2 Good/
Approaching Standard
1 Beginning
Healthy Beverage Choices: Options: Are there more healthy options (waters, low fat milks and 100% fruit juices) than there are sodas, energy drinks, sports drinks, sweet teas? Are healthy beverages as accessible and available as sodas? NOTES: _________________________ _____________________________________________________________________________________________________________________________
Variety of healthy beverages. No sodas sold.
Variety of healthy beverages including waters. Only sugar-free sodas sold. Soda is not available to students all day.
50% of all items offered for sale at any site include healthy beverages.
Few or no healthy options.
Healthy Choices: Portions. What are the sizes of beverages offered – for example, ½ cup fruit juice, 1 cup milk, 12 ounce cans, 20 ounce bottles, “super sizes”, “big gulps”? NOTES: ___________________________________________________________________________ ___________________________________________________________________________
Appropriate size beverages for child/adult
At least 75% of all items offered for sale at any site are appropriately sized.
At least 50% of all items offered for sale at any site are appropriately sized.
Few or no beverages appropriately sized. Most sodas are 20 ounce size or larger

18
4 Excellent/
Above Standard
3 Very Good/ At Standard
2 Good/
Approaching Standard
1 Beginning
Healthy Choices: Visibility Are there visible vending machines, snack bars, tribal events offering healthy choices? When can children get healthy beverages; i.e. School meals, school snacks, snack bars, markets, tribal events? NOTES: __________________________________________________________________ __________________________________________________________________
Healthy beverages widely available in vending machines, snack bars, tribal events, grocery stores and school cafeterias.
Many (over half) of the healthy choices are widely available in vending machines, snack bars, tribal events, grocery stores and school cafeterias.
Less than half of the healthy choices are widely available in vending machines, snack bars, tribal events, grocery stores and school cafeterias.
Few if any healthy beverages available. Soda pop, sugary beverages and/or alcohol highly visible in the community
Advertising and Promotion What are the messages at schools, sports fields, banners, tribal sponsored events advertising beverages? Do they promote healthy beverage choices such as water, 100% fruit juices, milk and/or sugar free beverages? NOTES: ___________________________________________________________________________ ___________________________________________________________________________
Promotion of healthy beverages highly visible in community. Zero promotion of unhealthy beverages. There exists a “no soda” policy at school and tribal community sponsored events.
Many (over half) of the healthy choices are advertised and promoted in the community.
Less than half of the healthy choices are advertised and promoted in the community.
No messages promoting healthy beverage choices. Soda pop, sugar sweetened beverages and/or alcohol highly visible in the community.
Rating Score:
19
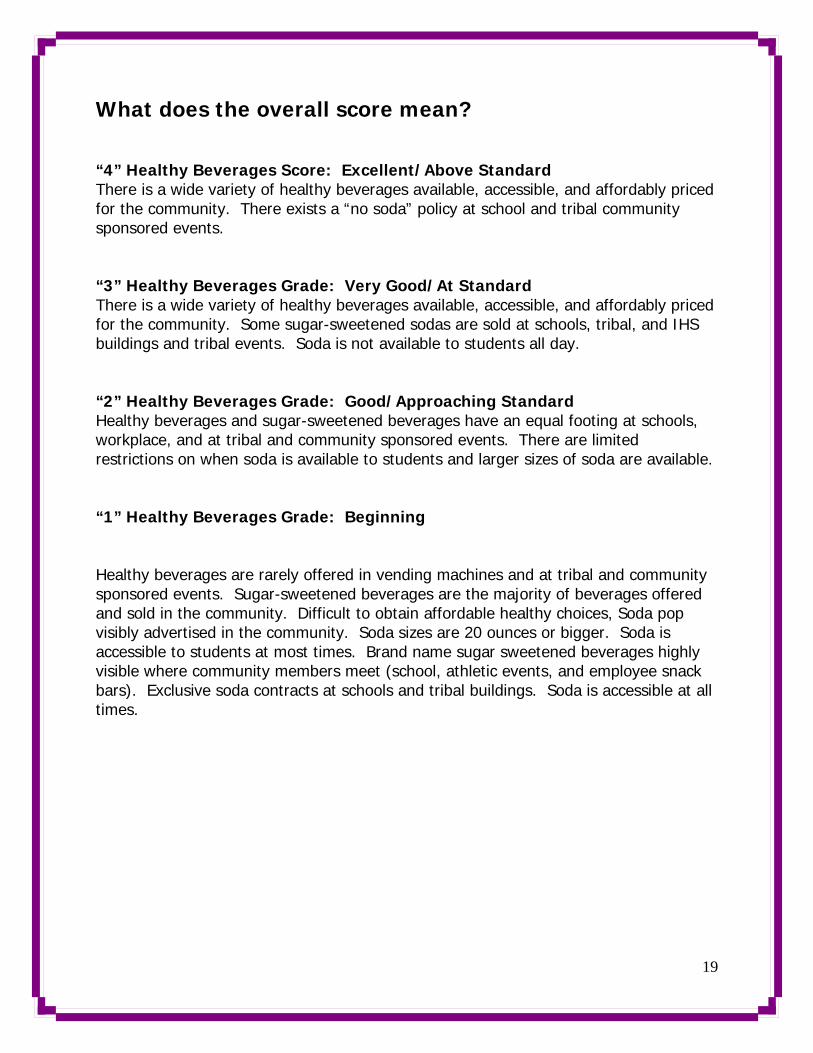
What does the overall score mean? “4” Healthy Beverages Score: Excellent/Above Standard There is a wide variety of healthy beverages available, accessible, and affordably priced for the community. There exists a “no soda” policy at school and tribal community sponsored events. “3” Healthy Beverages Grade: Very Good/At Standard There is a wide variety of healthy beverages available, accessible, and affordably priced for the community. Some sugar-sweetened sodas are sold at schools, tribal, and IHS buildings and tribal events. Soda is not available to students all day. “2” Healthy Beverages Grade: Good/Approaching Standard Healthy beverages and sugar-sweetened beverages have an equal footing at schools, workplace, and at tribal and community sponsored events. There are limited restrictions on when soda is available to students and larger sizes of soda are available. “1” Healthy Beverages Grade: Beginning Healthy beverages are rarely offered in vending machines and at tribal and community sponsored events. Sugar-sweetened beverages are the majority of beverages offered and sold in the community. Difficult to obtain affordable healthy choices, Soda pop visibly advertised in the community. Soda sizes are 20 ounces or bigger. Soda is accessible to students at most times. Brand name sugar sweetened beverages highly visible where community members meet (school, athletic events, and employee snack bars). Exclusive soda contracts at schools and tribal buildings. Soda is accessible at all times.

20
Sample 5: Community Beverages Assessment Form (blank)
A Excellent
B Very Good
C Fair
D ___
F Failing
Healthy Beverage Choices Are there more healthy options (waters, low fat milks and 100% fruit juices) than there are sodas, energy drinks, sports drinks, sweet teas? Are healthy beverages as accessible and available as sodas?
Healthy Choices: Portions What are the sizes of beverages offered – for example, ½ cup fruit juice, 1 cup milk, 12 ounce cans, 20 ounce bottles, “super sizes”, “big gulps”?
Healthy Choices: Prices How are the healthy choices priced compared to other beverages? Are waters, juices, and low fat milks cheaper, more expensive, or equal in price compared to sugary sodas.
Healthy Choices: Visibility Are there visible vending machines, snack bars, tribal events offering healthy choices? When can children get healthy beverages; i.e. School meals, school snacks, snack bars, markets, tribal events?
Advertising and Promotion What are the messages at schools, sports fields, banners, tribal sponsored events advertising beverages? Do they promote healthy beverage choices such as waters, juices and milks?

21
How to Start Planning for a Healthy Beverage Community Action Campaign
Based on the results of the assessment and community feedback gathered, we suggest focus on areas that will promote discussion among decision-makers and community members enabling them to work towards an agreement on a healthy beverages environment. It’s a good idea to start planning early. Here are specific steps to get the planning process started:
Identify the Healthy Beverages Campaign Champion (Leader) and Action Team members
Action team meets to brainstorm, develop strategy, plan of action, timeframe, and evaluation methods. For example, Action Team identifies community partners, organizes fun family events and presentations by elders.
Will need to schedule 1 or 2 meetings perhaps in the evening to accommodate community leaders, elders, and individuals who are unable to take off from work. Announce meeting dates and times.
Meetings led by a facilitator (and/or the workgroup leader/champion).
Allow people/participants to remain focused on the topic and on the agenda. See sample agenda.
Identify a recorder and timekeeper for the meeting.

22
⇒ Agenda Sample: Improving the Community Healthy Beverages Environment: Taking Action
Date: Time: Facilitator: Recorder: Timekeeper:
Objectives: (insert your objectives here) � Discuss results of the Community Beverages Assessment � Discuss opportunities for collaboration and coordination to create a healthy beverage
environment. Agenda � Welcome and Introductions prayer if appropriate. Circulate sign in
sheet. � Introduction to Healthy Beverage project � Results of the Community Assessment � Presentation on a Friendly Healthy Beverages Environment � Q & A/Discussion
� Closing Remarks
� Next Steps
� Closing Remarks
� Adjourn
Attach a list of participants (or description of the meeting participants; for example, 25 Head Start Program parents/teacher/staff/adults.

23
⇒ First meet with Tribal Official(s), ask for her/his support and follow up with a presentation to the Tribal Council and/or a Letter to a Tribal Leader.
Sample Letter Date: Address: Dear Chairman/Chairwoman, Mr. President: As a health professional and (Your title in organization), I want to make you aware that (your organization) is developing a healthy beverage awareness initiative to help reduce and prevent obesity, type 2 diabetes and dental caries among American Indians and Alaskan Natives (AI/AN). The Healthy Beverage initiative will officially kick off (Date/Time/location). This project will reach out to people of all ages and empower them to make informed, healthy beverage choices. This project is done in partnership with (insert your local partners). The purpose for the project is simple. America is facing a diabetes and overweight epidemic. This unhealthy trend is more prominent in our American Indian and Alaskan Native community. “Studies indicate that obesity rates for AI/AN children, adolescents, and adults are higher than rates for the US population. Age-specific prevalence of overweight ranged form 61% to 78% in 20- to 64-yr-old men and from 81% to 87% in women of the same age.” (Insert diabetes data). Oral disease rates in AI/AN are 2-3 times those of the non-Indian population. According to the 1999 IHS Oral Health Survey, 79% of AI/AN children aged 2-5 yrs have tooth decay; the prevalence increases with age to 87% at 6 -14 yrs, and 91% at 15-19 yrs. Adults age 44 yrs have a 78% prevalence, and those aged 55 or older have lost at least one tooth due to tooth decay, gum disease, or other trauma.” We believe your commitment to and participation in this outreach effort is critical to the success of our healthy beverages project. I hope that after you take a look at the facts I have enclosed on health problems among AI/AN, you will support the need for this project in our community. (Insert your overweight and obesity facts, oral health and diabetes data) I encourage you to support our efforts as we move forward with our project. I look forward to hearing from you. Our message needs to be heard so that our people can start taking a more active role in staying healthy.
Sincerely, Your name
Address Phone number Fax number, Email address

24
Fact Sheet
Why less Soda and More Healthy Beverages for Children and Youth?
Teenage boys drink carbonated or non-carbonated soft drinks an average of three 12-ounce cans per day.
Teenage girls drink more than two 12-ounce cans of carbonated or non-carbonated soft drinks per day.
Direct link between good nutrition and the ability to learn, play, grow and develop.
Well-nourished and hydrated children have higher test scores, better school attendance and fewer behavioral problems.
Parents can help children learn to enjoy water as the thirst quencher of choice. Caffeinated drinks are a mildly addictive stimulant drug and are not appropriate for children. Many soft drinks are caffeinated. A 12-ounce can of soda have 35-55 mg of caffeine; too much for children.
Teeth and oral health
Prevent tooth decay. According to the 1999 IHS Oral Health Survey, 79% of American Indian and Alaska Native (AI/AN) children aged 2-5 years have tooth decay. The prevalence increases with age to 87% at 6-14 years. and 91% at 15-19 years.
Preserve beautiful smiles in children. Carbonated soft drinks can erode tooth enamel surfaces, leading to cavities. Carbonated soft drinks – both sugary and sugar-free, contain acids.
Tooth enamel starts to dissolve when the pH level in the mouth drops below 5.5, and all soda have an acid level much stronger than 5.5. Coke has a pH of 2.53, and Pepsi 2.49. As a comparison, battery acid has a pH of 1.00.
Sports drinks, energy drinks, and other flavored drinks such as Gatorade, Red Bull, and PowerAde may do more damage to your teeth than plain old cola. PowerAde caused up to 11 times more erosion of tooth enamel than Coca-Cola. (Source: Dental notes, spring 2005, Academy of General Dentistry).

25
Too much body weight (overweight)
According to the 2001 Surgeon General’s Call to Action to Prevent and Decrease Obesity, today there are nearly twice as many overweight children and almost three times as many overweight adolescents as there were in 1980. Healthy weight for height will lower a person’s risk for developing diseases such as diabetes and heart disease.
Sugary soft drinks are the major dietary source of added sugars. Studies connect soda pop consumption with increased overweight and nutrient deficiency.
The average teen consumes 15 teaspoons of sugar per day from soft drinks. Each additional serving of sugar-sweetened drinks increases the frequency of overweight.
Consumption of sugar-sweetened beverages is associated with overweight in children and teens.
Sweet drinks, including soda, fruit drinks, and other sweetened beverages, increase the risk of overweight and obesity among preschool children. (Welsh, 2005).
Researchers report a correlation between soft drink consumption and television viewing and obesity in adolescents. For students who drank three or more soft drinks per day (both diet and regular soft drinks), and watched 3 or more hours of television per night had high body weights for Height or high Body Mass Index (BMI) at or above the 85th percentile. (Giammattei, 2003).
Diabetes
Overweight is a strong risk factor for developing Type 2 diabetes. Type 2 diabetes is increasingly common in American Indian and Alaska Native youth. Excess calories from sugary drinks can cause overweight.
Bone health
Soda consumption has replaced milk in the diets of many children, putting them at risk for fragile and broken bones and bone disease such as osteoporosis.
Vitamins, Minerals and Beverages
Water is needed for good health. Milk contains vitamins, A, D, B-12, calcium, magnesium and protein. These are nutrients important for the developing strong bones, healthy teeth, nerves, and more. When soft drinks are chosen in place of milk, protein, calcium, zinc, vitamins A & C fall.
Carbonated sodas contain sugar, corn syrup, caffeine, and water. Drinking carbonated sodas cause decrease in vitamin A, calcium and magnesium in children.
The American Academy of Pediatrics recommends that school-age children limit their fruit juice to 8 – 12 ounces daily (1 – 1/2 cups/day total).

26
Fact Sheet
Soda Pop Consumption Increasing
Manufacturers pumped out 15 billion gallons of pop in 2000, twice as much as the 1970s. Today’s children consume 8 percent of their calories from soft drinks. The larger the container, the more people are likely to drink. The 6½-ounce standard serving of the 1950s grew into 12 ounces, now being supplanted by 20 ounces. Pricing encourages the purchase of larger sizes at fast food establishments. A preliminary report on an informal survey shows that more than half of the Alaska Natives surveyed drink at least one can of pop a day, and one fifth drink at least two cans a day.
Tooth Decay Hurts Alaska Natives
The 1999 Indian Health Service Oral Health Survey represents only about 1% of the Alaska Native population, but gives us preliminary data about the seriousness of the problem of tooth decay compared to non-Natives. The averages for three age groups (shown below) shows Alaska Natives have more than twice as many decayed or filled teeth as non-Natives.
Age Alaska Native U. S. All Rates Ages 6-14 7 3.4 Ages 15-19 11 5
Adults 35-44 33 7.6
(Other contributors to the problem of tooth decay among Alaska Natives include poor access to dental care and preventive measures such as protective sealants and fluoridation.)
Diabetes Rates Are Also Skyrocketing According to a study from the Harvard School of Public Health, the odds of a child becoming overweight increase 1 to 6 times for each additional can or glass of sugar-sweetened drink per day. One of the most serious aspects of overweight and obesity in children is Type 2 diabetes. It accounted for 2 to 4 % of all childhood diabetes before 1992, but rocketed to 16% by 1994. Moreover, overweight adolescents are much more likely to become overweight adults, with increased risk for developing heart disease and stroke, gallbladder disease, arthritis, and endometrial, breast, prostate, and colon cancers.
In Alaska, the rate of diabetes varies in different parts of the state, but some areas have rates of diabetes almost four times higher than the United States in general. These rates are increasing in all areas of the state. Rates of increase vary from 30% to 152%.
27
Detailed Fact Sheet (Adapted from Alaska Native Tribal Health Consortium)
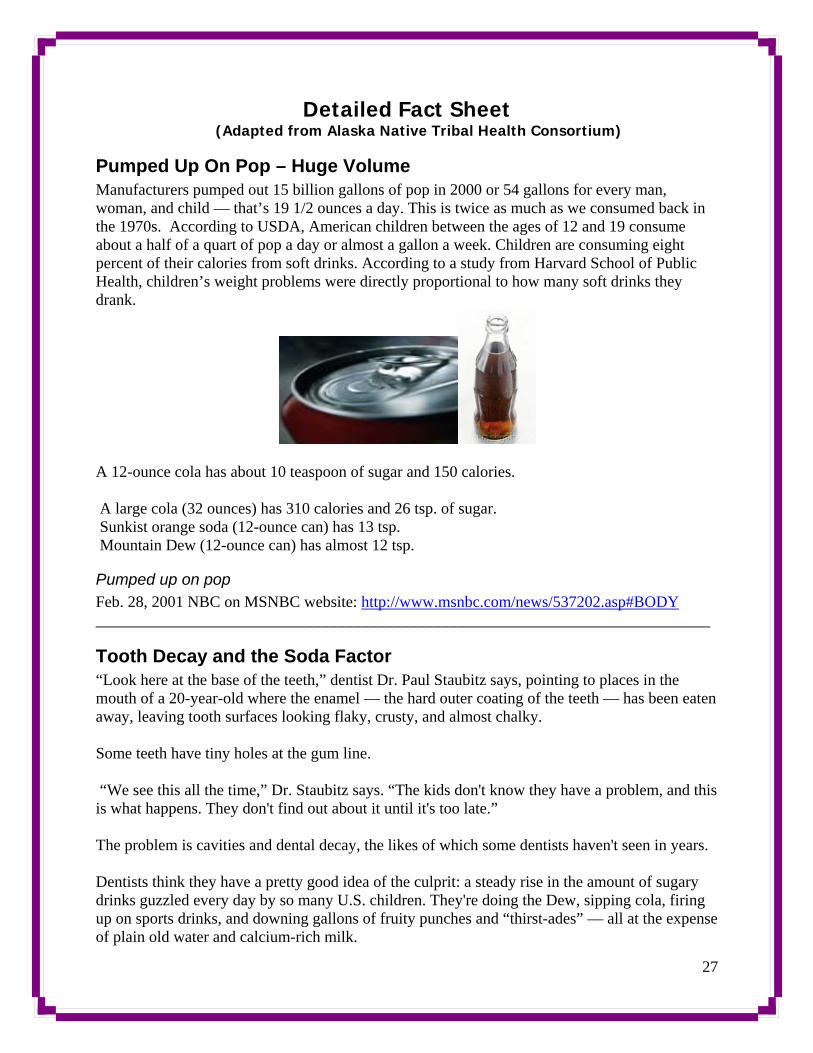
Pumped Up On Pop – Huge Volume Manufacturers pumped out 15 billion gallons of pop in 2000 or 54 gallons for every man, woman, and child — that’s 19 1/2 ounces a day. This is twice as much as we consumed back in the 1970s. According to USDA, American children between the ages of 12 and 19 consume about a half of a quart of pop a day or almost a gallon a week. Children are consuming eight percent of their calories from soft drinks. According to a study from Harvard School of Public Health, children’s weight problems were directly proportional to how many soft drinks they drank.
A 12-ounce cola has about 10 teaspoon of sugar and 150 calories.
A large cola (32 ounces) has 310 calories and 26 tsp. of sugar. Sunkist orange soda (12-ounce can) has 13 tsp. Mountain Dew (12-ounce can) has almost 12 tsp.
Pumped up on pop Feb. 28, 2001 NBC on MSNBC website: http://www.msnbc.com/news/537202.asp#BODY _____________________________________________________________________________
Tooth Decay and the Soda Factor “Look here at the base of the teeth,” dentist Dr. Paul Staubitz says, pointing to places in the mouth of a 20-year-old where the enamel — the hard outer coating of the teeth — has been eaten away, leaving tooth surfaces looking flaky, crusty, and almost chalky. Some teeth have tiny holes at the gum line. “We see this all the time,” Dr. Staubitz says. “The kids don't know they have a problem, and this is what happens. They don't find out about it until it's too late.” The problem is cavities and dental decay, the likes of which some dentists haven't seen in years. Dentists think they have a pretty good idea of the culprit: a steady rise in the amount of sugary drinks guzzled every day by so many U.S. children. They're doing the Dew, sipping cola, firing up on sports drinks, and downing gallons of fruity punches and “thirst-ades” — all at the expense of plain old water and calcium-rich milk.
28
Tooth decay and the soda factor: As consumption of sweet drinks grows by big gulps, cavities go crazy; By Sue MacDonald, The Cincinnati Enquirer. April 07, 1999 From the website: http://enquirer.com/editions/1999/04/07/loc_tooth_decay_and_soda.html
Tooth Decay “Drinking carbonated soft drinks regularly can contribute to the erosion of tooth enamel surfaces” according to the Academy of General Dentistry, an organization of North American dentists dedicated to continuing education to ensure the best possible dental care for the patient.”
Academy of General Dentistry Consumer Information Fact Sheet From the website: http://www.qualitydentistry.com/library/agd/dsdb.html _____________________________________________________________________________
Childhood Overweight “Excessive bodyweight probably now constitutes the most common pediatric medical problem in USA. Although the cause of this apparent obesity epidemic is likely to be multifactorial, our findings suggest that sugar-sweetened drink consumption could be an important contributory factor. The odds ratio of becoming overweight among children increased one - six times for each additional can or glass of sugar-sweetened drink that they consumed every day.” Relation between consumption of sugar-sweetened drinks and childhood obesity: a prospective and observational study. By David S. Ludwig, Karen E. Peterson, and Steven L. Gortmaker THE LANCET • Vol 357 • February 17, 2001 _________________________________________________________________________ Type 2 Diabetes in Youth Type 2 diabetes is not uncommon in American Indian and Alaska Native youth. Among AI/AN youth age 15 to 19 years, diabetes increased by 106% in an IHS-wide study done in 1990-2001. Although the peak age of occurrence is usually around adolescence, type 2 diabetes has been reported in AI children as young as 4 years. Risk factors for type 2 diabetes in children include overweight, inactivity, and a family history of type 2 diabetes. IHS National Diabetes Program Interim Report to Congress Special Diabetes Program for Indians, December 2004.
29
Liquid Candy: Advertising, large container sizes lead to high consumption “...One reason, aside from the ubiquitous advertising, for increasing consumption is that the industry has steadily increased container sizes. In the 1950s, Coca-Cola's 6½-ounce bottle was the standard serving. That grew into the 12-ounce can, and now those are being supplanted by 20-ounce bottles (and the 64-ounce Double Gulp at 7-Eleven stores). The larger the container, the more beverage people are likely to drink, especially when they assume they are buying single-serving containers. Also, prices encourage people to drink large servings. For instance, at McDonald's restaurants a 12-ounce (‘child size’) drink costs 89 cents, while a drink 250% larger (42-ounce ‘super size’) costs only 79% more ($1.59) At Cineplex Odeon theaters, a 20-ounce (‘small’) drink costs $2.50, but one 120% larger (44-ounce ‘large’) costs only 30% more ($3.25).”
Liquid Candy: How Soft Drinks are Harming Americans' Health, by Michael F. Jacobson, Ph.D.
An excerpt from the Center for Science in the Public Interest website: http://www.cspinet.org/sodapop/liquid_candy.htm
Native Americans and tooth decay Oral disease constitutes a major public health problem among Native Americans... the cost of treating oral health problems as well as the social disability resulting from poor oral health cannot be ignored, particularly in view of the fact that most oral health problems are preventable. Native Americans suffer from high rates of tooth decay, gum disease and tooth loss. This situation has occurred while the oral health of the U.S. population at large has improved. The Oral Health of Native Americans: A Chart Book of Recent Findings, Trends and Regional Differences, by William Niendorff, DDS, MPH, Dental Field Support and Program Development Section, Indian Health Service, Albuquerque, NM. 1991 Parent and Family Facts Sheet (1 page) “What are you and your family drinking?” created 2005, Kelle Vort, RD, San Felipe Pueblo Health and Wellness Department, NM:

30
A New Proposed Guidance System for Beverage Consumption in the United States The American Journal of Clinical Nutrition March 2006
The Beverage Guidance System ranks beverages in 6 levels that should be consumed in limited quantities. Level 1 is consumed as the major beverage water.
Levels of Beverages Recommended OuncesLevel 1: Water
� Essential for human life. � Necessary for metabolism and physiologic functions. � May provide calcium, magnesium, and fluoride.
(20-50 fl oz/day 100 % water
Level 2: Tea and Coffee, (Unsweetened)
� Black, green and oolong tea – provides variety of flavonoids, antioxidants and fluoride.
� reduces tooth decay & cavities, reduces kidney stones, increases bone density
� Coffee can reduce risk of Type 2 diabetes, colorectal cancer, and Parkinson’s disease in men
4-5 cups (0-40 fl oz/d) Limit Caffeine 400 mg/d
Level 3: Low Fat Milk, Skim Milk, Soy Beverages
� Provides vitamin D, calcium and protein � Low fat milk and skim milk contribute to healthy diet � Soymilk provides alternative for people who do not
drink cow’s milk
0-16 fl oz/d
Level 4: Noncalorically Sweetened Beverages
� Diet sodas, diet drinks are alternatives to providing a sweet drink
� Nutritive sweeteners are added to most diet sodas & diet drinks
� Downside is that drinks with sweeteners provide a sweeter taste, less preference for water, tea or coffee
0-32 fl oz/d
Level 5: Caloric Beverages with Some Nutrients
� Fruits juices, vegetable juices, whole milk and sports drink provide some nutrients
� Downside is that could contain high energy content, high sodium, dense fats, too much carbohydrates
0-8 fl oz 100% fruit juices/d
Level 6: Calorically Sweetened Beverages
� Sweetened with high fructose corn syrup or sucrose. Regular sodas, fruit drinks, and other carbonated drinks.
� Can cause dental caries, weight gain, and Type II Diabetes
0-8 fl oz/d

31
The Daily Healthy Beverage Guidelines You Are What You Drink
Purpose: Help Americans make smart beverage choices. Recommended: Women should drink 9 eight oz. servings.
Men should drink 13 eight oz. servings. Limit caffeine to 400 mg per day. Beverages should not be more than 10-15% of total daily calories. Choose more beverages from the bottom of the pitcher. Drink in moderation beverages from the top of the pitcher.
“The Daily Healthy Beverage Guidelines” Unilever Health Institute 2006.
http://www.liptont.com/downloads/tea_health/beverage_guide/lipton_bevguide_poster.pdf

32
The Daily Healthy Beverage Guidelines Recommendations
The American Journal of Clinical Nutrition March 2006
Women should drink 9 eight oz. servings
Men should drink 13 eight oz. servings
Limit caffeine to 400 mg per day
Beverages should not be more than 10- 15% of total daily calories
Choose more beverages from the bottom
of the pitcher Drink in moderation beverages from the
top of the pitcher
NOTE: “Fluid needs vary widely among people and persons with higher-than- average needs should increase their fluid intake from calorie-beverage, preferable water.”
The fluoride content of bottled water is usually much lower than fluoridated tap water, but on occasion it may exceed advisable concentrations.

33
Beverage Caffeine Content of 12-ounces beverage milligrams
Beverage Amount of Caffeine in milligrams
Red Bull (8.2 oz) 80.0 Jolt 71.2 Pepsi One 55.5 Mountain Dew 55.5 Mountain Dew Code Red 55.5 Diet Mountain Dew 55.5 Kick Citrus 54.0 Mellow Yellow 52.8 Surge 51.0 Tab 46.8 Diet Coke 45.6 Diet Coke with Lemon and Diet Coke with Lime 45.6 Diet Vanilla Coke 45.6 Shasta Cola 44.4 Shasta Cherry Cola Shasta Diet Cola
44.4
RC Cola Diet RC
43.0
Diet Sunkist Orange 41.0 Mr. Pibb 40.0 Sugar-Free Mr. Pibb 40.0 Red Flash 40.0 Sunkist Orange 40.0 Slim-fast Cappuccino Delight Shake 40.0 Ruby Red 39.0 Big Red 38.0 Storm 38.0 Wild Cherry Pepsi 38.0 Pepsi-Cola 37.5 Pepsi Twist 37.5 Diet Pepsi 36.0 Diet Wild Cherry Pepsi 36.0 Diet Pepsi Twist 36.0 Aspen 36.0 Coca-Cola Classic 34.0 Coke C2 34.0 Cherry Coke 34.0 Lemon Coke 34.0 Vanilla Coke 34.0 Diet Cherry Coke 34.0 Snapple Flavored Teas (Reg. or Diet) 30.0 Canada Dry Cola
30.0

34
Beverage
Amount of Caffeine in milligrams
A & W Crème Soda 29.0 Nestea Sweet Iced Tea 26.0 Nestea Unsweetened Iced Tea 26.0 Barq’s Root Beer 23.0 A&W Diet Crème Soda 22.0 Slim-fast Chocolate Flavors 20.0 Snapple Sweet Tea 12.0 Lipton Brisk, All Varieties 9 Canada Dry Diet Cola
1.2
Diet Rite Cola 0 7-Up 0 Sprite 0 Mug Root Beer 0 Diet Barq’s Root Beer 0 Sun Drop Orange 0 Minute Mid Orange 0 A&W Root Beer 0 Slice Sierra Mist 0 Fresca 0
“Caffeine Content of Popular Drinks” 14 June 2006 Wilstar 2006. <http://wilstar.com/caffeine.htm>“Caffeine Content of Foods and Drugs.” 12 June 2006 Nutrition Action Health letter 1996. <http://www.cspinet.org/nah/caffeine/caffeine_content.htm>
Beverage
Amount of Caffeine Milligrams
Brewed Coffee 85 Instant Coffee 60 Decaffeinated Coffee 5 Coffee, tall Starbucks 375 mg Coffee, grande Starbucks 500 mg Expresso, Starbucks 35 mg Tea, green or instant 30 Tea, leaf or bag 50 mg Arizona Iced Tea-assorted flavors 15-30 mg Nestea Pure Lemon Sweetened Iced Tea 22mg Cocoa 5 Herbal Teas 0 Bottle Water 0
35
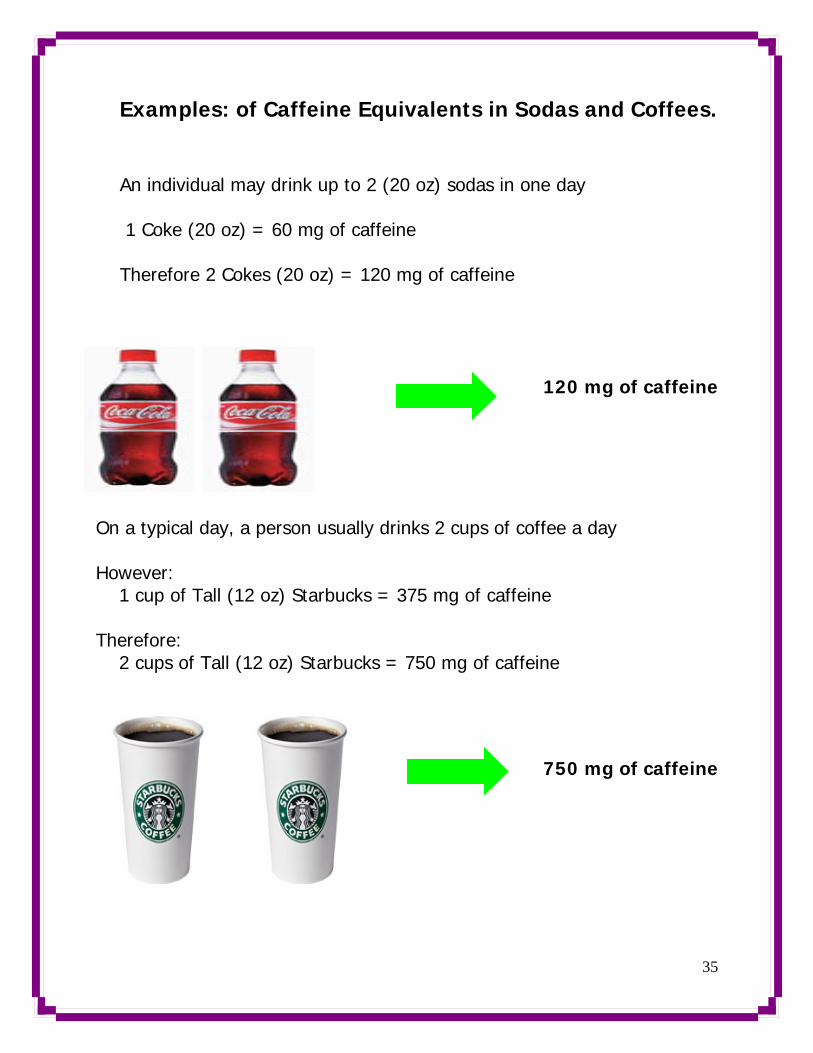
Examples: of Caffeine Equivalents in Sodas and Coffees. An individual may drink up to 2 (20 oz) sodas in one day 1 Coke (20 oz) = 60 mg of caffeine Therefore 2 Cokes (20 oz) = 120 mg of caffeine
120 mg of caffeine
On a typical day, a person usually drinks 2 cups of coffee a day However: 1 cup of Tall (12 oz) Starbucks = 375 mg of caffeine Therefore: 2 cups of Tall (12 oz) Starbucks = 750 mg of caffeine
750 mg of caffeine
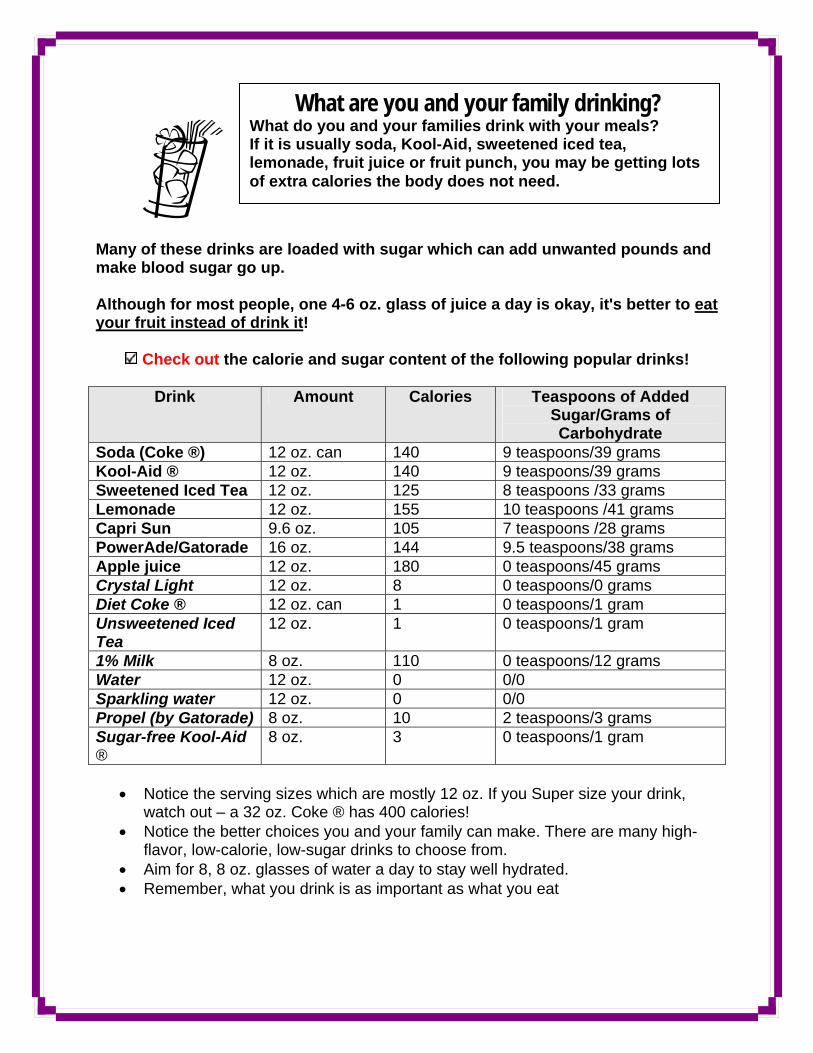
Many of these drinks are loaded with sugar which can add unwanted pounds and make blood sugar go up. Although for most people, one 4-6 oz. glass of juice a day is okay, it's better to eat your fruit instead of drink it!
Check out the calorie and sugar content of the following popular drinks!
Drink Amount Calories Teaspoons of Added
Sugar/Grams of Carbohydrate
Soda (Coke ®) 12 oz. can 140 9 teaspoons/39 grams Kool-Aid ® 12 oz. 140 9 teaspoons/39 grams Sweetened Iced Tea 12 oz. 125 8 teaspoons /33 grams Lemonade 12 oz. 155 10 teaspoons /41 grams Capri Sun 9.6 oz. 105 7 teaspoons /28 grams PowerAde/Gatorade 16 oz. 144 9.5 teaspoons/38 grams Apple juice 12 oz. 180 0 teaspoons/45 grams Crystal Light 12 oz. 8 0 teaspoons/0 grams Diet Coke ® 12 oz. can 1 0 teaspoons/1 gram Unsweetened Iced Tea
12 oz. 1 0 teaspoons/1 gram
1% Milk 8 oz. 110 0 teaspoons/12 grams Water 12 oz. 0 0/0 Sparkling water 12 oz. 0 0/0 Propel (by Gatorade) 8 oz. 10 2 teaspoons/3 grams Sugar-free Kool-Aid ®
8 oz. 3 0 teaspoons/1 gram
• Notice the serving sizes which are mostly 12 oz. If you Super size your drink,
watch out – a 32 oz. Coke ® has 400 calories! • Notice the better choices you and your family can make. There are many high-
flavor, low-calorie, low-sugar drinks to choose from. • Aim for 8, 8 oz. glasses of water a day to stay well hydrated. • Remember, what you drink is as important as what you eat
What are you and your family drinking? What do you and your families drink with your meals? If it is usually soda, Kool-Aid, sweetened iced tea, lemonade, fruit juice or fruit punch, you may be getting lots of extra calories the body does not need.

37
Alternative Herbal Teas (Commonly known as “Indian Tea”)
Many alternative herbal teas are consumed by Native Americans for health, medicinal and other ailments. These herbs are grown in the plains and mountain states and are used predominately in the Southwest, abundantly on the Navajo, Hopi, and Pueblo lands. The most commonly consumed teas are the: Indian Tea Greenthread (Thelesperma spp.) Dharmananda, Ph.D., Director, Institute for Traditional Medicine, Portland, Oregon
Traditional Method of Preparation: “Late July or early August my mother and sister would go up the mountains and gather ch'ilgoh wehih. When the buds open, usually we cut them 3-4 inches, so they would be more for next year. Next we would wash the plants well to get the dirt off. You may have to wash them several times. We would then lay them out to dry on the table or outside. When they are dry we would tie them up in bundles with strings and stored them in containers to be boiled later. We drink Ch’ilgoh with our meals or use it for medicine purpose. A bundle of tea takes about (2-5 minutes) to boil. It will produce a golden color.”
Dharmananda, Ph.D., Director, Institute for Traditional Medicine, Portland, Oregon January 2004

38
Other Alternative Teas Black, Green and Oolong Tea
Black, green and Oolong tea is the most consumed drink globally. Black, green and oolong teas originate from the Camellia sinensis plant and have all been associated with health benefits.
Black, Green tea and Oolong: � Tea has flavonoids and antioxidants � reduces tooth decay & cavities � reduces kidney stones, increases bone density

39
Who can I ask to be involved?
Participants will get involved for many reasons: Examples are:
Their community is important to them These are their issues and they believe they may contribute to
make a difference. They expect positive outcomes Their vision of a better community.
Participants will need to have at least:
Some knowledge, interest, and/or issues about healthy beverages. Something they can identify within their community and a feeling
they can contribute to make a difference. Willingness to get involved and participate.
How do I enlist participants?
Attend a community committee meeting that has been set. Explain why you want participants involved and the purpose of
your meeting. Keep a list of names and addresses as you build your list of
participants. It is sometimes easier to ask people you already know and get
them involved to increase your participation. Recruit participants from: community members, tribal leaders,
health care providers, parents, teachers, school board members, churches, agencies and organizations, senior programs, health care facilities, and youth groups.
Ground Rules for meetings:
Remember, all opinions, ideas, and beliefs are worthy. Keep on agenda. Listen, appreciate, and show consideration for others. You have a right to disagree without expressing judgment. Strive to reach agreement. Start and end on time.

40
Issues and topics
Some topics may need further discussion and may require more time. It is important to record the topic and discuss it later when appropriate. Focus Groups: The purpose of the focus group is to collect information regarding the knowledge, attitudes, and beliefs of AI/AN people regarding soft drink consumption in order to provide culturally sound and effective strategies to reduce soda consumption in their communities.
You will need a facilitator if you are going to conduct a focus group sessions. A facilitator’s role is to:
Be a resource person and leader
Be responsible for arranging a meeting for everyone to participate
Move the process along and help the group accomplish its
objectives Keep and enforce the ground rules
Give clear instructions and guidance about the activities
Monitor the meeting to keep on time and allow extra time for
discussion. Be non-judgmental and supportive
Provide essential information, and not opinions.
Some major themes may emerge from the focus groups: for
example soda pop consumption, the health impacts of soda consumption, health education messages, and intervention strategies.

41
Focus group questions assessing American Indian knowledge, attitudes, beliefs and recommendations about soft drinks.
(Adapted from IHS Emerging Leaders Report, 2005)
Names and identification of the primary grocery shopper:
1. Factors in food purchase and soda pop consumption What beverages do you and your family like to drink? What are some of the reasons that certain beverages are bought and consumed in your home?
How does what you drink affect your health?
2. Soda pop consumption: knowledge, attitudes, and beliefs Why do you drink soft drinks like soda pop? If you were asked to drink fewer soft drinks or soda pops, how would you feel?
What are some of the bad things about drinking soda pop? Have you ever heard anything about drinking fewer soft drinks or soda pop?
3. Social influences/community channels and networks
Who do you usually talk to about your health and the health of your family?
Do you influence the health of your family and community? Where do you get information about food and beverages? What is the best way to get the word out about health and soda? What would help your community reduce the amount of soda pop they drink?
4. Slogan Development
Do you have any ideas for a slogan that would encourage people in your community or school to drink fewer soft drinks or soda pops?
What do you think of the slogans “stop the pop”, “you are sweet enough”, and “pop busters”?

42
Community Survey
Explore how people in your community would be willing to help by talking to community members, schools, health centers, clinics, and community leaders.
Partnerships When you are planning and implementing partnerships, consult a variety of community members and tribal leaders and involve them from the start choosing issues that affect them and recognizing their power to help.

43
The Following Is An Example Of A Community Action.
A community action can be used to gather feedback and build support for improvements. Get feedback and suggestions from the community and encourage a discussion to be included in your action plan.
Develop a questionnaire. The results will help you assess the amount of support behind improving the healthy beverage environment in your community. You can present this to draw attention. PowerPoint presentation (Sample included in the Appendix)
Present success stories and activities that you would like to share and the benefits of healthy beverages in schools. Flyers and Fact Sheets
Create your own or adapt handouts and fact sheets on Healthy Beverages. Distribute at community meetings or events and post with permission at public locations.
Letter templates, (See sample)
Media materials
Call your local community newspaper and ask for a reporter who covers child obesity or nutrition. To publicize your press release template, send in out early or according to the newspaper policy. Follow up with a reminder via phone call before the event. Recommendations for building support
Other resources
44
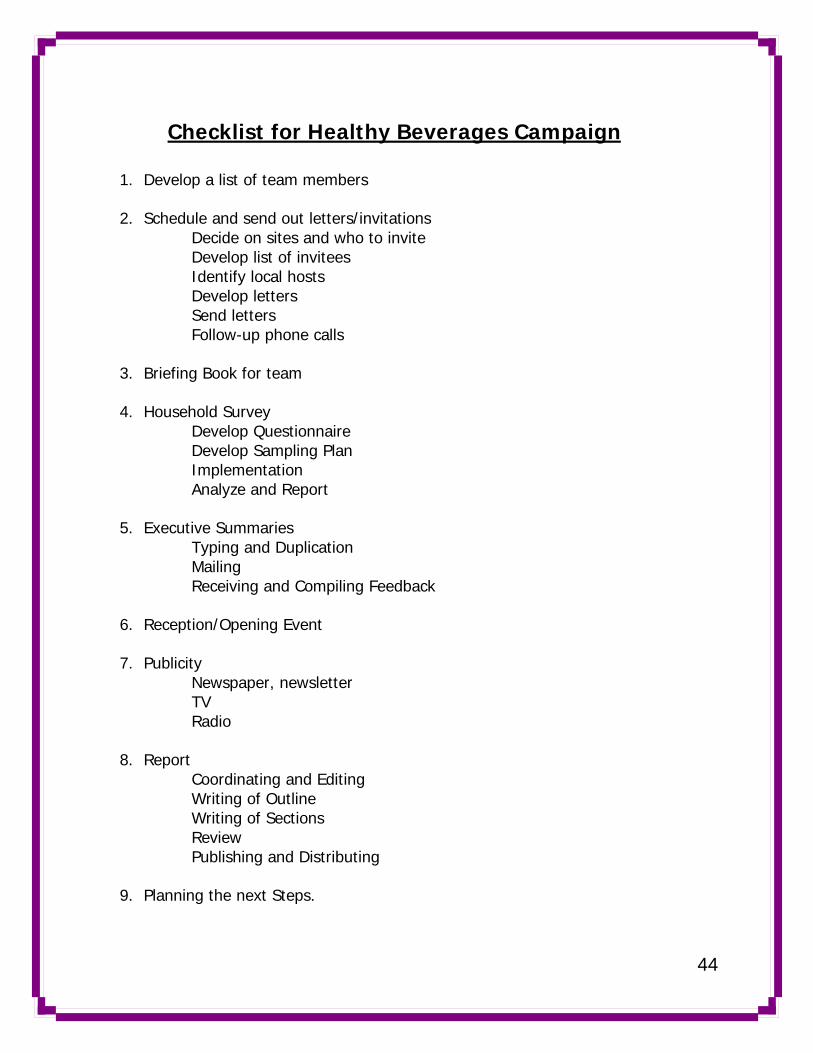
Checklist for Healthy Beverages Campaign
1. Develop a list of team members
2. Schedule and send out letters/invitations
� Decide on sites and who to invite � Develop list of invitees � Identify local hosts � Develop letters � Send letters � Follow-up phone calls
3. Briefing Book for team
4. Household Survey
� Develop Questionnaire � Develop Sampling Plan � Implementation � Analyze and Report
5. Executive Summaries
� Typing and Duplication � Mailing � Receiving and Compiling Feedback
6. Reception/Opening Event
7. Publicity
� Newspaper, newsletter � TV � Radio
8. Report
� Coordinating and Editing � Writing of Outline � Writing of Sections � Review � Publishing and Distributing
9. Planning the next Steps.

45
Partners: The following steps can assist you to build partnerships with the community.
1. Identify needs and enlist community partners and resources
2. Form a community partnership. Community members have an important role and can bring a vast range of resources, talents, and perspectives to contribute.
• Community tribal leaders, elected public officials, school representatives,
teachers, parents and students, Behavioral/social services
• Health Care Providers: It is essential to have the awareness, support and participation of health care providers such as dietitians. dental, CHR, nursing, and behavioral health.
• Community Health Centers/clinics and hospitals: You can get important
clients to increase awareness of making healthy beverage choices.
• Religious groups: Some churches have traditional and family community service and volunteer programs that may have information resources.
• Community colleges and universities: Ask these schools for participation or
it might be a good project for student internships with credit.
• Community groups: These include social services organizations, like volunteer programs, local chapters, PTA, city councils, senior groups and Boys and Girls’ Club.
• Media Representatives: Include local newspaper, newsletter, and radio
stations to get the word out to your community.
• Businesses: These include grocery stores, food markets, supermarkets, and local restaurants. They will help improve the visibility of your healthy beverage project.
• Government: These include Head Start and Women, Infants, and Children
(WIC) programs.
46
Work collaboratively together as a team and get buy-in:
Consult community leaders/members and involve them from the start. Let them feel a sense of ownership in partnerships by determining their own needs, choosing healthy beverage issues that affect them.
Assemble a group of interested people and discuss concerns that you have. If you already have an existing team, start with them. It should be made up of diverse members such as community leaders, parents, community members, health care providers and teachers. Choose team members who are willing to make a commitment and stay involved.
Create a supportive atmosphere Get the support of the community before you start Involve partners on the team such as health care professionals, community
leaders and schools.
Involve key players on the team:
Recruit individuals or groups who may be directly affected by the concerns you addressed. Get community members and health care professionals involved from the beginning.
It is important that various people be involved and must be a team effort.
Recognize that change is difficult and sometimes stressful for certain individuals:
It is important that you be sensitive to others. Communicate your team goals and planned activities to all stakeholders to
lighten hesitation about your efforts and ask for support from them.
Arrange for a team meeting:
Get together at a set time each month and agree the meeting time at the first meeting.
If your team members cannot attend regular meetings, meet individually to keep things coordinated.
Recognize that Teams go through periods of improvements:
It is important to take the time and effort to listen to each person’s point of view and suggestions. Thus each team member has the chance to have a say.

47
Implementation Process
The final phase focuses on implementation the action plan, pilot testing the changes, reporting to the community on the outcomes, and developing a proposal for a new beverage policy. Examples are provided on how to implement a healthy beverage policy. Purpose of the Policy The purpose of this policy initiative is to be used as a guide for AI/communities interested in passing a soda pop/snack vending machine policy. It is anticipated that the policy be adapted to fit the needs of the community.
48
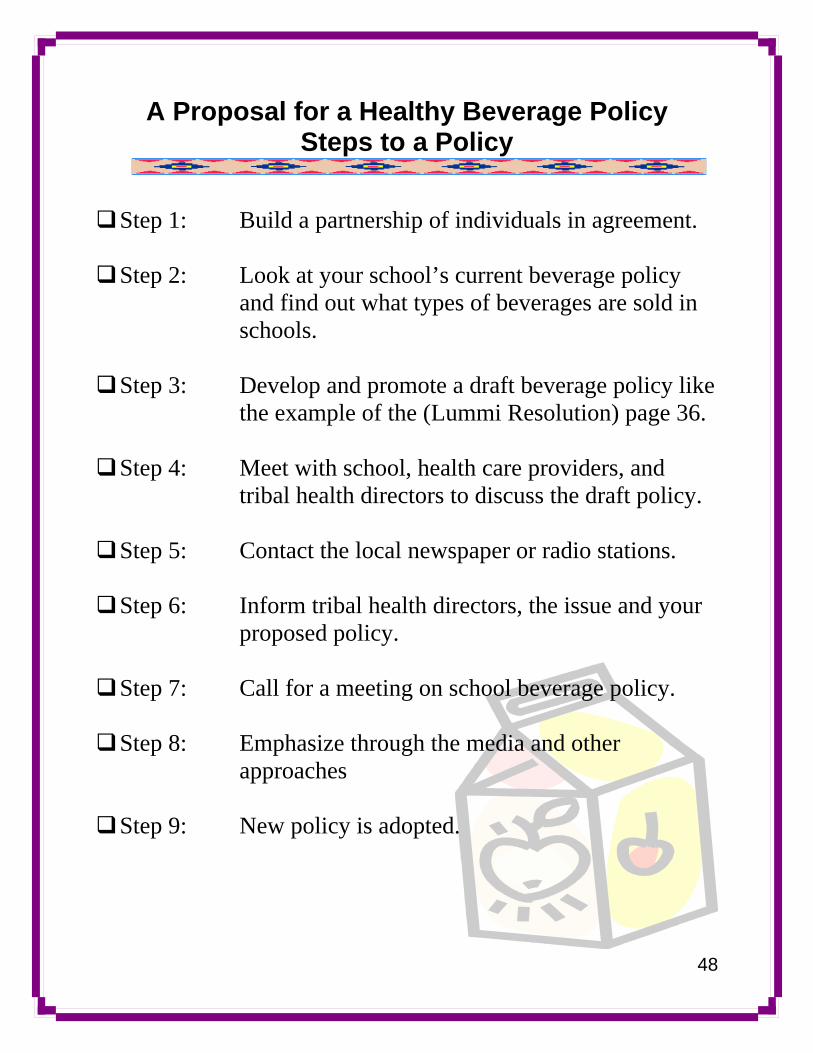
A Proposal for a Healthy Beverage Policy Steps to a Policy
Step 1: Build a partnership of individuals in agreement.
Step 2: Look at your school’s current beverage policy and find out what types of beverages are sold in schools.
Step 3: Develop and promote a draft beverage policy like the example of the (Lummi Resolution) page 36.
Step 4: Meet with school, health care providers, and tribal health directors to discuss the draft policy.
Step 5: Contact the local newspaper or radio stations.
Step 6: Inform tribal health directors, the issue and your proposed policy.
Step 7: Call for a meeting on school beverage policy.
Step 8: Emphasize through the media and other approaches
Step 9: New policy is adopted.

49
Example of STOP the Pop Resolution:
RESOLUTION #2004-149 OF THE LUMMI INDIAN BUSINESS COUNCIL TITLE: Stop the Pop: a resolution designed to encourage healthy beverage choices within LIBC and the community, in order to reduce healthcare problems, costs and increase academic performance
WHEREAS, the Lummi Indian Business Council is the duly constituted governing body of the Lummi Indian Reservation by the authority of the Constitution and By-laws of the Lummi Tribe of the Lummi Reservation, Washington; and WHEREAS, the Council is responsible for protecting and ensuring the health, safety, and welfare of the Lummi People and the Lummi Reservation community; and WHEREAS, the council recognizes the need and necessity to facilitate a healthy environment for all workers on the Lummi Reservation to the greatest extent possible; and WHEREAS, the council recognizes that pop and sugar sweetened drinks are known to contribute significantly to obesity, diabetes, heart disease, dental carries, cholesterol, and the escalating healthcare costs associates with these health problems, in addition to having a significant effect on student learning, behavior, and academic performance; and WHEREAS, the council recognizes the significant social, medical and economic threat to the community posed by the rising incidence of the above mentioned health problems, and that policy has been shown to have a significant effect on individual behavior; and
WHEREAS, the council wishes to be a national leader in setting precedents for a healthy community, the council does not wish to profit at the cost of the health of the Lummi people or LIBC employees, and the council wishes to send a powerful message and set a positive example for LIBC, the youth, and the community.
NOW THEREFORE BE IT RESOLVED, that LIBC will no longer support unhealthy beverage choices, and LIBC funds and purchase orders shall not be used to purchase pop and sugar sweetened drinks for any meetings, committees, commissions, functions or events; and
BE IT FURTHER RESOLVED, that all vending machines allowed on LIBC property, including schools, will provide healthy choices, such as bottled water, unsweetened iced tea, club soda, waters with fruit essence, and 100% juice. Sugar sweetened pop shall not be allowed in machines on school property; and
BE IT FURTHER RESOLVED, that the council, with the assistance of the wellness committee will encourage the purchase of fresh produce, whole grains options, and traditional foods at all LIBC functions, meetings, and events; and
BE IT FURTHER RESOLVED, that organizations or individuals wishing to fundraise on LIBC premises shall comply with this resolution; and
BE IT FURTHER RESOLVED, that the wellness committee shall develop an implementation plan to be approved by the LIBC. The wellness committee will provide education regarding implementation of this resolution; and
BE IT FURTHER RESOLVED, that the Chairman (or Vice Chairman in his absence) is hereby authorized and directed to execute this resolution and any documents connected therewith, and the Secretary (or the Recording Secretary in his absence) is authorized and directed to execute the following certification
LUMMI NATION Darrell Hillaire, Chairman
Lummi Indian Business Council
50
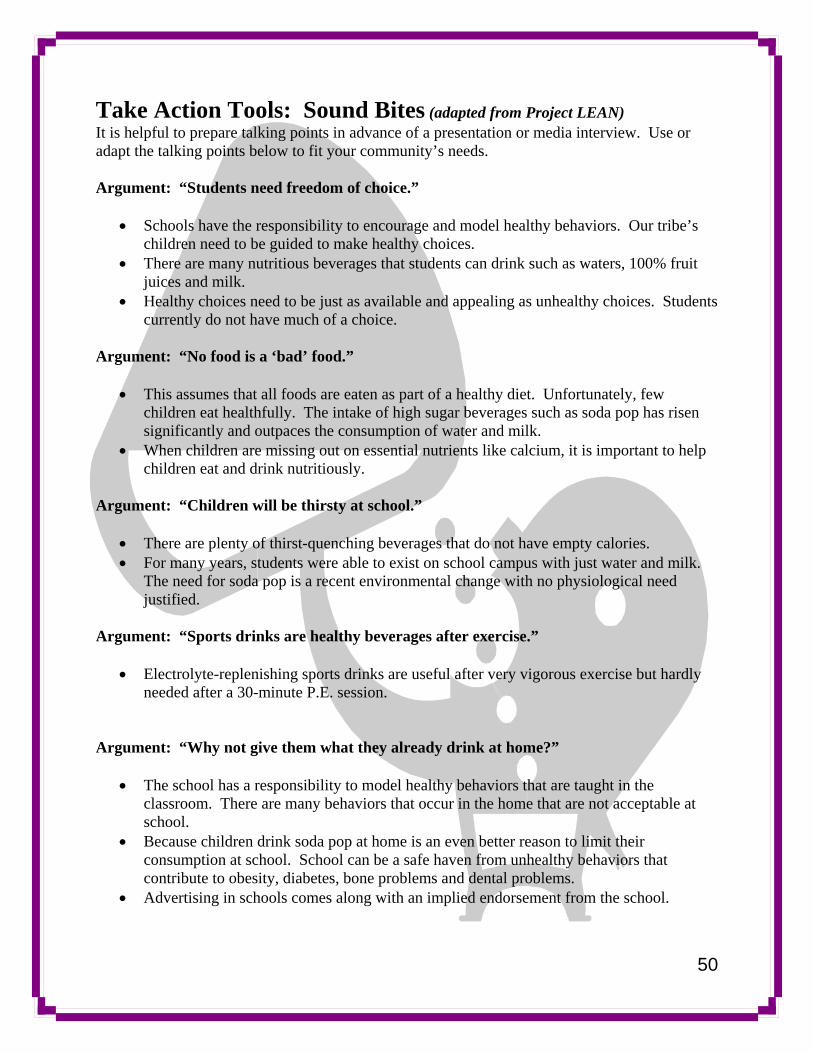
Take Action Tools: Sound Bites (adapted from Project LEAN)
It is helpful to prepare talking points in advance of a presentation or media interview. Use or adapt the talking points below to fit your community’s needs.
Argument: “Students need freedom of choice.”
• Schools have the responsibility to encourage and model healthy behaviors. Our tribe’s children need to be guided to make healthy choices.
• There are many nutritious beverages that students can drink such as waters, 100% fruit juices and milk.
• Healthy choices need to be just as available and appealing as unhealthy choices. Students currently do not have much of a choice.
Argument: “No food is a ‘bad’ food.”
• This assumes that all foods are eaten as part of a healthy diet. Unfortunately, few children eat healthfully. The intake of high sugar beverages such as soda pop has risen significantly and outpaces the consumption of water and milk.
• When children are missing out on essential nutrients like calcium, it is important to help children eat and drink nutritiously.
Argument: “Children will be thirsty at school.”
• There are plenty of thirst-quenching beverages that do not have empty calories. • For many years, students were able to exist on school campus with just water and milk.
The need for soda pop is a recent environmental change with no physiological need justified.
Argument: “Sports drinks are healthy beverages after exercise.”
• Electrolyte-replenishing sports drinks are useful after very vigorous exercise but hardly needed after a 30-minute P.E. session.
Argument: “Why not give them what they already drink at home?”
• The school has a responsibility to model healthy behaviors that are taught in the classroom. There are many behaviors that occur in the home that are not acceptable at school.
• Because children drink soda pop at home is an even better reason to limit their consumption at school. School can be a safe haven from unhealthy behaviors that contribute to obesity, diabetes, bone problems and dental problems.
• Advertising in schools comes along with an implied endorsement from the school.

51
Native American Communities Making It Happen!
Alaska Natives In 2001, the Alaska Native Tribal Health Consortium and the Alaska Native Health Board started a campaign to heighten awareness of the harmful effects of sugared soda consumption. The campaign included letters from board members to community grocery store managers, and issued a “symbolic” report card to schools with two “D”s for decay and diabetes. To learn more link to: http://www.turtletrack.org/Issues01/Co04212001/CO_04212001_Pop.htm School board members in Larsen Bay, Alaska agreed to replace soda with water in the schools after two health aides who had attended diabetes training classes gave a presentation on the increasing rates of diabetes and tooth decay in children. This has had a great impact on the community and the school board members. Fort Peck Students, Montana Fort Peck, Montana, students boycotted school lunch for 3 weeks to get the soda machines replaced with bottles of water and to get a salad bar. The students were concerned with overweight, the availability of high fat and sugary foods and drinks in the schools. The students were successful in obtaining healthier foods and beverages served in the school. These student champions were featured speakers at the 2002 IHS Diabetes Conference, a national health conference attracting over 1000 Native Americans. Kayenta Service Unit Health Advisory Board, Kayenta, AZ Did you know...that children’s weight problems are related to how many soft drinks they consume? The Advisory Board has sponsored a National Public Health Week on Healthy Life, and gives educational facts on soda pop on the internet. Find out more from Kayenta Service Unit website, http://www.kayentahealth.com/popandkids.htm “Pop Facts”. Lummi Tribe of Washington. “Stop the Pop” was a tribal resolution successfully adopted in 2004 by the Lummi Tribe of the Lummi Reservation, Washington. See Resolution #2004-149 below. The council also requested an educational campaign regarding the resolution before its implementation in May 2005. A community action team has started the educational campaign targeting schoolchildren and families. 2-pages. (will need to create PDF and include here as a link to the document for the reader on the internet) Hopi Nation, Arizona The Hopi Nation has replaced unhealthy drinks in vending machines with healthier choices, and is still making money on the sales.

52
New Mexico Tribes A registered dietitian in New Mexico presented a nutrition project as a fundraiser for American Indian schools. The project offered nutritious alternatives to the usual sodas and candy. It featured yogurt, trendy flavored milk drinks, “blizzard” drinks with fruits and low-fat milk and ice. The school fundraiser was a huge success, making more profit than ever. Zuni Pueblo of New Mexico Perhaps the most successful program in the literature was the Zuni Diabetes Program (Weber, 1998). The study had well designed evaluation measures, including physiological measures such as BMI, as well as food logs that tracked consumption of sugared beverages that showed a significant reduction in soda consumption, accompanied by an increase in glucose/insulin ratios. A key point to take away from this intervention is that the individuals receiving health education were also exposed to an environment that continually supported the decision to make healthy behavior changes. For example, diet (or unsweetened) beverages and water replaced sugar sweetened beverages in vending machines; and access to recreational facilities was provided. The project provided palatable water in coolers for students in several school locations. This allowed a consistent message of health promotion to become a part of the daily routine. Within two years, Zuni high school students had decreased BMI, decreased consumption of soft drinks, increased consumption of dietary fiber, and increased glucose/insulin ratios; therefore, achieving the program’s goal of decreasing the risk of diabetes. This study provides a clear model of an effective intervention. (Weber 1998) The Zuni Pueblo Special Diabetes Grant Program (SDPI) initiated a community wide campaign “Drink Zuni’s Own Water!” in Fall, 2005. As of January 03, 1125 water carafes – each 2 gallon container individualized with Zuni stickers – were distributed to community families, and individualized water bottles for all the Zuni schoolchildren and Zuni teachers. At community events, they distribute water carafes with their Zuni Pueblo designed logo to families, to promote drinking of water (instead of sugary beverages) by families at the family dining table, and chilled water in the refrigerator as healthy choice for children and families. (Source of information and contacts: Chetna Mehrotra, Epidemiologist CDC assigned to direct the Zuni Special Diabetes Grant Program. Other key staff at Zuni involved in the project: Dr. Tim Naimi, MD, HP/DP Director for Zuni, and Dr. Eric Coontz, DDS, Dental Officer at Zuni.
Three years ago, Zuni Pueblo Utility Department invested $ 7 million in a new water plant and installing replacement water pipes in many of the tribal communities, in a successful effort to improve the quality of the water. The water now has no sulphur smell or odor, is clear, clean, good water. There is still a perception from previous history that the Zuni water is not good quality; so many people still buy bottled water and sodas. April-May 2005, Zuni Diabetes Program staff gathered data on community member’s perception of the water – and reached over 500 people with a 12-13 item questionnaire. They have also marketed their program through the tribal newsletter, in a question-answer handout, distributing the water bottles and water carafes at no cost to community members. February – April 2006, the project staff will conduct another survey to identify knowledge, attitudes and behaviors influenced by the Zuni Water Project. They purchased the 2 gallon water carafes from Culligan (not filtered carafe, because the water now at Zuni is high quality), at the discounted price of $3.66/carafe; significantly less than the cost for 1 carafe at $6.00.

53
California Kelseyville Unified School District A Local Anti-pop Campaign
One big issue for Native American youth that we have seen for a long time is a gross increase in carious lesions when they reach the age of 14-15. While there are many risk variable associated with this etiology we noticed that the schools in the area made a huge profit off sugar drinks and soda that the children could start to purchase when they entered middle school. Children at this age now had the freedom to make choices in what they ate and drank without parental or teacher intervention. Many would use their lunch money to purchase sugar drinks, soda and packaged carbohydrates for lunch instead of eating healthy foods. We decided to do something. You need to understand that this is a small community with the associated small town politics. We first gathered information regarding the sugar/soda drink consumption at the schools. We then gathered information on other schools that have replaced the sugar/soda drinks with healthy alternatives and discovered that their revenues from these drinks actually increased after placing healthy stuff in there. We also gathered information on alternative ways to raise money that were not time consuming (a point that the schools make is that raising money other ways is too time consuming). All of this data and information was made into a report. I then met with the school superintendent and requested that an action item be placed on the agenda for the next school board meeting to replace sugar/soda drinks in the schools vending machines with healthy alternatives. We also asked that teachers stop selling candy, donuts etc out of their desks and stop giving candy as a reward for academic performance. I didn't know exactly what the response would be from the board. I WAS surprised at the fierce opposition we encountered. We were careful not to insult the schools lunch program (they thought we were and were ready to defend that). Arguments were brought from both sides as well as from the student body and in the end the vote was 3-2 to remove the junk food. This took place at the beginning of the 2004 school year. I was very surprised at the backlash this created. My daughter was in class shortly after the board meeting and the teacher told they couldn't go to science camp that year because I had taken away their revenue source (this was not true, the school was actually banned for a year due to poor behavior of the students the previous year). The teacher spent a whole hour on how we had messed things up for the children and the schools. A black-market was started in the high school. Enterprising students would smuggle in soda and sell it for a large profit (some actually thanked me for their success). The kids all complained. Parents were very supportive and thankful that someone stood up for the kids. A follow up to the high school has been very positive. Kids are now drinking bottled water and it is now the "hip" thing to do. This all shows that change is hard and you need to be prepared for all arguments. It also shows that change can occur and people can and will adapt and that one person can make a difference in a community. I am still known as that dentist who took away the soda and am proud of it
54
Recommendations
Reducing soda pop consumption among the AI\AN population can be achieved. A successful campaign requires a specific message relevant to the AI\AN community and innovative strategies that will empower the community to choose healthier alternatives to soda more often and in turn reduce overall consumption of unhealthy beverages. This requires the dedication of the entire community, from the youth and adults to the tribal leaders and government officials.
AI/populations are also aligned with DHHS’ Healthy People 2010 objectives (DHHS, 2000). The Department has outlined strategic goals and objectives to increase the percentage of AI/A children and adults with access to quality health care services and to provide expanded consumer choices (DHHS, 2004a).
DHHS has also formed two coordinating committees of particular relevance to AI/groups. The first is the Intradepartmental Council on Native American Affairs, which will develop recommendations for solutions to improve AI/AN policies and programs.
The recommendations will also be used to improve the HHS organizational structure to better administer services to American Indians and Alaska Natives, and to ensure that all HHS divisions and offices implement the HHS policy on tribal consultation. A second committee to be formed will examine cross-cutting oral health issues by compiling information needed for decision-making, reducing disparities, and promoting multi-agency oral health initiatives (DHHS, 2004a).
55
Director’s Health Promotion/Disease Prevention Initiative
“The main health challenges currently faced by American Indian and Alaska Native people are the increasing health conditions and chronic diseases that are related to lifestyles issues such as obesity, physical inactivity, poor diet, substance abuse, and injuries. To help meet these challenges, the Indian Health Service (IHS) Director has launched a Health Promotion and Disease Prevention (HP/DP) Initiative to develop a coordinated and systematic approach to enhance preventive health approaches at the local, regional, and national levels.”
These Initiatives are aligned with the President’s Healthier US, HHS Steps to a Healthier US, and Healthy People 2010.
• “The goal of the HP/DP Initiative is to create healthier American Indian and Alaska Native communities by developing, coordinating, implementing, and disseminating effective health promotion and chronic disease prevention programs through collaboration with key stakeholders and by building on individual, family, and community strengths and assets.”
Ongoing efforts include:
• “Establish HP/DP coordinators in the 12 IHS Areas to support IHS, Tribal, and Urban programs in developing, implementing, and evaluating health promotion and chronic disease prevention efforts;”
• “Create and expand federal, corporate, foundation, and academic partners to support healthier behaviors;”
• “Promote and expand community and clinical health promotion and chronic disease prevention best practices;”
• “Build the capacity for effective health promotion practices at the local level by increasing the knowledge, skills, and capacities of Tribal, IHS, and Urban program health workers and leaders;”
• “Promote and adopt environmental, school, and worksite polices that support healthier behaviors;”
• “Develop a clearinghouse of best practices, resources, training, and community assessment tools to enhance community access;”
• “Develop communication materials to raise awareness to specific health concerns; and
• “Conduct continuous process, impact, and outcome evaluations that are aligned with GPRA and Healthy People 2010 objectives.”
Reference: Assistant Surgeon General, Director, Indian Health Service, Director’s Health Promotion/Disease Prevention Initiative
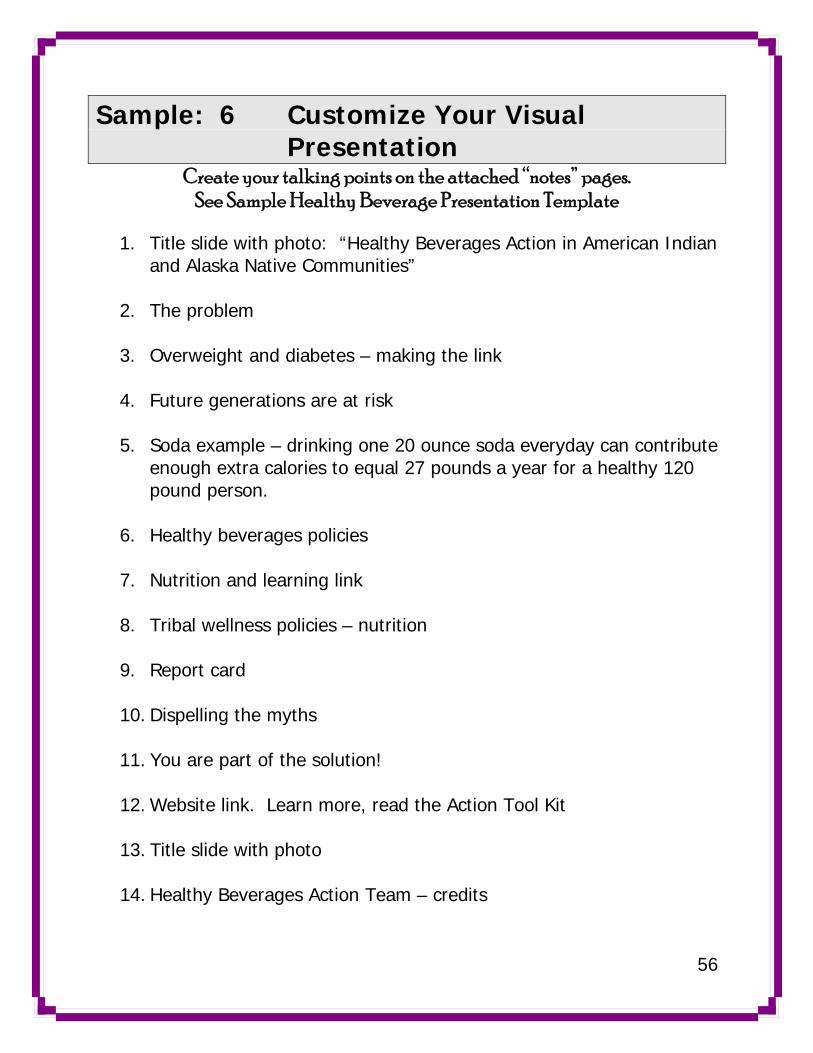
56
Sample: 6 Customize Your Visual Presentation
Create your talking points on the attached “notes” pages. See Sample Healthy Beverage Presentation Template
1. Title slide with photo: “Healthy Beverages Action in American Indian
and Alaska Native Communities” 2. The problem 3. Overweight and diabetes – making the link 4. Future generations are at risk 5. Soda example – drinking one 20 ounce soda everyday can contribute
enough extra calories to equal 27 pounds a year for a healthy 120 pound person.
6. Healthy beverages policies 7. Nutrition and learning link 8. Tribal wellness policies – nutrition 9. Report card 10. Dispelling the myths 11. You are part of the solution! 12. Website link. Learn more, read the Action Tool Kit 13. Title slide with photo 14. Healthy Beverages Action Team – credits

57
Healthy
Beverage Presentation
Template

58
Slide 1
WE ARE SWEET ENOUGH!
Jean CharlesJean Charles--Azure, MPH, RDAzure, MPH, RDElaine Little, MS, RDElaine Little, MS, RD
Patrick Blahut, Delores Starr & Patrick Blahut, Delores Starr & Primary Slide ContributorsPrimary Slide Contributors
___________________________________
___________________________________
___________________________________
___________________________________
___________________________________
___________________________________
___________________________________
Slide 2 Healthy Beverage Action Team
•• Jean CharlesJean Charles--Azure Azure •• Elaine LittleElaine Little•• Brenda BroussardBrenda Broussard•• Alberta BecentiAlberta Becenti•• Patrick BlahutPatrick Blahut•• Cheryl WilsonCheryl Wilson•• Kathy CharlesKathy Charles
•• Mary McEneryMary McEnery•• Mary AltenbergMary Altenberg•• Ellie ZephierEllie Zephier•• Gary QuinnGary Quinn•• Delores StarrDelores Starr•• Eriko GroverEriko Grover•• HHS HHS ELsELs
___________________________________
___________________________________
___________________________________
___________________________________
___________________________________
___________________________________
___________________________________
Slide 3 Water Prayer
We give thanks to all the Water of the We give thanks to all the Water of the world for quenching our thirst and world for quenching our thirst and
providing us with strength. Water is providing us with strength. Water is life. We know its power in many life. We know its power in many
formsforms——waterfalls and rain, mists, waterfalls and rain, mists, and streams, rivers and oceans. With and streams, rivers and oceans. With
one mind, we send greetings and one mind, we send greetings and thanks to all the spirits of water.thanks to all the spirits of water.
Mohawk Thanksgiving AddressMohawk Thanksgiving Address
___________________________________
___________________________________
___________________________________
___________________________________
___________________________________
___________________________________
___________________________________
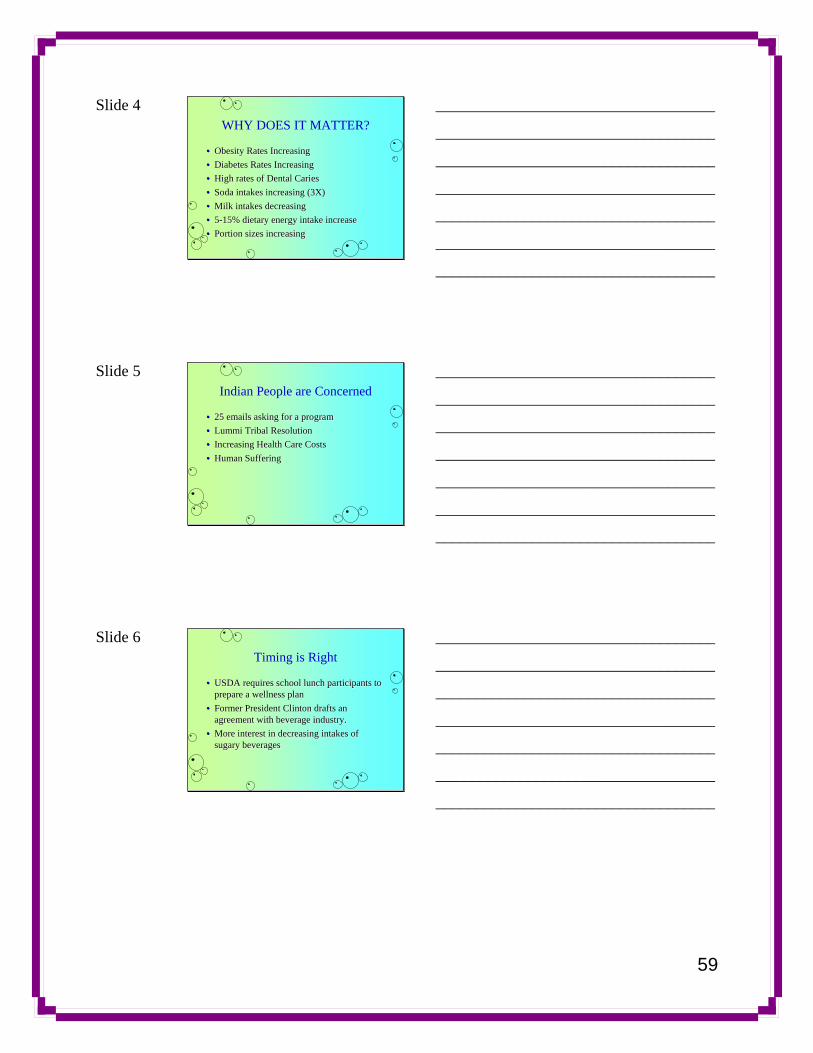
59
Slide 4 WHY DOES IT MATTER?
•• Obesity Rates IncreasingObesity Rates Increasing•• Diabetes Rates IncreasingDiabetes Rates Increasing•• High rates of Dental CariesHigh rates of Dental Caries•• Soda intakes increasing (3X)Soda intakes increasing (3X)•• Milk intakes decreasing Milk intakes decreasing •• 55--15% dietary energy intake increase15% dietary energy intake increase•• Portion sizes increasingPortion sizes increasing
___________________________________
___________________________________
___________________________________
___________________________________
___________________________________
___________________________________
___________________________________
Slide 5 Indian People are Concerned
•• 25 emails asking for a program25 emails asking for a program•• Lummi Tribal ResolutionLummi Tribal Resolution•• Increasing Health Care CostsIncreasing Health Care Costs•• Human SufferingHuman Suffering
___________________________________
___________________________________
___________________________________
___________________________________
___________________________________
___________________________________
___________________________________
Slide 6 Timing is Right
•• USDA requires school lunch participants to USDA requires school lunch participants to prepare a wellness planprepare a wellness plan
•• Former President Clinton drafts an Former President Clinton drafts an agreement with beverage industry.agreement with beverage industry.
•• More interest in decreasing intakes of More interest in decreasing intakes of sugary beveragessugary beverages
___________________________________
___________________________________
___________________________________
___________________________________
___________________________________
___________________________________
___________________________________

60
Slide 7 Behavioral Health is Important
•• Behavior Change Behavior Change •• MotivationMotivation•• Fear is not a helpful motivatorFear is not a helpful motivator•• Knowledge and SkillsKnowledge and Skills•• Change is ImportantChange is Important•• Change is DifficultChange is Difficult•• Changing Nutritional EnvironmentChanging Nutritional Environment
___________________________________
___________________________________
___________________________________
___________________________________
___________________________________
___________________________________
___________________________________
Slide 8 Mobilizing Indian Communities
•• Capitalize on strengths & resourcesCapitalize on strengths & resources•• Community OwnershipCommunity Ownership•• Community BuyCommunity Buy--inin•• Community DirectedCommunity Directed•• Community BasedCommunity Based•• Collaboration of PartnersCollaboration of Partners
___________________________________
___________________________________
___________________________________
___________________________________
___________________________________
___________________________________
___________________________________
Slide 9 AI/AN Active Users Age 2-74 with a Body Mass Index Recorded (60% of All AI/AN Active Users Reported in GPRA 2004) Who Are Obese
or Obese and OverweightIndian Health Service 2004
6769
70
4444
41
0
10
20
30
40
50
60
70
80
GY2000 GY2003 GY2004
Perc
ent
Overw eight or Obese Obese
___________________________________
___________________________________
___________________________________
___________________________________
___________________________________
___________________________________
___________________________________

61
Slide 10 TRENDS
•• Americans drinking more soda pop than Americans drinking more soda pop than ever beforeever before
•• 1999: 50 GALLONS/person (USDA 2005)1999: 50 GALLONS/person (USDA 2005)•• American teens consume American teens consume ½½ quart weekly or quart weekly or
almost a GALLON per weekalmost a GALLON per week•• AI/AN consume soft drinks at more than AI/AN consume soft drinks at more than
twice the US national average rate twice the US national average rate
___________________________________
___________________________________
___________________________________
___________________________________
___________________________________
___________________________________
___________________________________
Slide 11 PORTIONS
•• Bigger serving sizesBigger serving sizes•• Drank more frequentlyDrank more frequently•• 1950s 1950s –– 6.5 ounces 6.5 ounces •• 1990s 1990s –– 20 ounces20 ounces•• One 12 ounce soda contains an average of One 12 ounce soda contains an average of
10 teaspoons of sugar and 150 calories10 teaspoons of sugar and 150 calories
___________________________________
___________________________________
___________________________________
___________________________________
___________________________________
___________________________________
___________________________________
Slide 12
___________________________________
___________________________________
___________________________________
___________________________________
___________________________________
___________________________________
___________________________________

62
Slide 13
___________________________________
___________________________________
___________________________________
___________________________________
___________________________________
___________________________________
___________________________________
Slide 14 Resources
•• A New Proposed Guidance System for A New Proposed Guidance System for Beverage Consumption in the United StatesBeverage Consumption in the United States, , The American Journal of Clinical Nutrition, The American Journal of Clinical Nutrition, Vol. 83, No. 3, 529Vol. 83, No. 3, 529--542, March 2006 542, March 2006
•• Soon to be released the Soon to be released the Healthy Beverage Healthy Beverage Action KitAction Kit, Indian Health Service, 2006, Indian Health Service, 2006
___________________________________
___________________________________
___________________________________
___________________________________
___________________________________
___________________________________
___________________________________
Slide 15 Resources
•• JADA 109 Aug 1984 JADA 109 Aug 1984 –– ((cariogencitycariogencity of soft of soft drinks) drinks) IsmailIsmail--BurtBurt--EklundEklund
•• Caries and beverage consumption Caries and beverage consumption ––University of University of Iowa(Marshall,LevyIowa(Marshall,Levy, , BroffettBroffett, , EichenbergerEichenberger, Burns , Burns StumboStumbo) Pediatrics ) Pediatrics 2003 Sep.2003 Sep.
___________________________________
___________________________________
___________________________________
___________________________________
___________________________________
___________________________________
___________________________________
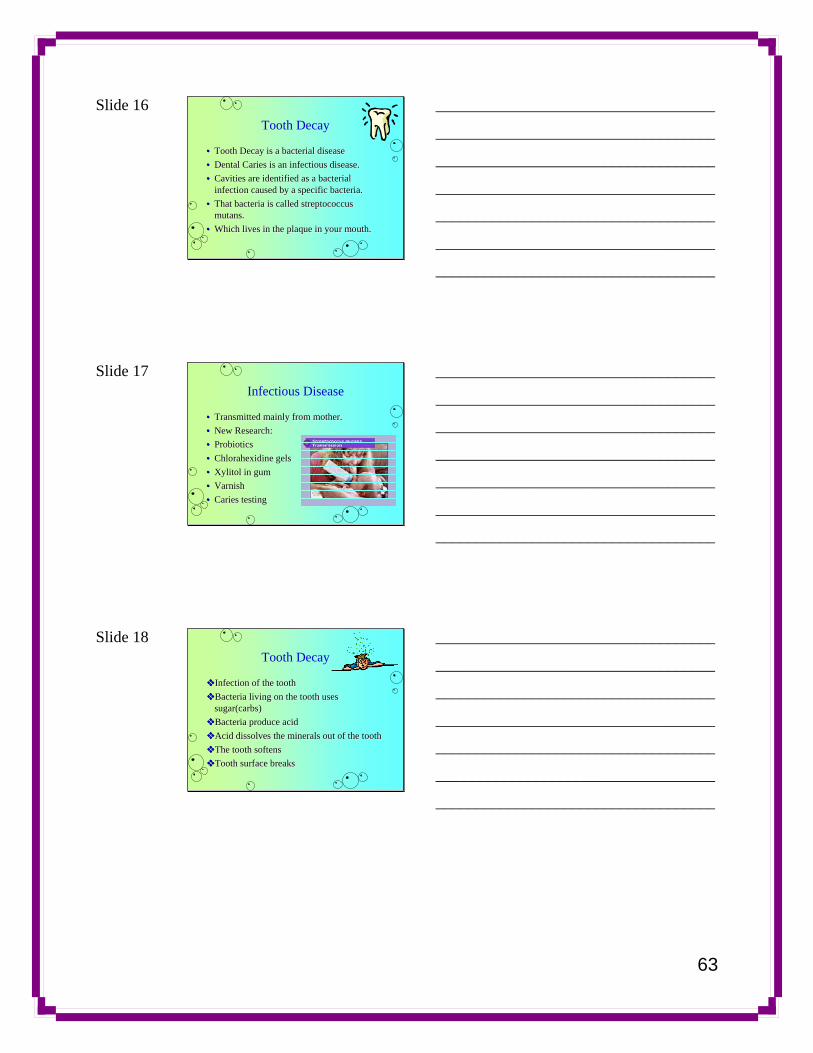
63
Slide 16 Tooth Decay
•• Tooth Decay is a bacterial diseaseTooth Decay is a bacterial disease•• Dental Caries is an infectious disease.Dental Caries is an infectious disease.•• Cavities are identified as a bacterial Cavities are identified as a bacterial
infection caused by a specific bacteria.infection caused by a specific bacteria.•• That bacteria is called streptococcus That bacteria is called streptococcus
mutans.mutans.•• Which lives in the plaque in your mouth.Which lives in the plaque in your mouth.
___________________________________
___________________________________
___________________________________
___________________________________
___________________________________
___________________________________
___________________________________
Slide 17 Infectious Disease
•• Transmitted mainly from mother.Transmitted mainly from mother.•• New Research:New Research:•• ProbioticsProbiotics•• Chlorahexidine gelsChlorahexidine gels•• XylitolXylitol in gumin gum•• VarnishVarnish•• Caries testingCaries testing
___________________________________
___________________________________
___________________________________
___________________________________
___________________________________
___________________________________
___________________________________
Slide 18 Tooth Decay
Infection of the toothInfection of the toothBacteria living on the tooth uses Bacteria living on the tooth uses sugar(carbssugar(carbs))Bacteria produce acidBacteria produce acidAcid dissolves the minerals out of the toothAcid dissolves the minerals out of the toothThe tooth softensThe tooth softensTooth surface breaksTooth surface breaks
___________________________________
___________________________________
___________________________________
___________________________________
___________________________________
___________________________________
___________________________________

64
Slide 19 Chain of Tooth Decay
•• Plaque ( bacteria) feeds off of sugar(Carbs)Plaque ( bacteria) feeds off of sugar(Carbs)•• To make Acid.To make Acid.•• The amount of time the acid stays on your The amount of time the acid stays on your
teeth determines how fast your teeth will teeth determines how fast your teeth will decay.decay.
___________________________________
___________________________________
___________________________________
___________________________________
___________________________________
___________________________________
___________________________________
Slide 20 Decay Process Multi-factorial infectious disease
___________________________________
___________________________________
___________________________________
___________________________________
___________________________________
___________________________________
___________________________________
Slide 21
___________________________________
___________________________________
___________________________________
___________________________________
___________________________________
___________________________________
___________________________________

65
Slide 22 Decay Process
___________________________________
___________________________________
___________________________________
___________________________________
___________________________________
___________________________________
___________________________________
Slide 23 More Then Double Trouble
•• Pop is sweetened, acidic, caffeinated Pop is sweetened, acidic, caffeinated carbonated drink!carbonated drink!
•• Sugar + Acid + caffeine + Phosphorus + =Sugar + Acid + caffeine + Phosphorus + =•• Tooth DecayTooth Decay•• Obesity (Harvard researchObesity (Harvard research--childhood childhood obestyobesty))•• Caffeine dependencyCaffeine dependency•• Weakened Bones(1994 Harvard study)Weakened Bones(1994 Harvard study)
___________________________________
___________________________________
___________________________________
___________________________________
___________________________________
___________________________________
___________________________________
Slide 24 Consistency of sugar(cariogenicty) Ismail, Burt and Eklund JADA Aug 1984
•• Little Research: Little Research: VipeholmVipeholm study had the greatest study had the greatest acceptance.(6 year experiment with pts who ate acceptance.(6 year experiment with pts who ate Carmel or toffee)Carmel or toffee)
•• Several studies show sucrose rinses have Several studies show sucrose rinses have significant increase in decay. (significant increase in decay. (Stephans,VonStephans,Von derderFehrFehr))
•• NHANES (1971NHANES (1971--74 24 hrs) frequency between 74 24 hrs) frequency between meals more important then actual amount.meals more important then actual amount.
•• NHANES(1988NHANES(1988--94 Heller, Burt, 94 Heller, Burt, EklundEklund)) increase )) increase DMFS age 25DMFS age 25
___________________________________
___________________________________
___________________________________
___________________________________
___________________________________
___________________________________
___________________________________
66
Slide 25 Acid Production
•• Sugar between meals will produce acid for Sugar between meals will produce acid for 20 minutes.20 minutes.
•• Drink 3 soda pops between meals and you Drink 3 soda pops between meals and you will have 180 minutes of acid production.will have 180 minutes of acid production.
•• Plus 60 mins for 3 meals.Plus 60 mins for 3 meals.•• Your mouth is producing acid for 4 hours.Your mouth is producing acid for 4 hours.
___________________________________
___________________________________
___________________________________
___________________________________
___________________________________
___________________________________
___________________________________
Slide 26 ACID * SUGAR**Low = Bad Per 12 oz.
Serving (1 can)PURE WATER 7.00 (neutral) 0.0
BARQ’S 4.61 10.7 tsp.DIET BARQ’S 4.55 0.0DIET 7UP 3.67 0.0
SPRITE 3.42 9.0 tsp.DIET DR. PEPPER 3.41 0.0DIET COKE 3.39 0.0
DIET MOUNTAIN DEW 3.34 0.0Grape Minute maid Soda 3.29 11.0 tsp
MOUNTAIN DEW 3.22 11.0 tspFRESCA 3.20 0.0
ORANGE SLICE 3.12 11.9 tspDIET PEPSI 3.05 0.0
NESTEA 3.04 5.0 tspSURGE 3.02 10.0 tspGATORADE 2.95 3.3 tspDR. PEPPER 2.92 9.5 tspSQUIRT 2.85 9.5 tspHawaiian Fruit Punch 2.82 10.2 tspOrange Minute made soda 2.80 11.2 tsp
COKE CLASSIC 2.53 9.3 tspPEPSI 2.49 0.8 tsp
BATTERY ACID 1.0 (OUCH) 0.0
* Laboratory tests. University of Minnesota School of Dentistry, 2000 **USDA 4.2 Grams = 1 teaspoon sugar
___________________________________
___________________________________
___________________________________
___________________________________
___________________________________
___________________________________
___________________________________
Slide 27 Fluorida dental association
Mouth Wise
REGULAR SODACarbonated waterHigh fructose corn syrupSucroseColoringPhosphoric acidCitric acidNaturalFlavorsCaffeine
DIET SODA Carbonated waterCaramel colorAspartamePhosphoric acidCitric acidPotassium benzoateNatural flavorsCitric acidCaffeine
___________________________________
___________________________________
___________________________________
___________________________________
___________________________________
___________________________________
___________________________________

67
Slide 28 Double Trouble and More
•• High acid content plus sugar.High acid content plus sugar.•• Phosphorous found in soda pop can deplete Phosphorous found in soda pop can deplete
bones of calciumbones of calcium
___________________________________
___________________________________
___________________________________
___________________________________
___________________________________
___________________________________
___________________________________
Slide 29 Sipping Pop
•• A 16 yr old after one year of sipping popA 16 yr old after one year of sipping pop•• Found 15 cavitiesFound 15 cavities
•• Courtesy of Roseville Family Dental CareCourtesy of Roseville Family Dental Care
___________________________________
___________________________________
___________________________________
___________________________________
___________________________________
___________________________________
___________________________________
Slide 30 Effects of Soda Pop
•• Obesity Obesity •• Tooth decayTooth decay•• Caffeine dependencyCaffeine dependency•• Weakened bonesWeakened bones
___________________________________
___________________________________
___________________________________
___________________________________
___________________________________
___________________________________
___________________________________

68
Slide 31 Caffeine
•• Fluid lossFluid loss•• Sleep disruptionSleep disruption•• IrritableIrritable•• Children stomach painsChildren stomach pains
___________________________________
___________________________________
___________________________________
___________________________________
___________________________________
___________________________________
___________________________________
Slide 32 •• 1212--ounce beverage milligrams ounce beverage milligrams Red Bull (8.2 oz) 80.0 Red Bull (8.2 oz) 80.0 Jolt 71.2 Jolt 71.2 Pepsi One55.5 Pepsi One55.5 Mountain Dew 55.0 Mountain Dew 55.0 Mountain Dew Code Red 55.0 Mountain Dew Code Red 55.0 Diet Mountain Dew 55.0 Diet Mountain Dew 55.0 Kick Citrus 54.0 Kick Citrus 54.0 Mellow Yellow 52.8 Mellow Yellow 52.8 Surge 51.0 Surge 51.0 Tab 46.8 Diet Coke 45.6 Tab 46.8 Diet Coke 45.6 Diet Coke with Lemon 45.6 Diet Coke with Lemon 45.6 Diet Coke with Lime 45.6 Diet Coke with Lime 45.6 Diet Vanilla Coke 45.6 Diet Vanilla Coke 45.6 Shasta Cola 44.4 Shasta Cola 44.4 Shasta Cherry Cola 44.4 Shasta Cherry Cola 44.4 Shasta Diet Cola 44.4 Shasta Diet Cola 44.4 RC Cola 43.0 RC Cola 43.0 Diet RC 43.0 Diet RC 43.0 Dr. Pepper 41.0 Dr. Pepper 41.0 Diet Dr. Pepper 41.0 Diet Dr. Pepper 41.0 Diet Sunkist Orange 41.0 Diet Sunkist Orange 41.0 Mr. Mr. PibbPibb 40.0 40.0 SugarSugar--Free Mr. Free Mr. PibbPibb 40.0 40.0 Red Flash 40.0 Red Flash 40.0 Sunkist Orange40.0 Sunkist Orange40.0 SlimSlim--Fast Cappuccino Delight Shake 40.0 Fast Cappuccino Delight Shake 40.0 Ruby Red 39.0 Ruby Red 39.0 Storm38.0 Storm38.0 Big Red38.0 Big Red38.0 PepsiPepsi--Cola 37.5 Cola 37.5 Pepsi Twist 37.5 Pepsi Twist 37.5 Diet Pepsi 36.0 Diet Pepsi 36.0 Wild Cherry Pepsi 38.0 Wild Cherry Pepsi 38.0 Diet Wild Cherry Pepsi 36.0 Diet Wild Cherry Pepsi 36.0 Diet Pepsi Twist 36.0 Diet Pepsi Twist 36.0 Aspen 36.0 Aspen 36.0 CocaCoca--Cola Classic 34.0 Cola Classic 34.0 Coke C2 34.0 Coke C2 34.0 Cherry Coke 34.0 Cherry Coke 34.0 Lemon Coke 34.0 Lemon Coke 34.0 Vanilla Coke 34.0 Vanilla Coke 34.0 Diet Cherry Coke 34.0 Diet Cherry Coke 34.0 Snapple Flavored Teas (Reg. or Snapple Flavored Teas (Reg. or Diet) 31.5 Diet) 31.5 Canada Dry Cola 30.0 Canada Dry Cola 30.0 A&W A&W CremeCreme Soda 29.0 Soda 29.0 Nestea Sweet Iced Tea26.5 Nestea Sweet Iced Tea26.5 Nestea Unsweetened Iced Tea26.0 Nestea Unsweetened Iced Tea26.0 Barq'sBarq's Root Beer 23.0 Root Beer 23.0 A&W Diet A&W Diet CremeCreme Soda 22.0 Soda 22.0 SlimSlim--Fast Chocolate Flavors 20.0 Fast Chocolate Flavors 20.0 Snapple Sweet Tea12.0 Snapple Sweet Tea12.0 Lipton Brisk, All Varieties9Canada Dry Diet Cola 1.2 Lipton Brisk, All Varieties9Canada Dry Diet Cola 1.2 Diet Rite Cola0Sprite0 Diet Rite Cola0Sprite0 77--Up 0 Up 0 Mug Root Beer0 Mug Root Beer0 Diet Diet Barq'sBarq's Root Beer0 Root Beer0 SundropSundrop Orange0 Orange0 Minute Maid Orange0 Minute Maid Orange0 A&W Root Beer0 A&W Root Beer0 Slice0 Slice0 Sierra Mist0 Sierra Mist0 Fresca0Fresca0
••
___________________________________
___________________________________
___________________________________
___________________________________
___________________________________
___________________________________
___________________________________
Slide 33
Beverage caffeine content
Brewed Coffee 85Instant Coffee 60Decaffeinated coffee 3Tea 50Cocoa 5(=250 milligrams of theobromine)Cola – type soft drinks average 35 pr canMountain Dew 55Diet Coke 45Coca cola classic 35Pepsi 37.5
Milligrams Milligrams
___________________________________
___________________________________
___________________________________
___________________________________
___________________________________
___________________________________
___________________________________
69
Slide 34 Caffeine
•• 180 milligrams of caffeine can cause 180 milligrams of caffeine can cause nausea, vomiting, diarrhea, cramps and nausea, vomiting, diarrhea, cramps and muscle twitching in a 40 lb child.muscle twitching in a 40 lb child.
•• 184 milligrams of caffeine in 2 20 oz bottles 184 milligrams of caffeine in 2 20 oz bottles of mountain dew.of mountain dew.
___________________________________
___________________________________
___________________________________
___________________________________
___________________________________
___________________________________
___________________________________
Slide 35 Theories on Contemporary versus
traditional foods•• Islanders of the South Pacific led a disease Islanders of the South Pacific led a disease
free life that afflicted Europe of the 18free life that afflicted Europe of the 18thth
centuries'.centuries'.•• The belief was the apparent freedom from The belief was the apparent freedom from
caries the primitive races enjoyed was caries the primitive races enjoyed was attributed to their natural diet.attributed to their natural diet.
___________________________________
___________________________________
___________________________________
___________________________________
___________________________________
___________________________________
___________________________________
Slide 36 Theories Continued
•• Anthropology studies report rapid increases Anthropology studies report rapid increases in dental caries that occur when an in dental caries that occur when an indigenous society comes in contact with indigenous society comes in contact with the diet and lifestyle changes of high the diet and lifestyle changes of high ––income nations.income nations.
•• World War 11 studies rations no sugar.World War 11 studies rations no sugar.•• South Atlantic Islands increased contact.South Atlantic Islands increased contact.•• HopewoodHopewood HouseHouse-- vegetarian dietvegetarian diet
___________________________________
___________________________________
___________________________________
___________________________________
___________________________________
___________________________________
___________________________________

70
Slide 37 Theories Cont.
•• Native American diets:Native American diets:•• TraditionalTraditional-- hunters, foragers, gatherershunters, foragers, gatherers•• Northern Plains foods consisted of :Northern Plains foods consisted of :•• Turnips, wild game and berries. Calcium Turnips, wild game and berries. Calcium
was retrieved from bone marrow of wild was retrieved from bone marrow of wild game.game.
•• More lactose intolerant babies.More lactose intolerant babies.
___________________________________
___________________________________
___________________________________
___________________________________
___________________________________
___________________________________
___________________________________
Slide 38 Native American Introduction to
refined foods.Hunters ,foragers, gatherersHunters ,foragers, gatherersFarmersFarmers-- flour flour –– sugarsugar-- rationsrations--land land
allotmentsallotmentsBoarding SchoolsBoarding Schools--DessertsDesserts--refined sugarrefined sugarRanchersRanchers-- Commodities Commodities –– High sugar and fat High sugar and fat
contentcontentMore recently improved commodities.More recently improved commodities.
___________________________________
___________________________________
___________________________________
___________________________________
___________________________________
___________________________________
___________________________________
Slide 39 Cont
•• Hunters: Early eruption patterns of teethHunters: Early eruption patterns of teeth•• Seen today through screening.Seen today through screening.•• Born with teeth.Born with teeth.•• Introduction of refined foods. High cariesIntroduction of refined foods. High caries•• BBTD ECCBBTD ECC•• Sugared drinks Sugared drinks –– cool aid, soda popcool aid, soda pop
___________________________________
___________________________________
___________________________________
___________________________________
___________________________________
___________________________________
___________________________________

71
Slide 40 Poor Health
•• DiabetesDiabetes•• ObesityObesity•• Dental CariesDental Caries•• Periodontal diseasePeriodontal disease•• Heart diseaseHeart disease•• Cancer etc. Cancer etc.
___________________________________
___________________________________
___________________________________
___________________________________
___________________________________
___________________________________
___________________________________
Slide 41 1999 Oral Health SurveyHistory of Tooth Decay
68.2
19
68
24
0
10
20
30
40
50
60
70
2-5 yrs 15-19yrs
IHSNHANES
___________________________________
___________________________________
___________________________________
___________________________________
___________________________________
___________________________________
___________________________________
Slide 42 Total numbers for caries free and
history of decay 2004Mean Av - % caries free - % history of decay
Mean Av, 18% caries free
Mean Av, 82% history of decay
1 2 3
___________________________________
___________________________________
___________________________________
___________________________________
___________________________________
___________________________________
___________________________________

72
Slide 43 Food consumption survey
1999-2002
2.5
1.33
0
0.5
1
1.5
2
2.5
boys Girls
13-18 year olds
Cans
7
15
0
5
10
15
Toddlers 11-Jun
1/5 of all toddlers and 1/2 of 6-11
oz
___________________________________
___________________________________
___________________________________
___________________________________
___________________________________
___________________________________
___________________________________
Slide 44 Caries and Beverage consumption
University of Iowa•• Contemporary changes in beverage Contemporary changes in beverage
consumption such as regular soda pop, consumption such as regular soda pop, regular powdered beverages and to a lesser regular powdered beverages and to a lesser extent 100% Juice was associated with extent 100% Juice was associated with increase in dental caries.increase in dental caries.
•• Milk had a neutral association Milk had a neutral association
___________________________________
___________________________________
___________________________________
___________________________________
___________________________________
___________________________________
___________________________________
Slide 45
•• Roughly 700 million spent on mediaRoughly 700 million spent on media
___________________________________
___________________________________
___________________________________
___________________________________
___________________________________
___________________________________
___________________________________
73
Slide 46 Remineralization
•• Minerals are depositedMinerals are deposited•• Fluoride increases the remineralization rateFluoride increases the remineralization rate•• Need to Drink fluoridated WaterNeed to Drink fluoridated Water
___________________________________
___________________________________
___________________________________
___________________________________
___________________________________
___________________________________
___________________________________
Slide 47 Water
•• Bottled Water no fluoride.Bottled Water no fluoride.•• Now substituting other drinksNow substituting other drinks•• Sports drinksSports drinks•• Energy drinks.Energy drinks.
___________________________________
___________________________________
___________________________________
___________________________________
___________________________________
___________________________________
___________________________________
Slide 48 Sports Drinks
___________________________________
___________________________________
___________________________________
___________________________________
___________________________________
___________________________________
___________________________________

74
Slide 49 Sports Drinks
•• Organic Acids Organic Acids –– Break down calciumBreak down calcium•• High in caffeineHigh in caffeine•• Not regulated by federal drug Not regulated by federal drug
administration.administration.•• Water should be the first choice.Water should be the first choice.
___________________________________
___________________________________
___________________________________
___________________________________
___________________________________
___________________________________
___________________________________
Slide 50 Energy Drinks
•• Caffeine and Sugar.Caffeine and Sugar.
___________________________________
___________________________________
___________________________________
___________________________________
___________________________________
___________________________________
___________________________________
Slide 51
By Davies Reviewed by Nazario 2003
Active Students/Sports, Track etc WebMD Medical News
•• Makes the grade Makes the grade ---- Sports drinks qualify because research Sports drinks qualify because research shows their light flavor and sodium encourage kids to shows their light flavor and sodium encourage kids to drink up to 90% more than plain water to stay better drink up to 90% more than plain water to stay better hydrated. hydrated.
•• OK (if it's the only drink available) OK (if it's the only drink available) ---- Water falls in this Water falls in this category because it's a good thirst quencher, but research category because it's a good thirst quencher, but research shows kids find it challenging to drink enough. And water shows kids find it challenging to drink enough. And water doesn't replace the electrolytes kids lose through sweat. doesn't replace the electrolytes kids lose through sweat.
•• Falls short Falls short ---- Fruit juices, fruit drinks, and soft drinks don't Fruit juices, fruit drinks, and soft drinks don't have the right amount of electrolytes and contain too much have the right amount of electrolytes and contain too much sugar sugar ---- which can upset the stomach and slow a child which can upset the stomach and slow a child down. down.
___________________________________
___________________________________
___________________________________
___________________________________
___________________________________
___________________________________
___________________________________
75
Slide 52 Schools
•• Clinton agreement w/ beverage industry!Clinton agreement w/ beverage industry!•• Children spend an average of 6 hrs/day.Children spend an average of 6 hrs/day.•• Easy Access to vending machinesEasy Access to vending machines•• Pouring ContractsPouring Contracts•• Sip all daySip all day•• Selling ObesitySelling Obesity
___________________________________
___________________________________
___________________________________
___________________________________
___________________________________
___________________________________
___________________________________
Slide 53 Vending MachinesAdvertise Drinks
••
___________________________________
___________________________________
___________________________________
___________________________________
___________________________________
___________________________________
___________________________________
Slide 54 Most beverages don’t have enough
calcium needed•• 99--13 year olds need 1300 mg/day of 13 year olds need 1300 mg/day of
calciumcalcium
___________________________________
___________________________________
___________________________________
___________________________________
___________________________________
___________________________________
___________________________________
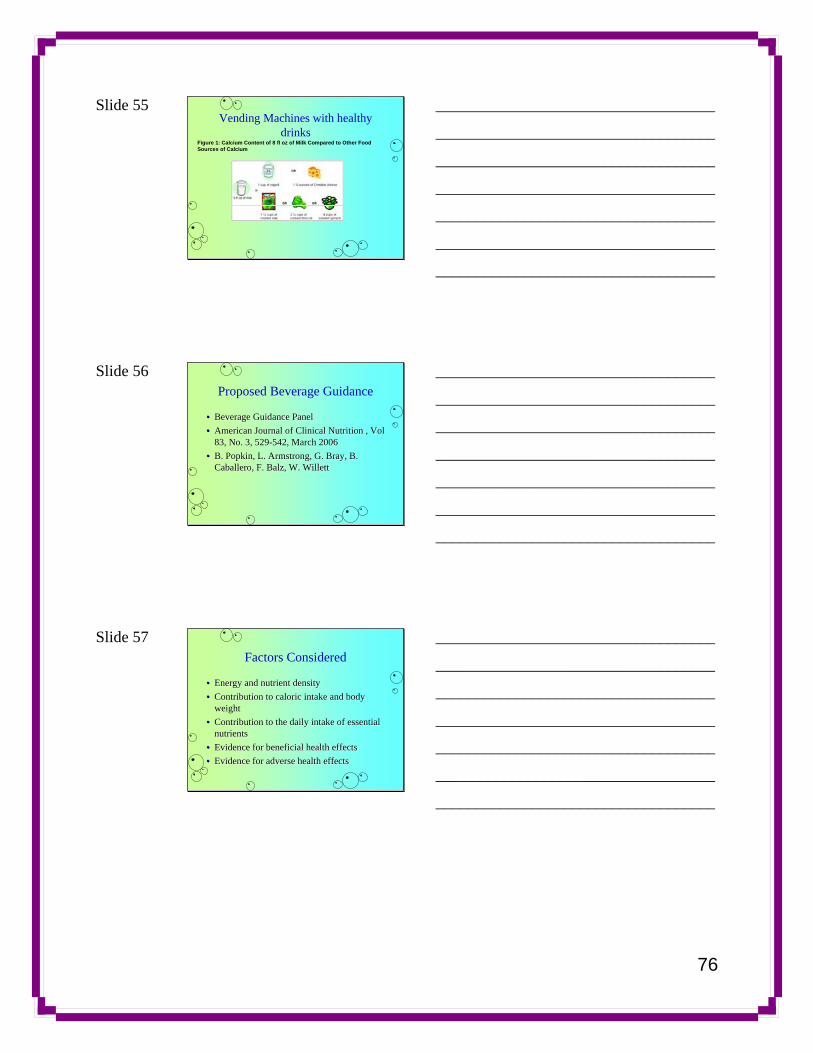
76
Slide 55 Vending Machines with healthy
drinksFigure 1: Calcium Content of 8 fl oz of Milk Compared to Other Food Sources of Calcium
___________________________________
___________________________________
___________________________________
___________________________________
___________________________________
___________________________________
___________________________________
Slide 56 Proposed Beverage Guidance
•• Beverage Guidance PanelBeverage Guidance Panel•• American Journal of Clinical Nutrition , American Journal of Clinical Nutrition , VolVol
83, No. 3, 52983, No. 3, 529--542, March 2006542, March 2006•• B. B. PopkinPopkin, L. Armstrong, G. Bray, B. , L. Armstrong, G. Bray, B.
Caballero, F. Caballero, F. BalzBalz, W. Willett, W. Willett
___________________________________
___________________________________
___________________________________
___________________________________
___________________________________
___________________________________
___________________________________
Slide 57 Factors Considered
•• Energy and nutrient densityEnergy and nutrient density•• Contribution to caloric intake and body Contribution to caloric intake and body
weightweight•• Contribution to the daily intake of essential Contribution to the daily intake of essential
nutrientsnutrients•• Evidence for beneficial health effectsEvidence for beneficial health effects•• Evidence for adverse health effectsEvidence for adverse health effects
___________________________________
___________________________________
___________________________________
___________________________________
___________________________________
___________________________________
___________________________________
77
Slide 58 Levels for Adults
•• Level 1:Level 1: WaterWater•• Level 2:Level 2: Tea & CoffeeTea & Coffee•• Level 3:Level 3: Skim, Low Fat Milk & Soy BevSkim, Low Fat Milk & Soy Bev•• Level 4:Level 4: No Calorie Sweetened BeveragesNo Calorie Sweetened Beverages•• Level 5:Level 5: Caloric BevCaloric Bev’’s w/ some nutrientss w/ some nutrients•• Level 6:Level 6: CaloricallyCalorically Sweetened BeveragesSweetened Beverages
___________________________________
___________________________________
___________________________________
___________________________________
___________________________________
___________________________________
___________________________________
Slide 59 Calcium deficiency
Food intake survey CSF -11 1994-96•• 44% boys and 58% girls ages 644% boys and 58% girls ages 6--11 11 •• 64% boys and 87% girls ages 1264% boys and 87% girls ages 12--19 19 •• 55% men and 78% of women ages 20+ 55% men and 78% of women ages 20+
•• More bone fracturesMore bone fractures•• OsteoporosisOsteoporosis
___________________________________
___________________________________
___________________________________
___________________________________
___________________________________
___________________________________
___________________________________
Slide 60 Water
•• Natures way of telling us Natures way of telling us something.something.
•• More then half of your body More then half of your body weight is water.weight is water.
•• Water gives you energyWater gives you energy•• Helps digest foodHelps digest food•• Contains needed minerals.Contains needed minerals.•• Keeps you healthy.Keeps you healthy.
___________________________________
___________________________________
___________________________________
___________________________________
___________________________________
___________________________________
___________________________________
78
Slide 61 Water the First Choice
•• Essential nutrients of lifeEssential nutrients of life•• Men need 10Men need 10--12 cups12 cups•• Women need 8Women need 8--10 cups10 cups•• Fluoridated water.Fluoridated water.
___________________________________
___________________________________
___________________________________
___________________________________
___________________________________
___________________________________
___________________________________
Slide 62 Cariogenic foods
Decay causing foodsDecay causing foods
___________________________________
___________________________________
___________________________________
___________________________________
___________________________________
___________________________________
___________________________________
Slide 63 Prevention Programs
•• XylitolXylitol programsprograms•• Fl varnish programsFl varnish programs•• School sealant programsSchool sealant programs•• Drink the water campaigns.Drink the water campaigns.•• NOW NOW Decreasing Pop ConsumptionDecreasing Pop Consumption
___________________________________
___________________________________
___________________________________
___________________________________
___________________________________
___________________________________
___________________________________
79
Slide 64 California Endowment
•• Apply standards to 100% of beverages Apply standards to 100% of beverages offered in their schools.offered in their schools.
•• 100% compliance100% compliance•• Eliminate advertising of beverages that Eliminate advertising of beverages that
dondon’’t comply.t comply.•• Price healthy beverages cheaper.Price healthy beverages cheaper.•• Give students more choices of healthy Give students more choices of healthy
drinksdrinks
___________________________________
___________________________________
___________________________________
___________________________________
___________________________________
___________________________________
___________________________________
Slide 65 Health Beverages Kit
•• The best thing for Indian Country.The best thing for Indian Country.•• Drink SensibleDrink Sensible•• Healthy drinks.Healthy drinks.
___________________________________
___________________________________
___________________________________
___________________________________
___________________________________
___________________________________
___________________________________
Slide 66 Questions
___________________________________
___________________________________
___________________________________
___________________________________
___________________________________
___________________________________
___________________________________
80
Slide 67
___________________________________
___________________________________
___________________________________
___________________________________
___________________________________
___________________________________
___________________________________
Slide 68 Healthy Beverage Action Kit
•• Your Comments are welcomeYour Comments are welcome•• [email protected]@ihs.gov (602) 364(602) 364--77557755•• [email protected]@hqe.ihs.gov (301) 443(301) 443--05760576
___________________________________
___________________________________
___________________________________
___________________________________
___________________________________
___________________________________
___________________________________

81
Healthy Beverage Team Leaders
Jean Charles-Azure, MPH, RD IHS Principal Nutrition Consultant Rockville, MD Phone: 301-443-0576 [email protected]
Elaine Little, MS, RD LCDR USPHS Public Health Nutritionist IHS Phoenix Area, Phoenix, AZ Phone: 602-364-7755 [email protected]
Brenda Broussard, RD MPH MBA BC-ADM CDE Health Care Consultant Albuquerque, NM Phone: 505-792-0065 [email protected]
Healthy Beverage Team
Mary Altenberg, MS, CHES Program Director, Dental Support Center, Albuquerque Area Phone: 505-922-4246 [email protected] Alberta Becenti, IHS Health Promotion and Disease Prevention (HP DP) Consultant Rockville, MD Phone: 301-443-4305 [email protected] Robert Bialas, R.S. Commander, USPHS IHS – Head Start Program Bremerton, WA 98310 Phone: 360-792-1235, ext. 116 [email protected] Patrick Blahut, DDS, IHS Dental Program, HQE Rockville, MD, [email protected] Tammy Brown, MPH RD BC-ADM, CDE IHS Nutrition Consultant, Diabetes, Treatment & Prevention, Albuquerque, NM Phone: 505-248-4182 [email protected]
Kathy Charles, MPH, RN Public Health Educator, Lummi Tribe of Washington Phone: 360-384-2386 [email protected] Mary McEnery, DDS Pediatric Dentist, Lame Deer, MT Phone: 406-477-4400 [email protected] CDR Delores E. Starr BS, RDH Area Dental Prevention Officer Aberdeen Area, Pine Ridge Hosp Pine Ridge, SD 57770 [email protected] Cheryl Wilson, MS Director, IHS Head Start Program, Albuquerque, NM Phone: 505-248-7771 [email protected] Ellie Zephier, MPH, RD IHS Nutrition Consultant, Aberdeen Area Aberdeen, SD Phone: 605-226-7458 [email protected]

Acknowledgements
This document was made possible with the leadership, support and hard work of the following individuals in the U. S. Department of Health and Human Services Emerging Leader (Native American) Intern Program, Washington, D.C., June 2005, who championed the work of “Reducing Soda Pop Consumption in American Indian and Alaska Native Communities”: Lynda Bishop Brian ChanIman Freeman Angela Ingram-Jones Carl Lawson Gary M. Quinn Valerie J. Rock Michelle Yeboah Tia Zeno Special thanks to the American Indian and Alaska Native participants in the March 2005 focus group sessions conducted in Phoenix, AZ, Cherokee, NC, Albuquerque, NM, and Pine Ridge, SD.

83
References:
Agron, P., Takada, E., Purcell, A. California Project LEAN’s Food on the Run Program: An Evaluation of a High School-Based Student Advocacy Nutrition and Physical Activity Program. Journal of the American Dietetic Association, Adolescent Nutrition Supplement. 2002; 102(3): 103-105. American Academy of Pediatrics (2004). Soft drinks in schools. Pediatrics, 113:152-154. Barry, M Popkin, Lawrence E. Armstrong et al. A new proposed guidance system for beverage consumption in the United States. AM J Clin Nutrition, March 2006, Vol. 83, No. 3, 529-542. Ballew, Kuester, Gillespie, Archives of Pediatric and Adolescent Medicine Nov. 2000; 154:1148-1152. California Project LEAN. In Taking the Fizz out of Soda Contracts. www.phi.org/pdf-library/sodareport.pdf. Charles-Azure J, Little E. Promotion of Healthier Beverages in Indian Communities. The IHS Primary Care Provider. 2005:30(6):143-147. Charles-Azure J; Blahut, Patrick; Starr, Delores, “Healthy Beverage” 2006, Power Point Contributors.
Giammattei J, Glen Blix, Marshak H, Wollitzer A, Pettitt D. Arch Pediatr Adolesc Med. 2003;157:882-886.
Ludwig, D, Peterson K, Gortmaker S. Relation between consumption of sugar-sweetened drinks and childhood obesity: a prospective, observational analysis. The Lancet Feb. 17, 2001, 357:505-508. McCormack Brown, K., Akintobi, T., Pitt, S., Berends, V., McDermott, R., Agron, P., Purcell, A. California School Board Members’ Perceptions of Factors Influencing School Nutrition Policy. Journal of School Health. 2004; 74(2):52-58. National Center for Health Statistics, NHANES III Story M, Strauss K, Zephier E, Broussard B. Nutritional concerns in American Indian and Alaska Native children: Transitions and future directions. Journal of the American Dietetic Association. 1998:98(2):170-176. The Food Trust, Food Services Division of the School Pennsylvania Advocates for Nutrition and Advocacy (PANA) Pennsylvania Action for Healthy Kids, 1992

84
U.S. Dept of Health and Human Services. The Surgeon General’s Call to Action to Prevent and Decrease Overweight and Obesity. Rockville, MD: USHHS, PHS, Office of the Surgeon General, 2001, Washington, D.C. U.S. Department of Health and Human Services and U.S. Department of Agriculture. Dietary Guidelines for Americans, 2005. 6th Edition, Washington, D.C.: U.S. Government Printing Office, January 2005. www.healthierus.gov/dietaryguidelines Weber JL, Lytle L, Gittelsohn J, Cunningham-Sabo L, Heller K, Anliker JA, Teufel NI, Retenbaugh CK. Development of a primary prevention program: insight gained in the Zuni Diabetes Prevention Program. Clinical Pediatrics 1998;37:131-142. Welsh J, Cogswell M, Rogers S et al. Overweight among low-income preschool children associated with consumption of sweet drinks: Missouri, 1999-2002. Pediatrics 2005, 115:223-229.
Appendix A: Other Additional Resources
“Reducing Soda Pop Consumption in American Indian and Alaska Native Communities”, DHHS, Washington, D.C., June 01, 2005. (22-page report) The Oral Health of Native Americans: A Chart Book of Recent Findings, Trends and Regional Differences, by William Niendorff, DDS, MPH, Dental Field Support and Program Development Section, Indian Health Service, Albuquerque, NM. 1991 Healthy Guidelines published in the American Journal of Clinical Nutrition. www.lipton.com Caffeine Content of Popular Drinks” 14 June 2006 Wilstar 2006. http://wilstar.com/caffeine.htm “Caffeine Content of Foods and Drugs.” 12 June 2006 Nutrition Action Health letter 1996. http://www.cspinet.org/nah/caffeine/caffeine_content.htm Appendix B: PowerPoint Presentation Visuals and Speaker Notes – 14 visuals, “Healthy Beverages Action in American Indian and Alaska Native Communities”. (adapted from “Taking the Fizz out of Soda Contracts, California Project LEAN) PA Department of Agriculture “Healthy Beverage Tool Kit” The Food Trust, 2004 Philadelphia, PA. www.Thefoodtrust.org 2006 The StayWell Company, San Bruno, CA, www.krames.com A Healthy Weight for Your Preteen: Helping your child make good choices and Say No to TV Zombies and Soda Monsters, The Choice is Yours! Watch Out for TV Zombies and Soda Monsters. Eat Healthy. Play Healthy. Stay Healthy. and Helping Your Child Maintain a Healthy Weight: A Parent's Guide for Food and Fun (each booklet is designed for 2 audiences: children and parents/caregivers.

85
Appendix C: Web Resources Banning Sodas in your School: A Short Organizing Tool. http://departments.oxy.edu/uepi/cfj/Articles/BanningSodasinYourSchool.pdf Successful strategies used by the Los Angeles United School District (2nd largest school district) to pass a motion to ban sodas in schools. Beverage Intake in the United States. 02 June 2006. UNC Carolina Population Center 2006. <http://www.beverageguidancepanel.org/> Caffeine. 02 June 2006 Wikipedia 2006 http://en.wikipedia.org/wiki/Caffeine Caffeine Content of Foods and Drugs. 12 June 2006 Nutrition Action Healthletter 1996. <http://www.cspinet.org/nah/caffeine/caffeine_content.htm> The Daily Healthy Beverage Guidelines. 02 June 2006. Unilever Health Institute 2006. <http://www.liptont.com/downloads/tea_health/beverage_guide/lipton_bevguide_poster.pdf> California Project LEAN (Leaders Encouraging Activity & Nutrition) http://www.californiaprojectlean.org/ A joint program of the California Department of Health Services and the Public Health Institute focusing on youth empowerment, policy and environmental change strategies, and community-based solutions to increase healthy eating and physical activity. Website contains resources for advocacy and policy efforts, fact sheets, lesson plans, program plans, and youth specific campaign information, and research and evaluation reports. Centers for Disease Control, Division of Nutrition and Physical Activity www.cdc.gov/nccdphp/dnpa/index.htm and obesity resources: www.cdc.gov/nccdphp/dnpa/obesity/resources.htm Features publications, data, and other resources for individuals, communities, and health care providers on nutrition and physical activity. Competitive Food Standards Recommendations, California Center for Public Health Advocacy. http://www.publichealthadvocacy.org/school_food_standards/school_food_stan_pdfs/standards.pdf Provides recommendations on competitive foods and beverages in elementary and secondary schools; such as beverages that contain at least 50% fruit juice with no added sweeteners, water and low fat/nonfat milk. Eat Smart. Play Hard. ™ http://www.fns.usda.gov/eatsmartplayhard/ Campaign messages and materials include downloadable tip sheets, campaign overviews, and how to get involved.

86
Fit, Healthy, and Ready to Learn: A School Health Policy Guide-National Association of State Boards of Education. http://www.nasbe.org/HealthySchools/Sample_Policies/healthy_eating.html Food on the Run: Lessons from a Youth Nutrition and Physical Activity Advocacy Campaign. http://www.caprojectlean.org/ Food on the Run trained student advocates to conduct research, set goals, and formulate policy solutions to improve their schools' food and physical activity environments. Advocacy workbooks and an award-winning teen web site www.caprojectlean.org were created to assist teens in the advocacy process. Healthy Schools Policies to Encourage Healthy Eating http://www.nasbe.org/HealthySchools/healthy_eating.html Sample policies to adopt at the state, school district or school level to encourage healthy eating and healthy food choices in schools. Indian Health Service Nutrition and Diabetes Programs www.ihs.gov/medicalprograms/nutrition www.ihs.gov/medicalprograms/diabetes Lesson Plan to help reduce soda pop in schools-NOW TV show, PBS http://www.pbs.org/now/printable/classroom_diet_print.html A lesson plan and curriculum created by a Pennsylvania physical education teacher designed to increase awareness and understanding of soft drink consumption in schools. Includes lesson objectives, related national health standards, background information, teacher strategies and related resources. Lesson Plan to help students age 9-11 years become media smart. www.interact.uoregon.edu/MediaLit/mlr/courses/Sauerland/lesson.html Liquid Candy: How Soft Drinks are Harming Americans’ Health, Michael Jacobson, Center for Science in the Public Interest. http://www.cspinet.org/new/pdf/liquid_candy_final_w_new_supplement.pdf Making It Happen! School Nutrition Success Stories http://teamnutrition.usda.gov/Resources/makingithappen.html Making It Happen! School Nutrition Success Stories shares stories from 32 schools and school districts that have made innovative changes to improve the nutritional quality of all foods and beverages offered and sold on school campuses. These success stories illustrate the wide variety of approaches used to improve student nutrition. The most consistent theme emerging from these case studies is that students will buy and consume healthful foods and beverages, and schools can make money from healthful options. Making It Happen! includes a variety of materials developed by some of the schools and contact information for each story.
87
MEE Productions and CANFIT MEE (Motivational, Educational, Entertainment) Productions and California Nutrition and Fitness. www.meeproductions.com and www.canfit.org Model School Wellness Policies National Alliance for Nutrition and Activity (NANA) http://www.schoolwellnesspolicies.org/WellnessPolicies.html National Diabetes Education Program (NDEP) American Indian and Alaska Native Community Partnership Guide: Supplement and Activity Plans http://www.ndep.nih.gov/diabetes/pubs/AIsupplement.pdf Reaching School Board Members: A Guide for Creating a Clear, Concise, and Compelling Nutrition Policy Campaign. http://www.californiaprojectlean. Select “Policy and Advocacy Tools” This Guide utilizes multiple hours of feedback and discussion with California school board members, superintendents, school principals, and parents to help community groups create "win-win" situations when working on school district nutrition and physical activity issues. The Guide helps readers convey their nutrition policy message effectively while at the same time helping school board members gain the information they need to create effective nutrition policy. School Beverage Bill Language, Sept. 2005, California State legislative language that describes the beverages encouraged in schools, and those that are not permitted in vending machines and on school grounds in California. http://www.leginfo.ca.gov/pub/bill/sen/sb_0951-1000/sb_965_bill_20050825_amended_asm.html School Foods Tool Kit – Center for Science in the Public Interest. http://www.cspinet.org/nutritionpolicy/policy_options.html#ImproveSchoolFoods Website includes model policies and case studies for parents, teachers, community members, and health professionals to use to influence school nutrition. Soft Drinks and School-Age Children. http://www.nutritionnc.com/TeamNutrition/SoftDrink(8-19).PDF Strategic Alliance for Healthy Food and Activity Environments. http://www.preventioninstitute.org/sa/enact/enact/ ENACT is a concrete menu of strategies designed to help improve nutrition and activity environments on a local level in seven environments: childcare, school, after-school, neighborhood, workplace, healthcare, and government. Taking the Fizz out of Soda Contracts: A Guide to Community Action, 2002, California Project LEAN. http://www.asu.edu/educ/epsl/CERU/Community%20Corner/CERU-0306-138-RCC.pdf
88
Photo References: Photos Courtesy of Google Imagery
1. Page 1: Water Fall, Google Images; http://images.google.com/image. 2. Page 2: Eagle, Ron Niebruggem; http://images.google.com/image. 3. Page 6: Soda Cans, Google Images; http://images.google.com/image. 4. Page 7: Glass of water, Google Images; http://images.google.com/image. 5. Page 10: Juice Carton, http://images.google.com/image. 6. Page 10: Glass of water, Google Images; http://images.google.com/image. 7. Page 11: Child, Donated by Cheryl Wilson. 8. Page 12: Vending machine, Google Images; http://images.google.com/image. 9. Page 14: Water Bottle, http://images.google.com/image. 10. Page 17: Water Bottle, http://images.google.com/image. 11. Page 18: Water Bottle, http://images.google.com/image. 12. Page 20: Glass of water, Google Images; http://images.google.com/image. 13. Page 24: Water Bottle Background, http://images.google.com/image. 14. Page 25: Person drinking water, http://images.google.com/image. 15. Page 26: Toothbrush, http://images.google.com/image. 16. Page 27: Soda bottle. http://images.google.com/image. 17. Page 28: Tooth. http://images.google.com/image. 18. Page 29: Milk Carton, http://images.google.com/image. 19. Page 29: Candy, http://images.google.com/image. 20. Page 31: Tea, http://liptont.com/downloads/tea. 21. Page 33: Water Bottle, http://images.google.com/image. 22. Page 34: Coffee Pot, http://images.google.com/image. 23. Page 35: Starbucks Coffee mugs, http://images.google.com/image. 24. Page 35: Soda bottles, Google Images; http://images.google.com/image. 25. Page 36: Glass of water, http://images.google.com/image. 26. Page 37: Tea Grass, Dharmananda, PhD., Director, Institute for Traditional Medicine, Portland, Oregon January 2004. 27. Page 37: Tea Flower, Tea Grass, Dharmananda, PhD., Director, Institute for Traditional Medicine, Portland, Oregon January 2004. 28. Page 37: Tea Bundle, Tea Grass, Dharmananda, PhD., Director, Institute for Traditional Medicine, Portland, Oregon January 2004. 29. Page 37: Multiple Tea Bundles, Tea Grass, Dharmananda, PhD., Director, Institute for Traditional Medicine, Portland, Oregon January 2004. 30. Page 37: Tea Pot, http://images.google.com/image. 31. Page 37: Tea Leaves, http://images.google.com/image. 32. Page 37: Tea Set, http://images.google.com/image. 33. Page 37: Tea Bag, http://images.google.com/image. 34. Page 39: Water Droplet, http://images.google.com/image. 35. Page 41: Water Cooler, http://images.google.com/image. 36. Page 42: Community Image, http://images.google.com/image. 37. Page 43: Water Bottles, http://images.google.com/image. 38. Page 45: People Images, http://images.google.com/image. 39. Page 46: Water faucet, http://images.google.com/image. 40. Page 47: Water Drinking, http://images.google.com/image. 41. Page 48: Juice Carton, http://images.google.com/image. 42. Page 50: Water Drinking, http://images.google.com/image. 43. Page 51: Water Faucet, http://images.google.com/image. 44. Page 81: Landscape, http://images.google.com/image. 45. Page 82: Water Splash, http://images.google.com/image. 46. Page 89: Water Fall,www.trekearth.com/gallery/photo;http://images.google.com/image.

89
“”Water is the Best Medicine for everyone. The best thing for Indian Country is to
drink sensibly with healthy drinks.”
CDR Delores E. Starr BS RDH Oglala Sioux Tribe
Aberdeen Area Dental Prevention Officer