hearing with civil society and the private sector - unctadunctad.org/meetings/en/miscellaneous...
TRANSCRIPT
Trade and Development Board Fifty-fifth Session Geneva, 15- 6 September 2008
Hearing with civil society and the private sector 17 September 2008, 3 p.m.-6p.m. Room XXVI, Palais des Nations
Civil society inputs and contributions to the selected themes to be discussed at the hearing as received by 5 September 2008 Submitted for the attention of member States
_________________ Disclaimer: The statements are made available by the UNCTAD secretariat in the language and form in which they were received.
Disclaimer: The statements are made available by the UNCTAD secretariat in the language and form in which they were received.
Civil society inputs and contributions to themes Theme 1: The global food crisis: addressing a systemic failure in development strategy & Theme 2: The global financial crisis and its impact on sustainable development African Cocoa/Coffee farmers’ Marketing Organization (ACCFMO)
Coordination des ONG Africaines des Droits de l’Homme (CONGAF)
Collectif des femmes pour la Protection de l’Enfant et de l’Environnement (COFEPRE)
Organisation Camerounaise de promotion de la Coopération Economique Internationale (OCAPROCE)
Village Suisse ONG (VSONG)
Rwanda Women's Network
Cercle d'Initiative Commune pour la recherche, L'environnement et la Qualité (CICREQ)
United Youth Front International (UYFI)
Synergie Développement et Partenariat International (SY.DE.P.I /SY.F.O.D.I.P)
Consumer Unity and Trust Society (CUTS International)
Centre for Trade and Development (CENTAD)

Disclaimer: The statements are made available by the UNCTAD secretariat in the language and form in which they were received.
Organization: African Cocoa/Coffee farmers’ Marketing Organization (ACCFMO) Contact: Sylvanus Nekenja Chairman
6 de Wet Goodwood, 7460 Cape Town, South Africa Tel: +278 352 039 40 or +272 159 146 62 Fax: +272 159 242 06 E-mail: [email protected]
Themes Addressed:
The global food crisis: addressing a systemic failure in development strategy & The global financial crisis and its impact on sustainable development
Input: Developing nations and mostly countries of the Central African sub region is being menaced by various social and economic factors and which are visibly impeding economic growth in the area. The zone is made up of mostly French colonies with the exception of Cameroon which is bilingual and most of its citizens receive formal education in either English or French languages. The cultural differences of these two groups of colonies, is clearly portrayed in their manner of perceiving internal socio-economic and political issues thus, the approach of formulating strategies vary considerably. However, there is consensus in the call of harmonizing economic lead development strategies sighting neighboring country, Nigeria as a potential emerging market for the farm products finished and unfinished from the region.
We strongly agree with the quotation that “Poverty anywhere is a danger to
prosperity everywhere” (Declaration of Philadelphia, Constitution of the International Labor Office 1944)
However, we can further elaborate those poor economic policies by one member
state to provoke and influence a down-turn of economic prospects in the rest of the economic and monetary union. The poor performance of the banking sector lending ability to economic operators in the region according to both the Bank of Central African States (BEAC) and the African Development Bank (ADB) is linked to bad policies. These institutions which held workshop meetings in the months of June and July 2008 respectively associated the slow pace of economic growth in the sub region to poor fiscal and monetary policies aggravated by rampant capital flight and excessive financial mal-practices with top civil servants and to some extent, lack of political will by public officials. The ADB indicated that it will be reducing its spending in developmental funded project in Cameroon; this is due to the fact that the government has consistently been slow in awarding public contracts in the execution of existing funded project with the Bank.
This regretful circumstance urgently requires an effective civil society that will not
only criticized the public service mechanism and functionality but, formulate practical mechanisms and propose ample, workable socio-economic developmental policy measures that would assist the administrations of the various countries in the sub region in drafting and implementing appropriate integrated policy framework. Corruption is not the problem but government management with the support of international community.
Theme 1: The global food crisis: addressing a systemic failure in
development strategy Food crop production in developing countries and particularly in Sub Saharan
Africa is the affair of smallholder farmers who are often considered mean and dejected
Disclaimer: The statements are made available by the UNCTAD secretariat in the language and form in which they were received.
segment of the economy. To address food security and food sufficiency in developing countries, we have to reverse this stigma by introducing Pro Poor-growth programmes.
While we struggle to overcome global food crisis, we should have in mind that in
most developing countries there are stable food types like Cassava, Plantain, Coco-yams, Yams, Potatoes and different species of fruits and vegetables, spices, seeds and nuts produced locally for which prices can not be affected by subsidized exports and or speculators from the developed economies. Therefore, agricultural policy and strategy should be streamlined to include this area and enhance food production and trade for development perspective.
Trading of food commodities in most developing counties has always been
dominated by the informal sector. The fact that most local authorities have permanently attached little or no importance in the production, supply/distribution of food commodities, there has been lack of proper measures to ensure structural integration that would harness the economic development potential of the activities. It is time we implement an innovative structure of the smallholder farmers through Producers’ Cooperative Schemes per village or area in every developing country and link them to a central Cooperative Union.
Most Micro Finance Institutions are often reluctant in funding the agricultural
sector in the developing countries especially in the Central African sub region because of the risks involve in agricultural activities and the lack of an effective insurance cover. Nonetheless, the sector needs a Creditor Bank operating under an integrated, innovative structured finance mechanism, establishing a linkage between main players and stakeholders: Financiers, Producers, Warehousing, Transporters, Input Suppliers, Insurers, Traders/Processors, Exporters, Quality Inspectors and Credit Service Institutions. See Enhancing Commodity Finance through Producers Cooperative Societies a document from the ‘National Cocoa/Coffee Empowerment Project’
In structuring Producers’ associations, there will the need for an immediate action
to equip and render the organisations performing and competitive. Office equipments, transport facilities, information & communication technology and technical assistance can be supplied under a loan agreement between the creditor banks.
Post-harvest crops in developing countries face enormous storage problems
ranging from stock control and stock financing through Warehouse Receipt System. Up-country intermediate graded warehouse is necessary to store the regular and irregular supplies parchments of crops such as maize, rice and other grains and beans etc. Trade between regional countries would require the construction of standard cross-border warehouse equipped with modern technology capable of storing highly perishable food crops. Same warehouses can also serve in the storage and distribution of input supply to farmers through farmers’ associations.
Another strategy that can enhance food crop productivity and distribution capacity
is the development of farm to market roads, information communication technology and a viable distribution chain. Transportation and distribution posses a serious danger in providing food to all at an affordable price, Lack of information and the ability to transport food commodities from one location or country to another within the required time can lead to artificial scarcity hence high prices, starvation and malnutrition in the affect area or country.
Input Supplies serve an important role to achieve food productivity and fight food
price crisis depending on how best the system’s strategies are formulated and implemented. An elaborate structure should clearly separate the functions of the input procurement and supply scheme to agricultural field technicians and other regulatory bodies so as avoid corrupt practises and encourage transparency. The Food and

Disclaimer: The statements are made available by the UNCTAD secretariat in the language and form in which they were received.
Agricultural Organisation should ensure that farmers are not victimised by some state funded organisations that put personal interest ahead of farmers’. Farmers in developing countries are becoming increasingly aware of the fact that nothing goes for anything and the notion of free input supply should be replaced by a subsidised input supply scheme.
The transfer of science and technology to developing countries is important if we
hope to transform these economies and ensure its participation in a globalized world economy. Science can play a great deal in the transformation of farming practices and agricultural activities in a society where seventy percent of the active population depend on for their livelihood. While science seeks to pave the way, technology will harness economic development through capital investment, communication network, transport and transportation, move the value chain upward to manufacturing level and expand farm enterprise service delivery. Most African stable food crops are of perishable nature and would require an advance technology to store and maintain the quality of substantial quantity of varied supplies to the warehouse destined either for export or for the processing industries.
Creating a viable value chain will enable the region to improve on its trade and
productive capacity, enhance sustainable development and food security while facilitating price risk management in the process. It has been notice with great disappointment that where personal interest overrides community interest, the value chain players are unnecessarily extended and this makes the scheme become lest cost effective and cost recovery rate are discouraging.
INTEGRATING FOOD COMMODITY VALUE CHAIN IN THE CENTRAL AFRICAN SUB REGION
Well structured Farmers’ Cooperative Societies, equipped and strengthened to
perform and operate within the context of the evolution of the international trading system and international development perspective. This will enable individual farmers participation and integrate the farming community effectively into the value chain. This structural approach will be carried out within the concept of regionalization whereby, the act will be introduced simultaneously within the different countries in the economic sub region.
Farmers’ Cooperative Societies are private initiative formed by smallholder
farmers themselves within a given area producing various types of different commodities food and cash crops for trading purposes. The shareholders are farmers whose contribution comes in the form of physical crops which is evaluated in monetary terms. Their liabilities are limited to the evaluated crop share contributed to the organisation. As a trading instrument to the group of smallholder farmers, the cooperative is able to hold and manage substantial stock of crops in the cooperative warehouse. This opportunity provides the cooperative a bargaining strength that allows it to trade at favourable terms with off-takers, Traders and or Processors.
Traders of unprocessed or processed commodity and processing firms should
have an Information Communication Network Technology that links them and help share
FARMERS COOPERA-TIVE SOCIETIES
FARMES
TRADERS / PROCESS-ORS
WHOLES-ALERS
RETAILE-RS
CONSUM-ERS
Disclaimer: The statements are made available by the UNCTAD secretariat in the language and form in which they were received.
information within the regional economic blocks. This will enhance e-commerce and facilitate the mobilisation of resources; good and services, check commodity prices and regularised productive capacity both in quantity and quality within the region and between other regions. The transfer of science and technology to the agribusiness will help move the value chain up-ward to a food processing level in the region and pave the way to achieving the Millennium Development Goals. Processing companies will create a new wave of capital mobilisation and encourage the use of specialised labour in the supply and distribution of commodity. Improve the production capacity of smallholder farmers by adding value to crop production and increasing their incomes.
Regional integration base on an international trade development perspective
requires harmonising policy options between countries within a sub region. A common policy framework reoriented to meet regional integrated development goals. Introduce models in the agribusiness geared at achieving greater equity, sustainability and a better balance between export-led growth in the production and distribution for domestic and regional market, as well as measures to ensure food security and self-sufficiency in the region.
Wholesale trade may hold large stocks of both grains, beans, and other
perishables; stock the regular and irregular supplies of food commodities either directly from farmers’ cooperative societies and traders or establish a backward economic integration with processing firms. With a well established regional operational framework within the wholesalers, stock control and stock distribution will be better managed and the forces of demand and supply will have little effect on commodity prices. A Forwarded integration between wholesale traders and the retail out-lets is eminent at this stage.
There is an urgent need to up grade trade in developing countries so as to bring
together stakeholders in the supply chain and integrate their activities. Modern international trade gives more emphasis to retailing in the form of supper markets, multiple stores etc. which are open to the consumer at afforded and regulated prices. Such an establish trade models will not only guaranty sustainable production and supply/distribution capacity but will enhance development and poverty reduction while ensuring food security and food sufficiency within regions and in the global context.
Climate change is gradually impacting negatively in the cultivation of food crops
for the local and cross-border markets. The amount of rain fall experience in Central African sub region during the seventies and eighties has gradually reduced. Planting periods of different food crops has change in order for cultivated crops to receive water during raining season which periods in months has been reduced due to climate change. The international community need to assist local authorities identify causes and introduce measures to control climate change effecting food crop cultivation and its production capacity.
Theme 2: The global financial crisis and its impact on sustainable
development Liquidity crisis became an issue in most developing nations in the 1980s when
cash crops prices (Cocoa, Coffee, Rubber, Palm Oil etc.) felt to an unexpected level, the devaluation of the Franc of the Communauté Financière Africaine or F, CFA which is a common currency shared between French language speaking nations in West and Central.
The introduction of the Structural Adjustment Programme was not a very familiar
plan by the Britton Wood Institution to most developing nations who are estimated to be dependent on commodity for more than 50 per cent of their export income. These countries depend on commodities as a source of livelihood, employment, foreign
Disclaimer: The statements are made available by the UNCTAD secretariat in the language and form in which they were received.
exchange and public revenue, and the commodity sector provides the principal stimulus for economic growth.
Furthermore, the significant land area and human and natural resource base
required by commodity production significantly influence natural resource management, biodiversity conservation and social development. Developing countries are also facing the challenge of industrializing and meeting the growing demands of their populations at a time when the constraints on the natural resource base and the environment are more severe than ever.
Policies on the effects on economic growth and long-term development of
migrants’ remittances, which supplement household incomes, should be mobilised so that it can produce direct positive impact on poverty alleviation to the millions of farming communities in the developing and least developed nations in Africa.
As migrants’ remittances, which are private income, are expected to grow further
for many years to come, consideration might be given to providing incentives for using such inflows for capital formation. This could strengthen their impact on long-term development and at the same time help solve the problems that have been causing emigration in the first place.
After strong and sustained expansion during the 1990s, FDI flows to developing
countries and Sub Saharan Africa have become less stable since the turn of the millennium. Policymakers should adopt measures that will foster stable flow of foreign direct investment in the organisation of agricultural commodity production, diversification, transformation and marketing and trade. There has recently been a resurgence of FDI flows to developing countries in Africa driven by prospects for greater earnings in the extractive industries but, flows have not been compactable enough to enhance long-term economic development in commodity dependent countries.
The growth of FDI relative to domestic capital formation or GDP suggests that
inward FDI has come to play a more significant role in developing economies than it did 20 years ago. But the amount of FDI alone is not an indicator of its contribution to development. Empirical evidence points to considerable variation in the benefits that host countries actually reap from FDI inflows, depending on how FDI policies are formulated and integrated into a broader development strategy and on the extent to which private business interests of foreign investors and national development objectives can be reconciled.
Weak bargaining and regulatory capabilities on the part of host-country
governments has result in an unequal distribution of benefits or an abuse of market power by trans-national corporations TNC by crowding out domestic investment. FDI is increasingly required to serve global and regional markets, often in the context of international production networks, and the spread of such networks should offer, in principle, new possibilities for developing countries and economies in transition to benefit from FDI in the manufacturing and distribution sector.
In Central Africa and other developing and least developed countries, FDI is still
heavily concentrated in the extraction and exploitation of natural resources, with weak linkages to the domestic economy creating fewer and unstable job opportunities to the labour market. Host-country regulations can influence the creation of linkages between domestic producers and foreign affiliates, and also induce FDI to contribute to technology transfer. This should be a concern of global policymaking.
This in turn implies that developing countries should be more closely involved,
and have more of a say, in international economic decision-making. Global financial crisis
Disclaimer: The statements are made available by the UNCTAD secretariat in the language and form in which they were received.
is a reflection to the fact that profits of most FDI in developing countries are repatriated to countries of origin.
FDI or TNC should be urged to re-invest part of their profit back into the host
countries that will facilitate the formation of local small and medium size enterprises vital for economic development.
Capacity building at national level of macroeconomic management of higher fiscal
and foreign-exchange earnings from commodity exports must aim to ensure that the current boom in commodity prices should help to spur diversification, industrialization and structural change.
Most African countries that are highly dependent on foreign earnings from
favourable agricultural commodity prices, should be assisted with capacity to be able to manage the transitional period of a state owned to a liberalised and private sector orientated economy.
The global financial system should enact policies that through coherence in the
global financial system that will ensure resource-rich developing countries should also use rising resource rents to ensure long-term sustainability, by moving away from the depletion of natural resources and towards investment in material and human capital, and by confronting pressing employment and social needs.
In developing countries, the imperatives of enterprise development and structural
change imply the provision by institutions of mechanisms to implement policies designed to achieve high rates of investment and the adoption of new technologies necessary to move up the value chain.
The guiding principle behind institutional reform should be to address the
information and coordination failures that undermine entrepreneurial decision-making and to improve transparency and checks and balances in private and public enterprises.
Funding of development projects to least developed and developing countries
should well be planned and stratify to include both equipment for construction and liquidity depending on the type of funded programme. For instance, if the programme is road construction, construction firms should be contacted directly through a tripartite agreement and maybe liquidity movement could be for salaries and wages which of cause should have been predetermined. Furthermore, disbursement of funds to realise a particular project should be done systematically project face by face finance base on progress report and project supervisory agency report. This will reduce the project funding deviation and embezzlements hence underdevelopment and indebtedness by the recipient countries. The CSO forum should came up with declarations which will recognised NGOs and give them the opportunities in assisting development financing programmes in developing and least developed countries.
Finally, global financial crisis is being experience because of exorbitantly high fuel
prices and speculations. A lot of factors, including trade policies, energy costs, bio-fuels, and market speculation, have contributed to the booming prices. World food prices have roughly doubled over the past three years, but between April 2007 and April 2008 alone they increased by 85%. This price rise has been broad-based, led by wheat (whose price almost doubled), then maize (up 67% since July 2007), followed by rice (which has tripled since September 2007 and soared by 160% between January and April 2008 alone). Prices for vegetable oilseeds and oils also shot up, multiplying by about 2.5 since early 2006. Global development assistance for agriculture fell from a high of $8 billion in 1984 to $3.4 billion in 2004, of which Africa received $1.2 billion. American aid to African farmers fell from $500 million in 1988 to less than $100 million in 2006, according to the U.S. Government Accountability Office. The World Food Programme planned to feed 73
Disclaimer: The statements are made available by the UNCTAD secretariat in the language and form in which they were received.
million of the estimated 860 million hungry people worldwide on a $2.9 billion budget. With rising food and fuel costs, nearly 1 billion people now face hunger, and the WFP has been forced to increase its budget to $4.4 billion to reach 79 million people.
Over the years, many aids and assistance have been channelled to different
countries to help fight and reduce poverty, finance socio-economic crisis from the structural adjustment programme and privatisation of formally state owned enterprises. But where these funds have finally landed is only the Western friendly nations that can respond effectively to this question. In Africa and in most developing countries, a substantial portion of money income at public and household levels is repatriated annually by one way or the other back to Western countries. Astonishingly, poverty level is even high than it were before the mid 80s.
Due to lack of proper global supportive policies, structural adjustment programme
was never implemented in its fullest, liberalisation of the commodity sector is still a struggle between private and public sector; so are many other project funded from funds from donors agencies and bilateral and multilateral sources that their objectives were never realised and the physical fund can not be traced.
Therefore, the architects of globalisation have the responsibility to review
coherent policies and prescribed them to developing countries, policies that will enhance greater transparency, pro-development conditions linked to funding disbursement and stability in the global financial system.
Regional efforts to strengthen financial cooperation should not, however, pre-
empt multilateral efforts to strengthen the international financial system and its coherence with the international trading system. Successful regional financial cooperation among developing countries could be one of the building blocks of an improved international monetary system. International financial stability and crisis prevention is a precondition for development and sustainable growth.
Governments had to undertake fiscal reforms in order to adjust to lower income
from import taxes resulting from trade liberalization and in some cases to reduced social security contributions resulting from reforms of the social security system.
Privatization led to a reduction of fiscal revenue in a number of countries due to
incoherent policies formulation from global institutions. Governments from developing countries affected by these poor and repressive policies had to resort to high value-added tax and other indirect taxes on goods and services, taxes on income and profits as alternative sources of revenue that increased their share in total income.
The effects of these structural changes on fiscal balances and on the ability to
pursue active fiscal policies have been mixed. While fiscal administration improved in several countries, increased interest payments and the loss of fiscal income in many cases created serious problems for attaining the objective of fiscal equilibrium and compromised public investment. As a result, several governments are revising some of their previous choices, in particular those regarding taxation of firms exploiting natural resources like oil, timber etc. They are also re-thinking the question of the direct participation of the State in these activities in an attempt ease the enormous tax burden.
Disclaimer: The statements are made available by the UNCTAD secretariat in the language and form in which they were received.
Organization: Coordination des ONG Africaines des Droits de l’Homme (CONGAF) Contact: Mr. Djély Karifa SAMOURA
CP 127 ;1211 Geneva 20, Switzerland Tel: +41 78 610 13 48 Fax: +334 50 95 10 52 E-mail: [email protected]; [email protected] Mr. Claude CITON CP 127 ;1211 Geneva 20, Switzerland Tel: +41 78 610 13 48 Fax: +334 50 95 10 52 E-mail: [email protected] or [email protected] Mr. Jacques Rivkine Expert agroalimentaire CP 127 ;1211 Geneva 20, Switzerland Tel: +41 78 610 13 48 Fax: +334 50 95 10 52 Mobile: +4176 378 87 60 E-mail: [email protected] or [email protected]
Theme Addressed: The global food crisis: addressing a systemic failure in development
Input:
1. La CONGAF a noté que la Conférence d'Accra – CNUCED XII - a envisagé la
crise alimentaire qui en Avril 2008 ébranla les consciences et les fondations sociales et fatale à des vies humaines dans un certain nombre de pays.
2. Elle note également que la CNUCED a commencé à étudier des mesures pour y
remédier. Elle a aussi pris connaissance du Policy Brief que la CNUCED a publié en juin 2008. Ce document propose notamment de concevoir un mélange approprié d'actions en faveur à la fois des cultures d'exportation et des cultures vivrières.
3. Cependant cela ne modifie pas la perception très répandue que l'accent mis
depuis deux décennies ou plus sur les exportations pour réaliser les objectifs du développement avait trop amené à négliger les cultures vivrières, avec les effets négatifs et désastreux que l'on constate à présent sur l'alimentation des populations des pays en développement. Il est notoire que cet accent sur les exportations reflétait surtout une priorité accordée par les institutions financières internationales, à commencer par le FMI et la Banque mondiale, sur l'obtention de devises pour rembourser les dettes des pays en développement. Cette politique est souvent aujourd'hui jugée hâtive et néfaste notamment pour l'alimentation des pays les plus pauvres, et en définitive pour le développement.
4. D'ailleurs les conférences tenues sur la dette ont dégagé des vues plus
nuancées et plus partagées sur la question. Dette ou Julu, ne signifie rien

Disclaimer: The statements are made available by the UNCTAD secretariat in the language and form in which they were received.
d’autre, chez les peuples madingues de l’Afrique de l’ouest, que « la corde », c’est-à-dire la corde au cou dans leurs réalités quotidiennes. De sorte que de fortes critiques ont fusé même dans les milieux dirigeants des pays développés. Ainsi l'ancien premier ministre français Michel Rocard a été jusqu'à qualifier la politique de développement qui privilégie les exportations de ces pays depuis quelques décennies de "folie furieuse".
5. Par ailleurs il est admis dans les milieux internationaux que la crise alimentaire
qui a pris de l'ampleur en 2008 compromettrait la réalisation des objectifs de développement du millénaire, notamment en ce qui concerne la lutte contre la pauvreté.
6. Certes des efforts ont commencé à être faits et vont continuer pour accroître
l'approvisionnement alimentaire des pays qui connaissent une crise. Des mesures sont actuellement étudiées en ce sens au Sommet du G8 qui se tient actuellement au Japon. Mais d’autres Sommets (les P7 ou les 7 pays les plus pauvres de la planète, ou le Sommet des Pauvres à Bamako) sont organisés pour mettre en lumière le déficit de solidarité et le besoin toujours plus accru de conquêtes de matières premières des pays en voie de développement, etc. En outre des changements dans les politiques générales sont préconisés, en faveur des cultures vivrières - par exemple dans le Policy Brief de la CNUCED déjà mentionné.
7. A cela la CONGAF souhaite cependant ajouter quelques considérations inspirées
par son expérience du terrain. En tant que coordination d'organisations africaines de la société civile elle déplore que l'on ne tienne pas davantage compte de ce que font déjà les peuples africains pour assurer leur nutrition, y compris grâce à des modèles et à des savoirs anciens de culture et de commerce qui font en somme partie de leur patrimoine ; modèles et savoirs qui sont perpétués à ce jour et qui sont le principal facteur en ce qui concerne l'alimentation des peuples. Ceci malgré les importations de denrées du type « riz blanc ou cassé ».
8. Certes il est utile et louable d'apporter des livraisons d'aliments de base à des
populations aujourd'hui en crise, comme le fait notamment le Programme Alimentaire Mondial (PAM) avec beaucoup de responsabilité et d’humanité. Mais il faut aussi tenir compte des ressources qui existent déjà dans les pays, et qui appellent des efforts pour les renforcer.
9. La CONGAF souhaite en particulier que la CNUCED entre dans ce genre d'action
qui est en réalité une voie salvatrice, qui n'a pas été prioritaire pour elle ces dernières années, et qu'elle a même pu juger extérieure de son mandat. Elle propose donc les lignes d'action suivante, qu'elle développera lors des prochaines réunions depuis celles de la société civile accréditée jusqu'à celles du Conseil du commerce et du développement. La CONGAF souhaite collaborer avec les services de la CNUCED qui oeuvrent déjà en ce sens.
Disclaimer: The statements are made available by the UNCTAD secretariat in the language and form in which they were received.
A. L'insertion accrue dans les activités de la CNUCED du soutien aux productions vivrières en tant que facteur essentiel du développement, ainsi qu'au commerce traditionnel qui permet la distribution de ces productions; qui est parfois international, mais surtout national et sous régional. Ce sont ces productions et ce commerce qui au fil du temps et à ce jour permettent à des populations pauvres de se nourrir. Un soutien éclairé permettrait de les développer à un moment où cela est stratégique, et contribuerait beaucoup à éviter des désastres qui sont déjà redoutés.
B. Une meilleure compréhension des savoirs traditionnels et locaux, des
mécanismes locaux d'entraide, ainsi que l'accès à des financements solidaires qui ont déjà une place importante dans les sociétés. Il faudrait aussi étudier comment ajouter à ces méthodes traditionnelles, dans les meilleures conditions, des intrants et des outils nouveaux qui apporteraient un élément de modernisme judicieux.
C. La lutte contre les déperditions de nourriture qui sont notoires et
aisément observables sur le terrain, dues à des moyens de conservation insuffisants et au manque de transports sur les marchés des productions vivrières, dans certains cas avec des moyens simples ou grâce à une meilleure prévision, et dans d'autres cas avec des moyens technologiques nouveaux. Cela peut sembler relever plutôt du mandat de la FAO, mais la CNUCED a aussi un rôle à jouer au titre du développement et surtout du commerce. D'ailleurs certains de ses services ont déjà des activités qui vont en ce sens.
La société civile, et notamment la société civile africaine souhaite pouvoir apporter une collaboration à la fois réaliste et précieuse. Nous allons donc présenter des exposés plus détaillés sur ces questions, ou pouvoir les résumer lors des réunions de la CNUCED à son intention et à celle de ses Etats membres. Nous souhaitons qu'ils retiennent l'attention.
Disclaimer: The statements are made available by the UNCTAD secretariat in the language and form in which they were received.
Organization: Collectif des femmes pour la Protection de l’Enfant et de l’Environnement (COFEPRE) Contact: Ms. Dora (NGO NDJENG) SENDE
159, Impasse des Avocats, Face à l’ancienne Poste de Bonanjo, BP 462 Douala, Cameroon Tel : +237 33 04 13 68 Fax : +237 33 39 03 34 E-mail: [email protected]
Theme Addressed: The global food crisis: addressing a systemic failure in development
Input: STRATEGIES GLOBALES d’ERADICATION DE LA CRISE ALIMENTAIRE
POUR UN DEVELOPPEMENT DURABLE CONTEXTE ET JUSTIFICATIF Le système économique actuel qui a remplacé les valeurs universelles par les lois du marché a tendance à rendre vulnérable tout processus pouvant être mis en place pour affronter la crise alimentaire qui frappe le monde en général et l’Afrique en particulier. Nous sommes face à une situation qui interpelle les consciences parce que de dizaines de milliers d’êtres humains meurent de faim tous les jours et jusqu’alors il n’a pas été possible d’adopter des mesures nécessaires pour éradiquer le phénomène de crise alimentaire qui est un génocide silencieux. Pendant que des centaines de milliers d’êtres humains souffrent et meurent de la faim et des pays industrialisés dépensent pour des armements et pour la sécurité internationale. Face à cette « pandémie » alimentaire, il devient urgent et impératif que les Etats membres s’attellent à identifier des mesures d’urgence pour lutter contre cette catastrophe humanitaire qui menace le monde au même titre que le VIH/SIDA. Il est donc nécessaire que les prix baissent et la sécurité alimentaire soit renforcée car 60% de produits agricoles constituent l’élément essentiel de base de survie des populations vulnérables. La communauté internationale doit plus s’investir dans la production agricole. Au Cameroun, par exemple, à peine 3,8% du budget national est destiné à l’agriculture et au développement rural malgré son engagement à MAPUTO aux côtés des autres pays africains à consacrer 10% de son budget à l’agriculture d’où une différence de 6,2% ce qui est énorme ; il est à noter que les produits vivriers n’attirent point l’attention malgré des fonds nécessaires mis à disposition pour plusieurs projets agricoles. Partant de ce fait, si nous voulons atteindre les objectifs du millénaire d’ici à 2015, il est impératif qu’une stratégie globale soit apportée pour une réponse efficace à la crise alimentaire mondiale. L’une des stratégies serait d’abord de satisfaire les besoins humanitaires à l’immédiat, et pour un avenir sans crise, il faut offrir une garantir suffisante aux produits alimentaires pour une alimentation durable, La mise en place des règles justes et équitables en matière de commerce agricole international. Une autre stratégie qui n’est non négligeable, c’est la coopération multilatérale pour une meilleure éradication de la crise alimentaire.
Disclaimer: The statements are made available by the UNCTAD secretariat in the language and form in which they were received.
ROLE DE LA SOCIETE CIVILE L a Société Civile, consciente que la crise est réelle et frappe toutes les parties du monde, pense que les Etats et les Gouvernements doivent assumer leur rôle de régulateur dans la création des conditions favorables à l’accès à la nourriture et au renforcement des capacités de développement des populations, car l’accès à la nourriture est un droit pour les êtres humains. Les Etats membres et les Gouvernements devraient mettre une priorité absolue dans la création des infrastructures permettant l’évacuation des produits agricoles vers les métropoles. La Société Civile devrait veiller à la mise en œuvre, à l’exécution et engagements pris par des Etats membres et des Gouvernements des décisions et conventions signées. La Société Civile doit jouer un rôle de personnage de plaidoyer entre les organisations de producteurs et les Etats et Gouvernement par un échange d’information. Elle devrait accentuer les débats de rencontre d’échanges d’information sur la sécurité alimentaire en son sein, mener de campagne de mobilisation sociale en faveur de la lutte contre la faim et la pauvreté.
Disclaimer: The statements are made available by the UNCTAD secretariat in the language and form in which they were received.
Organization: Organisation Camerounaise de promotion de la Coopération Economique Internationale (OCAPROCE) Contact: Ms. Micheline MAKOU DJOUMA Coordinatrice Internationale
Case postale 40 CH.1211 Genève 20 CICG Tel : +41 78 893 1154 Fax : +41 22 301 20 00 E-mail: [email protected]
Theme Addressed: The global food crisis: addressing a systemic failure in development
Input: Monsieur le Président, Le récent échec des négociations de l’OMC qui ont eu lieu à Genève dans le cadre du cycle de Doha constitue un des aspects de la complexité des difficultés auxquelles sont confrontés les décideurs du monde, dans le cadre des politiques à mettre en œuvre en vue de l’éradication de la pauvreté ainsi que la recherche de solution idoine pour endiguer les crises rédhibitoires mais aussi et surtout celles liées à l’insécurité alimentaire. La recherche effrénée du profil n’est pas une solution à tous les problèmes économiques que nous rencontrons aujourd’hui, par conséquent le commerce à lui tout seul ne peut être la panacée du développement durable. Nous devons articuler les politiques globales du commerce avec celles des besoins d’épanouissement des populations qui, doit on le rappeler, sont des acteurs incontournables dans le marché des biens et des services commerciaux. Arrivera t-on à offrir cette opportunité d’échanges commerciaux aux agriculteurs mais également aux petits producteurs des pays pauvres ? La persistance des pays riches à subventionner encore leur agriculture met en exergue le double discours entre la situation de crise globale actuelle et les circonstances qui ont concourues à sa stridente acuité en terme de satisfaction en besoin humain : manger à sa faim. Y’aurait-il une volonté manifeste de parrainer l’étranglement économique et social des pays africains? Une politique de la mondialisation bien concertée ne pourrait qu’être bénéfique pour les pays en conséquence du fait qu’elle mettrait à l’abri de quelconques influences perverses à la libre circulation des biens et des services. En effet, pour OCAPROCE International, il me semble que les mentalités n’ont pas vraiment évolué pour laisser un véritable libre cours au jeu de l’offre et de la demande. J’entends bien par libre cours une absence totale d’influençable qui viserait à éviter des distorsions à desseins de priver de la profitabilité du commerce dans certaines localités du monde (l’Afrique SS). La crise alimentaire est le résultat de l’échec des politiques de développement qui ont été mises en œuvre pour favoriser l’essor économique et social des pays dits pauvres. Par rapport à cette crise, force est de souligner quelques points qui ont suscité l’inquiétude de l’OCAPROCE international :
• Baisse des stocks de produits de base (riz, blé, maïs…) • Hausse vertigineuse des coûts du pétrole • Surexploitation des ressources naturelles • Impact des changements climatiques
Disclaimer: The statements are made available by the UNCTAD secretariat in the language and form in which they were received.
• Utilisation des céréales comme biocarburants • Spéculation sur les marchés des matières première • Volatilités des Prix.
Les politiques du commerce et du développement durable ne devraient pas être un à-propos qui augmenterait la dépendance des pays en développement, particulièrement les pays de l’Afrique S.S. Au contraire elles devraient ouvrir la voie vers la résolution de la crise alimentaire que nous subissons de plein fouet. Si deux tiers des pays en développement sont importateurs alimentaires nets, il semble urgent de revoir les politiques de libéralisation par rapport à la sécurité et l’autosuffisance alimentaire. Une trop forte libéralisation des marchés agricoles dans les pays en développement sans aucune mesure d’accompagnement au niveau des propriétaires locaux de plantations en denrées alimentaires de ces pays. Les politiques du commerce et du développement pourront-ils limiter la volatilité au niveau des prix des denrées alimentaires ? Il semble tout à fait nécessaire de mener des accords d’investissements et de commerce qui promeuvent la mise en place de mesures réglementaires afin d’anticiper et de corriger d’éventuels effets de la volatilité des prix. Les gouvernements doivent développer des stratégies afin de s’assurer que les politiques commerciales intègrent les dimensions de la sécurité alimentaire et son corollaire. La gouvernance globale du commerce et du développement durable devrait s’atteler à limiter certaines règlementations en faveur de grandes multinationales dont les objectifs ne riment pas vraiment avec la protection de l’environnement encore moins le respect des Droits humains les plus élémentaires. Aujourd’hui force est de constater que certaines grandes industries agroalimentaires détiennent une position dominante en termes de pouvoir d’influence sur les marchés. Cette augmentation de leur pouvoir d’influencer sur les marchés des matières premières continue de se faire au détriment des petits producteurs locaux des pays en développement, particulièrement les pays de l’Afrique Sub-saharienne. C’est la raison pour laquelle il nous semble tout à fait important de mettre en place des mesures hardies de surveillance des propensions spéculatives d’investissements de certaines entreprises sur les marchés alimentaires. Les gouvernements doivent prendre toutefois des mesures urgentes en vue de la protection de l’environnement au regard du changement climatique et météorologiques qui, du reste contribuent encore à la désorganisation des cycles de production agricole. Parallèlement, il y’a lieu de ne ménager aucun effort afin de freiner la pollution et réduire l’exploitation abusive de ressources naturelles au regard de la Convention des Nations Unies sur les changements climatiques. La hausse des prix du baril du pétrole vient saborder cet équilibre instable. Les prix du pétrole ont augmenté de 74% et ils sont au moins cinq fois supérieurs au prix moyen des 100 dernières années. Ces hausses du prix du baril contribuent à augmenter les coûts de production des produits agricoles par le biais de l’utilisation de produit dérivés pétroliers dans l’industrie agricole : engrais, pesticides, pompes d’irrigation, machine agricole et transport… Ce qui entraîne de toute évidence une répercussion directe des hausses sur les denrées alimentaires. Pour réglementer ces question OCAPROCE propose que les gouvernements, les ONG, la Société civile, le secteur privé et les oligopoles du pétrole fessent amorcer de véritables concertations dans le but de corriger les distorsions sur le marché de l’or noir. Parallèlement des réglementations doivent être prises en compte dans le cadre de l’utilisation de biocarburants au détriment des besoins alimentaires des populations qui par ailleurs engendrent des conflits meurtriers (SOUDAN, Inde..) pour l’exploitation de l’eau et des surfaces à emblaver.
Disclaimer: The statements are made available by the UNCTAD secretariat in the language and form in which they were received.
Les politiques du commerce et du développement agricole doivent se fixer comme première priorité de garantir un approvisionnement stable et diversifiés des besoins alimentaires humain. En somme les politiques qui ont été élaborées ne mettent pas assez les priorités sur les solutions à la question alimentaire mondiale. Cette situation est d’autant plus éprouvante dans les pays appauvris par le système global du commerce ; où les populations croupissent dans la misère. Par rapport à toutes ces questions brûlantes nous entendons exhorter les pouvoir publics locaux à savoir les gouvernements ; au renforcement de la sécurité alimentaire globale et locale. Les gouvernements ont besoin d’outils qui permettraient de protéger le système local d’importations alimentaires subventionnés. Les règles de commerce multilatéral devraient mettre l’accent sur les moyens à mettre en œuvre afin de ne pas nuire à la sécurité alimentaire et les moyens d’existence d’autres pays. Les gouvernements devraient être en mesure d’utiliser le commerce comme un outil et non pas comme un ersatz pour investir sur les marchés locaux. La production locale et l’emploi sont indispensables pour le développement et la valorisation des ressources humaines locales. Dans les pays en voie de développement les gouvernements doivent s’atteler à la reformulation de politiques agricoles locales et régionales conséquentes afin de procéder au décollage économique, car sans une autosuffisance alimentaire, aucun développement durable n’est possible. Pour apporter des solutions à la volatilité des prix de produits alimentaires et agricoles, les gouvernements doivent rétablir les réserves de semences et de stocks de céréales aux niveaux national et régional. Ces réserves peuvent quelques part oblitérer la volatilité des prix et l’insécurité alimentaire. Aborder la question de volatilité suppose la planification internationale des actions pour gérer l’offre. Une meilleure implication des marchés mondiaux des matières premières garantirait sans commune mesure des partenariats justes et équitables à l’échelle des producteurs, des offres plus fiables et de meilleures qualités des biens agricoles au bénéfice des consommateurs. Les constitutions de stock de manière transparente désappointeront les velléités à la rétention et à la spéculation sur les marchés des matières premières. La question reste entièrement ouverte sur les voies et moyens à mettre en œuvre en vue de la stabilisation des prix des matières premières. Nous devons certainement créer de nouvelles règles du jeu de la concurrence mondiale afin de réduire l’immense pouvoir détenu par un petit nombre d’entreprises transnationales dans le marché des matières premières et des denrées alimentaires. Il nous semble incontournable de réglementer la capacité d’influence voire de nuisances de ces entreprises multinationales de l’agroalimentaires sur les marchés des denrées alimentaires et des matières premières. Des règles du jeu doivent être éditées, à l’instar d’un code de conduite mais également de normes ardues et adaptées à leurs rôles et à leurs responsabilités sociales en tant qu’entreprises. Afin de pallier à l’inefficience concurrentielle sur les plans locaux régionaux et internationaux, de telles mesures pourraient certainement atténuer voire empêcher les multinationales d’abuser de leurs pouvoirs sur le marché.

Disclaimer: The statements are made available by the UNCTAD secretariat in the language and form in which they were received.
Organization: Village Suisse ONG (VSONG) Contact: Mr. Adalbert Nouga Administrateur Fondateur
1 bis chemin des palettes, Case Postale 820 1212 Genève-Lancy 1 Tel : +41 79 680 96 24 Fax : +41 0848 048 001 E-mail: [email protected] or [email protected] Web: www.villagesuisseong.org
Theme Addressed: The global food crisis: addressing a systemic failure in development
Input: LA CRISE ALIMENTAIRE MONDIALE SOUS LE SIGNE DE L’INEFFICACITE DES STRATEGIES DU DEVELOPPMENT DANS UN MONDE DE GLOBALISATION. Au nom de Village Suisse ONG, Organisation non gouvernementale ayant un statut consultatif général à la CNUCED, permettez-moi de vous adresser du fond du cœur tous nos sincères remerciements pour nous avoir permis de prendre part à cette importante audience de la Société Civile avec le Conseil du Commerce et du Développement réunis à ce jour en sa 55ème Session au Palais des Nations Unies à Genève. Permettez moi aussi de féliciter l’excellent choix des thèmes qui nous ont été proposés pour en faire un débat de haut niveau avec vous. En ma qualité d’ acteur de la société civile , il va sans dire que Village Suisse ONG dont j’ai la charge, a l’immense plaisir de traiter le thème No1 du présent Hearing with civil society. Ce thème concerne « la Crise alimentaire mondiale vue sous le signe de l’inefficacité des stratégies du développement dans un monde de globalisation.. » En effet, l’actuelle crise alimentaire mondiale nous permet de discuter des problèmes du Commerce et des capacités productives pour la réalisation des objectifs internationaux du développement y compris les objectifs du Millénaire pour le développement. Elle nous permet aussi d’analyser les interdépendances qui y sont attachées notamment la mobilisation des ressources pour le développement-les prix des produits de base, les capacités productives, offre et distribution au niveau national, régional et international. Monsieur Le Président, la crise alimentaire mondiale que nous vivons maintenant nous permet enfin de nous pencher sur le développement économique en Afrique avec des problèmes liés à la libéralisation du commerce et aux résultats à l’exportation dans les pays africains. Ceci dit, et à notre humble avis, la problématique de l’actuelle crise alimentaire internationale soulève à nos yeux, le problème de l’inefficacité des stratégies du développement dans le domaine de l’Agriculture à l’échelon national , régional et international. Les traditionnelles politiques agricoles qui je les reconnais volontiers ont fait leur preuve en son temps, ne suffisent plus aujourd’hui à créer des mécanismes de commerce, de financement et de production agricole acceptable par tous à l’échelon mondial. Dès lors, il nous faut opérer des changements dans la mise en route des nouvelles stratégies de
Disclaimer: The statements are made available by the UNCTAD secretariat in the language and form in which they were received.
développement en utilisant les nouvelles connaissances qui sont mises à notre disposition grâce à l’utilisation des nouvelles technologies de l’information et de la communication.(TIC). L’Accès aux connaissances pour tous, facilite la réalisation des objectifs du Millénaire à tous les niveaux et notamment dans le domaine de l’agriculture, du commerce des produits alimentaire, de l’utilisation de l’eau, de la prévision des changement climatique, de la fixation des produits de denrées alimentaires, de l’analyse des besoins réels des populations concernées, tant au niveau national , régional , et international. On le voit bien , l’utilisation des technologies nouvelles combinées avec les anciennes méthodes traditionnelles permettent de jeter ainsi les fondements d’une croissance économique rigoureuse et du développement durable dans tous les domaines liés à la réalisation nd es objectifs du Millénaire. 2) Monsieur le Président, la crise alimentaire que nous vivons actuellement dans les pays en développement est une réelle menace de la prospérité dans les pays en développement .C’est une véritable menace de la prospérité dans le monde entier et cela pour la simple raison que notre monde est devenu un Village planétaire . Grâce à l’utilisation des technologies de l’information et de communication (TIC), tout ce qui se passe de bien ou de mal dans notre monde actuel est vu par des millions et des millions d’êtres humains. Ceci dit, aucun pays ne peut prétendre résoudre à lui tout seul une crise internationale du genre de l’actuelle crise alimentaire mondiale . D’où il nous faut envisager de mettre sur place des nouvelles stratégies du développement nous permettant de mieux atteindre les objectifs du Millénaire(ODM) définis au SMSI Genève2003-Tunis 2005. Pour mémoire , je rappelle que ces ODM sont au nombre de huit et je peux énumérer entre autres : 1/ Réduction de l’extrême pauvreté et de la faim 2/Assurer l’éducation primaire pour Tous 3/Promouvoir l’égalité des sexe et l’autonomisation des femmes 4/Réduire la mortalité infantile 5/ Améliorer la santé maternelle 6/Combattre le VIH/SIDA , le paludisme et les autres maladies 7/Assurer un environnement durable 8/ Mettre en place un partenariat mondial pour le développement Si on ne la résout pas , elle va empêcher la réalisation des objectifs du millénaires pour le développement non seulement pour les pays de la faim , mais aussi dans les pays où les gens ne meurent pas encore de faim , mais où la misère commence à s’installer petit -à- petit si on en croit les symptômes que l’on voit aujourd’hui et qui résume pour l’essentiel à l’existence du chômage, à la malnutrition, au manque de logement décent, des maladies, de l’extrême pauvreté,de la mortalité infantile,de la mal-gouvernance de la criminalité rampante, dans les zones urbaines et les banlieues . etc. A Village Suisse ONG , nous pensons que l’accès aux connaissances et surtout au partage des connaissances dans le domaine de l’Agriculture grâce à l’utilisation des TIC au niveau national , régional et international, permettra de résoudre plus facilement la
Disclaimer: The statements are made available by the UNCTAD secretariat in the language and form in which they were received.
crise alimentaire actuelle . des études montrent avec l’usage des nouvelles technologies , une autre agriculture est possible. Selon le professeur Jean Ziegler rapport des nations Unies à la FAO, la production agricole actuelle peut nourrir le double de la population mondiale soit 12 milliards de personnes. En Afrique par exemple, l’utilisation des nouvelles technologies permet de mieux produire et mieux gérer de l’eau.( Etude de la DDC, berne 2008) Dès lors, pour atteindre les objectifs du Millénaires que l’on s’est fixé au SMSI Genève 2003- Tunis 2005, les nouvelles stratégies du commerce et du développement doivent être conçue non pas seulement au niveau international, mais elles doivent prendre en compte les besoins réels des pays, et des régions des utilisateurs concernés. A quoi çà sert de cultiver uniquement du café dans un pays qui n’en a besoin que pour la consommation de ses partenaires étrangers, et non pour sa consommation intérieure. ? Au lieu de cultiver les cultures vivrières qui sont sensées nourrir la population et répondre à un besoin vital d’alimentation nationale, à quoi ça sert d’importer les denrées alimentaires trop coûteuses pour la consommation locale ?A notre avis la crise alimentaire mondiale actuelle montre vraiment l’inefficacité des politiques agricoles qui ne tiennent pas compte des besoins réels des populations concernées notamment au niveau de la production, de la distribution de la commercialisation que des échanges des connaissances et des expériences entres les différents acteurs concernés dans les filières agricoles et industrie agro-alimentaires. 3) L’ état actuel des connaissances traditionnelles qui ont fait leur preuve et l’utilisation des nouvelles connaissances issues des nouvelles technologies de l’information et de la communication permet de lutter plus rapidement contre la pauvreté dans le monde et de faire face à la crise alimentaire dans le court terme, le moyen terme et voire à long terme. Dans le court terme: - Il faut faire face aux besoins alimentaires d’urgence résultant de la hausse mondiale des cours des denrées alimentaires et prévenir ainsi la malnutrition qui peut provoquer de graves agitations politiques - En Afrique il faut encourager les gouvernements à doubler les rendements agricoles afin de dynamiser la croissance économique et combattre la faim dans la réalisation des Programme de développement de la ‘agriculture intégré en Afrique (PIDAA) - Encourager les gouvernements à mettre sur pied des programmes d’alimentation scolaire au plan national d’abord grâce à la production des denrées alimentaires issu du terroir national., objectif réduire la malnutrition à l’échelon national. - Encourager la formation des experts nationaux et des cerveaux dans le domaine agricole (ingénieurs agronomes) qui pourront échanger leurs connaissances du terrain avec d’autres ingénieurs agronomes des autres pays. - Encourager l’accès aux connaissances aux femmes dans le milieu rural et former les femmes à la prise des pouvoirs à l’intérieur de la Nation. - Encourager la formation des populations locales aux techniques de l’approvisionnement en eaux dans les campagnes et dans les quartiers pauvres . - Mieux prendre en compte les besoins réels des pays en développement afin de renforcer la cohérence de l’action des Nations Unies dans la réponse à la crise alimentaire.

Disclaimer: The statements are made available by the UNCTAD secretariat in the language and form in which they were received.
Pour vaincre la misère et la pauvreté, il faut associer tout le monde à la lutte contre la misère à l’échelon national, régional et international. Nous sommes tous les humains, personne n’est née pour être pauvre ou malheureux, Ensemble nous devons nous entraider, échanger nos connaissances humaines pour mieux réaliser les objectifs du Millénaires afin de mieux lutter contre la pauvreté et contre la faim. Monsieur le Président, je vous remercie du fond du cœur. =================================================================== (Documentation :1/Note du secrétariat de la CNUCED, TDB 55ème Session, Genève 2008 2/ Réaliser les OMD pour le Développement en Afrique, (Groupe de pilotage CNCED juin 2008) 3/ Alimentation pour tous : l’agriculture au service de la sécurité alimentaire,Riz au quotidien (DDC 2008) 4/Changement climatiques, environnement et alimentation pour tous ( Programme DDC, Berne 2008) 5/ programme alimentaire mondial des nations Unies (PAM) 6/ Recommandations du groupe de pilotage pour la réalisation des objectifs du Millénaire pour le développment en Afrique , Juin 2008 ===================================================================
Disclaimer: The statements are made available by the UNCTAD secretariat in the language and form in which they were received.
Organization: Rwanda Women's Network Contact:
Ms. Mary Balikungeri Kicukiro, Near World Food Program HQ House n° GSA/G 0545 PO Box 3157 Kigali Rwanda Tel: +250-58-36-62
In Switzerland Cell: +41 79 759 55 24 Tel: +41 22 340 0704 E-mail: [email protected] Web: www.rwandawomennetwork.org
Theme Addressed: The global food crisis: addressing a systemic failure in development
Input: The work of women in Africa is guided by the global strategy of ‘Rights to end poverty by 2005-2010’ that places Women’s rights as one of its key pillars. It spells out six themes for our engagement in tackling poverty. These themes focus on women’s rights, the right to education, the right to food, the right to human security in conflict and emergencies, the right to life and dignity in the face of HIV and AIDS, and the right to just and democratic governance. The Theme to address the global food crisis cannot ignore the global strategy which places the Women’s rights as one of its key pillars. It is widely acknowledged that improved women’s access to, control and ownership to land, natural and productive resources is a key factor in eradicating hunger and rural poverty. This has ben restated in several international frameworks. However there has not been a concerted international action to address the question of Women’s access, control and ownership of land, Natural and proactive resources in Africa. Why this Failure?????? The targets and goals are to eradicate hunger and achieve Food Security, this will not be attained unless Govts and International organizations take specific actions to end the persistent descrimination against women in matters of access to, ownership and control over land and natural resources in Africa, because women produce up to 80% of the food in developing countries and they are the majority affected by hunger. Is inst this a dilemma????? We are also aware that currently national land reform policies are heavily influenced by the World Bank which is promoting land, privatization and market based land reform, rather than state-led redistribution programmes for the poor. Is there a role for UNCTAD and its member states can apply in order to reverse this trend? Thank you.
Disclaimer: The statements are made available by the UNCTAD secretariat in the language and form in which they were received.
Organization: Cercle d'Initiative Commune pour la recherche, L'environnement et la Qualité (CICREQ) Contact: Guy Antoine DZE NGUESSE
Président BP 8636 DOUALA CAMEROUN Tel:+237 77697928 E-mail: [email protected], [email protected], [email protected]
Theme Addressed: The global food crisis: addressing a systemic failure in development
Input: La coopération multilatérale dans la production alimentaire
L’Afrique en générale et le Cameroun en particulier a une économie agricole à plus de 60%.
C’est dire que la structure économique de base de l’Afrique est essentiellement agricole. Il n’est pas normale que ce continent soit frappé de plein fouet par une crise alimentaire et économique sans précédent. Cela ne peut se justifier que par un déficit de politique agricole ; lequel ne s’explique pas uniquement par un manque relatif de volonté politique, mais surtout par un manque de moyen financier et technologique.
Il apparait donc nécessaire d’établir par le biais de la CNUCED, entre les Etats possédant et l’Afrique dont le potentiel naturel est avéré, une passerelle permettant à cette dernière d’accéder à des sources de financements disponibles chez les premiers, de telle sorte que l’aide qui en résulte ait pour finalité, non pas du poisson au pauvre, mais de l’amener à pêcher lui-même le poisson dans son propre fleuve.
ROLE DE LA CNUCED
Pour être plus concret : La CNUCED pourrait promouvoir dans les pays membres un fond de solidarité de fracture alimentaire destiné à financer tout Etat ou toute Organisation qui présenterait un programme de développement agricole ou innovateur ayant pour objectif de contribuer à l’autosuffisance et aux souverainetés alimentaires. ROLE DE LA COCIETE CIVILE
Dans ce contexte, la société civile pourrait jouer deux rôles déterminants :
• Un rôle de plaidoyer pour la création de ce fond multilatéral chargé d’appuyer
les initiatives. • Un rôle de suivi évaluation de l’action effective du fond sur le terrain
Disclaimer: The statements are made available by the UNCTAD secretariat in the language and form in which they were received.
A cet effet nous pensons que l’initiative prise à Accra lors de la CNUCED XII par les Organisations de la société civile Africaine pour la création d’une entité panafricaine de la société civile dénommée Organisation Panafricaine pour le Commerce et le Développement Durable (OPACEDD) devrait être encouragée par la CNUCED.
ROLE DU SECTEUR PRIVE Une fois que le processus est mis route, le secteur privé en deviendrait le principal bénéficiaire si les Etats mettaient en place une politique commerciale et fiscale favorable à l’investissement.
Cette stratégie aura pour conséquence d’attirer les investisseurs, de favoriser un commerce endogène entre les Etats Africains et une coopération multilatérale plus juste et qui profite à tous, mais surtout une production importante qui entrainerait la baisse des prix des denrées sur le marché et l’autosuffisance alimentaire dans les pays pauvres.
Disclaimer: The statements are made available by the UNCTAD secretariat in the language and form in which they were received.
Organization: United Youth Front International (UYFI)
Contact: Lauretta Okonkwo 102 BrickField Road, Ebute-Metta (West) 23401 Lagos, Nigeria Tel: +234 802 709 11 45 Fax: +234 154 500 26 E-mail: [email protected]
Theme Addressed: The global financial crisis and its impact on sustainable development
Input: Man's quest for an ever improved quality of life, coupled with their innate desire to leave a legacy that will remain in the reckoning long after the demise of it's founding father, are the underlying reasons for the establishment of such leading household name Corporation as General Motors, Ford Motors, Chrysler Motors, IBM, Sears and Roebucks, K-Mart Corporation, Cable News Network (CNN), Microsoft, Shell Petroleum, Mobil/Exxon, Chevron, Damier BENZ, Toyota, Mitsubishi, Peugeot, Honda, Daewoo, Volvo, and a host of others. Those drives, that spirit that propelled the founding fathers of these multinational organisations, can best be referred to as Spirit of Enterprise. Thus, nothing could be more devastating in one's lifetime than watch one's enterprise go down the drain.
In Nigeria, dating back to the colonial era, that spirit of enterprise propelled the Colonial masters to expand their business activities to our shores through the activities of such multinational trading conglomerates as U.A.C., A.G. Leventis, John Holt, etc. Their trading activities centered mostly around agricultural products/commodities such as - palm produce, timber, cocoa, cotton, rubber, groundnut, hides and skins, etc, which were shipped to their home countries as raw materials for their fledging industries. In return, the finished products were shipped back to us in form of clothing's shoes, tyres, cosmetics, butter, furniture, etc at considerably high cost compared to the price of the raw materials purchased from our shores. With the discovery of Oil in Nigeria by Shell B.P. in the Niger Delta in 1958, the trend continued with the influx of multinational Oil companies to exploit our crude oil which were shipped back to their home countries for use as fuel and feedstock for petrochemical products such as insecticides, aerosols, plastic products, etc, at prices considerably higher than those of crude oil taken from our shores. On attainment of independence in 1960 from Britain, the nation's founding fathers considered it quite expedient to marry our fledging political independence with considerable degree of economic independence, hence Government delved into the establishment of some State-owned enterprises across the nation.
The Oil boom era of the 1970's strengthened Federal Government's resolve to further compliment our political independence with economic independence as well, by using the gains from oil to embark upon aggressive/massive establishment of giant industrial complexes, in technical partnership with foreigners. This resulted in the birth of the various vehicle Assembly plants, Steel Rolling Mills, Paper Mills Oshogbo Machine Tools, Petroleum Refineries/Petrochemical plants, Banks, Insurance companies, Cement factories, Textile mills, just to mention a few. By the same token, the various State Governments followed the footstep of the Federal Government by establishing numerous State-Owned Enterprises ranging from Breweries, Hotels to Textiles factories etc.
The post civil war indigenisation decree of the Federal Government empowered Nigerian nationals to acquire substantial and in some cases the entire shares of foreign holdings in

Disclaimer: The statements are made available by the UNCTAD secretariat in the language and form in which they were received.
selected business enterprises. The purpose of these endearvours by the Government was to put our destiny in our own-hands and engender industrial culture among Nigerians, thereby stimulating economic growth by way of transfer of technology. The economic boom of that era gave rise to the popular "Udoji Award" which was a significant economic empowerment of the populace.
Towards the tail end of the 1970s however, the bubble began to burst, occasioned by monumental corruption in the award/execution of contracts in the new Federal Capital Abuja. All shades of emergency contractors sprang up in the quest for a piece of the action. Consequently, the age long culture of discipline, decorum, prudence, fair play, accountability and the fear of God suddenly gave way to a culture of greed/graft, opportunism and get-rich-quick syndrome in our entire body polity. Quite expectedly, as nothing last forever, the oil boom began to taper off and considering the culture of "squander mania" especially in the handling of projects in the new Federal Capital, the economy began to nose dive for the worst. The "Spirit of Enterprise" took a terrible beating and was relegated to the background. Welcome the new fads-Advanced fee Fraud (419) / scam, armed robbery in broad day light, smuggling across national borders, inflation of contract /10% syndrome, exam malpractice and other vices that guaranteed immediate wealth and success.
Persons in positions of trust and authority saw such exalted positions as license to loot public/corporate funds and a mass wealth of un-imaginable proportions. Government(s) establishing NGO's to showcase their corruptive and unpatriotic ability. Huge investments in numerous public and private enterprise went down the drain. Most of those that managed to stay afloat are presently in a state of coma and are either awaiting imminent revival or demise. As the economy went downhill, so did the image of the nation in the international arena, as a result of the prolonged political crisis, which did not help matters. Nevertheless, with the enthronement of democracy on the 29th May, 1999 and considering the determined efforts of new democratic government under the leadership of former President Olusegun Obasanjo to clean up the polity and revive the economy, there appears to be some ray of hope in the horizon. But, reviving the present comatose economy will no doubt require sustained spirit of co-operation and partnership between the public and the private sector. It will require something close to what former American President Franklin D. Roosevelt referred to as "New Deal", a massive social, political and economic programme aimed at revitalizing the American nation after the great depression, hence; the following question as- How then do we begin to re-establish and rekindle that age-long Spirit of Enterprise! How do we regain and restore the dignity of labour as we use to know in time past! How do we restore confidence in the management of public and private enterprises! How do we catch up technologically with such other medium powers as South Africa, India, South Korea, Brazil, Indonesia, Egypt, etc, most of who were developing their local technologies while we were busy running our economy aground and importing all manners of used items (tokumbo)!How can corporate organisations in partnership with Government contribute towards the funding of technology oriented research activities in designated centers of excellence in our Universities and other Research Institutes! What roles can the various professional bodies play toward reversing the nation's economic fortunes for the better! How does the quality of our management in both the public and private sectors measure against that of other nations in Africa and the rest of the World! What are the best strategies for attracting the much needed foreign investments! How does our balance of trade measure against our major trading partners in the absence of crude oil sales! How best can we optimize the benefit from our petroleum resources!
Is it more beneficial for us to continue exporting our crude oil to developed nations than expanding our petrochemical industries to process various petrochemical products for export to other nations of the world, considering the value added significance! How effective are the exiting environmental protection laws against the backdrop of gross industrial pollution nation/worldwide! Will President Olusegun Obasanjo's anti-corruption

Disclaimer: The statements are made available by the UNCTAD secretariat in the language and form in which they were received.
bill be effective enough to drastically reduce the chronic corruption and back-door syndrome in business transactions both in the public and private sectors in Nigeria! It is only when these and many more issues are critically examined and addressed that a new economic rebirth can be achieved and full employment ensured, not only for Nigeria but Africa and the rest of the world.
If we take a look at Africa as a whole, the natural resources are surplus, technology is fast growing. What then is holding the continent back? Today, the industrialized world is spending over US$600billion a year on defense and US$300billion on agricultural subsidies. United States of America is accused of protecting its agriculture and steel, refusing to import food and resources from poor countries. The Digital Solidarity Fund-DSF, proposal for developing countries was rejected by United States, Canada, European Union etc. Chinese President Hu Jintao and the leaders of Brazil, India, Mexico and South Africa gathered in Sapporo, Japan, on 8 July 2008, where the five leaders issued a Political Declaration on issues including the world economy, food security, climate change, energy security and the UN Millennium Development Goals. The leaders recognise that the interrelationships of a global economic slowdown marked by financial uncertainty, the persistence of trade protectionist distortions, soaring food and oil prices, and the threats posed by climate change, add complexity to the current scenario. Poverty reduction can be achieved through growth and /or improved distribution. However, growth can lead to a decrease or increase in inequality. Thus, it may not translate into poverty reduction.
United Nations Conference on Trade and Development was established and first meeting in 1964 (Geneva) while UNCTADXII in 2008 (Ghana) but the way forward in ownership and accountability. Meanwhile, poverty and growth depend on the level and dynamics of inequality. This complex inter-relationship among growth, inequality and poverty is termed the Poverty-Growth-Inequality (PGI) triangle. We are all familiar with the idea that today we live in an age linked tightly together by trade in goods and services, migration and capital movements. When; however, did this age of globalisation begin? Is it only as recent as the internet and the new information technology? Once again, continents are being connected in a manner that threatens the living standards of substantial sections of their populations, in this case particularly less skilled workers in developed countries. History warns us that there is no guarantee of an absence of protectionist backlashes, or even of major armed conflicts and the extent of globalisation has historically been determined as much by geopolitical considerations as by anything else, and this will remain true in the future. Many policies, however; entails trade-off between goals and clashes of ideology can be caused by a lack of understanding of the very word – “Globalization”, and the forces of destructive competition engendered by today’s global free movement of capital (free trade). The regional trading blocs in “free trade” agreement such as APEC, EEC or NAFTA and presently-the EPA etc, which give greater access to imperialist nations and their multinationals; to exploit people as cheap labour.
The poverty of large parts of the world can be alleviated through freedom to travel and to trade and to this end are committed to the further opening of western markets for products from the developing world. But a social market economy has to be accompanied by democratic institutions. Development finance can only help reduce poverty if the recipient government institutions adopt practices of good governance including full transparency and accountability based on the rule of law.
Disclaimer: The statements are made available by the UNCTAD secretariat in the language and form in which they were received.
Democratic governance today remains essentially national whilst business and markets have already become truly global. Nevertheless, democratic governance urgently needs to catch up and to operate at the global level. At a minimum, negotiators should agree to steps; to open their market by reducing agricultural subsidies; to ensuring that essential medicines reach people in need; curtailing tariff peaks on industrial products, where developing countries often have comparative advantage. Governments to re-examine the growth-oriented policies related to industry, trade, market and consumerism in terms of their social and environmental cost. Unite in non-violent strategies to confront and transform powerful institutions of oppression and drawing up legislation on investment policy that promote indigenous ownership towards a fairer world. Thank you.
Disclaimer: The statements are made available by the UNCTAD secretariat in the language and form in which they were received.
Organization: Synergie Développement et Partenariat International SY.DE.P.I /SY.F.O.D.I.P
Contact: Dr. Alpha Ayande
30 A rte de Soral 1232 Confignon Tel: +41 22 757 21 10 Fax: +41 22 757 20 56 Cell: +41 79 358 26 12 E-mail: [email protected] Website: www.sydepi.org
Theme Addressed: The global financial crisis and its impact on sustainable development
Input: Pourquoi la crise financière a connu cette amplitude sans précédent ? Une crise d’une telle ampleur ainsi que les forces qui ont concouru à son avènement étaient-elles prévisibles ? À ce jour Les institutions financières internationales tentent de briser une spirale que certains estiment aux plus graves des tragédies dans les annales financières. Que s’est-il passé ? Pourquoi cette crise ? Comment est-elle née, dans le mirage d'une mondialisation " créatrice" de " richesses " et grosse consommatrice de liquidités ? Comment assurer le retour à la confiance, pour un début de retour à la sagesse ? Est-il encore opportun de mettre en place des politiques de promotion du développement durable ? Serait-on proche du point de rupture, menacée par la croissance, la surpopulation et les désastres écologiques ? Entre 1971 et 2008, l’économie mondiale a enregistré pas moins de vingt quatre crises financières, soit en moyenne une toutes les années et demie. Même si les banques fournissent les crédits nécessaires à la croissance des économies ; faudrait-il trouver des moyens d’empêcher les défaillances des banques afin de limiter leurs prises de risques exagérées ? Faits essentiels. Des banques en faillite ou qui récusent de se prêter de l'argent entre elles parce qu'elles ont peur de ne pas le recouvrer. C’est aussi la raréfaction de l’emploi. Des marchés boursiers chaque jour plus volatils et le plus souvent à la baisse. Tout au début de la crise, à l'été 2007, la Bourse de Paris a fléchi de plus de 30 % et celle de New York de 15 %. Un dollar qui s'effondre, et ses principaux concurrents : euro, yuan, yen, qui battent des records à la hausse entraînant la déroute financière. Les prix de l'or et de certaines matières premières s'envolent en se muant ainsi en valeurs- refuges. Les mécanismes du capitalisme financier sont-elles en adéquation avec certaines valeurs éthiques pour un développement durable global ? En tout état de cause, les méthodes utilisées sont très sophistiquées et suscitent plus d’interrogations que de réponses aux problèmes économiques. Pour comprendre ces méthodes à l'origine de la crise financière, il faut revenir au phénomène des "produits dérivés" et de la "titrisation"dont une des manifestations les plus évidentes a été le moment où certaines banques américaines ont transformé les crédits immobiliers à risques en produits financiers. Voici comment les dérives d'une technique sophistiquée ont perturbé le système bancaire, les marchés et menacent toute l'économie mondiale. En somme, ces modèles mathématiques si sophistiqués soient-ils ; ne tiennent pas assez en compte un certain nombre de variables de l’économie réelle ; ce qui du reste les rendent incapables de prévoir et d’anticiper les crises financières. Faut-il mettre en place des structures plus coercitives pour une gouvernance financière globale adaptée ? Il est urgent d’instaurer un dialogue fécond et constituer un comité mondial pour le suivi des conséquences liées à ces crises cumulées ; afin d’apporter des réponses pertinentes sur les modèles de fonctionnement des marchés. Nous sommes

Disclaimer: The statements are made available by the UNCTAD secretariat in the language and form in which they were received.
persuadés que cette crise financière n'est pas le fruit d’un hasard. Elle n'était pas impossible à prévoir, comme le prétendent aujourd'hui certains experts de la politique, de l’économie et de la finance. La crise symbolise de fait l'échec de marchés peu ou mal régulés et elle nous montre une fois de plus que ceux-ci ne sont pas capables d'autorégulation. Il semble tout à fait opportun de mettre en place des mesures qui visent à contrer certaines dérives du capitalisme financier, mêmes si celle-ci paraît très complexes à instaurer. Si des instruments d’analyses techniques quantitatifs et sophistiqués existent, il y a lieu de les mettre au service de préoccupations humanitaires tout en créant parallèlement des relations d’osmose entre le capitalisme financier et la régulation. Car l’autorégulation comme base fondamentale de l’équilibre des marchés donne les résultats que l’on connaît actuellement. D’où l’importance de mettre des garde-fous puissants pour réglementer ces marchés en tenant compte d’une certaine dimension de libre concurrence et de flexibilité du marché. L’acuité de la crise globale caractérisé par sa concomitance sur les niveaux financiers, monétaires, économiques, alimentaires, énergétiques et écologiques exige à l’heure actuelle d’accroître en tout point de vue un plus grand contrôle sur ces marchés financiers. Même si la croissance mondiale semble se rétablir en 2008, la question reste entièrement ouverte pour ce qui concerne son envergure et les réelles conséquences de la crise globale sur la vie des individus. En revanche une croissance toujours plus forte tel qu’il est proposé par certains spécialistes, conduit à une impasse. À l’exemple des flambées récentes du prix du baril de pétrole dont nous ne savons pas si vraiment si elle s’est estompée ou pas ? Ses impacts sur le sort des nations sont certains et bien ressentis. À l’image du sculpteur qui tente de façonner son œuvre lorsque qu’il s’aperçoit que sa sculpture, c’est lui-même et qu’il ne pourra dresser les contours de son ouvrage sans se faire mal : le monde devrait imaginer d’autres modes de survie afin de ne pas compromettre l’existence de la race humaine considérée ici dans toute sa diversité. Nous devons élaborer des plans de développement intégrant de manière plus concise la dimension globale. La concertation doit être ouverte afin d’exhorter les pays riches à mettre en place des politiques visant à consacrer 1 à 2 % de leur revenu à l’effort de lutte contre ces immenses calamités qui séviront si le dialogue de sourd est maintenu. Par ailleurs, Les pays riches se sont engagés en 1970, devant l'ONU, à consacrer 0,7 % de leur PNB à l'aide publique au développement. Nous restons sceptiques quant à la réalisation de cet objectif au regard de la conjoncture actuelle ? Respecteront-ils leurs engagements ? Quelques questions sans réponses, mais solvables à la condition d’une volonté politique sans faille. Les principales contraintes physiques auxquelles nous sommes confrontés sont : l’eau, l'habitat, l'énergie, les émissions de dioxyde de carbone, la pêche, etc.… Et ces problèmes, même s’ils n’ont pas été énumérés ici de manière exhaustive ; demeurent solvables si nous nous donnons la volonté politique. Malheureusement, les gouvernements soutiennent-ils suffisamment ces initiatives de résolution des problèmes globaux agricoles, industriels, démographiques et environnementaux. Ou bien le réel pouvoir de décisions des politiques a-t-il été dérobé par les entreprises transnationales ? Si la population mondiale continue à croître comme le préconisent certaines prévisions, nous serons près de 12 milliards en 2050. Et si nos industries poursuivent leur production de la même façon, la concentration de dioxyde de carbone dans l'atmosphère aura doublé à cette date : devrons-nous déjà imaginer un tel scénario ? la croissance analysée de manière quantitative ne garantit pas une amélioration du sort des populations ; pire encore elle peut être accompagnée d’un accroissement de la pauvreté et des inégalités mais aussi de l’exploitation des catégories les plus vulnérables, de la diminution des libertés politiques et d’atteintes à l’environnement. Le développement durable devrait être un processus participatif qui favoriserait la redistribution des richesses, la mise en œuvre de réformes agraires et la généralisation de l’éducation et de la formation.
Disclaimer: The statements are made available by the UNCTAD secretariat in the language and form in which they were received.
Certaines mesures à prendre devraient s’articuler autour de : • La promotion des investissements dans les pays les plus pauvres, • La transparence et l’augmentation des coûts de la prise de risques des banques, • La mise en place d’institutions de contrôle adapté et de réglementation financière
plus stricte, • La mise en place de politique efficace et concertée en faveur de la protection de
l’environnement, • La mise en place de nouvelles règles d’exploitations des ressources
énergétiques, • L’aplatissement des politiques protectionnistes et de subvention des produits
agricoles, • La limitation de la commercialisation du bioéthanol, • La constitution de stocks de céréales pour les besoins alimentaires des uns et
des autres, • La nécessité de développer des sources d'énergie alternative, • La mise en place des structures régionales économiques et politiques fortes
capables de soutenir le développement agricole et l’autosuffisance alimentaire en Afrique,
• La mise en place d’un fonds d’investissement par le biais des fonds transférés par les migrants,
• L’assurance de l’approvisionnement en eau et en nourriture,
L’anticipation de l'augmentation globale de la population et de ses conséquences pour les plus pauvres des pauvres.
Disclaimer: The statements are made available by the UNCTAD secretariat in the language and form in which they were received.
Organization: CUTS International Contact: Atul Kaushik
Director CUTS Geneva Resource Centre 37-39, Rue de Vermont 1202 Geneva Switzerland Ph: +41.22.734.6080-82 Fax:+41.22.734.3914 Mob. +41-78 769 8551 E-mail: [email protected] CUTS International D-217, Bhaskar Marg Bani Park Jaipur 302 016, India Ph: 91.141.228 2821 Mob: 91.99296 49122 Fax: 91.141.228 2485 E-mail: [email protected]
Theme Addressed: The global food crisis: addressing a systemic failure in development Input: World Food Price Increase Where Does the Buck Stop?

Disclaimer: The statements are made available by the UNCTAD secretariat in the language and form in which they were received.
World Food Price Increase Where Does the Buck Stop?
Siddhartha Mitra
Director (Research), CUTS International
Abstract This paper tries to ascertain the crop specific causes for the recent global food price rise. This is an effort to not only identify specific causes for each crop but also to determine their geographic origins. The reasons for price rise vary from crop to crop – for wheat these were the crop failures in United States, Australia and Canada in various years and the slow growth in productivity, which led to production falling behind consumption at the beginning of the twenty first century, abetted by the rapid population growth and increase in per capita consumption in the African continent; for rice population growth in India was an abetting factor but it was the dramatic rice crop failure in the same country in 2002 which drove stocks to new lows that was the precipitating factor; for corn the gap between consumption and production at the beginning of this century and massive increases in per capita overall consumption of corn in the United States attributable to biofuel production were the main reasons; in the case of soybean the reasons were the massive increase in Chinese demand for soybean oil and soybean meal (the latter resulting from a rapid increase in demand for meat) attributable to that country’s rapid economic development and changing tastes.
Disclaimer: The statements are made available by the UNCTAD secretariat in the language and form in which they were received.
Introduction A continuous increase in food prices over the last couple of years has debilitated the world economy, plunging millions into hunger and starvation and prompting social disturbances and food riots in many countries. Academic or policy oriented studies have come up with a menu of factors which have probably contributed to this state of affairs – increases in demand prompted by economic and population growth, supply decreases caused by climate change and more temporary negative supply shocks in the form of droughts in different countries of the world, the fossil fuel crisis and the resulting resort to land intensive biofuels, etc.1 Whereas the menu looks comprehensive neither the relative importance of the various listed factors nor their geographic origin has been determined through rigorous or convincing studies. From here on government spokesmen have taken over to absolve their own countries of any blame and shift the burden of guilt to other countries. An unproductive blame game is in full swing instead of the meeting of minds needed to sort out the world’s food problems. This paper makes an effort to identify crop specific causes of price rise as well as their geographic origin. It must be pointed out here that price data are deceptive. Nominal price increases over time are nothing unexpected i.e. as incomes rise one would expect prices to rise too as a result of increasing purchasing power. It is only when the increase in prices of food items exceeds the rate of increase of the general price level significantly or when the rate of inflation itself is unexpectedly large is there any reason to be worried about the price rise. Thus, a general phenomenon of nominal price rise across a large number of agricultural commodities might mask the incidence of a malaise that might be specific to just a few crops. Thus, it is important to check whether the real price i.e. the nominal or current dollar price adjusted by the price index has actually risen sharply. Theoretical economics is always based on assumptions. Before using it as a tool or lens to examine reality it is essential to verify the applicability or validity of these assumptions. For example, much of the debate about the world food price surge has assumed that this problem is an outcome of shortages. However there are other factors which can result in a price increase without there being any food shortage – export bans, speculation and hoarding by private companies, governments building up buffer stocks etc. There is also the possibility that the story of price rise is different across crops i.e. for some crops the reason indeed may be a shortage whereas for others it might be any of the other outlined factors. Therefore, an important hypothesis that should be tested for any given crop exhibiting a significant real price rise is whether this rise is due to scarcity. If the above hypothesis is indeed true for a given crop then we can attribute the global shortage causing the price surge to the agricultural supply and demand situations in different countries. The technique used in this paper is to pin down the source of such shortage by identifying the major exporters and consumers of each crop, then focus on those which have exhibited a sharp decline/increase in exports/consumption and in the end try to find out the reason for such decline/increase. Due to the lack of availability of sufficient data, we have restricted our study to 4 major crops – wheat, rice, soybean and corn. The period of analysis is 2000-07 for which there is complete data. The data used for this paper is based on a compilation by Shoichi Ito2 from diverse sources such as the U.S. Bureau of Census (International Database) and US Department of Agriculture (PS&D Online).
1 For a comprehensive review of these causes and their theoretical underpinnings look at CUTS briefing paper, “The Saga of Rising Food Prices,” http://www.cuts-citee.org/pdf/BP08-DI-5.pdf. 2 Shoichi Ito is Professor, Department of Agricultural and Resource Economics, Faculty of Agriculture, Kyushu University. The data is available at http://worldfood.apionet.or.jp/index-e.html (accessed during 15th to 24th June, 2008).

Disclaimer: The statements are made available by the UNCTAD secretariat in the language and form in which they were received.
Immediate Causes of the World Food Price Crisis In the case of wheat the real price rise took place from 2006 onwards. The ending stocks in 2006 were 21mn tonnes lower than that in 2005. A reduction in cropped area in the U.S coupled with a bad crop was responsible for exports from that country declining by 3mn tonnes from the 2005 level (see Table A1 in the appendix). In Australia there was a major crop failure and exports declined by 7.5mn tonnes (Table A1). In all, the total amount traded in the world market declined by around 6mn tonnes or 5.2 percent. Wheat being an essential commodity, the real price in terms of 2008 dollars rose from $168.35 per tonne to $205.18. 2007 saw no pick up in exports and stocks declined further. The reasons were a second poor crop in Australia, leading to an export decline from that country by a further 1 million tonnes and a level of exports which was around 9mn tonnes less than its usual levels; a crop failure in Canada accompanied by a decline in harvested area led to a decrease in its exports by 4.5mn tonnes. Even a production revival in the United States and a massive increase its exports could not shore up world trade. Thus, prices increased by around 25 percent from $205.18 to $265.67.
Table 1: Wheat – World Production, Trade and Stocks
Source: http://worldfood.apionet.or.jp/
In the case of rice the story is similar but slightly more complicated. 2002 saw a sudden dip in world production levels by around 20mn tonnes or about 5 percent. The main reason for this was a reduction in production by around 22mn tonnes in India (see Table A2 in appendix) – a major crop failure saw the area harvested and yield decline by 10 percent each. World rice stocks in the world reached new lows at 81mn tonnes by 2003; the panic that this probably caused led to a rise in rice prices. In 2008 dollars, prices increased by around $47 per tonne from 2003 to 2004; with stocks declining further to 73.11mn tonnes in 2004, prices rose by another $36 per tonne from 2004 to 2005 (Table 3). In the next few years (2005 -2007) stocks remained almost stagnant at around 75mn tonnes while consumption climbed steadily by around 5mn tonnes every year. This level was a far cry from the levels of 133mn tonnes enjoyed in 2001; comfort levels were low and prices were bid up steadily from $ 318 to $ 346.
Year
Nominal price($/Tone)
Real price ($/Tonne) in terms of 2008 dollars
Ending Stocks (million tonnes)
Production (million tonnes)
Exports million tonnes)
Consumption (million tonnes)
2001 126.80 154.56 203.36 583.1 105.7 587.8
2002 148.53 178.20 166.9 568.7 105.6 604.2
2003 146.14 171.39 132.09 553.8 108.6 580.8
2004 156.88 179.56 150.87 625.7 110.8 605.5
2005 152.44 168.35 147.02 620.9 116.3 618.5
2006 191.72 205.18 126.63 596.0 110.7 618.1
2007 255.20 265.67 115.1 610.8 110.7 619.7
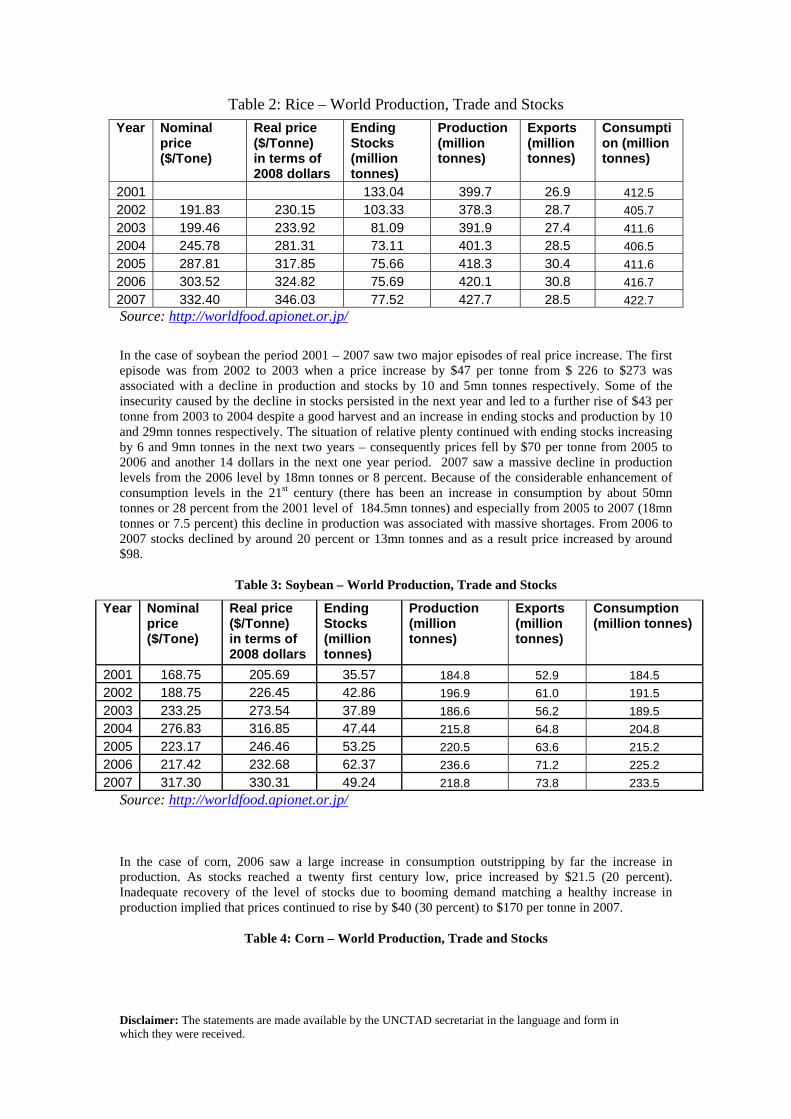
Disclaimer: The statements are made available by the UNCTAD secretariat in the language and form in which they were received.
Table 2: Rice – World Production, Trade and Stocks
Source: http://worldfood.apionet.or.jp/
In the case of soybean the period 2001 – 2007 saw two major episodes of real price increase. The first episode was from 2002 to 2003 when a price increase by $47 per tonne from $ 226 to $273 was associated with a decline in production and stocks by 10 and 5mn tonnes respectively. Some of the insecurity caused by the decline in stocks persisted in the next year and led to a further rise of $43 per tonne from 2003 to 2004 despite a good harvest and an increase in ending stocks and production by 10 and 29mn tonnes respectively. The situation of relative plenty continued with ending stocks increasing by 6 and 9mn tonnes in the next two years – consequently prices fell by $70 per tonne from 2005 to 2006 and another 14 dollars in the next one year period. 2007 saw a massive decline in production levels from the 2006 level by 18mn tonnes or 8 percent. Because of the considerable enhancement of consumption levels in the 21st century (there has been an increase in consumption by about 50mn tonnes or 28 percent from the 2001 level of 184.5mn tonnes) and especially from 2005 to 2007 (18mn tonnes or 7.5 percent) this decline in production was associated with massive shortages. From 2006 to 2007 stocks declined by around 20 percent or 13mn tonnes and as a result price increased by around $98.
Table 3: Soybean – World Production, Trade and Stocks
Source: http://worldfood.apionet.or.jp/
In the case of corn, 2006 saw a large increase in consumption outstripping by far the increase in production. As stocks reached a twenty first century low, price increased by $21.5 (20 percent). Inadequate recovery of the level of stocks due to booming demand matching a healthy increase in production implied that prices continued to rise by $40 (30 percent) to $170 per tonne in 2007.
Table 4: Corn – World Production, Trade and Stocks
Year Nominal price ($/Tone)
Real price ($/Tonne) in terms of 2008 dollars
Ending Stocks (million tonnes)
Production (million tonnes)
Exports (million tonnes)
Consumption (million tonnes)
2001 133.04 399.7 26.9 412.5
2002 191.83 230.15 103.33 378.3 28.7 405.7
2003 199.46 233.92 81.09 391.9 27.4 411.6
2004 245.78 281.31 73.11 401.3 28.5 406.5
2005 287.81 317.85 75.66 418.3 30.4 411.6
2006 303.52 324.82 75.69 420.1 30.8 416.7
2007 332.40 346.03 77.52 427.7 28.5 422.7
Year Nominal price ($/Tone)
Real price ($/Tonne) in terms of 2008 dollars
Ending Stocks (million tonnes)
Production (million tonnes)
Exports (million tonnes)
Consumption (million tonnes)
2001 168.75 205.69 35.57 184.8 52.9 184.5
2002 188.75 226.45 42.86 196.9 61.0 191.5
2003 233.25 273.54 37.89 186.6 56.2 189.5
2004 276.83 316.85 47.44 215.8 64.8 204.8
2005 223.17 246.46 53.25 220.5 63.6 215.2
2006 217.42 232.68 62.37 236.6 71.2 225.2
2007 317.30 330.31 49.24 218.8 73.8 233.5
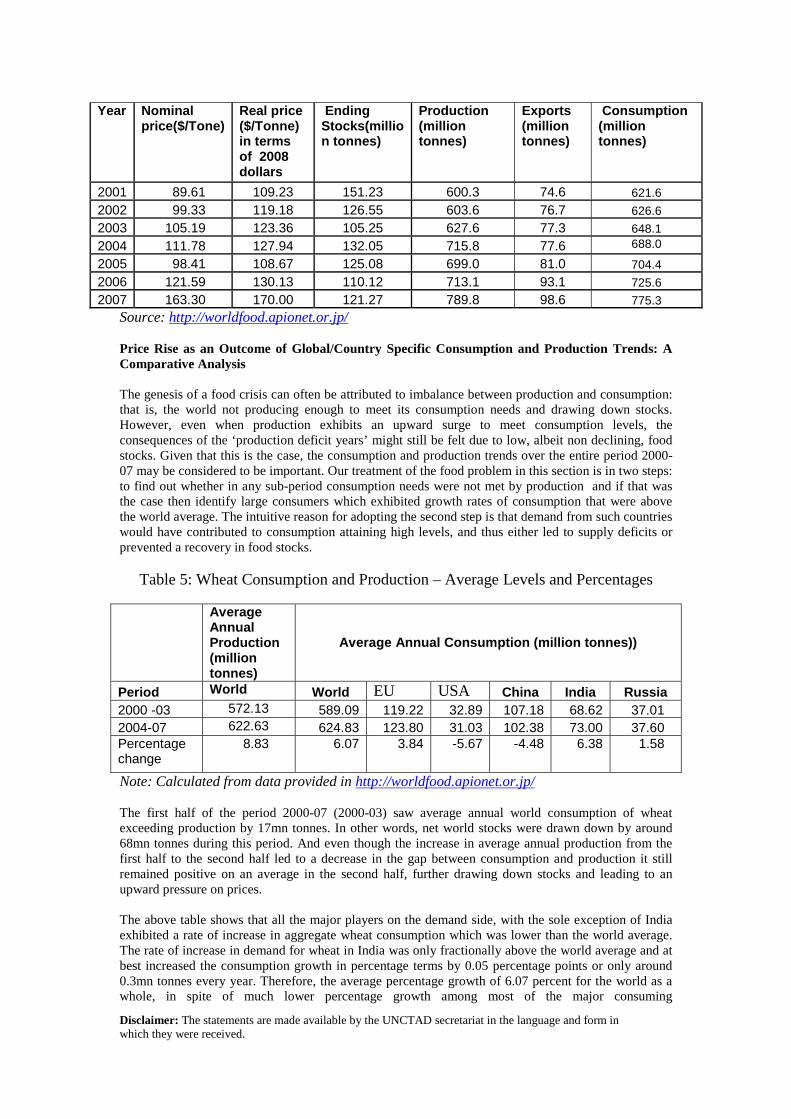
Disclaimer: The statements are made available by the UNCTAD secretariat in the language and form in which they were received.
Source: http://worldfood.apionet.or.jp/
Price Rise as an Outcome of Global/Country Specific Consumption and Production Trends: A Comparative Analysis The genesis of a food crisis can often be attributed to imbalance between production and consumption: that is, the world not producing enough to meet its consumption needs and drawing down stocks. However, even when production exhibits an upward surge to meet consumption levels, the consequences of the ‘production deficit years’ might still be felt due to low, albeit non declining, food stocks. Given that this is the case, the consumption and production trends over the entire period 2000-07 may be considered to be important. Our treatment of the food problem in this section is in two steps: to find out whether in any sub-period consumption needs were not met by production and if that was the case then identify large consumers which exhibited growth rates of consumption that were above the world average. The intuitive reason for adopting the second step is that demand from such countries would have contributed to consumption attaining high levels, and thus either led to supply deficits or prevented a recovery in food stocks.
Table 5: Wheat Consumption and Production – Average Levels and Percentages
Average Annual Production (million tonnes)
Average Annual Consumption (million tonnes))
Period World World EU USA China India Russia 2000 -03 572.13 589.09 119.22 32.89 107.18 68.62 37.01 2004-07 622.63 624.83 123.80 31.03 102.38 73.00 37.60 Percentage change
8.83 6.07 3.84 -5.67 -4.48 6.38 1.58
Note: Calculated from data provided in http://worldfood.apionet.or.jp/ The first half of the period 2000-07 (2000-03) saw average annual world consumption of wheat exceeding production by 17mn tonnes. In other words, net world stocks were drawn down by around 68mn tonnes during this period. And even though the increase in average annual production from the first half to the second half led to a decrease in the gap between consumption and production it still remained positive on an average in the second half, further drawing down stocks and leading to an upward pressure on prices. The above table shows that all the major players on the demand side, with the sole exception of India exhibited a rate of increase in aggregate wheat consumption which was lower than the world average. The rate of increase in demand for wheat in India was only fractionally above the world average and at best increased the consumption growth in percentage terms by 0.05 percentage points or only around 0.3mn tonnes every year. Therefore, the average percentage growth of 6.07 percent for the world as a whole, in spite of much lower percentage growth among most of the major consuming
Year Nominal price($/Tone)
Real price ($/Tonne) in terms of 2008 dollars
Ending Stocks(million tonnes)
Production (million tonnes)
Exports (million tonnes)
Consumption (million tonnes)
2001 89.61 109.23 151.23 600.3 74.6 621.6
2002 99.33 119.18 126.55 603.6 76.7 626.6
2003 105.19 123.36 105.25 627.6 77.3 648.1
2004 111.78 127.94 132.05 715.8 77.6 688.0
2005 98.41 108.67 125.08 699.0 81.0 704.4
2006 121.59 130.13 110.12 713.1 93.1 725.6
2007 163.30 170.00 121.27 789.8 98.6 775.3

Disclaimer: The statements are made available by the UNCTAD secretariat in the language and form in which they were received.
countries/regions (EU, USA, China and Russia) and growth only very marginally above the average in India, can be attributed to the aggregate effect of much larger growth among the other consumers of wheat. Foremost among these other consumers were African countries. The percentage growth of consumption of wheat in the African continent between the two mentioned periods was 20.67 percent and was driven by a growth in per capita consumption of wheat which was around 0.6 kgs per annum and a rate of population growth which was 2.2 percent per annum. In the case of rice even though world production grew at a higher rate than world consumption (the percentage growth is defined in this case as the percentage difference in the annual averages of 2000-03 and 2004-07), for the period 2000-03 world consumption remained higher than world demand leading to a depletion of stocks (Table 6). The pick up in world production in the second period was not high enough to counteract the severe depletion of stocks in the first period. The fact that the world consumption continued to grow from 2000-03 to 2004-07, though by only 3.3 percent, made matters worse as the effect of gains in production was whittled down. This growth was spearheaded by India whose rate of growth of consumption was 4.69 percent and thus helped to pull the average up because of the country’s large population. In fact India saw a massive depletion in its rice stocks in the twenty first century – from 25mn tonnes to 8.5mn tonnes in 2004. There has been a very slight increase in stocks in recent years but not large enough for the fear of stocks running out to subside. In 2007 rice stocks attained their highest level after 2004 but even that was 13mn tonnes, much lower than that in 2000. Thus, India imposed a ban on non-basmati rice exports in 2007 and basmati rice exports in 2008.3 Exports from India fell by 3mn tonnes in 2007 – quite a significant fall in a world market where the total amount traded on the international market varies between 27 and 30mn tonnes. Consequently prices rose.
Table 6: Rice Consumption and Production – Average Levels and Percentages
Average Annual Production (million tonnes)
Average Annual Consumption (million tonnes))
Period World World India China Vietnam 2000-03 392.20 405.76 82.27 134.65 17.64 2004-07 424.38 419.26 86.12 128.21 18.52 Percentage change
8.21 3.3 4.69 -4.78 4.96
Note: Calculated from data provided in http://worldfood.apionet.or.jp/ The demand for soybean is derived from the demand for the two joint products obtained from processing this oilseed – soybean oil and soybean meal.4 Soybean oil production increased at a rate from the first to the second period which was slightly higher than that for production. Similarly, in both periods the average level of consumption was slightly higher than that of production. But these small differences in averages meant that any cyclical downturns in production saw a depletion of stocks which led to an increase in prices. The percentage growth of consumption was extremely high at 20.92 percent (Table 7). Pulling it up were extremely high growth rates of consumption in India (32.52 percent) and China (56.42 percent). In India around 7 percentage points out of the total growth of 32.52 percent could be accounted for by population growth – the rest to economic development and a change in tastes. In China population growth only accounted for 2.5 percentage points. The rest could be attributed to economic development and changes in preferences. Given the low base level of Indian consumption, its increase from the first to the second period was less than 3 percent of the average world demand for the first period. The Chinese impact was much 3 For a discussion on ban on rice exports look at Subramanian K. (June 14, 2008), “The Politics of Rice,” The Hindu Business Line 4 For a good exposition of related issues look at Bennet, David ( February 5, 2003), “World soybean consumption quickens,” http://southeastfarmpress.com/mag/farming_world_soybean_consumption/ (accessed on 25th June, 2008)
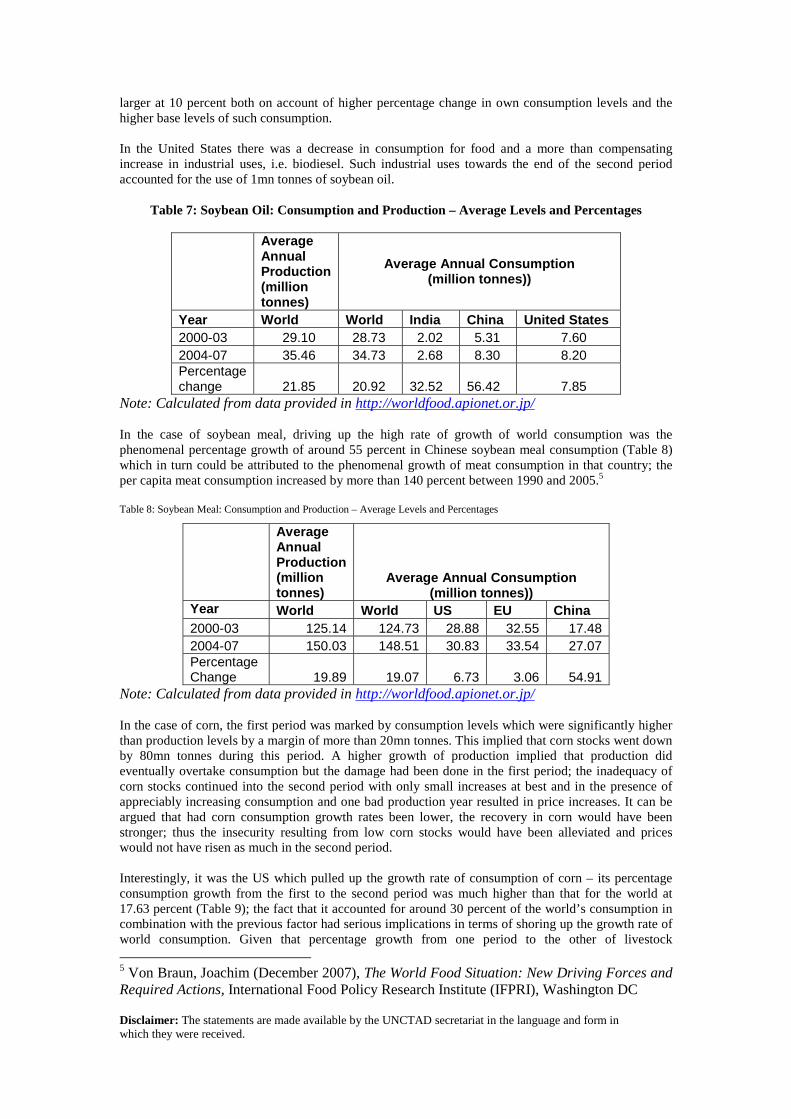
Disclaimer: The statements are made available by the UNCTAD secretariat in the language and form in which they were received.
larger at 10 percent both on account of higher percentage change in own consumption levels and the higher base levels of such consumption. In the United States there was a decrease in consumption for food and a more than compensating increase in industrial uses, i.e. biodiesel. Such industrial uses towards the end of the second period accounted for the use of 1mn tonnes of soybean oil.
Table 7: Soybean Oil: Consumption and Production – Average Levels and Percentages
Average Annual Production (million tonnes)
Average Annual Consumption (million tonnes))
Year World World India China United States 2000-03 29.10 28.73 2.02 5.31 7.60 2004-07 35.46 34.73 2.68 8.30 8.20 Percentage change 21.85 20.92 32.52 56.42 7.85
Note: Calculated from data provided in http://worldfood.apionet.or.jp/ In the case of soybean meal, driving up the high rate of growth of world consumption was the phenomenal percentage growth of around 55 percent in Chinese soybean meal consumption (Table 8) which in turn could be attributed to the phenomenal growth of meat consumption in that country; the per capita meat consumption increased by more than 140 percent between 1990 and 2005.5 Table 8: Soybean Meal: Consumption and Production – Average Levels and Percentages
Average Annual Production (million tonnes)
Average Annual Consumption (million tonnes))
Year World World US EU China 2000-03 125.14 124.73 28.88 32.55 17.48 2004-07 150.03 148.51 30.83 33.54 27.07 Percentage Change 19.89 19.07 6.73 3.06 54.91
Note: Calculated from data provided in http://worldfood.apionet.or.jp/ In the case of corn, the first period was marked by consumption levels which were significantly higher than production levels by a margin of more than 20mn tonnes. This implied that corn stocks went down by 80mn tonnes during this period. A higher growth of production implied that production did eventually overtake consumption but the damage had been done in the first period; the inadequacy of corn stocks continued into the second period with only small increases at best and in the presence of appreciably increasing consumption and one bad production year resulted in price increases. It can be argued that had corn consumption growth rates been lower, the recovery in corn would have been stronger; thus the insecurity resulting from low corn stocks would have been alleviated and prices would not have risen as much in the second period. Interestingly, it was the US which pulled up the growth rate of consumption of corn – its percentage consumption growth from the first to the second period was much higher than that for the world at 17.63 percent (Table 9); the fact that it accounted for around 30 percent of the world’s consumption in combination with the previous factor had serious implications in terms of shoring up the growth rate of world consumption. Given that percentage growth from one period to the other of livestock 5 Von Braun, Joachim (December 2007), The World Food Situation: New Driving Forces and Required Actions, International Food Policy Research Institute (IFPRI), Washington DC

Disclaimer: The statements are made available by the UNCTAD secretariat in the language and form in which they were received.
consumption of corn in the US was just 4.2 percent it can be concluded that much of the increase in consumption was due to the use of corn for production of bio fuel, population growth being just about 3.5 percent and the chances of per capita food consumption rising significantly in a developed country being very low for a staple food. In fact average annual per capita consumption of corn in the US (food plus non-food) increased by as much as 90 kilos between the two periods.
Table 9: Corn: Consumption and Production – Average Levels and Percentages
Average Annual Production (million tonnes)
Average Annual Consumption (million tonnes))
World World US South
America China EU 2000-03 605.58 626.14 202.86 51.04 124.41 56.68 2004-07 729.43 723.30 238.62 61.24 140.50 62.20 Percentage Change 20.45 15.52 17.63 19.97 12.93 9.73
Note: Calculated from data provided in http://worldfood.apionet.or.jp/ Conclusions Though all four crops studied here – wheat, rice, soybean and corn – were characterised by a sharp rise in real prices (nominal prices deflated by the general price level) the reasons for the price rise varied from crop to crop. In the case of wheat one of the main reasons was that consumption had gone ahead of production by the beginning of the twenty first century. Stagnation in yields is one important reason for this state. Consequently, stocks were down and led to a rise in prices. The price rise was exacerbated by the crop failures in the US in 2006, Australia in 2006 and 2007 and another noticeable fall in production in Canada in 2007. Much of the increase in consumption was attributable to rapid population growth in Africa accompanied by an increase in per capita consumption led by economic development and a change in tastes. In the case of rice a crop failure in India in 2002 caused a major jolt to the international market as it reduced production in India by 22mn tonnes and thus brought down its food stocks; the effect of this was felt much later as India’s food stocks failed to recover and the country had to force its exports down by banning exports of non-basmati rice and later even basmati rice. The lack of recovery of food stocks in India can also be attributed to population growth and the resulting increases in rice demand even though Indian per capita consumption of rice fell over the period 2000-07. In the case of corn there were no major crop failures but a rise in consumption at a very rapid rate prevented healthy increases in production from overwhelming the stock effects of consumption being in excess of production at the beginning of the twenty first century. This rapid increase in consumption was caused by a massive increase in per capita consumption levels in the United States attributable neither to an increase in livestock consumption nor consumption as staple food, especially as the US is a developed country where consumption of staples per capita is not expected to rise significantly as per Engel’s law. Thus, it seems that the major reason for the increase in corn consumption was industrial production i.e. biofuel generation. In the case of soybean it was a combination of occasional production reverses and a very sharp increase in consumption throughout which resulted in stocks reaching low levels in the last few years resulting in price increases. The increase in consumption demand arose from the sharp rise in demand for the two products derived from soybeans – soybean oil and soybean meal. Most of the increase in demand for both soybean meal and soybean oil came from China; in the case of soybean oil the factors which contributed to a rapid increase in Chinese demand were economic development and a change in tastes. In the case of soybean meal the Chinese demand increased due to an increase in the demand for meat consumption that accompanied its rapid economic development.

Disclaimer: The statements are made available by the UNCTAD secretariat in the language and form in which they were received.
Thus to summarise, the reasons for price rise varied from crop to crop – for wheat these were the crop failures in United States, Australia and Canada in various years and the slow growth in productivity, which led to production falling behind consumption at the beginning of the twenty first century, abetted by the rapid population growth and increase in per capita consumption in the African continent; for rice population growth in India was an abetting factor but it was the dramatic rice crop failure in the same country in 2002 which drove stocks to new lows that was the precipitating factor; for corn the gap between consumption and production at the beginning of this century and massive increases in per capita overall consumption of corn in the United States attributable to biofuel production were the main reasons; in the case of soybean the reasons were the massive increase in Chinese demand for soybean oil and soybean meal (the latter resulting from a rapid increase in demand for meat consumption) attributable to that country’s rapid economic development and changing tastes. How can the world rid itself of this price surge? The simple answer is to reduce demand and increase supply. One major component of a demand reduction strategy consists of disabling the trade-off between food and biofuel supply. The development of second generation biofuels may act as a facilitator in this regard as these would not only economise on the use of material inputs but would also utilise waste matter not used for human consumption. One contentious way of increasing supply would be the doing away of land retirement subsidies by the Western world or the drawing down of strategic food stocks maintained by developed countries. Given that the likelihood of such solutions appears bleak, developing countries might have to seek yield increases through tried and trusted means – crop research, better farm extension services, more extensive irrigation coverage and facilitation of greater access to modern inputs.

Disclaimer: The statements are made available by the UNCTAD secretariat in the language and form in which they were received.
Table A1: Wheat Country Specific Production, Trade and Production Profiles
Year Area
Harvested (1000ha)
Yield (ton/ha)
Production (1000ton)
TOTAL Export
(1000ton)
TOTAL Import
(1000ton)
TOTAL Consumption
(1000ton)
Consumption for food
and others (1000ton)
Feed Consumption
(1000ton)
Ending Stocks
(1000ton)
Population (million)
Per capita total
consumption (kg/capita)
USA
2000 21474 2.82 60641 28904 2445 36184 28008 8176 23846 282.3 128.2 2001 19616 2.7 53001 26190 2927 32434 27481 4953 21150 285 113.8 2002 18544 2.36 43705 23139 2106 30448 27298 3150 13374 287.7 105.8 2003 21474 2.97 63814 31524 1715 32507 26986 5521 14872 290.3 112 2004 20234 2.9 58738 29009 1921 31823 26868 4955 14699 293 108.6 2005 20283 2.82 57280 27291 2214 31357 27010 4347 15545 295.7 106 2006 18943 2.6 49316 24729 3317 31035 27742 3293 12414 298.4 104 2007 20644 2.72 56247 34428 2585 29892 28259 1633 6926 301.1 99.3 2008 22768 2.91 66184 27216 2722 35353 28413 6940 13263 303.8 116.4
EU
2000 26471 4.98 131697 15675 3536 118354 62027 56327 17483 377.7 313.3 2001 25929 4.76 123353 12751 8720 118456 61950 56506 18349 378.8 312.7 2002 26419 5.02 132579 18132 10686 124991 64990 60001 18491 379.8 329.1 2003 24318 4.55 110578 9834 7374 115095 62650 52445 11514 380.7 302.3 2004 25996 5.65 146886 14745 7061 123220 64000 59220 27496 381.6 322.9 2005 25833 5.12 132356 15694 6758 127525 64550 62975 23391 382.4 333.5 2006 24440 5.11 124783 13873 5137 125500 65300 60200 13938 383.1 327.6 2007 24673 4.84 119481 9500 6500 118965 65300 53665 11454 383.7 310 2008 26591 5.26 140000 15000 5000 129000 66000 63000 12454 384.3 335.6
Australia
2000 12141 1.82 22108 15930 74 5328 2728 2600 5509 19.2 278 2001 11592 2.1 24299 16409 76 5427 2727 2700 8048 19.4 280.4 2002 11070 0.92 10132 9146 286 6125 2725 3400 3195 19.5 313.4 2003 13067 2 26132 18031 73 5925 2725 3200 5444 19.7 300.3 2004 13399 1.63 21905 14742 75 5900 2700 3200 6782 19.9 296.3 2005 12456 2.02 25173 16012 75 6400 2700 3700 9618 20.1 318.6 2006 11624 0.92 10641 8728 93 7400 2700 4700 4224 20.3 365.2 2007 12300 1.07 13100 7000 75 6200 2700 3500 4199 20.4 303.4 2008 13500 1.78 24000 15000 75 6200 2700 3500 7074 20.6 301
Canada
2000 10963 2.42 26519 17316 199 7043 4065 2978 9658 31.3 225.2 2001 10585 1.94 20568 16272 341 7746 4171 3575 6549 31.6 245.2 2002 8836 1.83 16198 9403 382 8001 4223 3778 5725 31.9 250.8 2003 10215 2.26 23049 15836 233 7186 4048 3138 5985 32.2 223.1 2004 9389 2.64 24796 14880 253 8232 4168 4064 7922 32.5 253.2 2005 9404 2.74 25748 16003 290 8319 4135 4184 9638 32.8 253.6 2006 9682 2.61 25265 19638 322 8738 4410 4328 6849 33.1 264 2007 8640 2.32 20050 15000 300 8000 5000 3000 4199 33.4 239.6 2008 10000 2.45 24500 16500 300 7700 5200 2500 4799 33.7 228.6
Argentina
2000 6408 2.53 16230 11272 7 4991 4909 82 589 37.5 133.1 2001 6825 2.27 15500 10075 12 4887 4802 85 1139 37.9 128.9 2002 5900 2.08 12300 6759 7 5157 5077 80 1530 38.3 134.5 2003 5700 2.54 14500 9407 4 5232 5152 80 1395 38.7 135.1 2004 6100 2.62 16000 11834 2 5010 4930 80 553 39.1 128 2005 5000 2.9 14500 9563 10 5000 4920 80 500 39.5 126.5 2006 5285 2.88 15200 10500 5 4900 4820 80 305 39.9 122.7 2007 5600 2.86 16000 10000 5 5430 5350 80 880 40.3 134.7 2008 5100 2.84 14500 9500 5 5480 5400 80 405 40.7 134.7
China
2000 26650 3.74 99640 623 195 110278 100278 10000 91877 1268.9 86.9 2001 24640 3.81 93873 1512 1092 108742 99742 9000 76588 1276.9 85.2 2002 23910 3.78 90290 1718 418 105200 98700 6500 60378 1284.3 81.9 2003 22000 3.93 86490 2824 3749 104500 98500 6000 43293 1291.5 80.9 2004 21626 4.25 91950 1171 6747 102000 98000 4000 38819 1298.8 78.5 2005 22792 4.28 97450 1397 1018 101500 98000 3500 34390 1306.3 77.7 2006 22960 4.72 108470 2783 380 102000 98000 4000 38457 1314 77.6 2007 23100 4.76 109860 2700 200 104000 98000 6000 41817 1321.9 78.7 2008 23400 4.87 114000 2000 30 107000 98000 9000 46847 1330 80
India
2000 27486 2.78 76369 1569 441 66821 66321 500 21500 1004.1 66.5 2001 25700 2.71 69680 3087 32 65125 64625 500 23000 1022 63.7 2002 25900 2.77 71810 4850 34 74294 73694 600 15700 1039.7 71.5 2003 24860 2.62 65100 5650 8 68258 67658 600 6900 1057.5 64.5
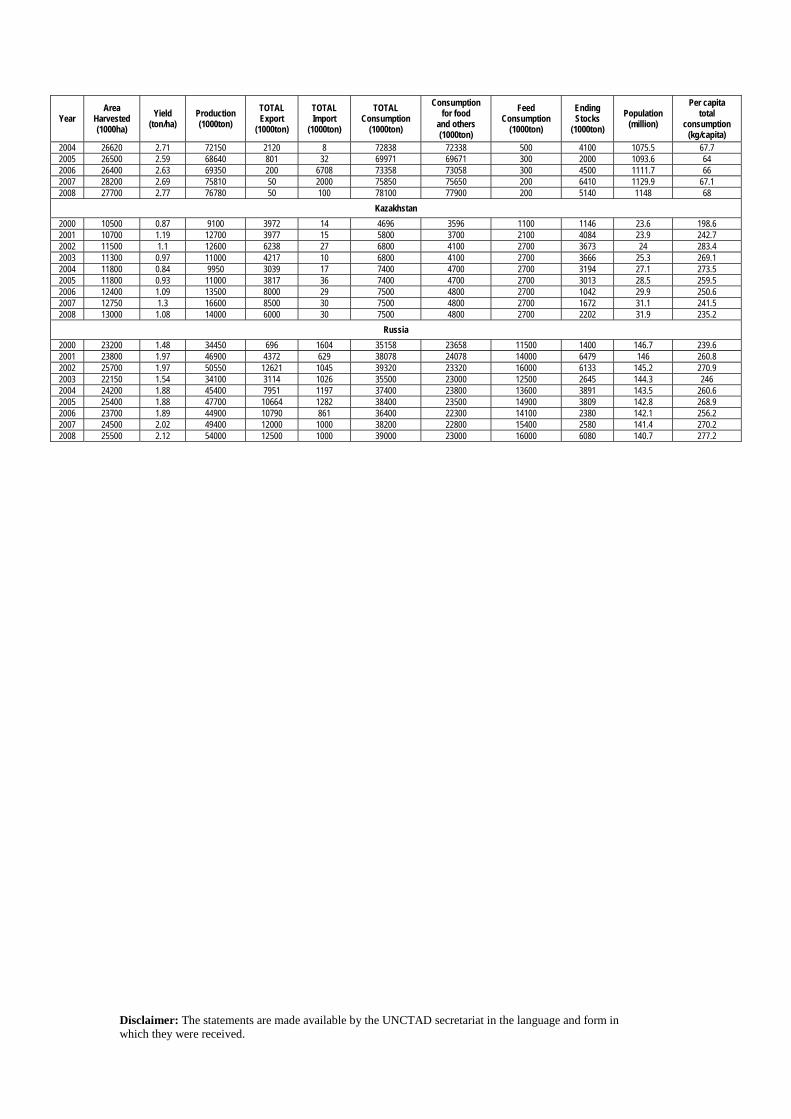
Disclaimer: The statements are made available by the UNCTAD secretariat in the language and form in which they were received.
Year Area
Harvested (1000ha)
Yield (ton/ha)
Production (1000ton)
TOTAL Export
(1000ton)
TOTAL Import
(1000ton)
TOTAL Consumption
(1000ton)
Consumption for food
and others (1000ton)
Feed Consumption
(1000ton)
Ending Stocks
(1000ton)
Population (million)
Per capita total
consumption (kg/capita)
2004 26620 2.71 72150 2120 8 72838 72338 500 4100 1075.5 67.7 2005 26500 2.59 68640 801 32 69971 69671 300 2000 1093.6 64 2006 26400 2.63 69350 200 6708 73358 73058 300 4500 1111.7 66 2007 28200 2.69 75810 50 2000 75850 75650 200 6410 1129.9 67.1 2008 27700 2.77 76780 50 100 78100 77900 200 5140 1148 68
Kazakhstan
2000 10500 0.87 9100 3972 14 4696 3596 1100 1146 23.6 198.6 2001 10700 1.19 12700 3977 15 5800 3700 2100 4084 23.9 242.7 2002 11500 1.1 12600 6238 27 6800 4100 2700 3673 24 283.4 2003 11300 0.97 11000 4217 10 6800 4100 2700 3666 25.3 269.1 2004 11800 0.84 9950 3039 17 7400 4700 2700 3194 27.1 273.5 2005 11800 0.93 11000 3817 36 7400 4700 2700 3013 28.5 259.5 2006 12400 1.09 13500 8000 29 7500 4800 2700 1042 29.9 250.6 2007 12750 1.3 16600 8500 30 7500 4800 2700 1672 31.1 241.5 2008 13000 1.08 14000 6000 30 7500 4800 2700 2202 31.9 235.2
Russia
2000 23200 1.48 34450 696 1604 35158 23658 11500 1400 146.7 239.6 2001 23800 1.97 46900 4372 629 38078 24078 14000 6479 146 260.8 2002 25700 1.97 50550 12621 1045 39320 23320 16000 6133 145.2 270.9 2003 22150 1.54 34100 3114 1026 35500 23000 12500 2645 144.3 246 2004 24200 1.88 45400 7951 1197 37400 23800 13600 3891 143.5 260.6 2005 25400 1.88 47700 10664 1282 38400 23500 14900 3809 142.8 268.9 2006 23700 1.89 44900 10790 861 36400 22300 14100 2380 142.1 256.2 2007 24500 2.02 49400 12000 1000 38200 22800 15400 2580 141.4 270.2 2008 25500 2.12 54000 12500 1000 39000 23000 16000 6080 140.7 277.2

Disclaimer: The statements are made available by the UNCTAD secretariat in the language and form in which they were received.
Table A2: Rice – Country Specific Production, Consumption and Trade Profiles
Year Area
Harvested (1000ha)
Yield (ton/ha)
Production (1000ton)
TOTAL Export
(1000ton)
TOTAL Import
(1000ton)
TOTAL Consumption
(1000ton)
Ending Stocks
(1000ton)
Population (million)
Per capita total
consumption (kg/capita)
India 2000 44361 1.92 84980 1685 0 75960 25051 1004.1 75.7 2001 44600 2.09 93340 6300 0 87611 24480 1022 85.7 2002 40400 1.78 71820 5440 0 79860 11000 1039.7 76.8 2003 42400 2.09 88530 3100 0 85630 10800 1057.5 81 2004 42300 1.97 83130 4569 0 80861 8500 1075.5 75.2 2005 43400 2.11 91790 4688 6 85088 10520 1093.6 77.8 2006 44000 2.12 93350 5500 0 86940 11430 1111.7 78.2 2007 44000 2.17 95680 2500 0 91610 13000 1129.9 81.1 2008 44500 2.16 96000 2000 0 93000 14000 1148 81
China
2000 29962 4.39 131536 1847 270 134300 93009 1268.9 105.8 2001 28812 4.31 124306 1963 304 136500 79156 1276.9 106.9 2002 28200 4.33 122180 2583 258 135700 63311 1284.3 105.7 2003 26508 4.24 112462 880 1122 132100 43915 1291.5 102.3 2004 28379 4.42 125363 656 609 130300 38931 1298.8 100.3 2005 28847 4.38 126414 1216 654 128000 36783 1306.3 98 2006 29295 4.34 127200 1340 472 127200 35915 1314 96.8 2007 29600 4.39 129840 1000 300 127340 37715 1321.9 96.3 2008 29750 4.39 130550 1100 330 127650 39845 1268.9 96
US
2000 1230 4.83 5941 2590 345 3676 887 282.3 13 2001 1341 5.01 6714 2954 419 3850 1216 285 13.5 2002 1298 5.04 6536 3860 471 3534 829 287.7 12.3 2003 1213 5.29 6420 3310 478 3656 761 290.3 12.6 2004 1346 5.54 7462 3496 419 3935 1211 293 13.4 2005 1361 5.23 7113 3660 544 3838 1370 295.7 13 2006 1142 5.46 6239 2943 654 4054 1266 298.4 13.6 2007 1112 5.68 6314 3582 699 3990 707 301.1 13.2 2008 1116 5.65 6300 3166 730 4024 547 303.8 13.2
Japan
2000 1770 4.88 8636 481 679 8297 2621 126.7 65.5 2001 1706 4.83 8242 45 655 8779 2694 126.9 69.2 2002 1688 4.79 8089 200 625 8742 2466 127.1 68.8 2003 1665 4.26 7091 200 700 8357 1700 127.2 65.7 2004 1701 4.67 7944 200 775 8300 1919 127.3 65.2 2005 1706 4.84 8257 200 669 8250 2395 127.4 64.8 2006 1688 4.61 7786 200 675 8250 2406 127.5 64.7 2007 1673 4.74 7930 200 700 8150 2686 127.5 63.9 2008 1650 4.79 7900 200 700 8130 2956 127.4 63.8
Vietnam
2000 7493 2.73 20473 3528 40 16932 978 79.1 214.2 2001 7471 2.82 21036 3245 40 17966 843 80 224.6 2002 7463 2.88 21527 3795 40 17447 1168 80.9 215.6 2003 7468 2.96 22082 4295 300 18230 1025 81.8 222.9 2004 7450 3.05 22716 5174 320 17595 1292 82.7 212.8 2005 7314 3.11 22772 4705 350 18392 1317 83.5 220.2 2006 7203 3.18 22922 4522 450 18775 1392 84.4 222.4 2007 7342 3.21 23543 4500 150 19317 1268 85.3 226.6 2008 7315 3.22 23560 4500 450 19380 1398 86.1 225
Thailand
2000 9891 1.72 17057 7521 0 9250 2247 61.9 149.5 2001 10125 1.73 17499 7245 15 9400 3116 62.3 150.8 2002 10158 1.69 17198 7552 0 9460 3302 62.8 150.6 2003 10315 1.75 18011 10137 0 9470 1706 63.3 149.7 2004 9995 1.74 17360 7274 0 9480 2312 63.7 148.8 2005 10220 1.78 18200 7376 2 9544 3594 64.2 148.7 2006 10270 1.78 18250 9500 5 9870 2479 64.6 152.7 2007 10430 1.77 18500 10000 7 9467 1519 65.1 145.5 2008 10500 1.79 18800 9000 8 9450 1877 65.5 144.3

Disclaimer: The statements are made available by the UNCTAD secretariat in the language and form in which they were received.
Table A3: Soybean oil –Country Specific Production, Consumption and Trade Profiles
Year
Production (1000ton)
TOTAL Export
(1000ton)
TOTAL Import
(1000ton)
TOTAL Consumption
(1000ton)
Industrial Consumption
(1000ton)
Food Consumption
(1000ton)
Feed Consumption
(1000ton)
Ending Stocks
(1000ton)
Population (million)
Per capita total
consumption (kg/capita)
2000 26734 7048 6948 26366 635 25560 171 3134 6073.3 4.3 2001 28897 8341 7737 28311 795 27309 207 3116 6149.1 4.6 2002 30584 9032 8272 30167 717 29287 163 2773 6224.2 4.8 2003 30183 8827 8333 30059 695 29209 155 2403 6299.3 4.8 2004 32563 9119 8907 31694 962 30563 169 3060 6375 5 2005 34572 9816 9019 33574 2592 30819 163 3261 6451.4 5.2 2006 36393 10682 9698 35594 3793 31638 163 3076 6528.1 5.5 2007 38298 11223 10663 38075 4556 33355 164 2739 6605
India
2000 814 19 1400 2024 0 2024 0 171 1004.1 2 2001 833 4 1479 2300 0 2300 0 179 1022 2.2 2002 615 5 1197 1900 0 1900 0 86 1039.7 1.8 2003 996 5 906 1885 0 1885 0 98 1057.5 1.8 2004 900 11 2026 2627 0 2627 0 386 1075.5 2.4 2005 1050 13 1727 2918 0 2918 0 232 1093.6 2.7 2006 1180 10 1403 2598 0 2598 0 207 1111.7 2.3 2007 1415 10 1000 2525 0 2525 0 87 1129.9 2.2
China
2000 3240 53 355 3542 0 3542 0 280 1268.9 2.8 2001 3575 59 551 4137 0 4137 0 210 1276.9 3.2 2002 4730 13 1712 6389 0 6389 0 250 1284.3 5 2003 4535 15 2728 7157 0 7157 0 341 1291.5 5.5 2004 5421 40 1728 7203 0 7203 0 247 1298.8 5.5 2005 6149 105 1516 7607 0 7607 0 200 1306.3 5.8 2006 6340 94 2404 8600 0 8600 0 250 1314 6.5 2007 6800 50 3000 9790 0 9790 0 210 1321.9 7.4
US
2000 8355 636 33 7401 0 7401 0 1255 282.3 26.2 2001 8572 1143 21 7635 0 7635 0 1070 285 26.8 2002 8360 1027 21 7748 0 7748 0 676 287.7 26.9 2003 7748 425 139 7650 0 7650 0 488 290.3 26.4 2004 8782 600 12 7911 0 7911 0 771 293 27 2005 9248 523 16 8147 706 7441 0 1365 295.7 27.6 2006 9293 857 17 8419 1253 7166 0 1399 298.4 28.2 2007 9639 1406 23 8346 1270 7076 0 1309 301.1 27.7
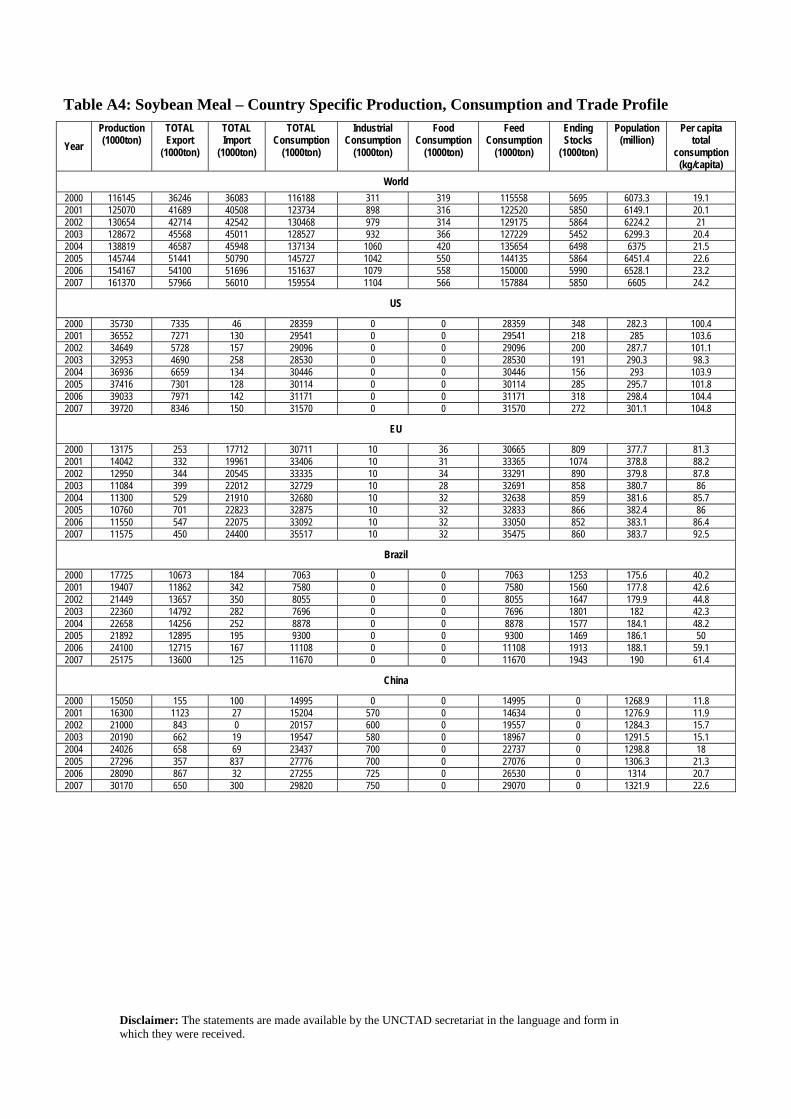
Disclaimer: The statements are made available by the UNCTAD secretariat in the language and form in which they were received.
Table A4: Soybean Meal – Country Specific Production, Consumption and Trade Profile
Year
Production (1000ton)
TOTAL Export
(1000ton)
TOTAL Import
(1000ton)
TOTAL Consumption
(1000ton)
Industrial Consumption
(1000ton)
Food Consumption
(1000ton)
Feed Consumption
(1000ton)
Ending Stocks
(1000ton)
Population (million)
Per capita total
consumption (kg/capita)
World
2000 116145 36246 36083 116188 311 319 115558 5695 6073.3 19.1 2001 125070 41689 40508 123734 898 316 122520 5850 6149.1 20.1 2002 130654 42714 42542 130468 979 314 129175 5864 6224.2 21 2003 128672 45568 45011 128527 932 366 127229 5452 6299.3 20.4 2004 138819 46587 45948 137134 1060 420 135654 6498 6375 21.5 2005 145744 51441 50790 145727 1042 550 144135 5864 6451.4 22.6 2006 154167 54100 51696 151637 1079 558 150000 5990 6528.1 23.2 2007 161370 57966 56010 159554 1104 566 157884 5850 6605 24.2
US
2000 35730 7335 46 28359 0 0 28359 348 282.3 100.4 2001 36552 7271 130 29541 0 0 29541 218 285 103.6 2002 34649 5728 157 29096 0 0 29096 200 287.7 101.1 2003 32953 4690 258 28530 0 0 28530 191 290.3 98.3 2004 36936 6659 134 30446 0 0 30446 156 293 103.9 2005 37416 7301 128 30114 0 0 30114 285 295.7 101.8 2006 39033 7971 142 31171 0 0 31171 318 298.4 104.4 2007 39720 8346 150 31570 0 0 31570 272 301.1 104.8
EU
2000 13175 253 17712 30711 10 36 30665 809 377.7 81.3 2001 14042 332 19961 33406 10 31 33365 1074 378.8 88.2 2002 12950 344 20545 33335 10 34 33291 890 379.8 87.8 2003 11084 399 22012 32729 10 28 32691 858 380.7 86 2004 11300 529 21910 32680 10 32 32638 859 381.6 85.7 2005 10760 701 22823 32875 10 32 32833 866 382.4 86 2006 11550 547 22075 33092 10 32 33050 852 383.1 86.4 2007 11575 450 24400 35517 10 32 35475 860 383.7 92.5
Brazil
2000 17725 10673 184 7063 0 0 7063 1253 175.6 40.2 2001 19407 11862 342 7580 0 0 7580 1560 177.8 42.6 2002 21449 13657 350 8055 0 0 8055 1647 179.9 44.8 2003 22360 14792 282 7696 0 0 7696 1801 182 42.3 2004 22658 14256 252 8878 0 0 8878 1577 184.1 48.2 2005 21892 12895 195 9300 0 0 9300 1469 186.1 50 2006 24100 12715 167 11108 0 0 11108 1913 188.1 59.1 2007 25175 13600 125 11670 0 0 11670 1943 190 61.4
China
2000 15050 155 100 14995 0 0 14995 0 1268.9 11.8 2001 16300 1123 27 15204 570 0 14634 0 1276.9 11.9 2002 21000 843 0 20157 600 0 19557 0 1284.3 15.7 2003 20190 662 19 19547 580 0 18967 0 1291.5 15.1 2004 24026 658 69 23437 700 0 22737 0 1298.8 18 2005 27296 357 837 27776 700 0 27076 0 1306.3 21.3 2006 28090 867 32 27255 725 0 26530 0 1314 20.7 2007 30170 650 300 29820 750 0 29070 0 1321.9 22.6

Disclaimer: The statements are made available by the UNCTAD secretariat in the language and form in which they were received.
Table A5: Corn – Country Specific Production, Consumption and Trade Profiles
Year
Area Harvested (1000ha)
Yield (ton/ha)
Production (1000ton)
TOTAL Export
(1000ton)
TOTAL Import
(1000ton)
TOTAL Consumption
(1000ton)
Consumption for food
and others (1000ton)
Feed Consumption
(1000ton)
Ending Stocks
(1000ton)
Population (million)
Per capita total
consumption (kg/capita)
World
2000 137176 4.31 590831 76751 75025 608281 180376 427905 174544 6073.3 100.2 2001 137861 4.35 600339 74566 72520 621623 185344 436279 151214 6149.1 101.1 2002 137904 4.38 603555 76714 75127 626595 193410 433185 126587 6224.2 100.7 2003 142254 4.41 627594 77281 76398 648069 202880 445189 105229 6299.3 102.9 2004 145127 4.93 715770 77643 76676 687978 213395 474583 132054 6375 107.9 2005 145984 4.79 698997 80966 79453 704426 226992 477434 125112 6451.4 109.2 2006 149293 4.78 713131 93060 90650 725670 248331 477339 110163 6528.1 111.2 2007 158682 4.98 789812 98563 94816 775136 275567 499569 121092 6605 117.4 2008 158330 4.9 775258 91867 89851 791049 305435 485614 103285 6682.5 118.4
US
2000 29316 8.59 251854 49313 173 198102 49706 148396 48240 282.3 701.6 2001 27830 8.67 241377 48383 258 200941 51983 148958 40551 285 705 2002 28057 8.12 227767 40334 367 200748 59445 141303 27603 287.7 697.8 2003 28710 8.93 256278 48258 358 211644 64447 147197 24337 290.3 729 2004 29798 10.06 299914 46181 275 224648 68220 156428 53697 293 766.6 2005 30399 9.29 282311 54201 224 232063 75726 156337 49968 295.7 784.7 2006 28590 9.36 267598 53970 304 230786 88595 142191 33114 298.4 773.3 2007 35022 9.48 332092 62233 381 266966 110749 156217 36388 301.1 886.5 2008 31889 9.35 298083 50802 381 266967 136151 130816 17083 303.8 878.7
South America
2000 18338 3.47 63562 16636 5774 51347 9919 41428 4916 348.2 147.5 2001 16817 3.37 56683 13358 5163 49480 10205 39275 3924 352.9 140.2 2002 17917 3.73 66916 16758 5875 50891 10680 40211 9066 357.6 142.3 2003 17280 3.75 64759 15866 5626 52455 10740 41715 11130 362.2 144.8 2004 16952 3.75 63565 15835 6052 56033 11250 44783 8879 366.7 152.8 2005 17950 3.67 65826 16061 8571 59949 11525 48424 7266 371.1 161.5 2006 19777 4.21 83335 28578 9441 63372 11800 51572 8092 375.5 168.8 2007 20736 4.31 89346 27645 8775 65595 11950 53645 12973 379.8 172.7 2008 21110 4.29 90649 28835 8920 68795 12600 56195 14912 384.1 179.1
China
2000 23056 4.6 106000 7276 89 120240 28240 92000 102372 1268.9 94.8 2001 24282 4.7 114088 8611 39 123100 29100 94000 84788 1276.9 96.4 2002 24634 4.92 121300 15244 29 125900 29900 96000 64973 1284.3 98 2003 24068 4.81 115830 7553 2 128400 31400 97000 44852 1291.5 99.4 2004 25446 5.12 130290 7589 2 131000 33000 98000 36555 1298.8 100.9 2005 26358 5.29 139365 3727 62 137000 36000 101000 35255 1306.3 104.9 2006 27900 5.43 151600 5269 16 145000 41000 104000 36602 1314 110.3 2007 28000 5.42 151830 500 100 149000 44000 105000 39032 1321.9 112.7 2008 27800 5.5 153000 500 100 157000 45000 112000 34632 1330 118
EU
2000 8917 5.62 50089 585 3689 55108 12160 42948 2672 377.7 145.9 2001 9452 6.14 58022 1258 2201 58288 12780 45508 3349 378.8 153.9 2002 8995 6.41 57660 756 2824 57576 12517 45059 5501 379.8 151.6 2003 9138 5.24 47905 455 5859 55764 12250 43514 3046 380.7 146.5 2004 9677 6.87 66471 678 2469 63200 12650 50550 8108 381.6 165.6 2005 9227 6.63 61158 449 2634 61500 14500 47000 9951 382.4 160.8 2006 8569 6.39 54720 664 7056 62300 13600 48700 8763 383.1 162.6 2007 8472 5.71 48393 350 13000 61800 12800 49000 8006 383.7 161.1 2008 8660 6.48 56122 1000 7000 60200 14000 46200 9928 384.3 156.6
Disclaimer: The statements are made available by the UNCTAD secretariat in the language and form in which they were received.
Organization: Centre for Trade and Development (CENTAD) Contact: Linu MATTHEW PHILIP A-1/304, Safdarjung Enclave 110029 Delhi, India Tel: +91 11 414 592 26 Fax: +91 11 414 592 27 E-mail: [email protected] or [email protected] Web: www.centad.org Theme Addressed: The global food crisis: addressing a systemic failure in development strategy
Input: Sound Trade Policy Formulation Crucial for Sri Lankan Food and Agriculture
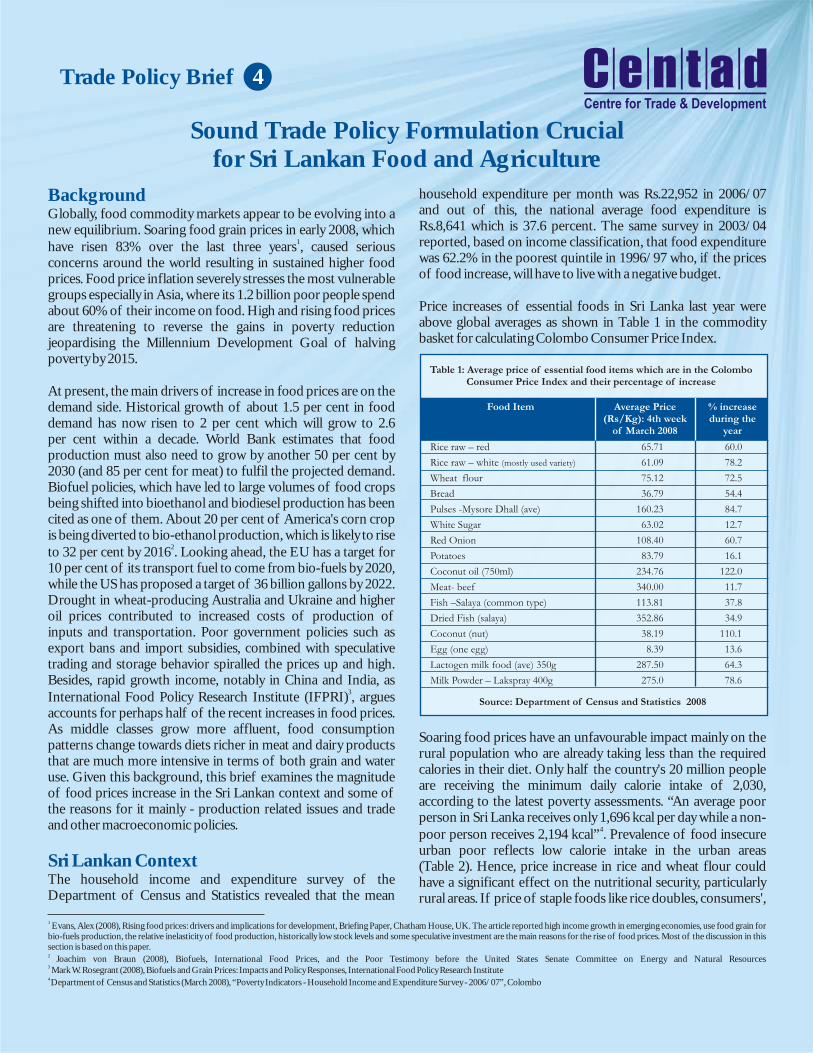
Trade Policy Brief 4
Background
Sri Lankan Context
household expenditure per month was Rs.22,952 in 2006/07 and out of this, the national average food expenditure is Globally, food commodity markets appear to be evolving into a Rs.8,641 which is 37.6 percent. The same survey in 2003/04 new equilibrium. Soaring food grain prices in early 2008, which
1 reported, based on income classification, that food expenditure have risen 83% over the last three years , caused serious was 62.2% in the poorest quintile in 1996/97 who, if the prices concerns around the world resulting in sustained higher food of food increase, will have to live with a negative budget.prices. Food price inflation severely stresses the most vulnerable
groups especially in Asia, where its 1.2 billion poor people spend Price increases of essential foods in Sri Lanka last year were about 60% of their income on food. High and rising food prices above global averages as shown in Table 1 in the commodity are threatening to reverse the gains in poverty reduction basket for calculating Colombo Consumer Price Index.jeopardising the Millennium Development Goal of halving
poverty by 2015.
At present, the main drivers of increase in food prices are on the demand side. Historical growth of about 1.5 per cent in food demand has now risen to 2 per cent which will grow to 2.6 per cent within a decade. World Bank estimates that food production must also need to grow by another 50 per cent by 2030 (and 85 per cent for meat) to fulfil the projected demand. Biofuel policies, which have led to large volumes of food crops being shifted into bioethanol and biodiesel production has been cited as one of them. About 20 per cent of America's corn crop is being diverted to bio-ethanol production, which is likely to rise
2to 32 per cent by 2016 . Looking ahead, the EU has a target for 10 per cent of its transport fuel to come from bio-fuels by 2020, while the US has proposed a target of 36 billion gallons by 2022. Drought in wheat-producing Australia and Ukraine and higher oil prices contributed to increased costs of production of inputs and transportation. Poor government policies such as export bans and import subsidies, combined with speculative trading and storage behavior spiralled the prices up and high. Besides, rapid growth income, notably in China and India, as
3International Food Policy Research Institute (IFPRI) , argues accounts for perhaps half of the recent increases in food prices. As middle classes grow more affluent, food consumption
Soaring food prices have an unfavourable impact mainly on the patterns change towards diets richer in meat and dairy products
rural population who are already taking less than the required that are much more intensive in terms of both grain and water
calories in their diet. Only half the country's 20 million people use. Given this background, this brief examines the magnitude
are receiving the minimum daily calorie intake of 2,030, of food prices increase in the Sri Lankan context and some of
according to the latest poverty assessments. “An average poor the reasons for it mainly - production related issues and trade
person in Sri Lanka receives only 1,696 kcal per day while a non-and other macroeconomic policies. 4poor person receives 2,194 kcal” . Prevalence of food insecure
urban poor reflects low calorie intake in the urban areas (Table 2). Hence, price increase in rice and wheat flour could
The household income and expenditure survey of the have a significant effect on the nutritional security, particularly Department of Census and Statistics revealed that the mean rural areas. If price of staple foods like rice doubles, consumers',
Sound Trade Policy Formulation Crucial for Sri Lankan Food and Agriculture
1 Evans, Alex (2008), Rising food prices: drivers and implications for development, Briefing Paper, Chatham House, UK. The article reported high income growth in emerging economies, use food grain for bio-fuels production, the relative inelasticity of food production, historically low stock levels and some speculative investment are the main reasons for the rise of food prices. Most of the discussion in this section is based on this paper.2 Joachim von Braun (2008), Biofuels, International Food Prices, and the Poor Testimony before the United States Senate Committee on Energy and Natural Resources3 Mark W. Rosegrant (2008), Biofuels and Grain Prices: Impacts and Policy Responses, International Food Policy Research Institute4 Department of Census and Statistics (March 2008), “Poverty Indicators - Household Income and Expenditure Survey - 2006/07”, Colombo

particularly the poor's options for “coping” consist only of sector resulted in lower productivity of all crops, apart from reducing or skipping meals and/or shifting to less-nutritious paddy, in comparison to many other countries (see Table 3). This diets. When children and pregnant women reduce or skip meals, shows that the Sri Lankan agricultural sector, including the
5even temporarily, health & nutritional consequences can be plantation sector, is internationally uncompetitive . This lifelong and irreversible. Malnutrition among preschool children situation coupled with rising cost of production contributed to directly affects their ability to learn and their ability to earn the food price increase.income as adults.
Unfavourable policies failed to keep the food imports and prices at a predictable level as higher food imports contributed to the price rise of certain commodities, except for rice and a few types of vegetables.
Cost of production, as shown in Figure 1 for paddy, significantly increased mainly due to increasing cost of fertiliser and farm labour. Cost of fertiliser has risen phenomenally from Rs.9,058 per mt (c.i.f value) in 1998, to Rs.16,452 in 2003 and to Rs.37,649 in 2007. Though government subsidies stabilised prices to varying degrees, they did not take the full impact of the price increase away. The nominal monthly wage rates of unskilled labour increased from Rs. 1877 in 2004 to Rs. 3187 in 2006 and then to Rs. 3907 at the end of 2007. These two factors affect cost of production of many other farm products in addition to paddy.Secondly, lack of new technology infusion into agriculture
Though many imported food items have substantially low CIF prices (see Figure 2), cheap imports have neither helped producers nor consumers, as retail prices are much higher than both CIF and farm-gate prices, partly due to the tariff structure prevailed in the economy. Sri Lanka fixed nearly all agricultural
6tariffs at a 50% ceiling, the lowest in the region . On the other side, the Sri Lankan agriculture sector was not structurally developed and was unable to face product competitiveness transmitted through imports and suffered consequently. Low-
Trade policies and general economic policies
What caused such high prices?
Production related issues
Table 2: Per Capita Daily Calorie Intake for Selected Key Food Items by Sectors: 2003/04
Urban
Kcal % Kcal % Kcal % Kcal %Item Rural Estate All Sectors
Figure 1: Cost of Production of Paddy: 2005 end of 2007
Source: Economic and Social Statistics of Sri Lanka (2007), Central Bank of Sri Lanka
y = 0.0223x
2
- 0.4956x + 15.049
R
2
= 79%
0.00
5.00
10.00
15.00
20.00
25.00
30.00
2005 MayJun Jul Aug Sep Oct Nov Dec Jan Feb Mar Apr May Jun Jul Aug Sep Oct Nov Dec Jan Feb Mar Apr May Jun Jul Aug Sep Oct Nov Dec
Rs/kg
2006 2007
5WORLD BANK, 2007. Sri Lanka Poverty Assessment – Engendering Growth with Equity: Opportunities and Challenges.6CENTAD, 2005. South Asian Year Book of Trade and Development - 2005: Mainstreaming Development in Trade Negotiation: Run Up to Hong Kong, New Delhi: Centre for Trade and Development.
Cereals
Roots, Tubers & Other Starchy Food
Sugar
Pulses & Nuts
Vegetable (including Onions)
T. V. P.
Fruits
Meat
Fish Fresh
Dried & Salted
Milk Whole Dried
Milk Food (Yogurt etc.)
Oil & Fats (including Coconut)

Within the liberal economic environment, the 10-year fixed tariffs and consequent low-applied tariffs (of 35% - 28%, agriculture policy will be directed towards transforming when India had nearly 100% tariff for many agricultural traditional subsistence agriculture (including livestock and products) led to gradual erosion of production of some food fisheries) to one, which maximises productivity. Increasing crops again contributing to increasing prices.productivity of tree crops/export agriculture to become more competitive in the international market has been identified as an On account of the unsatisfactory tariff structure, there were important strategy in the policy to create an exportable surplus frequent changes in the tariff policy on main food crops. or import substitution products and thereby strengthen the Changing tariff rates affected crops such as rice, potatoes,
7 balance of payments situation. Priority has also been given to onions and chillies . Though aimed at improving food security improving marketing, processing and other down-stream situation of the country, many of the changes were politically activities to increase value addition to agricultural products, motivated and sought to maintain producer and customer providing more employment opportunities in rural areas and satisfaction following crop failures, gluts in crop production or thereby reducing migration to urban areas. The goals of the high seasonal food demand. Thus, frequent changes in tariff agriculture policy are to achieve food security, sustainable policies had unfavourable effects on agribusiness and private earnings and higher incomes for those dependent on this sector, sector investments; affected resource-allocation decisions reduce the cost of living of the population as a whole, and leading to confusion resulting in a situation where prices of provide an adequate diet at an affordable price for the poor. The most of food items are a function of the world market prices Government places high priority on achieving a broad based-plus the tariff rates partly contributing to the high prices shift from low- value to high-value agriculture, accompanied by prevailing at present.
sustained improvements in productivity and competitiveness, which will launch the agriculture sector into a significantly higher growth trajectory.
Liberal trade policies based on the principle of reducing agricultural trade barriers to bring about enhanced sectoral competitiveness, promote better integration into the global trading systems and outward oriented development strategy, and improve the welfare of consumers, especially the poor - will be revisited to address new concerns. In theory, these are achievable expectations, which are apparently unachievable within the current situation of the agriculture sector in Sri Lanka. Therefore, it is imperative to advice the governments of developing countries including Sri Lanka in formulating trade policies, particularly for protecting domestic producers against competition from imports with distorted prices. There are several pertinent issues that support anti-protectionist view that cannot be overlooked in developing countries
As a response to the increasing food insecurity, Sri Lanka has including: (a) the burden on poor consumers is higher from food launched an integrated national drive called 'Api Vavamu Rata protectionism as they disproportionately spend on food items; Nagamu', meaning 'Grow more food towards prosperity', (b) the benefits of the protectionism of food crops to rural poor through which all arable lands in the country are being brought is less than it might appear as many of them in Sri Lanka, as in under cultivation. This was supported with substantial fertilizer other developing countries, are landless and mainly consumers subsidy for rice; a policy directive to provide lands to landless and the next poorer category are producers at subsistence level farmers; multipurpose irrigation schemes to transform dry so they will not gain or lose. However, this need to be carefully lands into fertile agricultural settlements, facilitate seed analysed in country specific way as many poor find employment production programmes and strengthening the market network in the agriculture sector which would be harmed with for agricultural produce. Sri Lanka is firm in the decision that no inappropriate liberalisation; and (c) advantage of protectionism land that can be used for food will be used for bio-fuel despite will largely be realised if there are opportunities for improving the commercial attraction.
Figure 2: Comparison of CIF Price (Rs/kg) and Farm-gate and Retail Prices of Some Selected Agricultural Products
Source: Hector Kobbekaduwa Agrarian Research and Training Institute (2003)
7Paddy faced the highest variation in the tariff rates in terms of total tax incidence (i.e. custom duty, surcharge, VAT, National Security Levy, gives the total tax incidence): January 1995 – 65.7% in ad-valorem equivalents; Feb, 1995 – 44.6%; April 1996 – 7.6%; Jan 1997 – 44.6%; Oct 1999 – 20.9%; Jan 2000 – 48%; Feb 2001 – 60%; Nov 2001 – 8.1%; Dec 2001 – 34.1%; Jan 2002 – 60%; Nov 2002 – 27.4%. Potatoes also had a high fluctuation: Feb 1995 – 54.7%; Dec 2000 – 172%; Feb 2001 – 223% etc (Central Bank Reports of respective years).
A-1/304, Safdarjung Enclave, New Delhi - 110029, IndiaPh.: 91-11-4145 9226, Fax: 91-11-4145 9227, Website: www.centad.org
Anura Herath Country Programme Management Facilitator, IFAD, Sri Lanka
August 2008
(Disclaimer: The views and analysis are of the author and may not necessarily reflect the views of Centad or IFAD)
The valuable comments of Seneka Abeyratne. International Consultant, Sri Lanka, is deeply acknowledged.
return to labour and land with technology infusion, and also agriculture sector itself through increased export crops. It is the have rural employment opportunities in non-farm sectors, policy and state interventions in terms of “behind-the-border” which is not always found in developing countries. measures that would create this environment of improving
export crops such as spices, fruits & vegetables and also However, for Sri Lanka, fully subscribing to these issues, on the beverage crops. other hand, creates problems. Thus, the policy design should also consider among other things the existing structures of Implication on government revenue from import tax is the agricultural tariff, the cost of adjustment on any tariff changes, fourth consideration. Although declining in many countries, stage of development in the sector, political sensitiveness on the revenue generated from import tariff is regarded important policy changes, and most usefully the Doha Round discussions which was about 12% (Rs 70,530 million) of the total where developing countries have some leverage for flexibility in government revenue and 2.2% of the GDP in Sri Lanka in
8liberalisation. 2006 . Any liberalisation attempt having a negative impact on the revenue needs to be assessed carefully.
Fifth, type of collateral polices to be in place to at least partially compensate the losers and facilitate adjustment of the negative
In consideration to both sides, the way forward includes proper impact of liberalisation and how quickly such policies could be timing of liberalisation; what kind of collateral policies that are implemented are important. While developed countries have needed as “behind-the-border” measures such as state structures, policies and also resources to make compensation investment, capacity building, institutional reform etc.; through means such as direct or de-coupled subsidies to the protecting the vulnerable sectors of the economy; and making farmers, how effectively the developing countries could the liberalisation process politically acceptable and sustainable. mobilise their meagre resources into such adjustment policies is
the issue that needs attention. Much of the adjustment support First of all, the relative size of the agriculture sector matters. If proposed by the developed countries and donors have not the sector is notable in employment generation and food always been realised and such policies need not always be in the production at certain sub-national level in Sri Lanka, then a rapid agriculture sector. They can be focused in non-farm sector too reduction in protection may generate significant unemployment in providing alternative livelihood sources like the government's and rural-urban migration. Unless there are drivers for “gama-neguma” programme.absorbing marginalised agricultural labour, rapid and unplanned liberalisation is a threat to the rural economies. Finally but most importantly the provision of “shock
absorbers” is essential. Sri Lanka and most other developing Pattern of protection is the second consideration. An uneven countries currently do not have modalities or resources to protection could be adopted where special products, which have implement safeguards that could be used by agricultural high stakes on contributing to rural livelihood, rural producers who are vulnerable to high international price development and food security could be protected more than fluctuations, which are brought about by liberalised trends. others. Thus, if there is technical substitutability across different Maintaining a high bound tariff and a policy space (i.e. crop sectors, the labour from more liberalised sectors could be difference between the bound and the applied tariff rates) is a relocated in others so that in the long run a more stable tool that many developing countries adopt as a safeguard. Doing production structure would evolve. away with this policy should be based on deep and objective
analysis of the sector.Thirdly, the relative effects of export and import substituting crops on labour markets. If export crops are more labour It is only wise to consider all these issues in sound trade policy intensive in relation to imported food crops then less protection formulation in the agriculture sector. It is also necessary to keep means labour reallocation in export crops. This is not always the the common voice of developing countries over these issues case in Sri Lanka, which can have dual advantages of cheaper vociferously in future trade negotiations despite the brief pause food and generating employment opportunities in the in the Doha round at present.
General Policy Inputs for the ailing agriculture sector
8Central Bank of Sri Lanka (2006), Annual Report