heating system for a group of condominiums
DESCRIPTION
ESD.71 Application Portfolio. Heating System for a Group of Condominiums. Rory Clune Dept. of Civil & Environmental Engineering, Massachusetts Institute of Technology. 1. Introduction 2. Uncertainties 3. Modelling & Design Levers 4. Decision Tree 5. Binomial Lattice 6. Conclusion. - PowerPoint PPT PresentationTRANSCRIPT

Heating System for a Group of Condominiums
Rory CluneDept. of Civil & Environmental Engineering, Massachusetts Institute of Technology
ESD.71 Application Portfolio

1. Introduction
2. Uncertainties
3. Modelling & Design Levers
4. Decision Tree
5. Binomial Lattice
6. Conclusion

1. Introduction
-What is the system?
-Heating plant – natural gas boiler heats water & pipes it to holiday homes
Hot water to homes
Cold water returned
Gas (fuel) in

2. Uncertainties
-Two major uncertainties
(a) Price of natural gas – an input cost
Source: Energy Information Administration (http://tonto.eia.doe.gov/dnav/ng/hist )
ν = 0.90%
σ = 14.00%

2. Uncertainties
(b) Demand for heat
Assumption:Demand for heat ~ number of tourists visiting condos ~ number of tourists visiting Ireland (for which data available)
Source: Central Statistics Office of Ireland (http://www.cso.ie )
ν = 3.63%
σ = 6.74%
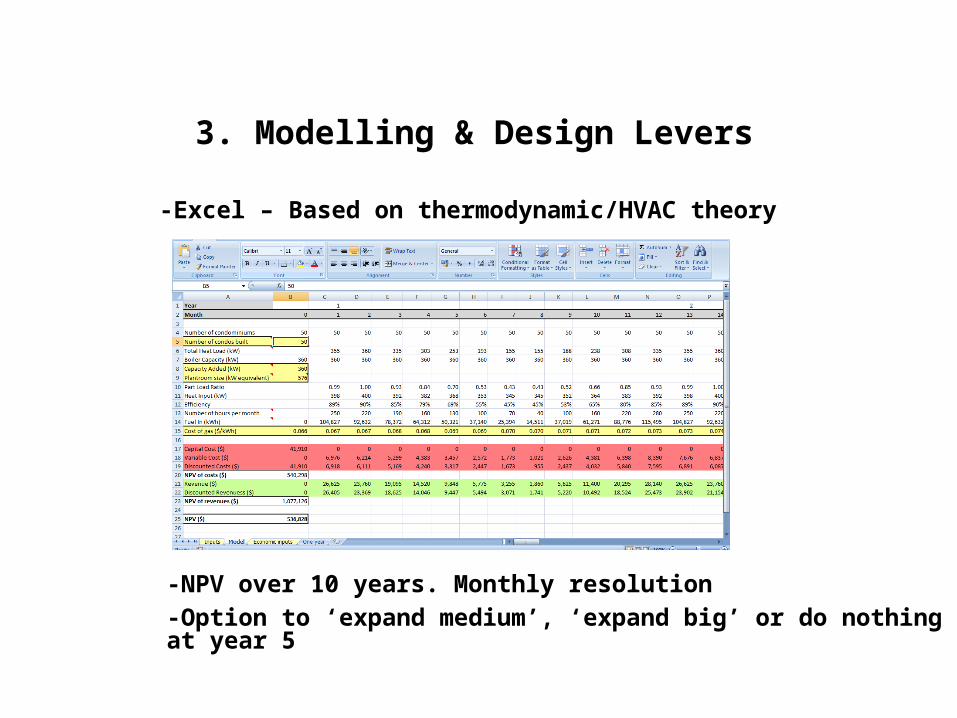
3. Modelling & Design Levers
-Excel – Based on thermodynamic/HVAC theory
-NPV over 10 years. Monthly resolution
-Option to ‘expand medium’, ‘expand big’ or do nothing at year 5

1. Introduction
2. Uncertainties
3. Modelling & Design Levers
4. Decision Tree
5. Binomial Lattice
6. Conclusion

4. Decision Tree
Fixed Design
Capacity to meet forecast demand level at year 5 (my decision point)
Bigger now means less efficient initially – boiler theory
Flexible Design
Capacity to meet today’s demand only
Capability to expand to meet anything up to maximum possible demand
Two uncertainties (gas price & demand level)
3 levels over each period – favourable, forecast & unfavourable
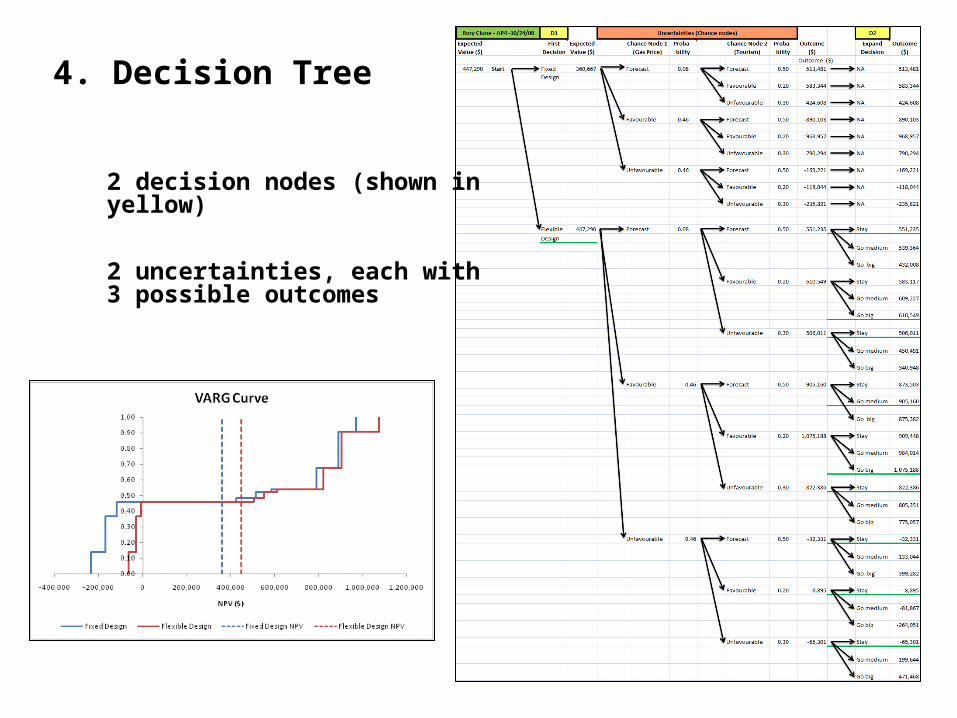
4. Decision Tree
2 uncertainties, each with3 possible outcomes
2 decision nodes (shown inyellow)
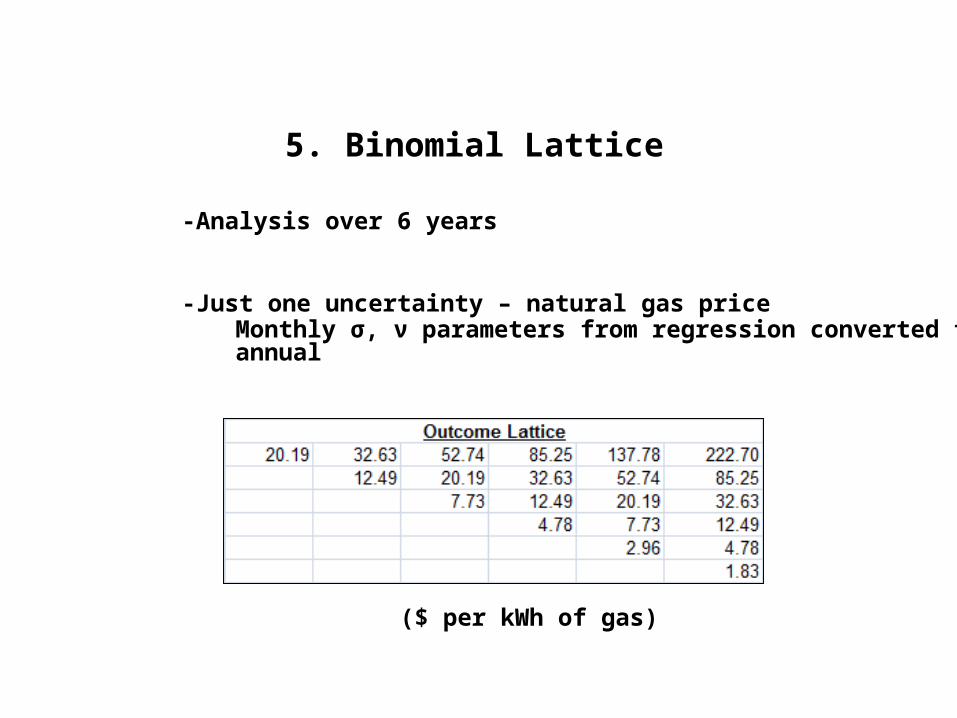
5. Binomial Lattice
-Analysis over 6 years
-Just one uncertainty – natural gas price
Monthly σ, ν parameters from regression converted to annual
($ per kWh of gas)

5. Binomial Lattice
-Option: close at any time, without penalty. Can be exercised only once
Annual undiscounted cash flows
(Year 0 includes Capex)
Double-checked using standard NPV of annual cash flows method

5. Conclusion
-Decision Tree:
Flexibility increases E(NPV) & shifts most of VARG to the right
Noticeably reduced downside
-Binomial Lattice:
Flexibility to expand increases E(NPV)
Effect on VARG curve not remarkable (short time period)
More awkward to apply – assumptions had to be made-number of uncertainties = 1-path independence
Easy to adapt to situation, but laborious

End