heavy-duty diesel inspection and maintenance pilot program · 2016-10-11 · this report summarizes...
TRANSCRIPT

Prepared by the Texas A&M Transportation Institute
Prepared for the North Central Texas Council of Governments and the Texas Department of Transportation
May 2013 (Revised October 2013)
Heavy-Duty Diesel Inspection and
Maintenance Pilot Program

Texas A&M Transportation Institute
2
ACKNOWLEDGMENTS This study was funded by the North Central Texas Council of Governments (NCTCOG) with leverage funding from the Texas Department of Transportation (TxDOT). Work was performed by the Texas A&M Transportation Institute (TTI) and the University of Denver (DU). Contributors to this report include: Doh-Won Lee, Joe Zietsman, Jeremy Johnson, Tara Ramani, and Reza Farzaneh of TTI, and Don Stedman and Gary Bishop of DU. The authors would like to thank Chris Klaus, Shannon Stevenson, Amanda Brimmer, and Richard McComb of NCTCOG and Bill Knowles of TxDOT for their input and contributions to this study. Additionally, the authors would like to thank Sergeant Robert Rodriguez and his staff of the Texas Department of Public Safety for their help during the pilot testing at the New Waverly Weigh Station.
For further information, contact: Dr. Josias Zietsman Division Head, Environment and Air Quality Division Texas A&M Transportation Institute 3135 TAMU College Station, TX 77843 Tel.: (979) 458-3476 Email: [email protected]
Texas A&M Transportation Institute
3
TABLE OF CONTENTS Executive Summary ........................................................................................................................ 9 Chapter 1: Introduction ................................................................................................................. 11
Project Purpose ......................................................................................................................... 11 Report Outline ........................................................................................................................... 11
Chapter 2: Diesel I/M Programs and Methodologies ................................................................... 12 Diesel I/M Program .................................................................................................................. 12
Current Diesel I/M Programs ................................................................................................ 12 I/M versus Screening ............................................................................................................ 13
Testing Methodologies for I/M Programs ................................................................................ 15 OBD Testing ......................................................................................................................... 15 Opacity Testing ..................................................................................................................... 16 Idle Testing ........................................................................................................................... 17 Additional I/M Testing Approaches ..................................................................................... 17
Chapter 3: HDDV Pilot Emissions Testing .................................................................................. 24 Pilot Testing Design .................................................................................................................. 24 Test Location and Dates ........................................................................................................... 24 Designated Test Vehicles .......................................................................................................... 26 SHED Testing ........................................................................................................................... 27
Set-Up ................................................................................................................................... 28 Validation Testing with PEMS ............................................................................................. 29 SHED Emission Analyzers ................................................................................................... 29 Additional SHED Equipment ............................................................................................... 30
PEMS Equipment ..................................................................................................................... 31 Other Testing ............................................................................................................................ 32
Idling Testing with Opacity Meter ........................................................................................ 32 Idling Testing with Filter Samples ........................................................................................ 32
Chapter 4: Pilot Testing Results for NOx ...................................................................................... 34 SHED Testing HDDV Fleet Analysis ...................................................................................... 34 SHED NOx Emissions Characterization Results ...................................................................... 37 Comparison with PEMS Data and MOVES Rates ................................................................... 38 Analysis of Potential Impacts for DFW Region ....................................................................... 41
Alternate Criteria for Defining HE Vehicles ........................................................................ 44 NOx Emissions Comparisons with Other Methodologies ........................................................ 44
Opacity Testing ..................................................................................................................... 45 Filter Sampling ...................................................................................................................... 45
Summary ................................................................................................................................... 46 Chapter 5: Conclusions and Recommendations ........................................................................... 47
Potential I/M and Screening Methodologies ............................................................................ 47 HD-OBD Testing .................................................................................................................. 48 Conventional RS Testing ...................................................................................................... 48 SHED Testing ....................................................................................................................... 49 WB Chassis Dynamometer Testing (with PEMS) ................................................................ 49 PR Chassis Dynamometer Testing (with PEMS) ................................................................. 49
Considerations for Implementation .......................................................................................... 49 Concluding Remarks ................................................................................................................. 50

Texas A&M Transportation Institute
4
Scope for Future Study ......................................................................................................... 51 Appendix A: Pilot Testing Results for Other Pollutants ............................................................... 53
Texas A&M Transportation Institute
5
LIST OF TABLES
Table 1: Diesel I/M Programs. ...................................................................................................... 13 Table 2: HDDVs Used in PEMS Testing. .................................................................................... 26 Table 3: Technically Feasible Testing Methodologies for HDDV I/M Program or
Screening Testing.............................................................................................................. 48

Texas A&M Transportation Institute
6
LIST OF FIGURES
Figure 1: The CARB Test Cycle “Power Curve” Developed for HDDV I/M Programs and Field Screening........................................................................................................... 14
Figure 2: IM240 Driving Schedule. .............................................................................................. 18 Figure 3: Photo of HDDV RSD Operations on a Road. ............................................................... 19 Figure 4: A Regression Analysis for RSD NO Emissions Results against PEMS NO
Emissions Results. ............................................................................................................ 21 Figure 5: Vancouver Test Results: Comparisons of Results Measured Using Conventional
RSDs (RSD Diesel) and SHED Methodology (SHED Diesel) as well as NOx Standards Associated with HDV MY. .............................................................................. 22
Figure 6: Photos of the NWWS. ................................................................................................... 25 Figure 7: SHED Testing Setup: (Top) NWWS Shed and (Bottom) Sampling Tent in Lane
1......................................................................................................................................... 27 Figure 8: SHED Testing of an HDDV. ......................................................................................... 28 Figure 9: The Test Shed Equipped with RSDs. ............................................................................ 30 Figure 10: SEMTECH-DS (Left) and EFM Installed on a Test Vehicle (Right). ........................ 31 Figure 11: Wager 6500 Smoke Meter (Left) and Partial Flow Adapter for the Opacity
Testing (Right). ................................................................................................................. 32 Figure 12: Sampling Cart Showing the MSS and Equipment for PM Filter Sampling. ............... 33 Figure 13: HDDV MY Distributions; (Top) HDDVs Registered in Five States, (Bottom)
HDDVs Identified from the State of Texas Only. ............................................................ 35 Figure 14: MY Distributions (Left y-Axis is for DMV Data and Right y-Axis is for
NWWS Data). ................................................................................................................... 36 Figure 15: Measured NOx Emissions Distributions for All HDDVs Travelling to/Passing
through the DFW Area...................................................................................................... 38 Figure 16: Comparisons between SHED Data and PEMS Data for NOx. .................................... 39 Figure 17: NOx Emissions Characterization Results - Test Vehicle # 6. ...................................... 40 Figure 18: NOx Emissions Rates Used in MOVES for Mobile Source Emissions
Estimation. ........................................................................................................................ 41 Figure 19: NOx Emissions Rates with Respect to MY. ................................................................ 42 Figure 20: MY Distributions of HDDVs and HEs (Left y-Axis is for Portions of HEs in
Percent (%) and Right y-Axis is for Total Number of HDDVs). ..................................... 43 Figure 21: Comparisons of Opacity Data to PEMS NOx Data. .................................................... 45 Figure 22: Comparisons of PM Filter Data to PEMS NOx Data. ................................................. 46 Figure 23: Measured CO Emissions Distributions for All HDDVs Traveling to/Passing
through the DFW Area...................................................................................................... 54 Figure 24: Comparisons between SHED Data and PEMS Data for CO. ..................................... 55 Figure 25: Comparisons of Opacity Data to PEMS CO Data. ...................................................... 56 Figure 26: Comparisons of PM Filter Data to PEMS CO Data. ................................................... 56 Figure 27: Measured HC Emissions Distributions for All HDDVs Traveling to/Passing
through the DFW Area...................................................................................................... 57 Figure 28: Comparisons between SHED Data and PEMS Data for HC. ..................................... 58 Figure 29: Comparisons of Opacity Data to PEMS HC Data. ...................................................... 59 Figure 30: Comparisons of PM Filter Data to PEMS HC Data. ................................................... 59 Figure 31: Measured PM Emissions Distributions for All HDDVs Traveling to/Passing
through the DFW Area...................................................................................................... 60
Texas A&M Transportation Institute
7
LIST OF ACRONYMS
ASM – Accelerated Simulation Mode
CAAA – Clean Air Act Amendment
CARB – California Air Resources Board
CFR – Code of Federal Regulations
CO2 – Carbon Dioxide
DFW – Dallas-Fort Worth
DIT – Dallas Intermodal Terminal
DMM – Dekati Mass Monitor
DMV – Department of Motor Vehicles
DPS – Department of Public Safety
DU – University of Denver
EFM – Electronic Flow Meter
EPA – U.S. Environmental Protection Agency
FWS – Ferris Weigh Station
GVWR – Gross Vehicle Weight Rating
HC – Hydrocarbons
HDDV/HDV – Heavy-Duty Diesel Vehicle/Heavy-Duty Vehicle
HD-OBD – Heavy-Duty On-Board Diagnostics
HE – High Emitter
I/M – Inspection and Maintenance
IR – Infrared
LDDV – Light-Duty Diesel Vehicle
LDGV – Light-Duty Gasoline Vehicle
LDV – Light-Duty Vehicle
MDDV/MDV – Medium-Duty Diesel Vehicle/Medium-Duty Vehicle
MSS – Microdilution Sampling System
MY – Model Year
NAAQS – National Ambient Air Quality Standards
NCTCOG – North Central Texas Council of Governments
NO – Nitrogen Monoxide
NO2– Nitrogen Dioxide
Texas A&M Transportation Institute
8
NOx – Oxides of Nitrogen
NWWS – New Waverly Weigh Station
O2 – Oxygen
O3 – Ozone
OBD – On-Board Diagnostics
PEMS – Portable Emissions Measurement System
PM – Particulate Matter
PR – Portable Roadside
RPM – Revolutions per Minute
RS – Remote Sensing
RSD – Remote Sensing Device
SAE – Society of Automotive Engineers
SCR – Selective Catalytic Reduction
SHED – Streamlined Heavy-Duty Emissions Determination
SIP – State Implementation Plan
TCEQ – Texas Commission on Environmental Quality
TRB – Transportation Research Board
TSI – Two-Speed Idle
TTI – Texas A&M Transportation Institute
TxDOT – Texas Department of Transportation
UV – Ultraviolet
WB – Water Brake

Texas A&M Transportation Institute
9
EXECUTIVE SUMMARY
This report summarizes the findings from the study titled “Heavy-Duty Diesel Inspection and Maintenance Pilot Program” performed by the Texas A&M Transportation Institute (TTI) in collaboration with the University of Denver (DU). This work was performed for the North Central Texas Council of Governments (NCTCOG) and the Texas Department of Transportation (TxDOT). This study provides the sponsoring agencies with information relating to the potential implementation of an Inspection/Maintenance (I/M) program for diesel vehicles, specifically heavy-duty diesel vehicles (HDDVs) in the Dallas-Fort Worth (DFW) area, for reduction of oxides of nitrogen (NOx) emissions.
As part of this project, the study team investigated literature and state of the practice on I/M approaches and methodologies, which included testing using on-board diagnostics (OBD), opacity measurement, idle testing, accelerated simulation mode (ASM) testing, IM240 testing, conventional remote sensing, particulate matter (PM) filter sampling, and chassis dynamometer testing using portable emissions measurement systems (PEMS).
The study team then conducted pilot testing at the New Waverly Weigh Station located on I-45 northbound in New Waverly, Texas. Through the two-week pilot test, several different emissions measurement methodologies were deployed, including streamlined heavy-duty emissions determination (SHED) and direct emissions measurements using PEMS. The pilot testing and on-site study enabled the study team to characterize the heavy-duty diesel vehicle (HDDV) traffic, to compare and validate various emissions measurement methodologies, and to evaluate application of SHED testing for HDDV inspection and maintenance (I/M) or screening purposes.
The findings from the study indicated that higher emitting vehicles did contribute a disproportionately large percentage of emissions (for example, 6.8% of vehicles at the test site were responsible for 19.2% of total NOx emissions measured). The findings support the notion that a HDDV I/M program or screening program has the potential for emissions reductions through identification and repair of high emitters (HEs). Applying the study results to available regional emissions characterization data indicates possible daily reductions of NOx to be as high as 5.3 tons per day if high-emitting vehicles instead produced emissions at fleet average levels.
A secondary finding in the study dealt with the NOx emissions of model year (MY) 2013 vehicles. The NOx emissions recorded during the study for MY 2013 vehicles were much higher than the previous four MYs, and nearly as high as the levels found in MY 2008 vehicles. The research team believes that the increased NOx emissions for the 2013 vehicles could possibly be due to the operation of the selective catalytic reduction (SCR) systems in these vehicles. It is possible that either the SCR systems were not operating at a high enough temperature, due to the nature of the driving through the SHED set-up, or that the SCR systems on these vehicles were not functioning properly or even disconnected. Further research is required to determine the exact nature of and causes for the observed higher NOx emissions for newer MY vehicles.
Texas A&M Transportation Institute
10
Based on the findings from this study, while a viable long-term solution to HDDV NOx I/M would be to use OBD (which will be standard on newer model year HDDVs), there is still a need for shorter-term solutions, and I/M options for older HDDVs. The SHED testing approach evaluated as part of this project can be beneficial for such I/M applications as well as for screening programs, as described below in the following.
• Implementation of a conventional I/M program based on SHED only – in which all HDDVs registered in the DFW area need to pass SHED testing.
• Alternatively, conventional remote sensing can be deployed at checkpoints to screen for potential HEs, similar to the light-duty vehicle (LDV) on-road inspection program, followed by SHED testing at a test facility.
• SHED testing can be used for preliminary screening, followed by chassis dynamometer testing for high-emitting HDDVs. This can be conducted through an approach similar to the LDV on-road inspection program, where vehicles screened as HEs (either through SHED or conventional remote sensing) are notified and required to pass an emissions test at a testing facility. Alternatively, vehicles can be made to pass through the SHED for real-time screening, followed by immediate testing of HEs using a chassis dynamometer set-up.
It is anticipated that further SHED validation or demonstrations will be needed before obtaining buy-in from various stakeholders including the U.S. Environmental Protection Agency (EPA) and the Texas Commission on Environmental Quality (TCEQ). Prior to implementing any program, factors that need to be considered in discussions with TCEQ and EPA include whether State Implementation Plan (SIP) credits would be granted, the emissions criteria that would be appropriate for categorizing the a vehicle as a HE, as well as aspects such as overall program design, detailed cost analysis, screening facilities and locations, reporting, penalties and enforcement, and quantification of benefits.
In addition, political and economic considerations will also needed in the development of an I/M program or rule. Outreach and incentive programs (for example, incentives or loans for repair or replacement of HEs), and linking the benefits of replacing HEs with fuel-efficient vehicles may also help in gaining public acceptance.
Some ideas to be addressed in future research include optimization of the SHED configuration to enable measurement for driving and accelerating at higher speeds, further refinements of how HEs are classified (i.e. using the same emissions cut points for all vehicles versus model year-specific categories), and additional studies that target local fleets in addition to long-haul vehicles that were a major part of this study.

Texas A&M Transportation Institute
11
CHAPTER 1: INTRODUCTION
To meet National Ambient Air Quality Standards (NAAQS), state and local agencies in nonattainment (NA) areas are evaluating new approaches and strategies for reducing mobile-source emissions. In the DFW area, the concept of implementing an I/M program for diesel vehicles was identified as one such feasible option. Currently I/M programs in Texas are limited to light-duty gasoline vehicles (LDGVs). However, diesel vehicles, especially HDDVs, are one of the most significant contributors to NOx emissions, one of the main precursors of ozone (O3). NOx is of regional significance to the DFW area, which is in nonattainment of the ozone NAAQS. Previous studies have shown that a small percentage of HEs in the HDDV fleet often contribute a disproportionately large share of overall emissions,1 and these vehicles can be targeted as part of emissions reduction programs.
Project Purpose This project provides NCTCOG and TxDOT with a pilot study relating to potential HDDV I/M program implementation. It provides an assessment of emissions from HDDV traffic through a pilot study, and identifies emissions measurement methodologies that can be useful for the implementation of an I/M or screening program.
To accomplish these goals, the TTI and DU study team investigated HDDV I/M programs and test methodologies used in other states, characterized NOx emissions from HDDVs through an on-site pilot testing study, and assessed the results and implications for HDDV I/M or screening programs.
The pilot testing was conducted at the New Waverly Weigh Station (NWWS) located on I-45 northbound in New Waverly, Texas. Through the two week pilot test, several different emissions measurement methodologies were deployed, including SHED and direct emissions measurements using PEMS. The pilot testing and on-site study enabled the study team to characterize the HDDV traffic that affects the DFW area air quality. The findings also allowed for comparison of emissions results from PEMS measurements and other methodologies including opacity, idling testing, PM filter sampling, as well as SHED testing.
Report Outline Following this introductory chapter, Chapter 2 provides general information on HDDV I/M programs and screening, various test methodology including conventional remote sensing (RS) testing, the new SHED testing, and applicability of conventional RS testing for screening purposes for an I/M program. The remainder of this report then describes the pilot testing conducted (Chapter 3), NOx emissions results from the pilot testing (Chapter 4, with results for other pollutants provided in Appendix A), and conclusions and recommendations regarding HDDV I/M program for the DFW area (Chapter 5). 1 Johnson, J, Lee, D.-W., Farzaneh, R., Zietsman, J., Yu, L. Characterization of Exhaust Emissions from Heavy-Duty Diesel Vehicles in the HGB Area – Final Report. FHWA/TX-12/0-6237-1, October 2011.

Texas A&M Transportation Institute
12
CHAPTER 2: DIESEL I/M PROGRAMS AND METHODOLOGIES
Diesel I/M Program Vehicle I/M programs are used to determine whether the emissions control system on a vehicle is working as designed. Vehicle I/M programs help improve air quality by identifying high-emitting vehicles in need of repair and requiring them to be repaired as a prerequisite to vehicle registration within a given nonattainment area.2 Since the first I/M program was implemented in New Jersey in 1974,3 32 U.S. states, including Texas, currently conduct I/M programs.4,5 Among the 32 states that conduct I/M programs 25 states have both gasoline and diesel I/M programs according to data from state Departments of Motor Vehicles (DMVs), state environmental agencies, and the U.S. Environmental Protection Agency (EPA).4,5 Among the states with diesel I/M programs, some have programs covering all light-duty diesel vehicles (LDDV), medium-duty diesel vehicles (MDDVs), and HDDVs while other states have programs for only specific vehicle types. Currently Texas, however, does not have any diesel I/M program.
Current Diesel I/M Programs Table 1 lists states that have diesel I/M programs, along with the vehicle types covered as part of the program, and specific approaches (testing methodologies) employed. Only nine states implement HDDV I/M programs and all of those states, except Oregon, use opacity testing for their program. Oregon uses OBD for newer MY HDDVs that are equipped with OBD systems for their engines (referred to as HD-OBD in this report). More detailed information for general and diesel I/M programs can be found in the previous TTI report, the state websites, and EPA.4
2 EPA. “Inspection & Maintenance (I/M),” http://www.epa.gov/otaq/im.htm, last accessed February 2013. 3 EPA. Guidance on Use of Remote Sensing for Evaluation of IM Program Performance. EPA-420-B-04-010, July 04. 4 I&M Reciprocity 2012 – Created by the Illinois EPA May 1, 2012, http://www.drivecleanpa.state.pa.us/service/reciprocity.pdf, last accessed in February 2013. 5 TTI. Investigation of Diesel I/M Program in the DFW Area. TWG Air Quality Planning Technical Analysis Task 2.1. Report prepared for TxDOT, August 2011.

Texas A&M Transportation Institute
13
Table 1: Diesel I/M Programs.
State Testing Methodology
LDDV MDDV↑ HDDV Arizona Opacity Opacity Opacity
California OBD OBD N/A* Colorado Opacity Opacity Opacity
Connecticut OBD or Loaded Mode Diesel Test N/A* Opacity
Delaware OBD N/A* N/A* Idaho OBD/Opacity N/A* N/A*
Illinois OBD OBD N/A* Maine N/A* N/A* Opacity
Massachusetts OBD for MY 1998 or newer vehicles
Opacity/OBD for MY 2007 or newer vehicles N/A*
Missouri OBD N/A* N/A*
Nevada Loaded Mode Diesel and Opacity/OBD Opacity/OBD N/A*
New Hampshire OBD N/A* N/A*
New Jersey OBD N/A* Opacity/Curbside Idle for vehicles of GVWRs** more than 18,000 ibs.
New Mexico OBD/Idle OBD/Idle N/A* New York OBD Opacity Opacity
North Carolina OBD N/A* N/A*
Ohio OBD/Opacity OBD/Opacity N/A*
Oregon OBD, Idle and Opacity N/A* OBD for MY 2013 or newer vehicles
Rhode Island OBD or Loaded Opacity N/A* N/A*
Tennessee OBD OBD for vehicles of GVWRs equal to or less than10,000 lbs. N/A*
Utah OBD N/A* Opacity Vermont OBD N/A* N/A* Virginia OBD N/A* N/A*
Washington Opacity Opacity Opacity Wisconsin OBD OBD N/A*
↑ The weight classification applied this table is based on California Air Resources Board (CARB) rule, Gross Vehicle Weight Ratings (GVWR) up to 14,000 lbs. (Data source: Illinois EPA,4 TTI,5 NCTCOG6.)
I/M versus Screening To save money and time for implementing I/M programs, EPA suggested “clean screening” as part of I/M programs. This term refers to the process of exempting a vehicle from a scheduled
6 NCTCOG. Personal conversations/data transfer, June 2011.

Texas A&M Transportation Institute
14
I/M emissions test.7 EPA defined clean screening methods to identify vehicles producing low emissions for purposes of exempting these relatively “clean” vehicles from their next scheduled test.8 EPA provided three methods for clean screening: conventional remote sensing devices (RSDs), vehicle emissions profiling (using statistics on the historic failure rate of vehicles of very similar design), and MY exemptions (on the premise that virtually all cars are clean when sold and most remain clean for at least several years).7
Additionally, CARB investigated the feasibility of HDDV I/M field screening for identifying HEs, as well as a wide-scale HDDV I/M program for NOx.9 In this concept, field screening would use portable roadside (PR) chassis dynamometers coupled with PEMS (referred to in this report as PR chassis testing with PEMS), while the wide-scale HDDV I/M program would use existing (repair-grade) water-brake (WB) chassis dynamometers with PEMS (called WB chassis testing with PEMS). For the field screening, it was planned that trucks operating on highways would be diverted to the PR chassis dynamometer setup, detached from their trailers and operated under a prescribed test cycle, called a “power curve,” which is shown in Figure 1.9
Figure 1: The CARB Test Cycle “Power Curve” Developed for HDDV I/M Programs and Field
Screening.
7 EPA. Clean Screening in Inspection and Maintenance Programs. EPA420-F-98-023, May 1998. 8 EPA. Program User Guide for Interim Vehicle Clean Screening Credit Utility. EPA420-P-98-007, May 1998. 9 Chernich, D. Development of a chassis Based Inspection and Maintenance Program for Heavy-Duty Diesel Powered Vehicles. 13th CRC Workshop, April 2003.

Texas A&M Transportation Institute
15
During the investigation CARB concluded that the HDDV field screening and a widely deployed I/M program were feasible from a technical standpoint. However CARB found difficulty in developing an effective NOx screening test based on the data collected during the investigation. This was due to several factors, most notably:
• Per vehicle emissions reductions from repairs were minimal (although there might be other unidentified engine problems that repairs did not address); and
• No clear cut point to screen out HEs.
Currently no HDDV HE screening is implemented although EPA’s MY exemption as a clean screening methodology has been widely adopted in I/M programs.
Testing Methodologies for I/M Programs As part of this study, the study team investigated various testing methodologies with possible applications for I/M programs, including:
• OBD testing; • Opacity testing; • Idle testing; • ASM testing; • IM240 testing; • Conventional RS testing; • SHED testing; • PM filter sampling; • WB chassis dynamometer testing with PEMS; and • PR chassis dynamometer testing with PEMS.
Three types of testing methodologies that are currently used by other states – OBD testing, opacity testing, and idle testing – are described in further detail in this section.
OBD Testing The Clean Air Act Amendment (CAAA) requires a computer-based OBD system to be built into all MY 1996 and newer LDVs, including both cars and trucks. OBD systems are designed to monitor the performance of major components of an engine including those responsible for controlling emissions.10 For heavy-duty vehicles (HDVs), either gasoline or diesel, the EPA issued a final rule to require OBD systems on heavy-duty engines used in vehicles weighing over 14,000 lbs.11 The HD-OBD is not available for MY 2012 or older HDDVs; therefore Oregon has only planned to use HD-OBD for their diesel I/M program for MY 2013 or newer HDDVs.
10 EPA. “On-Board Diagnostics (OBD),” http://www.epa.gov/obd/, accessed 2011. 11 EPA. “Heavy Duty Vehicles.” http://www.epa.gov/obd/regtech/heavy.htm.
Texas A&M Transportation Institute
16
During an emissions inspection, the analyzer plugs into the diagnostic link connector then checks and downloads stored information from the emissions-related components to identify those not working properly. Given the robust nature of today’s emissions control components of a vehicle, it is entirely possible for an individual component to malfunction without leading to an immediate increase in emissions at the tailpipe.12 In such cases, other components, such as the catalyst, can temporarily compensate for the broken or malfunctioning device. These other components can only do double duty for so long before they too begin to malfunction.12
An OBD test offers a short inspection time for the consumer and an accurate diagnosis of needed repairs.13 Many states have already incorporated OBD checks into I/M programs for LDVs as shown in Table 1. It is a quick testing methodology, but for HDDVs, it would not be feasible for several years until HDDVs equipped with HD-OBD are more prevalent on the roads.
Opacity Testing Opacity Testing, or smoke testing, is a methodology to measure smoke density, defined by opacity readings from a tailpipe while a vehicle idles. Using a smoke meter, the transparency, or opacity, of exhaust smoke from the tailpipe of a vehicle is measured. The higher the opacity the more smoke and PM that is being emitted. States conducting opacity tests follow the Society of Automotive Engineers (SAE) J1667 protocol.14
SAE J1667 is designed for use on a stationary vehicle. After the engine is warmed-up, the opacity is measured at its maximum governed engine speed idling (i.e., full throttle idling). Based on the smoke density produced at full throttle idling, opacity readings from 0% (no smoke) to 100% (smoke blocks entirely) are recorded. For I/M testing, the opacity readings are to compare the results to criteria values for determining pass or fail. For each vehicle, test time is normally 20-to-30 minutes including installation time. The J1667 test is used by most states conducting opacity testing with the exception of a few states that conduct opacity testing while LDVs are driving on a chassis dynamometer.
An opacity test provides an indirect measurement of particulate matter concentration from the vehicle’s tailpipe. The justification for using this methodology is that diesel vehicles with excessive smoke emissions are an indicator of poor vehicle maintenance and contribute to air pollution,15 which may or may not be directly related to NOx emissions. Most of the states that use the opacity testing for I/M programs are in PM nonattainment areas as well as ozone nonattainment areas.
12 EPA. “On-Board Diagnostics (OBD): Frequent Questions,” http://www.epa.gov/obd/questions.htm, accessed 2011. 13 EPA. “More States Are Using OBD for Vehicle Inspection and Maintenance Programs,” http://www.epa.gov/obd/pubs/inspection.pdf, accessed 2011. 14 SAE. Snap-Acceleration: Smoke Test Procedure for Heavy-Duty Diesel Powered Vehicles. February 1996. 15 Department of Environment Protection, State of New Jersey, http://www.nj.gov/dep/bmvim/bmvim_hddvip.htm.
Texas A&M Transportation Institute
17
Idle Testing Idle testing, or curbside idle/idle exhaust testing, measures pollutant emissions directly from tailpipes by emissions analyzers. For idle testing, there are two testing methodologies: single-speed and two-speed idle (TSI) testing. For single-speed idle testing, emissions testing is conducted at one engine speed, while the TSI testing is conducted at two different engine speeds: one low engine speed and one high engine speed.
For example, in Illinois, heavy-duty trucks receive a single-speed idle test (also referred to as a “steady state” test).16 In Texas, the Austin and El Paso I/M program areas use the TSI emissions inspection17 for designated vehicles (1995 or older light-duty gasoline vehicles [LDGVs]) not originally equipped with the second generation OBD (OBDII).18
During the idling, a vehicle’s exhaust emissions are measured by using emissions analyzers from the exhaust sample drawn through a probe inserted into the tailpipe. When analyzers are ready and a vehicle is warmed-up, the testing normally takes less than 15 minutes.
Additional I/M Testing Approaches In addition to the three methodologies described above and currently used in HDDV I/M programs, there are other methodologies that are available and are used for other types of vehicles such as LDVs and can be considered for HDDV I/M or screening. These methodologies include dynamometer testing and remote sensing testing. These methodologies are described in the following subsections.
Accelerated Simulation Mode/Loaded Mode Diesel Testing The ASM Test (or Loaded Mode Diesel Test) is an emissions testing methodology using a dynamometer that measures emissions under simulated driving conditions. During the test a vehicle runs at different speeds and different load conditions with or without any idle tests. While the vehicle runs at different test conditions, exhaust emissions are measured using emissions analyzers from the exhaust sample drawn through a tailpipe probe. Based on a comparison of the applicable test standards and the measured emissions values, a pass or fail determination is made. More detailed information is available in the EPA’s final technical guidance.19
16 Illinois EPA. “Understanding Idle Tests and Gas Cap Tests,” http://www.epa.state.il.us/air/vim/faq/types.html, accessed August 2011. 17 Texas Department of Public Safety. “FAQs: ASM/TSI Emissions Testing,” http://www.txdps.state.tx.us/vi/Misc/faq/faq_asm.htm, accessed August 2011. 18 Texas Department of Public Safety. “Inspection Criteria for the Annual SAFETY Inspection,” http://www.txdps.state.tx.us/vi/inspection/item_insp.asp, accessed August 2011. 19 EPA. Acceleration Simulation Mode Test Procedures, Emission Standards, Quality Control Requirements, and Equipment Specifications: Final Technical Guidance. EPA420B-04-011, July 2004, http://www.epa.gov/otaq/regs/im/420b04011.pdf, accessed August 2011.
Texas A&M Transportation Institute
18
In Connecticut, vehicle emissions for MY 1995 and older vehicles are measured using this loaded mode diesel testing.20 In Texas, the DFW and Houston/Galveston Area I/M programs use the ASM emissions inspection21 for designated vehicles (1995 or older LDGVs) not originally equipped with OBDII.18 After the analyzers, the dynamometer, and other necessary equipment are ready and the vehicle is warmed-up, testing normally takes less than 15 minutes. CARB’s HDDV I/M program and field screening methodology, described in the previous section, are a type of ASM testing with the only difference being the vehicles are tested under different driving conditions using PEMS.
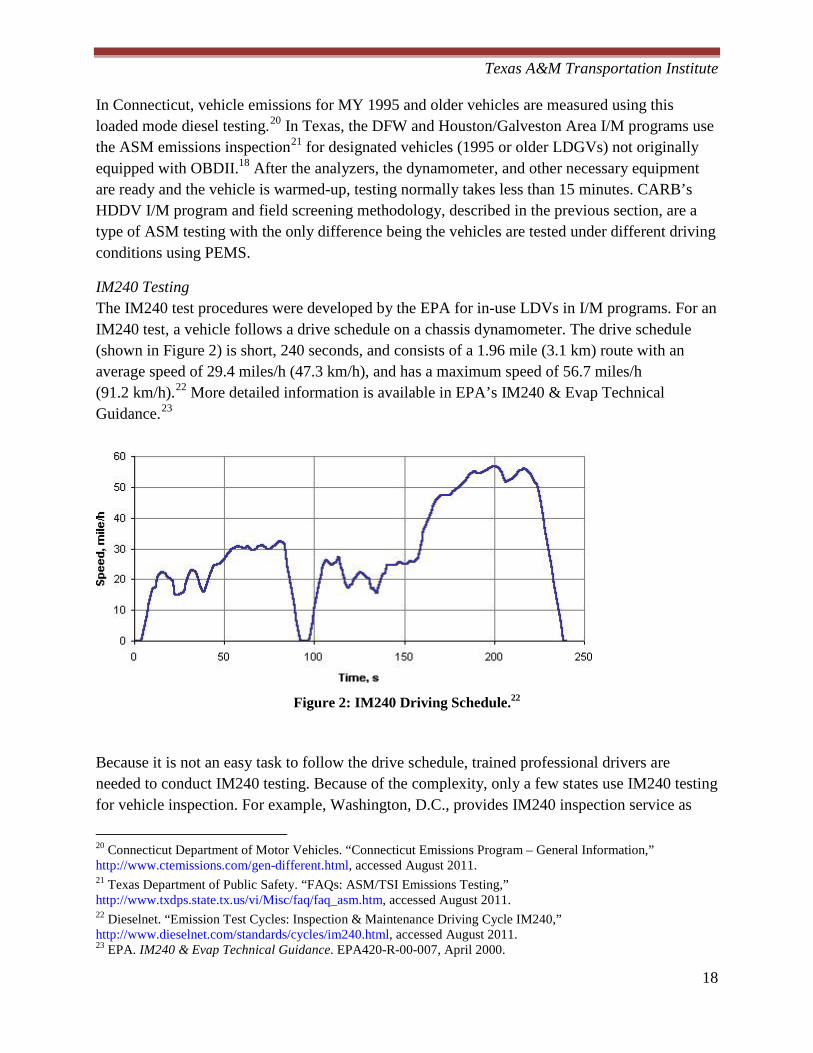
IM240 Testing The IM240 test procedures were developed by the EPA for in-use LDVs in I/M programs. For an IM240 test, a vehicle follows a drive schedule on a chassis dynamometer. The drive schedule (shown in Figure 2) is short, 240 seconds, and consists of a 1.96 mile (3.1 km) route with an average speed of 29.4 miles/h (47.3 km/h), and has a maximum speed of 56.7 miles/h (91.2 km/h).22 More detailed information is available in EPA’s IM240 & Evap Technical Guidance.23
Figure 2: IM240 Driving Schedule.22
Because it is not an easy task to follow the drive schedule, trained professional drivers are needed to conduct IM240 testing. Because of the complexity, only a few states use IM240 testing for vehicle inspection. For example, Washington, D.C., provides IM240 inspection service as
20 Connecticut Department of Motor Vehicles. “Connecticut Emissions Program – General Information,” http://www.ctemissions.com/gen-different.html, accessed August 2011. 21 Texas Department of Public Safety. “FAQs: ASM/TSI Emissions Testing,” http://www.txdps.state.tx.us/vi/Misc/faq/faq_asm.htm, accessed August 2011. 22 Dieselnet. “Emission Test Cycles: Inspection & Maintenance Driving Cycle IM240,” http://www.dieselnet.com/standards/cycles/im240.html, accessed August 2011. 23 EPA. IM240 & Evap Technical Guidance. EPA420-R-00-007, April 2000.

Texas A&M Transportation Institute
19
well as OBD and idle testing.24 After all analyzers, the dynamometer, and other necessary equipment are ready and a vehicle is warmed-up, the testing normally takes less than 15 minutes.
Conventional Remote Sensing Remote sensing is a way to measure pollutant levels in a vehicle’s exhaust while the vehicle is traveling down the road.25 Figure 3 shows a picture of RS testing on a roadway. Commercial RSDs operate by continuously projecting a beam of infrared (IR) and/or ultra violet (UV) radiation across a roadway. As a vehicle passes through the beam, the device measures the ratio of pollutants to carbon dioxide (CO2) in front of the vehicle and in the exhaust plume behind. The RSD uses the before measurement as a baseline and calculates the vehicle’s emissions rate by comparing the behind measurement to the expected ratio for ideal combustion.25 Average speed and acceleration are also measured to help determine the operational mode of the vehicle, which helps determining when “off-cycle” operation is occurring (for example, aggressive acceleration, when vehicles can be expected to have higher than normal emissions).26
Figure 3: Photo of HDDV RSD Operations on a Road.27
24 Washington, D.C., Department of Motor Vehicles. “Vehicle Inspections - Clean Air,” http://dmv.dc.gov/serv/inspection/inspection_main.shtm, accessed August 2011. 25 EPA. Remote Sensing: A Supplemental Tool for Vehicle Emission Control, EPA420-F-92-017, 1992. 26 ERG., Estimating Benefits and Costs of Improvement Strategies for the California I/M Program: Implementation Options for Using RSD; Report Version 9 (final). March 2, 2008. 27 Bishop, G., Schuchman, G., Stedman, D., Lawson, D. “Emission Changes Resulting from the San Pedro Bay, California Ports Truck Retirement Program.” Environmental Science & Technology, 2012, 46(1), pp. 551-558.
RSD (light source) RSD (detector)
Texas A&M Transportation Institute
20
When the RSDs and other equipment is prepared, the RS measurements for each vehicle can take less than a second. However, such quick testing results can produce uncertainty about the quantitative significance of a measurement made over only about ½ second during which there is no detailed knowledge about the driving mode of the vehicle.28
During the literature review, it was found that RS testing was recommended for screening purposes. For example, the Committee on Vehicle Emission Inspection and Maintenance Programs of the Transportation Research Board (TRB) stated that RS can be a useful screening tool to identify vehicles likely to pass or fail conventional I/M program tests.29 Additionally, RSDs were recommended by the EPA as a part of enhanced I/M programs for clean screening.
Further detail on conventional RS testing for HDDVs can be found in previous research such as the San Pedro Bay HDDV RS Testing.27 In addition Vescio et al.30 conducted pilot testing to capture data and information related to in-use emissions from commercial trucks crossing the US-Mexico border at Nogales, Arizona, using conventional RSDs, and to directly correlate the RS emissions measurements against PEMS measurements for the same truck taken at the same time. Their regression analysis results in Figure 4 show a good correlation between the conventional RSD and PEMS measurements of nitrogen monoxide (NO), the main component of vehicular NOx emissions. In Figure 4, the x-axis shows that the ratio of NO over CO2 concentrations (in parts per million [ppm]) measured by PEMS while y axis shows the ratio measured by conventional RSD. (These ratios can be converted to gram of NO/kg of CO2, the conventional unit used for RS data, by multiplying by a conversion factor of 681.8.) As shown in Figure 4, the linear regression line is very close to one another with a small y-intercept value, indicating conventional RSD emissions results can be used for HDDV I/M screening purposes for NOx.
28 Slott, R. Remote Sensing Measurement of Real World Vehicle High-Exhaust Emitters: Interim Report. CRC Project no. E-23, April 2002. 29 TRB. Evaluating Vehicle Emissions Inspection and Maintenance Programs. National Academies Press, p. 10, 2001. (ISBN: 0-309-56537-5). 30 Vescio, N., Full, G., Fraser, J., Balon, T., Grumet, S., Lowell, D., McClintock, M. Cross Border In-Use Emissions Study for Heavy Duty Vehicles, Nogales, AZ – Final Report. Prepared for the Arizona DEQ and EPA. September 8, 2006.

Texas A&M Transportation Institute
21
Figure 4: A Regression Analysis for RSD NO Emissions Results against PEMS NO Emissions
Results.
SHED Testing SHED testing is a new emissions measurement methodology (developed by the DU researchers on the study team) that was the focus of testing conducted in this study. Prior discussions with NCTCOG and TxDOT indicated that the SHED approach might be beneficial for a HDDV I/M program or screening testing in the DFW area, and the evaluation of this approach was therefore the focus of this testing study. In addition to the testing conducted as part of this project, DU researchers (along with Envirotest Canada) also compared the SHED methodology with RS measurements during another study in Vancouver, Canada.31 During the study, RSD measurements were followed immediately by SHED measurements. In the study, they found good agreement between SHED results and RS results, in general, as shown in Figure 5.
31 Envirotest Canada. Greater Vancouver Regional District Remote Sensing Device Trial for Monitoring Heavy-Duty Vehicle Emissions. March 2013.

Texas A&M Transportation Institute
22
Figure 5: Vancouver Test Results: Comparisons of Results Measured Using Conventional RSDs (RSD Diesel) and SHED Methodology (SHED Diesel) as well as NOx Standards Associated with
HDV MY.
For the SHED testing, a vehicle drives under a tent-like structure. The exhaust accumulates under the roof of the tent and is sucked into a longitudinal perforated tube under the tent. The perforations in the tube are designed such that the air is sampled into the tube while the vehicle drives through the tent. Then, the exhaust mixed with air in the tent is directed to intakes of a set of instruments measuring CO2, NOx, and other pollutants such as carbon monoxide (CO), hydrocarbons (HC), and PM. More details of the testing and set-up are described and shown in Chapter 3.
When conducting SHED testing, HDDV emissions can be detected remotely, and the emissions results can be instantly reported in a manner similar to that of conventional RS testing. However, SHED testing is different from the conventional RS testing in that there is greater measurement time – SHED testing measures accumulated emissions unlike the instantaneous measurement for RS, and could potentially provide more reliable results. Additionally, if this approach were to be implemented in the region by TCEQ and the Texas Department of Public Safety (DPS), there is

Texas A&M Transportation Institute
23
the possibility of using existing emissions analyzers used for IM240 and/or ASM testing in the DFW area instead of purchasing (expensive) commercial RSDs.

Texas A&M Transportation Institute
24
CHAPTER 3: HDDV PILOT EMISSIONS TESTING
The pilot test was conducted at the NWWS, located on I-45 in New Waverly, Texas from June 11 through June 22, 2012. The pilot test enabled the study team to characterize the truck traffic heading northbound on I-45 and to assess emissions from those vehicles using the SHED testing methodology. In addition to SHED testing truck traffic on I-45, 10 additional HDDVs (recruited separately and designated as additional test vehicles) were outfitted with PEMS and tested at the site. This was performed to confirm validity of the SHED data by comparing the results with the data measured by PEMS, which are accepted systems to accurately measure the in-use emissions of vehicles. Other methodologies such as opacity testing, idling testing, and PM filter sampling were also examined on these test vehicles.
Pilot Testing Design Prior to the pilot testing, the study team designed a test plan focusing on NOx emissions reduction with respect to a HDDV I/M program or high-emitting HDDV screening program. Through the pilot testing, the study team planned to:
• Examine emissions from actual HDDV traffic heading northbound of I-45 (toward the DFW area) using SHED methodology, and determine the portion of HEs among the HDDVs;
• Assess the possible effectiveness of HDDV I/M based on the results from SHED testing; and
• Examine the validity of SHED data and data collected using other methodologies.
Test Location and Dates In investigating possible pilot test locations, the study team and NCTCOG identified the following possible locations:
• Ferris Weigh Station (FWS) on I-45 northbound in Dallas County; • Dallas Intermodal Terminal (DIT) at I-45 southbound in Dallas County; and • NWWS on I-45 northbound in Walker County.
The first two sites, FWS and DIT, are located in Dallas County, and were initially considered good candidates since all HDDVs passing through these locations represent vehicles that would affect the DFW area air quality. However, the FWS did not have any fixtures or shed areas, which are essential for setting up SHED testing and the study team could not get permission to use the DIT site for the testing.
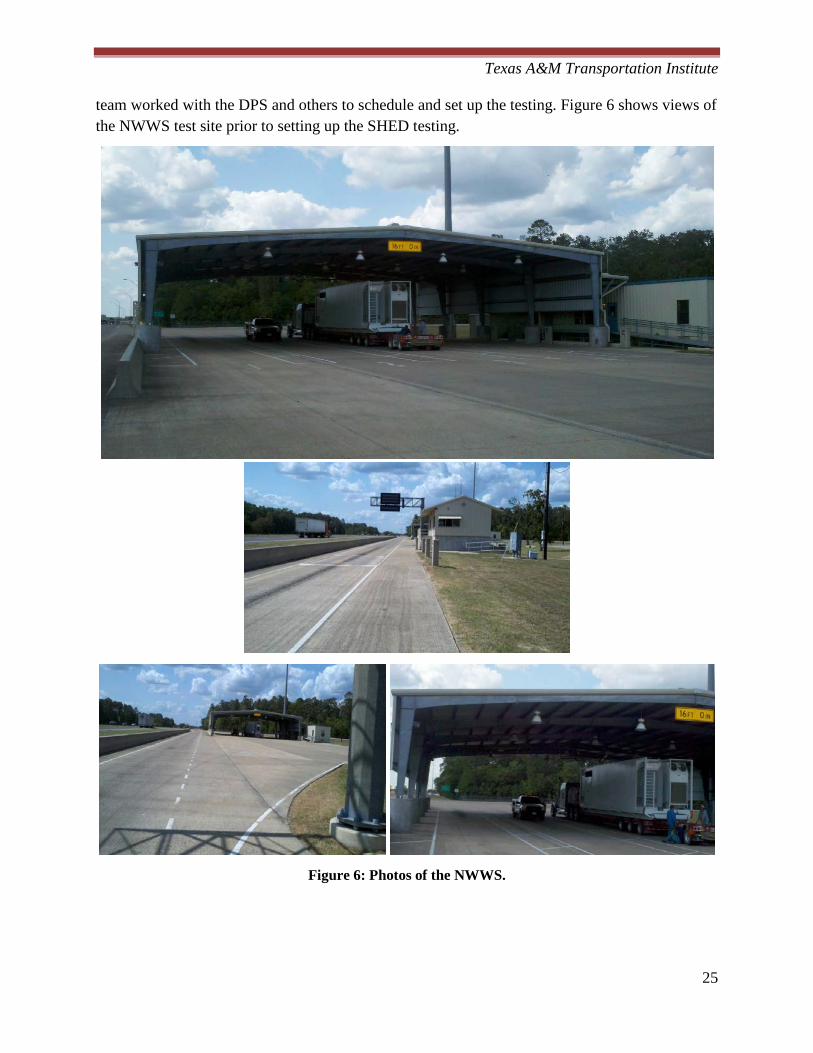
The NWWS, which had a shed area suitable for the test set-up, is located about 150 miles south of Dallas. Through analysis of traffic volumes and knowledge of major truck routes in the region, the research team confirmed that despite the relative distance from Dallas, a majority of the trucks passing through NWWS were headed for the DFW area. This established the NWWS as a good candidate location for the pilot testing. After final approval from NCTCOG, the study
Texas A&M Transportation Institute
25
team worked with the DPS and others to schedule and set up the testing. Figure 6 shows views of the NWWS test site prior to setting up the SHED testing.
Figure 6: Photos of the NWWS.

Texas A&M Transportation Institute
26
Designated Test Vehicles As mentioned previously, in addition to SHED testing for vehicles diverted from the I-45 traffic, additional testing was performed to examine the validity of data collected by SHED testing and to study other possible methodologies. This was performed through comparisons with PEMS data for 10 HDDV tractors that were recruited and used with a loaded trailer as designated test vehicles. The gross vehicle weight for the test tractor-trailer combination was approximately 70,000 lbs. (varying slightly due to the actual weight of the tractor). More detailed vehicle specifications of the 10 HDDVs are shown in Table 2. The vehicle number matches with the test date; that is, vehicle number 1 was tested on the first day, vehicle number 2 on the second day, etc.
The vehicle selection was based on Texas vehicle MY distributions and HDDV emissions standards, which resulted in the following recommended MY distribution for the test vehicles:
• 1 vehicle with MY 1997 or older; • 4 in MY 1998 – 2003 range; • 3 in MY 2004 – 2006 range; and • 2 in MY 2007 or newer.
After determining the MY distribution, the study team recruited the designated test vehicles to participate in the study.
Table 2: HDDVs Used in PEMS Testing.
Vehicle Number Make Model Year Engine Odometer Reading
1 Freightliner 2001 Detroit Diesel - DDC60 216,640
2 Kenworth 1997 3406CAT 747,999
3 Freightliner 2003 Detroit Diesel - DDC60 102,079
4 Freightliner 2005 Caterpillar - CATC15 690,977
5 Freightliner 2006 Detroit Diesel - DDC60 490,339
6 Freightliner 2003 Cummins ISM (rebuilt) 892,343
7 Freightliner 2006 Cummins ISX 530 882,829
8 Freightliner 2000 Detroit Diesel - DDC60 698,016
9 Kenworth 2012 Cummins ISX15 500 10,100
10 Kenworth 2011 Detroit Diesel - DD15 134,940
Texas A&M Transportation Institute
27
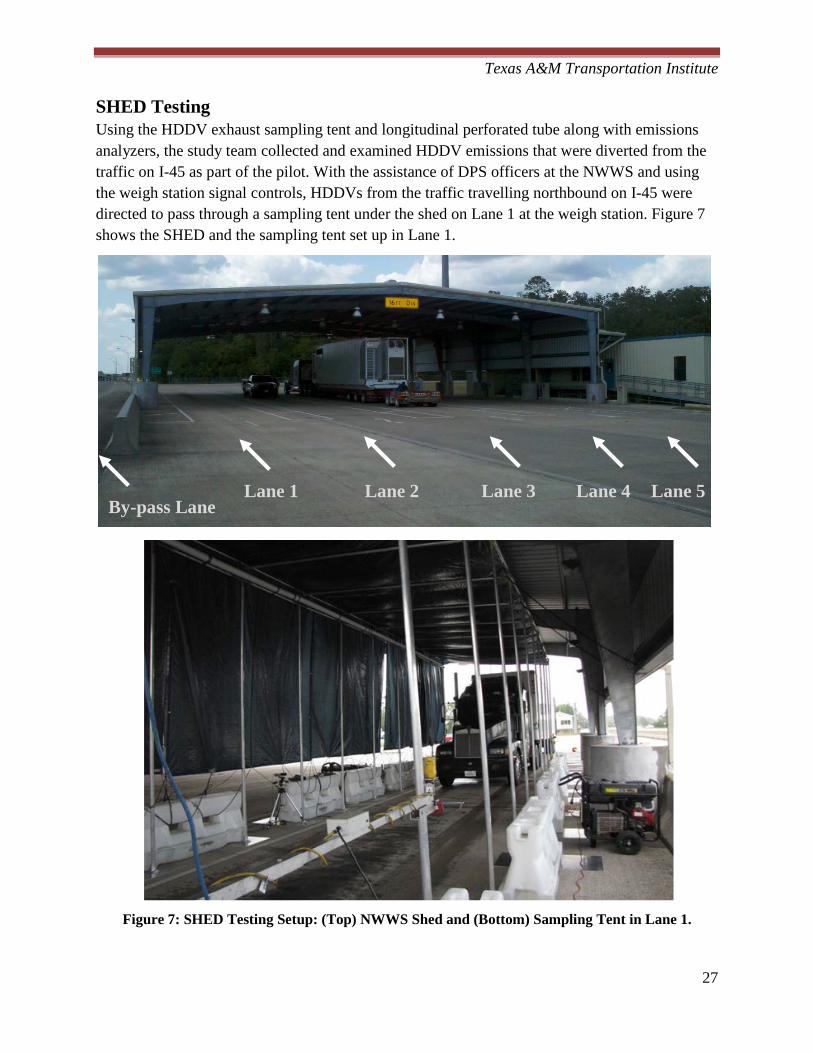
SHED Testing Using the HDDV exhaust sampling tent and longitudinal perforated tube along with emissions analyzers, the study team collected and examined HDDV emissions that were diverted from the traffic on I-45 as part of the pilot. With the assistance of DPS officers at the NWWS and using the weigh station signal controls, HDDVs from the traffic travelling northbound on I-45 were directed to pass through a sampling tent under the shed on Lane 1 at the weigh station. Figure 7 shows the SHED and the sampling tent set up in Lane 1.
Figure 7: SHED Testing Setup: (Top) NWWS Shed and (Bottom) Sampling Tent in Lane 1.
Lane 1 Lane 2
Lane 3 Lane 4 Lane 5 By-pass Lane

Texas A&M Transportation Institute
28
Set-Up The SHED testing used a long tent as a sampling chamber, or sampling tent, to collect an integral exhaust sample of six seconds (on average) for each HDDV that passed through the sampling tent. The exhaust sample would then be analyzed using a set of emissions analyzers. During the testing, HDDV drivers were asked to stop before the entrance of the sampling tent, interviewed briefly, and asked to drive through the sampling tent. Figure 8 shows an HDDV as it passes through the sampling tent after an interview. Brief interviews were conducted with the drivers to obtain as much information as possible with regard to vehicle destination and vehicle MY. The interviewer recorded the information provided by the driver and license plate number using a voice recorder for each vehicle as it passed through the tent.
Figure 8: SHED Testing of an HDDV.
The sampling tent, which was designed and constructed by the study team, was 50 feet long, 12 feet wide, and approximately 15 feet high at its apex. It was covered with tarps on the top and right sides (from the driver’s view point as shown in Figure 8) to capture emissions from HDDV
Sampling Tube
A Test HDDV
Interviewer

Texas A&M Transportation Institute
29
exhaust stacks. The set-up was chosen to capture the exhaust based on a typical HDDV set-up, which usually has the exhaust tubes in the upper right hand of the vehicle behind the cabin. The length of the tent allowed exhaust from an accelerating high-tailpipe HDDV to be contained and collected, and consisted of multiple accelerator positions as the vehicle up-shifted while gaining speed. Down the right hand side of the of the tent was the sampling tube, a 4-inch diameter 50-foot long pipe, about 14 feet above the roadway with 50 holes drilled one foot apart.
The perforations in the tube were designed such that the air sampled into the tube at the upstream end of the tube accelerates along the tube at about the same rate as the vehicle drives through. This feature allows the tube to add fresh exhaust to the initial exhaust in such a way that an integrated peak arrives at the end of the tube as the vehicle leaves the structure. An inline air fan drew air mixed with vehicle exhaust down the tube to a set of emissions analyzers for integral measurement.
Validation Testing with PEMS To validate data collected using the SHED methodology, HDDV emissions from the designated trucks were collected using PEMS while the HDDVs drove through the sampling tent. This allowed their emissions to be collected using the SHED analyzers and PEMS simultaneously. In addition to the stop-and-go test condition used when testing the actual traffic being diverted from I-45, the study team also measured the test truck emissions (using PEMS and SHED analyzers) for different driving conditions. The additional testing conditions included cruising through the tent at speeds ranging from 10 mph to 30 mph, as well as accelerating through the test with beginning speeds (at the entrance of the tent) ranging from 10 mph to 30 mph.
For these additional testing conditions, however, most test data for the SHED results were invalid because the data measured was under the detection limits. Even at the 10 mph cruise condition, the study team observed air wakes while test vehicles drove through the tent. It is possible that the sampling tent configuration caused the air wakes that resulted in vigorous mixing with ambient air (and potentially resulted in emissions not reaching the analyzers). Consequently, emissions were under the detection limits in most cases for these additional testing conditions. Optimization of the sampling tent and pipe configurations, such as a wider tent and larger and more holes on the sampling tube, would possibly allow for valid emissions measurements to be collected at these conditions. Due to lack of valid data, emissions results from the 10 vehicles discussed in this report are only from the stop-and-go condition, the same condition for SHED testing with HDDVs from the I-45 traffic.
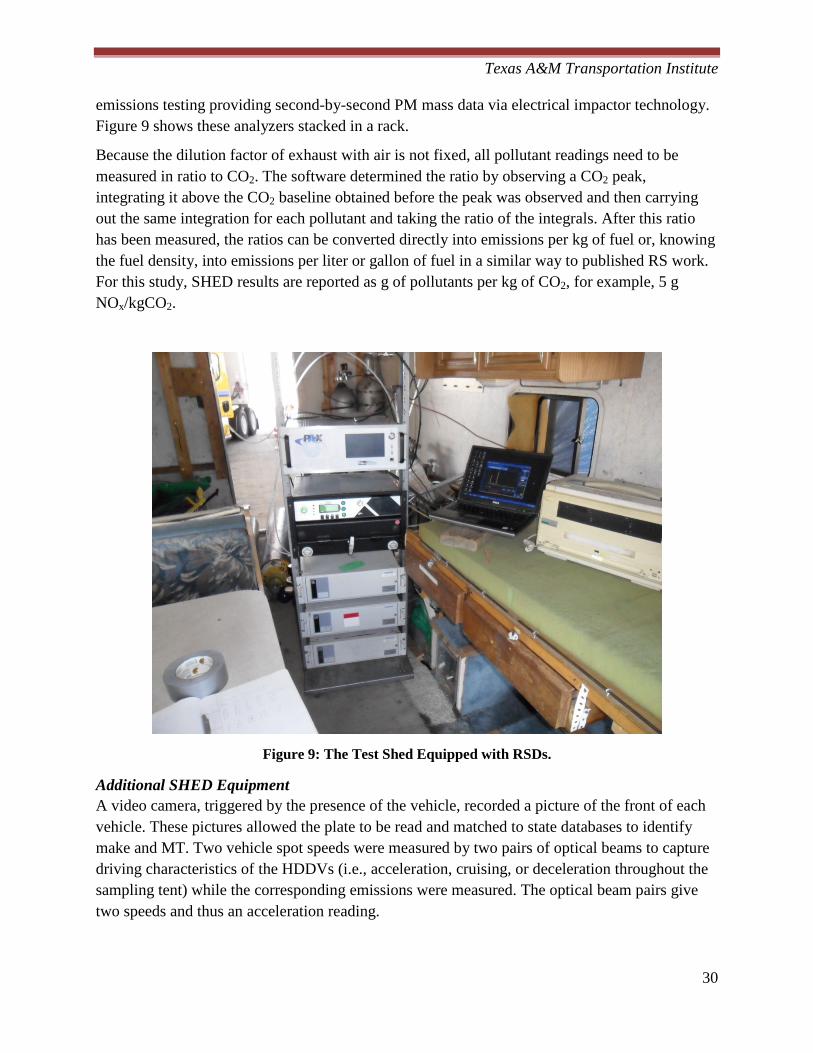
SHED Emission Analyzers To measure emissions of gaseous pollutants, a Horiba AIA 240 CO CO2 analyzer and a FCA 240 HC NOx analyzer, which are typically used for IM240 tests, were used. The analyzers measured CO and CO2 via IR spectroscopy, total HC using a flame-ionization detector, and NOx via a chemiluminescence methodologies. For PM emissions measurement, a Dekati Mass Monitor (DMM) was used. The DMM 230-A is a real time PM measuring instrument for vehicular
Texas A&M Transportation Institute
30
emissions testing providing second-by-second PM mass data via electrical impactor technology. Figure 9 shows these analyzers stacked in a rack.
Because the dilution factor of exhaust with air is not fixed, all pollutant readings need to be measured in ratio to CO2. The software determined the ratio by observing a CO2 peak, integrating it above the CO2 baseline obtained before the peak was observed and then carrying out the same integration for each pollutant and taking the ratio of the integrals. After this ratio has been measured, the ratios can be converted directly into emissions per kg of fuel or, knowing the fuel density, into emissions per liter or gallon of fuel in a similar way to published RS work. For this study, SHED results are reported as g of pollutants per kg of CO2, for example, 5 g NOx/kgCO2.
Figure 9: The Test Shed Equipped with RSDs.
Additional SHED Equipment A video camera, triggered by the presence of the vehicle, recorded a picture of the front of each vehicle. These pictures allowed the plate to be read and matched to state databases to identify make and MT. Two vehicle spot speeds were measured by two pairs of optical beams to capture driving characteristics of the HDDVs (i.e., acceleration, cruising, or deceleration throughout the sampling tent) while the corresponding emissions were measured. The optical beam pairs give two speeds and thus an acceleration reading.

Texas A&M Transportation Institute
31
PEMS Equipment As discussed previously, 10 test vehicles were selected (and recruited in advance) for the extended PEMS testing to examine validity of data collected by SHED testing and other methodologies. Technologies tested during this pilot testing included snap idle with opacity (smoke) meter and regular or high idling with PEMS and/or PM samplers as well as with SHED testing. For comparisons with SHED testing, the test vehicles (while equipped with PEMS) were driven through the sampling tent, following a pre-determined set of driving conditions, including different speeds and other driving characteristics such as cruise and acceleration as well as stop-and-go (the same set-up for SHED testing). For this comparison test, the test vehicles passed through the sampling tent multiple times (at least three times) for each driving characteristic set-up.
The SEMTECH-DS is a PEMS, which complies with the EPA’s Code of Federal Regulations (CFR) Title 40 Part 1065 (called 40 CFR 1065) field testing emissions instrument requirements, was used for emissions testing during the idling and comparison tests. It consists of a set of gas analyzers to measure gaseous emissions of NOx, CO, CO2, HC, and oxygen (O2) in the exhaust. The SEMTECH-DS is used in conjunction with the SEMTECH electronic flow meter (EFM), which measures the vehicle exhaust flow rate. This allows for calculating exhaust mass emissions from all measured gasses. Figure 10 shows the SEMTECH-DS and EFM installed on a HDDV during the testing.
Figure 10: SEMTECH-DS (Left) and EFM Installed on a Test Vehicle (Right).

Texas A&M Transportation Institute
32
Other Testing Idle testing, including idle opacity testing and other idling tests under different engine speeds, were also performed on these 10 vehicles using a smoke meter and a filter sampling system to examine those idling test methodologies for the I/M testing/screening purpose.
Idling Testing with Opacity Meter TTI uses a Wager 6500 Smoke Meter for opacity testing. The smoke meter shown in Figure 11 detects and measures the opacity of the smoke emitted from the exhaust of a vehicle according to SAE J1667. The system includes a partial flow head that collects only a small sample of the exhaust flow to complete the measurement.
The SAE J1667 procedure tests the opacity of a vehicle using the snap-acceleration method. This consists of having the smoke meter being placed on the exhaust outlet of the idling vehicle. At this point the vehicle goes through a set of at least three snap-accelerations, where the vehicle is quickly revved up from a normal idle revolutions per minute (RPM) to its maximum RPM speed. Each time this opacity meter records the amount of light that passes through the smoke coming out of the exhaust. The results of the three snap-accelerations are then averaged together to give an overall opacity rating for the vehicle being tested.
Figure 11: Wager 6500 Smoke Meter (Left) and Partial Flow Adapter for the Opacity Testing
(Right).
Idling Testing with Filter Samples In addition to the opacity testing, PM emissions during the idling tests were also collected on PM filters at two different idling speeds – regular and high idle – for each vehicle. For PM filter samples, TTI used a microdilution sampling system (MSS). The exhaust is transferred through a heated line to the MSS from a probe in the outlet of the SEMTECH EFM. The MSS uses an ejector pump to dilute PM samples before collecting them on PM filters. Figure 12 shows the TTI MSS and a filter sampling system used for PM filter collection.

Texas A&M Transportation Institute
33
Figure 12: Sampling Cart Showing the MSS and Equipment for PM Filter Sampling.
Texas A&M Transportation Institute
34
CHAPTER 4: PILOT TESTING RESULTS FOR NOX
During the pilot testing, the study team collected emissions data from several HDDVs using the SHED set-up and interviewed the drivers of the vehicles for their destinations. The study team also collected emissions data using PEMS on 10 test vehicles in addition to the SHED instruments for comparison. This chapter details the NOx results found from the testing while results for all other pollutants are presented in Appendix A. The testing results in this study are reported in units of grams of NOx (or other pollutant) per kilogram of CO2 (i.e. gNOx/kgCO2). This is the general form for reporting results from remote sensing devices, where emissions are reported as a ratio of CO2 emissions or fuel consumption, since no exhaust volume is available to allow calculating absolute emissions. This is the same case with the SHED technology employed in this study. Due to this, reporting results in terms of absolute emissions values, or conversion to standard measurement units of gNOx/bhp-hr to allow comparisons with EPA NOx engine certification standards is not possible for SHED data. The PEMS data results for the 10 test vehicles are therefore also reported in the same units for consistency.
SHED Testing HDDV Fleet Analysis During the RS emissions testing, with assistance from DPS officers at the NWWS, the study team was able SHED test a total of 1,367 HDDVs. Team members took pictures of license plates of those HDDVs and interviewed the drivers of the HDDVs when possible. The license plate picture and interview results were used to identify vehicle MY information and to determine if the HDDVs would affect air quality in the DFW area (i.e., whether they were traveling to, or passing through, the DFW area). Based on the interviews of drivers of 1,312 HDDVs (out of 1,367 total), a majority (1,001 out of 1,312 or 76.3%) were identified to travelling to, or passing through, the DFW area. The results confirm that the NWWS test site selection was appropriate to examine emissions of HDDVs that would affect the DFW area air quality.
For HDDV MY distribution analysis, the study team obtained registration data from 706 HDDVs of the 1,312 HDDVs interviewed, from databases of five states where vehicle registration data could be accessed. The five states where registration data was available were California, Illinois, Oklahoma, Oregon, and Texas. Among the 706 HDDVs identified, a majority (556, nearly 80%) were registered in Texas. The identified HDDV MYs varied from 1989 to 2013. Figure 13 shows the MY distributions of all the HDDVs for which model year information was available as well as the MY distribution for Texas-registered vehicles only.

Texas A&M Transportation Institute
35
Figure 13: HDDV MY Distributions; (Top) HDDVs Registered in Five States, (Bottom) HDDVs
Identified from the State of Texas Only.
Model Year
1989
1990
1991
1992
1993
1994
1995
1996
1997
1998
1999
2000
2001
2002
2003
2004
2005
2006
2007
2008
2009
2010
2011
2012
2013
Num
ber o
f Veh
icle
s (R
egis
tere
d in
5 S
tate
s)
0
20
40
60
80
100
Model Year
1989
1990
1991
1992
1993
1994
1995
1996
1997
1998
1999
2000
2001
2002
2003
2004
2005
2006
2007
2008
2009
2010
2011
2012
2013
Num
ber o
f Veh
icle
s (T
X Li
cens
e P
late
s)
0
20
40
60
80
100
Texas A&M Transportation Institute
36
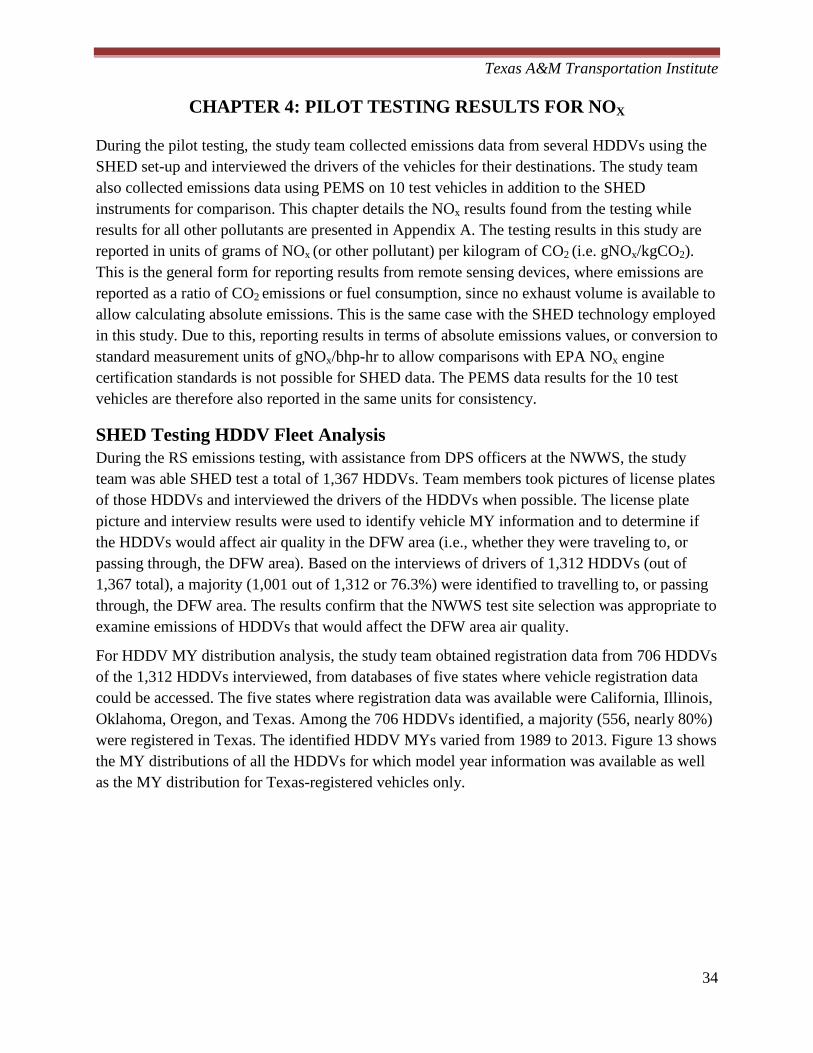
As shown in Figure 13, both MY distributions are similar to each other. It was observed that there were very few HDDVs from 1994 or older. The number of HDDVs showed peaks at MY 2000, MY 2007, and MY 2012, and the numbers were shown to generally increase as MY increases from MY 1995 to MY 2007 and then again from MY 2008 to MY 2012. A few 2013 MY HDDVs were observed as well.
Additionally, the observed MY distributions data for Texas is similar to statewide registration data from the Texas Department of Motor Vehicles (DMV).32 Figure 14 shows both the observed NWWS data and the DMV data. It should be noted however, that for newer MYs, the DMV data showed a lower number of vehicles since it is based on data from January 2012 (earlier than the testing dates June 2012).
Figure 14: MY Distributions (Left y-Axis is for DMV Data and Right y-Axis is for NWWS Data).
32 Texas Department of Motor Vehicles. “Class 8 HDDV MY Distributions on January 30, 2012.”

Texas A&M Transportation Institute
37
SHED NOx Emissions Characterization Results The study team conducted NOx emissions analysis using the NOx emissions data from the HDDVs that were determined to be traveling to, or passing through, the DFW area. Figure 15 shows the number of HDDVs with respect to their emissions measured by the SHED methodology. The SHED NOx emissions results were categorized in 13 different ranges, with the increments of 5 g of NOx/kg of CO2 for the first 10 ranges (up to 50 g of NOx/kg of CO2) and 10 g for the remaining three (up to 80g of NOx/kg of CO2, which covers the highest observed emissions of 73.1 g/kg of CO2).
The SHED NOx emissions results shown, as seen in Figure 15, are summarized in the following.
• The greatest number of HDDVs fell in the lowest emissions range from 0 to 5 g NOx/kg of CO2).
• For the other 12 ranges, the observed number of vehicle distributions was in a bell shape, peaking at the 15–20 g range.
• For the ranges of 35–40 g and higher, the corresponding numbers of vehicles were much less than those with emissions less than 35 g; only 6.8% of vehicles emitted 35 g or higher NOx/kg of CO2.
The average NOx emissions for all observed HDDVs in this data set were 17.24 g of NOx/kg of CO2. Defining vehicles that emitted 35 g of NOx/kg of CO2 (about twice the average) or more as HEs, these HEs (6.8% of all HDDVs) were found to be responsible for 19.2% of total NOx emissions from all of the HDDVs. It should be noted that this definition of a HE was based on a study of the data and the distribution of observed emissions rates to identify a suitable cut point. However, similar results were found if alternate definitions of a HE are used (such as vehicles showing disproportionately high emissions when compared to others in their MY category). These findings are discussed later in this chapter.

Texas A&M Transportation Institute
38
Figure 15: Measured NOx Emissions Distributions for All HDDVs Travelling to/Passing through
the DFW Area.
Comparison with PEMS Data and MOVES Rates In this section, SHED data from the previous section are compared with the PEMS data collected during SHED testing. The PEMS data are also characterized with respect to vehicle operating conditions using operation mode bins in MOVES, the official EPA mobile source emissions model.
Figure 16 shows the regression analysis of the comparison of SHED data and PEMS data. As shown in Figure 16, although SHED data overestimated NOx emissions, SHED data are well correlated with PEMS data, having a coefficient of determination (R2) of 0.8081.
0
30
60
90
120
150N
umbe
r of V
ehic
les
NOx Emission Range (gNOx/kgCO2)
6.8% HDDVs (NOx ≥ 35 g/kg)
19.2% of total NOx emissions

Texas A&M Transportation Institute
39
Figure 16: Comparisons between SHED Data and PEMS Data for NOx.
PEMS data were collected during the stop-and-go testing used during SHED testing, as well as other driving conditions. The collected PEMS data are characterized with respect vehicle operation conditions (in operation modes of MOVES), and one of the vehicle’s results (for Vehicle #6) is shown in Figure 17; the bars represent average emissions rates for corresponding operating modes (that is, different driving conditions in MOVES) along with the associated confidence intervals (at 95% level) as error bars. All other results are similar to those shown for this specific vehicle, and are therefore not included in this report.
y = 1.8044x - 0.967R² = 0.8081
0
5
10
15
20
25
30
35
40
45
0 5 10 15 20 25
gNO
x/kg
CO2
(SHE
D)
gNOx/kgCO2 (PEMS)

Texas A&M Transportation Institute
40
Figure 17: NOx Emissions Characterization Results - Test Vehicle # 6.
The test results shown in Figure 17 (for PEMS results only) are also similar to those used for MOVES NOx emissions estimations (HDD mean NOx emissions rates from MOVES in Figure 18). Based on the test results and observations described here, it can be concluded that SHED testing results correlate well with PEMS results. Additionally, the PEMS results obtained are similar to MOVES emissions rates.
Operating Mode
0 1 11 12 13 14 15 16 21 22 23 24 25 27
NO
x E
mis
sion
Rat
e (g
/hr)
0
200
400
600
800
1000
1200

Texas A&M Transportation Institute
41
Figure 18: NOx Emissions Rates Used in MOVES for Mobile Source Emissions Estimation.33
Analysis of Potential Impacts for DFW Region To conduct a rough analysis of potential impacts of HEs, the study team applied the measured SHED testing results along with regional emissions characterization from a TCEQ report,34 which quantified regional emissions using MOVES. The report showed that 65.2 tons of NOx emissions per summer weekday in 2012 are expected from pass-through (non-local) diesel vehicles (assuming most of the pass-through diesel vehicles are HDDVs). Based on SHED data results described earlier in this section and also shown in Figure 15, it was assumed that HEs (classified as those emitting over 35 g NOx per kg of CO2 - 6.8% of all HDDVs) were responsible for 19.2% of total NOx emissions. Under the additional assumption that CO2 emissions from HEs are similar to those of non-HEs, it can be inferred that NOx emissions can be reduced by 8.7 tons (from 65.2 to 56.5 tons) daily when the 6.8% of HEs (emitting 48.51 g NOx/kg of CO2 on average) instead produce NOx emissions as the rest of the vehicles observed
33 EPA. Development of Emission Rates for Heavy-Duty Vehicles in the Motor Vehicle Emissions Simulator (Draft MOVES2009). EPA-420-P-09-005, August 2009. 34 TCEQ. Characterization of Vehicle Activity and Emissions From Heavy-Duty Diesel Vehicles In Texas. Prepared by TTI, August 2011.

Texas A&M Transportation Institute
42
(14.95 g NOxx/kg of CO2 of the non-HEs average). This interpretation provides an approximation of the potential impacts of cleaning up HEs in the region as part of an HDDV I/M or screening program. This interpretation would lead to target older MY vehicles because older MY vehicles, in general, emit more NOx emissions (as shown in Figure 19) and can be HEs (as shown in Figure 20).
Figure 19: NOx Emissions Rates with Respect to MY.
Model Year
1989
1990
1991
1992
1993
1994
1995
1996
1997
1998
1999
2000
2001
2002
2003
2004
2005
2006
2007
2008
2009
2010
2011
2012
2013
Em
issi
on R
ates
of H
DD
Vs
(g o
f NO
x/kg
of C
O2)
0
10
20
30
40
50
Texas A&M Transportation Institute
43
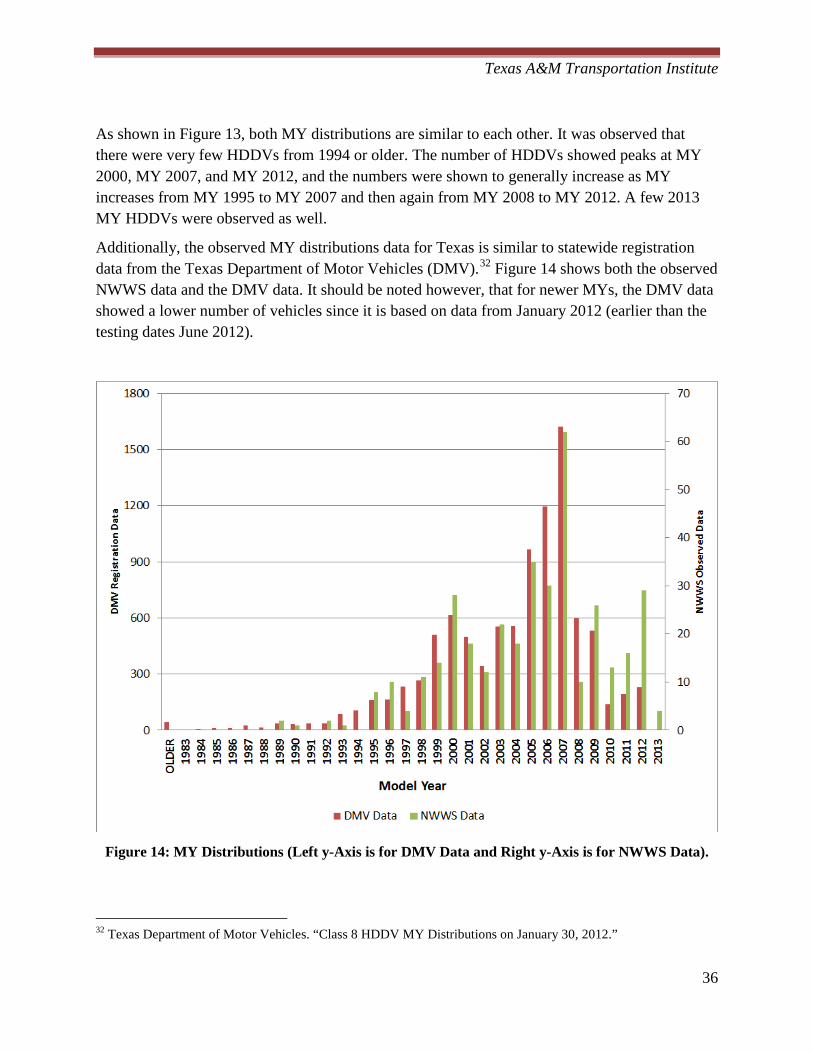
Figure 20: MY Distributions of HDDVs and HEs (Left y-Axis is for Portions of HEs in Percent (%)
and Right y-Axis is for Total Number of HDDVs).
Figure 19 shows that the average NOx emissions (along with the associated confidence interval at the 95% level) generally decrease for newer vehicles except for MY 2013 vehicles. For the high MY 2013 NOx emissions, the study team believes that it was due to different operation conditions of selective catalytic reduction (SCR) systems during SHED testing. All 2013 vehicles were equipped with SCR systems, which remove NOx emissions very efficiently. However, the efficiency drops as the temperature of the SCR system decreases. During the pilot testing, vehicle congestion at the pilot test site may have resulted in vehicles creep-idling for a long period of time. This could have reduced operating temperatures and affected SCR effectiveness, resulting in elevated NOx emissions in those 2013 vehicles. The wide confidence interval associated with the NOx emissions in 2013 vehicles shown in Figure 19 can be considered as an indication of the explanation. More investigations with SCR system temperature measurements, which are beyond the scope of this study, would further verify this possibility.
Figure 20 shows that HEs (as explained previously, in this case vehicles emitting more than 35 g NOx per kg of CO2 placed in this category) were generally observed more for older MY vehicles. For some of oldest MY vehicles however (MY 1990, 1992, and 1993), no HEs were observed. Since the number of those MY vehicles tested were so small (only one each for MY 1990 and

Texas A&M Transportation Institute
44
1993, and two for 1992), the study team believes that if more vehicles were sampled in these MYs, the number of HEs would increase to levels similar to the MYs around them.
Alternate Criteria for Defining HE Vehicles In the previously-discussed results, criteria for determining HEs was based only the amount of NOx emitted, with no consideration of the model year of the vehicle. As seen in Figure 20, this leads to the HEs being concentrated in older vehicles, and no vehicle newer than 2009 was identified as an HE. Using one number to classify HEs could unfairly target older vehicles, which were not subjected to the strict standards newer vehicles are. It may also be unreasonable to expect that an older HE, after being located, can be repaired to bring its emissions levels down to the average for the other vehicles in the study. This approach of classifying HEs may also omit newer vehicles, which are emitting much higher levels of NOx when compared to vehicles of the same MY, from being classified as a HE. Based on this, the study team conducted an alternative analysis where the top 5% of emitters within each MY were instead defined as an HE. Then, based on this definition, the study team estimated possible emissions reduction as follows:
• For each MY determine the 95th percentile of emission (criteria) value; • Examine vehicles emissions to identify HEs; that is, select vehicles emitted more than the
criteria value; • Calculate the average emissions value of non-HEs; • Calculate the difference between the emissions value of a HE and the non-HE average
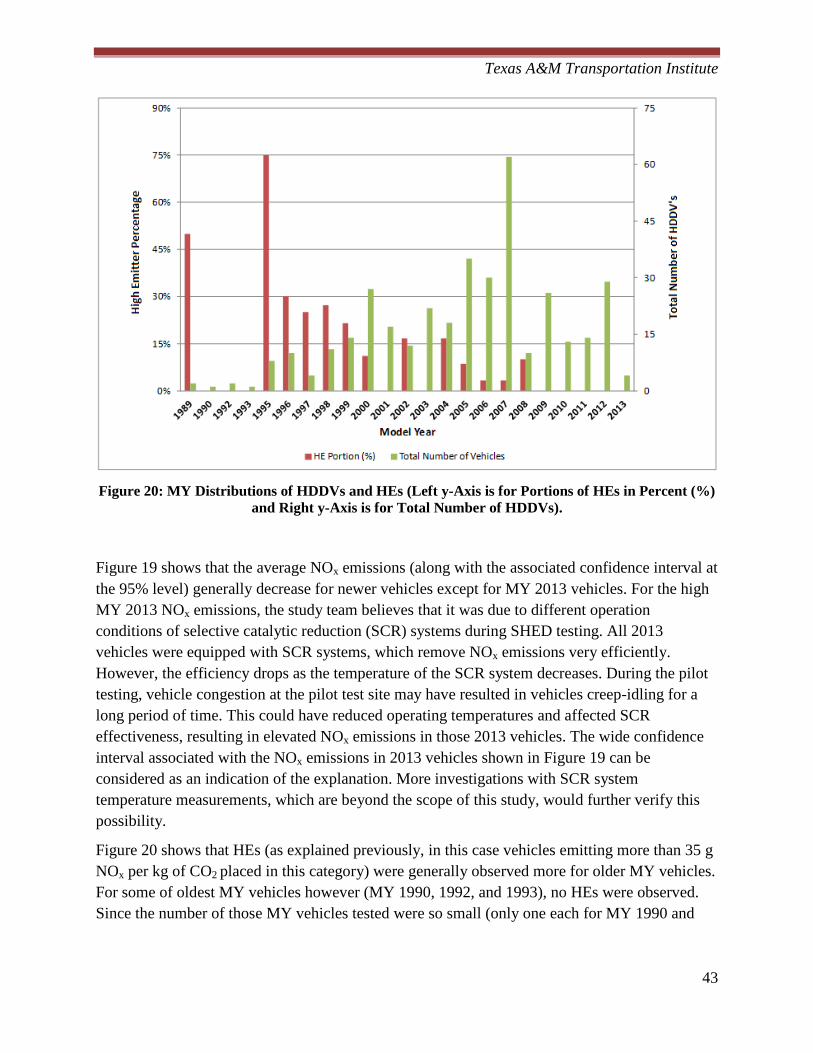
emissions value, which is the possible emissions reduction for the HE; • Add all of the possible emissions reductions of all HEs for each MY; and • Add all of the possible emissions reductions of each MY for all MYs, which provides a
total possible emissions reduction based on the new definition of an HE.
With the 95th percentile emission criteria, the estimated potential NOx emissions reduction (the total possible emissions reduction divided by total emissions produced) was 8.2%, which is equivalent to 5.3 tons daily based on the TCEQ data,34 reducing the total daily NOx emissions to 59.9 tons from 65.2 tons.
NOx Emissions Comparisons with Other Methodologies In this section, other methodologies (opacity testing and PM filter sampling) that could be used for HDDV I/M and/or screening programs for NOx were examined. Overall, the study team found that none of these methodologies would be useful, as detailed in this section.

Texas A&M Transportation Institute
45
Opacity Testing The opacity testing, following SAE J166714 described in Chapter 2, is the methodology used by most states that conduct HDDV I/M. However, the opacity testing results were not well correlated with the corresponding NOx emissions measured by PEMS, as shown in Figure 21, having an R2 of only 0.1835. As previously discussed opacity, testing was designed for measuring indirect PM emissions, which could be used as an indication of poor maintenance but not necessarily for consequent NOx emissions increases. As shown in Figure 21, higher opacity readings do not necessarily mean higher NOx emissions.
Figure 21: Comparisons of Opacity Data to PEMS NOx Data.
Filter Sampling PM filters were sampled during the two idling speeds – normal and high. The sampled PM emissions were compared to their corresponding NOx emissions measured by PEMS during the idling testing. No correlation was observed between the PM filter sample results and the PEMS NOx results, as shown in Figure 22, with a R2 value of 0.068. Similarly, as discussed in the previously, no good correlation was observed between direct PM emissions (by PM filter sampling) and PEMS NOx emissions, either.
y = 25.426x + 2.86R² = 0.1835
0
10
20
30
40
50
0.0 0.2 0.4 0.6 0.8 1.0
Opa
city
Rea
ding
(%)
NOx (g)
Texas A&M Transportation Institute
46
Figure 22: Comparisons of PM Filter Data to PEMS NOx Data.
Summary With regard to the NOx emissions, based on the findings for over 1,300 HDDVs examined, the study team found the following.
• A majority (over 75%) of the HDDVs were traveling to, or passing through, the DFW area by examining their destinations through interviews of drivers when they stopped for SHED testing.
• Using registration databases from five states that the study team could access (California, Illinois, Oklahoma, Oregon, and Texas), the study team identified the MYs of 706 HDDVs, of which nearly 80% were registered in Texas.
• The identified MY distributions of the 556 Texas-registered vehicles examined at the NWWS during the pilot testing were similar in terms of MY distribution to those from statewide registration data.
• SHED testing results showed that a small number of potential HEs (6.8% of the HDDVs observed on site traveling to the DFW area), most of which were observed in older MY vehicles, were responsible for 19.2% of total NOx emissions measured.
• Based on PEMS data collected for comparison, it was found that SHED NOx testing results were well correlated to the PEMS testing results. It was found that the PEMS data was also similar to MOVES rates.
• Based on regional emissions estimates from a TCEQ report, it was estimated that NOx emissions can potentially be reduced by 8.7 tons if HE emissions are lowered to the level of other vehicles. An alternate definition of HEs (based on characterizing HEs as those that produce NOx emissions greater than the 95th percentile emissions for each MY) indicated possible reductions of 5.3 tons of daily NOx emissions.
y = 0.0068x + 1.8041R² = 0.068
0
2
4
6
8
10
0 50 100 150 200 250 300 350 400
PM (g
/hr)
NOx (g/hr)
Texas A&M Transportation Institute
47
CHAPTER 5: CONCLUSIONS AND RECOMMENDATIONS
This chapter provides an evaluation of the different approaches and methodologies for HDDV I/M program or screening based on the results of the pilot testing and other investigations conducted as part of this project. The chapter also discusses overall conclusions and suggestions for future research. The recommendations are focused on technically feasible methodologies that can be used for a NOx-focused program in the DFW area and other nonattainment areas in Texas.
Potential I/M and Screening Methodologies As discussed in previous chapters, the study team investigated and tested different emissions measurement methodologies for an HDDV I/M program or screening testing, including:
• OBD testing; • Opacity testing; • Idle testing; • ASM testing; • IM240 testing; • Conventional RS testing; • SHED testing; • PM filter sampling; • WB chassis dynamometer testing with PEMS; and • PR chassis dynamometer testing with PEMS.
Among those methodologies, the study team concludes that opacity testing, idle testing, IM240 testing, and PM filter sampling are not appropriate for HDDV NOx I/M or screening testing. Opacity testing and PM filter sampling may be appropriate for PM but not for NOx. Idle testing may not be representative of actual vehicle operations (i.e., driving) and IM240 testing is more appropriate for gasoline vehicles than diesel vehicles.
Excluding these four methodologies, all other technically feasible methodologies are summarized in the selection of appropriate approaches. The remainder of this section discusses these technically feasible methodologies in further detail, including suggestions for possible implementation.
Table 3, which lists the testing capacity of the methodologies, estimated capital cost and whether actual tailpipe measurements are taken. ASM testing is not listed because it is essentially same as WB chassis testing and PR chassis testing with PEMS (except using different type of chassis dynamometer and emission analyzers).

Texas A&M Transportation Institute
48
Table 3: Technically Feasible Testing Methodologies for HDDV I/M Program or Screening Testing.
Estimated Testing
Capacity† (Number of HDDVs tested per day)
Actual Tailpipe Emissions
Measurements
Estimated Capital Cost‡
($1000s)
OBD Testing ~ 100 No 10
Conventional RS Testing ~ 200 Yes, but indirect values 100
SHED Testing ~ 150 Yes, but indirect values 25*
Portable Roadside Chassis Dynamometer Testing with
PEMS† ~ 15 Yes 630**
Water Brake Chassis Testing with PEMS† ~ 15 Yes 500***
† The number of vehicles tested can vary depending on actual installation/preparation time. ‡ The estimated costs are approximate values based on preliminary information. More precise cost estimation can be provided with more specific test set-up, configurations, etc. * Based on the assumption of using NCTCOG’s existing (ASM testing) analyzers. ** Based on PEMS; if using existing (ASM testing) analyzers, $380,000. *** Based on PEMS; if using existing (ASM testing) analyzers, $250,000.
HD-OBD Testing Since OBD testing is a well-established methodology for LDVs and MDVs, this methodology will be suitable for a HDDV I/M program after HD-OBD equipped HDDVs are dominant in HDDV fleets. Beginning in 2013, all highway heavy-duty engines from all manufacturers must to be certified to the OBD requirements. It is likely that the fleet turnover will occur faster in long-haul HDDVs than in local/short-haul fleets, though it will be several years before OBD systems become standard on all existing HDDVs. This methodology is preferable because HD-OBD will report on specific emissions control systems to be repaired, which is the main purpose of the I/M program.
Conventional RS Testing As discussed in Chapter 2, the use of RS has been well established. In Texas, the DPS has been using conventional RS testing (called on-road inspections) for high emitting, LDVs commuting from adjacent ozone nonattainment counties. For the inspections, the van-installed RS device is strategically placed to capture auto emissions from single-lane traffic in an acceleration mode to target light-duty HEs, and the targeted HEs are required to be inspected within 30 days of notification.35 Since this inspection program is designed for LDVs, modifications including scaffoldings for higher positions of tailpipes of HDDVs (as shown in Figure 3) are necessary for HDDVs. However, some HDDVs (especially, newer MY HDDV having SCR systems) have 35 TCEQ. “Program Enforcement,” http://www.tceq.texas.gov/airquality/mobilesource/vim/program_enforcement.html, accessed May 2013.

Texas A&M Transportation Institute
49
their tailpipes close to the ground, so that additional sets of RSD with appropriate testing modifications would be necessary.
SHED Testing As discussed in previous chapters, SHED testing is seen to be a viable candidate for a HDDV NOx I/M screening methodology based on the findings from this project and a subsequent study in Vancouver. The pilot test set-up and verification with PEMS in this study was only for stop-and-go testing, but the findings indicate that SHED testing is viable and has applicability as a quick and cost-effective approach to I/M or screening. The study team believes that additional modifications of the SHED testing set-up would allow measurements to be taken while driving/accelerating at higher speeds as well. The SHED set-up can also be modified to support stationary or portable testing as well. The SHED design also currently only accommodates a specific exhaust stack configuration (high stack) on the HDDVs and further design changes will be required to accommodate others.
WB Chassis Dynamometer Testing (with PEMS) As discussed in Chapter 2, WB chassis testing was successfully used for HDDV NOx measurements using the “power-curve” test cycle. From their pilot testing program for a wide-scale HDDV I/M program, CARB showed that the WB chassis testing with PEMS was technically feasible.36 This methodology may be used in conjunction with SHED testing. With SHED testing, potential HEs can be identified by providing indicative emissions (e.g., g of NOx/kgCO2). Potential HEs can then be sent to a facility having the WB chassis testing set-up, tested, and the actual emissions values (as g or g/bhp-hr) can be provided.
PR Chassis Dynamometer Testing (with PEMS) This test methodology is basically the same as WB chassis testing, except that the PR chassis dynamometer can be used in the field. This methodology may be also combined with SHED testing by setting up the PR chassis dynamometer and PEMS (or other emission measurement analyzers) next to the SHED testing set-up. SHED testing can be used for screening possible HEs and the PR chassis testing provides actual emissions rates. When a vehicle fails SHED testing, the vehicle is sent to the PR chassis on site to identify true HEs based on actual emissions criteria.
Considerations for Implementation Based on the findings from this study, the most viable long-term approach to HDDV NOx I/M would be to use HD-OBD testing for HDDVs (MY 2013 or newer), which will be equipped with HD-OBD systems. However, in the shorter term, or to target vehicles older than MY 2013, there are several possible approaches using SHED testing for HDDV I/M or screening, as described in the following. 36 Chernich, D. Development of a chassis Based Inspection and Maintenance Program for Heavy-Duty Diesel Powered Vehicles. 13th CRC Workshop, April 2003.

Texas A&M Transportation Institute
50
• Conventional I/M program based on SHED only – in which all HDDVs registered in the DFW area need to pass SHED emissions testing.
• Alternatively, conventional RS can be deployed at checkpoints to screen for potential HEs through an approach similar to the LDV on-road inspection program,35 followed by SHED testing at a test facility.
• Use SHED for preliminary screening, followed by WB/PR chassis dynamometer testing for high-emitting HDDVs. This can be conducted through an approach similar to the LDV on-road inspection program, where vehicles screened as HEs (either through SHED or conventional remote sensing) are notified and required to pass an emissions test at a testing facility.35 Alternatively, vehicles can travel through the SHED for real-time screening, followed by immediate testing of HEs using a PR chassis dynamometer set-up.
Given that SHED testing is a fairly recent development, it is anticipated that further validation or demonstration will be needed before obtaining buy-in from various stakeholders including EPA and TCEQ. Prior to implementing any program, factors that need to be considered in discussions with TCEQ and EPA include whether SIP credits would be granted, the emissions criteria that would be appropriate, as well as items such as overall program design, detailed cost analysis, screening facilities and locations, reporting, penalties and enforcement, and quantification of benefits.
As part of implementation, the study team also recommends studying major routes for HDDV traffic to identify the best locations for screening or deployment. Additional studies are required to determine whether these locations will target sufficient DFW-registered vehicles, or whether other approaches may be needed to target short-haul (local) trucks that travel only within the DFW area.
Concluding Remarks This project provides NCTCOG and TxDOT with data relating to potential HDDV I/M program implementation. As part of this project, the study team investigated programs and methodologies in other states, characterized NOx emissions from HDDVs through an on-site pilot testing study, and assessed the results and implications for HDDV I/M or screening programs.
The pilot testing was conducted at the NWWS located on I-45 northbound in New Waverly, Texas. Through the two-week pilot test, several different emissions measurement methodologies were deployed, including SHED – a new remote-sensing type approach, which was the focus of this study – and direct emissions measurements using PEMS. The pilot testing and on-site study enabled the study team to characterize the HDDV traffic that affects DFW area air quality. The findings also allowed for comparison of emissions results from PEMS measurements and other methodologies including opacity, idling testing, PM filter sampling, as well as SHED testing.
Based on SHED testing data for hundreds of HDDVs tested, it was seen that a small number of HDDVs (classified as HEs based on arbitrary cut points for each emissions type, and including

Texas A&M Transportation Institute
51
only vehicles traveling to, or passing through, the DFW region) were responsible for relatively large portions of vehicular emissions, as follows:
• 6.8% of vehicles were responsible for 19.2% of total NOx emissions measured; • 15.1% of vehicles were responsible for 70.7% of total CO emissions measured; and • 10.8% of vehicles were responsible for 43.8% of total HC emissions measured. • 13.4% of vehicles were responsible for 61.7% of total PM emissions measured.
From aggregate estimates of DFW area emissions from HDDVs, it was calculated that if average emissions from the HEs are lowered to the average level of non-HEs, the amount of NOx that can be reduced in the DFW area could be as high as 8.7 tons/day (for weekdays); for CO and HC, the reductions could be 13.6 and 1.6 tons/day, respectively.
The findings indicate that a HDDV I/M program or screening program has the potential for emissions reductions through identification and repair of HEs. SHED testing can be beneficial, but may be more appropriate (in aspects of accuracy, time, and cost for testing) for screening testing, rather than the basis for actual I/M testing due to the indirect nature of emissions measurement. As discussed in the previous section, in addition to considering I/M or screening program design and viability, stakeholders as well as TCEQ and EPA will need to be engaged in the process to ensure buy-in, determine criteria and parameters for the program, and to allow for SIP credits to apply.
In addition, political and economic considerations will also need to be considered in the development of an I/M program or rule. Outreach and incentive programs (i.e., incentives or loans for repair or replacement of HEs), linking benefits to replacing HEs with fuel-efficient vehicles may also help in gaining public acceptance.
Scope for Future Study This study provides an overview of research into existing approaches for a diesel I/M program and presents findings from a preliminary concept implementation of SHED testing for a pilot program. Some future research needs, to expand on this study’s findings or address this study’s limitations, include the following.
• SHED testing emissions data was found to be invalid for driving and accelerating at higher speeds (non-stop-and-go conditions). This was theorized as being due to air wakes that caused measured emissions to be under the detection limits. Further optimization of the SHED testing set-p and configuration can address this issue. Some aspects of SHED optimization include adjusting the height, pipe diameters, sampling tube perforations and spacing. Configuration changes to accommodate higher vehicle speeds (to combine with weigh-in-motion) and different exhaust stack configurations can further improve SHED testing usefulness. These can be addressed through a combination of experimental validation, modeling using computational fluid dynamics, and other approaches.
• Due to the location of the pilot testing site, the tested HDDVs were mostly long-haul trucks. Given that long-haul truck fleets generally tend to be newer and better maintained
Texas A&M Transportation Institute
52
than short-haul, or local fleets, a useful extension of this study would be to target short-haul fleets using a similar approach. In theory, it is expected that the short haul fleet would have greater prevalence of HEs (i.e., possibly a smaller portion of the fleet contributing to a higher proportion of emissions when compared to observations at the NWWS test site).
• The study team believes that the observed relatively high NOx emissions from some MY 2013 HDDVs was because their SCR systems were operating below the normal operating temperature when measured, due to delays caused by truck traffic at the test site resulting in creep idling. This could not be proven because actual operating temperature of the SCR systems was not measured, and monitoring of these temperatures could form a part of future studies. Additionally, the NOx analyzer used for SHED testing was not designed to provide separate nitrogen dioxide (NO2) emissions data. For newer vehicles equipped with SCR systems, increases of NO2 emissions are possible even if total NOx emissions decrease. A NOx analyzer capable of measuring both of NO and NO2 could be used in future studies.
• SHED testing results and other calculations relating to emissions apportionment in this report were based on the assumption of using the same CO2 emissions rates for both HEs and non-HEs. Further clarification or differentiation of these rates for HEs and non-HEs could provide more refined results.
• Before more widespread deployment of SHED testing, it is recommended that a pilot on-site deployment of SHED testing (potentially in conjunction with conventional remote sensing, as described in previous sections) in conducted after further optimization of the SHED set-up.
Texas A&M Transportation Institute
53
APPENDIX A: PILOT TESTING RESULTS FOR OTHER POLLUTANTS
In this appendix, SHED testing results for CO, HC, and PM are presented. For all three pollutants, most HDDVs (about 70%) produced emissions in the lowest range for each pollutant. Additionally, similar to NOx results, a small number of potential HEs produced at least 43% of the total emissions of the tested HDDVs:
• For CO, 15.1% of HDDVs were responsible for 70.7% of total CO emissions; • For HC, 10.8% of HDDVs were responsible for 43.8% of total HC emissions; and • For PM, 13.4% of HDDVs were responsible for 61.7% of total PM emissions.
SHED data were compared with corresponding PEMS data. Unlike the NOx results, no good correlations were observed for CO and HC. Using PEMS data, two possible alternative testing methodologies for HDDV I/M and/or screening programs, opacity testing, and PM filter sampling were also examined. Based on the comparison results discussed earlier in this report, only opacity testing results and PEMS CO results showed a good correlation with each other, while all other comparisons did not show good correlation.
Detailed findings are provided in the following section of this appendix. Carbon Monoxide (CO) SHED Testing Results
Figure 23 shows the number of HDDVs with respect to their CO emissions measured by the SHED methodology. SHED CO emissions results were categorized in 12 different ranges; with the increment of 2.5 g of CO/kgCO2 for the first four ranges (up to 10 g of CO/kgCO2), 5 g for the next six (up to 40 g of CO/kgCO2), and 10 g for the remaining two (up to 60 g of CO/kgCO2, which covers the highest emissions of 55.7 g). SHED CO emissions results are summarized as follows:
• Most HDDVs (about 70%) emissions fell in the lowest emission range, from 0 to 2.5 g CO/kgCO2);
• For the other 11 ranges the observed number of vehicles decreases as emission range increases;
• Average CO emissions from all of the HDDVs were 2.46 g of CO/kgCO2; and • Considering those vehicles that emitted 5 g of CO/kgCO2 (about twice of the average) or
higher as HEs, 15.1% of all HDDVs were responsible for 70.7% of the total CO emissions.
If the vehicles that emitted 5 g of CO/kgCO2 or higher are considered as HEs and their emissions were reduced to the average of non-HEs (0.85 g CO/kgCO2), the potential CO emissions reduction would be 13.6 tons per a summer weekday in 2012 based on regional MOVES-based estimates from the TCEQ report,34 from 20.8-to-7.2 tons. The estimated emissions reduction amounts will vary depending on the HE criteria value and determination methodology.

Texas A&M Transportation Institute
54
Figure 23: Measured CO Emissions Distributions for All HDDVs Traveling to/Passing through the DFW Area.
Comparison Results
The SHED CO results were also compared with PEMS CO results. Unlike NOx the correlations for CO were not good, having an R2 value of 0.3 as shown in Figure 24.
0
50
100
150
200
250
300
350
400
450N
umbe
r of V
ehic
les
CO Emission Range (gCO/kgCO2)

Texas A&M Transportation Institute
55
Figure 24: Comparisons between SHED Data and PEMS Data for CO.
CO PEMS emissions measurements results were also compared to the opacity testing and PM filter sampling. Figure 25 shows a good correlation between the opacity results and PEMS for CO, unlike NOx, having an R2 value of 0.7155. As discussed in the opacity testing section opacity testing was designed for, and has been adopted by, most states conducting HD I/M programs due to the indication of PM emissions, which is caused by incomplete combustion. Such incomplete combustion would also produce CO in a similar manner, which was seen in the good CO correlation between opacity and PEMS. However, the comparison results of PM filter sampling to PEMS CO results, shown in Figure 26, did not necessarily correlate well, having an R2 value of 0.4527.
y = 0.8037x + 0.7571R² = 0.296
0
5
10
15
20
25
30
35
40
45
0 5 10 15 20 25 30 35
gCO
/kgC
O2
(SHE
D)
gCO/kgCO2 (PEMS)

Texas A&M Transportation Institute
56
Figure 25: Comparisons of Opacity Data to PEMS CO Data.
Figure 26: Comparisons of PM Filter Data to PEMS CO Data.
Hydrocarbons (HC) SHED Testing Results
Figure 27 shows the number of HDDVs with respect to their HC emissions measured by the SHED methodology. SHED HC emissions results were categorized in 10 different ranges with the increment of 1 g (up to 10g of HC/kgCO2); the last range (9–10 g of HC/kgCO2) covers the highest emissions of 9.6 g). The following summarizes SHED HC emissions results.
y = 16.209x - 0.3194R² = 0.7155
0
10
20
30
40
50
0.0 0.5 1.0 1.5 2.0 2.5
Opa
city
Rea
ding
(%)
CO (g)
y = 0.0445x - 0.0045R² = 0.4527
0
2
4
6
8
10
0 20 40 60 80 100 120 140 160
PM (g
/hr)
CO (g/hr)
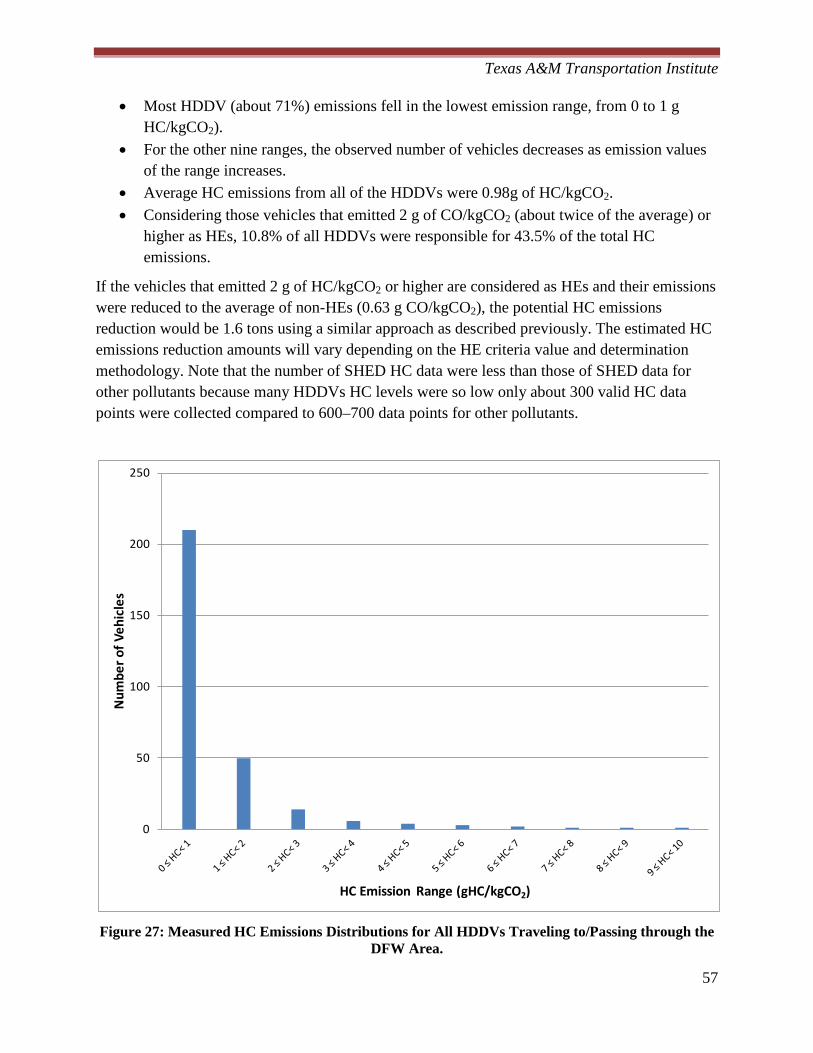
Texas A&M Transportation Institute
57
• Most HDDV (about 71%) emissions fell in the lowest emission range, from 0 to 1 g HC/kgCO2).
• For the other nine ranges, the observed number of vehicles decreases as emission values of the range increases.
• Average HC emissions from all of the HDDVs were 0.98g of HC/kgCO2. • Considering those vehicles that emitted 2 g of CO/kgCO2 (about twice of the average) or
higher as HEs, 10.8% of all HDDVs were responsible for 43.5% of the total HC emissions.
If the vehicles that emitted 2 g of HC/kgCO2 or higher are considered as HEs and their emissions were reduced to the average of non-HEs (0.63 g CO/kgCO2), the potential HC emissions reduction would be 1.6 tons using a similar approach as described previously. The estimated HC emissions reduction amounts will vary depending on the HE criteria value and determination methodology. Note that the number of SHED HC data were less than those of SHED data for other pollutants because many HDDVs HC levels were so low only about 300 valid HC data points were collected compared to 600–700 data points for other pollutants.
Figure 27: Measured HC Emissions Distributions for All HDDVs Traveling to/Passing through the
DFW Area.
0
50
100
150
200
250
Num
ber o
f Veh
icle
s
HC Emission Range (gHC/kgCO2)
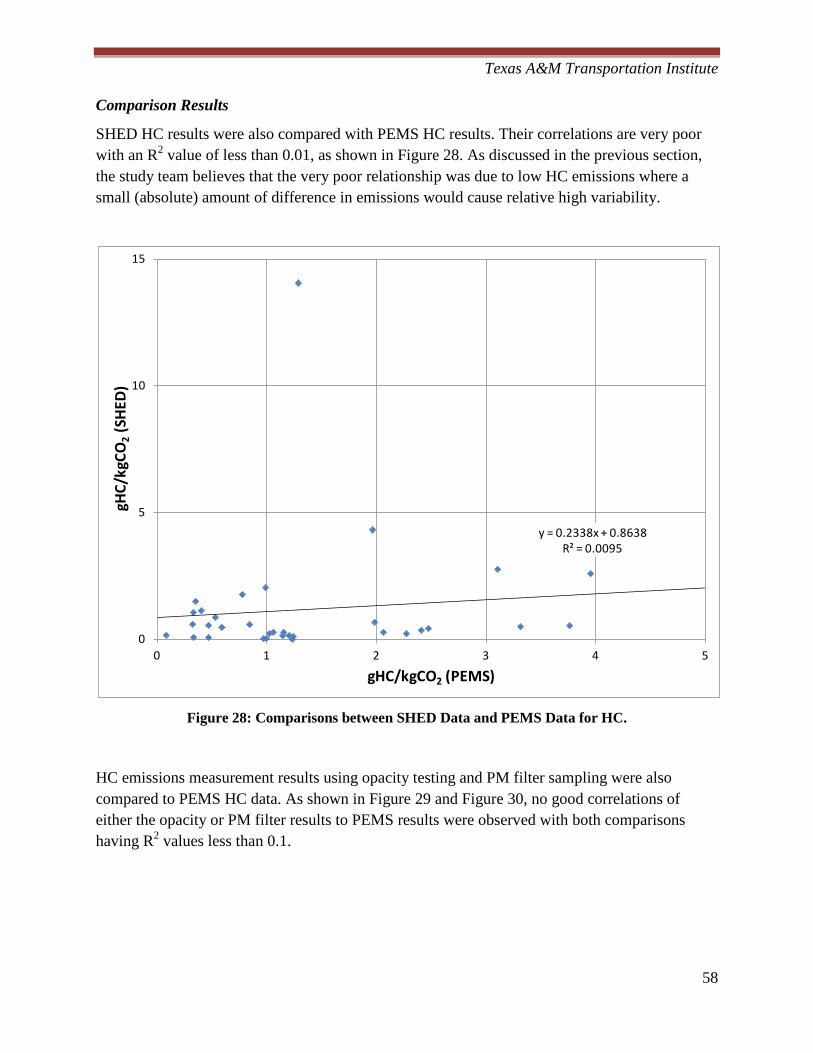
Texas A&M Transportation Institute
58
Comparison Results
SHED HC results were also compared with PEMS HC results. Their correlations are very poor with an R2 value of less than 0.01, as shown in Figure 28. As discussed in the previous section, the study team believes that the very poor relationship was due to low HC emissions where a small (absolute) amount of difference in emissions would cause relative high variability.
Figure 28: Comparisons between SHED Data and PEMS Data for HC.
HC emissions measurement results using opacity testing and PM filter sampling were also compared to PEMS HC data. As shown in Figure 29 and Figure 30, no good correlations of either the opacity or PM filter results to PEMS results were observed with both comparisons having R2 values less than 0.1.
y = 0.2338x + 0.8638R² = 0.0095
0
5
10
15
0 1 2 3 4 5
gHC/
kgCO
2(S
HED)
gHC/kgCO2 (PEMS)
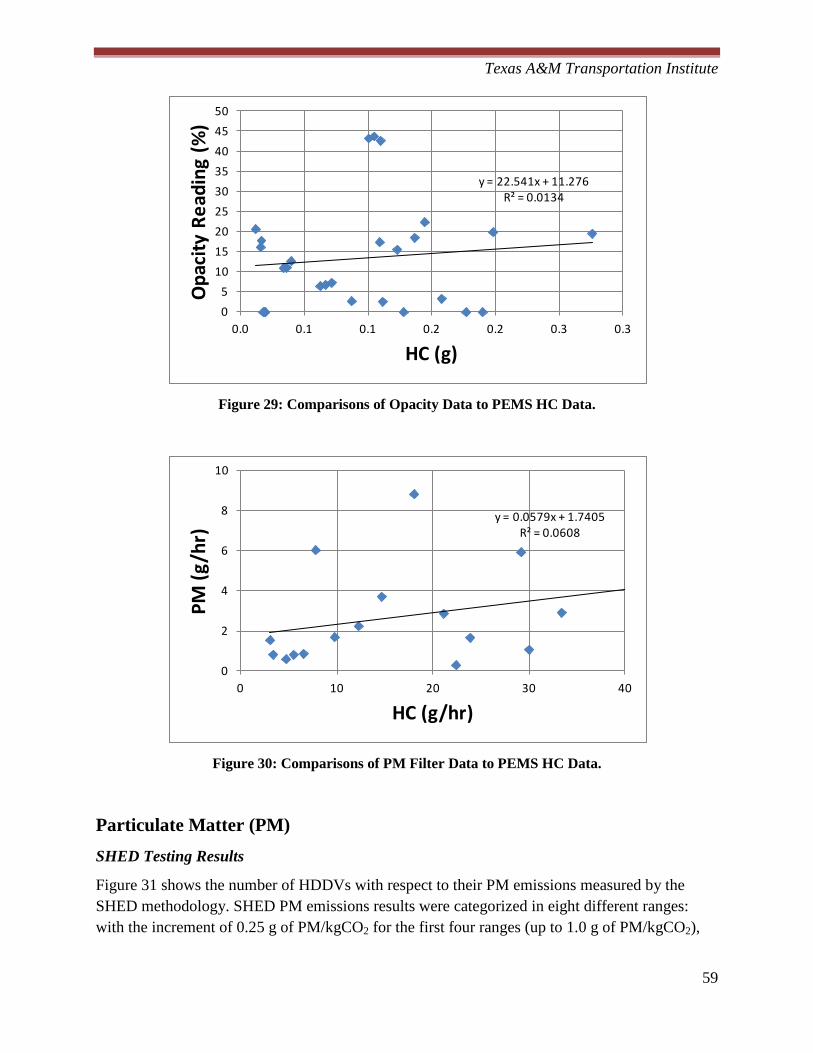
Texas A&M Transportation Institute
59
Figure 29: Comparisons of Opacity Data to PEMS HC Data.
Figure 30: Comparisons of PM Filter Data to PEMS HC Data.
Particulate Matter (PM) SHED Testing Results
Figure 31 shows the number of HDDVs with respect to their PM emissions measured by the SHED methodology. SHED PM emissions results were categorized in eight different ranges: with the increment of 0.25 g of PM/kgCO2 for the first four ranges (up to 1.0 g of PM/kgCO2),
y = 22.541x + 11.276R² = 0.0134
05
101520253035404550
0.0 0.1 0.1 0.2 0.2 0.3 0.3
Opa
city
Rea
ding
(%)
HC (g)
y = 0.0579x + 1.7405R² = 0.0608
0
2
4
6
8
10
0 10 20 30 40
PM (g
/hr)
HC (g/hr)

Texas A&M Transportation Institute
60
then, 1 g for the other four (up to 5 g of CO/kgCO2, which covers the highest emissions of 4.01 g). The following summarizes SHED PM emissions results.
• Most HDDV (about 71%) emissions fell in the lowest emission range, from 0 to 0.25 g PM/kgCO2).
• For the other seven ranges, the observed number of vehicles decreases as emissions values of the range increases.
• Average PM emissions from all of the HDDVs was 0.26 g of PM/kgCO2. • Considering those vehicles that emitted 0.5 g of PM/kgCO2 (about twice of the average)
or higher as HEs, 13.4% of all HDDVs were responsible for 61.7% of the total PM emissions.
If the vehicles emitted 0.5 g of PM/kgCO2 or higher are considered as HEs and their emissions were reduced to the average of non-HEs (0.11 g PM/kg CO2), the PM emissions would be reduce to about half. The estimated PM emissions reduction amounts will also vary depending on the HE criteria value and determination methodology.
No valid PM PEMS data was collected due to the malfunctioning of the PM PEMS. Consequently, no comparisons of SHED, opacity, and PM filter data to PEMS data were conducted in the case of PM.
Figure 31: Measured PM Emissions Distributions for All HDDVs Traveling to/Passing through the
DFW Area.
0
100
200
300
400
500
600
Num
ber o
f Veh
icle
s
PM Emission Range (gPM/kgCO2)