heavy truck crashworthiness: injury mechanisms … truck crashworthiness: injury mechanisms and...
TRANSCRIPT

DOT HS 812 061 May 2015
Heavy Truck Crashworthiness: Injury Mechanisms and Countermeasures to Improve Occupant Safety

DISCLAIMER
This publication is distributed by the U.S. Department of Transportation, National Highway Traffic Safety Administration, in the interest of information exchange. The opinions, findings, and conclusions expressed in this publication are those of the authors and not necessarily those of the Department of Transportation or the National Highway Traffic Safety Administration. The United States Government assumes no liability for its contents or use thereof. If trade or manufacturers’ names or products are mentioned, it is because they are considered essential to the object of the publication and should not be construed as an endorsement. The United States Government does not endorse products or manufacturers.
Suggested APA Format Citation:
Woodrooffe, J., and Blower, D. (2015, May). Heavy truck crashworthiness: injury mechanisms and countermeasures to improve occupant safety. (Report No. DOT HS 812 061). Washington, DC: National Highway Traffic Safety Administration.

i
Technical Report Documentation Page 1. Report No.
DOT HS 812 061
2. Government Accession No.
3. Recipient's Catalog No.
4. Title and Subtitle Heavy Truck Crashworthiness: Injury Mechanisms and Countermeasures to Improve Occupant Safety
5. Report Date
January 2015 6. Performing Organization Code
7. Authors John Woodrooffe and Daniel Blower
8. Performing Organization Report No.
UMTRI-2013-41 9. Performing Organization Name and Address
University of Michigan Transportation Research Institute 2901 Baxter Road Ann Arbor, MI 46109-2150
10. Work Unit No. (TRAIS) 11. Contract or Grant No.
DTNH22-11-D-00236/0006 12. Sponsoring Agency Name and Address
U.S. Department of Transportation National Highway Traffic Safety Administration Office of Applied Vehicle Safety Research 1200 New Jersey Avenue SE. Washington, DC 20590
13. Type of Report and Period Covered
October 2012 – December 2013
14. Sponsoring Agency Code NVS-321
15. Supplementary Notes Contracting Officer’s Technical Representative: Timothy Keon 16. Abstract This study was conducted by the University of Michigan Transportation Research Institute (UMTRI) under a contract from National Highway Traffic Safety Administration. The objective of the study was to analyze truck driver injury and loss of life in truck crashes related to cab crashworthiness and investigate regulations and industry trends in relation to truck occupant protection. The goal is to assemble information on truck driver casualties in crashes that would assist in understanding injury mechanisms and to review regulatory and industry initiatives concerned with reducing the number of truck occupant fatalities and the severity of injuries. The commercial vehicle focus is on truck-tractors and single-unit vehicles in the NHTSA Class 7 and 8 weight range. The study used UMTRI’s Trucks Involved in Fatal Accidents (TIFA) survey file and NHTSA’s General Estimates System (GES) file for categorical analysis and the Large Truck Crash Causation Study (LTCCS) for a supplemental clinical review of cab performance in frontal and rollover crash types. The study includes analysis of truck driver injury and injury mechanisms, a review of regulatory development and industry safety initiatives including barriers to implementation. A set of countermeasures to address truck driver safety risk are presented.
17. Key Word
Truck driver injury, cab crashworthiness, commercial vehicle safety
18. Distribution Statement
Document is available to the public from the National Technical Information Service www.ntis.gov
19. Security Classif. (of this report) Unclassified
20. Security Classif. (of this page) Unclassified
21. No. of Pages 110
22. Price
Form DOT F 1700.7 (8-72) Reproduction of completed page authorized

ii
Table of Contents
1 Introduction .........................................................................................................................1
2 About Truck Cabs ...............................................................................................................2
3 Review Of Regulatory Development ...................................................................................3
4 Cab Integrity Standards .......................................................................................................7
4.1 Sae J2420 – Coe Frontal Strength Evaluation—Dynamic Loading Heavy Trucks ........7
4.2 Sae J2422 Cab Roof Strength Evaluation – Quasi-Static Loading Heavy Trucks ..........9
4.3 Un Ece Regulation R29.03 ......................................................................................... 12
5 Safety Analysis.................................................................................................................. 16
5.1 Data ........................................................................................................................... 17
5.2 Definitions ................................................................................................................. 18
6 Truck Driver Injury And Injury Mechanisms ..................................................................... 19
6.1 Trends ....................................................................................................................... 19
6.2 Annual Estimates Of Truck Driver Injury .................................................................. 21
6.3 Seat Belt Use ............................................................................................................. 24
6.3.1 Reported Seat Belt Use by Truck Occupants In Crashes ......................................... 25
6.3.2 Truck Occupant Injuries by Seat Belt Use .............................................................. 27
6.4 Fatal Injury Risk ........................................................................................................ 28
6.5 Most Harmful Event Analysis .................................................................................... 29
6.5.1 Driver Injury by Most Harmful Event .................................................................... 30
6.5.2 Probability Of Driver Fatality Or Injury by Crash Type ......................................... 32
6.6 Differentiating Truck-Tractors And Single-Unit Trucks ............................................. 33
6.7 Ejection ..................................................................................................................... 36
6.8 Ejection And Sleeper Occupants ................................................................................ 42
6.9 Rollover And Ejection ............................................................................................... 43
6.10 Impact Location In Collision Events .......................................................................... 46
6.11 Restraint Use And Seat Belt Effectiveness ................................................................. 49
6.12 Posted Speed Limit .................................................................................................... 52

iii
6.13 Primary Crash Types In Severe Driver Injury ............................................................ 54
7 LTCCS Review ................................................................................................................. 56
7.1 Sampled Crash Population ......................................................................................... 56
7.2 Clinical Review Approach ......................................................................................... 58
7.3 “Catastrophic Impact” Crashes .................................................................................. 61
7.4 Rollover ..................................................................................................................... 63
7.5 Rollover and Subsequent Events ................................................................................ 66
7.6 Frontal Collisions ...................................................................................................... 69
7.7 Rear Intrusion in Frontal Collisions ........................................................................... 72
7.8 Sources of Driver Injury in Rollover and Frontal Collisions ....................................... 78
7.8.1 Injuries in rollovers ................................................................................................ 80
7.8.2 Injuries in frontal impacts ...................................................................................... 83
8 Industry Safety Initiatives and Barriers to Implementation ................................................. 87
8.1 Overview ................................................................................................................... 87
8.2 Barriers to Implementation of Safety Technology ...................................................... 88
9 Countermeasures ............................................................................................................... 90
9.1 Increasing the Integrity and Robustness of Cab Structures ......................................... 90
9.2 Seat Belts and Side Curtain Air Bags ......................................................................... 91
9.3 Automatic Pull-Down Seats ....................................................................................... 92
9.4 Frontal Air Bags ........................................................................................................ 92
9.5 Crash Avoidance Technology .................................................................................... 93
10 Conclusions ....................................................................................................................... 94
11 References ......................................................................................................................... 97

iv
List of Tables
Table 1 Percent Probability of K- or A-Injury by Cab Style, Belt Use, and GVWR Class ............3
Table 2 Comparison between Swedish and ECE Tests ................................................................6
Table 3 Driver and Occupant Fatalities in Medium and Heavy Trucks, TIFA 2006-2010 .......... 20
Table 4 Percentage Distribution of Driver and Occupant Fatalities in Medium and Heavy Trucks, TIFA 2006-2010 .................................................................................................. 21
Table 5 Annual Truck Occupant Injury Severity by Power Unit Type TIFA 2006-2010, GES 2006-2010 ................................................................................................................ 22
Table 6 Annual Truck Driver Injury Severity by Power Unit Type TIFA 2006-2010, GES 2006-2010 ................................................................................................................. 23
Table 7 Annual Truck Passenger Injury Severity by Power Unit Type TIFA 2006-2010, GES 2006-2010 ................................................................................................................. 23
Table 8 Annual Truck Occupant Injuries by for Heavy and Medium Trucks Fatal Crashes Only, TIFA 2006-2010 ...................................................................................................... 24
Table 9 Reported Seat Belt Use for Drivers and Passengers Truck-Tractors, All Crash Severities, TIFA 2006-2010, GES 2006-2010 .................................................................... 25
Table 10 Reported Seat Belt Use for Drivers and Passengers Single-Unit Trucks, All Crash Severities, TIFA 2006-2010, GES 2006-2010 .................................................................... 26
Table 11 Annual Injuries by Severity and Seat Belt Use Truck-Tractors, TIFA 2006-2010, GES 2006-2010 ................................................................................................................. 27
Table 12 Annual Injuries by Severity and Seat Belt Use Single-Unit Trucks, TIFA 2006-2010, GES 2006-2010 ................................................................................................................. 28
Table 13 Probability of Fatal Injury for Drivers and Passengers in Medium and Heavy Trucks, TIFA 2006-2010 ................................................................................................... 29
Table 14 Annual Truck Driver Injuries by Most Harmful Event, All Trucks, All Crash Severities TIFA 2006-2010, GES 2006-2010 ..................................................................... 31
Table 15 Probability of K+A Injury by Crash Type, All Trucks TIFA 2006-2010, GES 2006-2010 .................................................................................................................................. 32
Table 16 Probability of K+A Injury by Crash type, Truck-Tractors TIFA 2006-2010, GES 2006-2010 ......................................................................................................................... 33
Table 17 Injury Probability and Percent K+A Injuries by Truck Class Single-unit Trucks Only, Fatal Crashes Only, TIFA 2006-2010 ....................................................................... 34
Table 18 Distribution of Most Harmful Event for SUTs and Truck-Tractors Class 7 and 8 Only, Driver K- or A-Injury; TIFA 2006-2010 .................................................................. 35
Table 19 Ejection and Driver Injury, SUTs TIFA 2006-2010, GES 2006-2010 .......................... 37
Table 20 Ejection and Driver Injury, Truck-Tractors TIFA 2006-2010, GES 2006-2010 ........... 38

v
Table 21 Seat Belt Use and Ejection, Drivers, SUTs TIFA 2006-2010, GES 2006-2010 ............ 38
Table 22 Seat Belt Use and Ejection, Drivers, Truck-Tractors TIFA 2006-2010, GES 2006-2010 ......................................................................................................................... 39
Table 23 Seat Belt Use and Degree of Ejection Drivers, Truck-Tractors, Fatal Crashes Only TIFA 2006-2010 ................................................................................................................ 39
Table 24 Ejection and Rollover, Truck-Tractors in Fatal Crashes TIFA 2006-2010 ................... 40
Table 25 Percent Distribution of Ejection by Most Harmful Event, Tractors in Fatal Crashes TIFA 2006-2010 ................................................................................................................ 40
Table 26 Seat Belt Use and Ejection, Passengers in SUTs, TIFA 2006-2010, GES 2006-2010 ................................................................................................................. 41
Table 27 Seat Belt Use and Ejection, Passengers in Truck-Tractors, TIFA 2006-2010, GES 2006-2010 ................................................................................................................. 42
Table 28 Ejection for Sleeper Occupants and Unbelted Seated Occupants Tractors Only in Fatal Crashes, TIFA 2006-2010 ......................................................................................... 43
Table 29 Percent Distribution of Truck-Tractor Driver Injury Severity by Rollover and Seat Belt Use TIFA 2006-2010, GES 2006-2010 ............................................................... 44
Table 30 Percent Distribution of Truck-Tractor Driver Injury Severity by Rollover and Ejection TIFA 2006-2010, GES 2006-2010 ....................................................................... 45
Table 31 Percent Distribution of Rollover and Ejection by Driver Injury, Truck-Tractors Only TIFA 2006-2010, GES 2006-2010 ............................................................................ 46
Table 32 Driver K+A Injury by Power Unit Type and Impact Point in Collision Events Class 7 and 8 Only, Fatal Crashes Only, Rollovers Excluded, TIFA 2006-2010 ................. 48
Table 33 Driver K+A Injury for SUT and Truck-Tractors by Impact Point in Collision Events All Crash Severities, Rollovers Excluded, TIFA 2006-2010 ................................... 49
Table 34 Seat Belt Effectiveness by Crash Type, SUTs TIFA 2006-2010, GES 2006-2010 ....... 51
Table 35 Seat Belt Effectiveness by Crash Type, Truck-Tractors TIFA 2006-2010, GES 2006-2010 ......................................................................................................................... 52
Table 36 Percentage of Truck Driver Fatal and A Injuries by Power Unit Type and Posted Speed Limit TIFA 2006-2010, GES 2006-2010 ................................................................. 53
Table 37 Probability of Driver K+A Injury by Power Unit Type and Posted Speed Limit TIFA 2006-2010, GES 2006-2010 ..................................................................................... 54
Table 38 Percent Distribution of Driver K+A Injury by Crash Type, Truck-Tractors Only TIFA 2006-2010, GES 2006-2010 ..................................................................................... 55
Table 39 Annual Average Driver K+A Injuries by Crash Type, Truck-Tractors Only TIFA 2006-2010, GES 2006-2010 .............................................................................................. 55
Table 40 Truck Configuration by Crash Type, LTCCS Crash Population Reviewed .................. 57
Table 41 Quarter Turns in Rollover by Truck Configuration LTCCS Crash Population Reviewed .......................................................................................................................... 57

vi
Table 42 Direction of Rollover by Truck Configuration LTCCS Crash Population Reviewed .......................................................................................................................... 58
Table 43 LTCCS Rollover and Frontal Impact Cases Reviewed ................................................ 59
Table 44 Driver Injury in LTCCS Frontal Impact Cases Reviewed ............................................ 69
Table 45 Cab Integrity in Frontal Impacts, Driver K-, A-, or B-injuries .................................... 70
Table 46 Seat Belt Use and Ejection, Rollover and Frontal Impact Tractor-semitrailers and Straight Trucks, LTCCS .................................................................................................... 79
Table 47 Maximum Injury Severity by Crash Type, LTCCS ..................................................... 79
Table 48 Distribution of Injuries by Body Part Injured for Belted, Not Belted but Not Ejected, and Ejected Drivers Tractor-semitrailers and Straight Trucks that Rolled Over .... 80
Table 49 Distribution of Injuries by Body Part Injured, AIS 2+, Belted, Not Belted and Not Ejected, Heavy Truck Rollover, LTCCS Data .................................................................... 82
Table 50 Percent Distribution of Body Part Injured by Seat Belt Use, Frontal Crashes .............. 84
Table 51 Percent Distribution of Body Part Injured by Seat Belt Use, Frontal Crashes AIS 2+ Only, LTCCS Data ................................................................................................ 85
Table 52 Percentage of Injury Source for Rollovers and Frontals, Belted and Not Belted/Contained ............................................................................................................... 87
Table 53: Estimates of Technology Take-Rate for Safety Technology by Vehicle Class ............ 89

vii
List of Figures
Figure 1 Conventional (left) and Cab Over Engine Cab Styles.....................................................2
Figure 2 Cab Style Trends ...........................................................................................................3
Figure 3 COE Frontal Strength Test Configuration ......................................................................8
Figure 4 Vertical Position of Platen Contact ................................................................................8
Figure 5 Dynamic Pre-Load Configuration ................................................................................ 10
Figure 6 Quasi-Static Roof Load Configuration......................................................................... 11
Figure 7 Front Impact Test (Test A) .......................................................................................... 12
Figure 8 Front Pillar Impact Test (Test B) ................................................................................. 14
Figure 9 Roof Strength Test (Test C) ......................................................................................... 15
Figure 10 Truck Driver Fatalities by GVWR Class TIFA 2006-2010 ........................................ 20
Figure 11 Driver Belt Usage Rates for Trucks and Cars From Observational Studies, 2002-2010 ................................................................................................................. 24
Figure 12 Schematics Used to Code Impact Point on Trucks in FARS....................................... 47
Figure 13 Cumulative Percentage of Truck Driver Fatal and A-Injuries, by Power Unit Type TIFA 2006-2010, GES 2006-2010 ............................................................................. 53
Figure 14 Schematic of Truck Cab Greenhouse ......................................................................... 60
Figure 15 Truck-Tractor With 100 Percent Crush ...................................................................... 60
Figure 16 Truck-Tractor Rolled 4 Quarter Turns, Destroying the Cab ....................................... 61
Figure 17 Driver Compartment of Truck-Tractor That Rolled off a Bridge and Fell 11.2 M ...... 62
Figure 18 Cab Space Remaining by Truck Type, Rollover Crashes ........................................... 63
Figure 19 SUT Rollover, Cab Protected by the Cargo Body ...................................................... 64
Figure 20 SUT Rollover With 2 Quarter Turns, Cab Protected by Tank Cargo Body ................. 64
Figure 21 Cab Space Remaining by Truck Type, Rollover Crashes, Belted Drivers Only .......... 65
Figure 22 Cab Space For One and Two Or More Quarter Turns ................................................ 66
Figure 23 Rollover With Subsequent Contact With Concrete Barrier ......................................... 67
Figure 24 Truck After Being Up-Righted .................................................................................. 67
Figure 25 Truck Rollover Into Guardrail ................................................................................... 68
Figure 26 Distribution of Cab Space Remaining, Truck Rollover and Subsequent Contact ........ 69
Figure 27 Cab Space Remaining in Frontal Crashes, All and Belted Drivers Only ..................... 70
Figure 28 Rear Hood Intrusion Into Drivers Compartment ........................................................ 71

viii
Figure 29 Hood Intrusion in Frontal Collision ........................................................................... 72
Figure 30 Truck Cab Rear Intrusion From Steel Coil ................................................................. 73
Figure 31 Broken Seat Mount from Rear Intrusion .................................................................... 74
Figure 32 Truck Cab After Rear Trailer Intrusion ...................................................................... 75
Figure 33 Rear Intrusion from Trailer in Frontal Impact ............................................................ 76
Figure 34 Cab Frontal Damage .................................................................................................. 76
Figure 35 Undamaged Comparison Cab .................................................................................... 77
Figure 36 Cab Interior Showing Damaged Seat and Instrument Panel Intrusion......................... 77
Figure 37 Tractor-semitrailer and Straight Trucks, Cab Interior Contact for Driver Injuries, Rollover ................................................................................................................... 81
Figure 38 Tractor-Semitrailer and SUTs, Cab Interior Contact for AIS 2+ Injuries, Rollover, LTCCS Data ............................................................................................................ 83
Figure 39 Source of Injury in Frontal Impacts, by Seat Belt Use, LTCCS Data ......................... 84
Figure 40 Source of Injury in Frontal Impacts, AIS2+ Injuries Only, by Seat Belt Use, LTCCS .............................................................................................................................. 86
Figure 41 Steering Wheel Deformed by Belted Driver in Frontal Impact ................................... 86
Figure 42: Comparative Images of Truck Body Influence on Cab Crush ................................... 91
Figure 43: IMMI RollTek Truck Driver Seat ............................................................................. 92

ix
Acknowledgments
The authors are grateful for the technical support provided by the Technical Advisory Group that was organized under the auspices of the Society of Automotive Engineers Truck Crashworthi-ness Committee to provide industry advice during the course of this research project.
Technical Advisory Group members: Roger Lackore (Chair) – Oshkosh Ted Scott – American Trucking Associations Charles Blakewood – Daimler Trucks Nasser Zamani – Daimler Trucks Jim Chinni – IMMI Rich Kempf – Navistar Larry Bean – PACCAR Christofer Karlsson – Scania Tom Klena – TRW Andrew Adams – Volvo Trucks

1
Heavy Truck Crashworthiness:
Injury Mechanisms and Countermeasures to Improve Occupant Safety
1 Introduction
In the early 2000s, about 700 to 800 truck drivers were killed in truck crashes each year. In recent years, the number of truck driver fatalities has decreased due in large part to a general reduction in fatal truck crashes. However the proportion of drivers killed in relation to the number of fatal truck crashes has remained between 14 percent and 16 percent over the years. In 2003 and 2004, there were about 700 truck drivers fatally injured in crashes, and the number increased substantially in each of the next three years. The trend in the number of truck drivers killed began to decline after 2007, possibly due to reduced truck travel brought on by the recession. In 2007, a total of 796 truck drivers were killed in 5,049 fatal truck crashes, a 15.8 percent occurrence (Jarossi, Hershberger et al. 2012). In 2008, there were 639 truck drivers killed in 4,352 fatal truck crashes (14.7%); in 2009, there were 487 drivers killed in 3,450 fatal truck crashes (14.1%); and in 2010, 540 truck drivers were killed in 3,699 fatal crashes (14.6%). While the number of truck drivers killed in traffic crashes has fluctuated over the period, the ratio of drivers killed in relation to fatal truck crashes shows little change.
In addition to the fatalities, there were an estimated 2,600 incapacitating injuries, 6,400 non-incapacitating but evident injuries, and 7,500 minor injuries to truck drivers each year. In total, almost 21,000 truck drivers were estimated to be injured in traffic accidents each year. These statistics were derived from the Trucks Involved in Fatal Accidents database, compiled at University of Michigan Transportation Research Institute, and the National Automotive Sample Survey General Estimates System crash database. These data files are described in section 5.1. For more details on trends in truck occupant injuries, see section 6.1 and 6.2.
This report describes a research project designed to provide an analysis of truck driver injury and loss of life in truck crashes related to cab crashworthiness, and to investigate regulations, industry trends and possible countermeasures related to truck occupant protection. The goal of this project is to assemble information on truck driver casualties in crashes to assist in understanding injury mechanisms and to review regulatory and industry initiatives concerned with reducing the number of truck occupant fatalities and the severity of injuries. In particular the research study focused on the following two tasks:
1) Provide an analysis of truck driver injury and loss of life in truck crashes related to cab crashworthiness.
2) Review regulatory and industry initiatives concerned with reducing the number of truck occupant fatalities and the severity of injuries.

2
2 About Truck Cabs
Truck and truck-tractor (heavy vehicles) cabs function as the work environment for vehicle operators and passengers. They provide restraint and protection during critical events such as hard braking, evasive maneuvers and crashes. Truck cabs, particularly in class 7 and 8 vehicle weight categories, are distinct modules that are attached to the chassis frame rails with a cab suspension system designed to mitigate vibration transmitted from the chassis to the cab structure. The cab does not contribute to the structural integrity of the chassis nor does the chassis contribute significantly to the structural integrity of the cab structure.
Given their modular context, cabs vary in shape and size depending on the model and intended use of the vehicle. They fall into two basic categories, cab over engine (COE) and conventional (see Figure 1). The COE was more prevalent in the US until overall vehicle length regulations for articulated vehicles were relaxed and part of the Surface Transportation Assistance Act of 1982. Today, COEs are rarely seen as their numbers have diminished significantly since 1982 as shown in Figure 2. However they are frequently found on vocational single-unit trucks (SUTs) such as refuse haulers, and urban delivery trucks. In Europe where vehicle overall vehicle length is constrained, COEs are very common both as truck-tractors and SUTs.
Figure 1 Conventional (left) and Cab Over Engine Cab Styles
In U.S. crash databases, COE and conventional cab styles can only be differentiated in the University of Michigan Transportation Research Institute’s (UMTRI) Trucks Involved in Fatal Accidents (TIFA) database. Among class 7 and 8 truck-tractors, COEs represent about 1.4 percent of the vehicles in the 2006 to 2010 data years. In the SUT class 7 and 8 category, COE prevalence is 12.5 percent.

3
0.0
10.0
20.0
30.0
40.0
50.0
60.0
70.0
80.0
90.0
100.0
Perc
enta
ge
Crash year
STAA 1982
Conventional
COE
Figure 2 Cab Style Trends
As shown in Table 1, COE vehicles tend to have about the same risk of fatal or A-injury (incapacitating) to truck drivers in fatal crashes, regardless of belt use or GVWR class.1 In class 3-6 vehicles, belt use diminishes the probability of fatal or A-injury by a factor of 4.0 in conventional cabs and a factor of 3.5 for COE. For class 7 and 8, seat belt use reduces the probability by a factor of 5.8 in conventional cabs and a factor of 7.9 for COE vehicles. The data show that seat belt usage is highly beneficial and that there is a significantly greater benefit to seat belt usage in class 7 and 8 vehicles for both COE and conventional cab styles.
Table 1 Percent Probability of K- or A-Injury by Cab Style, Belt Use, and GVWR Class
Truck type Conventional COE
Belt No belts Belt No belts Class 3-6 15.1 60.5 20.3 70.6 Class 7, 8 9.8 56.9 7.0 55.1 All trucks 10.7 58.0 12.9 60.8
3 Review of Regulatory Development
In 1990, a major cab crashworthiness initiative was launched under the auspices of the SAE Cooperative Research Program. It consisted of three separate phases. Phase I reported in 1992 and focused on statistics, accident reconstruction and occupant dynamics simulation; Phase II concentrated on 180-degree dynamic rollover and static roof crush simulation. Phase I and II identified three key elements in the crashworthiness of heavy truck-tractors as cab structural
1 Definitions of injury severity are provided in section 5.2.

4
integrity, residual space for occupants, and effectiveness of restraint system(s). Phase III was comprised of three main tasks structured to develop and evaluate recommended test procedures that could be used to evaluate occupant protection in heavy trucks. The tasks were as follows:
• Task A – Development of test procedures for occupant restraint system evaluation in frontal impact and 90 degree rollover conditions.
• Task B – Development of test procedures for evaluating interior component impacts by occupants.
• Task C – Development of quasi-static and dynamic test procedures to evaluate structural integrity of truck cabs.
The product of the SAE Cooperative Research Program on heavy truck crashworthiness was the development of SAE Recommended Practice SAE J2420 and SAE J2422 both formally issued January 1998.
In the year 2000 timeframe the Paris-based International Organization of Motor Vehicle Manufacturers (Organisation Internationale des Constructeurs d’Automobiles OICA) established a working group focused on harmonizing truck cab structural standards with the intent of facilitating the creation of a global technical regulation. At the request of the Truck Manufactures Association (TMA), members of the SAE Truck Crashworthiness Committee volunteered to participate in this effort.
The number of truck manufacturers participating was large and included Volvo, Scania, Iveco, Renault, Peugeot, MAN, Daimler, Volkswagen, Autoliv, FIAT, JAMA (representing Japanese manufacturers) and TMA (representing US manufacturers). Most of the early meetings were spent on reviewing existing standards, and discussing available crash data and research. At the time there was very little comprehensive technical information available on this subject with the exception of the research work done associated with the SAE Truck Crashworthiness Committee which lead to the creation of SAE J2420 (later adopted by European Commission EC) and J2422 Recommended Practice which focus on improving truck cab strength.
The consensus of the group was that most heavy truck crashes could be broken into the categories identified in the SAE research program. They included frontal collisions, 90° rollovers, 90° rollovers with subsequent impacts, 180° rollovers, and rollovers greater than 180°. Subsequently the working group reduced the set to frontal collisions, 90° rollovers with subsequent impacts, and 180° rollovers. The 90° rollovers were recognized in general to be not cab intrusive as 90° rollovers with subsequent impacts and the greater than 180° rollovers were generally believed to not be survivable due to their high energies.
For the frontal collisions, there was extensive debate on the merits of cab only testing and barrier testing. Eventually it was recognized that the pendulum approach used in ECE Regulation 29

5
was a more practical approach to evaluating cab structural strength. Discussion then turned to the impact energy requirements and a general consensus was reached to increase the energy content over the existing ECE Regulation 29 requirements. There was good agreement that the 180° rollover scenario was well addressed by SAE J2422 and that this approach was better than other evaluations used at the time.2
There has been considerable movement in European Standards with the introduction of the EC whole vehicle type approval (WVTA), which Sweden and the 26 other EC member countries have adopted. Neither the Swedish VVFS 2003:29 cab strength standard nor the ECE cab strength standard R29.03 are included. However a cab standard in the form of VVFS 2003:29 and ECE Regulation R29.03 will be implemented in the near future as part of the General Safety Regulation GSR which is being included in the WVTA. Prior to the adoption of the WVTA, EC member counties, Sweden being one of them, could add any national requirements to a particular EC Regulation applied within their borders. However the recently adopted WVTA does not permit the inclusion of national requirements.3
A comparison of the Swedish VVFS 2003:29 and ECE cab strength standards in R29.02 is shown in Table 2.
2 Information for this record of account was provided by the Technical Advisory Group, SAE Truck Crashworthiness Committee. 3 ECE Regulation 29 and other standards can be found in section 4.

6
Table 2 Comparison between Swedish and ECE Tests
Source: Scania
Blue font indicates clarifying notes

7
4 Cab Integrity Standards
The following are relevant cab standards addressing cab structure integrity. Standards and regulations related to restraint systems have not been included given that the analysis did not investigate the structural requirements of seat belts or anchor systems.
4.1 SAE J2420 – COE Frontal Strength Evaluation—Dynamic Loading Heavy Trucks
Issued January 1998 and revised December 2003. (SAE 2003a)
The particular standard is for GVWR classes 6 and up, that is greater than 8845 kg (19 501 lbs.).
Scope—This SAE Recommended Practice describes the test procedures for conducting dynamic frontal strength test for COE heavy truck applications. Its purpose is to establish recommended test procedures which will standardize the procedure for heavy trucks.
The following publications were used to support the recommended practice:
SAE CRP-9—"Heavy Truck Crashworthiness (Statistics, Accident Reconstruction, Occupant Dynamics Simulation)", March 1995.(Cheng, Girvan et al. 1991; Cheng, Girvan et al. 1992; Cheng, Khatua et al. 1994)
SAE CRP-13—"Heavy Truck Crashworthiness (Phase III)," April 1997 (Cheng, Girvan et al. 1997).
ECE Regulation 29: Uniform Provisions Concerning the Approval of Vehicles with Regard to the Protection of the Occupants of the Cab of a Commercial Vehicle.
8
Figure 3 COE Frontal Strength Test Configuration
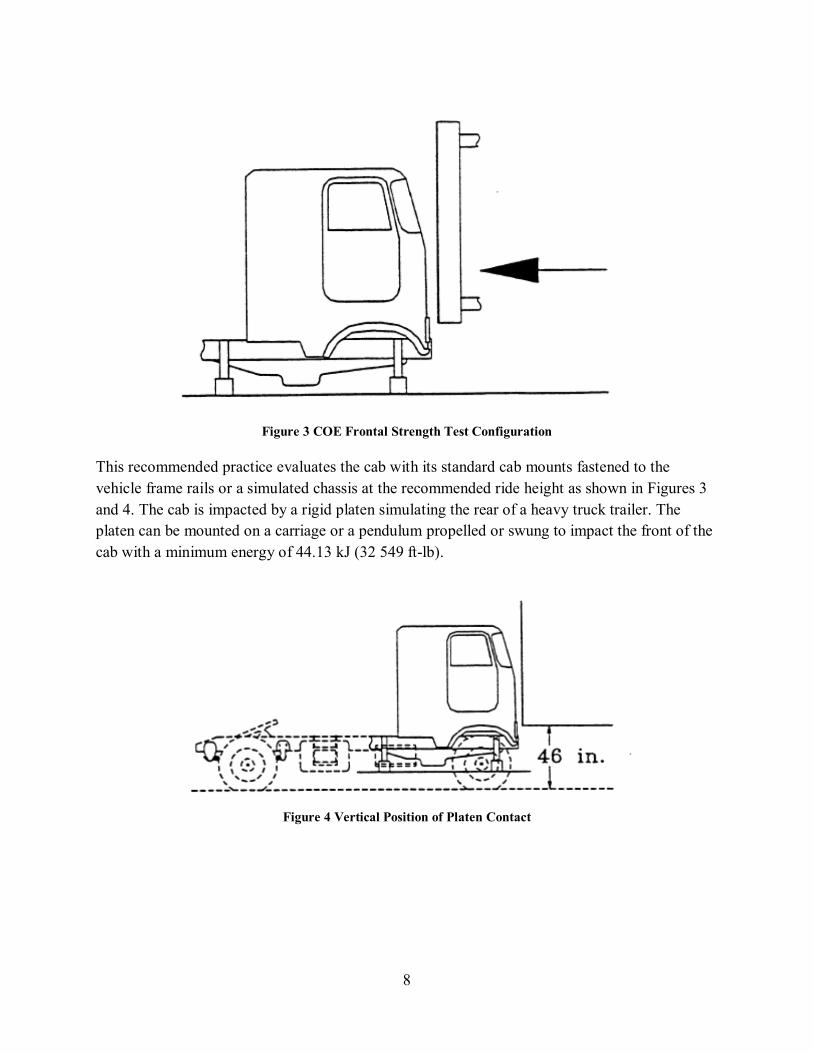
This recommended practice evaluates the cab with its standard cab mounts fastened to the vehicle frame rails or a simulated chassis at the recommended ride height as shown in Figures 3 and 4. The cab is impacted by a rigid platen simulating the rear of a heavy truck trailer. The platen can be mounted on a carriage or a pendulum propelled or swung to impact the front of the cab with a minimum energy of 44.13 kJ (32 549 ft-lb).
Figure 4 Vertical Position of Platen Contact

9
Performance Requirements: During the test, components attaching the cab to the chassis frame may become distorted or broken, but the cab shall remain attached, and in an orientation similar to the original. None of the doors shall open during the tests, but the doors shall not be required to open after testing.
Post-test, the cab shall exhibit a survival space allowing accommodation of the manikin defined in ECE Regulation 29 on the seat, with the seat in its median position, without contact between the manikin and non-resilient parts. (ECE R29 2011)
SAE J2420 Revision December 2003 - The original document did not include either a magnitude for the loadings to be imposed or a pass/fail criteria for a final evaluation but it did set out a common test procedure which could be followed to which industry applied company specific loads and pass/fail criteria. This omission was corrected by incorporating the load conditions and pass/fail criteria from ECE Regulation 29, which was considered the most applicable resource.
4.2 SAE J2422 Cab Roof Strength Evaluation – Quasi-Static Loading Heavy Trucks
Issued January 1998 and revised December 2003 (SAE 2003b)
Scope—This SAE Recommended Practice describes the test procedures for conducting quasi-static cab roof strength tests for heavy-truck applications. Its purpose is to establish recommended test procedures which will standardize the procedure for heavy trucks.
The following publications were used to support the recommended practice
SAE CRP-9—"Heavy Truck Crashworthiness (Statistics, Accident Reconstruction, Occupant Dynamics Simulation)", March 1995.(Cheng, Girvan et al. 1991; Cheng, Girvan et al. 1992; Cheng, Khatua et al. 1994)
SAE CRP-13—"Heavy Truck Crashworthiness (Phase III)," April 1997.(Cheng, Girvan et al. 1997)
ECE Regulation 29: Uniform Provisions Concerning the Approval of Vehicles with Regard to the Protection of the Occupants of the Cab of a Commercial Vehicle. (ECE R29 2011)
Summary: The cab roof strength test is designed to evaluate the resistance of a heavy-truck cab in 180-degrees rollover. The loading is divided into two phases, a dynamic pre-load that simulates the side loading on the upper cab as the vehicle rolls past 90 degrees, and a quasi-static roof loading that simulates the loading on the cab when the vehicle is inverted. Both phases are conducted on a cab attached to actual or simulated frame rails with its standard cab mounts. The loading is applied to the cab with a platen. The energy for the dynamic pre-loading is generated from the inertia of the plate and the structure carrying it.

10
Dynamic Pre-Load—In the dynamic pre-load, the platen impacts one side of the cab which is attached to its chassis fixed to the ground at a roll angle of 20 degrees. The vertically oriented platen initially contacts the upper portion of the cab as shown in Figure 5. The platen is oriented vertically, and aligned parallel to the chassis longitudinal axis. Either side of the cab may be loaded, depending on whether a driver side or passenger side leading rollover is to be simulated.
Figure 5 Dynamic Pre-Load Configuration
The energy to pre-load the cab comes from the kinetic energy of the platen and its supporting structure. For the pre-load phase of the test, the target energy level is 1.6 times a reference energy level up to a maximum recommended target level of 17,625.6 J (13 000 ft-lb). The recommended maximum was based upon the limited testing performed to evaluate this test procedure and to produce cab damage consistent with rollover crashes. Manufacturers can, at their discretion, exceed this maximum. (Cheng, Girvan et al. 1992; Parnell, Cheng et al. 1996; Cheng, Girvan et al. 1997) The reference energy level is an approximation of the kinetic energy developed when a vehicle is tipped from its static stability position to a rest position on its side.
The platen can be mounted on a carriage or a pendulum propelled or swung to impact the front of the cab with a prescribed energy level.
Quasi-Static Roof Load— this test follows the dynamic pre-load test. In this test a platen is loaded into the roof of the cab. The platen moves parallel to the vertical axis of the chassis. This can be implemented by affixing the chassis to ground, with it rotated so that the longitudinal axis of the chassis is horizontal and the lateral axis is vertical. With the side of the cab that was impacted in the pre-load phase oriented downward, a vertical platen would then travel horizontally into the roof. This roof loading configuration is shown in Figure 6.
Another possible implementation is with the chassis mounted with its longitudinal and lateral axes horizontal, with the platen traveling in the vertical direction.

11
Figure 6 Quasi-Static Roof Load Configuration
Performance Requirements—the load applied to the roof shall be equivalent to the maximum rated capacity of the front axle of the vehicle, subject to a maximum of 98.07 kN (22 046 lbs.).
During the test, components attaching the cab to the chassis frame may become distorted or broken, but the cab shall remain attached, and in an orientation similar to the original.
None of the doors shall open during the tests, but the doors shall not be required to open after testing.
Following the test, the cab of the vehicle shall exhibit a survival space allowing accommodation of the manikin defined in ECE Regulation 29 on the seat, with the seat in its median position, without contact between the manikin and non-resilient parts. (ECE R29 2011)
SAE J2422 Revision December 2003 – The original document did not include either a magnitude for the loadings to be imposed or a pass/fail criteria for a final evaluation but it did set out a common test procedure which could be followed to which industry applied company specific loads and pass/fail criteria. This omission was corrected by incorporating the load conditions and pass/fail criteria from ECE Regulation 29, which was considered the most applicable resource.

12
4.3 UN ECE Regulation R29.034
In Europe, Regulation R29 underwent three amendments and the numeric element in the name was changed to UN ECE Regulation R29.03. The revised regulation took effect in January, 2011. The focus remained on the protection of the occupants of commercial vehicles.
Scope- This Regulation applies to vehicles with separate driver’s cab of category N1 with regard to the protection of the occupants of the cab.
Test procedure • Doors - Before the tests the doors of the cab shall be closed but not locked. • Engine - For test A the engine, or a model equivalent thereto in mass, dimensions and
mounting, shall be fitted to the vehicle. • Cab - The cab shall be equipped with the steering mechanism, steering wheel,
instrument-panel and the driver and passenger seats. The steering wheel and the seating position shall be adjusted to their positions for normal use as prescribed by the manufacturer.
• Anchorage of the cab - For test A, the cab shall be mounted on a vehicle. For tests В, C the cab shall, at the manufacturer’s choice, be mounted either on a vehicle or on a separate frame.
Figure 7 Front impact test (test A)
4 Note: N1 -commercial vehicles with GVW less than 3.5 tonnes. N2 - commercial vehicles with GVW greater than 3.5 tonnes and not exceeding 12 tonnes. N3 - commercial vehicles with GVW exceeding 12 tonnes.

13
• The impactor shall be made of steel and its mass shall be evenly-distributed; its mass shall not be less than 1,500 kg. Its striking surface, rectangular and flat, shall be 2,500 mm wide and 800 mm high (see b and h on Figure 7). Its edges shall be rounded to a radius of curvature of 10 mm± 5 mm.
• The impactor assembly shall be of rigid construction. The impactor shall be freely suspended by two beams rigidly attached to it and spaced not less than 1,000 mm apart (see f on Figure 7). The beams shall be not less than 3,500 mm long from the axis of suspension to the geometric center of the impactor (L on Figure 7).
• The impactor shall be so positioned that in the vertical position: Its striking face is in contact with the foremost part of the vehicle; Its center of gravity is c=50 +5/ - 0 mm below the R point of the driver’s seat, and
its center of gravity is in the median longitudinal plane of the vehicle. • The impactor shall strike the cab at the front in the direction towards the rear of the
cab. The direction of impact shall be horizontal and shall be parallel to the median longitudinal plane of the vehicle.
• The impact energy shall be: 29.4 kJ in the case of vehicles of category N1 and of vehicles of category N2 with
a gross vehicle mass not exceeding 7.5 t. 55 kJ in the case of vehicles of category N3 and of vehicles of category N2 with a
gross vehicle mass exceeding 7.5 t.

14
Front pillar impact test (Test B)
Figure 8 Front pillar impact test (Test B)
• The impactor shall be rigid and its mass shall be evenly-distributed; its mass shall not be less than 1,000 kg. The impactor shall be cylindrical with a diameter d of the cylinder of 600 ± 50 mm and a length b of not less than 2,500 mm. Its edges shall be rounded to a radius of curvature of not less than 1.5 mm.
• The impactor assembly shall be of rigid construction. The impactor shall be freely suspended by two beams rigidly attached to it and spaced not less than f = 1,000 mm apart. The beams shall not be less than L = 3,500 mm long from the axis of suspension to the geometric center of the bob impactor.
• The impactor shall be so positioned that when its suspension is in the vertical position: Its striking face is in contact with the foremost part of the cab. Its median longitudinal line is horizontal and perpendicular to the median
longitudinal vertical plane of the cab.

15
Its center of gravity is midway between the lower and the upper windscreen frame, as measured along the windscreen and along the median longitudinal vertical plane of the cab.
Its center of gravity is in the median longitudinal plane of the cab. Its length is equally distributed over the width of the vehicle, overlapping the full
width of both A-pillars. • The impactor shall strike the cab at the front in the direction towards the rear of the
cab. The direction of impact shall be horizontal and shall be parallel to the median longitudinal plane of the vehicle.
• The impact energy shall be 29.4 kJ
Roof strength test (Test С)
Figure 9 Roof strength test (Test C)
• For vehicles of category N2 with a gross vehicle mass exceeding 7.5 t and of category N3, both the dynamic pre-load and roof strength tests, in that order, shall be conducted on the same cab.
• For vehicles of category N2 with a gross vehicle mass not exceeding 7.5 t and of category N1, only the test as described below shall be conducted.
• Dynamic pre-loading of vehicles of category N2 with a gross vehicle mass exceeding 7.5 t and of category N3 (see P1 on Figure 9).
• The impactor shall be rigid and its mass shall be evenly distributed; its mass shall not be less than 1,500 kg.
16
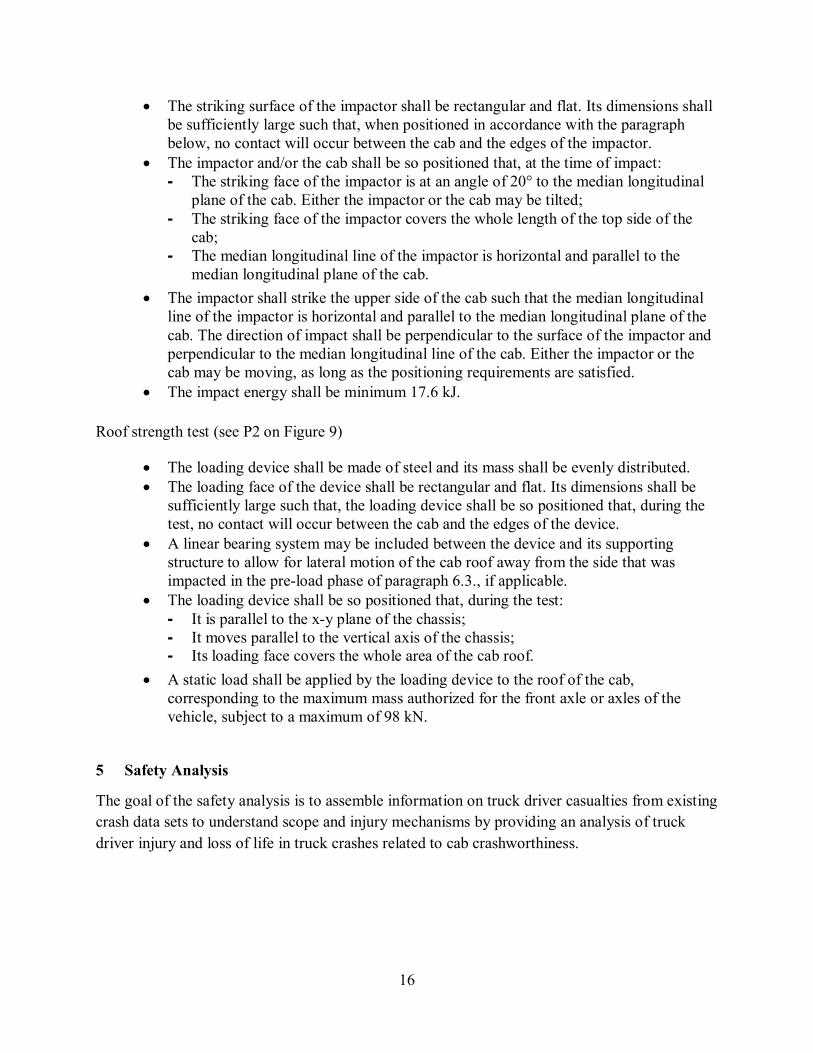
• The striking surface of the impactor shall be rectangular and flat. Its dimensions shall be sufficiently large such that, when positioned in accordance with the paragraph below, no contact will occur between the cab and the edges of the impactor.
• The impactor and/or the cab shall be so positioned that, at the time of impact: The striking face of the impactor is at an angle of 20° to the median longitudinal
plane of the cab. Either the impactor or the cab may be tilted; The striking face of the impactor covers the whole length of the top side of the
cab; The median longitudinal line of the impactor is horizontal and parallel to the
median longitudinal plane of the cab. • The impactor shall strike the upper side of the cab such that the median longitudinal
line of the impactor is horizontal and parallel to the median longitudinal plane of the cab. The direction of impact shall be perpendicular to the surface of the impactor and perpendicular to the median longitudinal line of the cab. Either the impactor or the cab may be moving, as long as the positioning requirements are satisfied.
• The impact energy shall be minimum 17.6 kJ.
Roof strength test (see P2 on Figure 9)
• The loading device shall be made of steel and its mass shall be evenly distributed. • The loading face of the device shall be rectangular and flat. Its dimensions shall be
sufficiently large such that, the loading device shall be so positioned that, during the test, no contact will occur between the cab and the edges of the device.
• A linear bearing system may be included between the device and its supporting structure to allow for lateral motion of the cab roof away from the side that was impacted in the pre-load phase of paragraph 6.3., if applicable.
• The loading device shall be so positioned that, during the test: It is parallel to the x-y plane of the chassis; It moves parallel to the vertical axis of the chassis; Its loading face covers the whole area of the cab roof.
• A static load shall be applied by the loading device to the roof of the cab, corresponding to the maximum mass authorized for the front axle or axles of the vehicle, subject to a maximum of 98 kN.
5 Safety Analysis
The goal of the safety analysis is to assemble information on truck driver casualties from existing crash data sets to understand scope and injury mechanisms by providing an analysis of truck driver injury and loss of life in truck crashes related to cab crashworthiness.

17
5.1 Data
Two national crash data files were used to analyze fatalities and injuries in truck crashes and to identify the primary crash types and injury mechanisms. They are UMTRI’s TIFA survey file and NHTSA’s General Estimates System (GES) file.
The TIFA crash data file was produced by the Center for National Truck and Bus Statistics at the UMTRI. The TIFA file was a survey of all medium and heavy trucks (gross vehicle weight rating (GVWR) > 10,000 lbs.) involved in a fatal crash in the United States. Candidate truck cases were extracted from NHTSA’s Fatality Analysis Reporting System (FARS) file, which is a census of all traffic crashes involving a fatality in the United States. To collect data for TIFA, police reports were acquired for each crash, and UMTRI researchers contacted drivers, owners, operators, and other knowledgeable parties about each truck. The TIFA survey collected a detailed description of each truck involved, as well as data on the truck operator and on the truck’s role in the crash. The TIFA file was a census file, which means that every truck involved in a fatal crash was included in the file. TIFA included about 4,400 trucks involved in a fatal crash each year. (Jarossi, Hershberger et al. 2012)
The GES crash file is part of NHTSA’s National Automotive Sampling System (NASS). GES is a nationally-representative sample of the estimated 6.4 million police-reported crashes that occur annually. GES includes all vehicles involved in a specific traffic crash, not just trucks. GES is the product of a sample survey with clustering and stratification. Case weights allow national estimates to be computed from the samples. All crash severities are included in GES. To compile annual GES files, police reports are sampled and data are coded entirely from those sampled police reports. The GES file includes vehicle information that allow trucks to be classified by power unit type (truck-tractor or SUT) and variables that describe crash events and types, along with data about injuries for all persons involved in crashes. The GES file has been compiled since 1988. GES samples about 10,000 trucks per year. These 10,000 sampled trucks equate to a national estimate of about 440,000 trucks involved in a police-reported crash annually. (NHTSA 2011c)
Five years of data were combined for this study, using 2006-2010 data. Multiple years of data are used to provide robust estimates of deaths and injuries. The counts of crash involvements and injuries are annual averages, based on the five years of data.
Data from the TIFA file were used to represent all fatal truck crashes. Trucks involved in nonfatal crashes were extracted from the GES data. Most of the significant fields in TIFA and GES are compatible, so data from TIFA and GES were combined to form a consistent and comprehensive description of truck crashes of all severities. Since TIFA was a census file, the combination of TIFA and GES provides the most accurate accounting of truck crashes of all severities.

18
In addition to the TIFA and GES data sets, crash investigation data from the Large Truck Crash Causation Study (LTCCS) was used for a supplemental clinical review of cab performance in two crash types. The LTCCS was undertaken jointly by the Federal Motor Carrier Safety Administration (FMCSA) and NHTSA. LTCCS was based on a sample of 963 injury and fatal crashes involving 1,123 large trucks that occurred between April 2001 and December 2003. The crash severity threshold for LTCCS was a fatality, an incapacitating injury (A-injury), or a non-incapacitating but evident injury (B-injury). The data collected provide a detailed description of the physical events of each crash, along with information about all vehicles and drivers, weather and roadway conditions, and trucking companies involved in the crashes. The data were collected by two-person teams: a crash investigator and, typically, a state truck inspector. (NHTSA and FMCSA 2006b; NHTSA and FMCSA 2006a)
The LTCCS is a rich source of detailed crash investigations, including scene diagrams and photos, photos of each involved vehicle, and a detailed summary of events by the researchers. This information is all available through a Web browser interface.(NHTSA/FMCSA 2012) The LTCCS includes all the variables used in the TIFA and GES files to identify crash types and events associated with truck driver injury. Photos in the LTCCS case materials were used to examine cab performance in the crashes. In addition, data on driver injury in crashes was used to provide more detail on how truck drivers are injured in certain crash types.
Data in the tables may be subject to rounding errors. This will happen in tables that show annual averages over multiple years, or in tables based on GES or LTCCS which are sample files with fractional weights.
5.2 Definitions
In the TIFA, GES, and LTCCS crash files, injury is classified using the KABCO injury severity scale. KABCO is the common injury severity scale used on all police crash reports and in crash files built on those reports.
Code Description
K-injury Fatal injury. A fatality that occurs within 30 days of a crash and is due to injuries received in the crash is counted as a fatal injury
A-injury
An incapacitating injury is one that prevents an injured person from walking, driving, or continuing with the normal activities of which the person was capable before the injury. Severe lacerations, broken limbs, skull fractures, or extended unconsciousness all count as incapacitating.
B-injury A non-incapacitating but evident injury. Bruises, abrasions, and minor lacerations are counted as B-injuries.
C-injury Possible injury, also known as complaint of pain. Examples include momentary unconsciousness, claim of injuries not evident, or limping.
O No injury.

19
In this analysis, primary attention is on fatal (K) and incapacitating (A) injuries because they are the most serious and account for the most total harm in truck crashes. Estimates of total harm by injury severity in truck crashes show that on average fatalities are almost 49 times as costly as the least severe injury (C-injury). (Zaloshnja and Miller 2007) A-injuries are estimated to be over five times as costly. The combination of fatal and A-injuries will be referred to as K+A-injuries.
Trucks are classified by GVWR. Class 7 and 8 trucks are often collectively referred to as “heavy” trucks, while class 3 through 6 trucks are called “medium” trucks. This convention will be followed in this report. The following shows GVWR ranges for medium and heavy trucks.
Heavy trucks: GVWR class 7 and 8 (26,001 lbs. and above.)
Medium trucks: GVWR class 3-6 (10,001 lbs. to 26,000 lbs.)
6 Truck Driver Injury and Injury Mechanisms
This section presents results from crash data analysis using the TIFA and GES databases. In the first subsection, recent trends in truck occupant injury are described. The next subsection provides estimates of the average annual incidence and distribution of fatalities and injuries to drivers and other truck occupants in crashes. Next, the extent of reported belt use is described for different categories of truck occupants. The distribution of injuries to belted and unbelted truck occupants are described separately. Following this is a section that presents data on fatality risks for different classes of trucks.
In the following sections, an analysis is presented that identifies and describes the primary crash types and events associated with truck driver injury. First a crash typology is presented that identifies the riskiest crash types in terms of driver injury. Next are sections on ejection, rollover and fire, impact location in collision events, the association of driver injury risk with speed, and estimates of seat belt effectiveness is reducing truck driver injury in crashes.
6.1 Trends
Figure 10 shows annual counts of driver fatal injuries for 2006 through 2010, broken down by class 3-6 (medium-duty) trucks and class 7-8 (heavy) trucks. Driver fatal injuries for both truck GVWR classes declined over the period, decreasing from 617 to 390 for heavy trucks and from 166 to 150 for medium-duty trucks. The decline has been relatively greater for heavy trucks than medium-duty trucks. For heavy trucks, the total reduction in fatalities has been about 58 percent, compared with about 11 percent for medium duty trucks. It is likely that some of the decline to the low of 2009 and 2010 is due to lower levels of truck activity (exposure) due to a reduction in economic activity. This might be reflected more strongly among the heavy trucks used for long-

20
haul freight transportation. Combination truck travel estimates from the Federal Highway Administration’s Highway Statistics publication show an 8.7 percent decline in vehicle miles traveled from 2008 to 2009, followed by an increase of 4.7 percent from 2009 to 2010. SUT travel estimates declined by 5.3 percent from 2008 to 2009, and then again by 7.8 percent from 2009 to 2010.
2006 2007 2008 2009 2010Class 3-6 166 196 149 128 150Class 7-8 617 600 488 357 390Class 3-6 1.00 1.18 0.90 0.77 0.90Class 7-8 1.00 0.97 0.79 0.58 0.63
0.00
0.20
0.40
0.60
0.80
1.00
1.20
1.40
0
200
400
600
800
1,000
Change from baseline (2006 = 1.0)
Num
ber o
f fat
aliti
es
Figure 10 Truck driver fatalities by GVWR Class
TIFA 2006-2010
Table 3 shows annual counts of fatalities in trucks, broken out by year and distributed between drivers and passengers, for medium, heavy, and all trucks, respectively. Both medium and heavy trucks show a decline in the number of driver and passenger fatalities over the period. For medium duty trucks, 233 truck occupants were killed in 2006 and 178 occupants were killed in 2010 (reduction of 23.6%). For heavy trucks, the decline was from 694 to 431 (reduction of 37.9%).
Table 3 Driver and Occupant Fatalities in Medium and Heavy Trucks, TIFA 2006-2010
Truck size Occupant type
Crash year Total
2006 2007 2008 2009 2010
Class 3-6 Driver 166 196 149 128 150 789 Passenger 67 59 49 46 28 249 Total 233 255 198 174 178 1,038
Class 7-8 Driver 617 600 488 357 390 2,452 Passenger 77 64 73 36 41 291 Total 694 664 561 393 431 2,743
All trucks Driver 784 796 639 487 540 3,246 Passenger 144 123 122 82 69 540 Total 928 919 761 569 609 3,786

21
The number of in-cab fatalities and injuries is a function both of risk and exposure. Trucks with more occupants have a greater chance of a fatality or injury in a given collision. In the crash data, medium duty trucks tended to have more passengers than heavy trucks. On average over the period 2006-2010, medium trucks in fatal crashes had 1.45 occupants per truck, while heavy trucks had 1.12 occupants per truck. Many medium trucks were working vehicles, where the passengers were likely part of a work crew. Examples include construction workers riding in a dump truck, or helpers in a delivery van. Most heavy trucks were long-haul freight tractor-trailer combinations; while some have team-drivers, most heavy trucks in fatal crashes had solo drivers.
Passengers accounted for a higher share of fatalities in medium trucks than in heavy trucks, including both truck-tractors and SUTs. Across all the years in the table, 24.0 percent of the fatalities in medium duty trucks were passengers, compared with 10.6 percent for heavy trucks. (See Table 4.) The passenger share of fatalities varied over the period, for both medium-duty and heavy-duty trucks. In medium-duty trucks, passengers accounted for 28.8 percent of fatalities in 2006, but only 15.7 percent in 2010. Passengers accounted for 13.0 percent of occupant fatalities in heavy trucks in 2008, though only 9.2 percent in the following year. The reason for the variation is not known. It is likely due to the underlying variability of the data, rather than reflecting some larger exogenous factor.
Table 4 Percentage Distribution of Driver and Occupant Fatalities in Medium and Heavy Trucks, TIFA 2006-2010
Truck size Occupant type
Crash year Total 2006 2007 2008 2009 2010
Class 3-6 Driver 71.2 76.9 75.3 73.6 84.3 76.0 Passenger 28.8 23.1 24.7 26.4 15.7 24.0 Total 100.0 100.0 100.0 100.0 100.0 100.0
Class 7-8 Driver 88.9 90.4 87.0 90.8 90.5 89.4 Passenger 11.1 9.6 13.0 9.2 9.5 10.6 Total 100.0 100.0 100.0 100.0 100.0 100.0
All trucks Driver 84.5 86.6 84.0 85.6 88.7 85.7 Passenger 15.5 13.4 16.0 14.4 11.3 14.3 Total 100.0 100.0 100.0 100.0 100.0 100.0
For both medium and heavy trucks there was a downward trend in the number of passenger fatalities. This parallels a downward trend in the number of passengers in trucks involved in fatal crashes. The number of passengers declined for both medium-duty and heavy-duty trucks over the period.
6.2 Annual Estimates of Truck Driver Injury
This subsection provides estimates of annual truck occupant fatalities and injuries in traffic crashes. It describes the scope of the problem that might be addressed by improvements in cab

22
crashworthiness. The estimates are averages over the five year period from 2006 to 2010, which cover the most recent complete years of suitable crash data. Estimates are presented for all truck occupants; for drivers and passengers separately; and for all trucks and for truck-tractors and SUTs separately. The final table shows estimated casualties for medium and heavy trucks, broken down by drivers and passengers. Because this table shows casualties for trucks classified by GVWR, it is based on fatal crashes only.
Table 5 shows annual averages of injury severity to truck occupants for all trucks, and then disaggregated for truck-tractors, SUTs, and unknown power unit types. For all trucks, there was an estimated 757 truck occupant fatalities per year, about 3,000 A-injuries, and about 7,700 B-injuries. Most of the fatalities occurred in truck-tractors, with an average of 425 per year. SUTs had an average of 324 annually. In terms of total occupant injuries, there was about the same number in SUTs as truck-tractors, but truck-tractors experienced about 100 more occupant fatalities, on average.
Table 5 Annual Truck Occupant Injury Severity by Power Unit Type TIFA 2006-2010, GES 2006-2010
Injury severity All trucks Tractor SUT Unknown Fatal 757 425 324 8 A-injury 2,959 1,627 1,294 39 B-injury 7,693 4,245 3,332 116 C-injury 9,082 3,823 5,089 170 Unknown severity 299 66 230 2
No injury 310,277 150,068 146,198 14,010 Other/unknown 21,615 11,093 7,878 2,644 Total 352,682 171,347 164,345 16,990
Table 6 is restricted to just truck drivers, and shows the breakdown of injuries by severity for all trucks and separately for truck-tractors, SUTs, and unknown power unit types. Annually, about 649 truck drivers were killed in crashes over the period. Truck-tractor drivers accounted for a majority, with about 383 annually. SUTs accounted for an average of about 260. In addition, there was an average of 1,501 truck-tractors drivers who incurred A-injuries, and 1,035 SUT drivers with A-injuries. Overall, about 17,359 truck drivers were injured in traffic crashes over the period, 9,066 in truck-tractors, 8,002 in SUTs, and 292 in unknown power unit types.

23
Table 6 Annual Truck Driver Injury Severity by Power Unit Type TIFA 2006-2010, GES 2006-2010
Driver injuries All trucks Tractor SUT Unknown Fatal 649 383 260 6 A-injury 2,572 1,501 1,035 36 B-injury 6,409 3,679 2,629 100 C-injury 7,462 3,436 3,878 147 Unknown severity 267 66 199 2
No injury 271,028 139,000 119,855 12,173 Other/unknown 21,209 11,081 7,547 2,581 Total 309,595 159,146 135,404 15,045
SUTs tended to have more passengers than truck-tractors, and correspondingly more passenger injuries. Over all truck types, an average of 108 passengers were killed in truck crashes: 43 in truck-tractors and 64 in SUTs. In addition, an average of 125 passengers in truck-tractors suffered A-injuries and 259 passengers in SUTs suffered A-injuries. Overall, about twice as many passengers in SUTs as truck-tractors received some level of injury in traffic crashes. However, bear in mind that the SUT truck type is a mixture of medium and heavy trucks, so the true number of driver and occupant injuries in heavy SUTs alone cannot be estimated, but would likely be less.
Table 7 Annual Truck Passenger Injury Severity by Power Unit Type TIFA 2006-2010, GES 2006-2010
Passenger injuries All trucks Tractor SUT Unknown Fatal 108 43 64 2 A-injury 387 125 259 3 B-injury 1,284 566 703 16 C-injury 1,620 387 1,211 23 Unknown severity 31 0 31 0
No injury 39,249 11,068 26,343 1,838 Other/unknown 406 12 331 63 Total 43,087 12,201 28,941 1,945
As mentioned, only trucks in fatal crashes can be classified as medium or heavy. Table 8 shows annual estimates of casualties in fatal crashes for heavy trucks. Medium trucks are also shown for comparison sake. On average, about 549 heavy truck occupants died annually in crashes, consisting of 490 drivers and 58 passengers. (The numbers do not sum because of rounding.) An average of 144 occupants received A-injuries in heavy trucks: 121 drivers and 23 passengers. Note that in these crashes, the number of fatalities and injuries in heavy trucks was two to three times greater than in medium trucks. This partly reflects the fact that heavy trucks are more
24
likely to be in fatal crashes than medium trucks. It is not known if the same ratio of truck occupant injuries applies to nonfatal crashes.
Table 8 Annual Truck Occupant Injuries by for Heavy and Medium Trucks Fatal Crashes Only, TIFA 2006-2010
Injury severity
All occupants Drivers Passengers Class 7 & 8
Class 3-6
Class 7 & 8
Class 3-6
Class 7 & 8
Class 3-6
Fatal 549 208 490 158 58 50 A-injury 144 99 121 60 23 39 B-injury 385 183 344 118 40 65 C-injury 392 147 349 98 43 49 Unknown type 5 2 5 1 0 1
Total 1,474 639 1,309 435 165 204 Casualties in trucks with unknown GVWR omitted: annually, 1 driver and 0.4 passengers.
6.3 Seat Belt Use
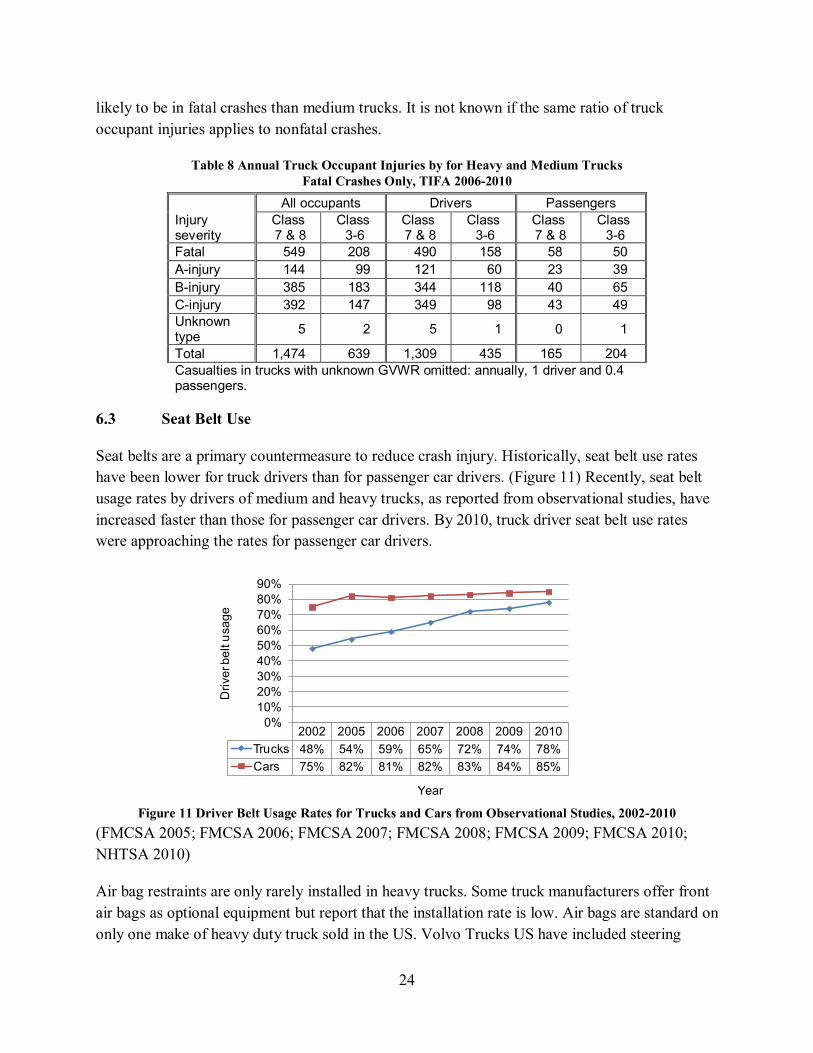
Seat belts are a primary countermeasure to reduce crash injury. Historically, seat belt use rates have been lower for truck drivers than for passenger car drivers. (Figure 11) Recently, seat belt usage rates by drivers of medium and heavy trucks, as reported from observational studies, have increased faster than those for passenger car drivers. By 2010, truck driver seat belt use rates were approaching the rates for passenger car drivers.
2002 2005 2006 2007 2008 2009 2010Trucks 48% 54% 59% 65% 72% 74% 78%Cars 75% 82% 81% 82% 83% 84% 85%
0%10%20%30%40%50%60%70%80%90%
Driv
er b
elt u
sage
Year
Figure 11 Driver Belt Usage Rates for Trucks and Cars from Observational Studies, 2002-2010 (FMCSA 2005; FMCSA 2006; FMCSA 2007; FMCSA 2008; FMCSA 2009; FMCSA 2010; NHTSA 2010)
Air bag restraints are only rarely installed in heavy trucks. Some truck manufacturers offer front air bags as optional equipment but report that the installation rate is low. Air bags are standard on only one make of heavy duty truck sold in the US. Volvo Trucks US have included steering

25
wheel integrated frontal air bags as standard equipment since 1996 on VN, VHD and VT models. In the fatal crash data, there were only 168 deployments of air bags reported from 2006 to 2010. In the GES data used to examine nonfatal truck crashes, there were only 11 deployments from 2006 to 2010. Except for Volvo trucks, air bag restraints are rarely installed in heavy trucks. There were not enough cases of air bag deployments in the data to provide useful analysis.
6.3.1 Reported seat belt use by truck occupants in crashes
Table 9 shows reported seat belt use for occupants of truck-tractors in crashes. Occupants are classified as drivers, seated passengers, sleeper occupants, passengers in other areas of the truck such as cargo spaces and the exterior, and passengers with an unknown location. Seated passenger means an occupant in a seating area of the truck, not including the driver’s seat. Seat belt use is reported as belted, meaning with a lap and shoulder belt; not belted, meaning not using seat belts at all. Other/unknown combines cases coded as seat belts improperly used, lap only, shoulder only, and unknown if seat belt restraints were used. Fewer than 2 percent of cases are coded lap only or shoulder only, so it is not meaningful to show them separately. FMVSS 208 allows lap-only seat belts to be installed. However, no major heavy truck manufacturer currently installs lap-only belts at the driving position, though some passenger locations, like the middle position on a bench seat, may have them. This is particularly true of specialty vehicles such as fires trucks and ambulances. Most of the other/unknown category are cases where it was unknown if seat belt restraints were used.
Table 9 Reported Seat Belt Use for Drivers and Passengers Truck-Tractors, All Crash Severities, TIFA 2006-2010, GES 2006-2010
Occupant type Belted Not
belted Other/
unknown Total Driver 128,297 2,336 28,513 159,146 Passengers Seated 7,174 523 958 8,656 Sleeper 0 2,736 4 2,741 Other/cargo 22 288 56 366 Unknown 80 96 263 438 Pass. subtotal 7,276 3,644 1,282 12,201 All 135,572 5,980 29,795 171,347
Row percentages Driver 80.6 1.5 17.9 100.0 Passengers Seated 82.9 6.0 11.1 100.0 Sleeper 0.0 99.8 0.2 100.0 Other/cargo 6.0 78.7 15.3 100.0 Unknown 18.2 21.9 60.0 100.0 Pass. subtotal 59.6 29.9 10.5 100.0 All 79.1 3.5 17.4 100.0

26
Seat belt use rates are reported high for drivers and seated passengers, with about 80-82 percent for each. The other/unknown category is substantial, however, accounting for 17.4 percent of all occupants. Sleeper occupants, who are about 1.6 percent of all truck-tractor occupants, typically are not reported as using any restraints. In most cases, the crash data record that restraints were not available in the sleeper compartment position. However, all trucks manufactured after July 1, 1971, and equipped with a sleeper must have some means of preventing ejection (FMCSR 393.75(h)). It is likely that the ejection-prevention system was not captured as a restraint. In any case, there is no evidence that sleeper berth restraint systems were used to any significant extent.
Seat belt use rates are reported only slightly lower in SUT crashes, both for drivers and seated passengers, though with the same high rates of missing data. (Table 10)
Table 10 Reported Seat Belt Use for Drivers and Passengers Single-Unit Trucks, All Crash Severities, TIFA 2006-2010, GES 2006-2010
Occupant type Belted Not belted Other/
unknown Total Driver 104,753 4,339 26,312 135,404 Passengers Seated 19,393 2,211 4,712 26,315 Sleeper 0 114 0 114 Other/cargo 166 1,030 421 1,618 Unknown 198 160 535 893 Pass. subtotal 19,757 3,516 5,668 28,941 All 124,510 7,855 31,980 164,345
Row percentages Driver 77.4 3.2 19.4 100.0 Passengers Seated 73.7 8.4 17.9 100.0 Sleeper 0.0 100.0 0.0 100.0 Other/cargo 10.3 63.7 26.0 100.0 Unknown 22.2 17.9 59.9 100.0 Pass. subtotal 68.3 12.1 19.6 100.0 All 75.8 4.8 19.5 100.0
It should be noted that seat belt usage rates are probably inflated. Seat belt use is recorded by investigating officials on crash reports. Uninjured or lightly-injured occupants are usually out of their vehicles following a crash by the time an officer arrives, so officers have to rely on self-reporting. Many states implemented mandatory seat belt use laws over the period. Seat belts are required in trucks (FMVSS 208) and truck drivers are required to use them (FMCSR 392.16). In addition, many trucking companies require their drivers to use seat belts. Accordingly, truck drivers and passengers have an incentive to misreport seat belt use. A method has been developed to reduce the effects of over-reported seat belt use in calculating seat belt

27
effectiveness estimates, and is used in section 6.11. Reported seat belt use rates in the tables in the current section have not been corrected to account for exaggerated seat belt use.
6.3.2 Truck occupant injuries by seat belt use
The tables in this section divide injured truck occupants into two groups: belted and not belted. Belted occupants are already (if reported seat belt use is accurate) using a primary occupant protection measure. Unbelted occupants are not. It should be kept in mind that reported seat belt use, particularly for lightly injured occupants, is probably exaggerated. By the same token, though, the no-belt coding is more likely to be accurate.
Table 11 shows annual injuries to drivers and passengers in truck-tractors, by severity and coded seat belt usage. (The table shows only counts of injured occupants. Occupants with no injuries or missing data on injury are excluded.) Despite the fact that there was about eight times as many injured belted drivers than unbelted, the number of fatalities to unbelted drivers is almost exactly the same as the number of belted fatalities, 140 and 142, respectively. Among injured truck-tractor passengers, approximately 75 percent of the fatalities were not belted, 31 out of 43 on average. There were also an average of 190 A-injuries to unbelted drivers per year, and about 60 A-injuries to passengers per year. In total, there was an average of 2,052 K+A-injuries to occupants of truck-tractors annually.
Table 11 Annual Injuries by Severity and Seat Belt Use Truck-Tractors, TIFA 2006-2010, GES 2006-2010
Injury severity Belted No belts Other/
unknown Total Drivers Fatal 142 140 100 383 A-injury 1,170 190 141 1,501 B-injury 2,918 356 406 3,679 C-injury 2,885 222 329 3,436 Unknown severity 59 0 7 66
Total 7,174 908 984 9,066
Belted No belts Other/
unknown Total Passengers Fatal 2 31 9 43 A-injury 59 60 6 125 B-injury 84 430 52 566 C-injury 207 125 55 387 Unknown severity - 0 - 0
Total 352 646 122 1,121

28
Table 12 presents the same statistics for SUTs. An average of 260 SUT drivers die annually in traffic crashes, along with almost 64 passengers. There was also an average of 1,035 A-injuries to drivers and 259 A-injuries to SUT passengers, for an average of 1,618 K+A-injuries to SUT occupants annually. These SUTs are a mixture of medium- and heavy-trucks, so the true number of K+A-injuries to heavy SUT occupants is not known.
Unbelted drivers and passengers incurred most of the fatalities. In the case of drivers, about 142 of the fatalities were not belted and about 83 were properly belted. As was the case for truck-tractors, the disproportion was even greater for passenger fatalities in SUTs. An average of 45 fatalities occurred to unbelted passengers, compared to just 12 among those using seat belts.
Table 12 Annual Injuries by Severity and Seat Belt Use Single-Unit Trucks, TIFA 2006-2010, GES 2006-2010
Injury severity Belted No belts Other/
unknown Total Drivers Fatal 83 142 35 260 A-injury 749 209 77 1,035 B-injury 2,139 292 199 2,629 C-injury 3,247 255 376 3,878 Unknown severity 43 27 128 199
Total 6,261 925 816 8,002
Belted No belts Other/
unknown Total Passengers Fatal 12 45 6 64 A-injury 134 115 10 259 B-injury 344 257 102 703 C-injury 559 329 322 1,211 Unknown severity 14 5 12 31
Total 1,063 752 452 2,267
6.4 Fatal Injury Risk
Table 13 shows the probability of a fatal injury to truck occupants, given involvement in a fatal traffic crash, for drivers and passengers of medium and heavy trucks, respectively. Note that fatal crash means a fatal injury to anyone involved in the crash, not just to truck occupants. The probability of fatal injury is calculated as the proportion of occupants in trucks involved in a fatal crash who are themselves fatally-injured. For both medium and heavy trucks, there is some year-to-year variation in the probability of fatal injury, conditioned on involvement in a fatal crash, but averaged over the five years of data used in this report, fatality risk is the same for drivers and passengers of heavy trucks. However, drivers of medium duty trucks are at a somewhat

29
higher risk of fatal injury than passengers of medium duty trucks: 18.6 percent of drivers but only 13.0 percent of passengers were killed in these crashes. In addition, note that occupants of medium duty trucks are at a somewhat higher risk of fatal injury than occupants of heavy trucks: 16.9 percent of occupants (drivers plus passengers) of medium trucks were killed in these crashes, compared with 14.0 percent of heavy trucks.
Table 13 Probability of Fatal Injury for Drivers and Passengers in Medium and Heavy Trucks, TIFA 2006-2010
Occupant type
Crash year Total 2006 2007 2008 2009 2010
Class 3-6 Driver 17.1 19.7 18.5 17.3 20.4 18.6 Passenger 12.7 14.9 13.4 15.5 8.6 13.0 Total 15.6 18.3 16.9 16.8 16.7 16.9 Class 7-8 Driver 14.4 14.8 13.8 13.2 13.2 14.0 Passenger 13.7 15.2 17.8 10.0 13.1 14.1 Total 14.3 14.9 14.2 12.8 13.2 14.0 All trucks Driver 14.9 15.8 14.7 14.1 14.6 14.9 Passenger 13.2 15.0 15.8 12.5 10.8 13.6 Total 14.6 15.7 14.8 13.9 14.0 14.7
6.5 Most Harmful Event Analysis
A most harmful event (MHE) typology was developed to classify events identified as the most harmful event in the crash to the truck or its occupants. Most harmful event is defined as the event that resulted in the most severe injury to occupants of the vehicle or to non-motorists (not occupants of other vehicles), or, if there was no injury, the greatest property damage involving this motor vehicle.(NHTSA 2011b) The typology was developed to isolate events that have a greater or lesser association with truck driver injury. It is primarily based on the most harmful event variable coded in GES and TIFA (taken from FARS), but where the most harmful event was a collision with another motor vehicle, the general type of vehicle was identified. For example, if the most harmful event was coded as collision with a motor vehicle, the motor vehicle is classified as either another truck, a light vehicle (GVWR less than 10,000 lbs.), or an unknown vehicle type. Fixed objects are aggregated as “hard” or “soft,” where “hard” aggregates fixed objects that have a higher than average probability of fatality or serious injury and “soft” aggregates fixed objects that have a lower than average fatality or injury probability. Hard fixed objects include items such as buildings, bridge structures, and embankments, while soft fixed objects include fences, shrubbery and sign posts.
Note that if the most severe injury is to a non-motorist, collision with a pedestrian or bicyclist is coded as the most harmful event, rather than injury to a truck occupant or damage to the truck.

30
It is important to understand that the identification of an MHE does not exclude the possibility that another event also occurred in a crash. For example, the MHE for a crash may be classified as “fire,” though a rollover or collision may also have occurred in the crash. The MHE is the event identified by a FARS analyst as the most harmful event to a vehicle in a crash. Other harmful events may also have occurred.
6.5.1 Driver injury by most harmful event
Table 14 displays truck driver injury across the different levels of the MHE typology. Injuries are shown as fatal; fatal or A-injury; any injury; no injury; and unknown (if injured). The first two columns of data provide different aggregations of the more serious truck driver injuries, because the different MHE’s are associated with different probabilities of injury. The bottom half of the table shows the proportion of the different levels of injury accounted for by each MHE. The table includes crashes of all severities and all truck types with a GVWR greater than 10,000 lbs. are included in this table.

31
Table 14 Annual Truck Driver Injuries by Most Harmful Event, All Trucks, All Crash Severities TIFA 2006-2010, GES 2006-2010
Most harmful event
Truck driver injury
Total Fatal Fatal or A-injury
Any injury No injury Unknown
Rollover 233 1,320 5,614 5,380 118 11,112 Fire 74 90 213 1,079 0 1,292 Other non-collision 15 38 301 5,977 813 7,091
Col
lisio
n w
ith:
Truck/bus 88 395 1,938 20,232 1,985 24,155 Light vehicle 41 517 5,528 187,640 13,593 206,761 Unknown vehicle type 34 147 999 19,740 2,517 23,256 Train 17 39 90 194 49 333 Ped/bike/animal 3 27 94 5,815 229 6,138 Other non-fixed object 4 93 179 3,257 434 3,869 Hard fixed object 122 478 1,747 7,861 122 9,730 Soft/other fixed object 19 75 653 13,812 1,349 15,815
Unknown 1 1 3 41 0 44 Total 649 3,221 17,359 271,028 21,209 309,595 Column percentages Rollover 35.9 41.0 32.3 2.0 0.6 3.6 Fire 11.4 2.8 1.2 0.4 0.0 0.4 Other non-collision 2.3 1.2 1.7 2.2 3.8 2.3
Col
lisio
n w
ith:
Truck/bus 13.5 12.3 11.2 7.5 9.4 7.8 Light vehicle 6.3 16.1 31.8 69.2 64.1 66.8 Unknown vehicle type 5.2 4.6 5.8 7.3 11.9 7.5 Train 2.6 1.2 0.5 0.1 0.2 0.1 Ped/bike/animal 0.5 0.8 0.5 2.1 1.1 2.0 Other non-fixed object 0.6 2.9 1.0 1.2 2.0 1.2 Hard fixed object 18.8 14.8 10.1 2.9 0.6 3.1 Soft/other fixed object 3.0 2.3 3.8 5.1 6.4 5.1
Unknown 0.1 0.0 0.0 0.0 0.0 0.0 Total 100.0 100.0 100.0 100.0 100.0 100.0
Measured by the proportion of fatalities, rollover (35.9%), collision with a hard fixed object (18.8%), collision with another truck or bus (13.5%), and fire (11.4%) are the major crash types to address to reduce the number of injuries and fatalities to truck drivers. Together, these events account for almost 80 percent of truck driver fatalities. If the scope is enlarged to K+A-injuries, the major harmful events are rollover (41.0%), collision with a light vehicle (16.1%), collision with a hard fixed object (14.8%), and collision with a truck or bus (12.3%). Together, these crash types account for 84.1 percent of K+A-injuries. Fire (2.8%) has dropped from the list probably because in these crashes the driver managed to escape before the fire spread.
Rollover is identified as the MHE for the most fatalities and serious injuries, and clearly is the most significant threat to truck drivers and other truck occupants. Note that this classification includes just rollovers identified as the MHE, not necessarily all rollovers. All rollovers as such

32
will be covered below. But here, rollover is identified as the MHE in 35.9 percent of fatalities and 41.0 percent where the driver received K+A-injuries. This is despite the fact that rollover is the MHE of only 3.6 percent of all truck crashes.
6.5.2 Probability of Driver Fatality or Injury by Crash Type
In Table 14, crash types were identified that account for the majority of serious injuries, defined here as K+A-injuries. Table 15 presents an evaluation of the crash types in terms of their probability of injury. Injury probability is calculated as the percentage of K+A -injuries in truck crash involvements. The two right-most columns in Table 15 show a “normalized rate.” This is the ratio of the injury probability of a particular crash type to the overall injury probability, given involvement in a crash. The purpose of this table is to identify crash types that present the greatest risk of death or serious injury to truck drivers. The crash types with the highest K+A-injury probability are rollover (11.9%), collision with a train (11.7%), fire (7.0%) and collision with a hard fixed object (4.9%). This list is somewhat different from the list of crashes by prevalence. Rollover, fire, and collision with a hard fixed object are on both lists. But collision with a train is very rare, and so not on the prevalence list, but very severe, and therefore among the most severe.
Table 15 Probability of K+A Injury by Crash Type, All Trucks TIFA 2006-2010, GES 2006-2010
Crash type Probability of injury
Probability relative to all crashes
K K+A K K+A Rollover 2.1 11.9 10.0 11.4 Fire 5.7 7.0 27.2 6.7 Other non-collision 0.2 0.5 1.0 0.5
Col
lisio
n w
ith:
Truck/bus 0.4 1.6 1.7 1.6 Light vehicle 0.0 0.3 0.1 0.2 Unknown vehicle type 0.1 0.6 0.7 0.6 Train 5.0 11.7 24.1 11.3 Ped/bike/animal 0.1 0.4 0.2 0.4 Other non-fixed object 0.1 2.4 0.5 2.3 Hard fixed object 1.3 4.9 6.0 4.7 Soft/other fixed object 0.1 0.5 0.6 0.5
Unknown 1.4 2.3 6.5 2.2 Total 0.2 1.0 1.0 1.0
Table 16 is limited to truck-tractors, which are virtually all class 7 and 8 trucks. The primary crash types in terms of severe injury probability to truck drivers is the same as for all trucks. The most dangerous crashes are rollover (12.2%), collision with a train (9.5%), fire (6.3%), and collision with a hard fixed object (4.2%).

33
Table 16 Probability of K+A Injury by Crash type, Truck-Tractors TIFA 2006-2010, GES 2006-2010
Crash type Probability of injury
Probability relative to all crashes
K K+A K K+A Rollover 1.9 12.2 7.9 10.3 Fire 5.8 6.3 24.1 5.3 Other non-collision 0.2 0.6 0.9 0.5
Col
lisio
n w
ith:
Truck/bus 0.3 1.7 1.4 1.4 Light vehicle 0.0 0.2 0.1 0.2 Unknown vehicle type 0.3 1.2 1.1 1.0 Train 2.1 9.5 8.7 8.0 Ped/bike/animal 0.0 0.6 0.2 0.5 Other non-fixed object 0.1 1.3 0.4 1.1 Hard fixed object 1.1 4.2 4.4 3.6 Soft/other fixed object 0.1 0.4 0.4 0.4
Unknown 0.5 1.6 2.2 1.3 Total 0.2 1.2 1.0 1.0
6.6 Differentiating Truck-Tractors and Single-Unit Trucks
The goal of the project is to determine the scope of injury and injury mechanisms to occupants of heavy trucks. Heavy trucks are defined as trucks with a gross vehicle weight rating (GVWR) greater than 26,000 lbs, i.e. GVWR class 7 and 8. Trucks in fatal crashes can be classified by GVWR using the TIFA data, but there is no comprehensive national source of data on nonfatal crashes in which trucks can be classified by GVWR. This presents a significant problem, which cannot be cleanly resolved.
Classification by power unit type (truck-tractor vs. SUT) can serve as a partial surrogate for class 7 and 8 trucks. Analysis of the TIFA data showed that 99.9 percent of truck-tractors were class 7 or 8 vehicles. The data also showed that 46.3 percent of SUTs were class 7-8 and 53.5 percent were class 3 through 6. Power unit type is identified in nonfatal crash data, so the truck-tractor power-unit type reliably identifies the target truck type (class 7 and 8). However, while nearly all truck-tractors were class 7 and 8, not all class 7 and 8 trucks were truck-tractors. In the fatal crash data (TIFA), about a fifth (20.4%) of class 7 and 8 trucks are SUTs and 78.4 percent are truck-tractors (the remainder, 1.2 percent, could not be classified by power unit type).
Accordingly, while truck-tractors capture (virtually) only class 7 and 8 trucks, focusing on truck-tractors alone excludes SUTs which have different operating characteristics that may result in a different set of crashes and injury mechanisms contributing to truck driver injury.
One question is, among SUTs, how does the crash experience of medium trucks differ from heavy? Table 17 shows the distribution of driver K+A-injuries across the MHE crash types for class 3-6 and class 7-8 SUTs. In terms of the crash types that account for the most serious driver

34
injuries, the same crash types are indicated for each: rollover, collision with truck/bus, light vehicle, or hard fixed object. These crash types account for 85.1 percent of medium-duty SUT driver K+A-injuries and 78.9 percent of heavy SUT driver K+A-injuries. MHE rollover accounts for a higher share of heavy SUT K+A-injuries, while collisions with light vehicles, truck/bus, or hard fixed objects account for more medium SUT K+A-injuries. In terms of the probability of injury (shown on the right side of the table), K+A-injury probabilities are virtually the same for rollover and collisions with hard fixed objects. K+A-injury probability is much higher in collisions with other trucks or buses and light vehicles for medium SUTs, which make sense because of the relative size differences. While there are clear differences in the crash experience between medium and heavy SUTs, in terms of driver injury, the same crash types are identified. In addition, in terms of injury probability in the crashes, they are reasonably close except for crash types where relative size disparity might explain the result.
Table 17 Injury Probability and Percent K+A Injuries by Truck Class Single-unit Trucks Only, Fatal Crashes Only, TIFA 2006-2010
Crash type
Percent of K+A-injuries Probability of K+A-injury Class 3-6
Class 7&8 All
Class 3-6
Class 7&8 All
Rollover 26.3 40.4 31.7
76.6 79.9 78.2
Fire 2.5 4.8 3.4 67.5 71.1 69.4 Other non-collision 0.8 2.2 1.4 19.6 38.5 28.2
Col
lisio
n w
ith:
Truck/bus 14.8 7.5 12.0 79.8 38.5 63.4
Light vehicle 27.1 17.9 23.6 12.3 5.4 8.9
Unknown vehicle type 5.1 4.5 4.8 14.4 12.6 13.7 Train 1.7 5.4 3.1 100.0 100.0 100.0 Ped/bike/animal 0.9 0.7 0.9 2.2 1.4 1.8 Other non-fixed object 0.7 0.4 0.6 15.1 10.0 13.3
Hard fixed object 16.9 13.2 15.4 91.4 91.7 91.5
Soft/other fixed object 2.9 3.0 2.9 83.8 74.1 79.7 Unknown 0.2 0.0 0.1 100.0 - 100.0 Total 100.0 100.0 100.0 25.8 18.7 22.5
Accordingly, it appears that, among SUTs, at least in fatal crashes, distinguishing between medium and heavy trucks would not result in selecting a different set of crash types that account for serious driver injuries. Rollovers and collisions with large objects are the primary injury mechanisms. Collisions with light vehicles account for a significant share of K+A-injuries primarily because such crashes are so frequent.
How do truck-tractors differ from heavy SUTs in terms of driver injury? Do presumed operational differences result in a significantly different identification of target crash types for

35
countermeasures? Table 18 shows how the distribution of MHEs differs between truck-tractors and SUTs, even when restricted only to class 7 and 8 trucks. (These are fatal crashes only.) Rollover accounts for a higher percent of K+A-injuries in SUTs than truck-tractors. Rollover is the MHE for 40.0 percent of SUT drivers that suffered K+A-injuries, compared with 29.9 percent of truck-tractor drivers. In contrast, fire was identified as the MHE in 14.2 percent of truck-tractor cases, compared with only 4.8 percent of SUT cases. Collision with a truck or bus was more likely to be the MHE for truck-tractor drivers than K+A-injured SUT drivers, while collisions with light vehicles were more often the MHE for SUTs than truck-tractors. Finally, the proportion of collisions with hard-fixed objects is about the same.
Table 18 Distribution of Most Harmful Event for SUTs and Truck-Tractors Class 7 and 8 Only, Driver K- or A-Injury; TIFA 2006-2010
Crash type SUT Tractor SUT Tractor
Frequency Percentage Rollover 264 706 40.0 29.9 Fire 32 335 4.8 14.2 Other non-collision 15 58 2.3 2.5
Col
lisio
n w
ith:
Truck/bus 49 304 7.4 12.9 Light vehicle 119 320 18.0 13.5 Unknown vehicle type 30 176 4.5 7.4 Train 36 30 5.5 1.3 Ped/bike/animal 5 16 0.8 0.7 Other non-fixed object 3 16 0.5 0.7 Hard fixed object 88 356 13.3 15.1 Soft/other fixed object 19 45 2.9 1.9
Unknown 0 3 0.0 0.1 Total 660 2,365 100.0 100.0
However, while the order of MHEs involved in most K+A-injured truck drivers differs by power unit type, the same MHEs are identified for both. Rollover may be more likely to be the MHE for SUTs than truck-tractors, but rollover is the primary MHE for both. The same is true for the other MHE types that have been identified as the primary sources of serious truck driver injury. In addition, calculations show (not displayed here) that the probability of K+A-injury for each MHE is about the same for SUT and truck-tractor drivers. For example, the probability of a K+A-injury in rollover, given involvement in a fatal crash, is 79.5 percent for a SUT driver and 81.6 percent for a truck-tractor driver.
To summarize: The focus of the cab crashworthiness research is class 7 and 8 trucks. Such trucks can be identified directly in crash data on fatal crashes. But they cannot be identified in nonfatal crashes. Therefore it is necessary to find a method to statistically represent class 7 and 8 trucks in nonfatal crashes. Truck-tractors are almost all class 7 and 8 trucks, and truck-tractors can be identified directly in the data on nonfatal crashes used here. Therefore, classifying trucks by

36
power unit type identifies at least one group that fits the target population. The disadvantage of using truck-tractors is that heavy SUTs are excluded. However, while the relative size of the primary crash types for truck-tractors and SUTs differ, the crash types that produce the most K+A-injuries are the same for both.
Therefore, the analysis will show results for truck-tractors and all SUTs. The truck-tractors meet the truck size target for the project. SUTs, when including nonfatal crashes, are a mixture of heavy and medium-duty trucks. They are consequently an imperfect representation of class 7 and 8 SUTs in nonfatal crashes. However, they are the best surrogate available. Moreover, there is evidence to believe that the crash types and injury mechanisms identified for all SUTs are also the crashes of primary concern for heavy SUTs.
6.7 Ejection
This section considers ejection, seat belt use, and injury for drivers and other occupants of truck-tractors and SUTs. The frequencies in the tables are all annual averages over the period 2006-2010.
Ejection is relatively rare, even among injured drivers. Overall, about 2.5 percent of injured truck-tractor drivers were ejected, and about 2.8 percent of injured SUT drivers were ejected.
However, ejection is highly associated with the most severe injuries. Among SUT drivers, almost 40 percent of ejected drivers suffered fatal injuries, and almost 25 percent were coded with A-injuries. (See Table 19.) In contrast, only 0.1 percent of SUT drivers that stayed in the cab were fatally injured, and only 0.7 percent of SUT drivers that stayed in the cab received A-injuries. Note that on average over the 5-year period covered by the crash data, ejection accounted for 91 of 260 SUT driver fatalities, which is 35.0 percent of all SUT driver fatalities. By contrast, ejection was a much smaller source of A-injuries, with 56 of 1,035, which is 5.4 percent of A-injuries. Clearly, ejection is a major factor in SUT fatal injuries, and keeping drivers in the cab is a high priority.
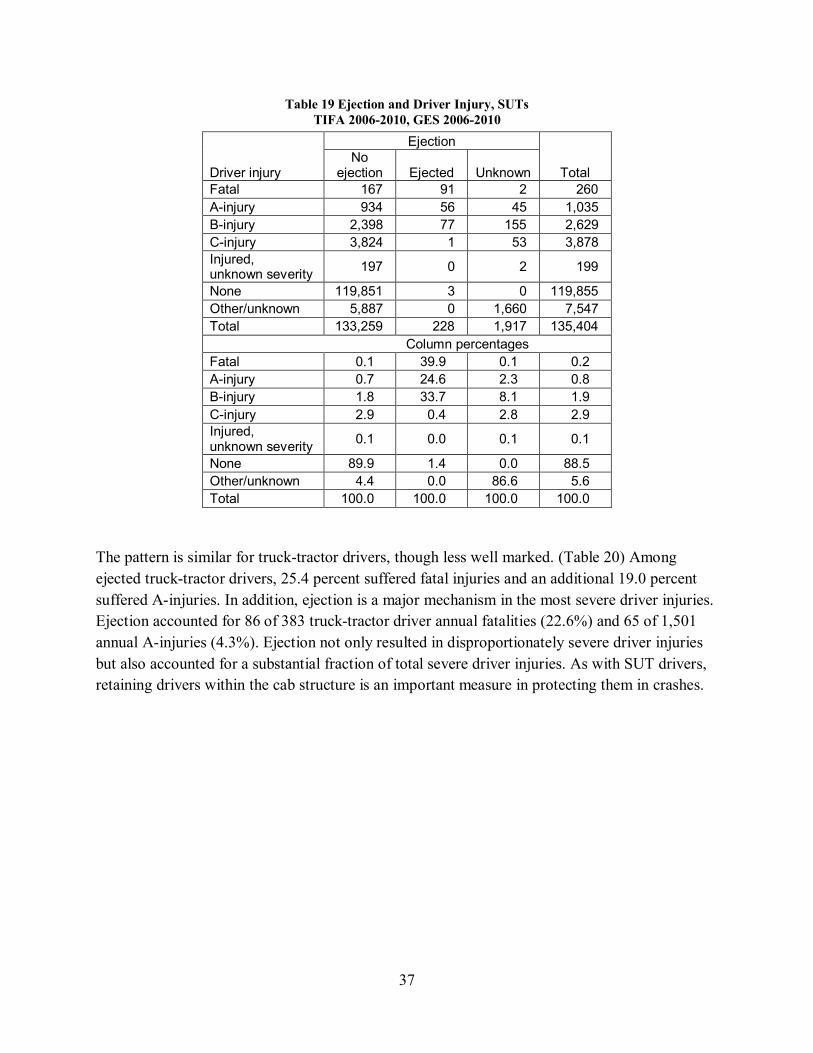
37
Table 19 Ejection and Driver Injury, SUTs TIFA 2006-2010, GES 2006-2010
Driver injury
Ejection
Total No
ejection Ejected Unknown Fatal 167 91 2 260 A-injury 934 56 45 1,035 B-injury 2,398 77 155 2,629 C-injury 3,824 1 53 3,878 Injured, unknown severity 197 0 2 199
None 119,851 3 0 119,855 Other/unknown 5,887 0 1,660 7,547 Total 133,259 228 1,917 135,404
Column percentages Fatal 0.1 39.9 0.1 0.2 A-injury 0.7 24.6 2.3 0.8 B-injury 1.8 33.7 8.1 1.9 C-injury 2.9 0.4 2.8 2.9 Injured, unknown severity 0.1 0.0 0.1 0.1
None 89.9 1.4 0.0 88.5 Other/unknown 4.4 0.0 86.6 5.6 Total 100.0 100.0 100.0 100.0
The pattern is similar for truck-tractor drivers, though less well marked. (Table 20) Among ejected truck-tractor drivers, 25.4 percent suffered fatal injuries and an additional 19.0 percent suffered A-injuries. In addition, ejection is a major mechanism in the most severe driver injuries. Ejection accounted for 86 of 383 truck-tractor driver annual fatalities (22.6%) and 65 of 1,501 annual A-injuries (4.3%). Ejection not only resulted in disproportionately severe driver injuries but also accounted for a substantial fraction of total severe driver injuries. As with SUT drivers, retaining drivers within the cab structure is an important measure in protecting them in crashes.

38
Table 20 Ejection and Driver Injury, Truck-Tractors TIFA 2006-2010, GES 2006-2010
Driver injury
Ejection
Total No
ejection Ejected Unknown Fatal 292 86 4 383 A-injury 1,229 65 208 1,501 B-injury 3,048 44 587 3,679 C-injury 3,093 34 309 3,436 Injured, unknown severity 54 0 12 66
None 138,889 109 2 139,000 Other/unknown 10,312 2 767 11,081 Total 156,918 340 1,889 159,146
Column percentages Fatal 0.2 25.4 0.2 0.2 A-injury 0.8 19.0 11.0 0.9 B-injury 1.9 13.1 31.1 2.3 C-injury 2.0 10.0 16.4 2.2 Injured, unknown severity 0.0 0.0 0.6 0.0
None 88.5 32.1 0.1 87.3 Other/unknown 6.6 0.5 40.6 7.0 Total 100.0 100.0 100.0 100.0
Seat belt use virtually eliminates ejection, for both SUT and truck-tractor drivers. (See Table 21 for SUTs and Table 22 for truck-tractors.) Among SUT drivers only 31 out of 104,753 belted drivers were coded as ejected, compared with 179 ejected of 4,339 not belted. For the belted SUT drivers, only 0.03 percent were ejected, compared with 4.1 percent of belted. Similarly for truck-tractor drivers, only 0.1 percent of belted drivers were ejected, compared with 6.7 percent of unbelted drivers.
Table 21 Seat Belt Use and Ejection, Drivers, SUTs TIFA 2006-2010, GES 2006-2010
Seat belt use
Ejection
Total Not
ejected Ejected Other/
unknown Belted 104,516 31 206 104,753 Not belted 4,135 179 26 4,339 Other/unknown 24,609 19 1,685 26,312 Total 133,259 228 1,917 135,404
Row percentages Belted 99.8 0.0 0.2 100.0 Not belted 95.3 4.1 0.6 100.0 Other/unknown 93.5 0.1 6.4 100.0 Total 98.4 0.2 1.4 100.0

39
Table 22 Seat Belt Use and Ejection, Drivers, Truck-Tractors TIFA 2006-2010, GES 2006-2010
Seat belt use
Ejection
Total Not
ejected Ejected Other/
unknown Belted 127,317 148 831 128,297 Not belted 1,994 156 187 2,336 Other/unknown 27,606 36 871 28,513 Total 156,918 340 1,889 159,146
Row percentages Belted 99.2 0.1 0.6 100.0 Not belted 85.3 6.7 8.0 100.0 Other/unknown 96.8 0.1 3.1 100.0 Total 98.6 0.2 1.2 100.0
The use of seat belts also affects the degree of ejection. Table 23 is limited to truck-tractor drivers who were ejected in fatal crashes. The table shows the degree of ejection by whether the drivers were using seat belts. Results for nonfatal crashes are omitted from this table because the ejection results are based on only 17 cases, while results for fatal crashes are a census. Restricting the table to only fatal crashes provides more robust results. Almost 46 percent of ejected truck-tractor drivers who were coded as using seat belts were partially ejected. In these cases the driver was properly belted but some portion went outside of the truck cab during the crash. The ejection path was unknown for all but five of the belted drivers, but it is likely the partial ejection was out the driver’s side window or door. Of the cases where ejection path was coded, two were through the door and three out the window.
Table 23 Seat Belt Use and Degree of Ejection Drivers, Truck-Tractors, Fatal Crashes Only
TIFA 2006-2010 Degree of ejection Belted No belts
Other/ unknown Total
Partial ejection 25 83 23 131 Total ejection 30 228 69 327 Total 55 311 92 458
Column percentages Partial ejection 45.5 26.7 25.0 28.6 Total ejection 54.5 73.3 75.0 71.4 Total 100.0 100.0 100.0 100.0 * Two cases with unknown degree of ejection omitted.
In contrast, when unbelted drivers were ejected, almost three-quarters were total ejections. Only about one-quarter were partial ejections. In most cases of partial ejection, ejection path was unknown (61.4 percent), but where the path was known, most were out the side window or through the windshield area. For drivers totally ejection, again, ejection path was unknown in

40
74.6 percent. However, for the cases where the path was known, the most frequent paths were out the side door, out the windshield, and out a side door window.
How are belted drivers ejected? The most severe ejections occur in rollover. Rollover as such accounts for almost 65 percent of ejected truck-tractor drivers in fatal crashes. (Table 24) Most driver ejections in fatal crashes occur in only a few crash types. Table 25 shows driver ejection by the MHE crash classification for fatal truck-tractor crashes. Three crash types–rollover, collision with hard fixed object, and collision with a truck or bus, account for almost 80 percent of ejections in fatal crashes. In these crashes, there is either a rollover or a major impact with another truck or a large fixed object.
Table 24 Ejection and Rollover, Truck-Tractors in Fatal Crashes TIFA 2006-2010
Rollover
Ejection
Total Not
ejected Ejected Other/
unknown No roll 11,759 165 101 12,025 Rollover 1,428 295 16 1,739 Total 13,187 460 117 13,764
Column percent No roll 89.2 35.9 86.3 87.4 Rollover 10.8 64.1 13.7 12.6 Total 100.0 100.0 100.0 100.0
Table 25 Percent Distribution of Ejection by Most Harmful Event, Tractors in Fatal Crashes TIFA 2006-2010
Crash type Not
ejected Ejected Other/
unknown Total Rollover 4.7 51.1 4.3 6.3 Fire 3.5 6.1 5.1 3.6 Other non-collision 0.6 1.3 1.7 0.7
Col
lisio
n w
ith:
Truck/bus 5.3 10.2 12.8 5.5 Light vehicle 62.1 4.8 48.7 60.1 Unknown vehicle type 11.5 3.9 9.4 11.2 Train 0.2 2.2 0.0 0.2 Ped/bike/animal 7.8 0.9 12.8 7.6 Other non-fixed object 1.3 0.4 1.7 1.3 Hard fixed object 2.5 17.4 2.6 3.0 Soft/other fixed object 0.4 1.7 0.9 0.4
Unknown 0.0 0.0 0.0 0.0 Total 100.0 100.0 100.0 100.0
In about half the cases, drivers were only partially ejected. Partial ejection is much more likely to be coded for belted drivers than unbelted. In the case of belted drivers totally ejected, it is likely

41
that the cabs were effectively destroyed in the crashes, so essentially the cab was destroyed around the driver.
Seat belt use is equally effective in reducing ejection among truck passengers. Table 26 shows belt use and ejection for passengers in SUTs. Table 27 shows belt use and ejection for passengers in truck-tractor combinations. Overall, the rates of ejection are low in each. Only 0.6 percent of passengers in SUTs are ejected, and only 0.7 percent of passengers in truck-tractors are ejected, in crashes of all severities. Among belted SUT passengers, only 0.4 percent were ejected, while 2.8 percent of unbelted passengers were ejected.
Table 26 Seat Belt Use and Ejection, Passengers in SUTs, TIFA 2006-2010, GES 2006-2010
Seat belt use
Ejection
Total Not
ejected Ejected Other/
unknown Belted 19,653 79 26 19,757 Not belted 3,413 100 3 3,516 Other/unknown 5,630 5 33 5,668 Total 28,696 184 62 28,941
Row percentages Belted 99.5 0.4 0.1 100.0 Not belted 97.1 2.8 0.1 100.0 Other/unknown 99.3 0.1 0.6 100.0 Total 99.2 0.6 0.2 100.0
Interestingly, the relationship between belt use and ejection is seemingly reversed for truck-tractor passengers. About 0.9 percent of belted passengers were coded ejected but only 0.3 percent of unbelted. A more detailed examination of the result showed that this relationship is driven entirely by the nonfatal crash data from GES. In fatal crashes, which are subject to more investigation because of their seriousness, 7.4 percent of unbelted passengers were ejected, compared with 0.9 percent of belted passengers. However, in nonfatal crashes extracted from GES had 0.9 percent of belted passengers coded as ejected and only 4 of 17,418 unbelted passengers ejected. GES is coded entirely from police crash reports without any other investigation. The number of cases of passengers ejected is very small regardless, so it is possible that this result is simply anomalous.

42
Table 27 Seat Belt Use and Ejection, Passengers in Truck-Tractors, TIFA 2006-2010, GES 2006-2010
Seat belt use
Ejection
Total Not
ejected Ejected Other/
unknown Belted 7,150 66 60 7,276 Not belted 3,460 13 171 3,644 Other/unknown 1,277 2 2 1,282 Total 11,886 81 234 12,201
Row percentages Belted 98.3 0.9 0.8 100.0 Not belted 95.0 0.3 4.7 100.0 Other/unknown 99.6 0.2 0.2 100.0 Total 97.4 0.7 1.9 100.0
6.8 Ejection and sleeper occupants
Ejection of sleeper occupants was examined separately. The analysis focused just on sleeper occupants in tractor-semitrailer combinations. Some SUTs have sleepers but they are uncommon.
Unlike the other sections, data here are totaled for the entire 5 years of crash data used for the analysis, and not annual averages.
There was only one sleeper occupant in fatal crashes that was coded as having been restrained. No sleeper occupant in a nonfatal crash over the period was coded as using restraints. Overall, only 0.3 percent of sleeper occupants of truck-tractor combinations were ejected in crashes. However, the rate was much higher for sleeper occupants in fatal crashes, where 7.6 percent of sleeper occupants were ejected. This ejection rate is actually significantly lower than the rate at which unbelted truck-tractor drivers were ejected in fatal crashes, which was about 24.1 percent. However, those rates are across all fatal crashes.
To control for crash severity, ejection from the sleeper was examined in crashes where there was also at least one unbelted seated occupant, either a driver or a passenger. The analysis was limited to truck-tractors with a sleeper occupant. We compared the ejection status of unbelted seated occupants in order to exclude catastrophic cases where a belted occupant is ejected. In terms of restraint usage, the unbelted seated occupant is relatively similar to a sleeper occupant, who are almost always recorded as unrestrained. The purpose is to examine where sleeper occupants are ejected at higher rates than unbelted drivers or passengers in the same crashes.
Over the five years of data used in the project, there were only 62 truck-tractors involved in fatal crashes with an occupant in a sleeper and at least one unbelted seated occupant. In these crashes, sleeper occupants were ejected at almost the same rate as the unbelted seated occupants. The

43
ejection rate for sleeper occupants was 25.8 percent and for unbelted seat occupants, in the same crashes, 27.4 percent.
However, there were some interesting differences, which suggest that in some cases the sleeper compartment can help contain the occupant. In 6 of the 17 cases where a seated unrestrained occupant was ejected, the occupant of the sleeper was not ejected. (Table 28) In other words, the sleeper occupant was contained. In contrast, in 5 of 45 cases where an unbelted occupant was not ejected, a sleeper occupant was ejected.
Table 28 Ejection for Sleeper Occupants and Unbelted Seated Occupants Tractors Only in Fatal Crashes, TIFA 2006-2010
Sleeper occupant
Unbelted seated occupant Ejected Not ejected
Ejected 11 5 Not ejected 6 40 Total 17 45
Ejected 64.7 11.1 Not ejected 35.3 88.9 Total 100.0 100.0
The number of sleeper occupants in crashes with ejection is low, but they are ejected at about the same rate as unbelted drivers and passengers and could benefit if proper restraints were used.
6.9 Rollover and ejection
Rollover was identified as a primary crash type in the MHE analysis. However, in the MHE analysis, the roll crash type does not include all rollovers, but just those coded in FARS as the most harmful event. This section presents results on all rollovers, not just those identified as the MHE, to provide a more comprehensive analysis of rollover.
Rollover accounted for a disproportionate share of not only fatal injuries but also injuries of all severities to truck drivers in traffic crashes. This is true regardless of whether the driver was belted or not. Table 29 shows the distribution of injury severity to drivers of truck-tractors in crashes by belt use and rollover. For each condition of seat belt use, compare the distribution of injury.

44
Table 29 Percent Distribution of Truck-Tractor Driver Injury Severity by Rollover and Seat Belt Use TIFA 2006-2010, GES 2006-2010
Driver injury severity
Belted Not belted All No roll Roll No roll Roll No roll Roll
Fatal 0.1 1.1 3.1 15.3 0.1 2.6 A-injury 0.4 10.4 5.0 18.4 0.5 10.8 B-injury 1.4 20.1 9.3 34.8 1.4 21.4 C-injury 1.7 13.3 8.1 14.1 1.6 13.3 Unknown severity 0.0 0.7 0.0 0.0 0.0 0.6 No injury 96.1 54.4 68.7 17.0 89.2 50.0 Unknown if injured 0.4 0.0 5.7 0.3 7.2 1.3 Total 100.0 100.0 100.0 100.0 100.0 100.0
The results can be summarized as follows (differences from summing the cells in the table are due to rounding):
For all truck-tractor drivers (belted and unbelted drivers):
• 40.4 percent of injuries occurred in rollover.
• When trucks rolled over, almost half of drivers were injured (48.7%).
• One in three received K-, A-, or B-injuries.
• One in eight died or received incapacitating injuries.
• When trucks did not roll over, 3.6 percent were injured.
• When trucks did not roll over, only 1.9 percent received K-, A-, or B-injuries.
• When trucks did not roll over, only 0.6 percent of drivers received fatal or A-injuries.
For belted drivers:
• 39.7 percent of injuries occurred in rollover.
• When trucks rolled over, almost half of drivers were injured (45.6%).
• Almost one in three received K-, A-, or B-injuries.
• One in nine died or received incapacitating injuries.
• When trucks did not roll over, 3.5 percent were injured.
• When trucks did not roll over, only 1.8 percent received K-, A-, or B-injuries.
• When trucks did not roll over, only 0.5 percent of drivers received fatal or A-injuries.
For unbelted drivers:
• 49.5 percent of injuries occurred in rollover.

45
• When trucks rolled over, 82.7 percent were injured.
• 68.5 percent received K-, A-, or B-injuries.
• One in three died or received incapacitating injuries.
• When trucks did not roll over, 25.5 percent were injured.
• When trucks did not roll over, only 17.5 percent received K-, A-, or B-injuries.
• When trucks did not roll over, only 8.1 percent of drivers received fatal or A-injuries.
Seat belt use may be over-reported, for reasons identified in section 6.3, which would tend to exaggerate risks associated with no belts and overestimate injury-reduction from belt use. However, across all truck-tractor drivers, regardless of belt use, over 40 percent of driver injuries occurred in rollover. In sum, rollover accounted for 51.1 percent of fatal injuries, 54.1 percent of A-injuries, 43.8 percent of B-injuries, and 29.1 percent of C-injuries, despite the fact that only 4.7 percent of truck-tractors rolled over in traffic crashes.
Ejection frequently occurred in combination with rollover. As mentioned above, in fatal truck-tractor rollover crashes, almost 65 percent of drivers were also ejected. Table 30 shows how driver injury risks vary with rollover, ejection, or ejection and rollover together. For truck-tractors that rolled over only and the driver remained in the cab, only about 2.0 percent were fatally injured and another 9.2 percent suffered A-injuries. Ejection alone had a higher risk of severe driver injury. For drivers that were ejected only, but the trucks did not rollover, 12.9 percent were fatally injured and 11.8 percent received A-injuries. Ejection by itself had a significantly higher probability of K+A-injury than rollover by itself. However, the combination of rollover and ejection resulted in much higher rate of severe driver injury. Here, 55.6 percent of drivers were killed and an additional 36.7 percent received A-injuries, for a total of 92.4 percent of drivers in this situation suffering K+A-injuries.
Table 30 Percent Distribution of Truck-Tractor Driver Injury Severity by Rollover and Ejection TIFA 2006-2010, GES 2006-2010
Driver injury None Roll only
Eject only
Roll and eject Total
Fatal 0.1 2.0 12.9 55.6 0.2 A-injury 0.4 9.2 11.8 36.7 0.9 B-injury 1.1 19.2 16.1 5.6 2.3 C-injury 1.5 13.5 13.9 0.4 2.2 Unknown severity 0.0 0.5 0.0 0.0 0.0
No injury 90.9 54.5 45.3 0.0 88.1 Unknown if injured 6.0 1.0 0.0 1.6 6.2
Total 100.0 100.0 100.0 100.0 100.0

46
In terms of the prevalence of the combinations of rollover and ejection, Table 31 shows the distribution of rollover and ejection for different levels of driver injury. Rollover alone accounts for a plurality of fatal and A-injuries. However, ejection, either alone or in combination with rollover, also contributes strongly to fatal injuries, less so to A-injuries. Among fatal injuries, 8.2 percent of drivers were ejected and an additional 14.6 percent both rolled and were ejected. Ejection alone accounted for 2.2 percent of A-injuries, while rollover and ejection accounted for another 2.8 percent.
Table 31 Percent Distribution of Rollover and Ejection by Driver Injury, Truck-Tractors Only TIFA 2006-2010, GES 2006-2010
Driver injury None Roll only
Eject only
Roll and eject Total
Fatal 40.6 36.6 8.2 14.6 100.0 A-injury 45.7 49.3 2.2 2.8 100.0 B-injury 55.4 43.2 1.3 0.2 100.0 C-injury 69.5 29.4 1.1 0.0 100.0 No injury 97.2 2.7 0.1 0.0 100.0 Total 95.2 4.6 0.2 0.1 100.0
6.10 Impact location in collision events
Section 6.5 identified collisions with other objects, either vehicles or roadside objects, as one of the primary crash mechanisms resulting in severe injuries to truck drivers. This section classifies impact locations on trucks in collision events, to identify the primary vectors of force involved. The analysis is based on the initial impact on the truck, because initial impact is available for both fatal and nonfatal crashes. Results are provided for all MHE collisions and for MHE collisions that resulted in K+A-injuries, because these are the most serious crashes.
The collision typology presented in Table 14 classified crashes in terms of the event in the crashes that produced the most harm for each vehicle. These events were deemed the most harmful event or MHE. However, the MHE was not necessarily the only harmful event in the crash. Rollover also occurred in 0.4 percent of all crashes where MHE was a collision, and in 12.1 percent of collision events in which drivers received a fatal or A-injury.
In this section on collision, rollovers are excluded, whether they happened prior to the MHE collision or after. The goal is to focus on events involved only collisions, to determine the impact locations on trucks that produced the greatest risk of injury to drivers.
As in most analyses in this report, data for this section were obtained from the FARS file (incorporated into the TIFA file) and the GES file. FARS and GES use different systems to code impact location. In the FARS data, which cover fatal crashes, impact point is captured using a clock-face metaphor, though the levels correspond to points on trucks rather than vectors of

47
impact. Figure 12 shows the diagram used by the coders. (NHTSA 2011a) The 12 o’clock point corresponds to the front of vehicles, 1 to the right side of the cab, 6 to the rear plane of the truck. In the GES file, which supplied data on nonfatal crashes, impact point is captured in a simpler format, by plane of the vehicle: front, left side, right side, and rear. (NHTSA 2011b) (There are also code levels for top, undercarriage, and a few other typically minor categories. The FARS data also include these other levels.) Impact location can be determined with more detail for fatal crashes. However, combining impact point for both fatal and nonfatal crashes required that the more detailed information on the fatal crash data be aggregated to levels available in the nonfatal crash data, i.e., front, left, right, and rear.
Figure 12 Schematics Used to Code Impact Point on Trucks in FARS
Table 32 shows impact location for fatal crashes, where the MHE was a collision event. With the table derived from TIFA data (fatality to any person in the crashes), the more detailed location can be shown. In addition, the table is limited to heavy trucks only. These are all cases where the most harmful event was a collision and the truck did not roll over. The table shows the distribution of K+A-injuries by impact point where the most harmful event was a collision, for SUTs and truck-tractors. The table also shows the probability of K+A-injury to the driver for each impact point. Only class 7 and 8 trucks are included in the table.
Impact to the front of trucks was the dominant mode of serious injury to the truck drivers in collision events in which there was no rollover. Impacts to the front of these trucks accounted for 72.4 percent of SUT driver K+A-injuries in the crashes and 76.9 percent of truck-tractor driver K+A-injuries. Clock points 11, 12, and 1 identify the driver side, front plane, and passenger side, respectively. Together, these three points accounted for 81.0 percent of SUT driver K+A-injuries and 86.2 percent truck-tractor K+A-injuries. Because truck-tractors pull semitrailers coupled only by a kingpin, impacts to trailers may not be as harmful as impacts to the side of a straight truck. The highest probability of K+A-injury in truck-tractor combinations were at the 12-, 1-, and 11-o’clock positions, all of which identify strikes to the front of the truck cab. For SUTs, the

48
highest K+A-injury probabilities were similar to truck-tractors but also included the 2-, 3-, 9-, and 10-o’clock positions. These positions are at the front half of trucks, but behind the cab. Nevertheless, impacts to the front plane accounted for about three-quarters of K+A-injuries.
Table 32 Driver K+A Injury by Power Unit Type and Impact Point in Collision Events Class 7 and 8 Only, Fatal Crashes Only, Rollovers Excluded, TIFA 2006-2010
Impact point
SUT Tractor % of K+A
Prob of K+A
% of K+A
Prob of K+A
Clock 1 4.3 11.0 4.3 11.4 Clock 2 3.9 18.0 0.8 4.9 Clock 3 4.7 12.6 2.9 7.2 Clock 4 0.4 4.5 0.6 2.8 Clock 5 0.0 0.0 0.4 1.6 Clock 6 1.7 0.9 2.8 1.7 Clock 7 0.4 1.8 0.4 1.0 Clock 8 0.0 0.0 0.3 0.7 Clock 9 5.2 12.0 3.5 6.3 Clock 10 2.6 10.7 2.1 6.6 Clock 11 4.3 6.9 5.0 9.1 Clock 12 72.4 10.3 76.9 12.7 Total 100.0 8.4 100.0 8.8
Enlarging the scope of crash severity to all crashes requires that the impact point be simplified to the four planes of the truck. Table 33 shows the distribution K+A-injuries by impact side for SUTs and truck-tractors in crashes in which the most harmful event was a collision event and there was no rollover. Once again, impact to the front of the truck accounted for most K+A-injuries, with 59.0 percent for SUTs and 53.4 percent for truck-tractor combinations. For SUT drivers, impact to the driver side accounted for over twice as many K+A-injuries as impact to the passenger side. The disparity is not as great for truck-tractor combinations. The probability of a K+A-injury in a frontal impact is about twice as great as the overall probability in these collision events. Probability of K+A-injury was also much higher in driver-side impacts than passenger side in SUTs; however, the disparity was not as great for truck-tractors. The primary conclusion, however, is that frontal impacts accounted for the vast majority of K+A-injuries in collisions. In addition, the probability of K+A-injury to drivers in frontal impacts was much greater than when trucks were struck in any of the other sides.
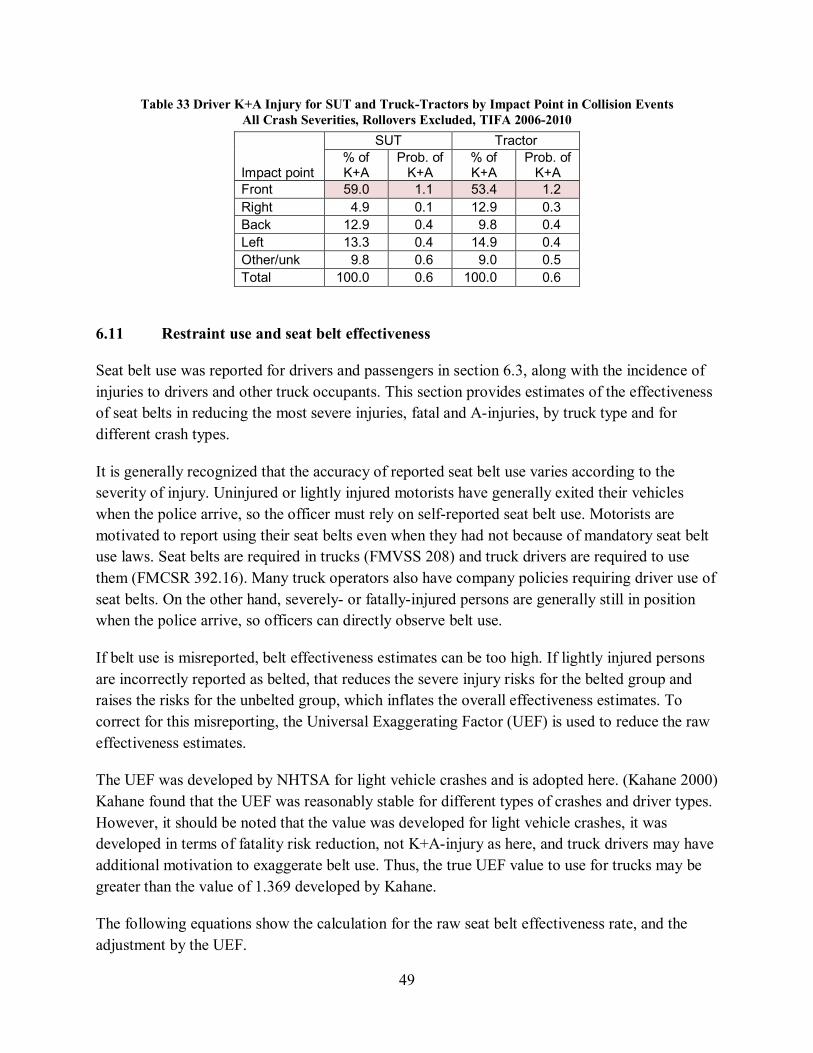
49
Table 33 Driver K+A Injury for SUT and Truck-Tractors by Impact Point in Collision Events All Crash Severities, Rollovers Excluded, TIFA 2006-2010
Impact point
SUT Tractor % of K+A
Prob. of K+A
% of K+A
Prob. of K+A
Front 59.0 1.1 53.4 1.2 Right 4.9 0.1 12.9 0.3 Back 12.9 0.4 9.8 0.4 Left 13.3 0.4 14.9 0.4 Other/unk 9.8 0.6 9.0 0.5 Total 100.0 0.6 100.0 0.6
6.11 Restraint use and seat belt effectiveness
Seat belt use was reported for drivers and passengers in section 6.3, along with the incidence of injuries to drivers and other truck occupants. This section provides estimates of the effectiveness of seat belts in reducing the most severe injuries, fatal and A-injuries, by truck type and for different crash types.
It is generally recognized that the accuracy of reported seat belt use varies according to the severity of injury. Uninjured or lightly injured motorists have generally exited their vehicles when the police arrive, so the officer must rely on self-reported seat belt use. Motorists are motivated to report using their seat belts even when they had not because of mandatory seat belt use laws. Seat belts are required in trucks (FMVSS 208) and truck drivers are required to use them (FMCSR 392.16). Many truck operators also have company policies requiring driver use of seat belts. On the other hand, severely- or fatally-injured persons are generally still in position when the police arrive, so officers can directly observe belt use.
If belt use is misreported, belt effectiveness estimates can be too high. If lightly injured persons are incorrectly reported as belted, that reduces the severe injury risks for the belted group and raises the risks for the unbelted group, which inflates the overall effectiveness estimates. To correct for this misreporting, the Universal Exaggerating Factor (UEF) is used to reduce the raw effectiveness estimates.
The UEF was developed by NHTSA for light vehicle crashes and is adopted here. (Kahane 2000) Kahane found that the UEF was reasonably stable for different types of crashes and driver types. However, it should be noted that the value was developed for light vehicle crashes, it was developed in terms of fatality risk reduction, not K+A-injury as here, and truck drivers may have additional motivation to exaggerate belt use. Thus, the true UEF value to use for trucks may be greater than the value of 1.369 developed by Kahane.
The following equations show the calculation for the raw seat belt effectiveness rate, and the adjustment by the UEF.

50
Raw effectiveness = ((K+Aunbelted ∕ Totalunbelted) − (K+Abelted ∕ Totalbelted)) ∕ (K+Aunbelted ∕ Totalunbelted) 1.
Adjusted effectiveness = 1 − 1.369*(1 − Raw effectiveness) 2.
Table 34 presents seat belt effectiveness estimates by MHE crash type. The “Raw” column shows the raw belt effectiveness, calculated using equation 1 above. The “Adjusted” column shows belt effectiveness rates as adjusted by the UEF, using equation 2 above.
The estimates are for belt effectiveness in reducing K+A-injuries. K+A-injuries are used here because they are the most serious injuries and probably most reliably reported. Seat belt effectiveness estimates were calculated for each crash type, and a weighted average effectiveness was computed across all crash types based on the number of truck drivers in each crash type. The tables show estimates by power unit type, for all SUTs and for all truck-tractors. Truck-tractors are virtually all class 7 and 8, so they are a good surrogate for the target population of trucks with GVWR of 26,000 lbs. and above. SUTs are a combination of medium and heavy straight trucks.
The rates are all relatively high because the target population of injury types (K+A) is so severe. Effectiveness here means reducing injury severity to something less than K+A, including no injury. Seat belt effectiveness varies by crash type. In rollover crashes, belts are estimated as 71 percent effective in reducing K+A injury for SUT drivers, higher where the MHE was a collision with another truck or bus, but lower where the MHE was a collision with a light vehicle. Effectiveness in light vehicle crashes may be lower than in crashes with trucks because the impacts with light vehicles resulted in lower deceleration rates than with trucks. On the other hand, belts are estimated to be 90 percent effective in reducing K+A injury in collisions with hard fixed objects. As the section on impact direction showed, most of these are pure frontal impacts, where belts should be most effective. Effectiveness estimates for crash types with low numbers of cases are less stable and likely less robust.

51
Table 34 Seat Belt Effectiveness by Crash Type, SUTs TIFA 2006-2010, GES 2006-2010
Crash type
Unbelted Belted Seat belt
effectiveness K+A Injury Total
K+A injury Total Raw Adjusted*
Rollover 974 2,518 1,300 15,769 79% 71% Fire 10 14 65 997 91% 87% Other non-collision 22 469 10 6,092 97% 95%
Truck/bus 135 976 493 30,072 88% 84% Light vehicle 191 14,016 1,316 384,254 75% 66% Unknown vehicle type 34 1,719 146 40,976 82% 75%
Train 35 47 10 123 89% 85% Ped/bike/animal 4 411 8 8,654 91% 87% Other non-fixed 5 18 307 5,086 78% 70% Hard fixed 286 609 427 12,291 93% 90% Soft/other fixed 55 895 78 19,420 93% 91% Unknown 1 1 0 30 100% 100% Total 1,753 21,694 4,162 523,764 78% 70% * Adjusted by UEF to account for misreported belt use. Frequencies shown are totals for the period 2006-2011.
Table 35 shows belt effectiveness rates by MHE crash type for truck-tractors. Seat belt effectiveness is lower in rollovers than it is in collision events, probably because the rotational forces in rollover cause even a belted driver to strike the sides of the cab. The effectiveness of seat belt in reducing K+A-injury is estimated at 53 percent, while effectiveness is estimated at 82 percent in collisions with trucks or buses, 86 percent in collisions with light vehicles, and 90 percent in collisions with hard fixed objects. seat belts are more effective in front impacts than rollovers, though substantially effective in rollover as well.

52
Table 35 Seat Belt Effectiveness by Crash Type, Truck-Tractors TIFA 2006-2010, GES 2006-2010
Crash type
Unbelted Belted Seat belt
effectiveness K+A Injury Total
K+A injury Total Raw Adjusted*
Rollover 741 2,362 3,068 28,470 66% 53% Fire 38 49 113 5,096 97% 96% Other non-collision 25 241 97 17,802 95% 93%
Truck/bus 177 1,439 1,003 62,644 87% 82% Light vehicle 100 5,401 764 399,129 90% 86% Unknown vehicle type 38 418 427 30,740 85% 79%
Train 15 60 111 454 3% -33% Ped/bike/animal 6 62 112 16,367 93% 90% Other non-fixed 98 103 13 10,421 100% 100% Hard fixed 380 967 779 28,304 93% 90% Soft/other fixed 31 580 73 41,876 97% 96% Unknown 1 1 2 181 99% 98% Total 1,650 11,682 6,562 641,483 89% 85% * Adjusted by UEF to account for misreported belt use. Frequencies shown are totals for the period 2006-2011.
6.12 Posted speed limit
Travel speed is not systematically available in either the TIFA or GES data, because the amount of missing data is excessive. Posted speed limit can serve as a partial surrogate, to provide at least some suggestion of the operating speeds at which the crashes occurred.
Most crashes that produce fatal or A-injuries to truck drivers occurred on higher speed roads. Table 36 shows the distribution of fatal and A-injuries to drivers by the posted speed limit of the road where the crashes occurred. Fully 83.1% of K+A-injuries to SUT drivers happened on roads posted for 45 mph or greater; for truck-tractors, the percentage is 82.2%. Roads posted at 55 mph accounted for 34.3 percent of SUT driver K+A-injuries and 30.4 percent of K+A-injuries to truck-tractor drivers. Such roads are often two-way, undivided roads and head-on crashes on these roads can have very high closing speeds. It is interesting to note the relatively small share of K+A injuries on 50 mph and 60 mph roads. This likely reflects exposure, with relatively few roads posted at those speeds.

53
Table 36 Percentage of Truck Driver Fatal and A Injuries by Power Unit Type and Posted Speed Limit
TIFA 2006-2010, GES 2006-2010 Posted speed limit SUT Tractor Other/Unk. <=20 mph 1.8 2.4 1.3 25 mph 3.4 4.2 2.7 30 mph 2.0 1.4 0.0 35 mph 4.8 8.1 2.7 40 mph 4.9 1.7 4.0 45 mph 16.4 10.8 9.4 50 mph 5.0 3.7 1.3 55 mph 34.3 30.4 62.5 60 mph 3.2 3.3 2.7 65 mph 13.5 11.3 12.0 70+ mph 10.6 22.7 1.3 Total 100.0 100.0 100.0
Figure 13 shows the cumulative distribution of fatal and A-injuries for truck drivers, separately for SUTs and truck-tractors. As mentioned above, virtually all truck-tractors qualify as class 7 or 8, i.e., heavy trucks. The cumulative distributions for truck-tractors and SUTs are similar and shifted toward roads with higher posted speed limits.
0.010.020.030.040.050.060.070.080.090.0
100.0
<=20 mph
25 mph
30 mph
35 mph
40 mph
45 mph
50 mph
55 mph
60 mph
65 mph
70 mph
Cum
ulat
ive
perc
ent
Posted speed limit
SUT Tractor
Figure 13 Cumulative Percentage of Truck Driver Fatal and A Injuries, by Power Unit Type TIFA 2006-2010, GES 2006-2010
Although it is not possible to estimate travel speeds or impact speeds from the available crash data, the posted speed limit data clearly indicate that crashes producing fatal and serious injuries to truck drivers are high speed events. The probability of a truck driver coded with a fatal or A-

54
injury increased with posted speed limit. Table 37 shows the probability of K+A-injury for SUTs and truck-tractors by ranges of posted speed limit. Speed limits have been aggregated somewhat because some speed limits, like 50 and 60 mph, are relatively infrequent in the data. On roads posted between 45 and 50 mph, 1.32 percent of SUT and truck-tractor drivers received fatal or A-injuries. For SUTs, the probability rose almost linearly to 2.19 percent on 55-60 mph roads and 3.14 percent on 65-70 mph roads. The relationship was not as straight-forward for truck-tractors. The K+A probability was about the same on 45-50 mph and 55-60 mph roads, but rose significantly for the higher speed roads.
Table 37 Probability of Driver K+A Injury by Power Unit Type and Posted Speed Limit
TIFA 2006-2010, GES 2006-2010 Posted limit SUT Tractor <=40 mph 0.36 0.79 45-50 mph 1.32 1.32 55-60 mph 2.19 1.35 65-70 mph 3.14 1.83 All roads 0.96 1.18
6.13 Primary crash types in severe driver injury
Rollover and frontal impact (as defined in section 6.10) in a collision event have been identified as the collisions types associated with the most serious driver injuries. Table 38 summarizes just how dominant these two crash modes are. The table addressed truck-tractor crashes only because truck-tractors are virtually all heavy trucks. As such, they best represent how truck drivers are injured in crashes. K+A-injuries are shown because they are the most serious injuries to address. MHE rollover and frontal impact in collisions accounted for 72.7 percent of all truck-tractor driver fatalities and A-injuries in crashes. MHE rollover is the dominant crash mode, with 44.5 percent of K+A-injuries, but frontal collision events account for 28.2 percent (though some of these may include rollover that was not deemed the MHE). No other crash event comes close to the share of these two crash types. Thus, almost three-quarters of the most serious injuries were produced by these two crash modes. Collisions with the left and right sides of trucks accounted for an additional 13.3 percent, rear and other impacts for 8.7 percent and all other crash types for 5.3 percent.

55
Table 38 Percent Distribution of Driver K+A Injury by Crash Type, Truck-Tractors Only TIFA 2006-2010, GES 2006-2010
Crash type
Injury severity and belt use
K+A K+A
belted K+A
unbelted MHE rollover 44.5 46.8 44.9 Frontal impact 28.2 29.6 26.3 Right side impact 6.3 6.5 8.4 Rear impact 4.2 5.9 0.4 Left side impact 7.0 6.0 7.2 Other collision 4.5 1.9 8.9 Other crashes 5.3 3.2 3.9 Total 100.0 100.0 100.0
For belted drivers, the K+A-injury share of rollovers and frontal impacts was even higher. About 76.3 percent of belted driver K+A-injuries occurred in frontal and rollover crashes. These two crash types accounted for 71.2 percent of unbelted truck-tractor driver K+A-injuries. Right-side impacts and other collision events accounted for a higher share of unbelted driver K+A-injuries than for belted drivers, probably because unrestrained drivers can move around in the cab during collision events.
Table 39 provides estimates of the annual number of K+A-injuries by the crash modes. Overall, about 838 truck-tractor drivers were killed or suffered A-injuries in rollovers each year, along with 531 drivers in frontal impacts. Left side impact accounted for the next greatest number of K+A-injuries, followed by impacts to the right side and other crash types.
Table 39 Annual Average Driver K+A Injuries by Crash Type, Truck-Tractors Only TIFA 2006-2010, GES 2006-2010
Crash type
Injury severity and belt use
K+A K+A
belted K+A
unbelted MHE rollover 838 614 148 Frontal impact 531 388 87 Right side impact 119 85 28 Rear impact 80 78 1 Left side impact 131 79 24 Other collision 85 26 29 Other crashes 99 42 13 Total 1,884 1,312 330

56
7 LTCCS review
To gain some insight into how drivers are injured in crashes, a limited number of crashes were sampled from the Large Truck Crash Causation Study (LTCCS). The purpose of the review was for some understanding of how the crashes occurred and how the drivers were injured. Within the scope of the current project, it was necessary to limit the review, so cases were selected from just two crash types, rollovers and frontal collisions.
The LTCCS was conducted from 2001 to 2003, so it represented the truck model years on the road in that period. The file has trucks ranging in model year from 1981 to 2003. For the purpose of the review, model years were limited to 1995 and later (effectively 2003). This ensured that the vehicles were all relatively recent at the time of the crashes, and would have whatever cab improvements were available at that time. In addition, only tractor-semitrailers and SUTs with no trailers, with a GVWR class 7 or 8, were included in the review. Finally, only cases where the driver suffered a fatal, A-, or B-injury were included in the review. It had been desired to limit the review to K+A driver injuries, in order to look at cab performance in the most challenging crashes, but that resulted in too few cases to review.
The cases sampled were not intended to be a representative sample of serious truck driver injuries, nor could they be. The LTCCS is limited to only about 960 crashes, and only crashes involving a fatal, A-, or B-injury were included. For the case review, we only selected from among a narrow set of seriously-injured truck drivers, as explained in the previous paragraph. The resulting “sample of a sample” cannot realistically represent a national population. However, it can supply illustrative cases. A much larger review would be necessary to provide a comprehensive description of the mechanisms of truck driver injury.
7.1 Sampled crash population
Table 40 shows the weighted LTCCS crash population from which review cases were selected. This is the whole set of LTCCS cases, from which cases for review were selected. The frequencies are national estimates of crash involvements, computed using the LTCCS case weights. The table provides estimates of the number of crash involvements where a truck driver received fatal, A-, or B-injuries; the crashes were rollovers or frontal impacts; and the trucks were class 7 or 8 SUTs or tractor-semitrailers. Most of the trucks that meet that description were tractor-semitrailers; there was about twice as many rollovers as frontal crashes.

57
Table 40 Truck Configuration by Crash Type, LTCCS Crash Population Reviewed Configuration Roll Frontal Total SUT 4,140 766 4,905 Tractor-semitrailer 17,651 9,904 27,555 Total 21,791 10,670 32,461
Column percentage SUT 19.0 7.2 15.1 Tractor-semitrailer 81.0 92.8 84.9 Total 100.0 100.0 100.0
Most of the rollovers were only one quarter turn. For SUT rollovers, 88.9 percent had just one quarter turn, and the remainder experience only two quarter turns. Rollovers for tractor-semitrailers also were primarily one quarter turn. About 77.5 percent had only one quarter turn, 8.3 percent had two, 4.2 percent had 3 quarter turns and only 1.6 percent had 4. While the number of cases these estimates are based on is relatively small, they strongly suggest that most rollovers only involve an overturn onto one side. Relatively few are energetic enough to roll onto the top or beyond.
Table 41 Quarter Turns in Rollover by Truck Configuration LTCCS Crash Population Reviewed
Quarter turns Straight
truck Tractor-
semitrailer Total 1 3,678 13,672 17,351 2 461 1,462 1,924 3 0 744 744 4 0 290 290 Unknown 0 1,482 1,482 Total 4,140 17,651 21,791
Column percent 1 88.9 77.5 79.6 2 11.1 8.3 8.8 3 0.0 4.2 3.4 4 0.0 1.6 1.3 Unknown 0.0 8.4 6.8 Total 100.0 100.0 100.0
Direction of roll was fairly evenly split between left and right overall, though SUTs more often rolled to the right (58.7% right to 41.3% left) and tractor-semitrailers to the left (43.5% right to 56.5% left.) The number of cases that these estimates are based on is relatively small; it is unlikely that the differences are statistically significant.

58
Table 42 Direction of Rollover by Truck Configuration LTCCS Crash Population Reviewed
Configuration Right Left Total Straight truck 2,429 1,710 4,140 Tractor-semitrailer 7,669 9,981 17,651
Total 10,099 11,692 21,791
Row percentage Straight truck 58.7 41.3 100.0 Tractor-semitrailer 43.5 56.5 100.0
Total 46.3 53.7 100.0
7.2 Clinical review approach
Within the scope of the project, the LTCCS review was intended to be exploratory and illustrative of primary injury mechanisms. Crashes from two types, rollover and frontal impact, were sampled for review. Frontal impacts that also involved rollover were excluded to limit damage to frontal impact only, without the addition of rollover damage. The sampling procedure took all cases in which a truck driver was killed, along with a random sample of cases of drivers with either A- or B-injuries. There were only four straight trucks in frontal collisions so all were taken. Sampling probabilities were recorded so that the sample could be weighted to the original sample frame. However, note that standard errors in the original LTCCS data are large (NHTSA and FMCSA 2006b). The distributions shown here, based on a small focused sample do not represent the broader population of truck driver injury.
The following filter was used to identify cases for review:
• Tractor-semitrailer or straight truck with no trailer. • GVWR class 7 or 8. • Truck driver fatal, A-, or B-injury. • Truck model year 1995 or later. • Truck rolled over in the crash. • Primary crash impact was frontal, with no rollover.
Table 43 shows the number of cases reviewed, along with the total number of cases available to be reviewed. For example, there were 80 tractor-semitrailer crash involvements in the LTCCS case files in which the driver had either fatal, A-, or B-injuries and the truck-tractor model year was 1995 or later. Of these cases, 27 were selected, including all driver fatal injuries and a random set of cases with A- or B-injuries.

59
Table 43 LTCCS Rollover and Frontal Impact Cases Reviewed
Driver injury
Rollover Frontal
Total Tractor-
semitrailer SUT Tractor-
semitrailer SUT Fatal 10 3 7 1 21 A-injury 7 8 5 1 21 B-injury 10 2 6 2 20 Total cases selected 27 13 18 4 62 Total available 80 21 51 4 156
Each case was reviewed a minimum of three times. Difficult cases were discussed by the authors until a consensus was achieved. The following data elements were collected.
• If the truck rolled over: Number of quarter turns. Direction of roll.
• Amount of crush to cab, in each of four quadrants: driver side/ passenger side; front and rear. (See Figure 14.)
• Amount of crush was estimated separately for the vertical and horizontal dimensions. • For horizontal crush, the direction of crush was recorded, where 0° meant front-to-
back, 90° meant into the driver’s side, 180° was back-to-front, and 270° meant into the passenger’s side.
• Trailer or load intrusion into the cab. • Cab contact with a substantial fixed object during or after the rollover.
Cab intrusion from the contact. Classification of longitudinal force as high or low. Classification of vertical force as high or low.
• Fire in the truck. Location of fire: cab, engine, sleeper, or trailer.
• Sleeper compartment; size (single or double) and integrated or modular. • Likely crash survivability for the driver (subjective). • If not survivable, why not? Impact; fire; or combination. • Possible countermeasures. • Discussion of key features of the crash.
Case materials, available on the web through a browser interface, include crash diagrams, the researcher narratives/discussion of the crashes, scene photos, photos of each vehicle, including interior shots, and injury data. Photos of the exterior and interior of trucks were used to estimate cab crush and intrusion in different quadrants of the cab. The injury data include diagrams showing the location of each injury, the severity of each injury and the injury source, where that can be determined. Gross estimates of cab crush were made from the photos. Accordingly the classification resolution was limited to four categories:

60
• None/incidental • Minor, <25 percent • Significant, 25-75 percent • Extreme, >75 percent
Figure 14 shows a schematic of a generic truck greenhouse with labels for the four quadrants of the greenhouse for which crush was estimated. The greenhouse of trucks is defined as the glassed-in area of the cab, from the roof to the base of the windows, sometimes called the beltline. Crush estimates for each of the quadrants were combined to compute a total available space remaining. To compute space remaining in the greenhouse, the midpoint of each range was used. 100 percent crush means that the cab greenhouse was flattened to the beltline, i.e., to the bottom of the windshield. Crush estimates are approximate.
Figure 14 Schematic of Truck Cab Greenhouse
Figure 15 Truck-tractor with 100 percent Crush
There were only four SUT frontal impacts cases that passed the filter, which severely limits the usefulness of this information. For frontal impacts, the data from SUTs were combined with tractor-semitrailer frontal crashes on the assumption that the problem of driver protection is similar in both cases. This is not always true, since tractor-semitrailers more often have sleeper berths behind the driving compartment and the cargo is in a semitrailer coupled to the tractor by

61
means of a kingpin, rather than in a cargo body permanently attached to the truck’s frame, as in a SUT. But where there is no intrusion from the rear, the performance of cabs in protecting drivers is likely to be similar for a given frontal crash.
7.3 “Catastrophic impact” crashes
Some crashes were so catastrophic that they seemed clearly outside the scope of the goal of the case review. These include crashes in which no intact cab structure remained and crashes that seemed to be clear outliers. Some of the crashes included cab damage so extensive as to seem unsurvivable. However, there were also crashes with extreme cab crush and yet the driver survived. Classifying cab damage as “unsurvivable,” while intuitively straight-forward, is much more difficult in practice because drivers sometimes survive seemingly unsurvivable crashes.
Figure 16 shows an on-scene photograph of a truck-tractor that rolled right four quarter turns. The cab’s greenhouse was apparently effectively torn away, leaving only the driver’s seat. Some of the cab may have been cut away in the process of removing the driver but clearly the cab suffered catastrophic damage. The belted driver was coded with B-injuries, including scalp lacerations, abrasions, and contusions. Is this a “survivable” crash? Clearly the driver survived. But the damage to the cab was catastrophic.
Figure 16 Truck-tractor rolled 4 quarter turns, destroying the cab
In another case, a tractor-semitrailer went off a bridge and fell 11.2m, striking a bridge pillar and landing effectively nose first. The cab remained relatively intact, with little deformation to the greenhouse. (See Figure 17.) There was some horizontal intrusion, estimated at less than 25 percent, from the instrument panel being pushed into the driver compartment. The unbelted driver was ejected, and experienced a comminuted skull fracture from striking the windshield.

62
This case was coded as unsurvivable in the case review, yet given the amount of survival space that remained, it is plausible to think that a belted driver may have survived.
Figure 17 Driver compartment of truck-tractor that rolled off a bridge and fell 11.2 m
These examples illustrate some of the extreme events that occurred in the crashes reviewed. Some of the cases include collision energies so large as to effectively disintegrate the cab. Others included highly unusual events, such as rolling off a bridge, that seemed not useful in considering possible countermeasures to protect truck drivers. Six tractor-semitrailer and two SUT rollover cases, and six tractor-semitrailer and 1 SUT frontal impact case were classified as catastrophic impacts. These cases amount to 15 of the 62 cases reviewed. In terms of their weighted share of the population, the “catastrophic impact” crashes accounted for 7.6 percent of all cases reviewed.
In addition to the catastrophic impact cases, cab crush could not be estimated along one or more of the dimensions in seven cases. Four of these were tractor-semitrailer rollover cases, 2 were tractor-semitrailer frontal impact crashes, and the final one was one of the 4 SUT frontal impacts. In the cases where not even a rough estimate of crush could be formed, the photographs were inadequate or missing, the cabs were destroyed by fire, or the cabs were altered by the process of extracting drivers. Due to such irresolvable issues, cab crush for these cases was coded unknown.
Thus, of the original 62 cases sampled for review, 15 were deemed catastrophic impact or outliers, and crush could not be estimated in an additional 7, leaving 40 cases. These 40 cases provide a sample of rollovers and frontal impacts that may provide some insight when

63
considering countermeasures to reduce truck driver injury. The following sections provide discussions of cab performance in survivable rollovers and frontal impacts.
7.4 Rollover
Figure 18 shows total cab space left, for all, belted and unbelted, in rollover events, for truck-tractors and SUTs. About 7.8 percent of truck-tractor rollovers were deemed unsurvivable and 7.0 percent of SUT rollovers. However, among the truck-tractors, almost 32 percent had more than 90 percent of cab space left, and for SUTs, almost 60 percent had more than 90 percent. In most of the truck-tractor rollovers, the truck rolled only one quarter turn. In many, the greenhouse was only slightly distorted. In others, the truck rolled somewhat past 90°, producing more crush.
Tractor SUT>90% 31.7 58.750-90% 32.5 33.8<=50% 20.5 0.5Catastrophic impact 7.8 7.0Unknown 7.6 0.0
0.010.020.030.040.050.060.070.080.090.0
100.0
Perc
ent
Figure 18 Cab space remaining by truck type, rollover crashes
For SUTs, in some cases the cargo body seemed to have provided protection to the cab, and overall SUTs experienced less crush and intrusion in rollovers than truck-tractors. Dump and other vocational bodies seemed to have protected the cab space. Figure 19 illustrates a case in which the hopper dump body of an SUT may have prevented the truck from rolling more than one quarter turn and may have protected the cab.

64
Figure 19 SUT rollover, cab protected by the cargo body
In this rollover of a SUT tanker (Figure 20), the truck rolled onto its top, but the cab was protected by the cargo tank. There was some minor crush on the passenger side, and none on the driver’s side.
Figure 20 SUT rollover with 2 quarter turns, cab protected by tank cargo body
Figure 21 shows the distribution of cab crush by truck type just for belted drivers. In these rollovers, the drivers were using the primary occupant protection mechanism, seat belts. The distributions here are very similar to the distribution for all drivers in Figure 18. Almost 3/4ths of the drivers in the rollovers reviewed were coded as using seat belts, so there is not enough data to credibly compare crush space for belted and unbelted drivers. Unbelted drivers have a higher

65
probability of serious injury, so separating belted and unbelted would be useful. However, a much larger review effort would be needed.
Tractor SUT>90% 30.8 62.350-90% 33.3 37.7<=50% 16.2 0.0Catastropic impact 9.9 0.0Unknown 9.9 0.0
0.010.020.030.040.050.060.070.080.090.0
100.0Pe
rcen
t
Figure 21 Cab space remaining by truck type, rollover crashes, belted drivers only
Figure 22 shows cab crush for one and two or more quarter turns. Truck-tractors and SUTs are combined in this figure. More than 90 percent of cab greenhouse space remained in 70.5 percent of rollovers with just one quarter turn. On the other hand, there was substantial crush in rollovers with two or more quarter turns. In only a negligible portion of cases was more than 90 percent of space left. In 42.0 percent there was between 50 percent and 90 percent left, and in over a third there was less than 50 percent of the greenhouse left.

66
One Two or more>90% 70.5 0.850-90% 23.9 42.0<=50% 0.2 34.6Catastrophic impact 3.3 12.1Unknown 2.2 10.5
0.010.020.030.040.050.060.070.080.090.0
100.0
Perc
ent
Figure 22 Cab Space for One and Two or More Quarter Turns
7.5 Rollover and subsequent events
In 23 percent of rollovers, the cab contacted a fixed object before, during, or after the rollover was completed. That means three-quarters of rollovers in the review sample were simple overturns, with no subsequent impact into any object.
In most cases with contact, the objects contacted were guardrails or barriers. In one case where the truck slid into a rock wall, but the trailer contacted the wall first and cab damage was relatively minor. In another case, the truck rolled onto a light vehicle, which did little damage to the truck. In most cases the contact occurred during the process of rolling over, rather than rolling over and sliding into an object.
Figure 23 shows the post rollover condition of a tractor-semitrailer loaded with steel that entered a ramp curved to the right, at an estimated speed of 45 mph. The truck rolled one quarter turn to the right. The driver claimed load shift, though this was discounted by the LTCCS researcher. The truck rolled to the right, the load struck a concrete barrier first, and then the truck-tractor contacted the barrier with its roof, sliding along the barrier and creating some minor deformation. The hood became unlatched at some point and possibly contacted the windshield. The unbelted driver fell on his right shoulder during the rollover and received injuries classified as A-injuries. The amount of crush is relatively minor.

67
Figure 23 Rollover with subsequent contact with concrete barrier
Figure 24 shows the truck after being set upright. There is some deformation to the cab, with the header pushed back into the driver compartment. Interior shots show the header deformation was the primary impact to the cab.
Figure 24 Truck after being up righted
Figure 25 shows a truck-tractor cab that rolled onto a guardrail. The truck was negotiating a curve ramp at an interchange in an urban area. The ramp had a posted warning speed of 20 mph. Pre-crash speed is unknown. The truck rolled right, first contacting and sheering off a light pole and then rolling onto a guardrail, which tore open the cab compartment. The unbelted driver was
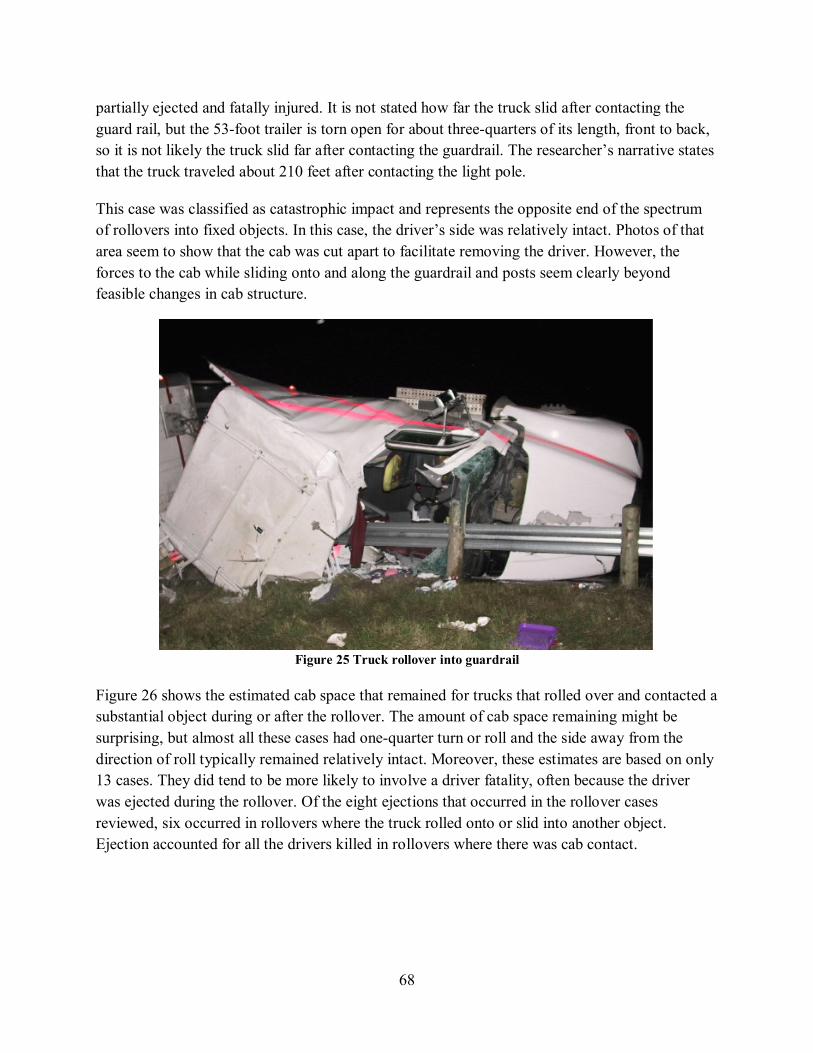
68
partially ejected and fatally injured. It is not stated how far the truck slid after contacting the guard rail, but the 53-foot trailer is torn open for about three-quarters of its length, front to back, so it is not likely the truck slid far after contacting the guardrail. The researcher’s narrative states that the truck traveled about 210 feet after contacting the light pole.
This case was classified as catastrophic impact and represents the opposite end of the spectrum of rollovers into fixed objects. In this case, the driver’s side was relatively intact. Photos of that area seem to show that the cab was cut apart to facilitate removing the driver. However, the forces to the cab while sliding onto and along the guardrail and posts seem clearly beyond feasible changes in cab structure.
Figure 25 Truck rollover into guardrail
Figure 26 shows the estimated cab space that remained for trucks that rolled over and contacted a substantial object during or after the rollover. The amount of cab space remaining might be surprising, but almost all these cases had one-quarter turn or roll and the side away from the direction of roll typically remained relatively intact. Moreover, these estimates are based on only 13 cases. They did tend to be more likely to involve a driver fatality, often because the driver was ejected during the rollover. Of the eight ejections that occurred in the rollover cases reviewed, six occurred in rollovers where the truck rolled onto or slid into another object. Ejection accounted for all the drivers killed in rollovers where there was cab contact.

69
2.2
3.5
0.5
61.7
32.1
0.0 10.0 20.0 30.0 40.0 50.0 60.0 70.0
Catastrophic impact
Unknown
<=50%
50-90%
>90%
Percent
Cab
crus
h
Figure 26 Distribution of Cab Space Remaining, Truck Rollover and Subsequent Contact
7.6 Frontal collisions
The population of frontal impacts reviewed were all crashes in which the driver suffered fatal, incapacitating, or non-incapacitating but evident injuries. They were all crashes with serious injuries to the driver. In these crashes, there was substantial damage to the cab. The primary injury mechanisms appeared to be the greenhouse being pushed into the driver’s space, the instrument panel or engine being displaced back into the cab space, the windshield pushed back in by the hood, or cargo intrusion from the rear.
One case which passed the filter was excluded because on review it was revealed that the driver had died due to a heart attack, which precipitated the crash. Excluding this case left 21 front impact crashes (4 SUT and 17 tractor-semitrailer) for review.
Table 44 Driver Injury in LTCCS Frontal Impact Cases Reviewed
Driver injury N Weighted
N % Fatal 7 503 7.4 A-injury 6 1,824 26.8 B-injury 8 4,473 65.8 Total 21 6,800 100.0
The cab was effectively destroyed in 10 of the 21 frontal impact crashes reviewed. In eight of the 10, the cab was destroyed by impact and in two the cab was destroyed by a post-impact fire. After applying case weights, these 10 account for 22.7 percent of the weighted total. (See Table 45.)

70
Destruction of the cab by impact accounted for all 7 of the frontal crashes in which the driver was killed. These crashes appeared to be so severe as to be unsurvivable. In terms of the weighted population, these account for 7.4 percent of the total population sampled for review. However, it should be noted that the case review was not intended to be representative, but rather illustrative of crashes in which truck drivers were seriously injured.
Table 45 Cab Integrity in Frontal Impacts, Driver K-, A-, or B-injuries
Cab integrity N Weighted
N % Cab destroyed
by: Impact 8 898 13.2 Fire 2 643 9.4
Not destroyed 11 5,259 77.3 Total 21 6,800 100.0
Figure 27 shows the estimated cab space remaining for all cases and for belted drivers only. As in the case of rollover, it could be expected that the cab crush distributions would be different for drivers who used seat belts, because the probability of injury is less for truck drivers using seat belts than drivers who do not. However, the distributions are reasonably similar. In around 50 percent of cases, more than 90 percent of the greenhouse space remained. Less than 50 percent remained in about a quarter of the crashes. Frontal crashes in this population seemed to have resulted in somewhat more crush than rollovers. However, it should be recalled that these are population estimates based on a limited sample of crashes, so it is expected that the variances of the estimates are large.
All Belted>90% 47.1 53.950-90% 10.7 12.3<=50% 28.3 25.7Catastropic impact 7.4 1.8Unknown 6.4 6.3
0.010.020.030.040.050.060.070.080.090.0
100.0
Perc
ent
Figure 27 Cab Space Remaining in Frontal Crashes, All and Belted Drivers Only

71
“Hood pops” were frequently observed. In these cases, the hood became unlatched and popped up. Because truck hoods latch at the rear, the rear of the hood pops up in front of the windshield. Hood pops were observed in 8 of the 12 frontal collisions in which the cab was not effectively destroyed. Using the case weights, hood pops were observed in two-thirds of frontal collisions. The action of unlatching put the rear of the hood in line so that it could be potentially driven back into the windshield. There was evidence that the hood was driven back into the windshield in about half of the cases where it became unlatched. From the cases of frontal crashes in which truck drivers were injured, there is evidence that hood intrusion into the occupant compartment occurred in a substantial number of cases.
Figure 28 is a good illustration of hood unlatching and subsequent intrusion into the cab structure. In this case, a tractor-semitrailer struck a stopped tractor-semitrailer in the rear. The front of the striking truck underrode the trailer, pushing the engine back and down and also driving the rear of the hood into the driver’s compartment.
Figure 28 Rear Hood Intrusion into Drivers Compartment
Figure 29 is an interior shot showing the displacement of the hood back into the cab. The windshield was shattered and driving into the driver’s compartment. The belted driver suffered nonincapacitating injuries, including eyelid lacerations, cervical spine strain, and lower extremity lacerations.

72
Figure 29 Hood Intrusion in Frontal Collision
7.7 Rear intrusion in frontal collisions
Of the 21 frontal impact cases, there was some rear intrusion into the cab from the cargo or trailer observed in six. If weighted to the sampled population, rear intrusion was observed in about a third (32.7%) of frontal impacts in which the driver receives K-, A-, or B-injuries. Three of the six cases were considered survivable, and three were not. Representative cases will be described in this section.
The first involved a 2000 model year truck-tractor pulling a flatbed trailer with sides. The trailer was carrying a large steel coil, tied down with chains. The steel coil was estimated to weigh 42,000 lbs. The tractor-semitrailer was following a truck-tractor with an empty tank trailer. The tanker slowed suddenly due to traffic. The flatbed braked, leaving 79 feet of skid marks, but struck the rear of the tank trailer. The steel coil broke loose from the tie downs and went into the rear of the flatbed’s cab. (The force of the impact into the empty tank trailer also caused the tankers 5th-wheel to fail, driving the tank trailer into the rear of its cab.) An inspection of the flatbed combination found no violations, including no violations of cargo securement standards.
The flatbed driver estimated he was going 50 to 60 mph prior to the critical incident and that he was following about 100 feet behind the tanker. If his travel speed was 50 mph, the flatbed would have a speed at impact of 36.3 mph. If his speed before braking was 60 mph, that implies an impact speed of 49.1 mph. No estimated speed is given for the tanker, but the driver stated that he had slowed in response to another truck ahead of him going at an estimated speed of 30

73
mph. If the tanker was going 30 mph at impact, the relative impact speed of the flatbed combination into the tanker would be from 6.3 mph to 19.1 mph. The results of the impact imply that the higher estimate is closer to the actual relative speed.
Figure 30 shows the rear of the cab was breached by the steel coil after it broke free of the tie downs and traveled through the front of the trailer. The coil came through the sleeper area and contacted the driver’s seat, breaking the seat mounts, and pushing the driver into the steering wheel. The steering wheel was deformed by driver contact. Photos of the front of the trailer do not indicate there was any substantial “headache” rack, a protective structure mounted behind the cab or at the front of a trailer to protect the cab from cargo shifting forward. The front bulkhead of the trailer appears to be a stamped metal sheet that was torn out of the fasteners by the steel coil.
Figure 30 Truck Cab Rear Intrusion from Steel Coil
Figure 31 shows the driver’s broken seat. The seat mounts were broken, the seat pushed forward and the driver impacted the steering wheel, deforming it. The driver suffered multiple pelvic fractures, chest contusions, lacerations, abrasions, and contusions to his lower extremities. Sources of injury were the seat back support, steering wheel, instrument panel, and the seat belt restraint.

74
Figure 31 Broken Seat Mount from Rear Intrusion
In another case, a 2003 model year truck-tractor went off road to the right in a left curve. The posted speed limit was 55 mph; travel speed was unknown. The 53-foot trailer was fully loaded with household retail goods in cardboard boxes; there was no estimate of cargo weight. The tractor-semitrailer proceeded through soft-sand desert terrain for approximately 120 meters, where it went down into a dry wash, continued across and impacted the opposite embankment with its front. At this point, the trailer tore the fifth wheel from the frame of the truck-tractor, jackknifed, split open and drove into the rear of the truck-tractor. The unrestrained driver was pinned; the driver’s air suspension seat and steering wheel were deformed. It appears that the instrument panel was driven back into the cab as well as the seat pushed forward. The driver suffered A-injuries, including a cervical spine fracture, rib cage fracture, and multiple lacerations from contact with the steering wheel, windshield, front header, and instrument panel.

75
Figure 32 Truck Cab After Rear Trailer Intrusion
In the final survivable frontal collision with rear intrusion, a 2001 model year truck-tractor pulling a refrigerated van loaded with 41,000 lbs. of boxed produce was traveling on a road with a 65 mph posted speed limit. The truck went off the road to the right in a left curve, through a chain-link fence and dropped into a roadside drainage box. When the truck struck the far concrete wall of the drainage box, the trailer broke open. The kingpin may have sheared off, allowing the trailer to continue forward into the back of the truck’s cab. There are no photos of the underside of the trailer, but on-scene photos show a section of trailer bottom with the landing gear upside down. Rear damage to the truck-tractor was extensive, with the back wall of the double-berth sleeper pushed all the way forward into the driver compartment proper. (Figure 33) There was also significant crush from the front, with intrusion from the instrument panel. Photos do not clearly show whether the engine was pushed back into the cabin. The belted driver received injuries that were coded nonincapacitating but evident (B-level). They were limited to a fractured clavicle attributed to the seat belt and a lower extremity laceration from contact with the instrument panel.

76
Figure 33 Rear Intrusion from Trailer in Frontal Impact
The front of the truck-tractor sustained substantial crush. The engine may have been displaced underneath the driver compartment, protecting the driver.
Figure 34 Cab Frontal Damage
Figure 35 is a photo of an undamaged truck of the same make and model for comparison.

77
Figure 35 Undamaged Comparison Cab
Figure 36 shows the cab interior. The driver’s seat broke loose and moved forward. The back wall of the sleeper was pushed up into the backs of the seats. It appears that the instrument panel intruded into the cabin due to the force of the frontal impact. The driver was not trapped and did not need extrication.
Figure 36 Cab Interior Showing Damaged Seat and Instrument Panel Intrusion
In the catastrophic frontal impacts with rear intrusion, cab damage was even more severe. In one, the truck veered up an apron under a bridge up into the underside of the bridge, compressing the cab into a wedge which was further compacted when the trailer drove into the back of the cab. In the next catastrophic crash, the truck went off the road at a shallow angle, down into a creek bottom. When the front axle hit the muddy creek bottom it was torn off. The trailer was a

78
refrigerated van full of lettuce packed in boxes. The load broke through the front of the van and into the back of the cab pushing it off its chassis. The engine was also torn from the chassis. The driver was not ejected, and was not coded as trapped. He was dead at the scene. Seat belt use was coded unknown. Injuries include numerous broken bones, liver lacerations, rib cage fracture, many lacerations, abrasions and contusions. The final case was a truck-tractor pulling a refrigerated van loaded with pork products that collided with a line of stopped tractor-semitrailers. The truck struck a stopped flatbed, loaded with heavy equipment (bobcats). The truck-tractor cab was essentially disintegrated in the collision. Post-crash photos show only the frame remaining. The cab was torn from its chassis and pushed onto the flatbed, along with the refrigeration unit from front of the trailer and much of the cargo.
7.8 Sources of driver injury in rollover and frontal collisions
This section provides an analysis of driver injury in rollover and frontal collisions, using the LTCCS injury data. The purpose of this section is to examine the sources of driver injury in rollover and frontal crashes. The previous section presented analysis from reviewing a limited number of frontal and rollover crashes. This section examines a larger set of cases from which the clinical review cases were sampled.
The clinical review cases were not intended to be representative, but to provide useful insight into crash events and cab performance in crashes that are associated with driver injury. The analysis in this section is based on the coded data in the LTCCS file for the population of trucks from which the clinical review sample was drawn. The LTCCS records meet the following criteria:
• Tractor-semitrailers and straight trucks with no trailer; • GVWR class 7 and 8; • Power unit model year 1995 and later; • Rollover and frontal collisions; • Driver coded with K-, A-, or B-injuries.
This is the same filter used for the case reviews, and the justification is similar.
Table 46 shows the distribution of trucks by crash type (rollover or frontal), seat belt use, and ejection. This is the population of crashes from which cases were sampled for the clinical review. Drivers are classified as belted, not belted but contained within the cab, ejected (including partial ejection), and unknown belt use but contained. Most of the drivers were belted. About 61.6 percent of drivers in rollover crashes and 66.0 percent of drivers in frontal crashes were coded as properly restrained. No drivers in frontal crashes were ejected in these data, but about 6.0 percent of drivers in rollovers were ejected. All of the drivers ejected were unbelted or belt use was coded unknown. The frequencies are weighted estimates of population totals. Note that in all of these crash involvements, the driver suffered at least one injury.

79
Table 46 Seat Belt Use and Ejection, Rollover and Frontal Impact Tractor-semitrailers and Straight Trucks, LTCCS
Seat belt use and ejection Roll Frontal Total Belted 13,419 7,048 20,467 Not belted, contained 6,482 3,043 9,525 Ejected 1,303 0 1,303 Unknown belt use, contained 586 580 1,166
Total 21,791 10,670 32,461
Column percentage Belted 61.6 66.0 63.1 Not belted, contained 29.7 28.5 29.3 Ejected 6.0 0.0 4.0 Unknown belt use, contained 2.7 5.4 3.6
Total 100.0 100.0 100.0
The detailed LTCCS injury data classifies injury severity using the Abbreviated Injury Score (AIS) scale. AIS scales injuries in terms of the probability of death from the injury. AIS is used in most medical databases and is a more consistent and reliable method than the KABCO scale, though it requires medical training to apply. This table shows the maximum AIS for each driver. Most are minor on the AIS scale.
Table 47 Maximum Injury Severity by Crash Type, LTCCS MAIS Roll Frontal Total Minor 16,741 7,650 24,390 Moderate 2,891 1,809 4,700 Serious 1,151 876 2,027 Severe 212 121 333 Critical 201 131 333 Maximum 594 84 677 Total 21,791 10,670 32,461
Column percentage Minor 76.8 71.7 75.1 Moderate 13.3 16.9 14.5 Serious 5.3 8.2 6.2 Severe 1.0 1.1 1.0 Critical 0.9 1.2 1.0 Maximum 2.7 0.8 2.1 Total 100.0 100.0 100.0
First, injuries in rollovers will be considered, followed by an account of injuries in frontal collisions.
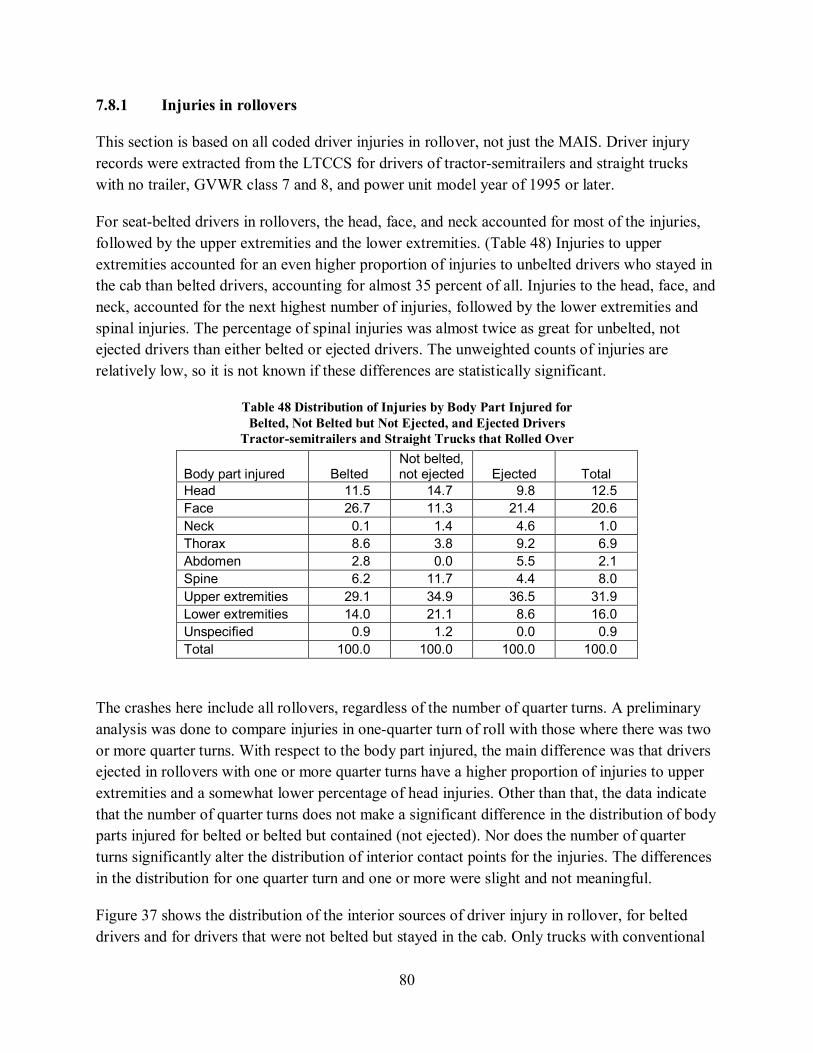
80
7.8.1 Injuries in rollovers
This section is based on all coded driver injuries in rollover, not just the MAIS. Driver injury records were extracted from the LTCCS for drivers of tractor-semitrailers and straight trucks with no trailer, GVWR class 7 and 8, and power unit model year of 1995 or later.
For seat-belted drivers in rollovers, the head, face, and neck accounted for most of the injuries, followed by the upper extremities and the lower extremities. (Table 48) Injuries to upper extremities accounted for an even higher proportion of injuries to unbelted drivers who stayed in the cab than belted drivers, accounting for almost 35 percent of all. Injuries to the head, face, and neck, accounted for the next highest number of injuries, followed by the lower extremities and spinal injuries. The percentage of spinal injuries was almost twice as great for unbelted, not ejected drivers than either belted or ejected drivers. The unweighted counts of injuries are relatively low, so it is not known if these differences are statistically significant.
Table 48 Distribution of Injuries by Body Part Injured for Belted, Not Belted but Not Ejected, and Ejected Drivers
Tractor-semitrailers and Straight Trucks that Rolled Over
Body part injured Belted Not belted, not ejected Ejected Total
Head 11.5 14.7 9.8 12.5 Face 26.7 11.3 21.4 20.6 Neck 0.1 1.4 4.6 1.0 Thorax 8.6 3.8 9.2 6.9 Abdomen 2.8 0.0 5.5 2.1 Spine 6.2 11.7 4.4 8.0 Upper extremities 29.1 34.9 36.5 31.9 Lower extremities 14.0 21.1 8.6 16.0 Unspecified 0.9 1.2 0.0 0.9 Total 100.0 100.0 100.0 100.0
The crashes here include all rollovers, regardless of the number of quarter turns. A preliminary analysis was done to compare injuries in one-quarter turn of roll with those where there was two or more quarter turns. With respect to the body part injured, the main difference was that drivers ejected in rollovers with one or more quarter turns have a higher proportion of injuries to upper extremities and a somewhat lower percentage of head injuries. Other than that, the data indicate that the number of quarter turns does not make a significant difference in the distribution of body parts injured for belted or belted but contained (not ejected). Nor does the number of quarter turns significantly alter the distribution of interior contact points for the injuries. The differences in the distribution for one quarter turn and one or more were slight and not meaningful.
Figure 37 shows the distribution of the interior sources of driver injury in rollover, for belted drivers and for drivers that were not belted but stayed in the cab. Only trucks with conventional

81
cabs are included, though this excluded only seven injuries. A total of 598 driver injuries passed the filter. The distributions in the figures are based on the weighted totals, which are estimates from the sample of crash population totals for the power unit types. (Drivers who were ejected sustained most of their injuries from exterior objects, primarily the ground, but also from the left side of the truck and from contact with the steering wheel or column.) The figure shows the distributions of injuries, rather than drivers; a driver can have more than one injury. All injury severities are included. Most were “minor.” No belted driver had any injuries coded to an exterior contact. Injuries with unknown contact source are excluded in computing the percentages. Non-contact (including fire) and exterior sources are also excluded. (There was a small percentage of exterior contacts for unbelted, not ejected drivers.) Unknown source of injury accounted for 17.0 percent of belted injuries and 26.0 percent of unbelted, not ejected injuries.
0.0 10.0 20.0 30.0
Windshield, front header, sunvisorFlying glass
Steering wheelInstrument panel
Windshield + front header, A pillar etc.Left roof rail
Left side, anyRight roof rail
Right side, anyOther roofSeat back
Belt webbing, buckle, etc.Other interior
PercentBelted Not belted, not ejected
Figure 37 Tractor-semitrailer and Straight Trucks, Cab Interior Contact for Driver Injuries, Rollover
Two over-representations primarily stand out: the first is the amount of contact with the left roof rail and with other left-side interior objects for belted drivers. These left-side contacts accounted for 35.2 percent of belted driver injuries, compared with only 7.5 percent of injuries to unbelted, not ejected drivers. Contact with seat belts accounted for another 25.0 percent of the injuries to belted drivers. Contact with the steering wheel or column accounted for 14.2 percent of injuries to belted driver. Other sources include the instrument panel, roof, seatback, flying glass, and the windshield.
Most injuries coded in these crashes were AIS 1, which are relatively minor. The following table and figure are restricted to AIS 2+ to show more serious injuries. Compare Table 48, which includes all levels of AIS injuries, to Table 49 which excludes AIS 1. Almost 64 percent of AIS

82
2+ injuries to belted drivers in rollover were to the head or face, compared with 38.2 percent when AIS 1 injuries are included. In addition, almost 19 percent of AIS 2+ injuries to belted drivers were to the thorax and the remainder were coded to upper extremities. In contrast, about a third of AIS 2+ injuries were to the head for unbelted drivers in rollover who were not ejected; about a third were to the upper extremities; and 11.8 percent were to the spine.
Table 49 Distribution of Injuries by Body Part Injured, AIS 2+, Belted, Not Belted and Not Ejected, Heavy Truck Rollover, LTCCS Data
Body part injured Belted Not belted, not ejected
Head 52.8 34.4 Face 10.0 0.0 Neck 0.0 0.0 Thorax 18.5 15.9 Abdomen 0.0 0.0 Spine 0.0 11.8 Upper extremities 18.8 31.1 Lower extremities 0.0 1.1 Unspecified 0.0 5.7 Total 100.0 100.0
For belted drivers in these rollovers, the left roof rail was the contact point for almost 40 percent of AIS 2+ injuries. The left side, which includes the A- and B-pillars and left side window glass and frame, account for an additional 36 percent of AIS 2+ injuries. About 10 percent were coded to the steering wheel, 8 percent to the seat back, and almost 7 percent were from some other roof contact. Contact with the roof, driver’s side window and frame account for over 82 percent of belted drivers AIS 2+ injuries. In contrast, unbelted drivers received most of their AIS 2+ injuries from forward structures including the windshield, front header, sunvisor, and A-pillar. Contact with steering wheels accounted for 25.4 percent of unbelted drivers AIS 2+ injuries in rollover, compared with 10 percent for belted drivers. The right side accounted for a relatively small proportion of injuries, 4.2 percent in these data, probably in rollovers to the right.

83
0.0 10.0 20.0 30.0 40.0
Windshield, front header, sunvisorSteering wheel
Windshield, A pillar etc.Left roof rail
Left side, anyRight side, any
Other roofSeat back
Other interiorNoncontact, incl fire
Percent
Belted Not belted, not ejected
Figure 38 Tractor-semitrailer and SUTs, Cab Interior Contact for AIS 2+ Injuries, Rollover, LTCCS Data
It should be noted that a very large majority of the injuries were classified in the AIS as “minor.” About 21.5 percent of injuries were omitted from this analysis because the injury source could not be determined. It is possible that the distributions of injury source would change if these injuries were known and could be included, though injuries with unknown source had about the same distribution of severity as injuries where the source was known.
7.8.2 Injuries in frontal impacts
This section considers driver injuries in frontal collisions, including the body part injured and the source of injury, i.e., the component contacted to produce the injury. As in the prior section, all coded driver injuries are included, not just the MAIS. Driver injury records were extracted from the LTCCS for drivers of tractor-semitrailers and straight trucks with no trailer, GVWR class 7 and 8, and power unit model year of 1995 or later.
Drivers are classified as belted or not belted, no ejection. No drivers were ejected in these collisions.
Table 50 shows the percentage distribution of body parts injured for belted and unbelted but contained drivers in frontal impacts. For belted drivers, the primary body parts injured were the face, lower extremities, upper extremities, thorax and spine. For unbelted but contained drivers, the injury distribution was shifted to the upper part of the body. Injuries occurred to the face, head, upper extremities, and thorax. The lack of lower extremity injury for unbelted drivers is notable. It appears these drivers are thrown up and over the windshield. The rate of head injuries is much higher for unbelted than belted.

84
Table 50 Percent Distribution of Body Part Injured by Seat Belt Use, Frontal Crashes
Body part injured Belted Not belted, not ejected
Head 7.2 23.2 Face 34.2 29.3 Neck 0.5 1.1 Thorax 8.5 10.8 Abdomen 2.8 3.3 Spine 8.2 9.9 Upper extremities 14.8 19.6 Lower extremities 21.0 0.8 Unspecified 2.7 2.0 Total 100.0 100.0
Figure 39 shows the source of injury in frontal impacts by belt use. For belted drivers, the primary interior impact points were the steering wheel, instrument panel, and the belt itself. For unbelted drivers, the primary sources of injury were the windshield and front header, the steering wheel, and the instrument panel. Seat belted drivers hit the interior of the truck that is right in front—the steering wheel, instrument panel, and belt restraints. Unbelted drivers were apparently also thrown in to the windshield, A-pillar, and front header.
0.0 10.0 20.0 30.0 40.0 50.0
Windshield, front header, sunvisorFlying glass
Steering wheelInstrument panel
Windshield + front header, A pillar, etc.Left side, any
Other roofSeat back, head rstrnt
Belt webbing, buckle, etc.Other interior
Exterior objectNoncontact, incl fire
Floor, foot controls
PercentBelted Not belted, no ejection
Figure 39 Source of Injury in Frontal Impacts, by Seat Belt Use, LTCCS Data
The distribution of body parts injured in frontal impacts for belted drivers is substantially different from unbelted drivers. Table 51 shows the distribution of AIS 2+ injuries in frontal impacts. The head and face accounted for over 60 percent of injuries to belted drivers, but only about 40 percent for unbelted. About 10 percent of belted driver injuries were to upper

85
extremities and 25.8 percent were to the lower extremities. Injuries to the extremities accounted for only 5.7 percent of unbelted drivers. However, unbelted drivers had a much higher percentage of injuries to the thorax (21.3%) and spine (30.7%), compared with no thorax injuries and only 3.3 percent of injuries to the spine for belted drivers.
Table 51 Percent Distribution of Body Part Injured by Seat Belt Use, Frontal Crashes AIS 2+ Only, LTCCS Data
Body part injured Belted Not belted, not ejected Total
Head 5.8 39.8 18.4 Face 54.6 0.0 34.4 Thorax 0.0 21.3 7.9 Abdomen 0.0 2.5 0.9 Spine 3.3 30.7 13.4 Upper extremities 10.5 5.7 8.7 Lower extremities 25.8 0.0 16.3 Unspecified 0.0 0.0 0.0 Total 100.0 100.0 100.0
Figure 40 shows the source of AIS 2+ injuries to drivers in frontal impacts. For both sets of drivers, belted and as well as unbelted, the steering wheel was the primary injury source. For belted drivers, seat back/head restraints and the belt itself accounted for most of the remaining AIS 2+ injuries. For unbelted, not ejected drivers, the major sources of AIS 2+ injuries were the windshield/A-pillar; the instrument panel; windshield, front header, sunvisor, and some other interior surface. Both groups sustained injuries from the steering wheel, but the unbelted were also injured by the windshield, front header and instrument panel, while most of the remaining injuries to belted drivers were accounted for by the belts themselves and the seat back or head restraint. An estimated 0.2 percent of seat-belted driver AIS 2+ injuries were from the floor, foot controls category. There were none such coded for unbelted drivers.
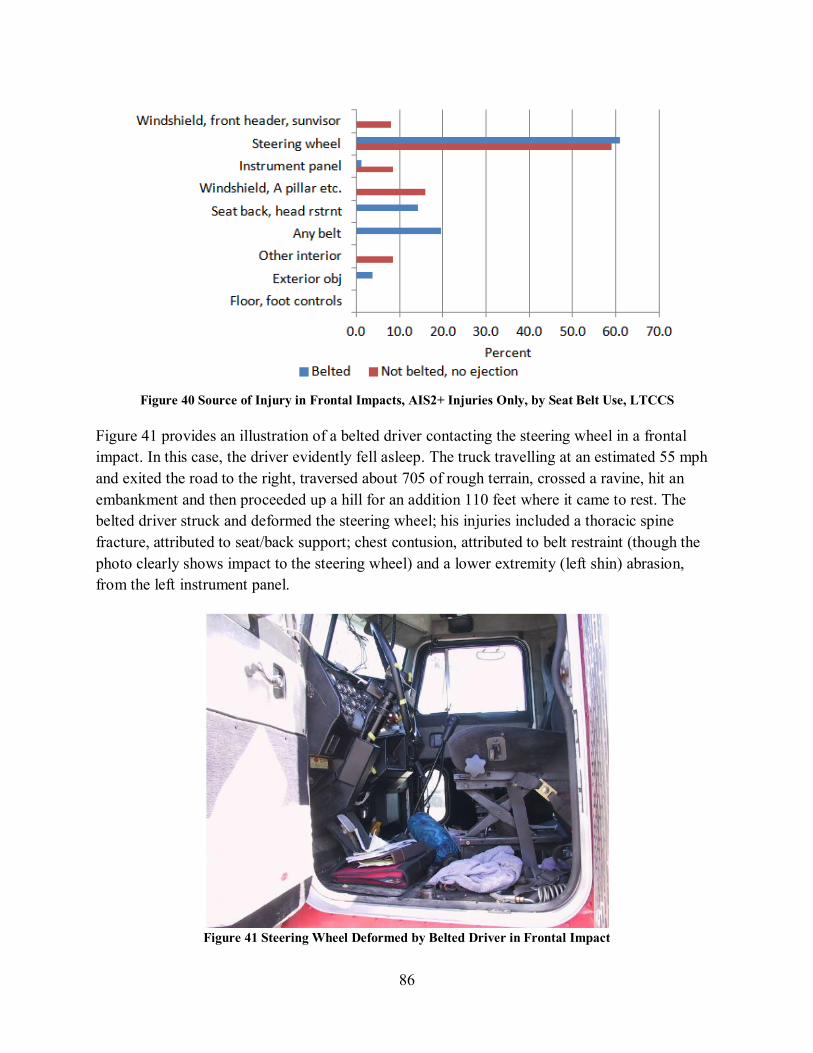
86
Figure 40 Source of Injury in Frontal Impacts, AIS2+ Injuries Only, by Seat Belt Use, LTCCS
Figure 41 provides an illustration of a belted driver contacting the steering wheel in a frontal impact. In this case, the driver evidently fell asleep. The truck travelling at an estimated 55 mph and exited the road to the right, traversed about 705 of rough terrain, crossed a ravine, hit an embankment and then proceeded up a hill for an addition 110 feet where it came to rest. The belted driver struck and deformed the steering wheel; his injuries included a thoracic spine fracture, attributed to seat/back support; chest contusion, attributed to belt restraint (though the photo clearly shows impact to the steering wheel) and a lower extremity (left shin) abrasion, from the left instrument panel.
Figure 41 Steering Wheel Deformed by Belted Driver in Frontal Impact

87
Table 52 provides a comparison of the distribution of injury source in frontal impacts and rollovers. Steering wheels were a prominent source of injury in both crash types, though the percentage of injuries from steering wheels was higher in frontal collisions for both belted and unbelted drivers. The share of injuries from contact with windshields or front headers was higher for the unbelted, compared with belted, in both rollover and frontal crash types. Instrument panels accounted for a significant share of injuries for belted drivers in frontal collision and unbelted drivers in rollovers. Left side and left roof rails accounted for a high share of injuries only for belted drivers in rollover crashes. Right side accounted for a significant share of injuries only for unbelted drivers in rollovers. Injuries from belts themselves were more frequent in rollovers than in frontal collisions.
In rollovers, the primary source of injury is with the sides, steering wheel, instrument panel and belts. In frontal impacts, the primary injury sources are the windshield, steering wheel, instrument panel, and for belted drivers, the right side of the cab.
Table 52 Percentage of Injury Source for Rollovers and Frontals, Belted and Not Belted/Contained
Injury source Belted Not belted/contained
Rollover Frontal Rollover Frontal Windshield, front header, sunvisor 3.0 2.7 8.2 33.3
Flying glass 4.1 0.7 4.7 0.0 Steering wheel 14.2 42.4 16.8 22.6 Instrument panel 7.2 19.1 15.0 9.2 Windshield, A pillar etc. 0.0 0.0 6.3 9.8 Left roof rail 8.7 0.0 0.0 0.0 Left side, any 26.5 5.2 7.5 8.8 Right roof rail 0.0 0.0 8.9 0.0 Right side, any 0.0 0.0 25.3 0.0 Other roof 5.4 0.0 0.0 1.8 Seat back 5.4 6.2 0.5 4.4 Any belt 25.0 16.3 0.0 0.0 Other interior 0.4 5.5 6.6 5.3 Floor, foot controls 0.0 1.9 0.0 4.9 Total 100.0 100.0 100.0 100.0
8 Industry Safety Initiatives and Barriers to Implementation
8.1 Overview
In the late 1980s there was considerable and growing interest in heavy truck safety with Federal agencies, private groups, manufacturers and researchers emphasizing the need to concentrate on heavy truck crashworthiness. In 1991 SAE sponsored a three-phase research program to investigate heavy truck crashworthiness. (Cheng, Girvan et al. 1997) This effort culminated in a

88
set of test procedures to evaluate heavy truck restraint systems, cab interior components and cab structural integrity. The test procedures were formally adopted as SAE Recommended Practices in 1998.
Industry has used SAE Recommended Practice test methods to evaluate cab performance and report that significant improvements in cab strength and integrity have been achieved. At about this time, computer aided design was embraced by the industry which included finite element analysis of cab structures. Discussions with truck manufacturers and knowledge of the industry strongly suggest that over the past 15 years the combination of the SAE J2420 and J2422 test procedures and the improvement of structural analysis methods plus ever-increasing demands for greater cab durability have resulted in significant cab structural integrity improvements. For proprietary reasons, vehicle manufacturers did not share detailed test results but conveyed the information in general terms that cab performance has improved considerably when tested against SAE recommended practice tests since they were introduced. Vehicle manufacturers have introduced various safety options including seat belt buckle sensors and reminders, supplemental restraints for rollover such as seat pull down with side air bag.
Most manufacturers have developed individual proprietary standards for the retention of cabs to chassis for lateral and longitudinal loading, for the retention of articles in the sleeper berths. There have been improved ergonomics of seats, steering wheels, and foot pedals.
While the industry is actively engaged in developing and implementing safety technology, there are unique characteristics within the heavy truck industry that creates barriers to broad acceptance of many of the safety developments as indicated in Table 53 below.
8.2 Barriers to Implementation of Safety Technology
The heavy truck marketplace is fiercely competitive and in general, purchasers are very cost conscious and strategic with their purchasing decisions. Class 7 and 8 trucks are commercial tools that are purchased by business entities who expect a financial return on their investment. Since every trucking operation is unique, truck buyers demand that manufacturers supply highly customized products to suit the specific needs of their operation. Even when manufacturers offer a particular safety feature at no or minimal cost, the purchaser will sometimes require that feature not be included in the build5. For technologies that are more costly, take-rates are low until there is an established level of reliability and effectiveness so that the buyer can calculate a return on investment. As an illustration of this safety equipment deployment challenge, Table 53 contains approximate representative estimates of take-rates for selected safety technologies.
5 Information provided by the Technical Advisory Group, SAE Truck Crashworthiness Committee.

89
Table 53: Estimates of Technology Take-Rate for Safety Technology by Vehicle Class6
Technology Take-Rates (2012)
Class 8 Class 5 - 7 Daytime running lights (varies by manufacturer) Standard * 50% Hood mounted mirrors (varies by manufacturer) Standard * 50% Roll stability or electronic stability control 50% < 5% Lane departure systems <10% Traction control 60% < 15% F-CAM systems including adaptive cruise control – fully installed <5% F-CAM systems including adaptive cruise control – wired only < 20% Steering hub air bags < 5% Pull down seats < 1%
Note - * indicates that about 1 percent of purchasers refuse the standard item. F-CAM systems are Forward Collision Avoidance and Mitigation Systems also referred to as collision mitigation braking systems.
Another barrier to implementation of particular safety technologies is the well-known concern over early adoption. Heavy truck buyers are businesses and the risk of additional maintenance costs or downtime is a major consideration when purchasing decisions are made. Some fleet operators who invest in first generation safety technology sometimes encounter equipment and system reliability problems associated with early adoption that are disruptive to their operations and result in unintended consequences. Over time these problems are usually rectified but the experience makes some purchasers more cautious about early adoption of any new technology. Trucking fleets will often wait until a new technology is proven to be reliable and effective before choosing to invest in it. However even as technologies mature, resistance to implementation appears to be the norm rather than the exception.7
Unlike light vehicles, most commercial drivers have no influence on the vehicle purchasing process including specifying vehicle safety content. Some fleet operators may choose to purchase advanced safety technologies, while others may not, thus potentially resulting in varying levels of safety protection available to heavy vehicle occupants. Of course, truck drivers can choose who to work for and take these safety issues into consideration. However, truck drivers may believe that their vehicles are inherently crashworthy due to their mass relative to other vehicles on the roads, and such perceptions may explain the lower rates for seat belt usage on heavy trucks compared to passenger cars. The analyses in this report have clearly shown that if heavy truck drivers would take full advantage of the most effective safety feature already in the vehicle, the seat belt, many fatalities and injuries would be avoided. Nonetheless, universal
6 Information provided by the Technical Advisory Group, SAE Truck Crashworthiness Committee. 7 Information provided through discussions with American Trucking Associations.

90
adoption of other safety technologies may not occur, or may take a long time to occur, absent regulatory action. Such regulatory action may work towards a more uniform protection for vehicle operators and passengers. However, in addition to the demonstration of improved protection for heavy truck occupants, any regulatory action must be carefully weighed against its potential costs.
9 Countermeasures
This analysis shows that heavy vehicle rollover presents the greatest risk to vehicle occupants. Fully 40 percent of all truck driver injury occurs in events where the truck rolls over and one in eight truck drivers die or receive incapacitating injuries. In contrast when the truck does not rollover 3.9 percent are injured and only one in 167 drivers receive fatal or incapacitating injuries.
Rollover events with belted drivers account for 37 percent of all injured truck drivers while unbelted drivers account for 50 percent. Focusing on severity, one in nine belted drivers die or receive incapacitating injuries while one in three unbelted drivers die or receive incapacitating injuries. The data suggests seat belts are particularly effective at reducing fatalities and incapacitating injuries in rollover events by a factor of three (Section 6.9).
The data also indicate that crashes resulting in fatal and serious injuries to truck drivers are most often high speed events which tend to have high energy content given the mass of the vehicles.8
The relationship of driver injury to events involving truck rollover is a compelling finding that helps to define and prioritize potential countermeasures.
9.1 Increasing the Integrity and Robustness of Cab Structures
It was not possible within the scope of this study to analyze the forces experienced by truck cabs during crash events. However through the course of this research, it has become clear that the high kinetic energy content associated with severe truck crashes results in forces that for the most part, exceed the ability of current structures to resist deformation thereby compromising survival space which heightens occupant injury risk.
Rollover has been found to present the greatest risk to drivers and the analysis of LTCCS showed that cab survival space is often compromised during one quarter rollovers and that it is further compromised in two or more quarter turn events. To the extent cab structures can be strengthened particularly with respect to the mitigation of rollover damage it is likely to provide benefit. The LTCCS revealed that SUTs with tanks or substantial body structures, (see Figure
8 The nonfatal crash data used in this report do not include gross weight at the time of the crash or load condition.
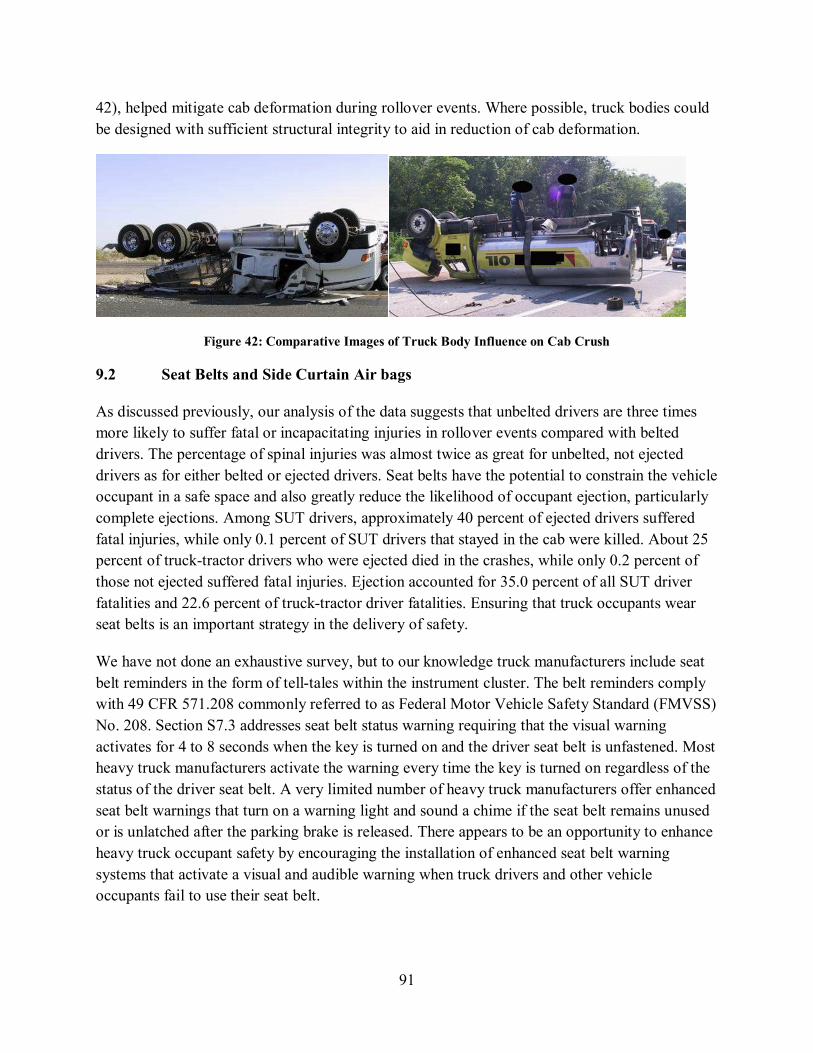
91
42), helped mitigate cab deformation during rollover events. Where possible, truck bodies could be designed with sufficient structural integrity to aid in reduction of cab deformation.
Figure 42: Comparative Images of Truck Body Influence on Cab Crush
9.2 Seat Belts and Side Curtain Air bags
As discussed previously, our analysis of the data suggests that unbelted drivers are three times more likely to suffer fatal or incapacitating injuries in rollover events compared with belted drivers. The percentage of spinal injuries was almost twice as great for unbelted, not ejected drivers as for either belted or ejected drivers. Seat belts have the potential to constrain the vehicle occupant in a safe space and also greatly reduce the likelihood of occupant ejection, particularly complete ejections. Among SUT drivers, approximately 40 percent of ejected drivers suffered fatal injuries, while only 0.1 percent of SUT drivers that stayed in the cab were killed. About 25 percent of truck-tractor drivers who were ejected died in the crashes, while only 0.2 percent of those not ejected suffered fatal injuries. Ejection accounted for 35.0 percent of all SUT driver fatalities and 22.6 percent of truck-tractor driver fatalities. Ensuring that truck occupants wear seat belts is an important strategy in the delivery of safety.
We have not done an exhaustive survey, but to our knowledge truck manufacturers include seat belt reminders in the form of tell-tales within the instrument cluster. The belt reminders comply with 49 CFR 571.208 commonly referred to as Federal Motor Vehicle Safety Standard (FMVSS) No. 208. Section S7.3 addresses seat belt status warning requiring that the visual warning activates for 4 to 8 seconds when the key is turned on and the driver seat belt is unfastened. Most heavy truck manufacturers activate the warning every time the key is turned on regardless of the status of the driver seat belt. A very limited number of heavy truck manufacturers offer enhanced seat belt warnings that turn on a warning light and sound a chime if the seat belt remains unused or is unlatched after the parking brake is released. There appears to be an opportunity to enhance heavy truck occupant safety by encouraging the installation of enhanced seat belt warning systems that activate a visual and audible warning when truck drivers and other vehicle occupants fail to use their seat belt.

92
Side curtain air bags offer side impact protection and ejection mitigation benefits to passenger car occupants. In heavy trucks, side curtain air bags could be a potential countermeasure in rollover events to reduce ejection through the side window and provide lateral head protection.
9.3 Automatic Pull-Down Seats
The automatic seat pull-down system is an active safety technology recently developed by IMMI marketed under the name RollTek. The air-suspended seat incorporates seat belt pretensioners to pull seat belts tight in the event of a crash to reduce occupant movement. In the event of rollover, a roll sensor triggers the seat pull down mechanism which lowers the seat thereby increasing the survival space for the vehicle occupant. It also includes an integrated side air bag depicted in Figure 43.
Figure 43: IMMI RollTek Truck Driver Seat
9.4 Frontal Air bags
Frontal impact in a collision event has been identified as the one of the two collisions types associated with the most serious driver injuries. Frontal collisions account for 28 percent of fatal

93
and serious injury to truck drivers. Cab destruction is also frequently associated with fatal frontal crashes suggesting that a significant number of these fatal crashes are not survivable.
A recent study on seat belt and frontal air bag effectiveness estimated effectiveness rates for air bags at about 4 percent for belted truck drivers and about 6 percent for unbelted truck drivers considering all crash types and assuming that air bags are only effective in frontal and near-frontal truck crashes. The effectiveness estimates were based on the experience of passenger cars and light trucks. Previous research showed little difference in air bag effectiveness between cars and light trucks, so estimates for light vehicles for frontal collisions were applied to trucks. The authors indicated that the overall air bag effectiveness rate is lower for trucks than light vehicles because rollovers, in which air bags should have no effect, account for a significantly higher share of serious injuries in truck crashes than in car crashes (Hu and Blower 2013).
The only other known study of air bag effectiveness is an undated study from Volvo, probably from the mid 1990’s. The study was based on a sample of 94 in-depth crash investigations involving Volvo trucks. Researchers evaluated each crash and estimated the injury-reduction potential of seat belts and air bags. The injury-reducing effect was assessed for each case based on crash sequences, type of accelerations, directions of forces, deformation, and driver injuries. It was estimated that air bags would provide an injury-reducing effect of 21 percent for belted drivers and 8 percent for unbelted drivers. It should be noted that the sample of cases reviewed is relatively small. Moreover, air bag effectiveness estimates for drivers using seat belts was based on only four cases (Volvo n.d.).
Seat belt effectiveness estimates in this report has shown that seat belts are highly effective in reducing K+A injuries. Seat belts were estimated as 70 percent effective in reducing K+A injuries for SUTs and 85 percent effective for truck-tractors. (See Table 34 and Table 35.) Seat belts are clearly the primary means of protecting drivers in crashes. However, it should be noted that, even if seat belts are worn, the analysis of driver injury data in the LTCCS file showed that the steering wheel is the primary source of AIS 2+ injuries (See Figure 40).
It appears that seat belts are largely effective in frontal collisions in reducing the most serious injuries, though there remains a remnant of injuries from the steering wheel that may be addressed by supplemental frontal air bags. However, there is insufficient data to determine if frontal air bags could make a significant contribution to reducing driver injury in class 7 and 8 trucks.
9.5 Crash Avoidance Technology
The deployment of crash avoidance technologies such as electronic stability control (ESC), roll stability control (RSC) (Woodrooffe, Blower, Gordon, Green, Liu, & Sweatman, 2009) and commercial vehicle forward collision avoidance and mitigation systems (F-CAM) (Woodrooffe, Blower et al. 2012) have demonstrated the potential for being effective countermeasures against

94
commercial vehicle rollover, loss of control and truck striking rear end crashes. While these existing technologies are not considered to be relevant to crashworthiness, it is clear that these particular technologies either avoid the crash or reduce impact energies through reduction in vehicle velocity which could result in less impact force on cab structures in frontal (in the case of F-CAM) and rollover (in the case of ESC) events.
This study has indicated a need to reduce the energy in heavy truck crashes. A possible future technology that may provide benefit is automatic brake application coincident with the initial impact event in a crash. Truck crashes tend to occur at speed with high kinetic energy. High energy crashes often include more than one significant event. The first event while it may be significant is not necessarily the most harmful event. Rollover is often the last and most harmful event in the sequence as that data show that it is the event resulting in the greatest vehicle occupant risk. During crash events, drivers could become dislodged from their driving position or otherwise incapacitated and unable to apply the vehicle brakes or steer the vehicle. However, this study did not attempt to evaluate driver actions in maintaining vehicle control during a crash.
10 Conclusions
The safety analysis contained in this report is based on the University of Michigan Transportation Research Institute’s (UMTRI’s) Trucks Involved in Fatal Accidents (TIFA) survey file, NHTSA’s General Estimates System (GES) file and the Large Truck Crash Causation Study (LTCCS). TIFA and GES data years 2006 – 2010 were used in the categorical analysis which represents the bulk of the study effort while the LTCCS data was used for a supplemental clinical review of cab performance in frontal and rollover crash types. Given that LTCCS was completed in 2003, the truck model years used in the supplemental analysis ranged from 1995 to 2003. No other source of more recent model year data was available for case by case analysis. Truck manufacturers have indicated that cab strength has improved significantly since this model year range because of improvements in structural analysis, developments in design and durability analysis however there were no data available to independently verify this finding.
This research project did not investigate forces or accelerations experienced by truck cabs or occupants; however the research clearly identifies crash scenarios and injury mechanisms that can be tied to potential countermeasures including cab strengthening.
For all trucks, there was an estimated 757 truck occupant fatalities per year, about 3,000 A-injuries, and about 7,700 B-injuries. Most of the fatalities occurred in truck-tractors, with an average of 425 per year. SUTs had an average of 324 annually.
Rollover and frontal impact in a collision event have been identified as the collisions types associated with the most serious driver injuries. Rollover and frontal impact in collisions

95
accounted for 72.7 percent of all truck-tractor driver fatalities and A-injuries in crashes. Rollover is the dominant crash mode, with 44.5 percent of fatalities and A-injuries, but frontal collision events account for 28.2 percent. No other crash event comes close to the share of these two crash types.
In events where the truck rolls over one in eight truck drivers die or receive incapacitating injuries. In contrast, when the truck does not rollover one in 167 drivers die or receive incapacitating injuries.
Rollover events with belted drivers account for 37 percent of all injured truck drivers while unbelted drivers account for 50 percent. Focusing on the risk associated with rollover, one in nine belted drivers die or receive incapacitating injuries while one in three unbelted drivers die or receive incapacitating injuries. Seat belts were shown to be particularly effective at reducing fatalities and incapacitating injuries in rollover events by a factor of three.
Ejection is highly associated with the most severe injuries. Among SUT drivers, almost 39.9 percent of ejected drivers suffered fatal injuries, and almost 24.6 percent were coded with A-injuries. Among truck-tractor drivers, 25.4 percent of ejected drivers suffered fatal injuries and an additional 19.0 percent suffered A-injuries. Ejection accounted 35.0 percent of SUT driver fatalities and 22.6 percent of truck-tractor driver fatal injuries.
Seat belt use was shown to virtually eliminate complete ejection for both SUT and truck-tractor drivers (though a small percentage of belted drivers are partially ejected in some crashes). Furthermore, rollover accounts for almost 65 percent of ejected truck-tractor drivers in fatal crashes.
There are challenges to the acceptance of safety technology in the heavy commercial vehicle industry. While vehicle manufacturers offer safety technology beyond that required by the FMVSSs, the purchaser take-rates for these technologies are for the most part very low. Given that most commercial drivers have no influence on the vehicle purchasing process including specifying vehicle safety content, this may tend to slow the adoption of safety protection available to heavy vehicle occupants.
Several potential countermeasures have been identified. Assessment of their potential effectiveness to reduce truck occupant injury and death in traffic crashes as well as their cost-effectiveness is beyond the scope of this study. These countermeasures include:
• Measures to increase seat belt usage. These may include the installation of enhanced seat belt warning systems that activate a visual and audible warning when truck drivers and other vehicle occupants fail to use their seat belt.

96
• Increasing the integrity and robustness of cab structures and the protection of cabs particularly with respect to rollover.
• The installation of side curtain air bags to prevent occupant ejection through the side windows and head trauma.
• Increasing occupant head space during rollover events through installation of automatic pull-down seats.

97
11 References
Cheng, L. Y., Khatua, T. P., Flaherty, B. P., & Girvan, D. S. (1994). Heavy truck crashworthiness. Phase I, task C. Occupant dynamics simulation. (Report No. SAE CRP-009). Warrendale, PA: Society of Automotive Engineers.
Failure Analysis Associates, Inc. (1991). Heavy truck crashworthiness. Phase 1, segment 1. Statistical analysis. (Report No. SAE CRP-009). Warrendale, PA: Society of Automotive Engineers.
Failure Analysis Associates, Inc. (1992). Heavy truck crashworthiness. Phase I, task B. Accident reconstruction. (Report No. SF-R-92-09-09). Warrendale, PA: Society of Automotive Engineers.
Failure Analysis Associates, Inc. (1997). Heavy truck crashworthiness -- Phase III. (Report No. SAE CRP-013). Warrendale, PA: Society of Automotive Engineers.
Federal Motor Carrier Safety Administration. (2005). Shoulder belt usage by commercial motor vehicle drivers executive summary. Retrieved from FMCSA Web site at www.fmcsa.dot.gov/safety-security/safety-belt/exec-summary-2005.htm
FMCSA. (2006). Shoulder Belt Usage by Commercial Motor Vehicle Drivers Executive Summary. Retrieved from FMCSA Web site at www.fmcsa.dot.gov/safety-security/safety-belt/exec-summary-2006.htm
FMCSA. (2007). Safety Belt Usage by Commercial Motor Vehicle Drivers (SBUCMVD) 2007 Survey. Retrieved from FMCSA Web site at www.fmcsa.dot.gov/safety-security/safety-belt/exec-summary-2007.htm
FMCSA. (2008). Seat Belt Usage by Commercial Motor Vehicle Drivers (SBUCMVD) 2008 Survey. Retrieved from FMCSA Web site at www.fmcsa.dot.gov/documents/safety-security/Executive-Summary-CMV-2008-508.pdf
FMCSA. (2009). Seat Belt Usage by Commercial Motor Vehicle Drivers (SBUCMVD) 2009 Survey. Retrieved from FMCSA Web site at www.fmcsa.dot.gov/safety-security/safety-belt/exec-summary-2009.aspx
FMCSA. (2010). Seat Belt Usage by Commercial Motor Vehicle Drivers (SBUCMVD) 2010 Survey. Retrieved from FMCSA Web site at www.fmcsa.dot.gov/safety-security/safety-belt/exec-summary-2010.aspx
Hu, J., & Blower, D. (2013). Estimation of Seatbelt and Frontal-Airbag Effectiveness in Trucks: U.S. and Chinese Perspectives. Ann Arbor, MI: UMTRI.
Jarossi, L., D. Hershberger, and Woodrooffe, J. (2012). Trucks Involved in Fatal Accidents Codebook 2010. Ann Arbor, MI: UMTRI.
Kahane, C. S. (2000, December). Fatality reduction by safety belts for front-seat occupants of cars and light trucks: Updated and expanded estimates based on 1986-99 FARS data. (Report No. DOT HS 809 199). Washington, DC: National Highway Traffic Safety Administration. Avaiulable at www-nrd.nhtsa.dot.gov/Pubs/809199.PDF
NHTSA. (2011a). 2010 Fatality Analysis Reporting System (FARS) Coding and Validation Manual. (Report No. 811 530). Washington, DC: Author. Available at www-nrd.nhtsa.dot.gov/Pubs/811530.pdf
NHTSA. (2011b). National Automotive Sampling System (NASS) General Estimates System (GES) 2010 Coding and Editing Manual. (Report No. 811 531). Washington, DC: Author. Available at www-nrd.nhtsa.dot.gov/Pubs/811531.pdf

98
NHTSA. (2013). National Automotive Sampling System (NASS) General Estimates System (GES) Analytical Users Manual 1988-2010. (Report No. DOT HS 811 532). Washington, DC: Author. Available at http://www-nrd.nhtsa.dot.gov/Pubs/811532.pdf
NHTSA & FMCSA. (2006a, June). Large Truck Crash Causation Study Analytical User’s Manual. Washington, DC Authors, .
NHTSA & FMCSA. (2006b, June). Large Truck Crash Causation Study Codebook. Washington, DC Authors.
NHTSA & FMCSA. (2012). Large Truck Crash Causation Survey Case Viewer. (Online Web site search tool). Retrieved from www-nass.nhtsa.dot.gov/nass/ltccs/SearchForm.aspx
Parnell, T. K., L. Y. Cheng, Khatua, T. P., Day, S., & White, C. (1996). Heavy truck 180-degree dynamic rollover and static roof crush simulation. (Report commissioned by the Society of Automotive Engineers). Menlo Park, CA: Failure Analysis Associates [since 1998 known as Exponent, Inc.].
Pickrell, T. M. & Ye, T. J. (2010). Seat Belt Use in 2010 - Overall Results. (Traffic Safety Facts Research NoteReport No. DOT HS 811 378). Available at www.trafficsafetymarketing.gov/newtsm/op-ciot/811378.pdf
Society of Automotive Engineers. (2003a). J2420 – COE Frontal Strength Evaluation—Dynamic Loading Heavy Trucks.(Issued January 1998, revised December 2003). Warrendale, PA: Author.
SAE. (2003b). J2422 Cab Roof Strength Evaluation – Quasi-Static Loading Heavy Trucks. Warrendale, PA: Author.
United Nations Economic Comkmission for Europe. (2011). Regulation R29.03: Uniform Provisions Concerning the Approval of Vehicles With Regard to the Protection of the Occupants of the Cab of a Commercial Vehicle. Geneva: Author.
Volvo (n.d.). Accident Investigation: Accidents involving Volvo Trucks resultsing in driver injury, and estimated effect of the SRS-Airbag. Gothenburg, Sweden: Author.
Woodrooffe, J., Blower, D., Bao, S., Bogard, S., Flannagan, C., Green, P. E., & LeBlanc, D. (2012). Performance Characterization and Safety Effectiveness of Collision Mitigation Braking and Forward Collision Warning Systems for Medium/Heavy Commercial Vehicles. ( Report No. UMTRI-2011-36). Ann Arbor, MI: University of Michigan Transportation Research Institute.
Woodrooffe, J., Blower, D., Gordon, T., Green, P. E., Liu, B., & Sweatman, P. (2009). Safety Benefits of Stability Control Systems for Tractor-Semitrailers. (Report No. DOT HS 811 205). Washington, DC: National Highway Traffic Safety Administration.
Zaloshnja, E., & Miller, T. (2007, March). Unit Costs of Medium and Heavy Truck Crashes. (Report No. FMCSA-RRA-07-034). Washington, DC: Federal Motor Carrier Safety Administration.

DOT HS 812 061 May 2015
10847-051215-v4