heterogeneity shifts d member - www … · stock) of diversity, disregarding that on going...
TRANSCRIPT

1
HETEROGENEITY SHIFTS DUE TO MEMBER
MOBILITY: NEW INSIGHTS ON DIVERSITY AND
PERFORMANCE
August 14, 2005
Johannes M. PENNINGS Filippo Carlo WEZEL
Department of Management Wharton School
Locust Walk Suite 2000 Steinberg Hall-Dietrich Hall
Phone +1 215 898 7755 [email protected]
Department of Organization and Strategy
Tilburg University P.O. Box 90153, 5000 LE Phone +31 13 466 3260
Acknowledgements The authors contributed equally. Much of the original data was collected as part of a research project (with financial support from the Limpberg Institute) conducted by Willem Bujink, Steven Maijoor, Arjen van Witteloostuijn, and Maurice Zinken, NIBOR, Department of Economics, Maastricht University, the Netherlands. A special thank goes to Rahul Patel, Drexel University, who provided excellent data management assistance. Gino Cattani, initially involved in the project, greatly contributed to the development of this paper. We also thank Paul Almeida, Sigal Barsade, Donald Hambrick, Jackson Nickerson, Gordon Walker, the participants of the 19th 2003 EGOS conference, the 2004 Organization Science Winter Conference, and the 2004 Academy of Management. All errors remain our responsibility.

2
HETEROGENEITY SHIFTS DUE TO MEMBER MOBILITY:
NEW INSIGHTS ON DIVERSITY AND PERFORMANCE
ABSTRACT Organizational demography is often invoked as a driver of firm performance. Heterogeneity
taxes the collective decision-making of members, undermines the firm’s esprit de corps and
impedes its effective functioning. Three main limitations have characterized the literature on
demographic diversity. First, the theory remains inherently static. Second, its empirical
assessment have been confined short run predictions. Third, the consequences of within-firm
organizational demography for between-firm competition have rarely been explored. This
paper addresses these shortcomings by focusing on inter-firm mobility to detect the intra
and inter-firm implications of demographic diversity on long run performance – which we
measure in terms of hazard of organizational dissolution. At the organizational level, we do
not find seemingly symmetrical effects in that an increase in heterogeneity is harmful, while a
reduction is not; at the inter-firm level the up-tick versus reduction in demographic overlap
among firms does reveal a symmetric effect.. By and large, inter-firm effects appear more
robust than the intra-firm consequences in predicting long run organizational performance.
Key words: Organizational Demography; Inter-firm Mobility; Competitive
Interdependence.

3
INTRODUCTION
The study of organizational demography in general, and that of top management
teams in particular, has often been examined as a major precursor to strategic positioning
and organizational outcomes (e.g., Finkelstein and Hambrick 1996; Hambrick et al. 1996).
Similarly, turnover, that is, exit and entry of members as additions or depletions of human
capital has received a good deal of attention as determinants of firm performance (e.g.
Pfeffer, 1994; Harris and Helfat, 1997). Demography and member mobility have rarely been
combined, however, in some additive or interactive way to explain organizational outcomes.
The investigation of the long-term performance (e.g., survival) implications of diversity, both
at the firm and the inter-firm levels, due to member mobility is the theme of the present
empirical study.
Specifically, we focus on three under-explored issues in organizational demography
research: (i) the dynamics of demographic diversity variations within firms, (ii) the influence
of demographic variation on the competitive overlap among firms, and (iii) the long term
consequences of the abovementioned intra and inter-firm demographic variations. First,
much of the research to date investigating the performance consequences of demographic
diversity is static and remains silent on shifts or discontinuous changes diversity due to
absorption of new members. Empirical research has focused on the study of the levels (i.e.,
stock) of diversity, disregarding that on going recruitment may reduce or increase the
current stock. Researchers have noticed that focusing demographic diversity flows allows a
more appropriate truthful investigation of the underlying mechanisms of the theory (e.g.,
Carroll and Harrison, 1998). A dynamic theory should then focus on the impact of
demographic diversity variations (either positive or negative) on organizational performance.
In the present paper examines inter-firm mobility of key members (e.g., CEOs, top
managers) as shocks to the established levels of diversity.

4
Second, firms in fact do not exist in a vacuum but are part of a sector, market and
strategic group. Inter-firm level research has not been paired with demographic aspects even
as one would presume that shifts in heterogeneity would have “implications for firm
performance beyond its consequences for internal group processes” (Sørensen, 1999b: 718).
Much of the pertinent work to date has dealt with the composition of top management
teams ( teams) As “managers operate on mental representations of the world and those
representations are likely to be of historical environments rather than current ones” (Kiesler
and Sproull, 1982: 557), overlapping management teams demographic attributes are likely to
proxy strategic similarity among competitors. For instance, if firms are similar
demographically, their managers are likely to exhibit similar mental models and thus to
converge in decision-making (Pegels et al., 2000). Thus, several inferences regarding
demographic variables within firms could also be used to study the implications of
competitive overlap between them. In this case too, the between-firm consequences of
overlapping managerial characteristics are likely to vary depending on the type of variation
(either positive or negative) induced by the mobility event.
Third, top management team research has mainly focused on short-run outcomes as
proxied by accounting measuressuch as ROI, failing to include long-run organizational
performance measures such as growth and survival. To move towards a dynamic theory of
demographic diversity, longitudinal research designs investigating the long-term implications
of variations in demographic heterogeneity are needed (Boone, Wezel and van
Witteloostuijn, 2006) Although Hambrick and Mason’s model (1984) speculated on the
impact of within-firm diversity on long run performance, empirical research has rarely
investigated this issue (for two exceptions see Hambrick and D’Aveni, 1988 and 1992). Note
that diversity might either hamper current coordination and alignment of members seeking a
common frame of reference or joint decisional commitment. It might also have long term
5
repercussions in that heterogeneous teams are less likely to settle into a set of lasting,
persistent routines, practices and a collectively ingrained body of knowledge.
We claim that demographic diversity variations may affect organizational survival
also by reducing or augmenting competitive overlap among firms. A set of teams that differ
significantly form each other are more likely to diverge from each other and will focus on
rather different strategic issues and challenges. Consider in fact that ecological theories of
organizations inform us that competition unfolds when overlap (measured along different
characteristics among which socio-demographic ones, see e.g., Rotolo and McPherson, 2001)
increases.
The present paper elaborates on these three points to theorize on the survival
consequences of intra- and inter-firm demographic of demographic variations of Dutch
accounting firms over the period 1880-1986. The paper is organized as follows. The next
section presents the theory. Section 3 describes the empirical setting, the data, and the
independent and control variables, respectively. Section 4 describes the model and the
method we employ to test the hypotheses. Results are shown in Section 5. The discussion of
the main implications of the analysis and the conclusions are presented in Section 6.
2. THEORY Organizational Implications
The focus on “people” as a critical component of firms is hardly new (e.g., Cyert and
March, 1963; Pfeffer, 1994). However, firm membership embodies a configuration of skills,
experience, and social contacts that are specialized towards the market segments or sectors
in which a firm operates. Differences among members partly reflect differences in their
backgrounds, such as prior career development across firms. This diversity matters because
it can at once hinder or enhance organizational performance. For example demographic
differences among the members might challenge the alignment to such a degree that much

6
energy gets diverted form the tasks at hand, and that substandard outcomes on a variety of
performance criteria ensues. Diversity challenges coordination and alignment of the
membership. Diveristy also produces differences in cognitive perspectives and behavioural
dispositions that render the firm strongly embedded in its strategic position and long term
trajectory. The short term and long term implications of team diversity formed one of the
key motivations of this paper. .
Research on upper echelons (Hambrick and Mason, 1984) has elaborated on the
diversity-performance link under the assumption that organizations mirror the values, goals,
and experiences of their pre-eminent members. Managers’ demographic profiles enter into
the performance argument because their characteristics are presumed to occasion
psychological dispositions and subsequent strategic choices (e.g., Hambrick and Mason,
1984). Characteristics such as gender, age, and tenure affect managers’ decisions and actions
through three different filters (see Hambrick and Mason, 1984). First, their background
delimits the problems and information by which their attention is attracted. Second, selective
perception occurs because managers devote disproportionately more attention to the stimuli
in their field of vision. Finally, the information they receive is filtered through their cognitive
lenses. The degree of heterogeneity in demographic characteristics typically amounts to a
“proxy for cognitive heterogeneity, representing innovativeness, problem-solving abilities,
creativity, diversity of information sources and perspectives, openness to change and
willingness to challenge and be challenged” (Finkelstein and Hambrick, 1996: 125). As a
result, teams with high variability in their demographic attributes typically have different
schemata or ways of seeing the world (e.g., Michel and Hambrick, 1992).
The literature on managerial cognition supports this claim, as documented by
empirical studies regarding the influence of managerial cognition on strategic decision-
making (e.g., Tripsas and Gavetti, 2000). A common conclusion of this research holds that
“managerial work experience shapes managerial cognition” (Adner and Helfat, 2003: 1022).

7
Demographic heterogeneity enters into the fray because divergent mental frames produce
cognitive and attitudinal heterogeneity among organizational members by alternatively
interfering with intra-group communication (e.g., Lawrence 1997; Zenger and Lawrence,
1989); exacerbating internal conflict (Jehn et al., 1999); increasing the time required to reach
decisions (Hambrick, Cho and Chen, 1996); lowering adherence to budget and schedule
(Ancona and Caldwell, 1992) or decreasing strategic consensus (Knight et al., 1999).
Furthermore, since tenure heterogeneity diminishes social integration, organizations might
also experience higher turnover rates (e.g., O’Reilly et al., 1989; Wiersema and Bird, 1993).
Recent reviews of the literature have underscored the multifaceted nature of the
relationship between demographic heterogeneity and performance (Guzzo and Dickson,
1996). A positive heterogeneity effect was found for highly complex, uncertain tasks, such as
those facing a top management team, for which “informational diversity should theoretically
be more beneficial than in routine tasks” (Barsade et al., 2000: 809). Others studies found a
positive relation between managers’ diversity and (firm or group) performance for tasks
requiring creative problem solving and innovation (e.g., Bantel and Jackson, 1989;
Eisenhardt and Schoonhoven, 1990). While this discrepancy in research on the effects of
team diversity on performance reflects the more general issue of whether demographic
variables are good proxies for cognitive variables in predicting team outcomes (Lawrence,
1997; Kilduff et al., 2000), the specific outcome of interest might partly explain these
seemingly conflicting findings.1 Most of the extant research, however, has yielded results
slanted towards a negative conclusion: demographic heterogeneity is detrimental to firm
performance (e.g., Smith et al., 1994; Keck, 1997; Boone et al., 2004). That research has also
bene largely cross sectional, thus precluding insights into shifts in diversity. Such shifts
should be revelatory in their effect on performance, representing a quasi experimental
manipulation. 1 It is worth noticing that the setting in which we carry out our test is marked by relevant routine based problem solving (see Maister, 1993).

8
An important yet unanswered question concerns, therefore, the “variations in the
demographic composition of groups” (Williams and O’Reilly III, 1998: 120). Answering this
question would help clarify the nature of the relation between demographic heterogeneity
and performance – whether at the group or the firm level. Although the investigation of the
diversity-performance relation has involved levels (i.e., stock) of heterogeneity, the theoretical
rationale for its harmful effects pertains to the costs of recruitment into the firm (i.e., inflows)
(see Pfeffer, 1983). We agree with Carroll and Harrison (1998: 658) that “a major source of
this diversity comes from the disruption by newly entering individuals.” As heterogeneity
variations produce differences in social integration, communication, and strategic consensus,
the recruitment of new members winds up affecting (increasing or reducing) such
differences. Such recruitment effects occur because of the correspondence between
demographic and cognitive heterogeneity. A recruit’s propensity to embrace the firm’s values
and norms is proportional to the demographic fit with the recipient organization. Unless
newcomers overlap demographically with the roster of people they are joining, their
collective ability to function effectively becomes compromised.2
Theoretical and empirical research in organizational demography of top management
teams has already pointed out that the demographic diversity engenders a downward spiral
of failure (Hambrick and D’Aveni, 1992; Stewman, 1988). Departing from the above
evidence that management team heterogeneity reduces short-term performance,
compositional deterioration will follow due to the inability of attracting new talents.
Retaining valuable executives becomes increasingly difficult because stars are likely to exit
when organizations perform poorly (Groysberg and Nanda, 2002). Increases in demographic
diversity severely threaten the long-term effectiveness of teams. Consider, for instance, that
2 A vast literature initiated by Schneider (1987) examines how top management teams – through ‘cycles’ of attraction, selection and attrition – become increasingly homogeneous. That is because social groups, such as top management teams, have the tendency to reproduce themselves by the selective recruitment of similar people and by facilitating the turnover of dissimilar ones, a process labeled “homosocial reproduction” by Kanter (1977). Adopting this perspective, Boone et al., 2004 for instance have shed light on the short run negative consequences of avoiding this social norm.
9
within-group cooperation is sustainable when people trust each other and deviance from
reciprocity can easily be monitored and sanctioned (Campbell, 1994). Group heterogeneity
however impedes trust and reciprocal altruism in groups (Ruef et al., 2003; Boone, Wezel and
van Witteloostuijn, 2006). Last but not least, a “team of divergent composition may be seen
as incompetent or ill-suited […] causing stakeholders to withdraw or restrict their support
for the organization” (Hambrick and D’Aveni, 1992: 1463). All in all, positive variations of
demographic diversity may trigger a cascade of unforeseeable events increase the risk of
organizational failure. This line of reasoning remains consistent with the insights of
Hambrick and Mason (1984 see Figure 2: 198; see also the recent review of Carpenter et al.,
2004: 751). Because socialization processes, communication and trust depend on the
matching between new entries and the existing team, then new member inflows that
augment group heterogeneity increase the risk organizational failure; conversely, inflows that
further homogenize such a group are beneficial for survival. Accordingly, we hypothesize:
H1a: When key member inflows raise demographic heterogeneity, the hazard of
organizational failure increases.
H1b: When key member inflows decrease demographic heterogeneity, the hazard of
organizational failure declines.
Competitive Implications
Demographic variables however inform us on the mental models of decision makers
that do play a key role in shaping competitive relationships. Mental models have been
demonstrated to influence the way managers perceive their environment (e.g., Porac et al.,
1989; Reger and Huff, 1993) and the strategic actions they take (Thomas, Clark and Gioia,
1993). Mental models can be inferred from demographic variables because managerial
knowledge structures are formed on the basis of differences in origins – e.g., experiences or
10
demograp[hic background (Walsh, 1995). Pfeffer (1983) for instance suggests that
individuals from similar age cohorts exhibit similar values and beliefs. Demographic
characteristics are also critical in influencing the strategic positioning of firms (Finkelstein
and Hambrick, 1990); their degree of diversification (Michel and Hambrick, 1992), and
internationalization (Carpenter and Fredrickson, 2001; Sanders and Carpenter, 1998); and
the propensity, speed, and scope of their competitive response (Hambrick, Cho and Chen,
1996). Furthermore, long-tenured managerial teams follow more persistent strategies and
select strategies committed to the status quo (Hambrick et al., 1993; Finkelstein and Hambrick,
1990). As the profiles of senior organizational members influence the selection of the firms’
prevailing patterns of actions, their demographic characteristics “provide vital information
on a firm’s preference for environmental niches to compete and on the likelihood of success
in the chosen market niches” (Pegels et al., 2000: 914).
A theory concerned with the impact of inter-firm mobility on demographic diversity
and firm performance should then take into account that firms are embedded in a set of
competitively interdependent peers. While it is widely understood that firms do not operate
in a social vacuum, “organizational demographers attribute no causal or mediating force to
the demographic characteristics of other organizations” (Sørensen, 1999b: 714). As a result,
the transfer of people inevitably affects the degree of demographic similarity among firms
and investigations should be extended beyond the focal firm and the evolving demography
of its team of top decision makers.3
Numerous studies have pointed to the inter-firm implications of demographic
heterogeneity (Boone et al., 2004; Keck and Tushman, 1993; Lawrence, 1997). Managers
with equivalent demographic characteristics typically exhibit ‘attentional homogeneity’ – i.e.,
3 Inter-firm mobility, of course, is not the only mechanism stimulating the emergence of shared perceptions of the competitive environment. As Reger and Huff (1993: 106) note, however, hiring from the same labor pool is an important avenue through which company managers interact with each other – besides participations to industry associations and other gatherings, access to similar sources of information such as trade publications, or employment of the same conultants.
11
similarity in the mental models regarding their sector and its incumbents (Abrahmson and
Hambrick, 1997). Convergent and analogous views of the competitive environment in turn
affect resource allocation and other strategic decisions (Sørensen, 1999b). Demographically
akin managers among peer firms express higher levels of mutual awareness, and tacitly or
explicitly mimic their strategic choices (see Pegels et al., 2000; Skaggs and Youndt, 2004).
Firms with demographically similar team members exhibit higher levels of strategic similarity
and hence competitive interdependence. That is because “a cohort is the societal exeriences
that have been imprinted on its members and have helped to shape their values and
perceptions” (Hambrick and Mason, 1984: 202), and cohorts of managers exposed to similar
historical environments share similar mental models (Kiesler and Sproull, 1982).
The argument regarding organizational demography and performance, therefore, takes
on a different twist here because also inter-firm demographic differences matter. Consider
for instance research on organizational ecology and niche overlap (McPherson, 1983;
Hannan and Freeman, 1989). A vast literature in organizational ecology demonstrated how
competitively interdependent firms act locally on some specific dimensions, with intensity
being greater if overlap occurs more locally. McPherson (1983) argued that the competition
between two voluntary organizations for new recruits is proportional to their socio-
demographic similarities. Baum and Singh (1994) showed that overlap between segments of
the child-care population produced higher failure levels.. Similar findings have been found
regarding technological (Podolny et al., 1996) and geographical (Baum and Mezias, 1992)
overlap. As firms with demographically similar members share similar strategic orientations
(for a review see Carpenter et al., 2004), we expect them to vie for the same resources and to
face stiffer competition. In contrast, dissimilarity produces divergent mental dispositions
among them and results in a strategic pursuit of diverse niches or segments (Pegels et al.,
2000). Thus, increases in demographic similarity intensify competition by generating
similarity in decision-making and in resource requirements (Sørensen, 1999b). Conversely,
12
demographic distance among firms creates more room for acting unilaterally. As before, a
strict test of the theory would suggests that increases in inter-firm demographic similarity
due to personnel inflows raises the risk of organizational failure, whereas the opposite holds
true for decreases in similarity:
H2a: When key member inflows raise demographic similarity among firms, the hazard of
organizational failure increases.
H2b: When key member inflows decrease demographic similarity among firms, the hazard of
organizational failure declines.
Both sets of hypotheses will thus be tested by linking diversity with survival. Diversity will
be treated here as an ecologically relevant concept by asserting that a firm’s leadership team
will be locked in strategically, for example by entrenchment into a collective mindset and
widely shared routines. While short term implications of diversity have dominated the
research on top management team research, we position this study very much in terms of
how diversity drives teams to be locked into a certain mold, depending on degree of
heterogeneity of its membership.
3. EMPIRICAL SETTING
Our empirical setting is the Dutch accounting sector during the period 1880-1986.
These firms are either single proprietorships or partnerships. Typically, partnerships
comprise partners or owner-managers and employees, often called associates. As owner-
managers, the partnership is more or less heterogeneous and shares many characteristics
with a top management team of small or medium sized corporations that have been the
focus of TMT (top management team) research tradition. . Several of our partnership
measures were constructed at the sub-population level of analysis– i.e., at the provincial level

13
and not at the national one. Previous research has shown how significant institutional
differences and the localized nature of competition in this industry make the province the
relevant level of analysis (for discussion, see e.g., Cattani, Pennings and Wezel, 2003). Each
province represents a distinct selection environment and becomes a key aspect for
measuring the localness of tenure. Within this sector, firms are embedded in geographic
entities with clear political, physical and administrative boundaries that contain institutional
and socio-economic properties, and are endowed with regional resources.
Provinces are also distinct for historical reasons, dating back to the 16th century. For
example some provinces participated in the Reformation and are largely protestant, while
others are more roman-catholic. Separated by rivers seas and other physical dividers, they are
linguistically set apart with one province, Frisia, even possessing its own official language,
Frysk. The provinces are not merely administrative units but are also historically, culturally,
institutionally and economically distinct. Although their significance is declining, they have
been critical in determining the current administrative structure of the Netherlands (Centraal
Bureau Statistiek, 2002). This suggests that geography matters for organizational activity such
as recruitment and service delivery, because firm embeddedness is largely local and, as an
institutional-competitive environment, provinces still hold sway (de Pree, 1997).
Figure 1 shows that the Dutch accounting industry remained fairly fragmented
during the window of our study. Due to their small size, many organizations compete at the
local (province) level and their critical resources (e.g., talented professionals and new clients)
are local as well. Some larger firms have over time expanded their geographic scope beyond
the provincial boundaries, yet the province is clearly the relevant environment for most of
these professional service firms. Given the central relevance of the local environment, we
chose local industry tenure as the dimension along which we measured demographic
heterogeneity and restricted the analysis to inter-firm mobility between firms located within
the same province – for a detailed explanation, see below. Our choice was premised on the

14
consideration that local experience, more than industry or firm experience, is a more
plausible proxy for managers’ mental models and strategic decision-making.4
---------------------------------
Insert Figure 1 about here
--------------------------------
Data
Data consist of information about individual professional accountants and their
organizations and were collected from the membership lists (or directories) of accountant
associations with one- to five-year gaps or intervals. Pennings, Lee and van Witteloostuijn
(1998) provide a comprehensive description of the sources. The percentages of our temporal
gaps are: 1year: 24%, 2years: 60%, 3years: 6%, 4years: 8%, 5years: 2%. This is clearly an issue
if we wish to map properly upticks and downticks of demographic diversity both within and
between firms. As we explain in the model section (see below), however, we controlled for
the different length in the intervals by creating a variable accounting for diverse time spans.
The membership lists provided information on the name, address, background education
and status (partner or associate) of each professional accountant within the association. We
reconstructed the histories of individual organizations by aggregating individual level data to
that of the firm. The data cover the entire population of Dutch accounting firms during the
period 1880-1986. In building the dataset, we considered the year in which the organization
appeared for the first time on the Register of Accountants as the founding year, whereas the
last year of appearance as the year of dissolution. We coded our dichotomous dependent
variable as 0 if the firm was still in existence in a given year and 1 once it exited the risk set.
4 Although seemingly arbitrary, the choice of using a measure of industry tenure is coherennt with a vast body of research in organizational demography (for an overview see Carpenter et al., 2004). Moreover, Finkelstein and Hambrick (1990: 492) have shown how this measure highly correlates with firm-level measures such as tenure in position and top-management team tenure. In the concluding section we further discuss this issue.
15
This notion is consistent with that proposed by Boone, Bröcheler and Carroll (2000) and by
Phillips (2002) who defined it as exit from the market, without distinguishing between
bankruptcy and merger or acquisition.5
The concern here is with the survival implications of hiring new members as partners
rather than associates. With their dual stratification, accounting firms have a dual stratification
with the top echelon endowed with superior human and social capital. The effects of
member entry on strategic conduct should be higher when the recruitment of new
organizational members involves partners. Partners are the owners of the firm. As such they
have a greater incentive to use their human capital for the growth of an organization than do
associates. Partners are more critical for a firm’s performance and survival as they have
greater influence on organizational outcomes (Galanter and Palay, 1991). Partners are
responsible for the overall management of accounting firms. Their decision-making power
extends to the task of building/changing routines, such as those dealing with hiring and
firing policies, procuring work and deploying junior professionals, differentiation (i.e., to
hedge against market shrinkage), investment, personal financial planning, and liability
insurance premium decisions (for more details see Maister 1993). The partners’ social capital
is thus more germane to the organization’s profit potential than that of the associates (see
Pennings et al. 1998). Thus, the recruitment of new partners often entails a shift in the
competitive landscape within which firms compete.
Independent Variables
5 Since “failure, in the sense of bankruptcy, cannot be observed in the audit industry and, therefore, cannot be distinguished from other types of exit” (Boone, Bröcheler and Carroll, 2000: 368), organizational dissolution encompasses different types of exit, ranging from the case where a single proprietorship vanishes as its owner is no longer listed in the C.P.A. (i.e., certified professional accountant) directories, to the case of dissolution by acquisition (but the professional accountants of the acquired organization kept working under the acquiring organization), to the case of dissolution by merger between two or more organizations – but see results section for an alternative specification. It should be noted that survival is a stochastic proxy that measures a firm’s risk of dissolution and is more encompassing than more immediate and concrete expressions of organizational effectiveness (e.g., Meyer and Gupta, 1994). The probability of dissolution entails an ongoing development of the firm’s health or viability, rather than the achievement of some other performance targets. In this respect, survival may be considered as context and time neutral, whereas targets as arbitrary and period idiosyncratic.
16
The inflow of key members (here, partners) is likely to affect the level of
demographic heterogeneity of the recipient firm. Due to the critical role of localized
networks and knowledge in our industry (see Smigel, 1969), we measured our construct
in terms of local experience. As we highlighted before, the province is the main
competitive arena for these firms. That is why we chose the length of service or tenure
within the focal ‘province’ as a proxy for managers’ demographic characteristics. It is
reasonable to believe that this measure captures the processes of interest here. Our
reasoning implies that two partners or managers with similar organizational and
industrial tenure will exhibit similar mental models and knowledge. Under these
circumstances, “[M]easures based on team tenure therefore potentially underestimate the
extent to which managers are similar” (Sørensen, 1999b: 727). In other words, whenever
partners join another firm the variable would take on the value 0, regardless of their level
of prior experience. This means treating all partners as if they were the same – thereby
ignoring their experience differences – every time they start working for a different firm.
Our choice of local tenure as the unique dimension along which we measure
demographic heterogeneity remains, however, grounded in theoretical reasoning. As
“managers operate on mental representations of the world and those representations are
likely to be of historical environments rather than current ones” (Kiesler and Sproull, 1982:
557), cohorts of managers exposed to similar historical environments share similar mental
models. Tenure implies socialization and mental programming, and the longer its duration,
the more paramount its mental and attitudinal effects. On the premise that ‘localness’ is a
valid attribution of strategic grouping, local tenure is specific and idiosyncratic to the
common fate of firms associated with its strategic groups. Local tenure, and by implication
indigenous or “native” experience, makes the firms’ members more knowledgeable about
current market conditions and future trends, and also instils competitive awareness among
them. When staffing involves such local occupational seniority and equivalence in experience
17
and socialization, the stronger the mutual awareness, the higher the intensity of rivalry
between firms. Moreover, an important strength of this measure is its focus on survival
consequences of demographic equivalence among peer firms. Long-tenured managerial
teams in fact have been shown to engage in persistent strategies and to select policies more
committed to the status quo (see Hambrick et al., 1993; Finkelstein and Hambrick, 1990).
Organizational demographers measure the level of tenure heterogeneity employing
the coefficient of variation – i.e., the ratio of the standard deviation of tenure to its mean. By
aggregating this measure, however, two main problems emerge. First, while this
standardization improves comparability across organizations, it comes “at a minimum price
of interpretive ambiguity” (Sørensen, 2002: 478). Models that use the coefficient of variation
alone risk confounding the differential effect that the mean and the standard deviation might
have on social processes. Second, when averages are computed using lower-level (e.g.,
managers) data, researchers implicitly adopt an “additive” model – i.e., the aggregate or
higher-level measure is just a summation of the lower-level units regardless of the variance
among these units (see Chan, 1998). By contrast, the standard deviation is a more
appropriate measure of heterogeneity because it overcomes the aggregation bias by
computing the distance between individuals, irrespective of the mean (Barsade et al., 2000).6
To test Hypotheses 1a and 1b, the variations in the value of the standard deviation
for local tenure was adopted. For each firm we first calculated the standard deviation of the
number of years the partners spent within the focal province. In particular, we captured the
evolving nature in local tenure heterogeneity by creating a time-varying variable – Tenure
Heterogeneity – which measures the change in the value of the standard deviation in tenure
that can be attributed to the entry of new partners only. We excluded endogenous diversity
6 In analyses not reported here we controlled for the stock of mean tenure due to new entries. It turned out that mean increases were positively related to organizational dissolution. This finding is in line with recent findings (e.g., Sørensen, 1999b) and may be interpreted as an indicator of the risks associated to strategic persistence (Finkelstein and Hambrick, 1990). The qualitative conclusions of the paper remained unaffected by the inclusion of this additional control.

18
shifts – for example changes due to partner death, retirement or simple exit. We calculated
the variable net of the natural increase (i.e., due to the mere passage of time) in tenure
between two consecutive time periods as well as any other variation due to the departure or
death of partners over the same period.
To test Hypotheses 2a and 2b, we created the variable Demographic Overlap that
measures the degree of overlap change in the average stock of provincial experience between
the recipient and its competitors located within the same geographical province. We chose
an average measure rather than a standard deviation based on existing literature. Both
quantitative (Finkelstein and Hambrick, 1990; Sørensen, 1999a, 1999b) and qualitative
research (Tripsas and Gavetti, 2000) seem to agree that average team tenure profoundly
affect strategies and performance. Consider for instance that Finkelstein and Hambrick
(1990: 488), studying the differences across firms in strategic behaviors, concluded that in
teams with longer tenure “perceptions become very restricted and risk taking is avoided. The
lowest risk thing is to follow the general tendency of mainstream competitors.”
The overlap measure varies over time as a result of recruiting new partners, again net
of the natural increase in tenure between time t and time t-1 as well as any other variation
due to the departure or death of partners over the same period. First, for each firm we
computed the maximum and minimum values for the provincial tenure range by adding and
subtracting 10% to (from) the mean value of firm tenure.7 We quantified the degree of niche
overlap by counting the number of firms falling within the same tenure range in a given year.
Since the inflow of key members can affect the degree of demographic similarity between
the recipient and its competitors by increasing or decreasing their mean tenure overlap, the
number of firms falling within the new range is likely to vary accordingly. To measure
changes in demographic overlap among firms, we calculated the difference between the
7 Other studies define an organizational niche using a two standard deviation window centered on the mean (e.g., Sørensen, 1999a, 1999b). To reduce the bias of the 10% band, we also applied a 20% and a 30% band and the results, though not reported here, were not significantly different from those presented in the paper.

19
numbers of firms in two consecutive time periods, respectively. To make sure this effect was
solely due to new entries, we restricted the variation of this variable to the cases in which (at
least) one new partner entry in a given year is observed.
A strict test of the theory sheds light on the counteracting forces behind within and
between firm differences in.. From earlier research it has been observed that both
heterogeneity and overlap ate harmful to the firm. With the variables, Tenure Heterogeneity
(TH) and Demographic Overlap (DO), we model their effect through as a “spline” function. In a
spline specification a variable is allowed to have slopes that differ depending on whether its
values lie above or below a given cut-off point (Greene, 2000: 322-324; see also Greve, 2003:
chapter 5). More specifically, we fitted a model that estimates the risk of dissolution of the
organization i at time t as follows:
[a]
where separate variables are entered to model the positive and negative effects. More
precisely, α1 is the coefficient that refers to tenure heterogeneity decreases (H1b); α2 is the
coefficient that refers to tenure heterogeneity increases (H1a); β1 is the coefficient that refers
to demographic overlap decreases (H2b); and β2 is the coefficient for demographic overlap
increases (H2a). Furthermore, δ is a vector of coefficients for the controls and D and E are
variables that take on the value 1 if the subscript condition is true, 0 otherwise. To facilitate
an intuitive interpretation of the opposite direction of the coefficients, diversity decrements
are measured in absolute values. Thus, while we expect α1 (H1b) and β1 (H2b) to be negative,
α2 (H1a) and β2 (H2a) should be positively related to organizational failure. Such a model
specification allows us to appreciate the different slopes exhibited by the decline and the
increase coefficients as conditional on the aforementioned change due to members entering
the partnership team. Their entry serves as a demography altering event having negative or
),)()()()(( 1012011012011 1111 −>−≤−>−≤− Χ++++=−−−− tDOtDOtTHtTHtit tttt
EDOEDODTHDTHFExit δββαα

20
positive long term performance consequences. We have no reason to expect the two effects
to be symmetrical.
Control Variables
Besides our variables of theoretical interest, we included in the final model several
control variables at the historical, provincial and organizational levels to rule out a number of
competing hypotheses, and to improve comparability with existing research on this industry
(Pennings, Lee and van Witteloostuijn, 1998; Cattani, Pennings and Wezel, 2002).
Historical Controls. The history of the Dutch accounting industry has been marked by
many important events that might well affect organizational survival chances in specific
years. In particular, we created two dummy variables for the governmental regulations
dealing with World War I (1914-1918) conditions and the occurrence of World War II (1941-
1946). Since the 1960s, the Dutch accounting industry has witnessed several fundamental
regulatory changes. More stringent requirements – e.g., the need for higher levels of
education and experience, and the examination to become C.P.A. – have over time restricted
the entry of potential competitors. In particular, four major regulatory changes have
encompassed both the supply and the demand of professional accounting services. In 1966,
with the Law on Registered Accountants, one professional organization or NIvRA
(Nederlands Instituut van Register Accountants) was created. Since then, every professional
accountant in public practice has become one of its members. We then created a variable –
Single Association – which takes on the value 1 if year > 1966, 0 otherwise. In 1970 the Act on
Annual Accounts of Companies (which took effect in 1971) expanded the number of firms
required by law of disclosing audited annual accounts by including large private firms and
cooperative societies in addition to public companies.
Finally, in 1983 the number was further enlarged with the Title 8 of Book 2 of the
Civil Code: every company, public or private, and every cooperative society was forced to

21
disclose audited annual accounts. After the promulgation of definitive guidelines in 1984, the
obligation remained less compulsory for small and medium-sized firms that were “allowed to
submit abridged annual accounts” (Boone, Bröcheler and Carroll, 2000: 366). We captured
the effect of the regulatory changes enforced in 1971 and 1984, which significantly
heightened the demand for audit services, with two dummy variables – i.e., Regulation of 1971
(1 if year > 1971) and Regulation of 1984 (1 if year > 1984), respectively.
Provincial Controls. We included the linear and quadratic effects of density
measures at the provincial level – i.e., Focal Province Density and Focal Province Density2 – to
estimate the extent to which more general ecological phenomena affect organizational
survival. In the presence of high levels of concentration, just a few organizations control
most of the available resources. We thus controlled for concentration of the industry – C4 –
given by the total market share of the top 4 firms.
The risk of organizational failure also depends on how many firms were founded or
disappeared each year – which reflects both the degree of munificence of the environment
and the extent to which ecological conditions affect inter-organizational mobility by
creating/destroying new job opportunities. Accordingly, we created two variables – Firms
Entering Province and Firms Exiting Province – to account for the number of firms founded and
dissolved during the previous year within a given province. We proxied the variations in
carrying capacity (e.g., number of potential clients) over time with the number of inhabitants
– Provincial Inhabitants – in each province for each year. We finally accounted for other
systematic geographical differences by introducing fixed effects at the province level.
Organizational Controls. Controlling for size and age,– Size – as the logarithm of
the annual number of professional accountants (partners and associates) while age was
proxied by number of years since inception. We also controlled for level of diversity: and
overlap at t-1 – i.e., Demographic Heterogeneity Stock and Demographic Overlap Stock, respectively.
Thus, our modeling design provides a stricter test of the ‘acceleration’ in the rate of

22
organizational failure due solely to further increases above the existing level of diversity.8 We
expect both these variables to be positively related to organizational failure. Additionally, we
controlled for the leverage of the firm aborrbing new partners – Recipient Leverage – i.e, the
number of associates per partner for each year. Firms with low leverage enjoy higher
survival chances. Many firms in this sector are single proprietorships and because of such
preponderance, we created a dummy variable – Single Proprietorship – taking on the value 1 if
size is equal to 1, otherwise 0. Although it may seem strange for a study on teams to include
individual firms in the sample, we opted for a control variable, instead of deleting
observations, to avoid adding any bias due to censoring. In the Appendix however we
present the estimates obtained by eliminating individual firms from the risk set. We aim at
capturing part of endogeneity, by controlling for a few other firm characteristics. For each
year, we also computed a ratio where the numerator is the sum of years of provincial
experience of all organizational members before the inflow of new members, and the
denominator is the mean value of provincial experience – i.e., Relative Position. The rationale
is that competitively stronger organizations are less exposed to the hazard of failure. Such an
advantage guarantees the selection of inflows from a larger pool of applicants. Second,
failing to control for team size is likely to bias the estimation of team heterogeneity effects
(Carpenter et al., 2004). We avoid this bias by adding a variable that counts the number of
partners that compose the team – team size. Third, we control for the degree of demographic
turbulence of the firm by counting the number of members (associates and partners)
entering and exiting the organization – Member Entries and Member Exits.
Finally, to ensure exogeneity with respect to the dependent variable, we lagged all our
covariates by one period. In Tables 1 and 2 we report the descriptive statistics and the
correlation values for the variables used in the analysis.
---------------------------------------- 8 That becomes clear when considering that, algebraically, our model resembles a restricted distributed lag regression without the lagged dependent variable as covariate.

23
Insert Tables 1 and 2 about here
----------------------------------------
4. MODEL AND METHOD
Following a standard procedure, the life of each organization was partitioned into
organization-years (Tuma and Hannan, 1984). The final dataset includes the life of 1920
firms over the 106-year study period for a total of 17,491 year-segments. Since our data were
collected at irregular intervals, the use of continuous event history analysis would bias our
estimates (for a discussion see Allison, 1982). Following previous studies using similar data
(e.g., Pennings, Lee and van Witteloostuijn, 1998), we employed discrete event history
analysis. A discrete time hazard rate is defined as:
itP = )t,T | (Pr itii XtT ≥=
[b]
where T is the discrete random variable measuring the uncensored date of failure and Pit is
the probability that an event will occur to firm i at time t given that the firm did not
experience such an event in any previous intervals. The complementary log-log specification
provides consistent estimates of the continuous time irrespective of the interval lengths
and/or the size of the survival rate (Allison, 1982). The model can be expressed as follows:
Pit = 1 – exp[- exp(γt + δ΄xit)] or [c]
or, after taking the logarithm of both sides:
log[- log (1 - Pit)] = γt + δ΄xit
[d]
where γt is an unspecified function of time, xit is the vector that includes both firm level
characteristics and environmental variables measured at different levels of analysis, and δ is

24
the vector of coefficients. The log transformation of the left-hand side is called the
complementary log-log function. In estimating the model, we specified:
γt = γ0 + γ1(organization age) + γ2(organization age2)
[e]
As mentioned before, one potential concern involves the endogeneity problem due
to self-selection among firms and their incoming partners. In other words, the entry of
partners observed may be systematically biased – i.e., not random. Literature in labor
economics indicates however that matching is difficult and a great deal of uncertainty
accompanies the hiring of a new member (see Jovanovic, 1979). Usually, high levels of short-
term turnover suggest matching uncertainty (e.g., Belzil, 2001). Therefore, we included the
number of years elapsed in between individual movements. The findings obtained (not
reported here) suggest that in this service sector , partners on average stayed put for eight
years. We interpret this high mobility frequency as further confirming the existence of
substantive uncertainty in the job searching process. That led us to consider self-selection on
recruitment not to be a serious problem in this study. We controlled for the different length
of the intervals by creating a variable accounting for them and using it into the ‘offset’
option. All the estimates were obtained with Maximum Likelihood Estimation method using
version 8 of STATA.
5. RESULTS
Table 3 presents the maximum likelihood estimates for the complementary log-log
models of organizational failure. Model 1 includes all the control variables. In Model 2, we
introduced the variable Tenure Heterogeneity Decrease and Tenure Heterogeneity Increase to test
Hypotheses 1a and 1b. Finally, in Model 3 we tested Hypotheses 2a and 2b by entering the
variable Demographic Overlap Decrease and Demographic Overlap Increase. As the impact of the
inflows may vary according to the level of diversity exhibited by the focal partnership, we

25
test these hypotheses while controlling for the stock of heterogeneity, i.e., both for the level
of heterogeneity within the firm and level of overlap between firms – i.e., Demographic
Heterogeneity Stock and Demographic Overlap Stock.
------------------------------------------
Insert Table 3 about here
------------------------------------------
The baseline model (Model 1) with all the control variables shows that the creation
of the single association (NIvRA) increased the dissolution rates of accounting firms,
whereas the 1971 and the 1984 regulations reduced it. All variables accounting for provincial
effects – i.e., births, deaths and densities – are in the expected direction and statistically
significant, supporting our choice of the unit of analysis.9
At the organizational level, the controls point to the existence of a curvilinear age
effect: accounting firms dissolve more likely when very young or old (the minimum risk of
dissolution is set at 28 years). A stock of human capital above the provincial average (Relative
Position) significantly reduces the risk of dissolution. As expected, the larger the number of
departures , the greater the hazard of failure, whereas the bigger the partnership, the greater
its survival chances. The coefficient related to the entry of new members does not reach
statistical significance. perhaps because influx of new members is complex and depends on
the new members and team fit Lastly, it is worth noticing that the single proprietorship
dummy is not statistically significant.suggesting that no systematic bias ensues in our results
due to the inclusion of single proprietorships in the risk set. The coefficient estimates of the
controls are by and large consistent with those of previous studies using these data
(Pennings, Lee and van Witteloostuijn, 1998; Cattani, Pennings and Wezel, 2002).
9 Analyses not reported here confirmed that the linear and quadratic effects of local density are prevalent on that of national density. This result is consistent with that obtained by Cattani, Pennings and Wezel (2003) for entry rates.

26
Tenure heterogeneity negatively affects organizational performance. - see the positive
value of the coefficient of the Demographic Heterogeneity Stock variable in Model 2. While
formulating Hypothesis 1, however, we argued that the impact of key member inflows on
the risk of organizational dissolution depends on the shift they produce in tenure
heterogeneity. We treat these changes in composition as a proxy of the costs of the
socialization process. Model 2 also presents the coefficient estimates for change in tenure
heterogeneity due to new inflows. The risk of early exit grows when partner recruitment
produces more heterogeneity. Unexpectedly, a drop in heterogeneity does not produce
higher mortality levels. The implication is that the impact of a decline in diversity (flows)
varies according to its level (stock). Given the increment in average tenure heterogeneity , at
the mean level of heterogeneity increase due to new entries, the risk of organizational
dissolution rises by about 15%. At a one-standard-deviation increase above the mean this
values becomes 35%. The inclusion of these variables improves significantly the fit of our
model, so providing strong support for Hypothesis 1a, but not to Hypothesis 1b.
As for the competitive implications of inter-firm mobility, we expected analogous
results. Shifts in demographic overlap due to a senior professional migrating across firms
produce dissolution in proportion to change in demographic similarity among them. Model
3 presents the estimate of the overlap shifts associated with new entries, while controlling for
the existing level of overlap. Adding these variables significantly improves our model’s
goodness of fit. The positive and significant estimate of the Demographic Overlap Stock variable
confirms its competitive. An increase in demographic overlap due to inter-fim mobility has
the hypothesized effect on organizational dissolution – as the coefficient of the Demographic
Overlap Increase variable indicates. Conversely, recruitment that result in diminished overlap
(Demographic Overlap Decrease) enhance organizational survival. The coefficient measuring the
impact of within-firm diversity loses statistical significance. This result supports the main
thrust of our paper:: the consequences of intra-firm diversity cannot be grasped unless we

27
consider the demographic make-up of competitors. Given the mean value of demographic
overlap increase in our sample, at the mean level of overlap increase due to new entries, the
risk of organizational dissolution is augmented by about 25% At one-standard-deviation
increase above the mean this risk becomes no less than 70%. Interestingly enough,
controlling for inter-firm overlap weakens the Demographic Heterogeneity Stock effect on survival.
The implication is that what matters most for the long term outlook is the change in
diversity, not the actual degree of heterogeneity in tenure among partners. We view these
findings as providing support to Hypothesis 2a and 2b, and, by and large, to our reasoning.
Robustness Tests.
We tested the robustness of the results to alternative model specifications. First,
although we did our best to control for potential endogeneity problems, this is still an issue
that may affect our findings. To control for further unobserved firm-level effects, we re-
estimated our models adopting a two-stage specification (Heckman, 1979). We first
estimated a probit model measuring the organizational probability of experiencing one new
entry (including all the controls presented in Model 1). Then, we used the estimates obtained
from this model as a control in the dissolution-rate specification. Because of our binary
dependent variable in the second step, we created a probit specification with self-selection,
following the approach of Van de Ven and Van Praag (1981). The results, which are
available from the authors upon request, confirm that endogeneity is not a serious concern.
Second, while the way we operationalize organizational dissolution does not coincide
with “failure,” it is nevertheless consistent with previous research (e.g., Boone, Bröcheler
and Carroll, 2000; Phillips, 2002) – which defines failure as exit from the market, without
distinguishing between bankruptcy and merger or acquisition. But mergers or acquisitions
are quite distinct from exit due to failure or extremely poor performance. For this reason,
since the M&A activity in the Dutch accounting industry was mainly, if not exclusively,
concentrated in more recent years, especially after 1966, we double-checked the robustness

28
of our results by running the analysis on a sub-sample that includes firms from 1880 to 1966.
Although the statistical significance of the coefficient estimates of the within-firm diversity
measures appears to be weaker, the results are consistent with those presented here.
Finally, although our models control for single proprietorships, our results might be
driven by the preponderance of these cases. Although the dummy variable flagging
individual firms never reaches statistical significant in the results presented in Table 3, we
further checked for this problem by fitting a model that excluded sole proprietorships from
the risk set. The Appendix reports the results for the models estimated, empirical findings
being qualitatively similar to those reported in Table 3. A significant discrepancy involves
local density-dependence: both its linear and the curvilinear effect disappear, suggesting that
small firms (those excluded from the risk set) are disproportionately exposed to such
negative selection.. Altogether these results led us to conclude that inclusion of single
proprietorships does not alter the main results.
6. DISCUSSION AND CONCLUSIONS
Drawing from organizational demography theories and the class of studies involving
upper echelons, in this paper we sought to create new grounds on diversity and firm long-
term performance. Considering that our sample coincides with the entire population of the
firms belonging to a professional services sector, and that we longitudinally traced the
movements of professionals between firms across geographical space, we are in the position
to observe the long-term performance consequences of variations in demographic diversity.
The inflow of members alters the demographic make-up of firms, both internally and
externally. Mobility changes internal diversity but alters the degree of similarity between
firms as well. We were able to distinguish between mobility events that augment or reduce
variations in heterogeneity, thereby implementing a more robust test of the theory.

29
Our findings suggest that uncovering such relationships is very much dependent on a
joint consideration of firm and inter-firm levels of analysis. By delving into the specific
conditions under which the entry of key individuals produces beneficial or detrimental
consequences, the paper has shown that personnel inflow should be framed as a multi-level
phenomenon. Instead of investigating each level in isolation, our study is among the firsts to
analyze their dynamic interactions in a longitudinal setting (for an exception see Sørensen,
1999b). While the degree of fit between new recruits and the recipient firm conditions the
performance consequences of hiring new members, those consequences are not confined to
the recipient firm. As demographic characteristics are also critical in influencing the strategic
positioning of firms (see Carpenter et al., 2004 for a review), the new members affect degree
of similarity between donor and recipient firms. Given this evidence we believe that the
present paper shows how personnel inflow constitutes an important force of strategy
convergence/divergence within industries. The performance implications of recruiting new
members, therefore, depend critically on changes in competitive overlap among firms.
The present study adds significantly to the body of literature on upper echelons.
First, by modeling both the increases and decreases in tenure heterogeneity, the
methodology adopted here permits us to decompose the positive and negative changes in
demographic diversity both within and between firms. The lack of significance of reductions
in tenure heterogeneity due to member inflow calls for further investigations of the
presumed positive effects of homogenous teams on organizational performance. Our
findings demonstrate that the existing stock of demographic heterogeneity of a team may
influence the positive impact of a diversity reduction on survival. We have followed the
putative assumption regarding demography and cognition, arguing that demographic
heterogeneity is predictive of mental and attitudinal diversity. Mental diversity shapes the
threshold for reaching consensus in beliefs and attitudes and, if that threshold rises, the risk
of disbanding grows, while lowering the threshold should have had opposite consequences.

30
We can speculate the existence of an interaction between the levels of diversity and its
reduction. More specifically, the diversity stock moderates the survival benefit due to
heterogeneity reduction: above certain levels of the stock, a reduction of heterogeneity does
not have beneficial effects because these are offset by the costs of absorbing inflows (see
Chatman, 1991). Second, we created significant additions to the recent cross-sectional
findings concerning inter-firm dynamics of tenure heterogeneity (Pegels et al., 2000). The
evidence presented here shows that changes in demographic overlap significantly affect
organizational performance. We consider especially intriguing the finding obtained by Model
3 in Table 3: after adding the overlap related variables, the coefficient measuring the impact
of the level of within-firm diversity loses its statistical significance. In this respect, our results
provide further support to the work of Sørensen (1999b) and suggest that the consequences
of intra-firm diversity cannot be fully grasped without considering the demographic
characteristics of competitors. The results of this study provide a first hint moreover at the
strategic convergence or divergence between firms due to executive migration and the
subsequent effects on firm survival.
A persistent concern in the literature on organizational demography is the ambiguity
regarding demographic characteristics matching cognitive ones (e.g., Finkelstein and
Hambrick, 1996). The research to date assumes that tenure diversity produces divergent
mental frames without substantiating this claim – it is just assumed that this is what it might
be. By no means is our study immune to such criticism. We likewise assumed that managers
with comparable demographic traits should exhibit similarity in their mental models and, by
implication, convergence in strategic decisions and behaviors. Unfortunately, our data do not
allow us to establish an empirical link between demographic characteristics and mental
proclivities.
On the other hand, we should emphasize some important advantages in the present
study of diversity and survival. Among all possible demographic attributes, tenure, and
31
especially local tenure is defensible as precursor to cognitive dispositions. By contrast,
attributes such as ethnicity, age and gender are much more tenuous when assuming a
demography-cognition connection, especially when such attributes are invoked to impute
mental dispositions around strategic and market conditions. In knowledge intensive
industries such as the accounting sector, with close ties between the professional and their
clients, local and lasting exposure to local conditions appears more germane to the
acquisition of common perceptions and attitudes. The implied socialization within
geographically defined markets is bound to instil commonality in beliefs and values
compared to settings where geography matters less and propinquity is not paramount.
The accounting sector is relatively static and persistent in its compliance with widely
accepted standards. Individual firms posses distinctive qualities and reveal varying degrees of
rents. (The Accounting Reporter, 2004). Demographically homogenous partnerships are
prone towards higher degrees of compliance and strongly ingrained norms and values but
when jolted by misfitting and divergent members joining, their firm becomes gravely
exposed to bankruptcy or industry exit. Particularly in this type of sector, the heterogeneity-
performance relationship comes sharply into focus when recruitment draws a firm into a
more disjointed and divergent membership and preservation of well ingrained routines and
practices is jeopardized.. Recall that the diversity–performance relationship takes on a
negative or positive relationship depending on the complexity of task, and the uncertainty
and ambiguity of markets. The accounting sector strives towards reliability and replicability,
both for individual firms and their industry. Innovation and adaptation occur slowly and are
subject to stringent regulation and standard setting. This industry would therefore be
expected to witness strong harmful effects of diversity and equally strong benefits of
homogeneity since these conditions impede or facilitate the compliance with accounting
rules and conventions, and even more so today as the corporate world is fraught with
numerous accounting scandals which necessitate further elimination of ambiguity in
32
corporate disclosure. We should press for additional research in high technology and other
emerging or novel industries where the findings on diversity might be contrary to what we
have discovered in the present setting.
In the end, we stress that any investigation of the performance implications of inter-
firm mobility should embrace the effect of member exit. Further research is then needed to
decompose the simultaneous positive and negative externalities of member entry and those
of member exit. The results on diversity and performance as decomposed here should
motivate researchers to link demographic with cognitive variables, both at the individual,
team or organizational level so that the researcher can peek more successfully into the black
box of decision making that is present among a set of decision makers. Similarly the
cognitive framing of markets and strategic groups and firm performance would benefit from
data that more tightly connect demographics with mental proclivities.
33
REFERENCES
Abrahamson E, Hambrick D. 1997. Attentional Homogeneity in Industries: the Effect of Discretion.
Journal of Organizational Behavior 18: 513-532.
Adner R, Helfat CE. 2003. Corporate effects and dynamic managerial capabilities Strategic Management
Journal 24(10): 1011-1025.
Allison PD. 1982. Discrete-time methods for the analysis of event histories. In S Leinhardt (ed.),
Sociological Methodology. San Francisco: Jossey-Bass, 61-98.
Ancona DG, Caldwell DF. 1992. Bridging the boundary: External activity and performance in
organizational teams. Administrative Science Quarterly 37: 634-665.
Bantel K, Jackson S. 1989. Top management and innovation in banking: does the composition of the
top team make a difference? Strategic Management Journal 10: 107-124.
Barsade SG, Ward AJ, Turner JDF, Sonnenfeld JA. 2000. To your hearts content: A model of
affective diversity in top management teams. Administrative Science Quarterly 45: 802-836.
Baum, J. A. C., S. Mezias. 1992. Localized competition and organizational failure in the Manhattan
hotel industry, 1898-1990. Administrative Science Quarterly, 37 580-604.
Baum JAC, Singh JV. 1994. Evolutionary Dynamics of Organizations. New York: Oxford University
Press.
Belzil, C. 2001. Unemployment insurance and subsequent job duration: Job matching versus
unobserved heterogeneity. Journal of Applied Econometrics 16(5): 619-636.
Boone C, Bröcheler V, Carroll GR. 2000. Custom service: Application and tests of resource-
partitioning theory among Dutch auditing firms from 1896 to 1992. Organization Studies 21(2):
355-381.
Boone C, de Brabander B, van Olffen W, van Witteloostuijn A. 2004. The Genesis of Top
management Team Diversity. Academy of Management Journal (forthcoming).
Bröcheler V, Maijoor S, van Witteloostuijn A. 2004. Auditor Human Capital and Audit Firm
Survival. The Dutch Audit Industry in 1930-1992. Accounting Organizations and Society
(forthcoming).
Boone, C., Wezel, F.C. and A. van Witteloostuijn 2006. Top Management Team Composition and
Organizational Ecology, in Baum, J.A.C. Dobrev, S. & a. van Witteloostuijn (Eds.), Ecology and
Strategy, Forthcoming, Advances in Strategic Management. Greenwich CT: Jai Press.
Carpenter MA, Fredrickson JW. 2001. Top management teams global strategies posture and the
moderating role of uncertainty. Academy of Management Journal 44 (3): 533-545.
Carpenter, M.A., W.G. Sanders, & M.A. Geletkanycz. 2004. The upper echelons revisited: The
antecedents, elements, and consequences of TEAM composition. Journal of Management. 30: 749-
778.
Carroll GR, Harrison JR. 1998. Organizational demography and culture: Insights from a formal
model and simulation. Administrative Science Quarterly 43(3): 637-667.

34
Cattani G, Pennings JM, Wezel FC. 2002. Organizational turnover as endogenous precursor of
industry dynamics and organizational survival. Working paper #02G39 University of Groningen,
The Netherlands.
Cattani G, Pennings JM, Wezel FC. 2003. Spatial and temporal heterogeneity in founding patterns.
Organization Science 14(6): 670-685.
Centraal Bureau Statistiek 2002. Ministerie van Binnelandse Zaken, Bevolking der Gemeenten van
Nederland (Population of Communities of the Netherlands).
Chatman JA. 1991. Matching people and organizations: Selection and socialization in public
accounting firms. Administrative Science Quarterly 36(3): 459-484.
Chan D. 1998. Functional relations among constructs in the same content domain at different levels of
analysis: a typology of composition models. Journal of Applied Psychology 83: 234-246.
Cyert R, March JG. 1963. A Behavioral Theory of the Firm. Englewood Cliffs, NJ: Prentice Hall.
De Pree JCI. 1997. Grenzen aan Verandering: Reorganisatie en structuurprincipes van het
binnenlands bestuur. (“Borders [or limits] to change: The relationship between reorganization
and structural attributes of interior governance”). The Hague: Wetenschappelijke Raad voor het
Regeringsbeleid.
Eisenhardt K, Schoonhoven K. 1990. Organizational growth: Linking founding team strategy
environment and growth among U.S. semiconductor ventures 1978-1988. Administrative Science
Quarterly 35: 504-529.
Finkelstein S. and D. Hambrick 1990. Top-management-team tenure and organizational outcomes:
The moderating role of managerial discretion. Administrative Science Quarterly 35: 484-503
Finkelstein S, Hambrick D. 1996. Strategic Leadership. St. Paul: West.
Galanter M, Palay T. 1991. Tournament of Lawyers. The Transformation of the Big Law Firm. Chicago: The
University of Chicago Press.
Greene WH. 2000. Econometric Analysis (4th edition). Upper Saddle River N.J.: Prentice Hall.
Greve HR. 2003. Organizational Learning from Performance Feedback: A Behavioral Perspective on Innovation
and Change. Cambridge MA: Cambridge University Press.
Groysberg, B. 2001. Can they take it with them? The portability of star knowledge workers
performance: Myth or reality? Unpublished doctoral dissertation, Harvard Business School.
Groysberg, B., A. Nanda. 2002. Does stardom affect job mobility? Evidence from analyst turnover in
investment banks. Boston, MA: Harvard Business School Division of Research Working paper
series 02-029.
Guzzo RA, Dickson MW. 1996. Teams in organizations: Recent research on performance and
effectiveness. Annual Review of Psychology 47: 307-338
Hambrick DC, Cho T, Chen M. 1996. The influence of top management team heterogeneity on
firms competitive moves. Administrative Science Quarterly, 41: 659-684.
35
Hambrick, D.C., M.A. Geletkancyz, and J.W. Fredrickson, 1993. Top Executive Commitment to the
Status Quo. Strategic Management Journal, 14: 401:418.Hambrick DC, D’Aveni RA. 1992. Top team
deterioration as part of the downward spiral of large corporate bankruptcies Management Science
38(10): 1445-1466.
Hambrick DC, Mason PA. 1984. Upper echelons: The organization as a reflection of its top
management. Academy of Management Journal 9(2): 193-206.
Hannan MT, Freeman J. 1989. Organizational Ecology. Cambridge, MA: Harvard University Press.
Heckman J. 1979. Sample selection bias as a specification error. Econometrica 47: 153-161.
Harris D, Helfat C. 1997. Specificity of CEO human capital and compensation. Strategic
Management Journal, 18: 895-920.
Hitt MA, Bierman L, Shimizu K, Kochhar R. 2001. Direct and moderating effects of human capital
on the strategy and performance in professional service firms: A resource-based perspective.
Academy of Management Journal 44: 13-28.
Jehn KA, Northcraft GB, Neale MA. 1999. Why differences make a difference: a field study of
diversity conflict and performance in workgroups. Administrative Science Quarterly 44: 741-763.
Jovanovic B. 1979. Job matching and the theory of turnover. Journal of Political Economy 87(5): 972-
990.
Keck SL, Tushman ML. 1993. Environmental and organizational context and executive team
structure. Academy of Management Journal 36: 1314-1344.
Keck SL. 1997. Top management team structure: Differential effects by environmental context.
Organization Science 8: 143-156.
Kiesler S. and L. Sproull. 1982. Managerial response to changing environments: Perspectives on
problem sensing from social cognition. Administrative Science Quarterly, 27: 548-570.
Kilduff M, Angelmar R, Merha A. 2000. Top management-team diversity and firm performance:
Examining the role of cognitions. Organization Science 11(1): 21-34.
Knight, D., Pearce, C. L., Smith, K. G., Olian, J. D., Sims, H. P., Smith, K. A., & Flood, P. (1999).
Top management team diversity, group process, and strategic consensus. Strategic Management
Journal, 20: 445-465.
Kristof-Brown, A, Jansen, KJ, Colbert, AE. 2002. A policy-capturing study of the simultaneous effect
of fit with jobs, groups, and organizations. Journal of Applied Psychology, 87 (5), 985-993.
Lawrence B. 1997. The black box of organizational demography. Organization Science 8: 1-22.
Maister D. H. 1993. Managing the Professional Service Firm. New York: Free Press.
McPherson, JM. 1983. An ecology of affiliation. American Sociological Review 48: 519-535.
Meyer MW, Gupta V. 1994. The performance paradox. In LL Cummings, BM Staw (eds.), Research in
Organizational Behavior 16. Greenwich CT: JAI Press, 309–369.
Michel J, Hambrick DC. 1992. Diversification posture and the characteristics of the top management
team. Academy of Management Journal 35: 9-37.

36
O’Reilly CA, Caldwell D, Barnett W. 1989. Work group demography social integration and turnover.
Administrative Science Quarterly 34: 21-37.
Pegels CC, Song YI, Yang B. 2000. Management heterogeneity competitive interaction groups and
firm performance. Strategic Management Journal 21(9): 911-923.
Pennings JM, Lee K, van Witteloostuijn A. 1998. Human capital social capital and firm survival.
Academy of Management Journal 41(4): 425-440.
Pfeffer J. 1983. Organizational demography. In LL Cummings, BM Staw (eds.), Research in
Organizational Behavior 5. Greenwich CT: JAI Press, 299–357.
Pfeffer J. 1994. Competitive Advantage Through People. Boston MA: Harvard Business School Press.
Phillips, DJ. 2002. A Genealogical Approach to Organizational Life Chances: The Parent-Progeny
Transfer and Silicon Valley Law Firms, 1946-1996. Administrative Science Quarterly, 47: 474-5.
Podolny, J.M., T. Stuart & M.T. Hannan. 1996. Networks, knowledge, and niches: competition in the
worldwide semiconductor industry, 1984-1991. American Journal of Sociology 102: 659-689.
Porac JF, Thomas H, Baden-Fuller C. 1989. Rivalry and the industry model of the Scottish knitwear
producers. Journal of Management Studies 26(4): 397-416.
Rao H, Drazin R. 2002. Overcoming resource constraints on product innovation by recruiting talent
from rivals: A study of the mutual fund industry 1986-1994. Academy of Management Journal 45(3):
491-507.
Reger RK, Huff AS. 1993. Strategic groups: A cognitive perspective. Strategic Management Journal 14(2):
103-123.
Rotolo, T. and J. M. McPherson, 2001. The System of Occupations: Modeling the Competition of
Occupations in Sociodemographic Dimensions. Social Forces 79: 1095-1130.
Sanders WMG, Carpenter MA. 1998. Internationalization and firm governance: The roles of CEO
compensation top tram composition and board structure. Academy of Management Journal 41(2):
158- 178.
Schneider, B. 1987. The people make the place. Personnel Psychology, 40: 437-453.
Skaggs BC, Youndt M. 2004. Strategic positioning human capital and performance in service
organizations: A customer interaction approach. Strategic Management Journal 25(1): 85-88.
Smigel EO. 1969. The Wall Street Lawyer: Professional Organization Man? Bloomington: Indiana
University Press.
Smith KG, Smith KA, Ollian JD, Sims HP, O’Bannon DP, Scully JA. 1994. Top management team
demography and process: The role of social integration and communication. Administrative Science
Quarterly 39: 412-438.
Sørensen JB. 1999a. Executive migration and interorganizational competition. Social Science Research
28: 289-315.
Sørensen JB. 1999b. The ecology of organizational demography: Managerial tenure distributions and
organizational competition. Industrial and Corporate Change 8: 713-744.
37
Sørensen JB. 2002. The Use and Misuse of the Coefficient of Variation in Organizational
Demography Research Sociological Methods and Research 30: 475-491.
Stewman, S. 1988. Organizational demography. Annual Review of Sociology, 14: 173-202.
Thomas, H., Clark, S. M., & Gioia, D. A. 1993. Strategic sense making and organizational
performance: Linkages among scanning, interpretation, action, and outcomes. Academy
of Management Journal, 36: 239-270.
Tripsas M, Gavetti G. 2000. Capabilities cognition and inertia: evidence from digital imaging. Strategic
Management Journal 21(10-11): 1147-1161.
Tuma N, Hannan MT. 1984. Social Dynamics: Models and Methods. Orlando: Academic Press.
Tushman M, Smith W. 2002. Organizational Technology. In JAC Baum (ed.), Companion to
Organizations. Oxford: Blackwell, 386-314.
Van de Ven W, Van Praag BMS. 1981. The demand for deductibles in private health Insurance: A
probit model with sample selection. The Journal of Econometrics 17: 229-25.
Wernerfelt B. 1984. A resource-based view of the firm. Strategic Management Journal, 5: 272-280.
Wiersema MA, Bird A. 1993. Organizational demography in Japanese firms: Group heterogeneity
individual dissimilarity and top management team turnover. Academy of Management Journal 36:
996-1025.
Williams KY, O’Reilly III CA. 1998. Demography and diversity in organizations: A review of 40
years of research. In LL Cummings, BM Staw (eds.), Research in Organizational Behavior 20.
Greenwich CT: JAI Press, 77-140.
Zenger TR, Lawrence BS. 1989. Organizational demography: The differential effects of age and
tenure distributions on technical communication. Academy of Management Journal 32(2): 353-376.

38
Figure 1
Concentration Index of the Four Biggest Firms
0
0.2
0.4
0.6
0.8
1
1.2
1880
1884
1888
1892
1896
1899
1903
1908
1913
1916
1920
1923
1928
1932
1937
1941
1947
1950
1953
1956
1960
1964
1968
1971
1973
1978
1986
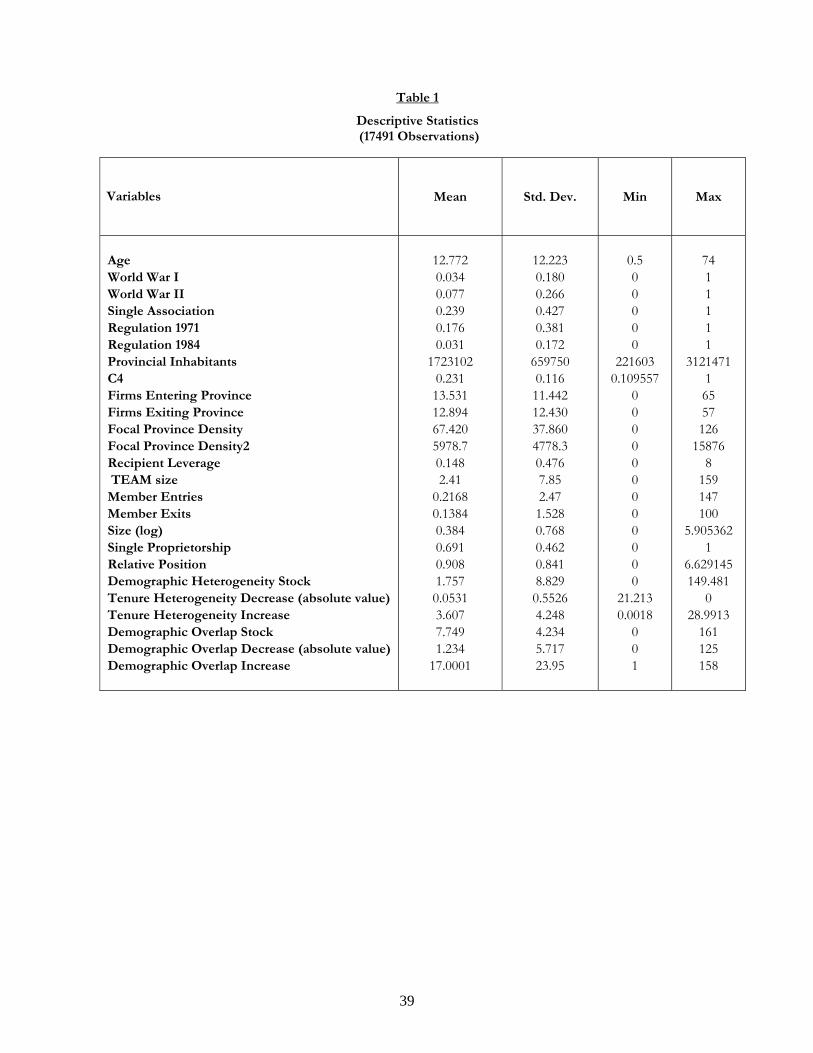
39
Table 1
Descriptive Statistics (17491 Observations)
Variables
Mean
Std. Dev.
Min
Max
Age World War I World War II Single Association Regulation 1971 Regulation 1984 Provincial Inhabitants C4 Firms Entering Province Firms Exiting Province Focal Province Density Focal Province Density2 Recipient Leverage TEAM size Member Entries Member Exits Size (log) Single Proprietorship Relative Position Demographic Heterogeneity Stock Tenure Heterogeneity Decrease (absolute value)Tenure Heterogeneity Increase Demographic Overlap Stock Demographic Overlap Decrease (absolute value)Demographic Overlap Increase
12.772 0.034 0.077 0.239 0.176 0.031
1723102 0.231 13.531 12.894 67.420 5978.7 0.148 2.41
0.2168 0.1384 0.384 0.691 0.908 1.757 0.0531 3.607 7.749 1.234
17.0001
12.223 0.180 0.266 0.427 0.381 0.172
659750 0.116 11.442 12.430 37.860 4778.3 0.476 7.85 2.47 1.528 0.768 0.462 0.841 8.829 0.5526 4.248 4.234 5.717 23.95
0.5 0 0 0 0 0
221603 0.109557
0 0 0 0 0 0 0 0 0 0 0 0
21.213 0.0018
0 0 1
74 1 1 1 1 1
31214711 65 57 126
15876 8
159 147 100
5.9053621
6.629145149.481
0 28.9913
161 125 158

40
Table 2 Pairwise Correlation Values
1 2 3 4 5 6 7 8 9 10 11 12 13 14 15 16 17 18 19 20 21 22 23 24 25 26
1 Failure 1.00
2 Age -0.08 1.00
3 World War I -0.03 -0.05 1.00
4 World War II -0.03 0.22 -0.05 1.00
5 Single Association 0.10 -0.21 -0.10 -0.16 1.00
6 Regulation 1971 0.08 -0.16 -0.09 -0.13 0.82 1.00
7 Regulation 1984 0.09 -0.07 -0.03 -0.05 0.32 0.38 1.00
8 Provincial Inhabitants 0.04 0.05 -0.13 -0.01 0.21 0.16 0.05 1.00
9 C4 0.10 -0.21 -0.08 -0.18 0.86 0.85 0.30 0.15 1.00
10 Firms Entering Province 0.03 0.08 -0.06 0.09 0.14 0.08 0.05 0.39 0.04 1.00
11 Firms Exiting Province 0.17 0.04 -0.13 -0.05 0.14 0.16 0.14 0.50 0.14 0.50 1.00
12 Focal Province Density -0.03 0.20 -0.09 0.08 -0.37 -0.34 -0.14 0.60 -0.42 0.28 0.40 1.00
13 Focal Province Density2 -0.03 0.21 -0.13 0.07 -0.41 -0.38 -0.15 0.50 -0.44 0.18 0.36 0.98 1.00
14 Single Proprietorship 0.00 -0.10 0.02 -0.01 -0.04 -0.04 -0.02 -0.09 -0.04 -0.05 -0.07 -0.05 -0.05 1.00
15 Size (log) 0.00 0.13 -0.04 0.00 0.09 0.09 0.04 0.12 0.10 0.09 0.11 0.06 0.05 -0.78 1.00
16 Relative Position -0.09 0.36 0.00 0.03 -0.04 -0.02 -0.03 0.00 -0.05 0.00 -0.01 0.03 0.03 -0.21 0.26 1.00
17 Recipient Leverage 0.00 0.06 -0.05 0.02 0.03 0.05 0.04 0.10 0.04 0.03 0.06 0.05 0.05 -0.46 0.55 0.11 1.00
18 TEAM size 0.01 0.02 -0.02 -0.02 0.15 0.15 0.05 0.09 0.14 0.09 0.11 0.01 -0.01 -0.27 0.66 0.15 0.20 1.00
19 Member Exits 0.04 0.06 -0.01 -0.02 0.04 0.05 0.03 0.03 0.04 0.01 0.03 0.02 0.02 -0.08 0.21 0.07 0.09 0.31 1.00
20 Member Entries 0.03 0.06 -0.01 -0.02 0.05 0.04 0.05 0.04 0.05 0.01 0.04 0.02 0.02 -0.11 0.28 0.10 0.12 0.41 0.50 1.00
21 Demographic Heterogeneity Stock
0.05 0.05 -0.02 -0.01 0.07 0.05 0.05 0.08 0.07 0.02 0.08 0.04 0.04 -0.28 0.39 0.17 0.16 0.36 0.35 0.47 1.00
22 Tenure Heterogeneity Decrease -0.01 -0.01 0.01 0.00 0.02 0.02 0.00 0.01 0.02 0.00 0.01 -0.01 -0.01 0.12 -0.07 -0.03 -0.03 -0.01 -0.02 -0.03 -0.05 1.00
23 Tenure Heterogeneity Increase 0.03 0.03 -0.01 0.03 -0.01 -0.02 0.00 0.03 -0.02 0.02 0.03 0.05 0.05 -0.17 0.11 0.07 0.04 0.02 0.02 0.04 0.25 -0.01 1.00
24 Demographic Overlap Stock 0.08 -0.13 -0.07 -0.09 0.09 0.09 0.07 0.16 0.11 0.03 0.12 0.11 0.13 0.10 -0.02 -0.07 0.01 0.03 0.01 0.01 0.00 0.04 -0.04 1.00
25 Demographic Overlap Decrease -0.06 -0.01 0.02 -0.02 -0.02 0.01 -0.01 -0.01 0.00 0.02 -0.01 -0.02 -0.03 0.09 -0.10 -0.03 -0.03 -0.05 -0.06 -0.09 -0.16 0.12 -0.14 0.04 1
26 Demographic Overlap Increase 0.08 -0.05 -0.02 -0.05 0.01 -0.03 0.04 0.01 -0.02 -0.06 -0.02 0.01 0.02 0.01 -0.02 -0.05 0.00 -0.02 0.03 0.02 0.03 -0.11 0.04 0.02 -0.06 1
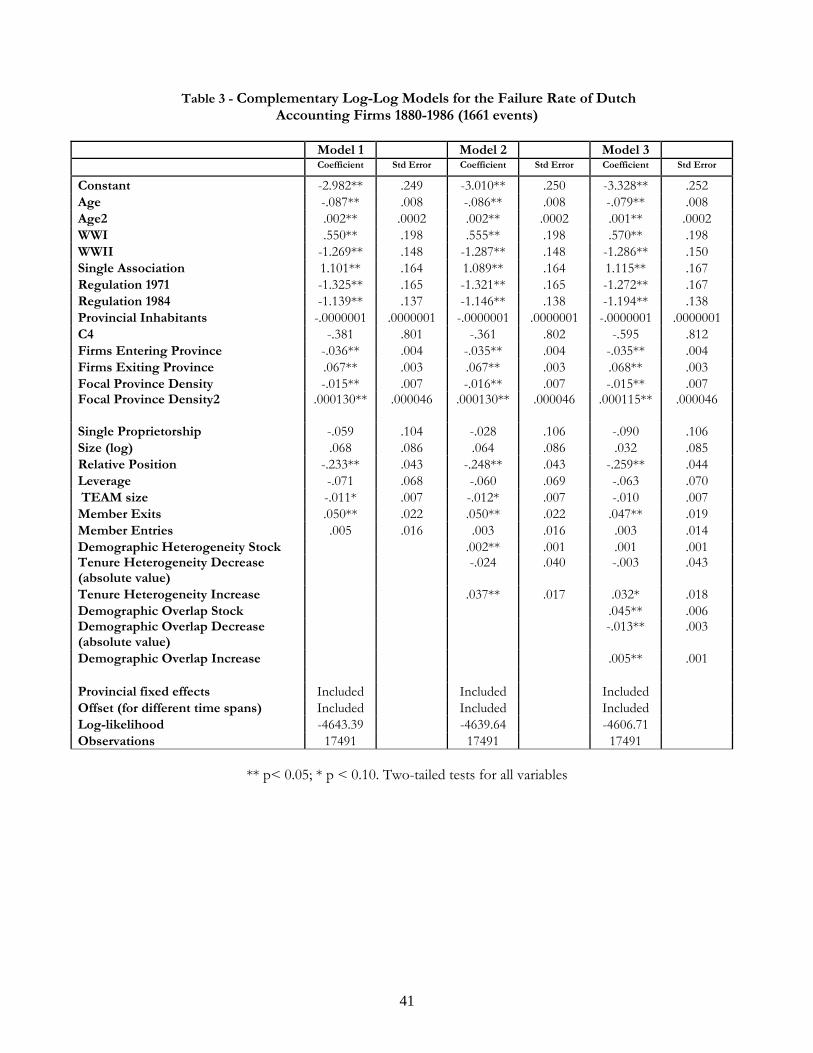
41
Table 3 - Complementary Log-Log Models for the Failure Rate of Dutch Accounting Firms 1880-1986 (1661 events)
Model 1 Model 2 Model 3 Coefficient Std Error Coefficient Std Error Coefficient Std Error
Constant -2.982** .249 -3.010** .250 -3.328** .252 Age -.087** .008 -.086** .008 -.079** .008 Age2 .002** .0002 .002** .0002 .001** .0002 WWI .550** .198 .555** .198 .570** .198 WWII -1.269** .148 -1.287** .148 -1.286** .150 Single Association 1.101** .164 1.089** .164 1.115** .167 Regulation 1971 -1.325** .165 -1.321** .165 -1.272** .167 Regulation 1984 -1.139** .137 -1.146** .138 -1.194** .138 Provincial Inhabitants -.0000001 .0000001 -.0000001 .0000001 -.0000001 .0000001 C4 -.381 .801 -.361 .802 -.595 .812 Firms Entering Province -.036** .004 -.035** .004 -.035** .004 Firms Exiting Province .067** .003 .067** .003 .068** .003 Focal Province Density -.015** .007 -.016** .007 -.015** .007 Focal Province Density2
.000130**
.000046
.000130**
.000046
.000115**
.000046
Single Proprietorship -.059 .104 -.028 .106 -.090 .106 Size (log) .068 .086 .064 .086 .032 .085 Relative Position -.233** .043 -.248** .043 -.259** .044 Leverage -.071 .068 -.060 .069 -.063 .070 TEAM size -.011* .007 -.012* .007 -.010 .007 Member Exits .050** .022 .050** .022 .047** .019 Member Entries .005 .016 .003 .016 .003 .014 Demographic Heterogeneity Stock .002** .001 .001 .001 Tenure Heterogeneity Decrease (absolute value)
-.024
.040
-.003
.043
Tenure Heterogeneity Increase .037** .017 .032* .018 Demographic Overlap Stock .045** .006 Demographic Overlap Decrease (absolute value)
-.013**
.003
Demographic Overlap Increase .005** .001 Provincial fixed effects Included Included Included Offset (for different time spans) Included Included Included Log-likelihood -4643.39 -4639.64 -4606.71 Observations 17491 17491 17491
** p< 0.05; * p < 0.10. Two-tailed tests for all variables

42
Appendix - Complementary Log-Log Models for the Failure Rate of Dutch Accounting Firms 1880-1986 (excluding individual firms, 518 events)
Model 1 Model 2 Model 3 Coefficient Std Error Coefficient Std Error Coefficient Std Error
Constant -4.487** .459 -4.564** .465 -4.866** .464 Age -.077** .012 -.073** .012 -.061** .012 Age2 .001** .0002 .001** .0002 .001** .0002 WWI .264 .606 .302 .608 .270 .606 WWII -1.297** .307 -1.353** .307 -1.356** .310 Single Association .674** .271 .617** .271 .774** .276 Regulation 1971 -2.067** .262 -2.064** .263 -2.006** .264 Regulation 1984 -.822** .205 -.827** .205 -.908** .203 Provincial Inhabitants .0000009 .0000002 .0000010 .0000003 .0000008 .0000003 C4 3.682** 1.092 3.817** 1.092 3.228** 1.112 Firms Entering Province -.031** .008 -.030** .008 -.031** .009 Firms Exiting Province .051** .005 .051** .005 .053** .005 Focal Province Density .006 .015 .005 .015 .005 .016 Focal Province Density2
.000039
.000096
.000039
.000096
.000019
.000099
Size (log) .030 .083 .031 .083 -.002 .084 Relative Position -.225** .064 -.256** .065 -.249** .065 Leverage -.110* .069 -.099 .069 -.098 .069 TEAM size -.009 .007 -.009 .007 -.008 .007 Member Exits .029** .014 .028** .013 .026** .013 Member Entries .014 .010 .012 .010 .013 .009 Demographic Heterogeneity Stock .002** .001 .0004 .002 Tenure Heterogeneity Decrease (absolute value)
-.061
.042
-.038
.044
Tenure Heterogeneity Increase .048** .019 .043** .020 Demographic Overlap Stock .052** .011 Demographic Overlap Decrease (absolute value)
-.011**
.004
Demographic Overlap Increase .005* .003 Provincial fixed effects Included Included Included Offset (for different time spans) Included Included Included Log-likelihood -1374.62 -1370.23 -1357.47 Observations 5404 5404 5404
** p< 0.05; * p < 0.10. Two-tailed tests for all variables