hf loans insider trading february 2010
TRANSCRIPT
8/6/2019 HF Loans Insider Trading February 2010
http://slidepdf.com/reader/full/hf-loans-insider-trading-february-2010 1/52
Do Hedge Funds Trade on Private Information?
Evidence from Syndicated Lending and Short-Selling
Nadia Massoud∗
Schulich School of Business, York University
Debarshi NandySchulich School of Business, York University
Anthony Saunders
Stern School of Business, New York University
Keke SongSchulich School of Business, York University
First version: January, 2009
Current version: January, 2010

8/6/2019 HF Loans Insider Trading February 2010
http://slidepdf.com/reader/full/hf-loans-insider-trading-february-2010 2/52
Do Hedge Funds Trade on Private Information?
Evidence from Syndicated Lending and Short-selling
ABSTRACT
This paper investigates an important contemporary issue relating to the involvement of hedge
funds in the syndicated loan market. In particular, we investigate the potential conflicts of
interest that arise when hedge funds make syndicated loans and take short positions in the equity
of borrowing firms. We find evidence consistent with the short-selling of the equity of the hedge
fund borrowers prior to public announcements of both loan originations and loan amendments.
We also find that hedge funds are more likely to lend to highly leveraged, lower credit quality
firms, where access to private information is potentially the most valuable and where trading on
such information may lead to enhanced profits. Overall, our results have important implications
for the current debate regarding regulating the hedge fund industry.
Keywords: Hedge funds, short-selling, private information, conflict of interest, syndicated loans,
loan origination, loan renegotiation, loan amendment.
JEL Classifications: D82, G2, G38

8/6/2019 HF Loans Insider Trading February 2010
http://slidepdf.com/reader/full/hf-loans-insider-trading-february-2010 3/52
I. Introduction
Over the past decade, hedge funds have made significant inroads into the syndicated loan
market. In particular, anecdotal evidence suggests that hedge funds are willing to lend to
borrowers that commercial banks may be unwilling to lend to. In 2005, hedge funds and other
institutional investors provided almost 50% of the $509 billion loans made in the “highly
leveraged” segment of the syndicated loan market. Sufi (2009) argues, that the introduction of
loan ratings in 1995 allowed nonbank institutional investors, such as hedge funds, to enter the
syndicated loan market which otherwise had been dominated by commercial banks. The entry of
hedge funds into this market thus raises a number of important questions and issues that so far
have not been addressed. In particular, we investigate the conflict of interest that arises when
hedge funds’ participate in syndicated lending, while at the same time shorting the stocks of
borrowing firms. This issue is especially pertinent since hedge fund lenders, like banks are
“quasi-insiders” and thus privy to private information about the performance of borrowing firms
around both loan originations and loan renegotiations.1 However, hedge funds are not subject to
the same degree of oversight and regulation as banks.
Recently, there have been public concerns about hedge fund involvement in corporate
lending. An article in the Business Week on October 31, 2005 voiced these apprehensions: “a
new breed of lender is stepping in: Hedge funds are providing hundreds of millions of dollars to
companies whose shaky credit disqualifies them for prime bank loans …But with the new source
of capital come new dangers, including the possibility that hedge funds will make risky loans and
8/6/2019 HF Loans Insider Trading February 2010
http://slidepdf.com/reader/full/hf-loans-insider-trading-february-2010 4/52
consistent with the recognized difference between the objectives and expertise of hedge funds
and traditional lenders such as commercial banks (see, for example, Diamond (1984) and Fama
(1985)). Specifically, hedge funds may seek to maximize short term profits, while commercial
banks may seek to maximize long term profits by building “customer relationships” over time.
Indeed, prior research has shown strong support for the importance of banking relationships.
What has not been established is whether, or how, hedge fund lenders are different from bank
lenders especially in protecting their clients' interests.
In this paper we investigate the potential conflict of interest that arises when hedge funds
participate in syndicated lending. In particular, we analyze two cases, (i) conflicts that may arise
at loan origination and (ii) conflicts that may arise around loan amendments.
Empirical evidence supports the view that the announcement effect of hedge fund loan
borrowers is significantly negative compared to that of bank borrowers.2 Thus, one potential
profitable strategy is to short-sell the equity of a borrower prior to a new loan announcement by
taking advantage of the private information gathered during the lending decision process. We
investigate this potential conflict of interest by analyzing the short-selling of a hedge fund
borrower’s equity prior to loan announcements benchmarked against the short-selling of a
borrower’s equity around commercial bank loan announcements.3 Overall, our results are
consistent with the notion that the equity of the hedge fund borrowers are short-sold prior to
public announcements of loan originations.
2
8/6/2019 HF Loans Insider Trading February 2010
http://slidepdf.com/reader/full/hf-loans-insider-trading-february-2010 5/52
We also analyze the potential conflicts of interest that arise at the time of loan
amendments. It is well known that lenders often enforce very strict covenants on the loans they
grant to financially troubled firms (see, Drucker and Puri, 2009) and failure to comply with these
covenants result in a technical default. As a result, such violations give lenders the right to
reevaluate the financial position of a borrower and decide whether or not to amend an existing
loan contract. Nini, Smith, and Sufi (2009), find that such violations allow creditors to introduce
several restrictions in subsequently renegotiated loan agreements. Thus, following a covenant
violation a restructured loan might include: new capital expenditure restrictions, increasing or
decreasing the loan interest rate, the loan’s maturity, and/or the principal amount. During this
process of renegotiation lenders may obtain “new” or additional private information about the
future performance of a borrower. Thus, a potential conflict of interest arises when hedge fund
lenders take advantage of this private information and trade on it by short-selling the equity of
borrowers prior to loan amendments dates.4, 5
While we do not differentiate between active and passive hedge fund lenders, it could be
argued that active hedge fund lenders, in certain situations, could force such amendments, thus
gaining control over the timing and severity of the amendments process. This not only implies a
greater potential conflict of interest but also enables the hedge fund lenders to generate
potentially larger profits by trading on private information. For example, such an issue arose in
4 While it is possible that hedge funds can take advantage of such private information in other markets, such as the
8/6/2019 HF Loans Insider Trading February 2010
http://slidepdf.com/reader/full/hf-loans-insider-trading-february-2010 6/52
March 2006 when Movie Gallery, a large movie rental chain, breached covenants and requested
amendments to its existing loan which was syndicated by hedge fund lenders.6
Overall, we find evidence consistent with significant and profitable short-selling of hedge
fund borrower’s equity around loan amendment announcement dates. Our results therefore raise
important regulatory policy issues regarding hedge funds’ practice of acting as lenders to, and
trading in the equity of, borrowing firms. In comparison to commercial banks, hedge funds are
largely unregulated with respect to their equity holdings (either long or short) and commonly
have fewer internal information barriers, such as “Chinese walls”, between those in the hedge
fund who initiate lending and those who trade in the equity of the borrowing firm. 7, 8
The related literature on potential conflicts of interest that arise when non-banks engage
in syndicated lending has been relatively limited. In a recent paper, Bushman, Smith, and
Wittenberg-Moerman (2009) analyze the relationship between syndicated loans and the speed of
price discovery in both the secondary loan market and the equity market over quarterly earnings
cycles. They find that price discovery in the equity market is faster for firms that have
6 On March 6, 2006, executives from Movie Gallery held a private conference call for their lenders to discuss thatindustry conditions had primarily caused the company to recognize a record loss of $522 million. These lossesviolated one of the major covenants of a $1.35 billion syndicated loan extended by hedge fund lenders such asHighland Capital Management, Canyon Capital, and Silver Point Capital. The Movie Gallery executives requestedthat their lenders amend the existing loan contracts and relax the existing financial covenants. Nearly two weeksafter the private conference call, on March 17, 2006, Movie Gallery publicly announced their loan covenant
amendments to the public. However, between the conference call on March 6, and the announcement on March 17,short-selling of Movie Gallery’s stock rose significantly. In particular, between March 7 and March 13, the weeklycumulative short-sale volume increased from 0.4 million shares (1.23% of the outstanding shares) to 3.04 millionshares (9.5% of the outstanding shares). By March 13, Movie Gallery’s stock price had fallen by 61% as its closingprice dropped from $3.27 on March 6, 2006 to $2.01 on March 13, 2006. See The New York Times cover story, “AsLenders, Hedge Funds Draw Insider Scrutiny” by Jenny Anderson, October 16, 2006.7 Regulators in other countries have also expressed concern with respect to this issue. For example, in Britain, the

8/6/2019 HF Loans Insider Trading February 2010
http://slidepdf.com/reader/full/hf-loans-insider-trading-february-2010 7/52
institutional lenders. However, their paper does not directly consider trading activities in the
borrower’s stock around the potential leakage of private information nor does it explicitly
analyze participation by hedge funds. Ivashina and Sun (2009) study potential conflicts of
interest that arise when institutional managers simultaneously participate in syndicated lending
and are long a borrower’s equity. Thus, their paper does not consider short positions taken in the
borrower’s equity nor does it explicitly analyze participation by hedge funds. Jiang, Li, and Shao
(2009) analyze dual holdings, i.e., the simultaneous holding of both equity and debt claims in the
same firm, by non-bank institutional investors. However, they do not analyze potential conflicts
of interest nor do they explicitly investigate hedge fund participation.
Our paper is also broadly related to conflicts of interest that may arise for financial
intermediaries in other markets, such as those analyzed by Bodnaruk, Massa and Simonov
(2009), who investigate the potential of information leakage around M&A events from deal
advisors to their investment arms within a financial conglomerate. They show that deal advisors
who have a position in the target before the deal can profit from such a position in the tune of
4.08% a month net-of-risk. Our paper is also related to that of Acharya and Johnson (2007) who
provide evidence consistent with banks and other financial institutions exploiting private
information by engaging in insider trading in the credit default swap (CDS) market. They find
that information revelation in the CDS market increases with the number of banks that have an
ongoing relation with a firm and that this information revelation exclusively happens around
negative news.9
8/6/2019 HF Loans Insider Trading February 2010
http://slidepdf.com/reader/full/hf-loans-insider-trading-february-2010 8/52
from private information flows generated in the syndicate loan market to short-selling activity in
the equity market. Second, it identifies potential conflicts of interest based on the type of lender,
i.e. banks and hedge funds. Third, it provides insights into the current debate regarding the
regulation of hedge funds. Fourth, in analyzing the issues above it utilizes a new and
comprehensive hedge fund database (using seven major data sources) thereby contributing to
future research on hedge fund investment holdings and strategies.10, 11
The remainder of the paper is organized as follows. In section II, we describe our data
and sample construction process. In Section III we present our hypothesis and empirical results.
Finally, Section IV concludes.
II. Data and Sample Construction
II. A. Loan Database
Our loan information comes from the DealScan database provided by Thomson Reuters.
We restrict our sample to the period from January 2nd 2005 to July 6th 2007 since equity short-
selling data was only available for this time period under regulation SHO (RegSHO). We remove
observations with missing borrower names, deal active dates, facility active dates, facility
amount, all-in-drawn-spreads, or loan maturities and restrict our sample to include loans made
only to U.S. borrowers. We then merge our loan sample with Compustat and CRSP either by
borrower ticker and year of loan origination or by borrower name when the ticker information is
10 Our paper is also related to the large literature on loan renegotiations, such as that of Aghion, Dewatripont, and
8/6/2019 HF Loans Insider Trading February 2010
http://slidepdf.com/reader/full/hf-loans-insider-trading-february-2010 9/52
missing in DealScan.12 After merging, our loan sample consists of 4,315 loans at the deal level
consisting of 6,186 loan facilities.
II.B. The Hedge Fund Database
Due to the absence of strict reporting requirements, there is no single comprehensive
database on hedge funds or hedge fund management firms portfolio activities. An important part
of our analysis is the identification of syndicated loan lenders that are either hedge funds or
hedge fund management firms. Consequently, we build a comprehensive hedge fund database
utilizing seven major hedge fund databases that have been widely employed in the prior
literature, namely: the TASS Hedge Funds Database (TASS), the Hedge Fund Research
database (HFR), Center for International Securities and Derivatives Markets database
(CISDM), Nelson’s Directory of Investment Managers 2004 to 2006 (Nelson), Institutional
Investor magazine’s annual Hedge Fund 100 List (II100) 2003 to 2007, the database from
Cottier (1997), and the Private Equity Information Hedge Fund Database (PEI), which collects
hedge fund information from SEC-ADV forms.
Our final hedge fund database includes names from TASS (4,590 firms and 10,838
funds), HFR (2,328 firms and 8,052 funds), CISDM (4,058 firms and 12,367 funds), Nelson (288
firms and 639 funds), II100 (170 firms and 603 funds), Cottier’s (28 firms and 34 funds), and
PEI (6,555 firms and 27,338 funds). We identify and remove duplicate observations by checking
hedge fund names and their addresses from the compiled database. Specifically, when

8/6/2019 HF Loans Insider Trading February 2010
http://slidepdf.com/reader/full/hf-loans-insider-trading-february-2010 10/52
other six sources, we keep the former to preserve the information from SEC’s ADV forms. We
do this separately at both the management firm as well as the fund level.
Many hedge fund management firms, especially large ones, have more than one
functional area. For example, the II100 2007 Hedge Fund List ranked J.P. Morgan Asset
Management as the largest hedge fund firm. However, the company manages several asset
classes other than hedge funds, such as fixed income, currency, real estate, infrastructure, and
private equity, etc.. Therefore it is often difficult to define hedge funds at the management firm
level. During our sample period, investment advisers managing assets of $25 million or more
were generally required to register with the SEC and to file ADV forms until the registration
requirements were overturned by the courts in June 2006.13 Using the information on the ADV
forms (from PEI) and following Griffin and Xu (2009) and Huang (2009), we are able to apply
the following criteria to observations from PEI to define a hedge fund management firm: the
company charges performance-based fees and at least 50% of its clients are either “high net
worth individuals” or at least 50% of its clients are in “Other pooled investment vehicles (e.g.,
hedge funds)”.14 After excluding duplicates and hedge fund firms that do not meet these criteria,
we end up with a comprehensive hedge fund sample of 9,525 unique hedge fund management
firms and 48,601 unique funds with detailed information from all sources.
13 See, Brown, Goetzmann, Liang and Schwarz (2008) who provide a detailed analysis on the benefits anddrawbacks of mandatory disclosure as a regulatory tool, arising due to this controversial SEC policy requiring hedge
8/6/2019 HF Loans Insider Trading February 2010
http://slidepdf.com/reader/full/hf-loans-insider-trading-february-2010 11/52
II.C. Construction of the Hedge Fund-Syndicated Loan Sample
Finally, we construct our sample of syndicated loan lenders that are hedge funds by
merging DealScan lender names with hedge fund names both at the management firm level and
fund level. We verify the robustness of the merged results by comparing lender domiciles from
DealScan with hedge fund addresses, and by conducting web-based searches for merged lender
and hedge fund names. Our merged hedge fund lenders include the following four sub-cases: (1)
A lender in DealScan is defined as a hedge fund or a hedge fund management company
according to our hedge fund databases, e.g. Ares Leveraged Investment Fund II LP, a lender in
DealScan, is defined as a hedge fund managed by Ares Management LLC according to PEI. (2)
A lender in DealScan is a subsidiary of a hedge fund management company, e.g. DealScan
records Cyrus Opportunities Master Fund Ltd as a lender, its management company, Cyrus
Capital Partners, L.P., is recorded as a hedge fund management company. (3) A hedge fund or a
hedge fund company is a subsidiary of a lender in DealScan, e.g., New York Life Capital
Partners is a hedge fund company, and its parent, New York Life Capital Corp, is recorded as a
lender in DealScan. (4) A lender is defined as a hedge fund company in some hedge fund
database(s), but this lender could also have other functional areas, such as in the case of J.P.
Morgan Asset Management we mentioned before. When (3) or (4) occur, we consider the lender
to be a hedge fund only if the loan(s) made by the lender are defined as institutional loan(s) by
DealScan. We find 341 unique lender names in our DealScan loan sample that can be identified
as hedge funds (193) or as hedge fund management firms (148).
8/6/2019 HF Loans Insider Trading February 2010
http://slidepdf.com/reader/full/hf-loans-insider-trading-february-2010 12/52
hedge fund lenders participated in the loan. We define institutional loan facilities following
Nandy and Shao (2007). If DealScan reports one of the market segments for the loan facility as
“institutional” and if none of the lenders involved in the facility are hedge funds, we define the
loan deal as “other institutional”. Our bank lender category comprises loan deals where all
lenders are banks. Finally, we remove overlapping loan deals of the same borrower that are
within 60 trading days of each other. This leaves us with 128 (12.14%), 103 (9.77%), and 823
(78.08%) loans for the hedge fund lender, other institutional lender, and bank lender categories
respectively. The yearly distribution of the sample by lender category over the 2005 to 2007
period is shown in Table I Panel A, while Table I Panel B shows the number of unique
borrowers in each lender category.
<Insert Table I>
Roberts and Sufi (2009) have highlighted certain shortcomings in the DealScan database.
In their sample, they found that 47% of loan renegotiations (amendments) are recorded as
independent loan observations. Following their approach, we hand checked all loan contracts
between January 2, 2005 to July 6, 2007, the period during which the firm level short-selling
data is available. During this sample period, we were able to identify 217 amended loan deals
from a total of 577 new loans on DealScan.15
II.D. Short-Selling Data and defining Abnormal Short-Selling
On June 23 2004, the U.S. Securities and Exchange Commission (SEC) adopted
8/6/2019 HF Loans Insider Trading February 2010
http://slidepdf.com/reader/full/hf-loans-insider-trading-february-2010 13/52
public after January 1st 2005. These short-sales data include information on ticker name, short-
sale volume, short-sale price, transaction time and date, listing exchange, and trade type. These
data are available from January 2nd 2005 to July 6th 2007, after which the mandatory public
disclosure of short-sale data was eliminated.
We collected short-sale information on stocks traded on nine major U.S. exchanges from
the NYSE TAQ database, and from the websites of the American Stock Exchange (AMEX),
National Association of Securities Dealers Automated Quotations (NASDAQ), National Stock
Exchange (NSX), Archipelago (ARCA), Boston Stock Exchange (BSE), Chicago Stock
Exchange (CHX), National Association of Securities Dealers (NASD) and Philadelphia Stock
Exchange (PHLX). We first aggregated the raw data from the transaction level to a daily level by
ticker symbol, trading date, and the stock exchange on which the stock was traded (some stocks
might be traded on more than one exchange). Next, we merged this daily short-sale data with
CRSP daily data by ticker and date, and verified our merged results by comparing the daily
average short-sale prices with CRSP stock prices. We exclude short-sales of stocks not listed in
NYSE, AMEX and NASDAQ and generate aggregated daily non-exempted short-sale volumes
for each stock in our sample from January 2nd
2005 to July 6th
2007. This leaves us with short-
sales data on 3,117, 1,353 and 3,915 NYSE, AMEX and NASDAQ stocks, respectively. We then
merge the short-sale data to the relevant borrowers in the syndicated loan sample.
Following the short-selling literature (e.g., see Zheng (2008)), we use “abnormal” short-
selling. We define abnormal short-selling by adjusting the actual short-selling activities around
8/6/2019 HF Loans Insider Trading February 2010
http://slidepdf.com/reader/full/hf-loans-insider-trading-february-2010 14/52
abnormal short-selling is the difference between the daily short-selling in the window (-60 days
to +60 days) and the “normal” short-selling benchmark. We then “normalize” the degree of
short-selling by dividing it by either outstanding shares (Short/Shrout) or by the average daily
volume measured over a period -121 to -61 days prior to a loan announcement. This variable is
referred to as (Short/Avol).16 Our results are robust to using either definitions of normalized
abnormal short-selling.
II.E. Loan Amendment Sample Construction
Since a major part of our analysis focuses on the potential for trading on private
information prior to the public announcement of loan amendments, we obtain our loan
amendment sample from two sources: (1) loan amendments as defined by DealScan and (2)
hand-collected amendments from borrower filings with the SEC from forms 10-K, 10-Q and 8-
K. In total we have 113 (hedge fund) and 263 (bank) loan amendments that can be confirmed
with SEC filings and merged with the loan-short-selling merged data. From SEC filings we
collect the following information: the announcement date of the amendment (we take the filing
date as the announcement date if there is no explicit announcement date in the filing), as well as
any changes in the loan’s principal amount, interest rate, and maturity.
We define “favorable” amendment changes as larger principal amounts, lower interest
rates or longer maturities compared to the original loans. We then define “favorable” loan
amendments in our sample as those loan amendments with at least one favorable loan contract

8/6/2019 HF Loans Insider Trading February 2010
http://slidepdf.com/reader/full/hf-loans-insider-trading-february-2010 15/52
Our hedge fund lender sample contains 76 favorable amendments and 37 non-favorable
amendments, whereas the bank lender sample contains 126 favorable amendments and 137 non-
favorable amendments.
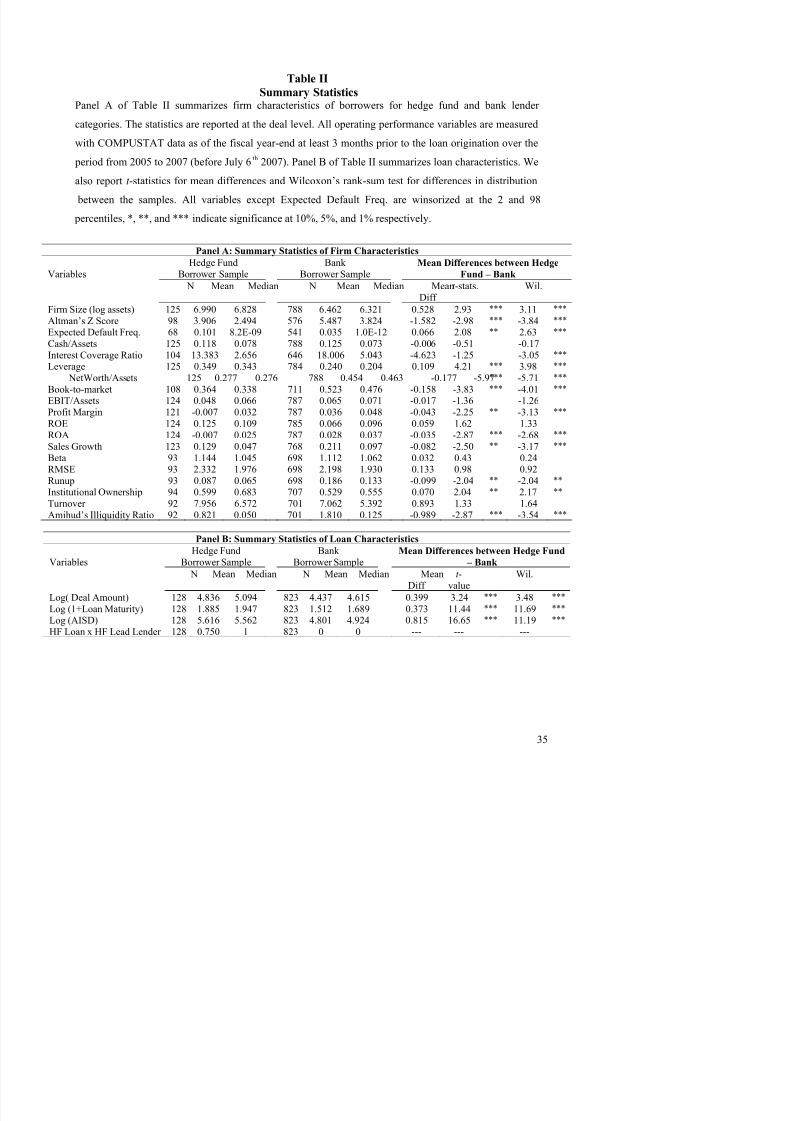
II.F. Descriptive Statistics and Univariate Comparisons
Table II summarizes the different variables we use in our tests for the hedge fund lender
and bank lender samples. Panel A summarizes the borrowing firm control variables and Panel B
summarizes the loan characteristics variables. The correlation matrix for all variables in panels A
and B is presented in Appendix B. The variables in Panel A comprise different accounting and
market based performance measures reflecting a borrowing firm’s performance and default risk
exposures. All operating performances variables are measured using COMPUSTAT data at the
last fiscal year-end at least 3 months prior to the loan origination date. Detailed definitions of all
variables are provided in Appendix A.
<Insert Table II>
In Table II, we report univariate differences among these variables for the hedge fund and
bank lender samples using t -tests and Wilcoxon rank sum tests. The univariate results show that
the differences among these variables are often significant with hedge funds lending to larger
firms with a lower Z-score, greater expected default frequency (EDF), greater leverage, and
generally poorer operating performance measures (such as profit margin, ROA, and sales
growth). Hedge fund borrowers however, seem to have greater stock market liquidity compared

8/6/2019 HF Loans Insider Trading February 2010
http://slidepdf.com/reader/full/hf-loans-insider-trading-february-2010 16/52
different, with hedge funds making larger loans with greater maturity and greater all-in-spread-
drawn.
III. Hypotheses and Empirical Results
In this section we discuss our main results regarding the potential conflict of interest that
arise when a hedge fund engages in syndicated lending and the short-selling of the equity of a
borrowing firm.
Prior to doing so, we develop and discuss our hypotheses and the methodology we use to
test these hypotheses. If short-selling activities are driven by hedging motives, then we should
expect to see short-selling increasing from its “normal” levels just after or immediately around
the public announcement of new or amended loan contracts. On the other hand, if abnormal
short-selling activities are observed prior to loan announcements then it is more likely to be
evidence consistent with the exploitation of private information gathered during the loan
origination and/or renegotiation process. In particular, we argue that the cleanest test of whether
hedge funds trade on private information will be just prior to loan amendment announcements.
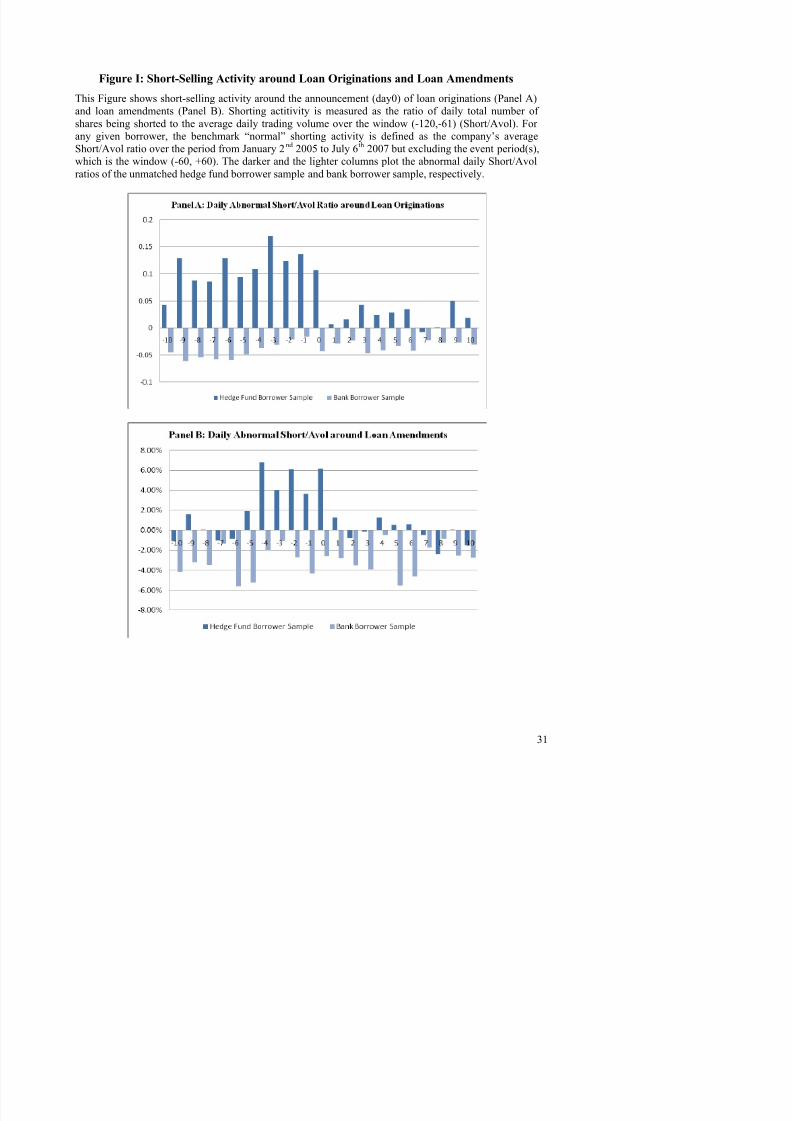
<Insert Figure 1>
Preliminary evidence regarding hedge fund short-selling prior to the announcement of
loan originations and amendments can be seen in Figure 1. Specifically, in Figure 1 we show
differences in abnormal short-selling between the hedge fund and the bank borrower samples
prior to the announcement of loan originations (in Panel A) and prior to the announcement of
8/6/2019 HF Loans Insider Trading February 2010
http://slidepdf.com/reader/full/hf-loans-insider-trading-february-2010 17/52
days prior to the announcement of a loan origination or amendment.17 Consequently, in
remainder of this section we test three hypotheses (H1, H2, and H3):
• Hypothesis 1 (H1): The equity of the firms that have hedge funds as lenders is more
likely to be short-sold prior to public announcements of loan originations.
• Hypothesis 2 (H2): The equity of the firms that have hedge funds as lenders is more
likely to be short-sold prior to announcements of loan amendment dates.
• Hypothesis 3 (H3): Short-selling is likely to be greater the weaker the financial situation
of the borrower.
III.A. Univariate Analysis of Short-Selling Prior to Loan Origination and Amendment:
We first present univariate tests of H1 and H2 followed by multivariate regressions where
we control for borrower, loan, and industry characteristics that may influence the degree of short-
selling in a borrowing firm’s stock. Table III presents a univariate analysis of the differences in
short-selling between the hedge fund and the bank borrower samples, prior to both the
announcement of loan originations (in Panel A) and loan amendments (in Panel B). In both
panels we present the results for several different event windows, namely: [-10, 0], [-10, -6], [-
10, -1], [-5, -1], [-5, 0], [0, 5], [6, 10], and [0, 10].
<Insert Table III>
As can be seen from the results in Panel A, in all windows prior to the loan
announcement day (day 0) abnormal short-selling activity in the hedge fund sample is both

8/6/2019 HF Loans Insider Trading February 2010
http://slidepdf.com/reader/full/hf-loans-insider-trading-february-2010 18/52
significant. In Panel B abnormal short-selling in the hedge fund sample is positive and
significant in the [-5, 0] and [-5, -1] windows. For example, in Panel A, the cumulative abnormal
short-selling for the hedge fund sample is 63.1% and significant for the [-5, -1] window while it
is negative and significant in the bank sample, with the difference between the cumulative short-
selling for the hedge fund sample and the bank sample being positive and significant at 1% for
virtually all pre-announcement windows.18
Thus, overall, the univariate difference in abnormal
short-selling is greater for the hedge fund sample prior to both loan origination and amendment
announcements, consistent with hypotheses H1 and H2.
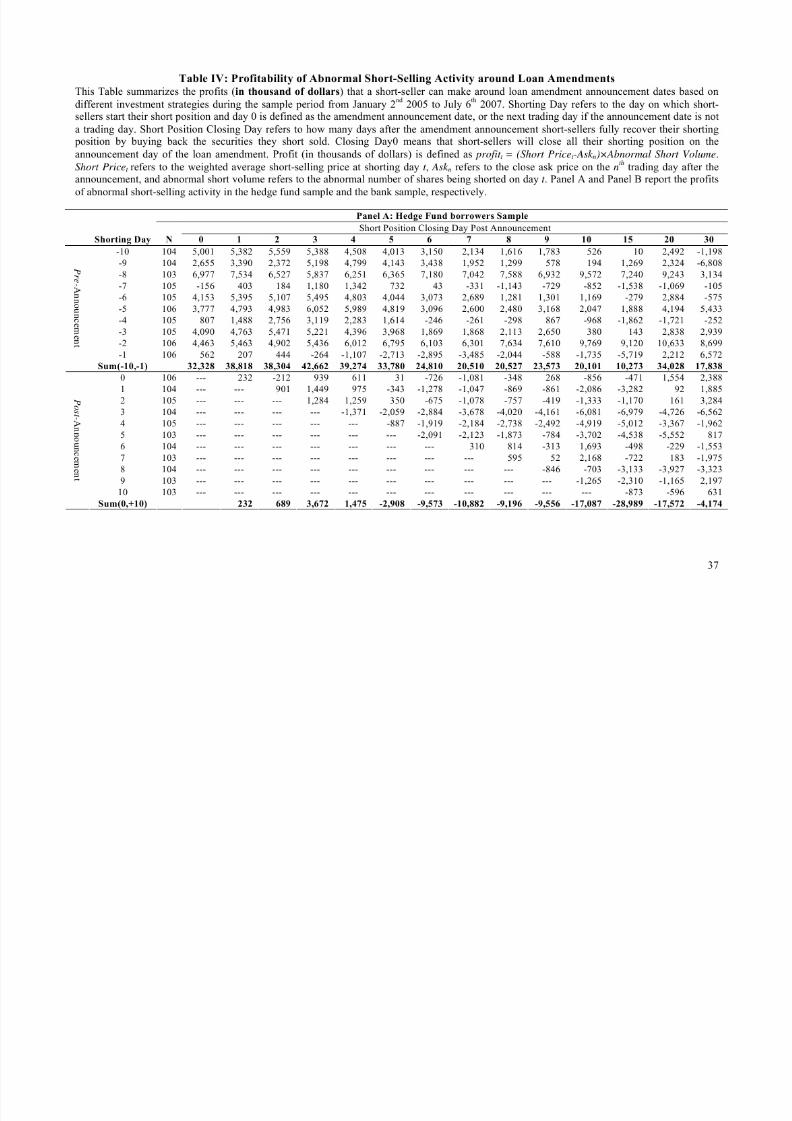
III. B. Short-Seller Profits
The results in Table IV provide additional support for the above findings. A natural
question to ask is how much profit could a short-seller have made by trading on private
information of an impending loan amendment ? To answer this question we construct a simple
naïve strategy where we consider the daily actual average abnormal short-selling volume in the
20 days around the loan amendment announcement (i.e., -10, +10). In Table IV the first column
called “shorting day” indicates the day of the abnormal short-selling relative to day zero
(amendment announcement day). For each day, we allow short-sellers to close their positions on
the announcement date, or one day, two days and up to 30 days after the amendment
announcement. We call these “short position closing days”. Profit (in thousands of dollars) is
defined as Profit t = (Short Pricet -Ask n)×Abnormal Short Volume, where Short Pricet refers to the
8/6/2019 HF Loans Insider Trading February 2010
http://slidepdf.com/reader/full/hf-loans-insider-trading-february-2010 19/52
of shares being shorted on day t . The results in Panel A of Table IV show that the short-sellers in
the hedge fund sample could make economically significant profits if they closed their positions
on day 0 or after.19
<Insert Table IV>
For example, abnormal short-selling of hedge fund borrowers equity on day -10 would
make an average abnormal profit of approximately $5.0 million, $5.4 million and $5.6 million if
it closed out its positions on loan amendment day 0 (the announcement day), day 1, and day 2
respectively. If we consider actual short-selling volume rather than abnormal short-selling
volume then total short-selling profits would be even larger, e.g., the total profits from actual
short-selling the hedge fund borrowers equity on day -10 is approximately $5.8 million if the
position were closed out on day 0.20 In comparison the short-sellers of the bank borrowers’
equity would mostly generate losses following a similar strategy, as can be seen from Panel B of
Table IV.
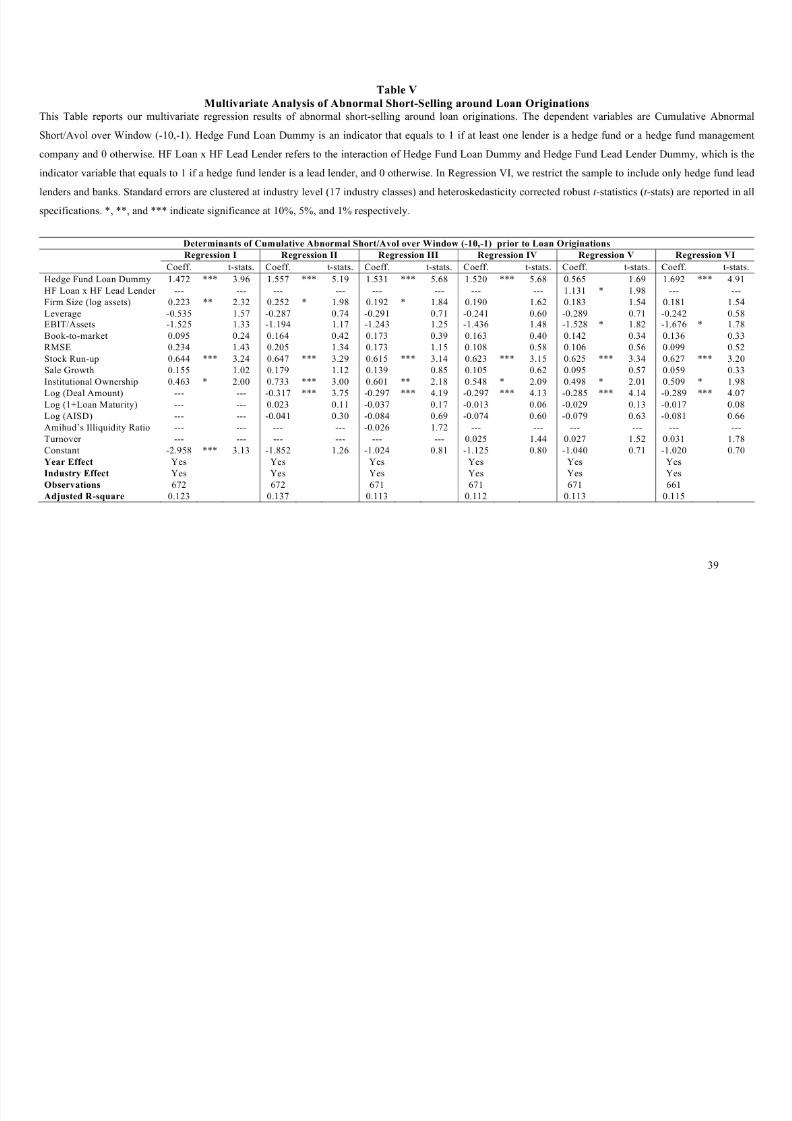
III. C. Multivariate Analysis of Short-Selling Prior to Loan Origination
However, given that, on average, the characteristics of borrowers in the two samples
appear to be different, it might be important to control for such characteristics and other industry
effects in our analysis. Table V reports a multivariate analysis of abnormal short-selling prior to
loan origination announcements.
<Insert Table V>

8/6/2019 HF Loans Insider Trading February 2010
http://slidepdf.com/reader/full/hf-loans-insider-trading-february-2010 20/52
Table V, presents six different regression specifications, where our dependent variable is
abnormal short-selling scaled by volume prior to the announcement of a loan origination over
the window [-10, -1].21 In the first four regressions the coefficient of interest is the hedge fund
loan dummy variable which equals 1 if the loan syndicate includes at least one hedge fund and 0
otherwise. In the fifth regression, we introduce the interaction of our hedge fund dummy with a
hedge fund lead lender dummy which equals 1 if the hedge fund is a lead lender in the syndicate
and 0 otherwise. In the sixth regression, we re-estimate regression 4 by restricting the loan
sample to only include loans where the lenders are either hedge fund lead lenders or banks.22 In
all specifications, we control for borrower and loan characteristics. As can be seen from the
results in Table V, the coefficient on the hedge fund dummy is positive and significant at the 1%
level in the first four specifications, suggesting that borrowers that have hedge funds as lenders
have greater abnormal short-selling of their equity prior to the announcement of loan
originations compared to bank borrowers. In the next two regressions, we find that this result
primarily holds true for borrowers that have hedge funds as lead lenders, as the coefficient on the
hedge fund lead lender interaction dummy is positive and significant at the 10% level, while the
hedge fund dummy is positive but not significant. In regression 6, we restrict the sample to
include only hedge fund lead lenders along with bank lenders. As can be seen, the hedge fund
lead lender indicator variable is significant at the 1% level. The results in the final two
regressions in Table V suggest that hedge fund lead lenders are more likely to engage in short
selling relative to bank lenders and non-lead hedge funds.23 The multivariate results also suggest
8/6/2019 HF Loans Insider Trading February 2010
http://slidepdf.com/reader/full/hf-loans-insider-trading-february-2010 21/52
that firm size, presence of institutional investors, and the run-up in the firm’s stock price prior to
loan origination affects abnormal short-selling positively, while abnormal short-selling is lower
for borrowers with larger loans. Overall, the results from these regressions support hypothesis
H1, i.e. the equity of firms that have hedge funds as lenders is more likely to be short-sold prior
to public announcements of loan originations.
III. D. Analysis of Short-Selling Prior to Loan Amendments
We next further examine H2 and H3 which relate to the relative abnormal short-selling of
equity prior to the announcement of loan amendments for hedge fund borrowers. While H2
argues that hedge fund borrowers are more likely to be subject to short-selling activity prior to
loan amendments, H3 argues that this would be most prevalent for unfavorable amendments.
As discussed earlier, loan amendments are commonly triggered when a borrower violates
covenants for reasons that include poor financial performance and deterioration in its credit
quality (see, Nini, Smith, and Sufi, 2009). Alternatively, it could also be the case that borrowers
want to renegotiate a loan contract due to their improved credit quality, which gives them the
ability to refinance at lower rates. Thus, we sort amendments based on the outcome of the
amendments (favorable or unfavorable), and then conduct a comparative analysis of abnormal
short-selling prior to a loan amendment announcement for both hedge fund and bank borrower
samples.
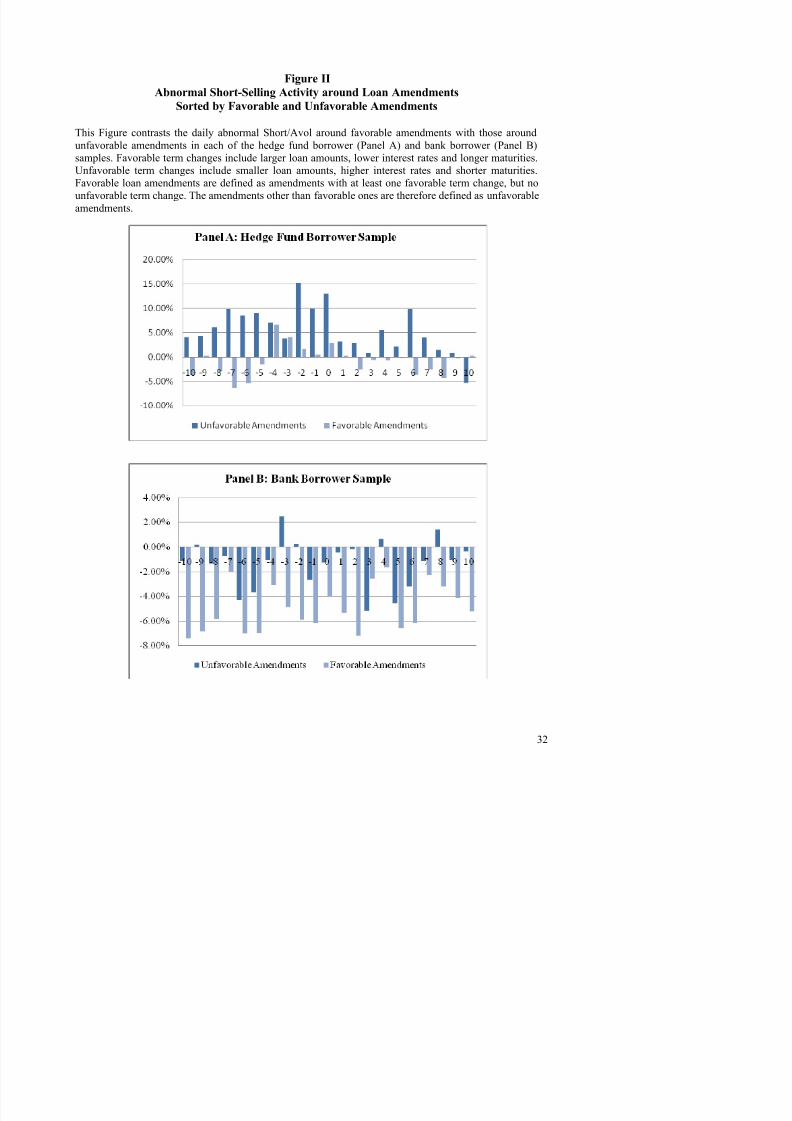
Figure II Panel A shows the differences in abnormal short-selling in the hedge fund
8/6/2019 HF Loans Insider Trading February 2010
http://slidepdf.com/reader/full/hf-loans-insider-trading-february-2010 22/52
ones, while for the bank sample there are 137 unfavorable amendments and 126 favorable ones.
Figure II clearly shows that abnormal short-selling is most prevalent in the days just prior to
unfavorable amendment announcements in the hedge fund sample. This is consistent with our
hypothesis H3 which suggests that the conflict of interest for hedge fund lenders is strongest
when the financial condition of the borrower deteriorates.
<Insert Figure II>
Indeed, we conduct additional analysis based on changes in borrower credit quality. It
can be argued that the potential for private information based short-selling profits are highest
when amendments are triggered by a borrower’s credit deterioration and an impending or actual
technical default on a loan contract. Thus, we sort amendments based on the change in the
expected default frequency (EDF) of a borrower between the pre- and post-loan amendment
announcement period. We measure the change in EDF as the difference between the EDF
estimated at the month end of the amendment announcement date and the EDF estimated six
months prior to the amendment announcement date and analyze the differences in abnormal
short-selling of the equity of hedge fund borrowers relative to bank borrowers, prior to the
announcement of the amendment.24
<Insert Figure III>
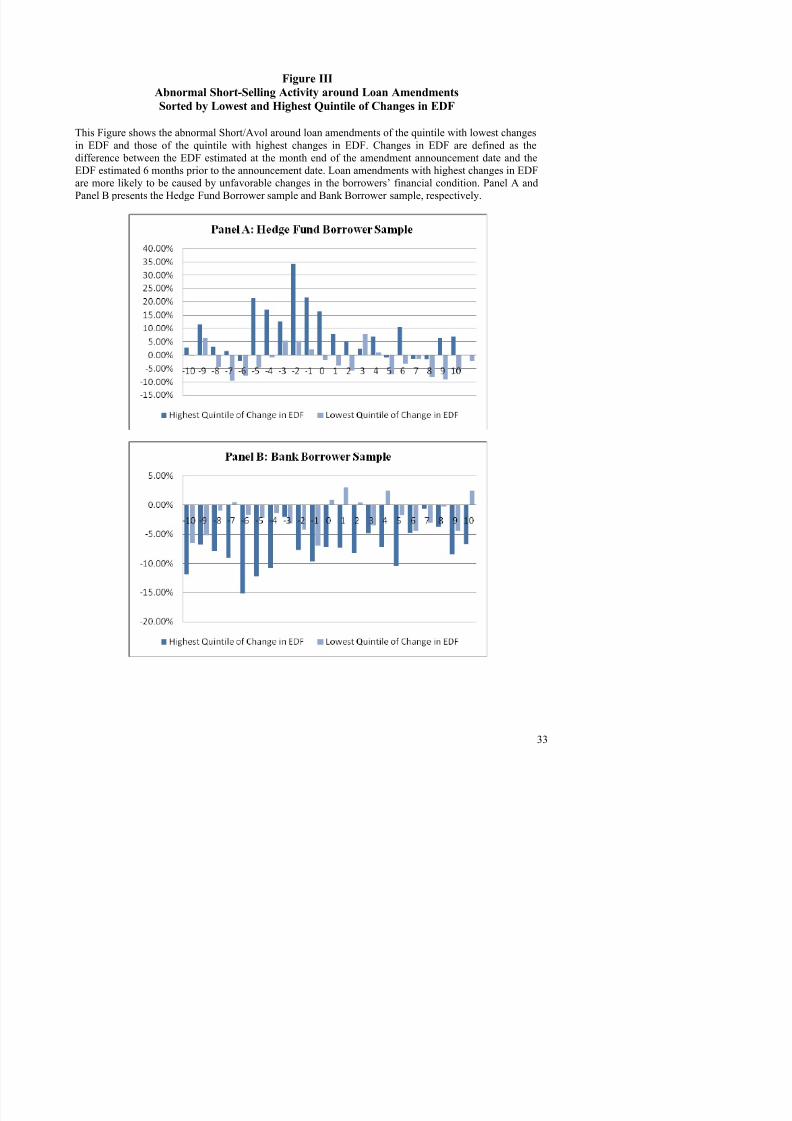
Figure III shows the differences in abnormal short-selling for the lowest EDF quintile
(lowest credit quality deterioration) and the highest EDF quintile (highest credit quality
deterioration) for both hedge fund and bank borrowers. Consistent with our hypothesis H3,

8/6/2019 HF Loans Insider Trading February 2010
http://slidepdf.com/reader/full/hf-loans-insider-trading-february-2010 23/52
is most severe for the highest quintile of hedge fund borrowers, i.e. those borrowers with the
highest credit quality deterioration.
III. D.1. Univariate Analysis of H3
We formalize our tests of data shown in Figure III by conducting both univariate and
multivariate tests of abnormal short-selling prior to loan amendment announcement dates
according to: (i) amendment outcomes: favorable and unfavorable amendment outcomes (shown
in Panel A of Table VI) and (ii) changes in credit quality quintile around the amendment
announcement period (shown in Panel B of Table VI).
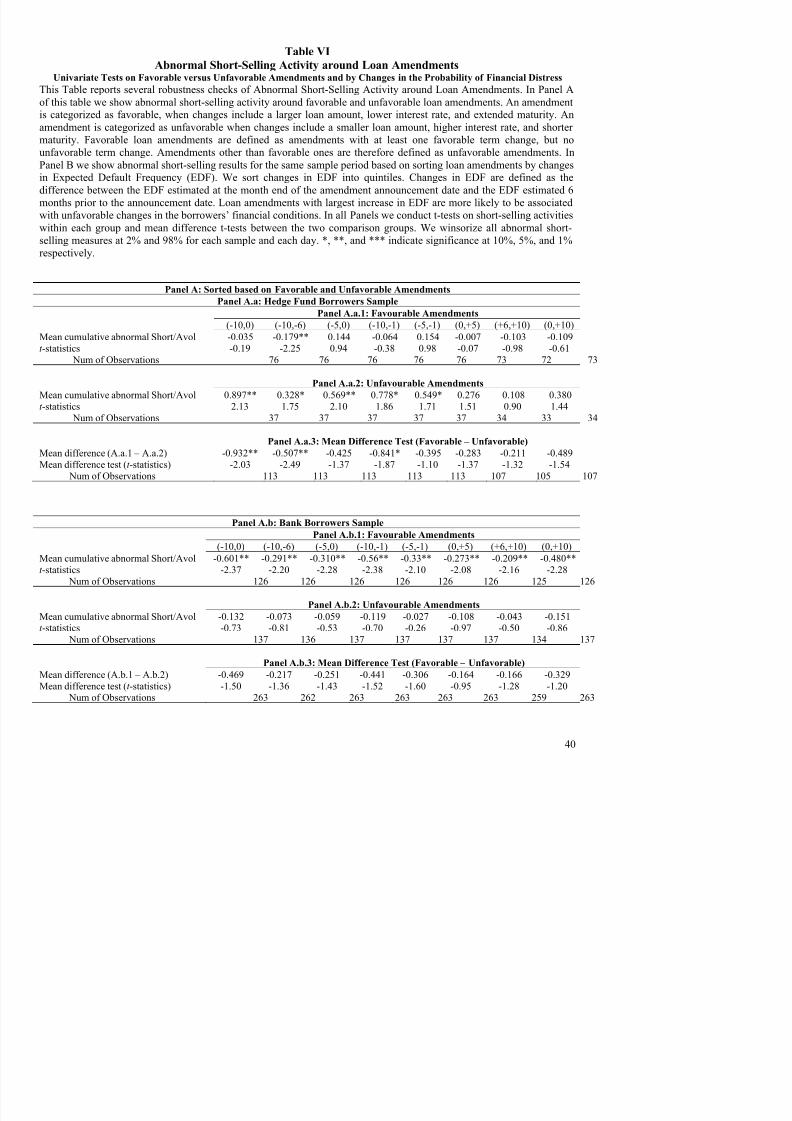
As discussed above, the outcome of a loan amendment can result in tighter (unfavorable)
or looser (favorable) contractual terms for the borrower.25 As can be seen for hedge fund
borrowers, in Panel A.a of Table VI, abnormal short-selling is positive and significant for all
windows prior to an unfavorable amendment announcement (i.e. for windows (-10, -1), (-10, 0),
(-10, -6), (-5, -1) and (-5, 0)), while it is either negative or insignificant for favorable
amendments. By contrast, for the bank loan amendment sample (Panel A.b of Table VI),
abnormal short-selling activity is negative for both unfavorable and favorable amendments.
Panel A.c of Table VI shows the differences between short-selling activity prior to unfavorable
loan amendment announcements for the hedge fund and bank samples. As can be seen, the
differences between the abnormal short-selling of the equity of hedge fund and bank borrowers
are positive and significant for all windows prior to an (unfavorable) amendment announcement.

8/6/2019 HF Loans Insider Trading February 2010
http://slidepdf.com/reader/full/hf-loans-insider-trading-february-2010 24/52
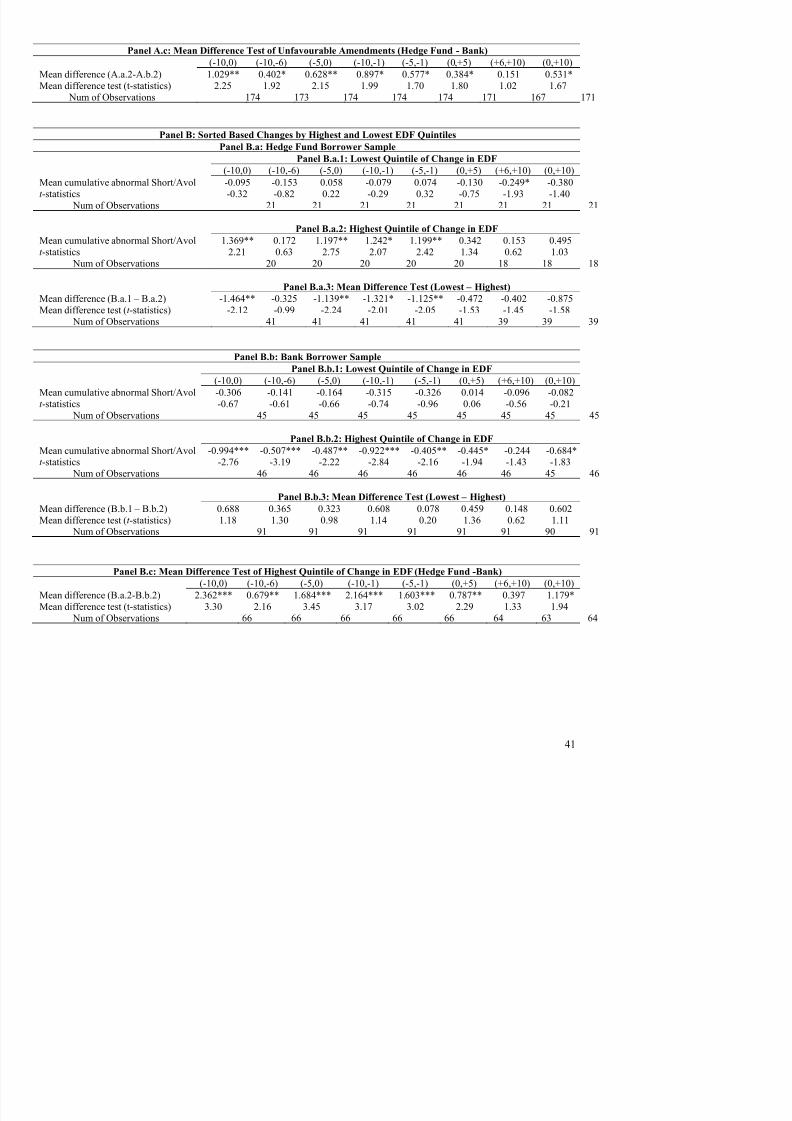
Panel B of Table VI shows the results for the differences in short-selling between the
lowest EDF quintile (lowest credit deterioration) and the highest EDF quintile (highest credit
deterioration). Consistent with Figure III, the highest credit quality deterioration quintile in the
hedge fund borrower sample shows positive and significant abnormal short-selling activity prior
to loan amendment announcements, and is significantly larger than the short-selling in the
similar quintile in the bank borrower sample (see Panel B.c of Table VI). Overall, the univariate
tests in this section provide evidence consistent with our hypothesis H3.
III. D.2. Multivariate Analysis of H2 and H3
In Table VII, we report multivariate analysis of short-selling activity prior to public
announcements of loan amendments. Our dependent variable is abnormal short-selling, scaled by
volume, prior to the announcement of loan amendments over the window [-10, -1].26 In addition
to firm and amendment specific controls, we include industry and year fixed effects in all
regression specifications. The primary coefficient of interest is the hedge fund loan dummy
variable which equals 1 if the loan syndicate includes at least one hedge fund and 0 otherwise.
As can be seen from the results, in five out the six specifications the hedge fund dummy is
positive and significant suggesting that abnormal short-selling is significantly greater for hedge
fund loan borrowers compared to bank borrowers which is consistent with H2. In regression 3,
we introduce an “unfavorable” amendment dummy and in regression 4, we interact this dummy
with our hedge fund lender dummy. In both cases, these variables are positive and significant
8/6/2019 HF Loans Insider Trading February 2010
http://slidepdf.com/reader/full/hf-loans-insider-trading-february-2010 25/52
significant (regression 4). These results are consistent with H3, i.e., in the hedge fund borrower
sample, the potential for exploiting private information is greater when a borrower has
deteriorating credit quality. Further support for H3 is provided in regressions 5 and 6, where we
introduce the change in a borrower’s EDF, as a measure of its credit quality deterioration
(regression 5) and interact this variable with our hedge fund dummy (regression 6). As can be
seen, both variables are positive and significant. Overall, the empirical findings in Table VII are
consistent with both hypotheses H2 and H3.
<Insert Table VII>
III.E. Robustness Tests on Loan Origination
In this subsection we present various robustness checks of our basic analysis for H1.
III.E.1. Propensity Score Matching
Our first robustness test addresses the concern that the decision to borrow from hedge
funds may be endogenous since lender–borrower matching is nonrandom. Lenders (banks or
hedge funds) might self-select which loans to finance, with such self-selection related to
observed firm characteristics such as a borrower’s size, leverage and financial risk. This can be
controlled for by using a number of econometric techniques. In this paper, we use Propensity
Score Matching (PSM) (see Dehejia and Wahba (2002)). PSM conditions selection on
observables and allows us to examine abnormal short-selling activities of the treatment (hedge
fund) sample of borrowing firms, in comparison to a matched control sample of bank borrowing
8/6/2019 HF Loans Insider Trading February 2010
http://slidepdf.com/reader/full/hf-loans-insider-trading-february-2010 26/52
by banks. This allows the identification of borrower characteristics that are more likely to be
related to firms obtaining financing from hedge funds rather than traditional bank lenders. We
include a number of market and accounting variables that can a priori be expected to measure
the performance and riskiness of a borrowing firm. In particular, we include a borrower’s
leverage, Altman Z-score and expected default frequency (EDF) as measures of financial risk
while we include profitability and growth of sales as measures of firm performance. We also
include firm size, cash flow, institutional ownership, Beta, momentum and idiosyncratic risk as
additional borrowing firm control variables.
In the second step, we calculate each firm’s propensity score based on the probability that
a firm with given characteristics will be financed by a hedge fund. In the third step, the hedge
fund and bank borrowing firms are matched using Leuven and Sianesi’s (2003) propensity score
matching procedure (using nearest neighborhood matching within a 0.8 caliper). In the final step,
we employ univariate tests to compare the abnormal short-selling of the equity of matched hedge
fund and bank borrowing firms around loan origination dates.
Table VIII, Panel A presents the logit regression results together with the elasticity
(economic importance), of each of the explanatory variables described above where the
dependent dummy variable is 1 for hedge fund borrowers and 0 for bank borrowers. We examine
four alternative specifications by including different control variables. In particular, we find that
the coefficient on the leverage variable is positive and significant at the 1% level, while EDF is
also positive (high EDF indicates a higher defaulting probability) and significant at the 10%
8/6/2019 HF Loans Insider Trading February 2010
http://slidepdf.com/reader/full/hf-loans-insider-trading-february-2010 27/52
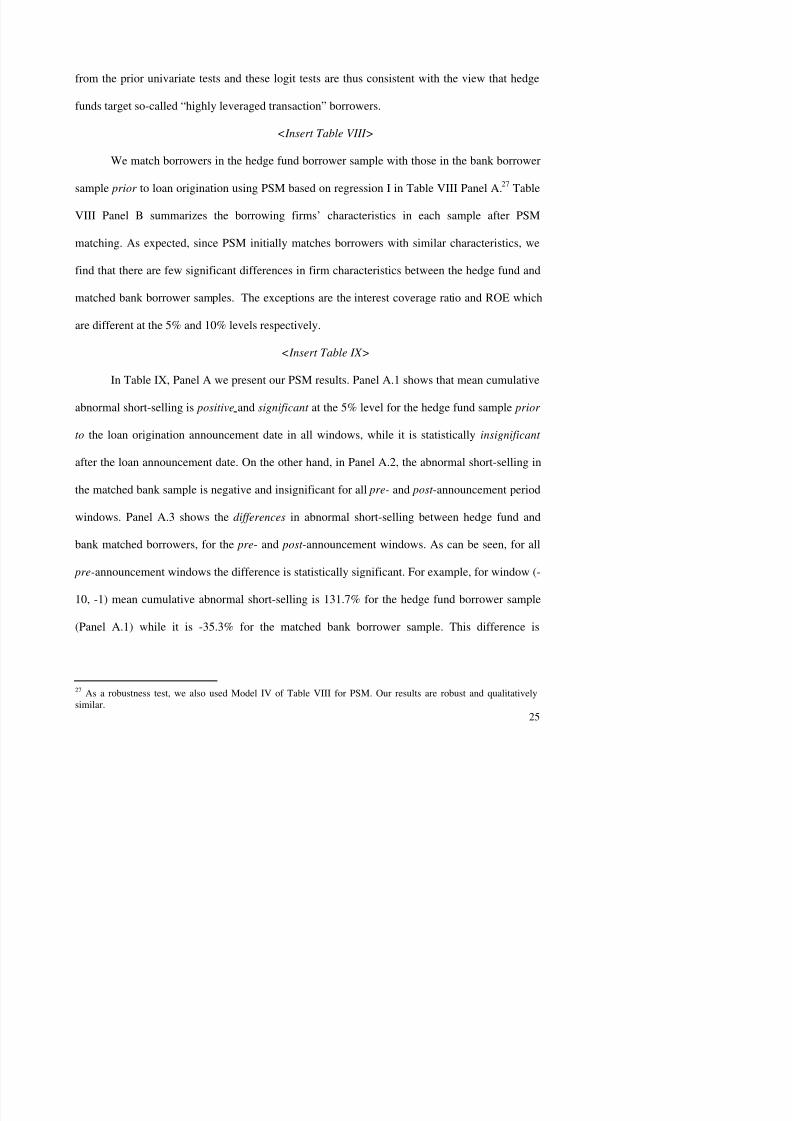
from the prior univariate tests and these logit tests are thus consistent with the view that hedge
funds target so-called “highly leveraged transaction” borrowers.
<Insert Table VIII>
We match borrowers in the hedge fund borrower sample with those in the bank borrower
sample prior to loan origination using PSM based on regression I in Table VIII Panel A.27 Table
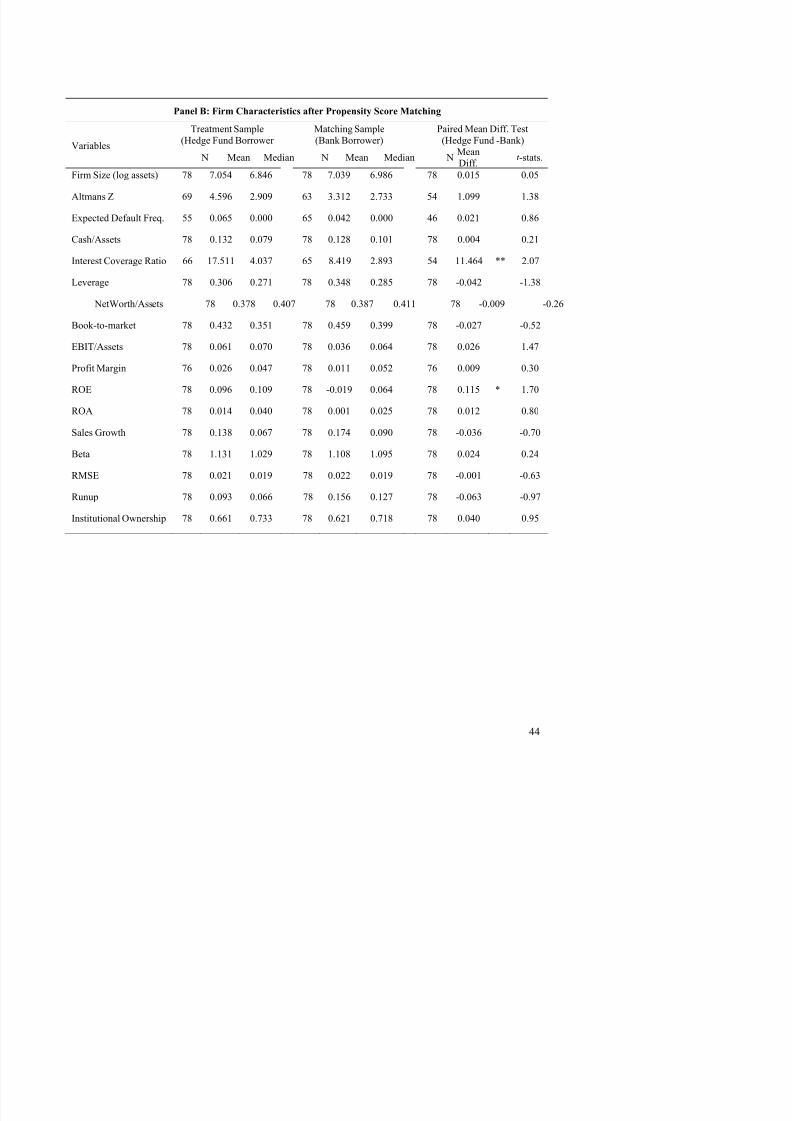
VIII Panel B summarizes the borrowing firms’ characteristics in each sample after PSM
matching. As expected, since PSM initially matches borrowers with similar characteristics, we
find that there are few significant differences in firm characteristics between the hedge fund and
matched bank borrower samples. The exceptions are the interest coverage ratio and ROE which
are different at the 5% and 10% levels respectively.
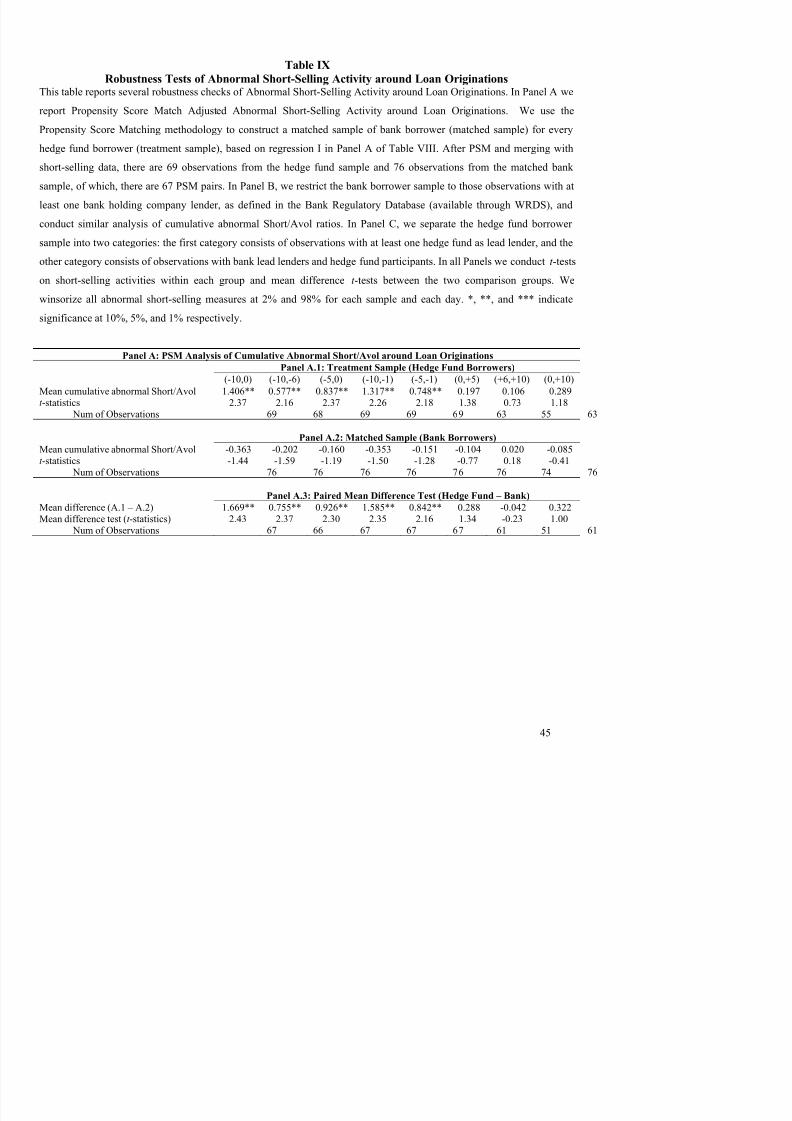
<Insert Table IX>
In Table IX, Panel A we present our PSM results. Panel A.1 shows that mean cumulative
abnormal short-selling is positive and significant at the 5% level for the hedge fund sample prior
to the loan origination announcement date in all windows, while it is statistically insignificant
after the loan announcement date. On the other hand, in Panel A.2, the abnormal short-selling in
the matched bank sample is negative and insignificant for all pre- and post -announcement period
windows. Panel A.3 shows the differences in abnormal short-selling between hedge fund and
bank matched borrowers, for the pre- and post -announcement windows. As can be seen, for all
pre-announcement windows the difference is statistically significant. For example, for window (-
10, -1) mean cumulative abnormal short-selling is 131.7% for the hedge fund borrower sample

8/6/2019 HF Loans Insider Trading February 2010
http://slidepdf.com/reader/full/hf-loans-insider-trading-february-2010 28/52
+158.5% and significant at the 5% level.28 However, while these results are supportive of H1, it
should be noted that PSM only matches on observables. Thus, there may be certain unobservable
variables that induce borrower self-selection by either a bank or a hedge fund.
III.E.2. Other Robustness Tests
In Table IX Panel B, we compare hedge fund borrowers to bank holding company
borrowers around loan origination announcements. Due to regulatory restrictions, banks by
themselves cannot directly engage in short-selling, however for bank holding companies, the
presence of a Section 20 subsidiary or an investment bank subsidiary allows them to legally
engage in short-selling through that subsidiary. Hence, short-selling differences between the
hedge fund borrower sample and the bank borrower sample could be driven in part by this
regulatory restriction on banks. However, the results in Table IX Panel B show that significant
differences in short-selling continue to exist when the hedge fund sample is compared to the sub-
sample of bank holding companies.
In Panel C, we compare abnormal short-selling activity in the hedge fund sample after
separating out those deals where at least one of the lead lenders is a hedge fund. A hedge fund
lead lender may be in a position to monitor a borrower more closely and generate more
information than a hedge fund acting as a syndicate participant. We find evidence supporting this
view, with differences in abnormal short-selling between the hedge fund lead lender and bank
lead lender sub-sample being positive and significant at the 5% level or better. Thus overall, our

8/6/2019 HF Loans Insider Trading February 2010
http://slidepdf.com/reader/full/hf-loans-insider-trading-february-2010 29/52
VI. Conclusion
In this paper we analyze the potential conflicts of interest that arise when hedge funds'
participate as lenders in the syndicated loan market. Specifically, we find evidence consistent
with the equity of hedge fund borrowers being short-sold, prior to both loan origination and loan
amendment dates, to a greater degree than that of bank borrowers. These results appear stronger
when a borrower’s loan amendment is unfavorable, or the borrower’s credit quality deteriorates.
Further, for hedge fund borrowers, we find evidence that short-selling can be profitable around
both loan origination and amendment announcement dates. Overall, our evidence is consistent
with a link between hedge funds’ generation of private information during the syndicated lending
process, and the profitable abnormal short-selling of the equity of hedge fund borrowers. Thus,
our results raise important issues regarding the regulation of hedge funds involved in both
syndicated lending and short-selling.
8/6/2019 HF Loans Insider Trading February 2010
http://slidepdf.com/reader/full/hf-loans-insider-trading-february-2010 30/52

8/6/2019 HF Loans Insider Trading February 2010
http://slidepdf.com/reader/full/hf-loans-insider-trading-february-2010 31/52
Cottier, P., 1997, Hedge Funds and Managed Futures: Performance, Risks, Strategies and Use inInvestment Portfolios (Bern: Verlag Paul Haupt).
Dehejia, R. H., and S. Wahba, 2002, Propensity Score-Matching Methods for Non-experimentalCausal Studies. Review of Economics and Statistics, 84 (1), 151-161.
Dennis, S., and D. Mullineaux, 2000, Syndicated Loans, Journal of Financial Intermediation, 9(4), 404-426.
Diamond, D. W., 1984, Financial Intermediation and Delegated Monitoring. The Review of
Economic Studies, 51 (3), 393-414.
Drucker, S. and M. Puri, 2009, On Loan Sales, Loan Contracting and Lending Relationships. Review of Financial Studies 22(7), 2635-2672
Fama, E. F., 1985, What’s Different about Banks? Journal of Monetary Economics, 15 (1), 29-39.
Gilson, S., K. John, and L.H.P. Lang, 1990, Troubled Debt Restructurings: An EmpiricalAnalysis of Private Reorganization of Firms in Default, Journal of Financial Economics, 27(2),315-353.
Griffin, J. M., and J. Xu, 2009, How Smart are the Smart Guys? A Unique View from HedgeFund Stock Holdings, Review of Financial Studies 22 (7), 2331-2370.
Huang, J., 2009, Hedge Funds and Shareholder Wealth Gains in Leveraged Buyouts, Working
paper, National University of Singapore.
Ivashina, V. and Z. Sun, 2009, Institutional Stock Trading on Loan Market Information,Working Paper and AFA 2008 New Orleans Meetings Paper.
Jiang, W., K. Li, and P. Shao, 2009, When Shareholders are Creditors: Effects of theSimultaneous Holding of Equity and Debt by Institutional Investors, Working Paper, University
of British Columbia.
Leuven, E., and B. Sianesi. 2003, PSMATCH2: Stata Module to Perform Full Mahalanobis andPropensity Score Matching, Common Support Graphing and Covariate Imbalance Testing,Statistical Software Components S432001, Boston College Department of Economics, revised 28

8/6/2019 HF Loans Insider Trading February 2010
http://slidepdf.com/reader/full/hf-loans-insider-trading-february-2010 32/52
Nini, G., D. Smith, and A. Sufi, 2009, Creditor Control Rights and Firm Investment Policy, Journal of Financial Economics, 92(3), 400-420.
Roberts, M. and A. Sufi, 2009, Control Rights and Capital Structure: An Empirical Investigation, Journal of Finance, 64(4), 1657-1695.
Roberts, M. and A. Sufi, 2009, Renegotiation of Financial Contracts: Evidence from PrivateCredit Agreements, Journal of Financial Economics, 93 (2), 159-184.
Smith, C. W., 1993, A Perspective on Accounting-Based Debt Covenant Violations. Accounting Review, 68(2), 289-303.
Sufi, A., 2007, Information Asymmetry and Financing Arrangements: Evidence from SyndicatedLoans, The Journal of Finance, 62 (2), 629-668.
Sufi, A., 2009, The Real Effects of Debt Certification: Evidence from the Introduction of Bank Loan Ratings, Review of Financial Studies, 22(4), 1659-1691.
Zheng, L., 2009, Short Sales and Post Earnings Announcement Drift, Working paper, CornellUniversity.
8/6/2019 HF Loans Insider Trading February 2010
http://slidepdf.com/reader/full/hf-loans-insider-trading-february-2010 33/52
Figure I: Short-Selling Activity around Loan Originations and Loan Amendments
This Figure shows short-selling activity around the announcement (day0) of loan originations (Panel A)
and loan amendments (Panel B). Shorting actitivity is measured as the ratio of daily total number of shares being shorted to the average daily trading volume over the window (-120,-61) (Short/Avol). For
any given borrower, the benchmark “normal” shorting activity is defined as the company’s average
Short/Avol ratio over the period from January 2nd 2005 to July 6th 2007 but excluding the event period(s),
which is the window (-60, +60). The darker and the lighter columns plot the abnormal daily Short/Avol
ratios of the unmatched hedge fund borrower sample and bank borrower sample, respectively.
8/6/2019 HF Loans Insider Trading February 2010
http://slidepdf.com/reader/full/hf-loans-insider-trading-february-2010 34/52
Figure II
Abnormal Short-Selling Activity around Loan Amendments
Sorted by Favorable and Unfavorable Amendments
This Figure contrasts the daily abnormal Short/Avol around favorable amendments with those around
unfavorable amendments in each of the hedge fund borrower (Panel A) and bank borrower (Panel B)
samples. Favorable term changes include larger loan amounts, lower interest rates and longer maturities.
Unfavorable term changes include smaller loan amounts, higher interest rates and shorter maturities.
Favorable loan amendments are defined as amendments with at least one favorable term change, but no
unfavorable term change. The amendments other than favorable ones are therefore defined as unfavorable
amendments.
8/6/2019 HF Loans Insider Trading February 2010
http://slidepdf.com/reader/full/hf-loans-insider-trading-february-2010 35/52
Figure III
Abnormal Short-Selling Activity around Loan Amendments
Sorted by Lowest and Highest Quintile of Changes in EDF
This Figure shows the abnormal Short/Avol around loan amendments of the quintile with lowest changes
in EDF and those of the quintile with highest changes in EDF. Changes in EDF are defined as the
difference between the EDF estimated at the month end of the amendment announcement date and the
EDF estimated 6 months prior to the announcement date. Loan amendments with highest changes in EDF
are more likely to be caused by unfavorable changes in the borrowers’ financial condition. Panel A and
Panel B presents the Hedge Fund Borrower sample and Bank Borrower sample, respectively.

8/6/2019 HF Loans Insider Trading February 2010
http://slidepdf.com/reader/full/hf-loans-insider-trading-february-2010 36/52
Table I
Distribution of Loan Sample by Year
Panel A reports the number of loans (at deal level) by lender category for each year from 2005 to 2007
(before July 6th 2007). The Hedge Fund borrower sample includes all loan deals with at least one lender
defined as a hedge fund or as a hedge fund management company. The other Institutional borrower
sample includes all loan deals with an Institutional borrower that is not identified as a hedge fund. The
Bank borrower sample covers all loan deals that are made by a lender or a syndicate of lenders where all
lenders are commercial banks. Panel B reports the number of borrowers in each lender category by year.
Panel A: Number of Deals in Each Category by Year
Hedge Fund
Borrower Sample
Other Institutional
Borrower Sample
Bank
Borrower Sample
Year N Pct (%) N Pct (%) N Pct (%)
2005 56 12.10 25 5.40 382 82.51
2006 46 10.72 49 11.42 334 77.86
2007 26 16.05 29 17.90 107 66.05
All 128 12.14 103 9.77 823 78.08
Panel B: Number of Unique Borrowers in Each Category by Year
Hedge FundBorrower Sample
Other InstitutionalBorrower Sample
Bank Borrower Sample
Year N Pct (%) N Pct (%) N Pct (%)
2005 55 12.01 24 5.24 379 82.75
2006 45 10.71 46 10.95 329 78.332007 26 16.05 29 17.90 107 66.05
All 126 12.12 99 9.52 815 78.37
8/6/2019 HF Loans Insider Trading February 2010
http://slidepdf.com/reader/full/hf-loans-insider-trading-february-2010 37/52
Table II
Summary StatisticsPanel A of Table II summarizes firm characteristics of borrowers for hedge fund and bank lender
categories. The statistics are reported at the deal level. All operating performance variables are measured
with COMPUSTAT data as of the fiscal year-end at least 3 months prior to the loan origination over the
period from 2005 to 2007 (before July 6th 2007). Panel B of Table II summarizes loan characteristics. We
also report t -statistics for mean differences and Wilcoxon’s rank-sum test for differences in distribution
between the samples. All variables except Expected Default Freq. are winsorized at the 2 and 98
percentiles, *, **, and *** indicate significance at 10%, 5%, and 1% respectively.
Panel A: Summary Statistics of Firm Characteristics
Hedge Fund
Borrower Sample
Bank
Borrower Sample
Mean Differences between Hedge
Fund – Bank Variables
N Mean Median N Mean Median Mean
Diff
t -stats. Wil.
Firm Size (log assets) 125 6.990 6.828 788 6.462 6.321 0.528 2.93 *** 3.11 ***
Altman’s Z Score 98 3.906 2.494 576 5.487 3.824 -1.582 -2.98 *** -3.84 ***
Expected Default Freq. 68 0.101 8.2E-09 541 0.035 1.0E-12 0.066 2.08 ** 2.63 ***
Cash/Assets 125 0.118 0.078 788 0.125 0.073 -0.006 -0.51 -0.17
Interest Coverage Ratio 104 13.383 2.656 646 18.006 5.043 -4.623 -1.25 -3.05 ***
Leverage 125 0.349 0.343 784 0.240 0.204 0.109 4.21 *** 3.98 ***
NetWorth/Assets 125 0.277 0.276 788 0.454 0.463 -0.177 -5.97*** -5.71 ***
Book-to-market 108 0.364 0.338 711 0.523 0.476 -0.158 -3.83 *** -4.01 ***
EBIT/Assets 124 0.048 0.066 787 0.065 0.071 -0.017 -1.36 -1.26
Profit Margin 121 -0.007 0.032 787 0.036 0.048 -0.043 -2.25 ** -3.13 ***
ROE 124 0.125 0.109 785 0.066 0.096 0.059 1.62 1.33
ROA 124 -0.007 0.025 787 0.028 0.037 -0.035 -2.87 *** -2.68 ***Sales Growth 123 0.129 0.047 768 0.211 0.097 -0.082 -2.50 ** -3.17 ***
Beta 93 1.144 1.045 698 1.112 1.062 0.032 0.43 0.24RMSE 93 2.332 1.976 698 2.198 1.930 0.133 0.98 0.92
Runup 93 0.087 0.065 698 0.186 0.133 -0.099 -2.04 ** -2.04 **
Institutional Ownership 94 0.599 0.683 707 0.529 0.555 0.070 2.04 ** 2.17 **
Turnover 92 7.956 6.572 701 7.062 5.392 0.893 1.33 1.64
Amihud’s Illiquidity Ratio 92 0.821 0.050 701 1.810 0.125 -0.989 -2.87 *** -3.54 ***
Panel B: Summary Statistics of Loan Characteristics Hedge Fund
Borrower Sample
Bank
Borrower Sample
Mean Differences between Hedge Fund
– Bank Variables
N Mean Median N Mean Median Mean
Diff
t -
value
Wil.
Log( Deal Amount) 128 4.836 5.094 823 4.437 4.615 0.399 3.24 *** 3.48 ***
Log (1+Loan Maturity) 128 1 885 1 947 823 1 512 1 689 0 373 11 44 *** 11 69 ***
Table III

8/6/2019 HF Loans Insider Trading February 2010
http://slidepdf.com/reader/full/hf-loans-insider-trading-february-2010 38/52
ab e
Univariate Analysis of Abnormal Short-Selling Activity around Loan Originations and Loan
AmendmentsThis Table reports the cumulative abnormal short-selling activity around the loan origination and loan amendment
announcement date during the sample period from January 2
nd
2005 to July 6
th
2007. We first define our “normal” short-selling benchmark for any borrower as the average daily short-selling over the period from January 2 nd 2005 to July 6th
2007 but excluding the event period(s) (-60,+60). The daily abnormal short-selling is the difference between the actual
daily short-selling in the event window and this “normal” short-selling benchmark. We then normalize this abnormal
short-selling by either the average daily volume prior to the event window (Short/Avol), which is calculated for a given
stock as the average trading volume in the event window (-120, -61) or the contemporaneous outstanding shares
(Short/SHROUT). Our results are robust to using either measure. Consequently, we only report the results of abnormal
Short/Avol. Panel A and Panel B report the Cumulative Abnormal Short/Avol around loan originations and loan
amendments, respectively. In all Panels we conduct t -tests on short-selling activities within each group and mean
difference t -tests between the two comparison groups. We winsorize all abnormal short-selling measures at 2% and 98%
for each sample and each day. *, **, and *** indicate significance at 10%, 5%, and 1% respectively.
Panel A: Univariate Analysis of Cumulative Abnormal Short/Avol around Loan Originations
Panel A.1: Hedge Fund Borrower Sample(-10,0) (-10,-6) (-5,0) (-10,-1) (-5,-1) (0,+5) (+6,+10) (0,+10)
Mean cum. abnormal Short/Avol 1.194** 0.470** 0.729** 1.096** 0.631** 0.213* 0.095 0.297
t -statistics 2.35 2.05 2.40 2.19 2.14 1.71 0.77 1.39
Num of Observations 81 80 81 81 81 74 65 74
Panel A.2: Bank Borrower Sample
Mean cum. abnormal Short/Avol -0.476*** -0.277*** -0.199*** -0.433*** -0.156*** -0.214*** -0.150*** -0.361***
t -statistics -5.66 -7.06 -3.96 -5.60 -3.57 -4.50 -3.33 -4.29
Num of Observations 677 676 677 676 676 671 662 671
Panel A.3: Mean Difference Test (Hedge Fund – Bank)
Mean difference (A.1 – A.2) 1.670*** 0.747*** 0.929*** 1.529*** 0.788*** 0.427*** 0.245* 0.658***Mean difference test (t -statistics) 3.24 3.21 3.02 3.02 2.64 3.19 1.85 2.87
Num of Observations 758 756 758 757 757 745 727 745
Panel B: Univariate Analysis of Cumulative Abnormal Short/Avol around Loan Amendments
Panel B.1: Hedge Fund Borrower Sample(-10,0) (-10,-6) (-5,0) (-10,-1) (-5,-1) (0,+5) (+6,+10) (0,+10)
Mean cum. abnormal Short/Avol 0.270 -0.013 0.283** 0.212 0.284* 0.083 -0.037 0.047
t -statistics 1.43 -0.15 2.08 1.17 1.90 0.93 -0.45 0.31 Num of Observations 113 113 113 113 113 107 105 107
P l B 2 B k B S l
8/6/2019 HF Loans Insider Trading February 2010
http://slidepdf.com/reader/full/hf-loans-insider-trading-february-2010 39/52

8/6/2019 HF Loans Insider Trading February 2010
http://slidepdf.com/reader/full/hf-loans-insider-trading-february-2010 40/52
Panel B: Bank Borrower Sample
Short Position Closing Day Post AnnouncementShorting Day N 0 1 2 3 4 5 6 7 8 9 10 15 20 30
-10 258 6,599 6,733 8,826 8,914 10,184 8,080 7,049 7,406 8,767 9,387 7,749 7,794 6,540 9,575
-9 256 -4,186 -4,678 -4,145 -5,379 -3,539 -5,707 -6,973 -6,289 -8,973 -11,040 -12,438 -17,202 -18,379 -15,225-8 259 -277 -1,614 -1,313 -1,579 -2,393 -3,624 -3,814 -3,149 -4,979 -4,112 -7,053 -6,535 -8,862 -9,771
-7 258 5,185 4,182 4,898 4,565 3,557 1,552 1,796 2,801 2,217 2,338 -91 -3,706 -5,338 -1,079
-6 257 -3,751 -4,211 -2,517 -1,876 886 -991 -1,071 -2,339 -3,593 -1,907 -6,267 -5,672 -6,847 -4,750-5 257 -1,481 -2,489 -1,057 702 3,073
1,560 345 -2,009 -4,882 -1,360 -6,413 -2,936 828 4,680
-4 255 -1,204 -4,419 -4,391 -3,288 -643 -2,514 -2,746 -7,588 -9,870 -8,185 -15,157 -10,264 -8,456 -4,417
-3 259 -1,844 -4,206 -6,183 -4,465 -1,822 -3,164 -2,172 -5,480 -7,240 -6,409 -10,879 -12,241 -12,593 -16,912-2 260 -590 -4,283 -5,163 -6,234 -4,316 -4,800 -4,901 -7,267 -11,287 -11,953 -15,760 -17,711 -15,818 -16,022-1 261 222 -949 -1,481 -1,785 47 -1,794 -1,811 -3,907 -4,454 -4,788 -8,293 -9,498 -9,911 -10,721
P r e-Ann o un c e
m e n t
Sum(-10,-1) -1,328
-15,933 -12,526
-10,426
5,032 -11,403
-14,297
-27,822
-44,295
-38,030
-74,602
-77,970
-78,837 -64,644
0 259 --- -944 1,604 74 1,219 -901 396 933 -1,461 -2,721 -5,143 -3,330 -5,065 -10,786
1 262 --- --- -460
-618 1,705 -617 775 2,357 -2,853 -3,383 -6,619 -7,125 -6,716 -7,649
2 255 --- --- --- 535
2,407 1,264 -313 732 -4,167 -3,757 -5,027 -8,243 -7,232 -5,660
3 256 --- --- --- --- 1,246
1,742 1,962 3,403 -323 -3 -4,347 -131 -4,832 2,9864 255 --- --- --- --- --- -1,744 -1,160 -3,039 -6,990 -3,257 -6,519 -11,719 -20,459 -18,254
5 257 --- --- --- --- --- --- -1,706 -3,297 -4,781 -4,264 -10,522 -10,487 -13,871 -10,499
6 257 --- --- --- --- --- --- --- -1,818 -4,158 -5,877 -10,530 -8,272 -10,438 -2,703
7 254 --- --- --- --- --- --- --- --- -3,369 -5,667 -6,112 -11,324 -11,710
-6,536
8 254 --- --- --- --- --- --- --- --- --- -655 -3,597 -2,046 -3,375 -9639 252 --- --- --- --- --- --- --- --- --- --- 652
-6,315 -7,910 -4,460
10 254 --- --- --- --- --- --- --- --- --- --- --- -12,367 -9,587 7,771
P o s t -Ann o un c e m e n t
Sum(0,+10) -944 1,144 -9 6,577 -256 -46 -728 -28,104 -29,584 -57,764 -81,359 -101,194 -56,754
38
8/6/2019 HF Loans Insider Trading February 2010
http://slidepdf.com/reader/full/hf-loans-insider-trading-february-2010 41/52
Table VI
Ab l Sh S lli A i i d L A d
8/6/2019 HF Loans Insider Trading February 2010
http://slidepdf.com/reader/full/hf-loans-insider-trading-february-2010 42/52
Abnormal Short-Selling Activity around Loan AmendmentsUnivariate Tests on Favorable versus Unfavorable Amendments and by Changes in the Probability of Financial Distress
This Table reports several robustness checks of Abnormal Short-Selling Activity around Loan Amendments. In Panel A
of this table we show abnormal short-selling activity around favorable and unfavorable loan amendments. An amendment
is categorized as favorable, when changes include a larger loan amount, lower interest rate, and extended maturity. Anamendment is categorized as unfavorable when changes include a smaller loan amount, higher interest rate, and shorter
maturity. Favorable loan amendments are defined as amendments with at least one favorable term change, but no
unfavorable term change. Amendments other than favorable ones are therefore defined as unfavorable amendments. In
Panel B we show abnormal short-selling results for the same sample period based on sorting loan amendments by changesin Expected Default Frequency (EDF). We sort changes in EDF into quintiles. Changes in EDF are defined as the
difference between the EDF estimated at the month end of the amendment announcement date and the EDF estimated 6
months prior to the announcement date. Loan amendments with largest increase in EDF are more likely to be associated
with unfavorable changes in the borrowers’ financial conditions. In all Panels we conduct t-tests on short-selling activities
within each group and mean difference t-tests between the two comparison groups. We winsorize all abnormal short-selling measures at 2% and 98% for each sample and each day. *, **, and *** indicate significance at 10%, 5%, and 1%
respectively.
Panel A: Sorted based on Favorable and Unfavorable Amendments
Panel A.a: Hedge Fund Borrowers Sample
Panel A.a.1: Favourable Amendments
(-10,0) (-10,-6) (-5,0) (-10,-1) (-5,-1) (0,+5) (+6,+10) (0,+10)
Mean cumulative abnormal Short/Avol -0.035 -0.179** 0.144 -0.064 0.154 -0.007 -0.103 -0.109
t -statistics -0.19 -2.25 0.94 -0.38 0.98 -0.07 -0.98 -0.61
Num of Observations 76 76 76 76 76 73 72 73
Panel A.a.2: Unfavourable Amendments
Mean cumulative abnormal Short/Avol 0.897** 0.328* 0.569** 0.778* 0.549* 0.276 0.108 0.380
t -statistics 2.13 1.75 2.10 1.86 1.71 1.51 0.90 1.44
Num of Observations 37 37 37 37 37 34 33 34
Panel A.a.3: Mean Difference Test (Favorable – Unfavorable)
Mean difference (A.a.1 – A.a.2) -0.932** -0.507** -0.425 -0.841* -0.395 -0.283 -0.211 -0.489
Mean difference test (t -statistics) -2.03 -2.49 -1.37 -1.87 -1.10 -1.37 -1.32 -1.54
Num of Observations 113 113 113 113 113 107 105 107
Panel A.b: Bank Borrowers Sample
Panel A.b.1: Favourable Amendments
(-10,0) (-10,-6) (-5,0) (-10,-1) (-5,-1) (0,+5) (+6,+10) (0,+10)Mean cumulative abnormal Short/Avol -0.601** -0.291** -0.310** -0.56** -0.33** -0.273** -0.209** -0.480**
t -statistics -2.37 -2.20 -2.28 -2.38 -2.10 -2.08 -2.16 -2.28
Num of Observations 126 126 126 126 126 126 125 126
Panel A.b.2: Unfavourable Amendments
Panel A.c: Mean Difference Test of Unfavourable Amendments (Hedge Fund - Bank)
( 10 0) ( 10 6) ( 5 0) ( 10 1) ( 5 1) (0 +5) (+6 +10) (0 +10)
8/6/2019 HF Loans Insider Trading February 2010
http://slidepdf.com/reader/full/hf-loans-insider-trading-february-2010 43/52
(-10,0) (-10,-6) (-5,0) (-10,-1) (-5,-1) (0,+5) (+6,+10) (0,+10)
Mean difference (A.a.2-A.b.2) 1.029** 0.402* 0.628** 0.897* 0.577* 0.384* 0.151 0.531*
Mean difference test (t-statistics) 2.25 1.92 2.15 1.99 1.70 1.80 1.02 1.67
Num of Observations 174 173 174 174 174 171 167 171
Panel B: Sorted Based Changes by Highest and Lowest EDF Quintiles
Panel B.a: Hedge Fund Borrower Sample
Panel B.a.1: Lowest Quintile of Change in EDF
(-10,0) (-10,-6) (-5,0) (-10,-1) (-5,-1) (0,+5) (+6,+10) (0,+10)
Mean cumulative abnormal Short/Avol -0.095 -0.153 0.058 -0.079 0.074 -0.130 -0.249* -0.380
t -statistics -0.32 -0.82 0.22 -0.29 0.32 -0.75 -1.93 -1.40
Num of Observations 21 21 21 21 21 21 21 21
Panel B.a.2: Highest Quintile of Change in EDF
Mean cumulative abnormal Short/Avol 1.369** 0.172 1.197** 1.242* 1.199** 0.342 0.153 0.495
t -statistics 2.21 0.63 2.75 2.07 2.42 1.34 0.62 1.03
Num of Observations 20 20 20 20 20 18 18 18
Panel B.a.3: Mean Difference Test (Lowest – Highest)
Mean difference (B.a.1 – B.a.2) -1.464** -0.325 -1.139** -1.321* -1.125** -0.472 -0.402 -0.875
Mean difference test (t -statistics) -2.12 -0.99 -2.24 -2.01 -2.05 -1.53 -1.45 -1.58
Num of Observations 41 41 41 41 41 39 39 39
Panel B.b: Bank Borrower Sample
Panel B.b.1: Lowest Quintile of Change in EDF
(-10,0) (-10,-6) (-5,0) (-10,-1) (-5,-1) (0,+5) (+6,+10) (0,+10)
Mean cumulative abnormal Short/Avol -0.306 -0.141 -0.164 -0.315 -0.326 0.014 -0.096 -0.082
t -statistics -0.67 -0.61 -0.66 -0.74 -0.96 0.06 -0.56 -0.21
Num of Observations 45 45 45 45 45 45 45 45
Panel B.b.2: Highest Quintile of Change in EDFMean cumulative abnormal Short/Avol -0.994*** -0.507*** -0.487** -0.922*** -0.405** -0.445* -0.244 -0.684*t -statistics -2.76 -3.19 -2.22 -2.84 -2.16 -1.94 -1.43 -1.83
Num of Observations 46 46 46 46 46 46 45 46
Panel B.b.3: Mean Difference Test (Lowest – Highest)
Mean difference (B.b.1 – B.b.2) 0.688 0.365 0.323 0.608 0.078 0.459 0.148 0.602
Mean difference test (t -statistics) 1.18 1.30 0.98 1.14 0.20 1.36 0.62 1.11 Num of Observations 91 91 91 91 91 91 90 91
Panel B.c: Mean Difference Test of Highest Quintile of Change in EDF (Hedge Fund -Bank)
(-10,0) (-10,-6) (-5,0) (-10,-1) (-5,-1) (0,+5) (+6,+10) (0,+10)
Mean difference (B.a.2-B.b.2) 2.362*** 0.679** 1.684*** 2.164*** 1.603*** 0.787** 0.397 1.179*
Mean difference test (t-statistics) 3 30 2 16 3 45 3 17 3 02 2 29 1 33 1 94

8/6/2019 HF Loans Insider Trading February 2010
http://slidepdf.com/reader/full/hf-loans-insider-trading-february-2010 44/52

8/6/2019 HF Loans Insider Trading February 2010
http://slidepdf.com/reader/full/hf-loans-insider-trading-february-2010 45/52
8/6/2019 HF Loans Insider Trading February 2010
http://slidepdf.com/reader/full/hf-loans-insider-trading-february-2010 46/52
Panel B: Firm Characteristics after Propensity Score Matching
Treatment Sample
(Hedge Fund Borrower
Matching Sample
(Bank Borrower)
Paired Mean Diff. Test
(Hedge Fund -Bank) Variables
N Mean Median N Mean Median NMeanDiff.
t -stats.
Firm Size (log assets) 78 7.054 6.846 78 7.039 6.986 78 0.015 0.05
Altmans Z 69 4.596 2.909 63 3.312 2.733 54 1.099 1.38
Expected Default Freq. 55 0.065 0.000 65 0.042 0.000 46 0.021 0.86
Cash/Assets 78 0.132 0.079 78 0.128 0.101 78 0.004 0.21
Interest Coverage Ratio 66 17.511 4.037 65 8.419 2.893 54 11.464 ** 2.07
Leverage 78 0.306 0.271 78 0.348 0.285 78 -0.042 -1.38
NetWorth/Assets 78 0.378 0.407 78 0.387 0.411 78 -0.009 -0.26
Book-to-market 78 0.432 0.351 78 0.459 0.399 78 -0.027 -0.52
EBIT/Assets 78 0.061 0.070 78 0.036 0.064 78 0.026 1.47
Profit Margin 76 0.026 0.047 78 0.011 0.052 76 0.009 0.30
ROE 78 0.096 0.109 78 -0.019 0.064 78 0.115 * 1.70
ROA 78 0.014 0.040 78 0.001 0.025 78 0.012 0.80
Sales Growth 78 0.138 0.067 78 0.174 0.090 78 -0.036 -0.70
Beta 78 1.131 1.029 78 1.108 1.095 78 0.024 0.24
RMSE 78 0.021 0.019 78 0.022 0.019 78 -0.001 -0.63
Runup 78 0.093 0.066 78 0.156 0.127 78 -0.063 -0.97
Institutional Ownership 78 0.661 0.733 78 0.621 0.718 78 0.040 0.95
Table IX
8/6/2019 HF Loans Insider Trading February 2010
http://slidepdf.com/reader/full/hf-loans-insider-trading-february-2010 47/52
b e
Robustness Tests of Abnormal Short-Selling Activity around Loan OriginationsThis table reports several robustness checks of Abnormal Short-Selling Activity around Loan Originations. In Panel A we
report Propensity Score Match Adjusted Abnormal Short-Selling Activity around Loan Originations. We use the
Propensity Score Matching methodology to construct a matched sample of bank borrower (matched sample) for every
hedge fund borrower (treatment sample), based on regression I in Panel A of Table VIII. After PSM and merging with
short-selling data, there are 69 observations from the hedge fund sample and 76 observations from the matched bank
sample, of which, there are 67 PSM pairs. In Panel B, we restrict the bank borrower sample to those observations with at
least one bank holding company lender, as defined in the Bank Regulatory Database (available through WRDS), and
conduct similar analysis of cumulative abnormal Short/Avol ratios. In Panel C, we separate the hedge fund borrower
sample into two categories: the first category consists of observations with at least one hedge fund as lead lender, and the
other category consists of observations with bank lead lenders and hedge fund participants. In all Panels we conduct t -tests
on short-selling activities within each group and mean difference t -tests between the two comparison groups. We
winsorize all abnormal short-selling measures at 2% and 98% for each sample and each day. *, **, and *** indicate
significance at 10%, 5%, and 1% respectively.
Panel A: PSM Analysis of Cumulative Abnormal Short/Avol around Loan Originations
Panel A.1: Treatment Sample (Hedge Fund Borrowers)
(-10,0) (-10,-6) (-5,0) (-10,-1) (-5,-1) (0,+5) (+6,+10) (0,+10)
Mean cumulative abnormal Short/Avol 1.406** 0.577** 0.837** 1.317** 0.748** 0.197 0.106 0.289t -statistics 2.37 2.16 2.37 2.26 2.18 1.38 0.73 1.18
Num of Observations 69 68 69 69 69 63 55 63
Panel A.2: Matched Sample (Bank Borrowers)Mean cumulative abnormal Short/Avol -0.363 -0.202 -0.160 -0.353 -0.151 -0.104 0.020 -0.085
t -statistics -1.44 -1.59 -1.19 -1.50 -1.28 -0.77 0.18 -0.41
Num of Observations 76 76 76 76 76 76 74 76
Panel A.3: Paired Mean Difference Test (Hedge Fund – Bank)
Mean difference (A.1 – A.2) 1.669** 0.755** 0.926** 1.585** 0.842** 0.288 -0.042 0.322
Mean difference test (t -statistics) 2.43 2.37 2.30 2.35 2.16 1.34 -0.23 1.00
Num of Observations 67 66 67 67 67 61 51 61
P l B C l ti Ab l Sh t/A l b t H d F d B d BHC B
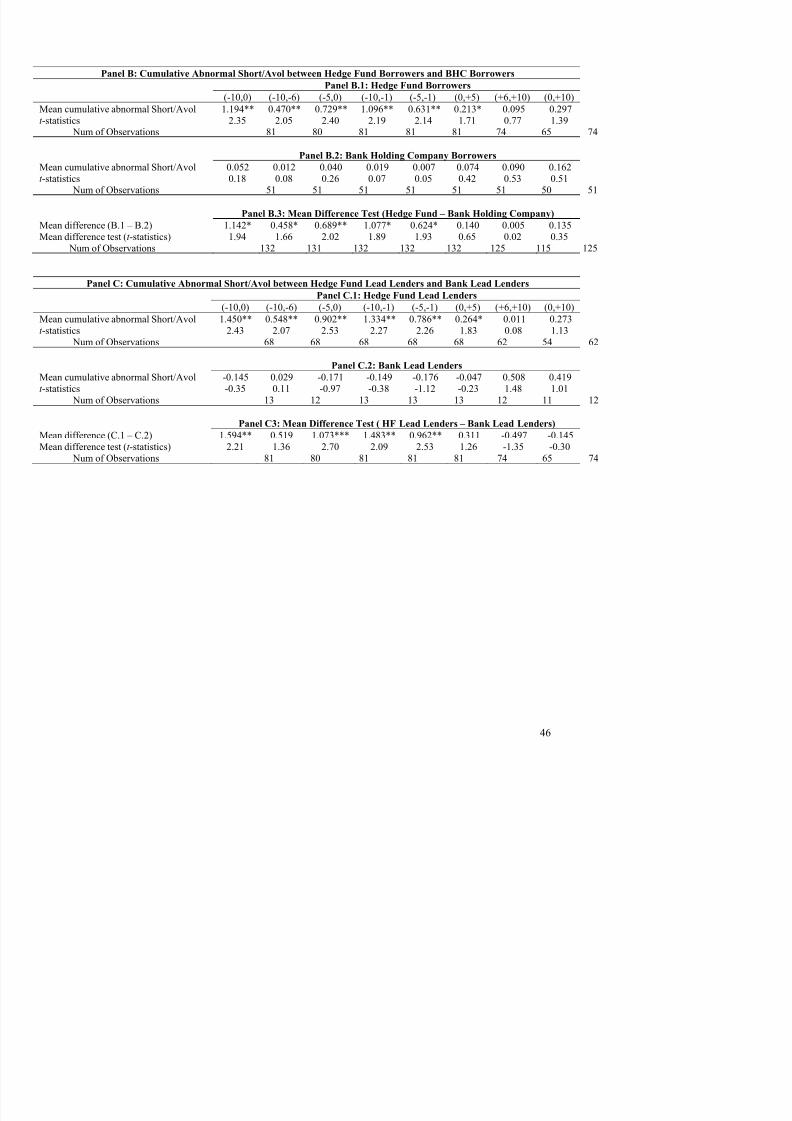
8/6/2019 HF Loans Insider Trading February 2010
http://slidepdf.com/reader/full/hf-loans-insider-trading-february-2010 48/52
Panel B: Cumulative Abnormal Short/Avol between Hedge Fund Borrowers and BHC Borrowers
Panel B.1: Hedge Fund Borrowers
(-10,0) (-10,-6) (-5,0) (-10,-1) (-5,-1) (0,+5) (+6,+10) (0,+10)
Mean cumulative abnormal Short/Avol 1.194** 0.470** 0.729** 1.096** 0.631** 0.213* 0.095 0.297
t -statistics 2.35 2.05 2.40 2.19 2.14 1.71 0.77 1.39 Num of Observations 81 80 81 81 81 74 65 74
Panel B.2: Bank Holding Company Borrowers
Mean cumulative abnormal Short/Avol 0.052 0.012 0.040 0.019 0.007 0.074 0.090 0.162t -statistics 0.18 0.08 0.26 0.07 0.05 0.42 0.53 0.51
Num of Observations 51 51 51 51 51 51 50 51
Panel B.3: Mean Difference Test (Hedge Fund – Bank Holding Company)
Mean difference (B.1 – B.2) 1.142* 0.458* 0.689** 1.077* 0.624* 0.140 0.005 0.135Mean difference test (t -statistics) 1.94 1.66 2.02 1.89 1.93 0.65 0.02 0.35
Num of Observations 132 131 132 132 132 125 115 125
Panel C: Cumulative Abnormal Short/Avol between Hedge Fund Lead Lenders and Bank Lead Lenders
Panel C.1: Hedge Fund Lead Lenders
(-10,0) (-10,-6) (-5,0) (-10,-1) (-5,-1) (0,+5) (+6,+10) (0,+10)
Mean cumulative abnormal Short/Avol 1.450** 0.548** 0.902** 1.334** 0.786** 0.264* 0.011 0.273
t -statistics 2.43 2.07 2.53 2.27 2.26 1.83 0.08 1.13 Num of Observations 68 68 68 68 68 62 54 62
Panel C.2: Bank Lead Lenders
Mean cumulative abnormal Short/Avol -0.145 0.029 -0.171 -0.149 -0.176 -0.047 0.508 0.419
t -statistics -0.35 0.11 -0.97 -0.38 -1.12 -0.23 1.48 1.01
Num of Observations 13 12 13 13 13 12 11 12
Panel C3: Mean Difference Test ( HF Lead Lenders – Bank Lead Lenders)
Mean difference (C.1 – C.2) 1.594** 0.519 1.073*** 1.483** 0.962** 0.311 -0.497 -0.145Mean difference test (t -statistics) 2.21 1.36 2.70 2.09 2.53 1.26 -1.35 -0.30
Num of Observations 81 80 81 81 81 74 65 74
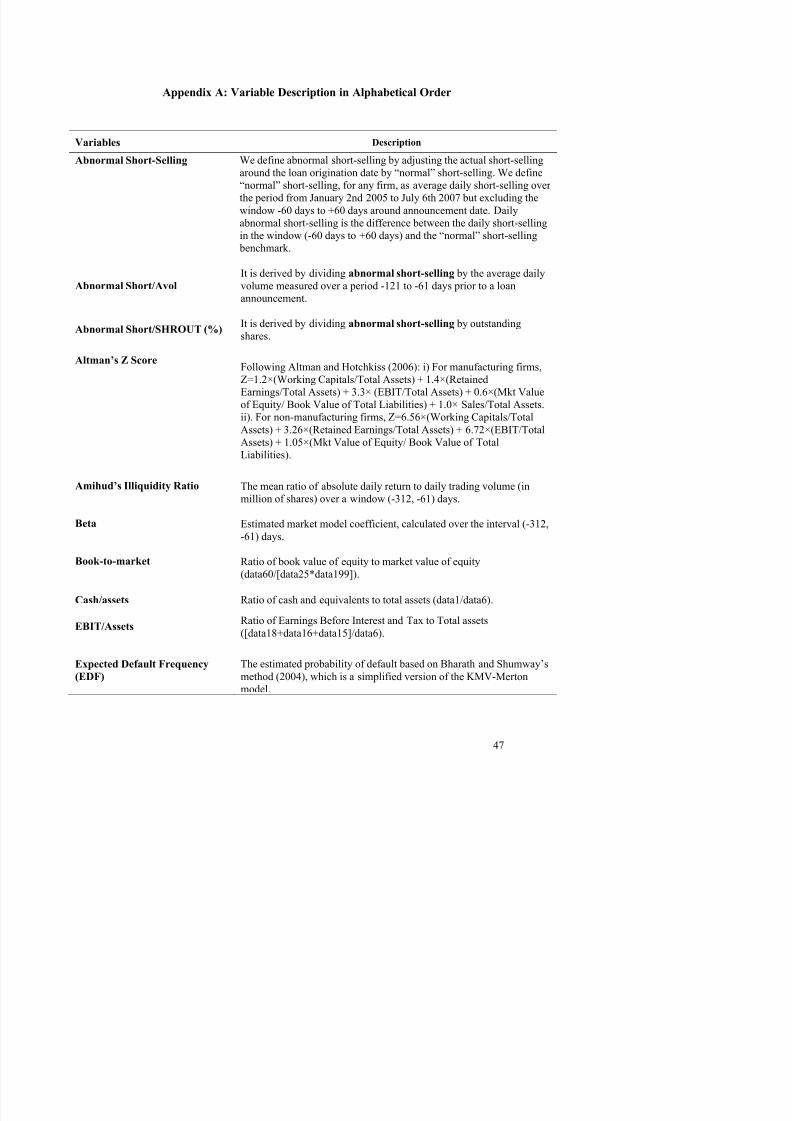
8/6/2019 HF Loans Insider Trading February 2010
http://slidepdf.com/reader/full/hf-loans-insider-trading-february-2010 49/52
Appendix A: Variable Description in Alphabetical Order
Variables Description
Abnormal Short-Selling We define abnormal short-selling by adjusting the actual short-selling
around the loan origination date by “normal” short-selling. We define
“normal” short-selling, for any firm, as average daily short-selling over
the period from January 2nd 2005 to July 6th 2007 but excluding the
window -60 days to +60 days around announcement date. Daily
abnormal short-selling is the difference between the daily short-sellingin the window (-60 days to +60 days) and the “normal” short-selling
benchmark.
Abnormal Short/Avol
It is derived by dividing abnormal short-selling by the average daily
volume measured over a period -121 to -61 days prior to a loan
announcement.
Abnormal Short/SHROUT (%)
It is derived by dividing abnormal short-selling by outstanding
shares.
Altman’s Z ScoreFollowing Altman and Hotchkiss (2006): i) For manufacturing firms,
Z=1.2×(Working Capitals/Total Assets) + 1.4×(Retained
Earnings/Total Assets) + 3.3× (EBIT/Total Assets) + 0.6×(Mkt Value
of Equity/ Book Value of Total Liabilities) + 1.0× Sales/Total Assets.
ii). For non-manufacturing firms, Z=6.56×(Working Capitals/Total
Assets) + 3.26×(Retained Earnings/Total Assets) + 6.72×(EBIT/Total
Assets) + 1.05×(Mkt Value of Equity/ Book Value of TotalLiabilities).
Amihud’s Illiquidity Ratio The mean ratio of absolute daily return to daily trading volume (in
million of shares) over a window (-312, -61) days.
Beta Estimated market model coefficient, calculated over the interval (-312,
-61) days.
Book-to-market Ratio of book value of equity to market value of equity
(data60/[data25*data199]).
Cash/assets Ratio of cash and equivalents to total assets (data1/data6).
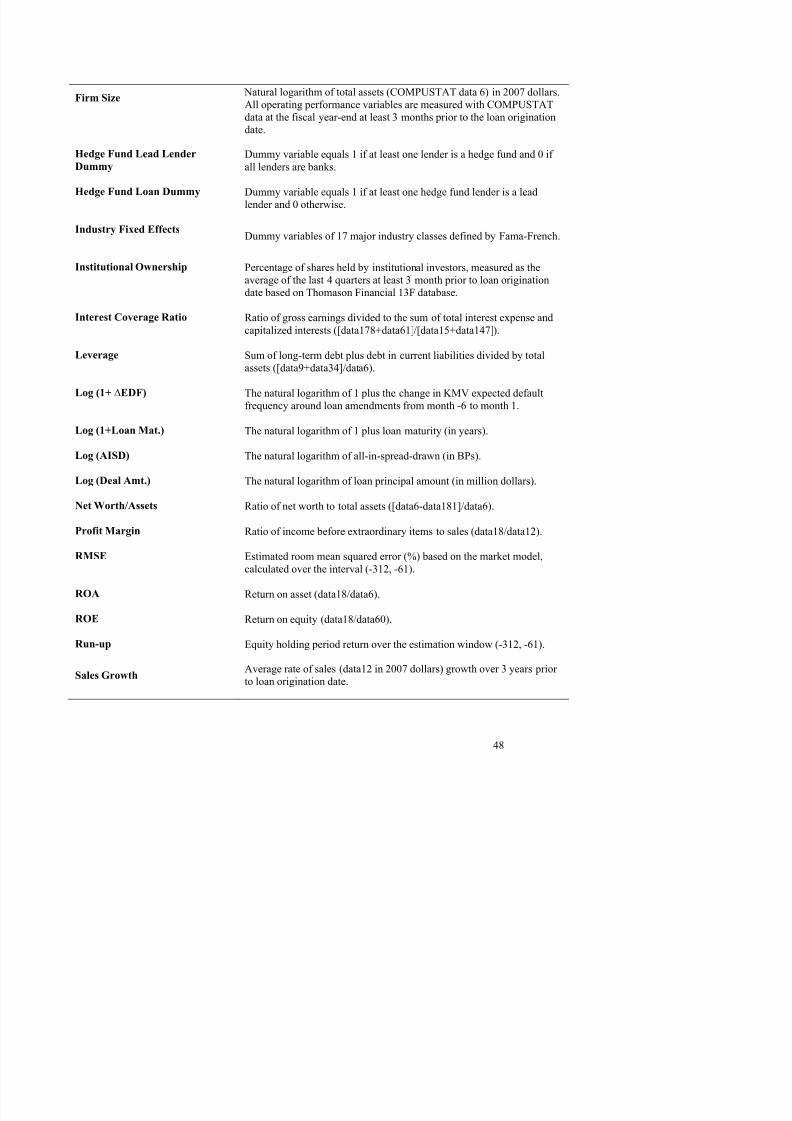
8/6/2019 HF Loans Insider Trading February 2010
http://slidepdf.com/reader/full/hf-loans-insider-trading-february-2010 50/52
Firm Size Natural logarithm of total assets (COMPUSTAT data 6) in 2007 dollars.
All operating performance variables are measured with COMPUSTAT
data at the fiscal year-end at least 3 months prior to the loan originationdate.
Hedge Fund Lead Lender
DummyDummy variable equals 1 if at least one lender is a hedge fund and 0 if
all lenders are banks.
Hedge Fund Loan Dummy Dummy variable equals 1 if at least one hedge fund lender is a lead
lender and 0 otherwise.
Industry Fixed EffectsDummy variables of 17 major industry classes defined by Fama-French.
Institutional Ownership Percentage of shares held by institutional investors, measured as the
average of the last 4 quarters at least 3 month prior to loan origination
date based on Thomason Financial 13F database.
Interest Coverage Ratio Ratio of gross earnings divided to the sum of total interest expense and
capitalized interests ([data178+data61]/[data15+data147]).
Leverage Sum of long-term debt plus debt in current liabilities divided by total
assets ([data9+data34]/data6).
Log (1+ ∆EDF) The natural logarithm of 1 plus the change in KMV expected default
frequency around loan amendments from month -6 to month 1.
Log (1+Loan Mat.) The natural logarithm of 1 plus loan maturity (in years).
Log (AISD) The natural logarithm of all-in-spread-drawn (in BPs).
Log (Deal Amt.) The natural logarithm of loan principal amount (in million dollars).
Net Worth/Assets Ratio of net worth to total assets ([data6-data181]/data6).
Profit Margin Ratio of income before extraordinary items to sales (data18/data12).
RMSE Estimated room mean squared error (%) based on the market model,
calculated over the interval (-312, -61).
ROA Return on asset (data18/data6).

8/6/2019 HF Loans Insider Trading February 2010
http://slidepdf.com/reader/full/hf-loans-insider-trading-february-2010 51/52
TurnoverThe mean ratio of daily trading volume (in thousand shares) to number
of shares outstanding (in million shares) over the interval (-312, -61)
days.
Unfavorable DummyDummy variable equals 1 if a loan amendment is unfavorable and 0 if it
is favorable.
Year Fixed Effects Indicators for year of loan deal origination or amendment.
A di B C l ti b t V i bl
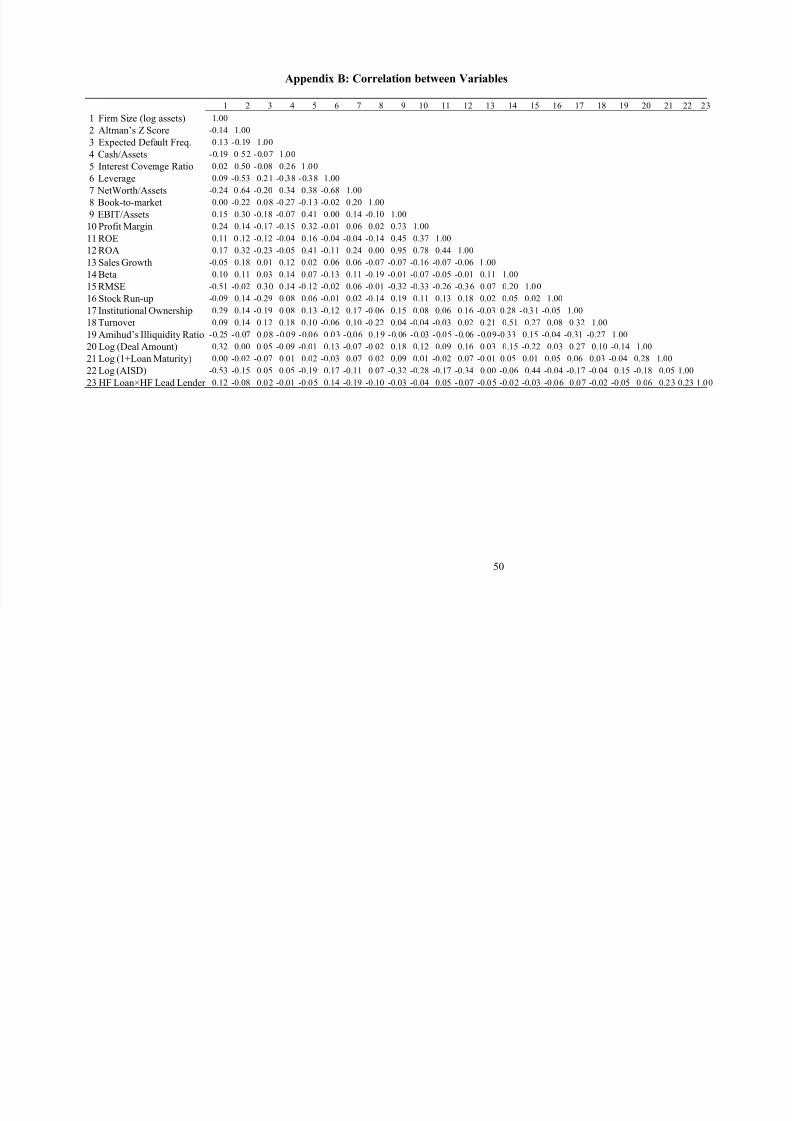
8/6/2019 HF Loans Insider Trading February 2010
http://slidepdf.com/reader/full/hf-loans-insider-trading-february-2010 52/52
Appendix B: Correlation between Variables
1 2 3 4 5 6 7 8 9 10 11 12 13 14 15 16 17 18 19 20 21 22 23
1 Firm Size (log assets) 1.002 Altman’s Z Score -0.14 1.00
3 Expected Default Freq. 0.13 -0.19 1.00
4 Cash/Assets -0.19 0.52 -0.07 1.00
5 Interest Coverage Ratio 0.02 0.50 -0.08 0.26 1.00
6 Leverage 0.09 -0.53 0.21 -0.38 -0.38 1.00
7 NetWorth/Assets -0.24 0.64 -0.20 0.34 0.38 -0.68 1.00
8 Book-to-market 0.00 -0.22 0.08 -0.27 -0.13 -0.02 0.20 1.00
9 EBIT/Assets 0.15 0.30 -0.18 -0.07 0.41 0.00 0.14 -0.10 1.00
10 Profit Margin 0.24 0.14 -0.17 -0.15 0.32 -0.01 0.06 0.02 0.73 1.0011 ROE 0.11 0.12 -0.12 -0.04 0.16 -0.04 -0.04 -0.14 0.45 0.37 1.00
12 ROA 0.17 0.32 -0.23 -0.05 0.41 -0.11 0.24 0.00 0.95 0.78 0.44 1.00
13 Sales Growth -0.05 0.18 0.01 0.12 0.02 0.06 0.06 -0.07 -0.07 -0.16 -0.07 -0.06 1.00
14 Beta 0.10 0.11 0.03 0.14 0.07 -0.13 0.11 -0.19 -0.01 -0.07 -0.05 -0.01 0.11 1.00
15 RMSE -0.51 -0.02 0.30 0.14 -0.12 -0.02 0.06 -0.01 -0.32 -0.33 -0.26 -0.36 0.07 0.20 1.00
16 Stock Run-up -0.09 0.14 -0.29 0.08 0.06 -0.01 0.02 -0.14 0.19 0.11 0.13 0.18 0.02 0.05 0.02 1.00
17 Institutional Ownership 0.29 0.14 -0.19 0.08 0.13 -0.12 0.17 -0.06 0.15 0.08 0.06 0.16 -0.03
0.28 -0.31 -0.05 1.00
18 Turnover 0.09 0.14 0.12 0.18 0.10 -0.06 0.10 -0.22 0.04 -0.04 -0.03 0.02 0.21 0.51 0.27 0.08 0.32 1.00
19 Amihud’s Illiquidity Ratio -0.25 -0.07 0.08 -0.09 -0.06 0.03 -0.06 0.19 -0.06 -0.03 -0.05 -0.06 -0.09
-0.33 0.15 -0.04 -0.31 -0.27 1.0020 Log (Deal Amount) 0.32 0.00 0.05 -0.09 -0.01 0.13 -0.07 -0.02 0.18 0.12 0.09 0.16 0.03 0.15 -0.22 0.03 0.27 0.10 -0.14 1.00
21 Log (1+Loan Maturity) 0.00 -0.02 -0.07 0.01 0.02 -0.03 0.07 0.02 0.09 0.01 -0.02 0.07 -0.01
0.05 0.01 0.05 0.06 0.03 -0.04 0.28 1.00
22 Log (AISD) -0.53 -0.15 0.05 0.05 -0.19 0.17 -0.11 0.07 -0.32 -0.28 -0.17 -0.34 0.00 -0.06 0.44 -0.04 -0.17 -0.04 0.15 -0.18 0.05 1.00
23 HF Loan×HF Lead Lender 0.12 -0.08 0.02 -0.01 -0.05 0.14 -0.19 -0.10 -0.03 -0.04 0.05 -0.07 -0.05 -0.02 -0.03 -0.06 0.07 -0.02 -0.05 0.06 0.23 0.23 1.00
50