hgcapital trust plc interim results for the six months .../media/files/h/hgcapital-trust/... ·...
TRANSCRIPT

HgCapital Trust plc Interim results for the six months ending 30 June 2009

2© Copyright 2009 HgCapital
ContentsHgCapital Trust plc
Appendices
Conclusion
Manager Update
Investment Activity
Portfolio Review
Performance
Summary

3© Copyright 2009 HgCapital
SummaryHgCapital Trust plc
� The portfolio is compact and appropriately valued.
� Action has been taken within the investment portfolio to cut costs and conserve cash.
� We retain significant liquid resources (46% of assets) to support and build our winners.
� We are beginning to see interesting new investment opportunities.
� We believe that we are well positioned to exploit what will be an exciting period for new investment.
� Economy is weak; recovery will be subdued at best.

4© Copyright 2009 HgCapital
Appendices
Conclusion
Manager Update
Investment Activity
Portfolio Review
Performance
Summary
ContentsHgCapital Trust plc
5© Copyright 2009 HgCapital
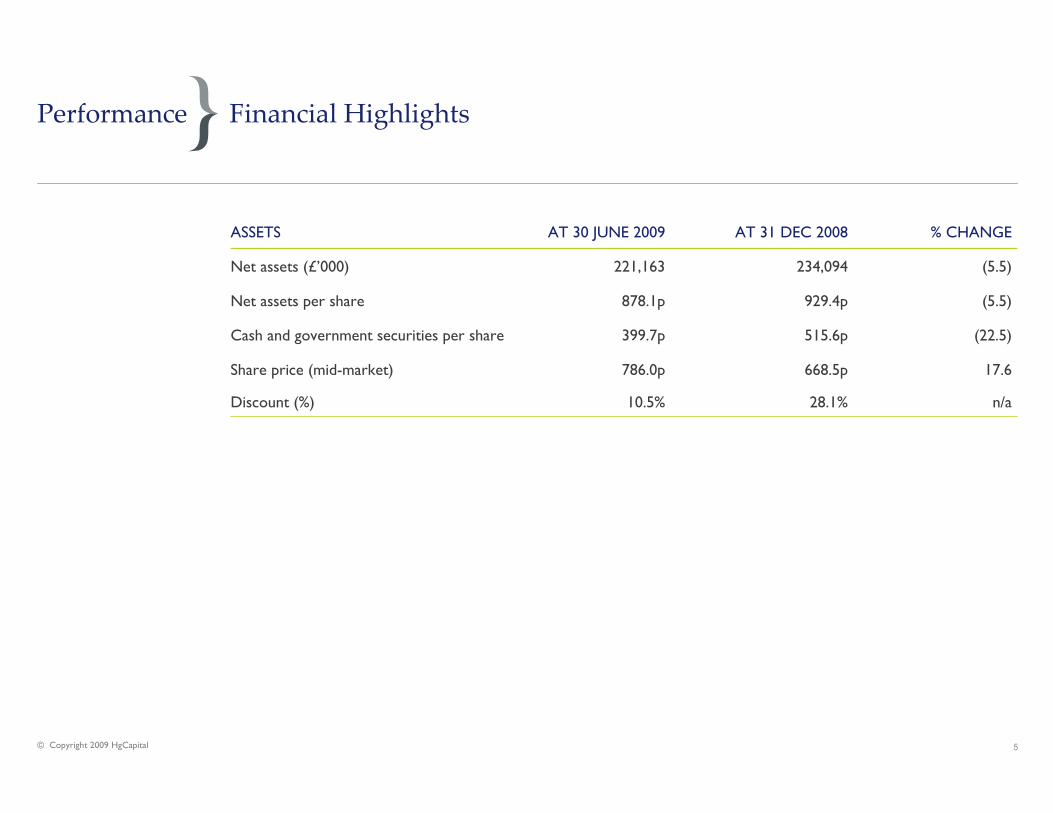
Financial Highlights
(22.5)515.6p399.7pCash and government securities per share
28.1%
668.5p
929.4p
234,094
AT 31 DEC 2008
17.6786.0pShare price (mid-market)
(5.5)878.1pNet assets per share
n/a
(5.5)
% CHANGE
10.5%Discount (%)
221,163Net assets (£’000)
AT 30 JUNE 2009 ASSETS
Performance

6© Copyright 2009 HgCapital
NAV Analysis
AT 31 DEC 2008AT 30 JUNE 2009
100.0%234.1100.0%221.2Net assets
(2.0%)(4.8)(0.5%)(1.0)Other net liabilities
55.5%130.045.5%100.7Cash/Government securities
---0.1Listed Investments
46.5%55.0% 108.9
£m %
121.4Unlisted Investments
£m %
Performance

7© Copyright 2009 HgCapital
Total Return
22.7%
0.8%
21.2%
(2.9%)
6 MONTHS TO 30 JUNE 2009
0.9%
0.1%
15.6%
13.5%
10 YEARS TO 30 JUNE 2009*
(10.5%)
(6.5%)
9.9%
10.6%
3 YEARS TO 30 JUNE 2009*
(0.4%)(19.1%)FTSE Small Cap Index
3.1%(20.5%)FTSE All-Share Index
19.6%
18.7%
5 YEARS TO 30 JUNE 2009*
(5.4%)Share price
(12.6%)Net asset value
1 YEAR TO 30 JUNE 2009
*Figures are annualised
Performance

8© Copyright 2009 HgCapital
Analysis of net asset value (NAV) movements for the six months ending 30 June 2009
Performance
-
(12,931)3,026 485(6,297) (2,962) (7,183)
(14,000)
(12,000)
(10,000)
(8,000)
(6,000)
(4,000)
(2,000)
-
Dec 2008 NAV * Dividends paid Accrued interest,
income received,
expenditure and tax
Priority profit share
to General Partner
Realised excluding
accrued interest
Unrealised excluding
accrued interest
June 2009 NAV
Change in NAV £'000
* December 2008 rebased to nil
Opening NAV£234.1m
Current NAV£221.2m

9© Copyright 2009 HgCapital
Analysis of unrealised movements in investment portfolio (including accrued interest movement of £2.9 million) for the six months ending 30 June 2009
Performance
12,5322,780
15,933 3,611(5,833) (3,959)
-
2,000
4,000
6,000
8,000
10,000
12,000
14,000
16,000
18,000
Dec 2008
Portfolio
valuation *
Acquisitions and
disposals at value
Trading Ratings Reduction in net
debt
Forex
movements
June 2009
portfolio
valuation
movement
Changes in valuation £'000
Opening valuation£108.9m
Current valuation £121.5m
* December 2008 rebased to nil

10© Copyright 2009 HgCapital
Realised and unrealised movements in investment portfolio(including accrued interest) during the first six months
Performance

11© Copyright 2009 HgCapital
ContentsHgCapital Trust plc
Appendices
Conclusion
Manager Update
Investment Activity
Portfolio Review
Performance
Summary

12© Copyright 2009 HgCapital
PortfolioTop 10 buy-out investments and the RPP fund investment represent over 85% of value
Portfolio Review
*The valuation includes accrued interest
18.4%
33.7%
42.6%
48.9%
54.9%
60.8%
66.5%
72.1%
77.2%
81.5%
85.8%
CUMULATIVE VALUE %
Healthcare
TMT
TMT
Consumer & Leisure
Consumer & Leisure
Renewable Energy
Healthcare
Industrials
Consumer & Leisure
Healthcare
TMT
SECTOR
82.0
12.9
14.4
n/a
6.6
8.7
4.3
6.5
9.8
5.7
7.9
5.2
VALUE* AT31/12/08
£m
104.2
22.3
18.6
10.8
7.6
7.3
7.1
6.9
6.9
6.2
5.3
5.2
VALUE* AT 30/06/09
£m
85.8%
18.4%
15.3%
8.9%
6.3%
6.0%
5.9%
5.7%
5.6%
5.1%
4.3%
4.3%
% OF INVESTED PORTFOLIO
30/06/09
Increase in rating and cash.
Further investment and increase in rating.
New investment.
Increase in rating.
Fall in rating and fx adjustments.
Further investment.
Improved trading and fall in rating.
Decline in earnings, increased rating and fx adjustments.
Increase in rating.
Fall in rating and fx adjustments.
No change.
PRINCIPAL REASON FOR CHANGE
1999
2006
2009
2005
2006
2006
2006
2007
2007
2008
2008
Pulse
Visma
Epyx
Sporting Index
Schleich
Hg RPP LP
Voyage
Mondo
Americana
Casa Reha
Achilles
INVESTMENT DATE
INVESTMENT

13© Copyright 2009 HgCapital
Pre 2005
15%
Year 2005
10%
Year 2006
28%
Year 2007
23%
Year 2008
12%
Year 2009
12%
Pre 2005
15%
Year 2005
10%
Year 2006
28%
Year 2007
23%
Year 2008
12%
Year 2009
12%
Pre 2005
15%
Year 2005
10%
Year 2006
28%
Year 2007
23%
Year 2008
12%
Year 2009
12%
VINTAGEVALUATION BASIS
Valuation Basis and VintagePortfolio Review
As at 30 June 2009 by value
Earnings
54%
Cost
13%
Net assets
6%
Other
1%
Written
down
26%
2009
9%
2008
9%
2007
17%
2006
36%
2005
8%
pre 2005
21%

14© Copyright 2009 HgCapital
BY NUMBERBY VALUE
Sector coverage of investmentsPortfolio Review
As at 30 June 2009 by value
TMT
32%
Healthcare
28%
Industrials
9%
Renewable Energy
6%
Services
4%
Consumer
& Leisure
20%
Fund
1%
TMT
22%
Fund
11%
Consumer
& Leisure
14%
Industrials
23%
Healthcare
16%
Renewable Energy
3%Services
11%

15© Copyright 2009 HgCapital
BY STAGEBY GEOGRAPHY
Geography and StagePortfolio Review
As at 30 June 2009 by value
UK
56%
Germany
14%
North America
1%Europe
6%
Benelux
2%
Nordic
Region
21%
Buyout
92%
Renewable
Energy
6%
Fund
1%
Expansion
1%
16© Copyright 2009 HgCapital
ContentsHgCapital Trust plc
Appendices
Conclusion
Manager Update
Investment Activity
Portfolio Review
Performance
Summary
17© Copyright 2009 HgCapital
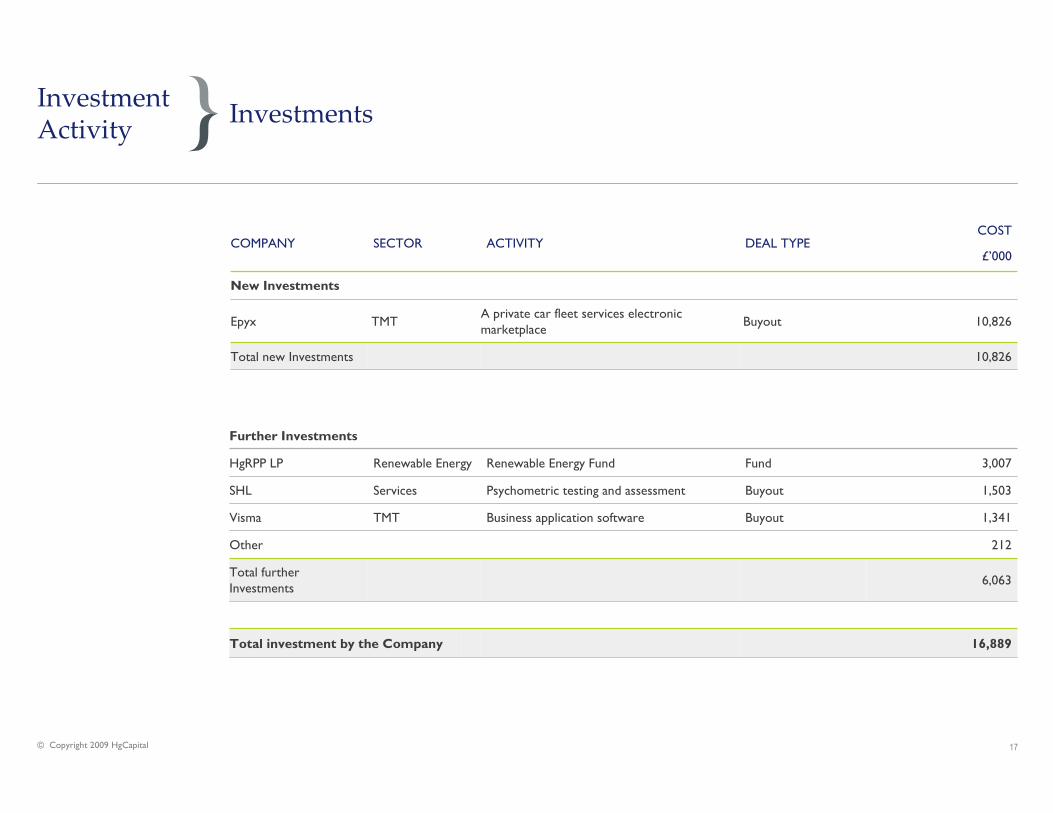
10,826BuyoutA private car fleet services electronic marketplace
TMTEpyx
10,826Total new Investments
ACTIVITY DEAL TYPECOST
£’000
New Investments
SECTOR COMPANY
InvestmentsInvestment Activity
6,063Total further Investments
Business application software
Psychometric testing and assessment
Renewable Energy Fund
212Other
1,341BuyoutTMTVisma
Buyout
Fund
1,503
3,007
ServicesSHL
Renewable EnergyHgRPP LP
Further Investments
16,889Total investment by the Company

18© Copyright 2009 HgCapital
9439831,939996956Total realisations
9439831,939996956Total partial realisations
177
819
BOOK VALUE AT 31 DEC 2008
£’000
Partial realisations
597(182)774956Other
-
RESIDUAL COST
£’000
Release of escrow
EXIT ROUTE
1,165
PROCEEDS
£’000
1,165
CUMULATIVE GAIN/(LOSS)**
£’000
346
CURRENT YEAR GAIN/(LOSS)***
£’000
IndustrialsHirschmann
SECTOR COMPANY
Investment Activity
Realisations
* Includes gross revenue received during the year** Realised proceeds including gross revenue received, in excess of historic cost*** Realised proceeds including gross revenue received, in excess of 31 December 2008 book value and accrued interest.

19© Copyright 2009 HgCapital 19© Copyright 2009 HgCapital
Portfolio OutlookPortfolio Review
� Trading conditions continue to be very tough for industrials and business services; much less so for healthcare, consumer and TMT investments, which continue to produce healthy growth.
� Our management teams have taken an aggressive stance to the downturn, rapidly re-shaping business as necessary.
� We have significant capital reserved both offensively for value enhancing acquisitions and defensively if required to protect value.

20© Copyright 2009 HgCapital
Investment Prospects
� Our assumption is that we will see a very weak and fragile recovery across most of Europe and that there is a material risk of price deflation across many product markets; falling prices are unequivocally bad for leveraged deals.
� We see many opportunities for private equity in the current economic environment arising from
- Earlier excesses- Over stretched balance sheets- Over extended business portfolios- Public market investors pulling away from small caps- Private owners wishing to call it a day
� We also see many distracted competitors who will be less able to compete for deals and talent.
� However, debt markets are much smaller, less liquid, more expensive so large buy out players will enter our space.
� So we must focus and maintain investment in research and origination to get the best deals, and
� flex our investment criteria to include unleveraged buy outs and minority deals within our tight sector focus.
Portfolio Review

21© Copyright 2009 HgCapital
Events since 30 June 2009
� Net asset value at 31 July 2009 was £221.9 million, 881.0 pence per share.
� Cash balances at the end of July 2009 were £101.5 million (46% of net assets), equating to 402.8 pence per share.
Portfolio Review

22© Copyright 2009 HgCapital
ContentsHgCapital Trust plc
Appendices
Conclusion
Manager Update
Investment Activity
Portfolio Review
Performance
Summary

23© Copyright 2009 HgCapital 23© Copyright 2009 HgCapital
HgCapital UpdateManager Update
FUND STATUS
� Hg5: our 2006 fund is now closed for new investments. The fund is 76.7% drawn, with significant reserves held back, primarily to make value-accretive add-on acquisitions but also to protect value.
� Hg6 is currently being raised with over £1.35 billion of commitments, including £250 million from HgCapital Trust (with investment opt-out provision).
MANAGER STATUS
� We are taking advantage of a weak labour market and weakness of competitors by hiring to build out our investment team.
� Yet our focus remains tightly directed at NW European mid market.
� We will complete unleveraged buy outs and minority investments within our target sectors and size range.

24© Copyright 2009 HgCapital
ContentsHgCapital Trust plc
Appendices
Conclusion
Manager Update
Investment Activity
Portfolio Review
Performance
Summary

25© Copyright 2009 HgCapital 25© Copyright 2009 HgCapital
ConclusionHgCapital Trust plc
� Compact portfolio, correctly valued and under control.
� A strong belief that we are entering a buyer’s market because economic conditions will continue to be tough and equity is in short supply.
� We have significant cash resources, and
� an experienced, deep team with plenty of time to
� take advantage of a buyer’s market.
26© Copyright 2009 HgCapital
Contents
Appendices
Conclusion
Manager Update
Investment Activity
Portfolio Review
Performance
Summary
HgCapital Trust plc

27© Copyright 2009 HgCapital
Performance over 10 Years (total return)
50
100
150
200
250
300
350
400
450
500
Jun-99 Jun-00 Jun-01 Jun-02 Jun-03 Jun-04 Jun-05 Jun-06 Jun-07 Jun-08 Jun-09
Performance Index
NAV FTSE ALL SHARE PRICE FTSE Small CAP
Share Price and NAV Performance against the Index (Total Return)
Appendices

28© Copyright 2009 HgCapital
Analysis of Movement in NAV
553VAT recovery on historic management fees
(2,962)Priority profit share to General Partner
221,163Closing net asset value as at 30 June 2009
-Carried interest
(6,297)Dividend paid
(874)Taxation
(312)Expenditure
3,659Gross revenue
(7,183)Net unrealised depreciation of investments (excluding accrued interest)
485Realised proceeds in excess of book value at 31 December 2008 (excludes gross revenue)
234,094
£’000
Opening net asset value as at 1 January 2009
Appendices
29© Copyright 2009 HgCapital
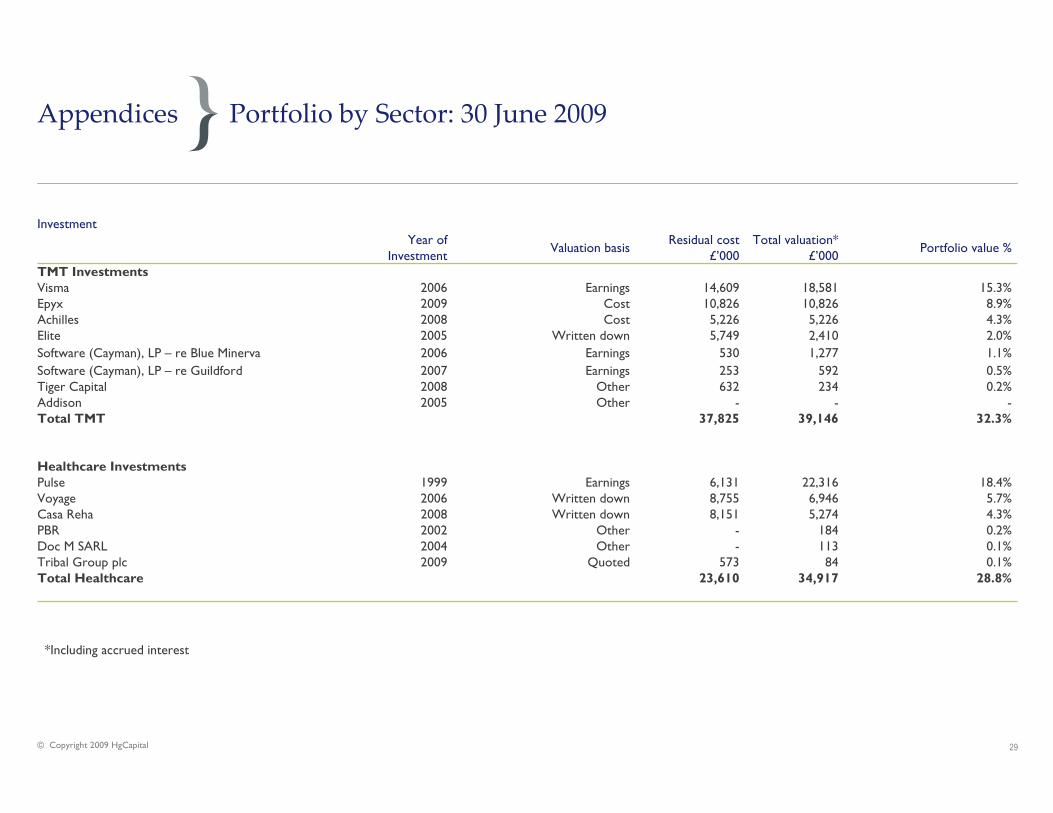
Portfolio by Sector: 30 June 2009Appendices
28.8%34,91723,610Total Healthcare0.1%84573Quoted2009Tribal Group plc0.1%113-Other2004Doc M SARL0.2%184-Other2002PBR4.3%5,2748,151Written down2008Casa Reha5.7%6,9468,755Written down2006Voyage18.4%22,3166,131Earnings1999Pulse
Healthcare Investments
32.3%39,14637,825Total TMT---Other2005Addison
0.2%234632Other2008Tiger Capital0.5%592253Earnings2007Software (Cayman), LP – re Guildford
1.1%
2.0%4.3%8.9%15.3%
Portfolio value %
1,277530Earnings2006Software (Cayman), LP – re Blue Minerva
Investment
Written downCostCost
Earnings
Valuation basis
5,2265,2262008Achilles10,82610,8262009Epyx
5,749
14,609
Residual cost £’000
2,410
18,581
Total valuation* £’000
2005Elite
2006VismaTMT Investments
Year of Investment
*Including accrued interest

30© Copyright 2009 HgCapital
Portfolio by Sector: 30 June 2009Appendices
9.2%11,31633,001Total Industrials---Other2005Schenck---Other1992Lantor plc (formerly South Wharf plc)---Other2005Hofmann--5,535Written down2008King (KVT)--6,813Written down2006FTSA--7,687Written down2003W.E.T.
0.2%274-Other2004Hirschmann3.4%4,1905,962Written down2007SLV5.6%6,8527,004Written down2007Mondo
Industrial Investments
20.3%24,59422,748Total Consumer & Leisure1.0%1.9%5.1%6.0%6.3%
Portfolio value %
1,1594,200Written down2007Cornish Bakehouse
Investment
EarningsEarningsEarningsEarnings
Valuation basis
6,1914,6252007Americana7,3374,6342006Schleich
2,197
7,092
Residual cost £’000
2,300
7,607
Total valuation* £’000
2003Hoseasons
2005Sporting IndexConsumer & Leisure Investments
Year of Investment
*Including accrued interest

31© Copyright 2009 HgCapital
Portfolio by Sector: 30 June 2009Appendices
100.0%121,460152,264Total Portfolio
(1.0%)(1,262)-Total Hedge(1.0%)(1,262)-n/a-Hg5 Euro Hedge
Hedge
0.7%9262,377Total Fund--12Net assets1992Crest Avenue--7Net assets1992Wand / Yankelovich LP-5938Net assets1994ACT Venture Capital
0.7%8672,320Net assets1998Weston Presidio Capital III, LPLegacy PE Fund Investments
3.8%4,68525,287Total Services--7,474Written down2007Fabory--1,669Written down1999SGI
1.8%2,2278,153Written down2007Atlas Energy2.0%2,4587,991Written down2006SHL
Services Investments
5.9%7,1387,416Total Renewable Energy5,9%
Portfolio value %
Investment
Net assets
Valuation basis
7,416
Residual cost £’000
7,138
Total valuation* £’000
2006HgRPP LPRenewable Energy Investments
Year of Investment
*Including Accrued Interest

32© Copyright 2009 HgCapital
HgCapital strategy
Mid-Market
� £50 million - £500 million EV buyouts/buy-ins:
− Consistently strong deal-flow
− Multiple exit options
− Not overly dependent on capital markets (for returns, financing or exit)
− Defensible market positions / proven records
− Ability to attract high quality management teams
− Return attribution potential to effect material operational improvements
� Sole / lead / control investors
� Seek multiple value levers
� Conservative capital structures
Pan-Regional
� Primary coverage of northern Europe
� Cultural affinity with management teams and business environments
� Secondary coverage of other European markets via sector focus
STRATEGY
Appendices

33© Copyright 2009 HgCapital
Tactical advantage
Sector-focused
� 4 dedicated sector teams (developed over 11 years) covering c.70% of the market
� Annual business planning process drives agenda for each team
� Strategy superseding geography in investment targeting
Intensive post-transaction planning and management
� Company and portfolio level activity (developed over 9 years)
� Dedicated resource and expertise (team of 7 professionals, plus support from other senior
partners)
� Helps drive growth and optimise exits
Highly resourced
� Favourable ratio of staff to deals - team of 76 with 17 active portfolio companies
� £2.4 billion funds under management
� Partners average 16 years of private equity experience / worked together for 12 years
TACTICS
Appendices

34© Copyright 2009 HgCapital
HgCapital
HgCapital’s communications are only directed at eligible counterparties and professional clients. HgCapital acts for its investors and for no one else in relation to its business. It will not advise, provide services to or be responsible for providing customer protections to any other person.
HgCapital is the trading name of HgCapital LLP and HgPooled Management Limited. Registered office: 2 More London Riverside, London SE1 2AP. Authorised and regulated by the Financial Services Authority.
Disclaimer