hgcapital trust plc/media/files/h/hgcapital-trust/... · €13 million to rpp 2 with its commitment...
TRANSCRIPT
Private equity investment trust of the year
Investment Week Awards 2005, 2006, 2007, 2008 and 2009
HgCapital Trust plc
Half-yearly report and accounts
30 June 2010
www.hgcapitaltrust.com

Investment objective 2
Financial highlights 3
Chairman’s statement 4
Interim management report and
responsibility statement 7
Performance record 9
Manager’s review 10
Portfolio analysis 15
Investments 16
Realisations 19
Review of principal buyout investments 20
Renewable energy 30
Top 20 investments by value 33
Income statement 36
Balance sheet 37
Cash flow statement 38
Reconciliation of movements in
shareholders’ funds 39
Notes to the financial statements 40
Management and administration 45
HgCapital Trust plcHALF-YEARLY REPORT AND ACCOUNTS 2010 01
CONTENTS

The objective of the Company is
to provide shareholders with
long-term capital appreciation in
excess of the FTSE All-Share Total
Return Index by investing in
unquoted companies.
The Company provides investors
with exposure to a diversified
portfolio of private equity
investments primarily in the UK
and Continental Europe.
FINANCIAL HIGHLIGHTSof the first six months of 2010
INVESTMENT OBJECTIVE
HgCapital Trust plcHALF-YEARLY REPORT AND ACCOUNTS 2010
Increase in NAV per share on a total return basisresulting from improved trading performance inthe portfolio+2.9%
Completed a capital fundraising at £8.45 per share in April 2010 to provide funding for newinvestment opportunities£50m
Year-on-year aggregate EBITDA growth of the top 20 investments+17%
Share price and dividend (total return) versus areturn from the FTSE All-Share Total Return Index of -6.1% and from the FTSE Small-Cap of -1.7%-2.6%
Ten year share price total return p.a. versus 1.6%p.a. from the FTSE All-Share Total Return Index +13.2%
Ten year investment return for every £1 invested>3.5x
A significant increase in cash deployed, investing in businesses that have continued to grow through the recession£72m
03HgCapital Trust plcHALF-YEARLY REPORT AND ACCOUNTS 201002
HgCapital Trust plcHALF-YEARLY REPORT AND ACCOUNTS 2010 05HgCapital Trust plc
HALF-YEARLY REPORT AND ACCOUNTS 201004
CHAIRMAN’S STATEMENT
Performance
In the first six months of 2010 the Company’s NAVper share grew by +2.9% on a total return basis to938.6 pence. This compares with a decline of -6.1% inthe FTSE All-Share Total Return Index.
It is pleasing to note that the positive performanceof the Company’s portfolio can mostly be attributedto growth in the sales and profitability of theunderlying investments, together with repayment ofdebt from cash flow. This has been offset by adverseforeign exchange movements and a small setback inthe ratings of comparable companies applied to anumber of our investments compared with their costor most recent valuation.
Total return to shareholders (share price plusdividend) over the period was -2.6% compared with-6.1% for the FTSE All-Share Index and -1.7% for theFTSE Small-Cap Total Return Index.
The Company’s share price has traded within therange 790.5 – 864.0 pence, representing a discount of8% – 11% to the then published NAV. The shareprice at 30 June 2010 was 798.5 pence; thisrepresented a discount of 10% to the last reportedNAV at 31 May 2010. The Company’s shares havecontinued to trade at a consistently narrowerdiscount to NAV than comparable investment trusts,reflecting the Company’s strong investment recordand conservative policies.
Revenue per share was 13.0 pence, compared with7.8 pence in the same period last year. As explainedin earlier reports to shareholders, the Company’srevenue will vary from one period to another,reflecting the structure of the underlying investmentsand income from the Company’s holding of liquidfunds awaiting reinvestment; this also causes dividendsto vary from year to year. The Company’s more fullyinvested position, combined with the low yieldsavailable on liquid funds and the greater number ofshares in issue, are likely to bring revenues per sharefor the whole year, and thus the dividend, back tolevels similar to those of previous years.
Share issue
In February we announced that the Board wasconsidering raising further funds by way of a shareissue. We completed this in April, raising £50 millionbefore fees through a placing and open offer of newordinary shares, at a price of 845 pence per share,with subscription shares attached on a 1-for-5 basis.As the share issue was made at the then marketprice, its dilutive effect was minimal and the issue hadno apparent effect on the price at which sharestraded in the after-market. The placing of sharesbrought a number of leading wealth managers andinstitutional investors onto our register. We welcomethese new shareholders as solid, long-term investors,while anticipating that the broadening of the registerwill enhance liquidity in the Company’s shares andanalyst coverage.
At the same time, we made a bonus issue ofsubscription shares to all existing shareholders on thesame basis. The subscription shares are listed on theLondon Stock Exchange and have traded at prices upto 55.0 pence. At 30 June 2010, the share price was43.3 pence per share.
Each subscription share confers the right to subscribefor one new ordinary share, beginning in May 2011and with the final exercise date being 31 May 2013.If exercised in 2011 or 2012 the subscription pricewill be 950 pence per share; and if exercised in 2013it will be 1025 pence per share. If all the subscriptionshares are exercised this will raise funds of between£59.1 and £63.8 million for the Company to deployin future years and will enhance further the liquidityof the market in our shares.
Investment strategy
HgCapital’s strategy is to focus closely on five sectors(TMT, healthcare, industrials, business services, andrenewable energy); each sector team identifies tightlydefined sub-sectors of interest. Exposure to four ofthese sectors is gained through the buyout ofestablished businesses, while new renewable energyprojects are purchased through specialist funds inwhich the Company participates.
During 2009 the Board committed to invest alongsideHgCapital’s new buyout fund HgCapital 6; this fundhas now closed and the Company’s commitment isfixed at £285 million, giving it a 15% interest in eachdeal. As mentioned in our prospectus, we have alsomade a commitment to HgCapital’s new renewableenergy fund, HgCapital Renewable Power Partners 2 LP (‘RPP 2’). The Manager closed on a relatively smallamount of capital in order to facilitate the completionof a new deal opportunity. The Company committed€13 million to RPP 2 with its commitment increasingto €40 million once the Manager has aggregatecommitments of €200 million. Under each of thesecommitments the Company has the right, in definedcircumstances, to be excused, without penalty, fromparticipating in any investment. There is also theflexibility to invest more, through co-investments, ifconditions for investment are attractive and theCompany has access to additional funds.
Investment activity
2009 was notable for the low level of activity in boththe UK and German private equity markets. Againstthis background, and consistent with our policy ofretaining sufficient liquidity on-balance sheet fordeployment in new opportunities at attractive pointsin the cycle, the Company made only two newinvestments in 2009 (Epyx and Goldshield) andentered 2010 with substantial liquid funds forinvestment. The Manager had a strong pipeline ofpotential deals, many of which it had tracked sincebefore the recession. When announcing our intentionto raise further capital we said we believed theCompany was in the early stages of the next significantcycle for deployment of capital and anticipated aprogressive increase in transaction volumes.
As anticipated, the pace of deployment in buyoutinvestments has picked up in 2010 and the Managercompleted five new acquisitions in the first half of theyear, investing £63.4 million on behalf of theCompany; other investments in the period totalled£9 million. Further buyouts, of Teufel and TeamSystem,were announced in July and August.
The Company’s portfolio is more diversified than ithas been for some time. The top 20 buyoutinvestments represent 92% of the investmentportfolio; at December the top 10 represented77.5%. Reflecting this, we have reverted to reportingin detail on the top 20 investments and, in theinterests of transparency, we are disclosing greaterdetail of the valuation multiples, leverage and currenttrading of the top 20 investments.
The Manager’s philosophy, with which the Boardconcurs, is to acquire good quality businesses, wherethere is a clear plan for growth in revenues andmargins, with multiple ways to realise value. There isless competition for such deals than in previous years,but vendors are still able to achieve fair prices forgood companies: we anticipate steady appreciation invalue, rather than short-term gains fromopportunistic purchases. The Manager anticipates aslower pace of deployment in the second half, as itssector teams focus on recent acquisitions.
Only modest realisations were made during theperiod, reflecting a long run of disposals from 2003 to2008 and the immature state of much of theportfolio. The investment cycle implies that the idealconditions for sale arrive as the best conditions forpurchase begin to fade. To provide standby liquidityduring this phase of the cycle the Company has fromtime to time arranged a small revolving bank facility.While the Board is considering arranging a short-term facility it does not believe in leveraging theCompany’s balance sheet with long-term borrowing.
Most of the Company’s current investments needfurther time to mature towards their optimal valuefor realisation. Nevertheless, there are potentialbuyers, especially other private equity managers withfunds raised before the global crash and which willexpire if not invested. The Company’s investments areperforming well and a number of them, especiallythose acquired before 2007, are likely to attract offersworth considering.
We aim to provide shareholders with long-term growth in value throughparticipation in private equity in an investment vehicle that is liquid and transparent
Outlook
The Manager has made a good start in deploying itsHgCapital 6 fund (and the funds committed by theCompany for investment alongside it) into a range ofbuyouts in its specialist sectors; approximately 40%of these funds have now been invested orcommitted. The priority now is to absorb the latestinvestments and ensure they have clear strategies forgrowth in sales and profitability. Meanwhile, moremature investments are being prepared for sale andwe can look forward, subject to market conditions,to an active realisation programme across 2011-2012,with some assets potentially being realised sooner.
Board
After 14 years as a director of the Company, TimAmies retired from the Board at the AGM in May. Formany years he chaired the Audit and ValuationCommittee. We are grateful to him for his expertisein valuation and close scrutiny of the valuations ofportfolio companies. As part of our successionplanning, this role was assumed by Richard Broomanin 2008 and we have recently appointed Mark Powellto the Board. As managing director, and thenchairman, of Rathbone Brothers Plc, he has built asuccessful and highly respected private bank andwealth manager; this expertise will provide the Boardwith a deeper understanding of the part that listedprivate equity can play in many portfolios and howwe can improve our communications with investors.
We remain convinced that an allocation to listedprivate equity is appropriate for many long-terminvestors and intend to continue to report withincreasing clarity and transparency so that investorsmay share our confidence.
Roger MountfordChairman25 August 2010
CHAIRMAN’S STATEMENT CONTINUED
HgCapital Trust plcHALF-YEARLY REPORT AND ACCOUNTS 201006 HgCapital Trust plc
HALF-YEARLY REPORT AND ACCOUNTS 2010 07
INTERIM MANAGEMENT REPORT AND
RESPONSIBILITY STATEMENT
Interim management report
The important events that have occurred during theperiod under review are set out in the Chairman’sstatement and in the Manager’s review, which alsoinclude the key factors influencing the financialstatements.
The principal risks and uncertainties for the remainingsix months of the financial year are set out in theManager’s review.
The Directors do not consider that the principal risksand uncertainties have changed since the publication ofthe annual report for the year ended 31 December2009. A detailed explanation of the risks summarisedbelow can be found on page 54 of the annual reportwhich is available at http://www.hgcapitaltrust.com.
Performance risk The Board is responsible for deciding the investmentstrategy to fulfil the Company’s objectives and formonitoring the performance of the Manager. Aninappropriate strategy may lead to poor performance.
Income/dividend riskThe amount of dividends and future dividend levelswill depend on the income received and receivablefrom the Company’s underlying portfolio.
Regulatory riskThe Company operates as an investment trust inaccordance with section 1158/9 of the CorporationTax Act 2010 (“CTA”). As such, the Company isexempt from corporation tax on any capital gainsrealised from the sale of its investments.
Operational riskIn common with most other investment trusts, theCompany has no employees. The Company thereforerelies upon the services provided by third parties andis dependent upon the control systems of theManager and the Company’s other service providers.
Financial risksThe Company’s investment activities expose it to avariety of financial risks that include valuation risk, market risk, currency risk, portfolio hedging,interest rate risk, liquidity risk, equity price risk andcurrency exposure.
By the nature of its investment objective, the Companyinvests in unquoted companies, and liquidity in theirsecurities can be constrained, potentially making theinvestments difficult to realise at, or near, the Directors’published valuation at any one point in time.
Responsibility statement
The Directors confirm that to the best of theirknowledge:
• The condensed set of financial statements hasbeen prepared in accordance with the Statementon Half-yearly Financial Reports issued by the UKAccounting Standards Board and gives a true andfair view of the assets, liabilities, financial positionand profit of the Company;
• The interim management report includes a fairreview of the information required by:
(a)DTR 4.2.7R of the Disclosure and TransparencyRules, being an indication of important events thathave occurred during the first six months of thefinancial year and their impact on the condensedset of financial statements; and a description of theprincipal risks and uncertainties for the remainingsix months of the year ; and
(b)DTR 4.2.8R of the Disclosure and TransparencyRules, being related party transactions that havetaken place in the first six months of the currentfinancial year and that have materially affected thefinancial position or performance of the Companyduring that period; and any changes in the relatedparty transactions described in the last annualreport that could do so. There were no relatedparty transactions during the period.
The Directors are responsible for the maintenanceand integrity of the corporate and financialinformation included on the Company’s website.Legislation in the United Kingdom governing thepreparation and dissemination of financial informationdiffers from legislation in other jurisdictions.
This half-yearly financial report was approved by theBoard of Directors on 25 August 2010 and the aboveResponsibility statement was signed on its behalf byRoger Mountford, Chairman.
HgCapital Trust plc gives the
investor access to a private equity
portfolio run by an experienced
and well-resourced Manager that
makes investments in fast growing
companies over a number of
geographies and sectors.
We believe this approach will
continue to reward investors with
superior performance, both
relative to the public markets and
its peers over the long term.
HgCapital Trust plcHALF-YEARLY REPORT AND ACCOUNTS 201008 HgCapital Trust plc
HALF-YEARLY REPORT AND ACCOUNTS 2010 09
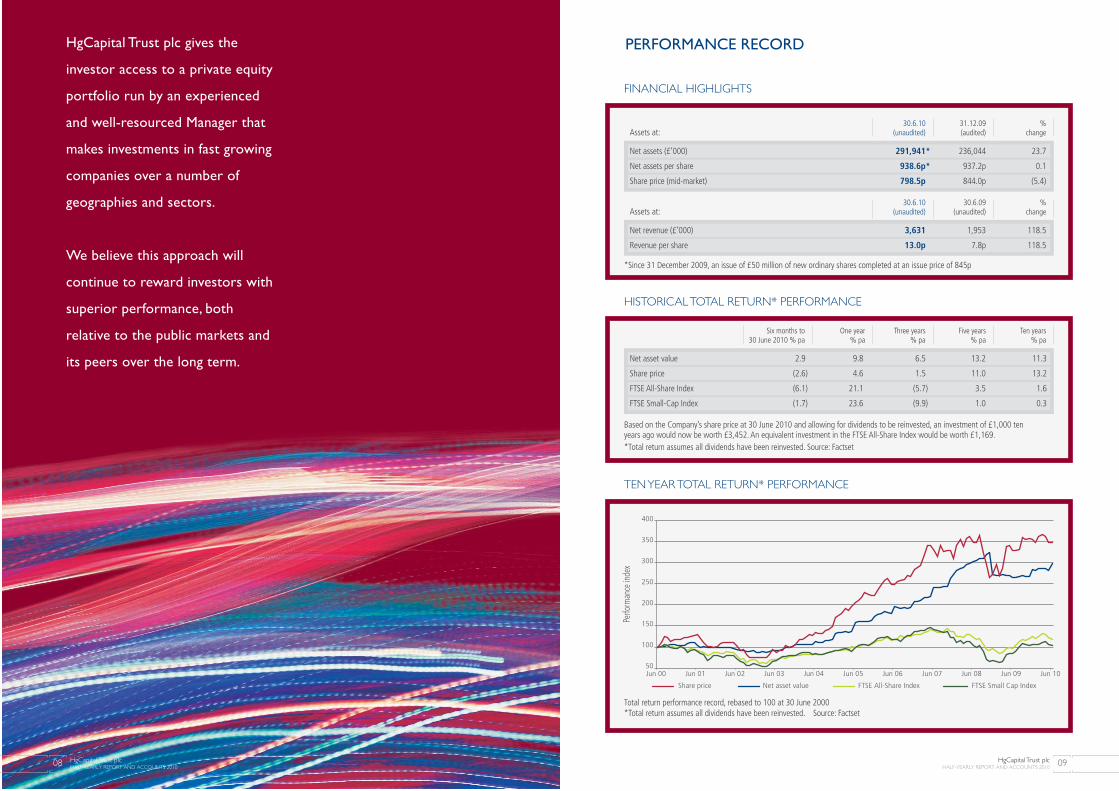
PERFORMANCE RECORD
30.6.10 31.12.09 %Assets at: (unaudited) (audited) change
Net assets (£’000) 291,941* 236,044 23.7
Net assets per share 938.6p* 937.2p 0.1
Share price (mid-market) 798.5p 844.0p (5.4)
30.6.10 30.6.09 %Assets at: (unaudited) (unaudited) change
Net revenue (£’000) 3,631 1,953 118.5
Revenue per share 13.0p 7.8p 118.5
FINANCIAL HIGHLIGHTS
Six months to One year Three years Five years Ten years30 June 2010 % pa % pa % pa % pa % pa
Net asset value 2.9 9.8 6.5 13.2 11.3
Share price (2.6) 4.6 1.5 11.0 13.2
FTSE All-Share Index (6.1) 21.1 (5.7) 3.5 1.6
FTSE Small-Cap Index (1.7) 23.6 (9.9) 1.0 0.3
HISTORICAL TOTAL RETURN* PERFORMANCE
Based on the Company’s share price at 30 June 2010 and allowing for dividends to be reinvested, an investment of £1,000 tenyears ago would now be worth £3,452. An equivalent investment in the FTSE All-Share Index would be worth £1,169.*Total return assumes all dividends have been reinvested. Source: Factset
*Since 31 December 2009, an issue of £50 million of new ordinary shares completed at an issue price of 845p
Share price Net asset value FTSE Small Cap IndexFTSE All-Share Index
Perfo
rman
ce in
dex
50
100
150
200
250
300
350
400
Jun 08Jun 00 Jun 01 Jun 02 Jun 03 Jun 04 Jun 05 Jun 06 Jun 07 Jun 09 Jun 10
TEN YEAR TOTAL RETURN* PERFORMANCE
Total return performance record, rebased to 100 at 30 June 2000*Total return assumes all dividends have been reinvested. Source: Factset
businesses that have grown through the recentrecession; paying prices which are below long runaverages and taking a clear view that they will continueto grow faster than the economy as a whole. We havenot bought cyclical recovery plays. This period ofheightened activity leaves the Company at the period-end with 78% of net assets invested and a portfolio of20 active investments representing 92% of theportfolio. Undrawn commitments amount to £231.0 million compared with liquid funds of £63.4 million; the Company can manage thesecommitments using cash flow from realisations and byraising modest amounts of short-term debt financeor, if necessary, by exercising its ability to opt out ofinvestment calls.
Portfolio
Trading conditions have improved significantly duringthe period and overall performance across most ofthe portfolio has been strong. Most of the investeecompanies are showing positive revenue and profittrends versus the prior year. Management teams haveplaced a strong emphasis on driving growth initiativesafter the strong focus on cost management in 2009.Overall, the Manager has been pleased with thespeed of action and positive attitude of the managersit has backed.
Levels of debt in the portfolio have been reducedand the value weighted average debt/EBITDAmultiple of the top 20 buyout investments was 2.9xas at 30 June 2010.
The impact of market ratings on portfolio valuationshas been mixed; movements in comparables
MANAGER’S REVIEW
Buyout investments are held through limitedpartnerships of which the Company is the sole limitedpartner. HgCapital Trust plc (the ‘Company’) investsalongside other clients of HgCapital. Typically, theCompany’s holding forms part of a much larger majorityinterest held by HgCapital clients in buyout investmentsin companies with an enterprise value (‘EV’) of between£50 million and £500 million. The Manager’s reviewgenerally refers to each transaction in its entirety, apartfrom the tables detailing the Company’s participationor where it specifically says otherwise.
Overview
The Company’s net asset value grew from £236.0 million to £291.9 million during the periodunder review. This increase mainly arose from theproceeds of a share issue in April of this year, but alsofrom favourable movements in the valuation of theunrealised portfolio.
The decrease in the share price of -2.6% (total returnbasis) compares favourably with a fall in the FTSE All-Share Total Return Index of -6.1% in the sixmonths to 30 June 2010.
The Company realised proceeds during the periodamounting to £10.7 million. These proceeds arosefrom the sale of Hoseasons, a refinancing of Elite anda dividend payment from Pulse.
During the period, the Company invested a total of£72.3 million, including five new buyout investments.Details can be found on page 16 of this report.
Summary
Over the period, the Manager has invested in line withits stated investment stance: putting capital to work in
ANALYSIS OF MOVEMENTS IN NET ASSET VALUE FOR THE SIX MONTHS ENDED 30 JUNE 2010
£’000
Opening net asset value as at 1 January 2010 236,044
Net proceeds from shares issued 48,855
Gross revenue 6,510
Priority profit share to General Partner (3,542)
Other expenditure (1,187)
Dividends paid (6,297)
Realised loss over 31 December 2009 book value (excluding gross revenue) (619)
Net unrealised appreciation of investments (excluding accrued interest) 12,177
Closing net asset value as at 30 June 2010 291,941
HgCapital Trust plcHALF-YEARLY REPORT AND ACCOUNTS 201010 HgCapital Trust plc
HALF-YEARLY REPORT AND ACCOUNTS 2010 11
(1.3)
£’m
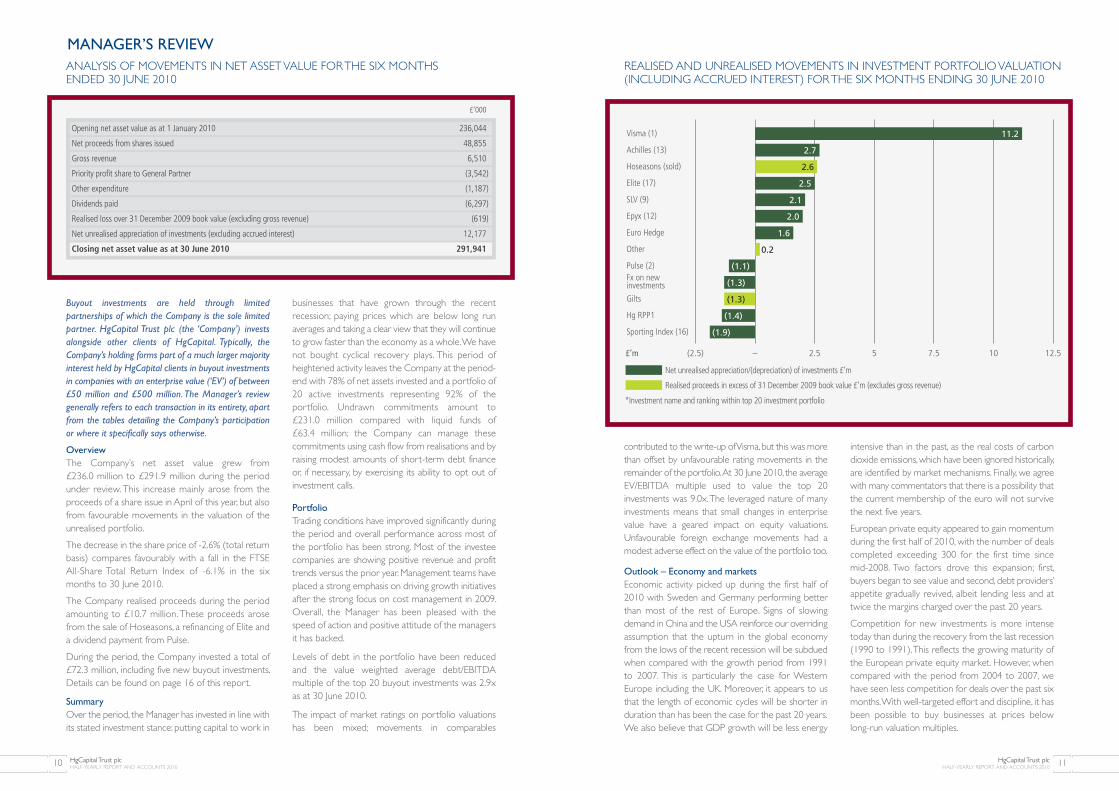
Net unrealised appreciation/(depreciation) of investments £’m
(2.5) – 2.5 5 107.5 12.5
Realised proceeds in excess of 31 December 2009 book value £’m (excludes gross revenue)
*Investment name and ranking within top 20 investment portfolio
11.2
2.7
2.6
2.5
2.1
2.0
1.6
0.2
(1.3)
(1.1)
(1.4)
(1.9)
Visma (1)
Achilles (13)
Hoseasons (sold)
Elite (17)
SLV (9)
Epyx (12)
Euro Hedge
Other
Pulse (2)Fx on new investments
Gilts
Hg RPP1
Sporting Index (16)
REALISED AND UNREALISED MOVEMENTS IN INVESTMENT PORTFOLIO VALUATION(INCLUDING ACCRUED INTEREST) FOR THE SIX MONTHS ENDING 30 JUNE 2010
contributed to the write-up of Visma, but this was morethan offset by unfavourable rating movements in theremainder of the portfolio. At 30 June 2010, the averageEV/EBITDA multiple used to value the top 20investments was 9.0x. The leveraged nature of manyinvestments means that small changes in enterprisevalue have a geared impact on equity valuations.Unfavourable foreign exchange movements had amodest adverse effect on the value of the portfolio too.
Outlook – Economy and markets
Economic activity picked up during the first half of2010 with Sweden and Germany performing betterthan most of the rest of Europe. Signs of slowingdemand in China and the USA reinforce our overridingassumption that the upturn in the global economyfrom the lows of the recent recession will be subduedwhen compared with the growth period from 1991to 2007. This is particularly the case for WesternEurope including the UK. Moreover, it appears to usthat the length of economic cycles will be shorter induration than has been the case for the past 20 years.We also believe that GDP growth will be less energy
intensive than in the past, as the real costs of carbondioxide emissions, which have been ignored historically,are identified by market mechanisms. Finally, we agreewith many commentators that there is a possibility thatthe current membership of the euro will not survivethe next five years.
European private equity appeared to gain momentumduring the first half of 2010, with the number of dealscompleted exceeding 300 for the first time since mid-2008. Two factors drove this expansion; first,buyers began to see value and second, debt providers’appetite gradually revived, albeit lending less and attwice the margins charged over the past 20 years.
Competition for new investments is more intensetoday than during the recovery from the last recession(1990 to 1991). This reflects the growing maturity ofthe European private equity market. However, whencompared with the period from 2004 to 2007, wehave seen less competition for deals over the past sixmonths. With well-targeted effort and discipline, it hasbeen possible to buy businesses at prices below long-run valuation multiples.
As the economy grows, we expect more players toreturn to active investing. Some, mostly the largerbuyout firms, will be spending the undrawncommitments on earlier funds which, when added tonew commitments, produce the potential “overhangof capital” in global private equity markets. Much ofthis money has a short shelf life and will be lookingfor acquisitions from existing owners, includingHgCapital. We believe we are about to enter thephase of the cycle where there will be an active two-way M&A market. Unless or until the economy goesinto recession and there is a bear market, the buyer’smarket phase of the M&A cycle has probably nowcome to an end.
We expect our investment rate to decline in thesecond half as we digest what we have acquired. Our resources will be directed towards developinginterest from the rational and best buyers for ourolder investments and in research of investmentthemes that will deliver the next round of attractiveinvestments for the Company.
Prospects
Prospects for the portfolio of buyout investments,assuming a slow recovery in the economy, appear tobe sound. On average, the 20 largest companies haveincreased revenues by 6% and EBITDA by 17% overthe 12 months to 30 June 2010 (source: managementaccounts). In the main, they serve markets that growfaster than GDP and these companies grew throughthe downturn. Some earlier investments, ill judged inretrospect, have suffered from sharp declines indemand; these were written down to zero 12 monthsago and will have no impact on net assets until theyproduce a significant growth in earnings and cashgeneration. Average gearing has fallen through risingearnings, cash generation and lower levels of gearinglevels used in newer investments.
Regulation-AIFM Directive
The European Union’s ill-conceived proposals foradditional regulation of private equity managers arelikely, if enacted in their current form, to addcompliance costs to the larger companies within ourportfolio. We will of course comply, although we cansee no benefit to society or to those who have alegitimate interest.
Renewable energy
We made three new and some further investments inwhich the Company’s total participation was £5.0million. Details of renewable energy assets are set outon page 30.
The performance of the Company’s investments inrenewable power generating assets is evolving in linewith our expectations.The three platforms in Sweden,Spain and the UK are tracking marginally (3%) belowplan, with availability and prices on plan and resource(wind and sun) below plan. As a consequence, theportfolio has started making significant cashdistributions in the period to 31 December 2010.
Having made a first close on the second fund, RPP 2,we have closed the first investment, a 44MW windfarm in Sweden, in partnership with RES, thedeveloper who completed Havsnäs for us. Our beliefis that the investment climate will get less competitiveas utilities have to address other challenges, not leastthe expensive replacement of an ageing andinadequate fleet of power plants, using conventionaland nuclear power. Accordingly, for the foreseeablefuture, we will continue to focus on two platforms:Sweden and the UK, avoiding Spain until theregulatory and currency outlook becomes clearer.
Risks
Looking forward, we have identified three principalrisks to the portfolio and the development of theCompany over the next six months. First, there is therisk of another sharp contraction in the globaleconomy. Trigger events could be the Chineseeconomy slowing sharply, a major bank failure, possiblyarising from the credit problems of certain euromember states, or from inflation taking hold andrequiring tight monetary policy overlaid on tight fiscalpolicy. In any of these scenarios, ratings are likely tofall. That said, our portfolio is defensively positioned byreference to the drivers of demand for the goods andservices the companies sell and by reference to thedebt levels they carry.
The second risk arises from the continuingdeleveraging of the financial sector and, in particular,the shrinking of the balance sheets of the banks thatprovide acquisition debt. If the deleveragingaccelerates, then this could adversely affect valuationsacross private and public markets and M&A activity.
Thirdly, while the outlook for the Company’sinvestments in renewable power generating assets isgetting clearer, there is a noteworthy risk, in the formof potential reductions by the Spanish Governmentof the 25-year tariff contracts for solar poweredelectricity. If the Spanish Government goes ahead withits threat, the value of the Company’s investment inRPP 1 could fall by up to €4.7 million, a sum equivalentto 15.2p per share. To date, new legislation has beenproposed that would not affect RPP I’s investments.
HgCapital Trust plcHALF-YEARLY REPORT AND ACCOUNTS 201012 HgCapital Trust plc
HALF-YEARLY REPORT AND ACCOUNTS 2010 13
MANAGER’S REVIEW CONTINUED
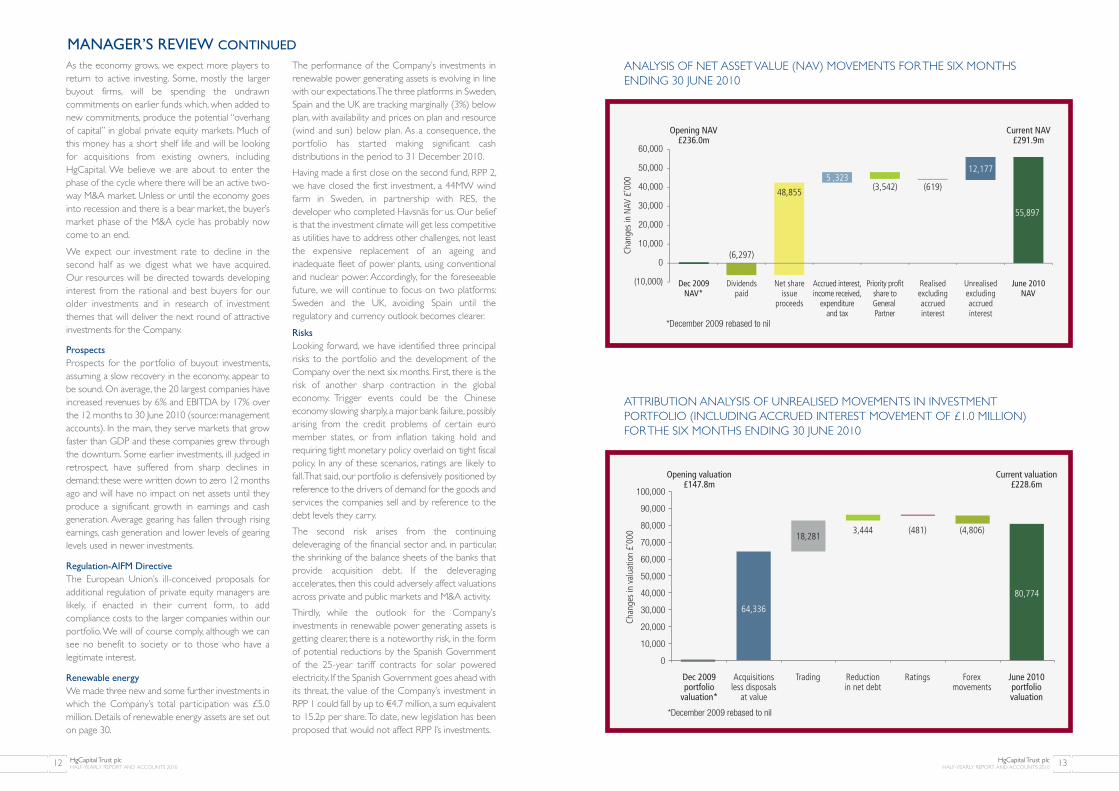
*December 2009 rebased to nil
Dec 2009 NAV*
Dividends paid
Net shareissue
proceeds
Accrued interest, income received,
expenditure and tax
Priority profit share to General Partner
Realised excluding accrued interest
Unrealised excluding accrued interest
June 2010 NAV
Opening NAV £236.0m
Current NAV£291.9m
Chan
ges
in N
AV £
’000
60,000
50,000
40,000
30,000
20,000
10,000
0
(10,000)
(6,297)
48,855
5 ,323(3,542) (619)
12,177
55,897
ANALYSIS OF NET ASSET VALUE (NAV) MOVEMENTS FOR THE SIX MONTHSENDING 30 JUNE 2010
Dec 2009 portfolio
valuation*
*December 2009 rebased to nil
Acquisitionsless disposals
at value
Trading Ratings Reduction in net debt
Forex movements
June 2010 portfolio valuation
Opening valuation £147.8m
Current valuation £228.6m
Chan
ges
in v
alua
tion
£’00
0
100,000
90,000
80,000
70,000
60,000
50,000
40,000
30,000
20,000
10,000
0
64,336
3,444 (481) (4,806)
80,774
18,281
ATTRIBUTION ANALYSIS OF UNREALISED MOVEMENTS IN INVESTMENTPORTFOLIO (INCLUDING ACCRUED INTEREST MOVEMENT OF £1.0 MILLION) FOR THE SIX MONTHS ENDING 30 JUNE 2010
HgCapital Trust plcHALF-YEARLY REPORT AND ACCOUNTS 201014
MANAGER’S REVIEW CONTINUED
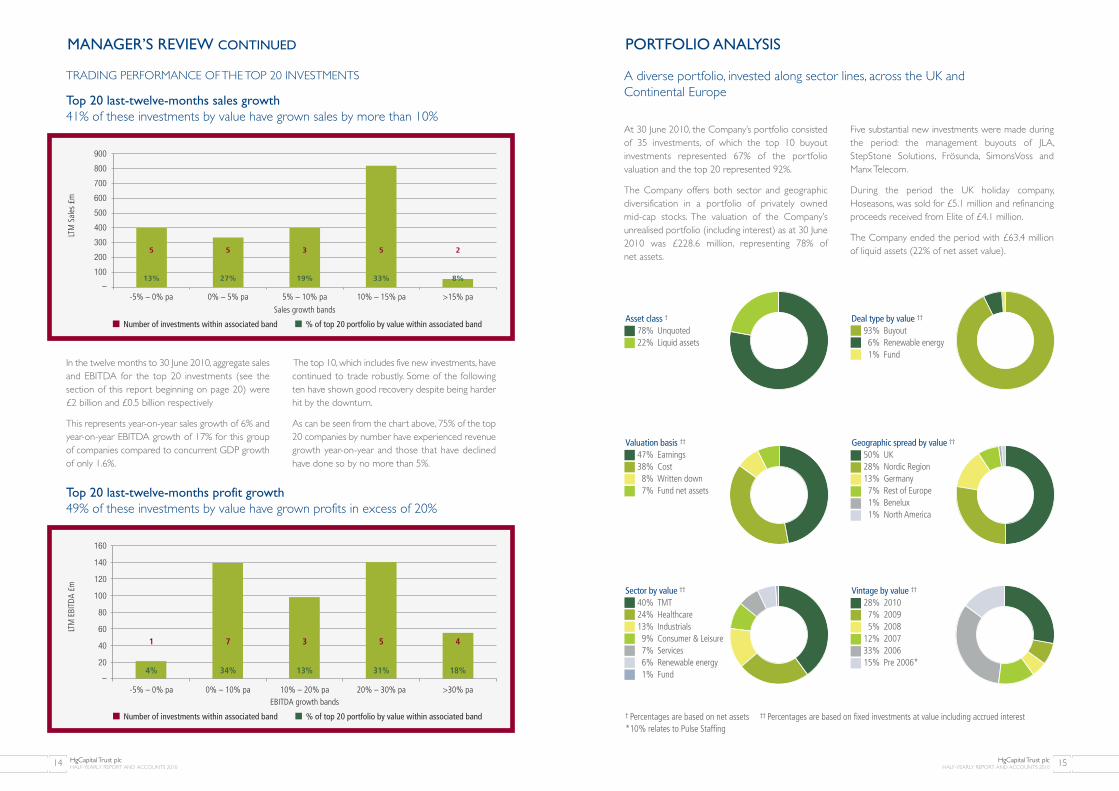
Top 20 last-twelve-months sales growth41% of these investments by value have grown sales by more than 10%
TRADING PERFORMANCE OF THE TOP 20 INVESTMENTS
Top 20 last-twelve-months profit growth49% of these investments by value have grown profits in excess of 20%
Number of investments within associated band % of top 20 portfolio by value within associated band
-5% – 0% pa 0% – 5% pa 5% – 10% pa 10% – 15% pa >15% pa
LTM
Sal
es £
m
Sales growth bands
800
900
700
600
500
400
300
200
100
–13% 27% 19% 33% 8%
5 5 3 5 2
-5% – 0% pa 0% – 10% pa 10% – 20% pa 20% – 30% pa >30% pa
LTM
EBI
TDA
£m
160
140
120
100
80
60
40
20
–4% 34% 13% 31% 18%
1 7 3 5 4
Number of investments within associated band % of top 20 portfolio by value within associated band
EBITDA growth bands
HgCapital Trust plcHALF-YEARLY REPORT AND ACCOUNTS 2010 15
In the twelve months to 30 June 2010, aggregate salesand EBITDA for the top 20 investments (see thesection of this report beginning on page 20) were £2 billion and £0.5 billion respectively
This represents year-on-year sales growth of 6% andyear-on-year EBITDA growth of 17% for this group of companies compared to concurrent GDP growthof only 1.6%.
The top 10, which includes five new investments, havecontinued to trade robustly. Some of the followingten have shown good recovery despite being harderhit by the downturn.
As can be seen from the chart above, 75% of the top20 companies by number have experienced revenuegrowth year-on-year and those that have declinedhave done so by no more than 5%.
PORTFOLIO ANALYSIS
At 30 June 2010, the Company’s portfolio consistedof 35 investments, of which the top 10 buyoutinvestments represented 67% of the portfoliovaluation and the top 20 represented 92%.
The Company offers both sector and geographicdiversification in a portfolio of privately owned mid-cap stocks. The valuation of the Company’sunrealised portfolio (including interest) as at 30 June2010 was £228.6 million, representing 78% of net assets.
Five substantial new investments were made duringthe period: the management buyouts of JLA,StepStone Solutions, Frösunda, SimonsVoss andManx Telecom.
During the period the UK holiday company,Hoseasons, was sold for £5.1 million and refinancingproceeds received from Elite of £4.1 million.
The Company ended the period with £63.4 millionof liquid assets (22% of net asset value).
A diverse portfolio, invested along sector lines, across the UK and Continental Europe
Deal type by value ††
93% Buyout6% Renewable energy1% Fund
Geographic spread by value ††
50% UK28% Nordic Region13% Germany7% Rest of Europe1% Benelux1% North America
Vintage by value ††
28% 20107% 20095% 2008
12% 200733% 200615% Pre 2006*
† Percentages are based on net assets †† Percentages are based on fixed investments at value including accrued interest*10% relates to Pulse Staffing
Sector by value ††
40% TMT24% Healthcare13% Industrials9% Consumer & Leisure7% Services6% Renewable energy1% Fund
Valuation basis ††
47% Earnings 38% Cost8% Written down7% Fund net assets
Asset class †
78% Unquoted22% Liquid assets
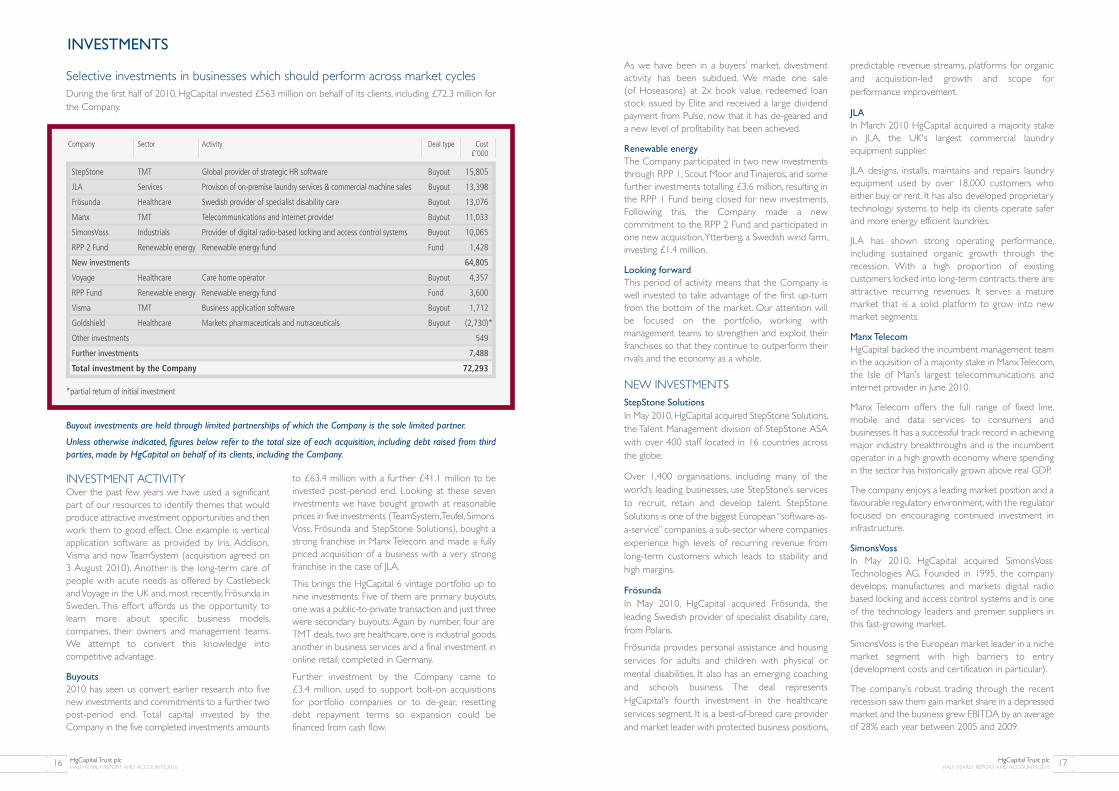
INVESTMENTS
During the first half of 2010, HgCapital invested £563 million on behalf of its clients, including £72.3 million forthe Company.
Selective investments in businesses which should perform across market cycles
INVESTMENT ACTIVITYOver the past few years we have used a significantpart of our resources to identify themes that wouldproduce attractive investment opportunities and thenwork them to good effect. One example is verticalapplication software as provided by Iris, Addison,Visma and now TeamSystem (acquisition agreed on 3 August 2010). Another is the long-term care ofpeople with acute needs as offered by Castlebeckand Voyage in the UK and, most recently, Frösunda inSweden. This effort affords us the opportunity tolearn more about specific business models,companies, their owners and management teams. We attempt to convert this knowledge intocompetitive advantage.
Buyouts
2010 has seen us convert earlier research into fivenew investments and commitments to a further twopost-period end. Total capital invested by theCompany in the five completed investments amounts
to £63.4 million with a further £41.1 million to beinvested post-period end. Looking at these seveninvestments we have bought growth at reasonableprices in five investments (TeamSystem, Teufel, SimonsVoss, Frösunda and StepStone Solutions), bought astrong franchise in Manx Telecom and made a fullypriced acquisition of a business with a very strongfranchise in the case of JLA.
This brings the HgCapital 6 vintage portfolio up tonine investments. Five of them are primary buyouts,one was a public-to-private transaction and just threewere secondary buyouts. Again by number, four areTMT deals, two are healthcare, one is industrial goods,another in business services and a final investment inonline retail, completed in Germany.
Further investment by the Company came to £3.4 million, used to support bolt-on acquisitions for portfolio companies or to de-gear, resetting debt repayment terms so expansion could befinanced from cash flow.
Buyout investments are held through limited partnerships of which the Company is the sole limited partner.
Unless otherwise indicated, figures below refer to the total size of each acquisition, including debt raised from thirdparties, made by HgCapital on behalf of its clients, including the Company.
HgCapital Trust plcHALF-YEARLY REPORT AND ACCOUNTS 201016 HgCapital Trust plc
HALF-YEARLY REPORT AND ACCOUNTS 2010 17
Company Sector Activity Deal type Cost£’000
StepStone TMT Global provider of strategic HR software Buyout 15,805
JLA Services Provison of on-premise laundry services & commercial machine sales Buyout 13,398
Frösunda Healthcare Swedish provider of specialist disability care Buyout 13,076
Manx TMT Telecommunications and internet provider Buyout 11,033
SimonsVoss Industrials Provider of digital radio-based locking and access control systems Buyout 10,065
RPP 2 Fund Renewable energy Renewable energy fund Fund 1,428
New investments 64,805
Voyage Healthcare Care home operator Buyout 4,357
RPP Fund Renewable energy Renewable energy fund Fund 3,600
Visma TMT Business application software Buyout 1,712
Goldshield Healthcare Markets pharmaceuticals and nutraceuticals Buyout (2,730)*
Other investments 549
Further investments 7,488
Total investment by the Company 72,293
As we have been in a buyers’ market, divestmentactivity has been subdued. We made one sale (of Hoseasons) at 2x book value, redeemed loanstock issued by Elite and received a large dividendpayment from Pulse, now that it has de-geared and a new level of profitability has been achieved.
Renewable energy
The Company participated in two new investmentsthrough RPP 1, Scout Moor and Tinajeros, and somefurther investments totalling £3.6 million, resulting inthe RPP 1 Fund being closed for new investments.Following this, the Company made a newcommitment to the RPP 2 Fund and participated inone new acquisition, Ytterberg, a Swedish wind farm,investing £1.4 million.
Looking forward
This period of activity means that the Company iswell invested to take advantage of the first up-turnfrom the bottom of the market. Our attention willbe focused on the portfolio, working withmanagement teams to strengthen and exploit theirfranchises so that they continue to outperform theirrivals and the economy as a whole.
NEW INVESTMENTS StepStone Solutions
In May 2010, HgCapital acquired StepStone Solutions,the Talent Management division of StepStone ASAwith over 400 staff located in 16 countries across the globe.
Over 1,400 organisations, including many of theworld’s leading businesses, use StepStone’s servicesto recruit, retain and develop talent. StepStoneSolutions is one of the biggest European “software-as-a-service” companies, a sub-sector where companiesexperience high levels of recurring revenue fromlong-term customers which leads to stability and high margins.
Frösunda
In May 2010, HgCapital acquired Frösunda, theleading Swedish provider of specialist disability care,from Polaris.
Frösunda provides personal assistance and housingservices for adults and children with physical ormental disabilities. It also has an emerging coachingand schools business. The deal represents HgCapital’s fourth investment in the healthcareservices segment. It is a best-of-breed care providerand market leader with protected business positions,
predictable revenue streams, platforms for organicand acquisition-led growth and scope forperformance improvement.
JLA
In March 2010 HgCapital acquired a majority stakein JLA, the UK's largest commercial laundryequipment supplier.
JLA designs, installs, maintains and repairs laundryequipment used by over 18,000 customers whoeither buy or rent. It has also developed proprietarytechnology systems to help its clients operate saferand more energy efficient laundries.
JLA has shown strong operating performance,including sustained organic growth through therecession. With a high proportion of existingcustomers locked into long-term contracts, there areattractive recurring revenues. It serves a maturemarket that is a solid platform to grow into newmarket segments.
Manx Telecom
HgCapital backed the incumbent management teamin the aquisition of a majority stake in Manx Telecom,the Isle of Man’s largest telecommunications andinternet provider in June 2010.
Manx Telecom offers the full range of fixed line,mobile and data services to consumers andbusinesses. It has a successful track record in achievingmajor industry breakthroughs and is the incumbentoperator in a high growth economy where spendingin the sector has historically grown above real GDP.
The company enjoys a leading market position and afavourable regulatory environment, with the regulatorfocused on encouraging continued investment ininfrastructure.
SimonsVoss
In May 2010, HgCapital acquired SimonsVossTechnologies AG. Founded in 1995, the companydevelops, manufactures and markets digital radiobased locking and access control systems and is oneof the technology leaders and premier suppliers inthis fast-growing market.
SimonsVoss is the European market leader in a nichemarket segment with high barriers to entry(development costs and certification in particular).
The company’s robust trading through the recentrecession saw them gain market share in a depressedmarket and the business grew EBITDA by an averageof 28% each year between 2005 and 2009.
*partial return of initial investment
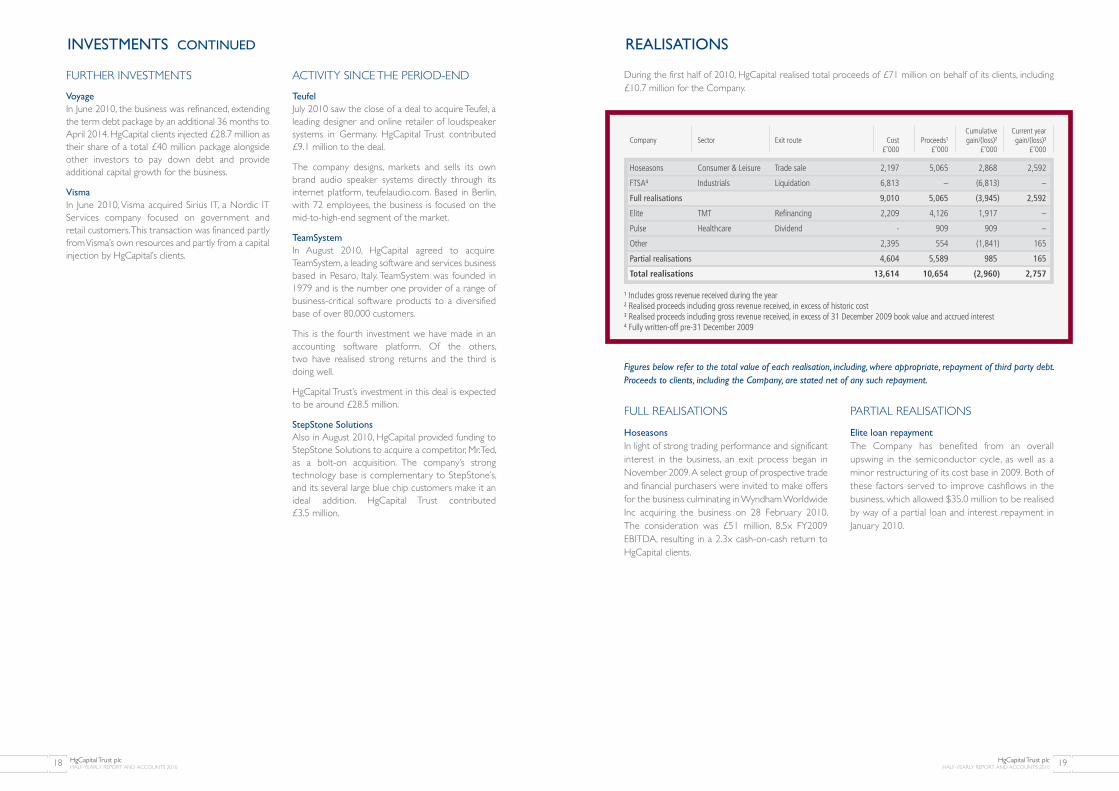
Figures below refer to the total value of each realisation, including, where appropriate, repayment of third party debt.Proceeds to clients, including the Company, are stated net of any such repayment.
REALISATIONS
During the first half of 2010, HgCapital realised total proceeds of £71 million on behalf of its clients, including£10.7 million for the Company.
FULL REALISATIONS
Hoseasons
In light of strong trading performance and significantinterest in the business, an exit process began inNovember 2009. A select group of prospective tradeand financial purchasers were invited to make offersfor the business culminating in Wyndham WorldwideInc acquiring the business on 28 February 2010. The consideration was £51 million, 8.5x FY2009EBITDA, resulting in a 2.3x cash-on-cash return toHgCapital clients.
PARTIAL REALISATIONS
Elite loan repayment
The Company has benefited from an overallupswing in the semiconductor cycle, as well as aminor restructuring of its cost base in 2009. Both ofthese factors served to improve cashflows in thebusiness, which allowed $35.0 million to be realisedby way of a partial loan and interest repayment inJanuary 2010.
1 Includes gross revenue received during the year2 Realised proceeds including gross revenue received, in excess of historic cost3 Realised proceeds including gross revenue received, in excess of 31 December 2009 book value and accrued interest4 Fully written-off pre-31 December 2009
HgCapital Trust plcHALF-YEARLY REPORT AND ACCOUNTS 2010 19HgCapital Trust plc
HALF-YEARLY REPORT AND ACCOUNTS 201018
Cumulative Current yearCompany Sector Exit route Cost Proceeds1 gain/(loss)2 gain/(loss)3
£’000 £’000 £’000 £’000
Hoseasons Consumer & Leisure Trade sale 2,197 5,065 2,868 2,592
FTSA4 Industrials Liquidation 6,813 – (6,813) –
Full realisations 9,010 5,065 (3,945) 2,592
Elite TMT Refinancing 2,209 4,126 1,917 –
Pulse Healthcare Dividend - 909 909 –
Other 2,395 554 (1,841) 165
Partial realisations 4,604 5,589 985 165
Total realisations 13,614 10,654 (2,960) 2,757
FURTHER INVESTMENTS
Voyage
In June 2010, the business was refinanced, extendingthe term debt package by an additional 36 months toApril 2014. HgCapital clients injected £28.7 million astheir share of a total £40 million package alongsideother investors to pay down debt and provideadditional capital growth for the business.
Visma
In June 2010, Visma acquired Sirius IT, a Nordic ITServices company focused on government and retail customers. This transaction was financed partlyfrom Visma’s own resources and partly from a capitalinjection by HgCapital’s clients.
ACTIVITY SINCE THE PERIOD-END
Teufel
July 2010 saw the close of a deal to acquire Teufel, aleading designer and online retailer of loudspeakersystems in Germany. HgCapital Trust contributed £9.1 million to the deal.
The company designs, markets and sells its ownbrand audio speaker systems directly through itsinternet platform, teufelaudio.com. Based in Berlin,with 72 employees, the business is focused on themid-to-high-end segment of the market.
TeamSystem
In August 2010, HgCapital agreed to acquireTeamSystem, a leading software and services businessbased in Pesaro, Italy. TeamSystem was founded in1979 and is the number one provider of a range ofbusiness-critical software products to a diversifiedbase of over 80,000 customers.
This is the fourth investment we have made in anaccounting software platform. Of the others, two have realised strong returns and the third isdoing well.
HgCapital Trust’s investment in this deal is expectedto be around £28.5 million.
StepStone Solutions
Also in August 2010, HgCapital provided funding toStepStone Solutions to acquire a competitor, Mr. Ted,as a bolt-on acquisition. The company’s strongtechnology base is complementary to StepStone’s,and its several large blue chip customers make it anideal addition. HgCapital Trust contributed £3.5 million.
INVESTMENTS CONTINUED

HgCapital Trust plcHALF-YEARLY REPORT AND ACCOUNTS 2010 21HgCapital Trust plc
HALF-YEARLY REPORT AND ACCOUNTS 201020
REVIEW OF PRINCIPAL BUYOUT INVESTMENTS
2 Pulse www.pulsejobs.com
Sector: HealthcareLocation: UKDate invested: June 1999Original enterprise value: £67 millionHgCapital clients’ total equity: 74%
Business description
• Pulse is one of the UK’s leading providers ofcomprehensive labour management, recruitmentand deployment services in the healthcare sector.
• The company works in partnership withhealthcare organisations in the public and privatesectors to provide staffing, management servicesand consultancy.
Performance
• Current trading: both revenues and EBITDA aresignificantly up year on year.
• Exit strategy: Pulse is anticipated to be a target forboth private equity and trade buyers and is also a possible candidate for an IPO.
1Visma www.visma.com
Sector: TMTLocation: Nordic regionDate invested: May 2006Original enterprise value: NOK 4.3 billionHgCapital clients’ total equity: 46%
Business description
• VISMA is the number one provider of businesssoftware and related services to small andmedium-sized enterprises in the Nordic region.
• The company provides accounting, resourceplanning and payroll software, outsourced book-keeping, payroll services and transactionprocess outsourcing.
Performance
• Current trading: performance in the year to date hasbeen strong, with good growth in both sales andEBITDA. The company has also closed three bolt-onacquisitions: Opic, Sirius IT and Invoicia.
• Exit strategy: significant interest from secondarybuyers is expected. A trade sale to software/publishing companies or an IPO provide alternatives.
Residual Unrealised Accrued Totalcost value interest value Valuation
£’000 £’000 £’000 £’000 methodology
StepStone Solutions 15,805 14,883 – 14,883 Cost
JLA 13,398 13,398 – 13,398 Cost
3 StepStone Solutionswww.stepstonesolutions.com
Sector: TMTLocation: UKDate invested: May 2010Original enterprise value: €110 millionHgCapital clients’ total equity: 79%
Business description
• StepStone Solutions, a division of StepStone ASA,is a leading provider of strategic HR software tomedium and large enterprises in Europe, operatingin 16 countries with 430 full-time employees.
• The business operates a subscription-basedrevenue model with a strong recurring consultingelement required to configure solutions tocustomer requirements. Customer retention ratesare high at around 95%.
Performance
• Current trading: performance in the year to date hasbeen strong. Since period-end, a bolt-on acquisition ofMr. Ted, one of StepStone’s competitors, has been made.
• Exit strategy: the company will be positioned for atrade exit, most likely to an industry consolidator.
4 JLA www.jla.com
Sector: ServicesLocation: UKDate invested: March 2010Original enterprise value: £150 millionHgCapital clients’ total equity: 75%
Business description
• JLA is the number one service provider to theon-premises laundry market, providingdistribution, rental and servicing of commerciallaundry machines to more than 18,000 UKbusiness customers.
• The company is also the number one provider of coin-operated, commercial machines intoaccommodation units. It services this market viaits Circuit brand.
Performance
• Current trading: performance in the year to date is slightly above the prior year.
• Exit strategy: the most likely exit routes are a sale to another private equity firm or a trade sale.
Residual Unrealised Accrued Totalcost value interest value Valuation
£’000 £’000 £’000 £’000 methodology
Visma 16,321 38,082 2,551 40,633 Earnings
Pulse 6,131 22,624 – 22,624 Earnings
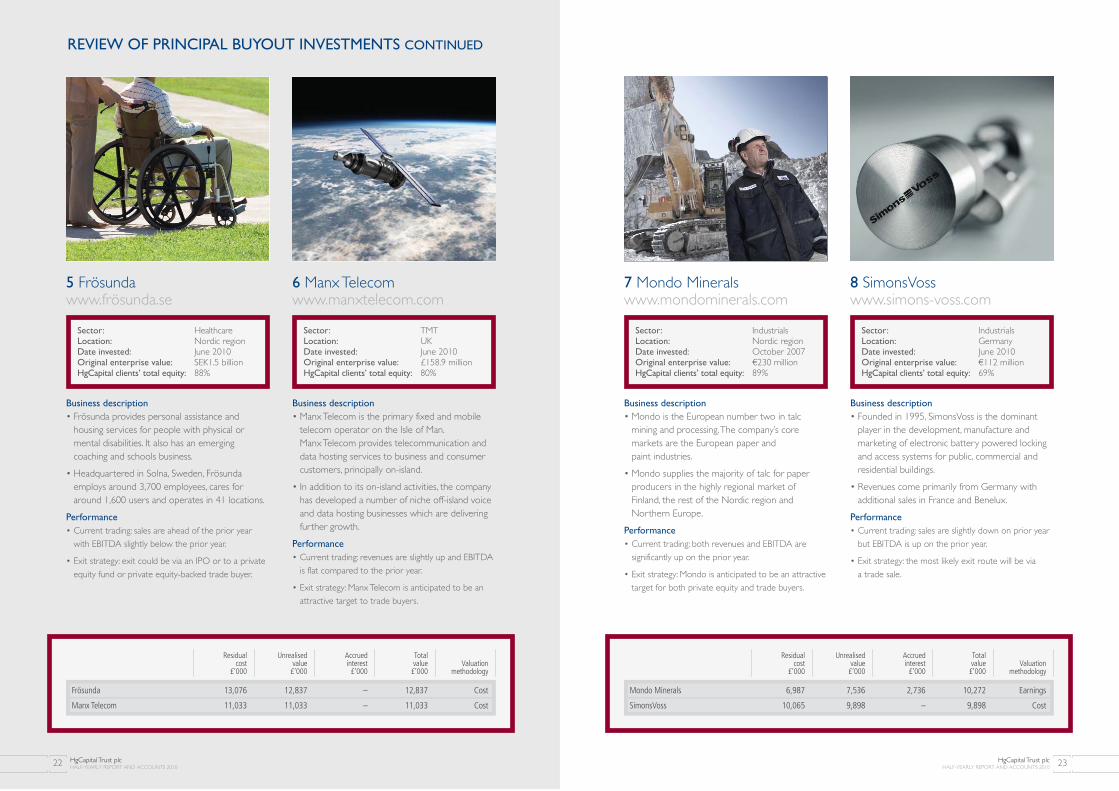
7 Mondo Mineralswww.mondominerals.com
Sector: IndustrialsLocation: Nordic regionDate invested: October 2007Original enterprise value: €230 millionHgCapital clients’ total equity: 89%
Business description
• Mondo is the European number two in talcmining and processing. The company’s coremarkets are the European paper and paint industries.
• Mondo supplies the majority of talc for paperproducers in the highly regional market of Finland, the rest of the Nordic region andNorthern Europe.
Performance
• Current trading: both revenues and EBITDA aresignificantly up on the prior year.
• Exit strategy: Mondo is anticipated to be an attractivetarget for both private equity and trade buyers.
8 SimonsVosswww.simons-voss.com
Sector: IndustrialsLocation: GermanyDate invested: June 2010Original enterprise value: €112 millionHgCapital clients’ total equity: 69%
Business description
• Founded in 1995, SimonsVoss is the dominantplayer in the development, manufacture andmarketing of electronic battery powered lockingand access systems for public, commercial andresidential buildings.
• Revenues come primarily from Germany withadditional sales in France and Benelux.
Performance
• Current trading: sales are slightly down on prior yearbut EBITDA is up on the prior year.
• Exit strategy: the most likely exit route will be via a trade sale.
HgCapital Trust plcHALF-YEARLY REPORT AND ACCOUNTS 2010 23HgCapital Trust plc
HALF-YEARLY REPORT AND ACCOUNTS 201022
REVIEW OF PRINCIPAL BUYOUT INVESTMENTS CONTINUED
Residual Unrealised Accrued Totalcost value interest value Valuation
£’000 £’000 £’000 £’000 methodology
Frösunda 13,076 12,837 – 12,837 Cost
Manx Telecom 11,033 11,033 – 11,033 Cost
Residual Unrealised Accrued Totalcost value interest value Valuation
£’000 £’000 £’000 £’000 methodology
Mondo Minerals 6,987 7,536 2,736 10,272 Earnings
SimonsVoss 10,065 9,898 – 9,898 Cost
6 Manx Telecom www.manxtelecom.com
Sector: TMTLocation: UKDate invested: June 2010Original enterprise value: £158.9 millionHgCapital clients’ total equity: 80%
Business description
• Manx Telecom is the primary fixed and mobiletelecom operator on the Isle of Man. Manx Telecom provides telecommunication anddata hosting services to business and consumercustomers, principally on-island.
• In addition to its on-island activities, the companyhas developed a number of niche off-island voiceand data hosting businesses which are deliveringfurther growth.
Performance
• Current trading: revenues are slightly up and EBITDAis flat compared to the prior year.
• Exit strategy: Manx Telecom is anticipated to be anattractive target to trade buyers.
5 Frösundawww.frösunda.se
Sector: HealthcareLocation: Nordic regionDate invested: June 2010Original enterprise value: SEK1.5 billionHgCapital clients’ total equity: 88%
Business description
• Frösunda provides personal assistance andhousing services for people with physical ormental disabilities. It also has an emergingcoaching and schools business.
• Headquartered in Solna, Sweden, Frösundaemploys around 3,700 employees, cares foraround 1,600 users and operates in 41 locations.
Performance
• Current trading: sales are ahead of the prior yearwith EBITDA slightly below the prior year.
• Exit strategy: exit could be via an IPO or to a privateequity fund or private equity-backed trade buyer.

REVIEW OF PRINCIPAL BUYOUT INVESTMENTS CONTINUED
HgCapital Trust plcHALF-YEARLY REPORT AND ACCOUNTS 2010 25HgCapital Trust plc
HALF-YEARLY REPORT AND ACCOUNTS 201024
Residual Unrealised Accrued Totalcost value interest value Valuation
£’000 £’000 £’000 £’000 methodology
SLV 5,999 6,691 2,407 9,098 Earnings
Goldshield 8,545 8,545 – 8,545 Cost
9 SLVwww.slv.com
Sector: IndustrialsLocation: GermanyDate invested: August 2007Original enterprise value: €280 millionHgCapital clients’ total equity: 66%
Business description
• SLV is a fast growing and highly profitable Germanprovider of lighting systems and decorativelighting solutions with a B2B focus. Products areonly sold through catalogues.
• SLV has a competitive advantage in the areas ofproduct development and design, production,warehousing and logistics, and distribution.
Performance
• Current trading: sales and EBITDA are both up onthe prior year.
• Exit strategy: SLV should be an attractive target forboth private equity and trade buyers. The feasibility of an IPO will also be considered; SLV could bemarketed as an attractive German mid-marketgrowth story.
10 Goldshield www.goldshield-pharmaceuticals.com
Sector: HealthcareLocation: UKDate invested: December 2009Original enterprise value: £179 millionHgCapital clients’ total equity: 53%
Business description
• Goldshield is a profitable niche pharmaceuticalcompany focused on the UK. It sells maturebranded products and niche generics, typically re-formulating them to extend their lives.
• Goldshield also has a small consumer healthdivision which sells a range of weightmanagement and consumer health products.
Performance
• Current trading: Goldshield’s sales and EBITDA aredown on the prior year, due mainly to the consumerhealth division and supply chain issues in thepharmaceutical division.
• Exit strategy: a trade sale is most likely although anIPO or sale to a private equity fund are possible.
12 Epyxwww.epyx.co.uk
Sector: TMTLocation: UKDate invested: June 2009Original enterprise value: €230 millionHgCapital clients’ total equity: 51%
Business description
• Epyx provides a marketplace for fleet vehicleservice, maintenance and repair, disposals, hire,relicensing and procurement.
• Epyx is the UK market leader, processingtransactions for around 90% of service andmaintenance events for UK fleet vehicles.
Performance
• Current trading: trading is above budget with salesand EBITDA both significantly ahead of last year.
• Exit strategy: the options for Epyx are attractive, with a trade sale or secondary buyout being viable options.
11 Voyage Groupwww.voyagecare.com
Sector: Healthcare Location: UKDate invested: April 2006Original enterprise value: £322 millionHgCapital clients’ total equity: 65%
Business description
• Voyage owns and operates small community-basedhomes for adults with learning disabilities andassociated physical disabilities, autistic spectrumdisorders, complex needs and acquired brain injury.
• Voyage offers a range of care provision from dailyhelp to intensive physical and mental support inmodified accommodation. Fees are paid by localauthorities.
Performance
• Current trading: occupancy remains strong and issignificantly higher than the industry average despitepressures on public sector budgets. Both sales andEBITDA are ahead of prior year.
• Exit strategy: exit could be via an IPO, to a privateequity fund or private equity-backed trade buyer.
Residual Unrealised Accrued Totalcost value interest value Valuation
£’000 £’000 £’000 £’000 methodology
Voyage Group 13,112 6,447 1,928 8,375 Written down
Epyx 6,388 7,522 836 8,358 Earnings
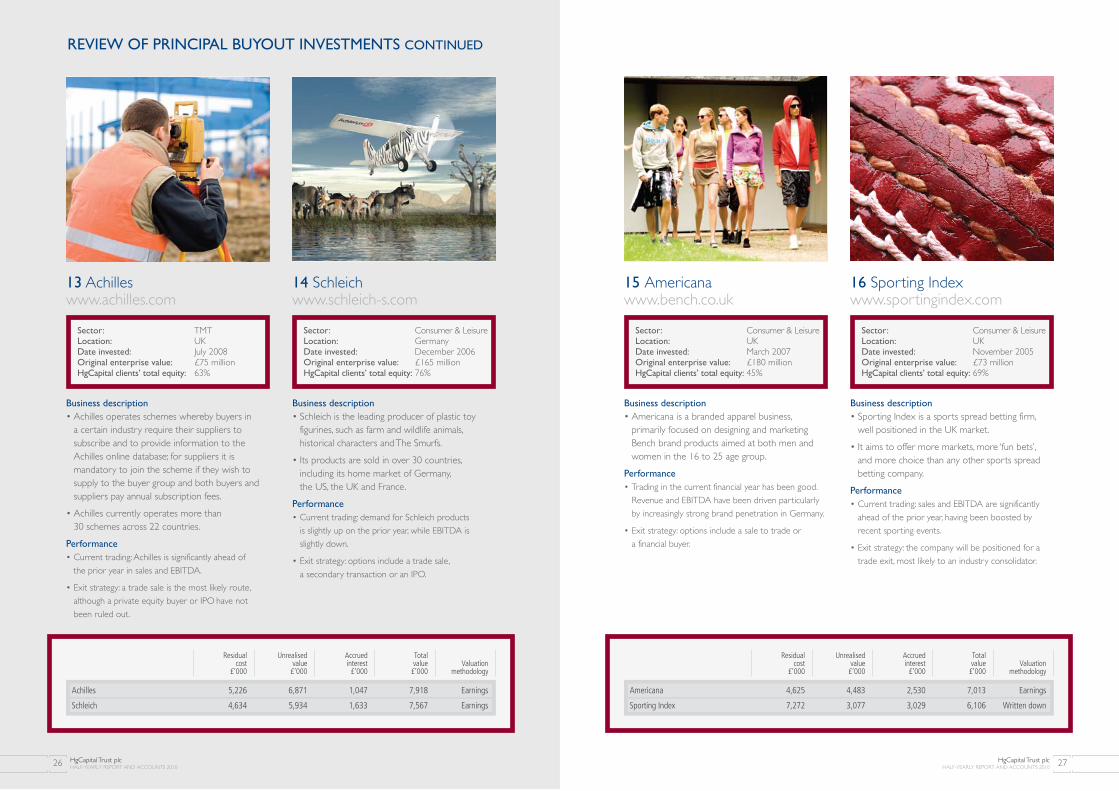
15 Americanawww.bench.co.uk
Sector: Consumer & LeisureLocation: UKDate invested: March 2007Original enterprise value: £180 millionHgCapital clients’ total equity: 45%
Business description
• Americana is a branded apparel business,primarily focused on designing and marketingBench brand products aimed at both men andwomen in the 16 to 25 age group.
Performance
• Trading in the current financial year has been good.Revenue and EBITDA have been driven particularlyby increasingly strong brand penetration in Germany.
• Exit strategy: options include a sale to trade or a financial buyer.
REVIEW OF PRINCIPAL BUYOUT INVESTMENTS CONTINUED
Residual Unrealised Accrued Totalcost value interest value Valuation
£’000 £’000 £’000 £’000 methodology
Achilles 5,226 6,871 1,047 7,918 Earnings
Schleich 4,634 5,934 1,633 7,567 Earnings
Residual Unrealised Accrued Totalcost value interest value Valuation
£’000 £’000 £’000 £’000 methodology
Americana 4,625 4,483 2,530 7,013 Earnings
Sporting Index 7,272 3,077 3,029 6,106 Written down
14 Schleich www.schleich-s.com
Sector: Consumer & LeisureLocation: GermanyDate invested: December 2006Original enterprise value: £165 millionHgCapital clients’ total equity: 76%
Business description
• Schleich is the leading producer of plastic toyfigurines, such as farm and wildlife animals,historical characters and The Smurfs.
• Its products are sold in over 30 countries,including its home market of Germany, the US, the UK and France.
Performance
• Current trading: demand for Schleich products is slightly up on the prior year, while EBITDA is slightly down.
• Exit strategy: options include a trade sale, a secondary transaction or an IPO.
13 Achilleswww.achilles.com
Sector: TMTLocation: UKDate invested: July 2008Original enterprise value: £75 millionHgCapital clients’ total equity: 63%
Business description
• Achilles operates schemes whereby buyers in a certain industry require their suppliers tosubscribe and to provide information to theAchilles online database; for suppliers it ismandatory to join the scheme if they wish tosupply to the buyer group and both buyers andsuppliers pay annual subscription fees.
• Achilles currently operates more than 30 schemes across 22 countries.
Performance
• Current trading: Achilles is significantly ahead of the prior year in sales and EBITDA.
• Exit strategy: a trade sale is the most likely route,although a private equity buyer or IPO have not been ruled out.
HgCapital Trust plcHALF-YEARLY REPORT AND ACCOUNTS 2010 27HgCapital Trust plc
HALF-YEARLY REPORT AND ACCOUNTS 201026
16 Sporting Indexwww.sportingindex.com
Sector: Consumer & LeisureLocation: UKDate invested: November 2005Original enterprise value: £73 millionHgCapital clients’ total equity: 69%
Business description
• Sporting Index is a sports spread betting firm,well positioned in the UK market.
• It aims to offer more markets, more ‘fun bets’, and more choice than any other sports spreadbetting company.
Performance
• Current trading: sales and EBITDA are significantlyahead of the prior year, having been boosted byrecent sporting events.
• Exit strategy: the company will be positioned for atrade exit, most likely to an industry consolidator.
HgCapital Trust plcHALF-YEARLY REPORT AND ACCOUNTS 2010 29HgCapital Trust plc
HALF-YEARLY REPORT AND ACCOUNTS 201028
REVIEW OF PRINCIPAL BUYOUT INVESTMENTS CONTINUED
Residual Unrealised Accrued Totalcost value interest value Valuation
£’000 £’000 £’000 £’000 methodology
Elite 3,540 2,012 1,522 3,534 Written down
Casa Reha 8,151 2,224 542 2,766 Written down
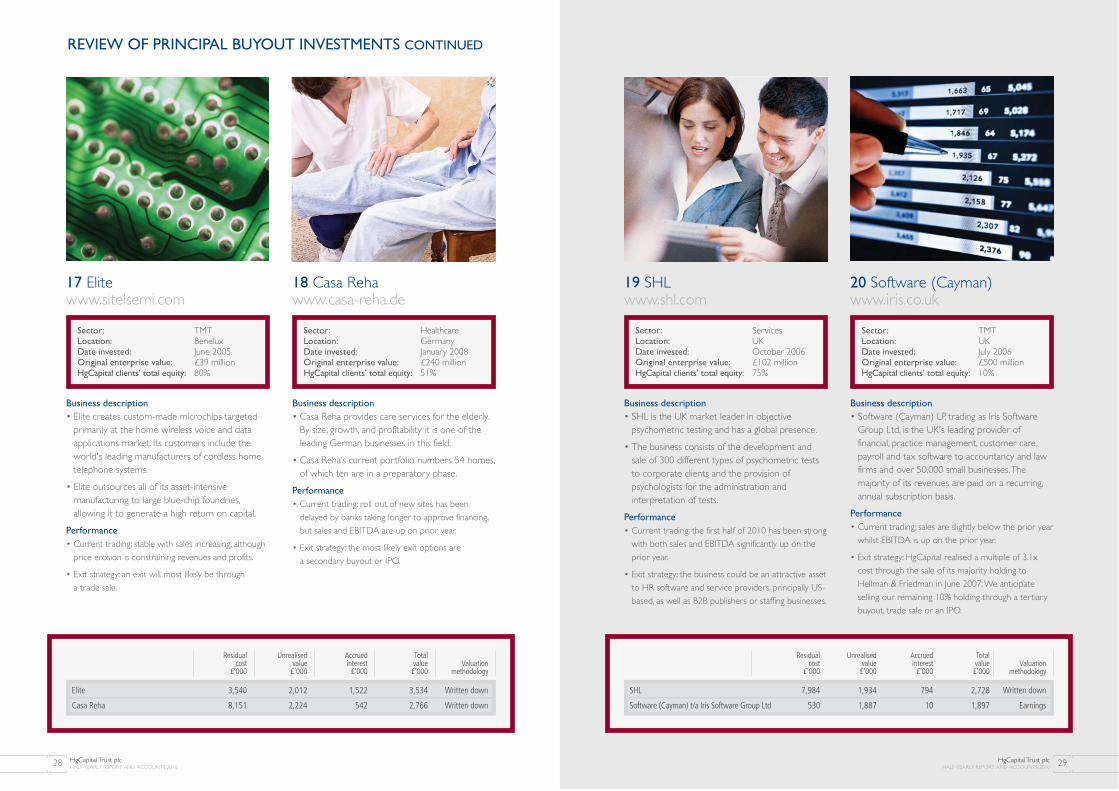
18 Casa Rehawww.casa-reha.de
Sector: HealthcareLocation: GermanyDate invested: January 2008Original enterprise value: £240 millionHgCapital clients’ total equity: 51%
Business description
• Casa Reha provides care services for the elderly.By size, growth, and profitability it is one of theleading German businesses in this field.
• Casa Reha’s current portfolio numbers 54 homes,of which ten are in a preparatory phase.
Performance
• Current trading: roll out of new sites has beendelayed by banks taking longer to approve financing,but sales and EBITDA are up on prior year.
• Exit strategy: the most likely exit options are a secondary buyout or IPO.
17 Elite www.sitelsemi.com
Sector: TMTLocation: BeneluxDate invested: June 2005Original enterprise value: £39 millionHgCapital clients’ total equity: 80%
Business description
• Elite creates custom-made microchips targetedprimarily at the home wireless voice and dataapplications market. Its customers include theworld's leading manufacturers of cordless hometelephone systems.
• Elite outsources all of its asset-intensivemanufacturing to large blue-chip foundries,allowing it to generate a high return on capital.
Performance
• Current trading: stable with sales increasing, althoughprice erosion is constraining revenues and profits.
• Exit strategy: an exit will most likely be through a trade sale.
19 SHLwww.shl.com
Sector: ServicesLocation: UKDate invested: October 2006Original enterprise value: £102 millionHgCapital clients’ total equity: 75%
Business description
• SHL is the UK market leader in objectivepsychometric testing and has a global presence.
• The business consists of the development andsale of 300 different types of psychometric teststo corporate clients and the provision ofpsychologists for the administration andinterpretation of tests.
Performance
• Current trading: the first half of 2010 has been strongwith both sales and EBITDA significantly up on theprior year.
• Exit strategy: the business could be an attractive assetto HR software and service providers, principally US-based, as well as B2B publishers or staffing businesses.
Residual Unrealised Accrued Totalcost value interest value Valuation
£’000 £’000 £’000 £’000 methodology
SHL 7,984 1,934 794 2,728 Written down
Software (Cayman) t/a Iris Software Group Ltd 530 1,887 10 1,897 Earnings
20 Software (Cayman)www.iris.co.uk
Sector: TMTLocation: UKDate invested: July 2006Original enterprise value: £500 millionHgCapital clients’ total equity: 10%
Business description
• Software (Cayman) LP, trading as Iris SoftwareGroup Ltd, is the UK's leading provider offinancial, practice management, customer care,payroll and tax software to accountancy and lawfirms and over 50,000 small businesses. Themajority of its revenues are paid on a recurring,annual subscription basis.
Performance
• Current trading: sales are slightly below the prior yearwhilst EBITDA is up on the prior year.
• Exit strategy: HgCapital realised a multiple of 3.1xcost through the sale of its majority holding toHellman & Friedman in June 2007. We anticipateselling our remaining 10% holding through a tertiarybuyout, trade sale or an IPO.
RENEWABLE ENERGY
REVIEW OF RENEWABLE ENERGY INVESTMENTS
HgCapital’s Renewable Energy sector team uses private equity skills to identify and acquire renewable energyprojects, usually based on wind or solar energy, in Western Europe. Investment returns are anticipated througha combination of yield during operation and capital gain at refinancing or exit, providing a return profile that theBoard believes will complement returns from its core investments in leveraged buyouts.
HgCapital is developing groups of projects based on the three platforms described below. These platforms canthen be refinanced efficiently or sold as portfolios of closely related projects. By participating as a limited partnerin HgCapital’s renewable funds the Company gains exposure across all these platforms more efficiently than byco-investing alongside the funds.
Renewable energy projects are initially valued at cost until they have been in operation for two years. From thattime they are valued on a discounted cash flow basis using discount rates reflecting similar transactions in therelevant market.
Hg RENEWABLE POWER PARTNERS LP AND HgCAPITAL RENEWABLE POWER PARTNERS 2 LP
In June 2006 the Company made its first commitment, of €21 million, to Hg Renewable Power Partners LP(‘RPP 1’). In June 2010, the Company committed €40 million to HgCapital Renewable Power Partners 2 LP(‘RPP 2’). This brings the Company’s total commitment to HgCapital’s renewable energy investment programmeto €61 million.
The investment strategy of these funds is to create a diversified portfolio of European renewable power assets,seeking out superior resource locations and utilising proven technologies. The funds take controlling positions in high quality, European renewable energy infrastructure projects, which provide a combination of attractive risk-adjusted returns, inflation linkage and insulation from GDP volatility. Investments are diversified by geography, technology, equipment supplier and regulatory regime. Projects are typically acquired at the pre-construction phase, and brought into operation within two years of acquisition. Each project is structuredwith long-term contracts for the sale of the power generated, for the supply and maintenance of equipment, andfixed rate funding.
In June 2010, it was reported that the Spanish government was considering the retroactive reduction ofgovernment guaranteed 25-year tariffs for solar PV projects. The HgCapital renewables team has taken steps tolobby against this unprecedented move. Legislation drafted by the Spanish government does not include anyretroactive changes for existing projects. The team remains confident that any such changes remain unlikely.
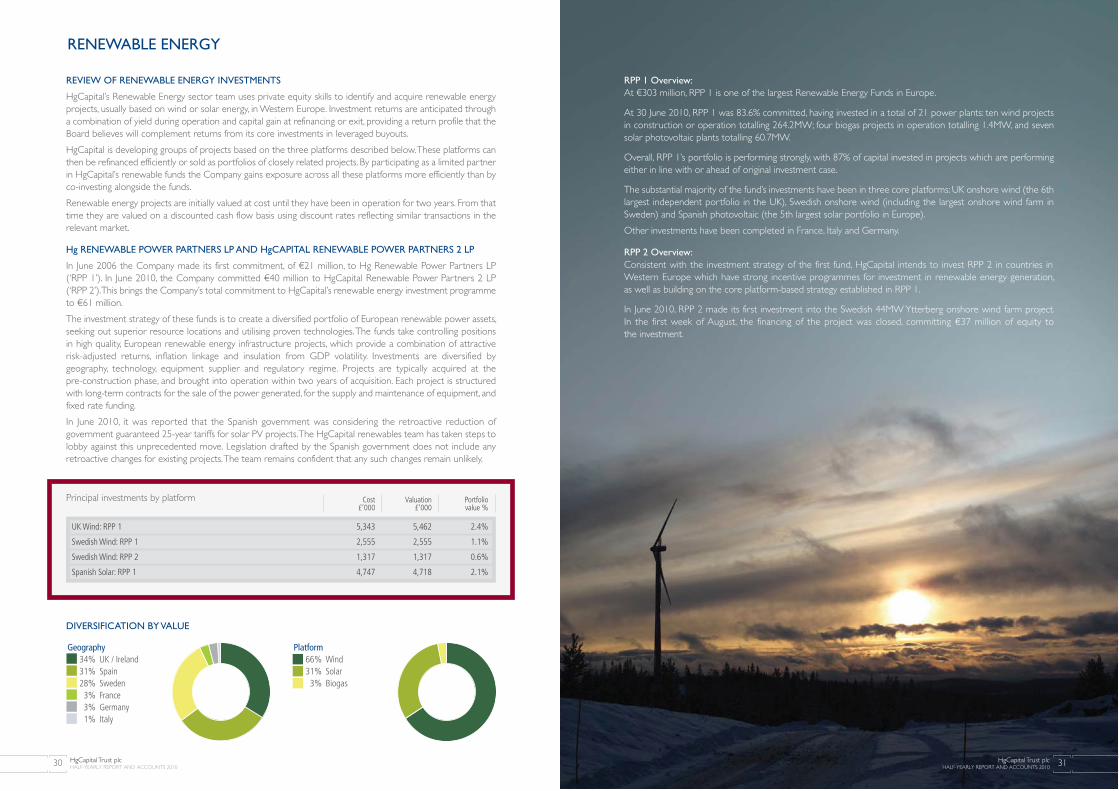
DIVERSIFICATION BY VALUE
RPP 1 Overview:
At €303 million, RPP 1 is one of the largest Renewable Energy Funds in Europe.
At 30 June 2010, RPP 1 was 83.6% committed, having invested in a total of 21 power plants: ten wind projectsin construction or operation totalling 264.2MW; four biogas projects in operation totalling 1.4MW, and sevensolar photovoltaic plants totalling 60.7MW.
Overall, RPP 1’s portfolio is performing strongly, with 87% of capital invested in projects which are performingeither in line with or ahead of original investment case.
The substantial majority of the fund’s investments have been in three core platforms: UK onshore wind (the 6thlargest independent portfolio in the UK), Swedish onshore wind (including the largest onshore wind farm inSweden) and Spanish photovoltaic (the 5th largest solar portfolio in Europe).
Other investments have been completed in France, Italy and Germany.
RPP 2 Overview:
Consistent with the investment strategy of the first fund, HgCapital intends to invest RPP 2 in countries inWestern Europe which have strong incentive programmes for investment in renewable energy generation, as well as building on the core platform-based strategy established in RPP 1.
In June 2010, RPP 2 made its first investment into the Swedish 44MW Ytterberg onshore wind farm project. In the first week of August, the financing of the project was closed, committing €37 million of equity to the investment.
HgCapital Trust plcHALF-YEARLY REPORT AND ACCOUNTS 2010 31HgCapital Trust plc
HALF-YEARLY REPORT AND ACCOUNTS 201030
Geography34% UK / Ireland 31% Spain28% Sweden3% France3% Germany1% Italy
Platform66% Wind31% Solar3% Biogas
Cost Valuation Portfolio £’000 £’000 value %
UK Wind: RPP 1 5,343 5,462 2.4%
Swedish Wind: RPP 1 2,555 2,555 1.1%
Swedish Wind: RPP 2 1,317 1,317 0.6%
Spanish Solar: RPP 1 4,747 4,718 2.1%
Principal investments by platform
RENEWABLE ENERGY CONTINUED
HgCapital Trust plcHALF-YEARLY REPORT AND ACCOUNTS 2010 33HgCapital Trust plc
HALF-YEARLY REPORT AND ACCOUNTS 201032
SPANISH SOLAR PHOTOVOLTAIC: MERCURIO
Mercurio is the fourth largest operator of solar PVin Europe with capacity of 60.8MW in seven projectsin Spain. Mercurio is owned by RPP 1 in partnershipwith Plenium Partners, who provide all operations,maintenance and administration services.
Olivenza:
18.0MW project in Extremadura operating since 2008.
Yecla:
7.5MW project in Murcia operating since 2008.
Abenojar:
5.3MW project in Castilla la Mancha operating since 2008.
Herencia:
4.7MW project in Castilla la Mancha operatingsince 2008.
Bargas:
5.3MW project in Castilla la Mancha operatingsince 2008.
Tinajeros:
12MW project in Murcia operating since 2008.
Fuente Alamo:
8.0MW project in Murcia commissioned in June 2010.
Performance
• Revenues for the first half of 2010 are 95% ofinvestment case and EBITDA 89%.
• Cumulative revenues since inception have been104% of investment case.
SWEDISH ONSHORE WIND
The largest owner of onshore wind farms inScandinavia with total capacity of 139MW in twoprojects, both developed and built by RenewableEnergy Systems Limited, one of the world’s mostexperienced developers of wind farms.
Havsnäs:
95MW wind farm operating since mid-2010, 75%owned by RPP I.
Ytterberg:
44MW project acquired by RPP 2 in June 2010,currently under construction.
Performance
• Havsnäs became fully operational post-period end,in early July 2010.
UK ONSHORE WIND
One of the ten largest independently-ownedonshore wind portfolios in the UK, the renewablesfunds have 112MW of capacity in operation.
Principal wind farms in operation
Tir Mostyn:
21MW wind farm in North Wales operating since2005.
Bagmoor:
16MW project in Lincolnshire operating since 2009.
Scout Moor:
65MW wind farm in Lancashire operating since 2009and owned through a 50 / 50 joint venture with Peel Holdings.
Wind Direct:
Two operating wind farms of 4MW and 5MW and athird 2MW project under construction, located onindustrial sites to supply electricity directly to theirindustrial host.
Windfarm development
RidgeWind:
A fully staffed development business with more than220MW under development and 60MW acrossthree projects with planning permission that are beingprepared for construction. HgCapital has a 100%controlling interest in this company.
Performance
• Performance year to date in 2010 has been poordue to exceptionally low wind conditions acrossthe UK from January to June. For the first half of2010, revenues are 58%, and EBITDA is 54% ofinvestment case.
• Power generation is expected to revert toinvestment case with underperformance entirelydue to extreme but natural variations in windresource and not related to any long-termproblem. All projects were above investment casein July.
• Cumulative revenues since inception have been89% of investment case.
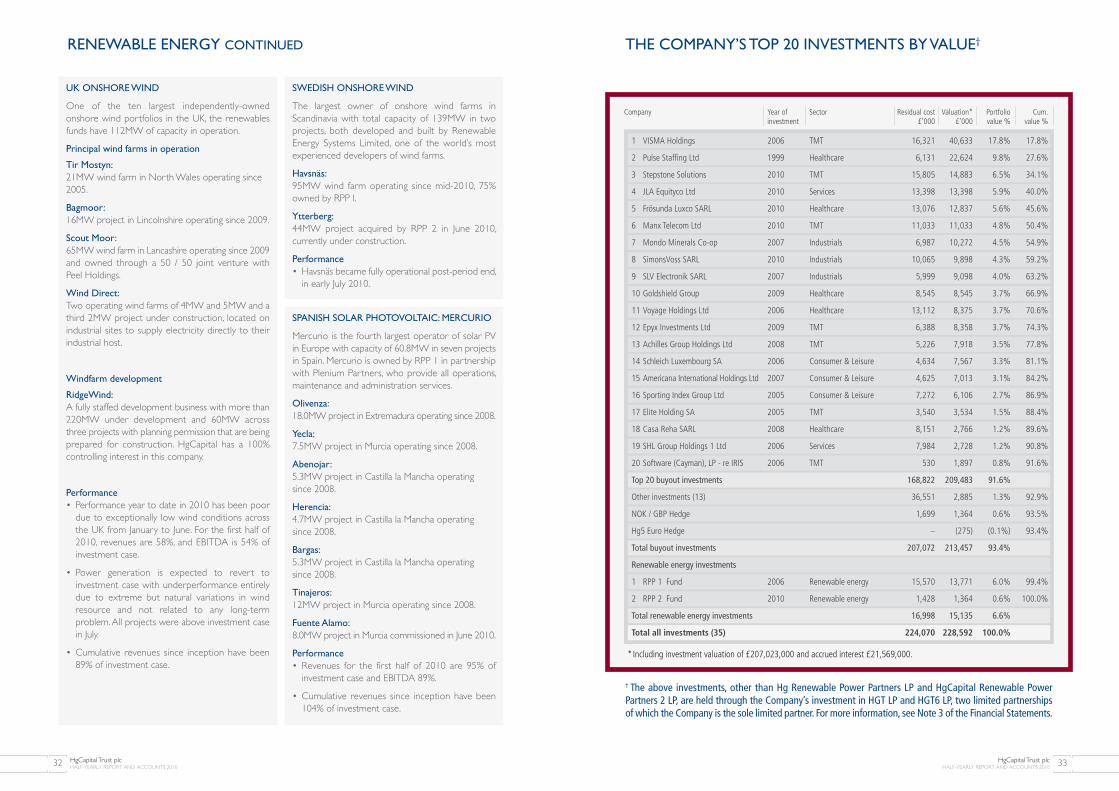
THE COMPANY’S TOP 20 INVESTMENTS BY VALUE†
† The above investments, other than Hg Renewable Power Partners LP and HgCapital Renewable PowerPartners 2 LP, are held through the Company’s investment in HGT LP and HGT6 LP, two limited partnershipsof which the Company is the sole limited partner. For more information, see Note 3 of the Financial Statements.
Company Year of Sector Residual cost Valuation* Portfolio Cum.investment £’000 £’000 value % value %
1 VISMA Holdings 2006 TMT 16,321 40,633 17.8% 17.8%
2 Pulse Staffing Ltd 1999 Healthcare 6,131 22,624 9.8% 27.6%
3 Stepstone Solutions 2010 TMT 15,805 14,883 6.5% 34.1%
4 JLA Equityco Ltd 2010 Services 13,398 13,398 5.9% 40.0%
5 Frösunda Luxco SARL 2010 Healthcare 13,076 12,837 5.6% 45.6%
6 Manx Telecom Ltd 2010 TMT 11,033 11,033 4.8% 50.4%
7 Mondo Minerals Co-op 2007 Industrials 6,987 10,272 4.5% 54.9%
8 SimonsVoss SARL 2010 Industrials 10,065 9,898 4.3% 59.2%
9 SLV Electronik SARL 2007 Industrials 5,999 9,098 4.0% 63.2%
10 Goldshield Group 2009 Healthcare 8,545 8,545 3.7% 66.9%
11 Voyage Holdings Ltd 2006 Healthcare 13,112 8,375 3.7% 70.6%
12 Epyx Investments Ltd 2009 TMT 6,388 8,358 3.7% 74.3%
13 Achilles Group Holdings Ltd 2008 TMT 5,226 7,918 3.5% 77.8%
14 Schleich Luxembourg SA 2006 Consumer & Leisure 4,634 7,567 3.3% 81.1%
15 Americana International Holdings Ltd 2007 Consumer & Leisure 4,625 7,013 3.1% 84.2%
16 Sporting Index Group Ltd 2005 Consumer & Leisure 7,272 6,106 2.7% 86.9%
17 Elite Holding SA 2005 TMT 3,540 3,534 1.5% 88.4%
18 Casa Reha SARL 2008 Healthcare 8,151 2,766 1.2% 89.6%
19 SHL Group Holdings 1 Ltd 2006 Services 7,984 2,728 1.2% 90.8%
20 Software (Cayman), LP - re IRIS 2006 TMT 530 1,897 0.8% 91.6%
Top 20 buyout investments 168,822 209,483 91.6%
Other investments (13) 36,551 2,885 1.3% 92.9%
NOK / GBP Hedge 1,699 1,364 0.6% 93.5%
Hg5 Euro Hedge – (275) (0.1%) 93.4%
Total buyout investments 207,072 213,457 93.4%
Renewable energy investments
1 RPP 1 Fund 2006 Renewable energy 15,570 13,771 6.0% 99.4%
2 RPP 2 Fund 2010 Renewable energy 1,428 1,364 0.6% 100.0%
Total renewable energy investments 16,998 15,135 6.6%
Total all investments (35) 224,070 228,592 100.0%
*Including investment valuation of £207,023,000 and accrued interest £21,569,000.

HgCapital Trust plcHALF-YEARLY REPORT AND ACCOUNTS 2010 35HgCapital Trust plc
HALF-YEARLY REPORT AND ACCOUNTS 201034
Income statement 36
Balance sheet 37
Cash flow statement 38
Reconciliation of movements in
shareholders’ funds 39
Notes to the financial statements 40
Management and administration 45

HgCapital Trust plcHALF-YEARLY REPORT AND ACCOUNTS 2010 37HgCapital Trust plc
HALF-YEARLY REPORT AND ACCOUNTS 201036
BALANCE SHEETas at 30 June 2010
INC
OM
E S
TA
TEM
EN
Tfo
r th
e six
mon
ths
ende
d 30
June
201
0
The
tota
l col
umn
of th
is st
atem
ent r
epre
sent
s the
Com
pany
’s in
com
e st
atem
ent.
The
supp
lem
enta
ry re
venu
e an
d ca
pita
l ret
urn
colu
mns
are
bot
h pr
epar
ed u
nder
gui
danc
e pu
blish
ed b
y th
eAs
socia
tion
of In
vest
men
t Com
pani
es (“
AIC”
). Al
l rec
ogni
sed
gain
s and
loss
es a
re d
isclo
sed
in th
e re
venu
e an
d ca
pita
l col
umns
of t
he in
com
e st
atem
ent a
nd a
s a c
onse
quen
ce n
o st
atem
ent
of to
tal r
ecog
nise
d ga
ins a
nd lo
sses
has
bee
n pr
esen
ted.
All r
even
ue a
nd c
apita
l ite
ms i
n th
e ab
ove
stat
emen
t der
ive fr
om c
ontin
uing
ope
ratio
ns.
Inte
rim d
ivide
nd fo
r the
yea
r end
ed 3
1 De
cem
ber 2
009
of 2
5.00
p (£
6,29
7,00
0) d
ecla
red
on 1
7 Fe
brua
ry 2
010
and
paid
on
31 M
arch
201
0.Fi
nal d
ivide
nd fo
r the
yea
r end
ed 3
1 De
cem
ber 2
008
of 2
5.00
p (£
6,29
7,00
0) d
ecla
red
on 1
3 M
arch
200
9 an
d pa
id o
n 11
May
200
9.
Reve
nue
retu
rnCa
pita
l ret
urn
Tota
l ret
urn
Six
mon
ths e
nded
Year
end
edSi
x m
onth
s end
edYe
ar e
nded
Six
mon
ths e
nded
Year
end
ed30
.6.1
030
.6.0
931
.12.
0930
.6.1
030
.6.0
931
.12.
0930
.6.1
030
.6.0
931
.12.
09£’
000
£’00
0£’
000
£’00
0£’
000
£’00
0£’
000
£’00
0£’
000
Not
e(u
naud
ited)
(una
udite
d)(a
udite
d)(u
naud
ited)
(una
udite
d)(a
udite
d)(u
naud
ited)
(una
udite
d)(a
udite
d)
Gai
ns/(l
osse
s) o
n in
vest
men
ts a
nd
gove
rnm
ent s
ecur
ities
––
–11
,558
(6,6
98)
5,21
111
,558
(6,6
98)
5,21
1
Loss
es o
n lo
ans r
ecei
vabl
e fro
m G
ener
al P
artn
er7(
b)–
––
(1,8
50)
(2,1
88)
(4,7
37)
(1,8
50)
(2,1
88)
(4,7
37)
Net
inco
me
64,
818
2,88
58,
018
––
–4,
818
2,88
58,
018
Inve
stm
ent m
anag
emen
t fee
reba
te7(
a)–
138
208
–41
562
5–
553
833
Oth
er e
xpen
ses
8(1
,187
)(3
12)
(1,0
78)
––
–(1
,187
)(3
12)
(1,0
78)
Net
retu
rn/(d
efic
it) o
n or
dina
ry
activ
ities
bef
ore
taxa
tion
3,63
12,
711
7,14
89,
708
(8,4
71)
1,09
913
,339
(5,7
60)
8,24
7
Taxa
tion
on o
rdin
ary
activ
ities
10–
(758
)–
–(1
16)
––
(874
)–
Tran
sfer
to/
(fro
m) r
eser
ves
3,63
11,
953
7,14
89,
708
(8,5
87)
1,09
913
,339
(6,6
34)
8,24
7
Retu
rn/(d
efic
it) p
er s
hare
1112
.98p
7.75
p28
.38p
34.6
9p(3
4.09
p)4.
36p
47.6
7p(2
6.34
p)32
.74p
30.6.10 30.6.09 31.12.09£’000 £’000 £’000
Note (unaudited) (unaudited) (audited)
Fixed assets
Investments held at fair value
Quoted at market valuation – 84 76
Unquoted at Directors’ valuation 207,023 104,227 127,128
207,023 104,311 127,204
Current assets
Debtors 23,638 17,516 25,237
Government securities 60,913 97,258 84,526
Cash 2,073 3,419 2,873
86,624 118,193 112,636
Creditors – amounts falling due within one year (1,706) (1,341) (3,796)
Net current assets 84,918 116,852 108,840
Net assets 291,941 221,163 236,044
Capital and reserves
Called up share capital 7,838 6,296 6,296
Share premium account 61,436 14,123 14,123
Capital redemption reserve 1,248 1,248 1,248
Capital reserve – realised 232,462 239,390 242,015
Capital reserve – unrealised (23,992) (50,314) (43,253)
Revenue reserve 12,949 10,420 15,615
Total equity shareholders’ funds 291,941 221,163 236,044
Net asset value per share 11 938.6p 878.1p 937.2p
Diluted net asset value per share 11 940.5p n/a n/a
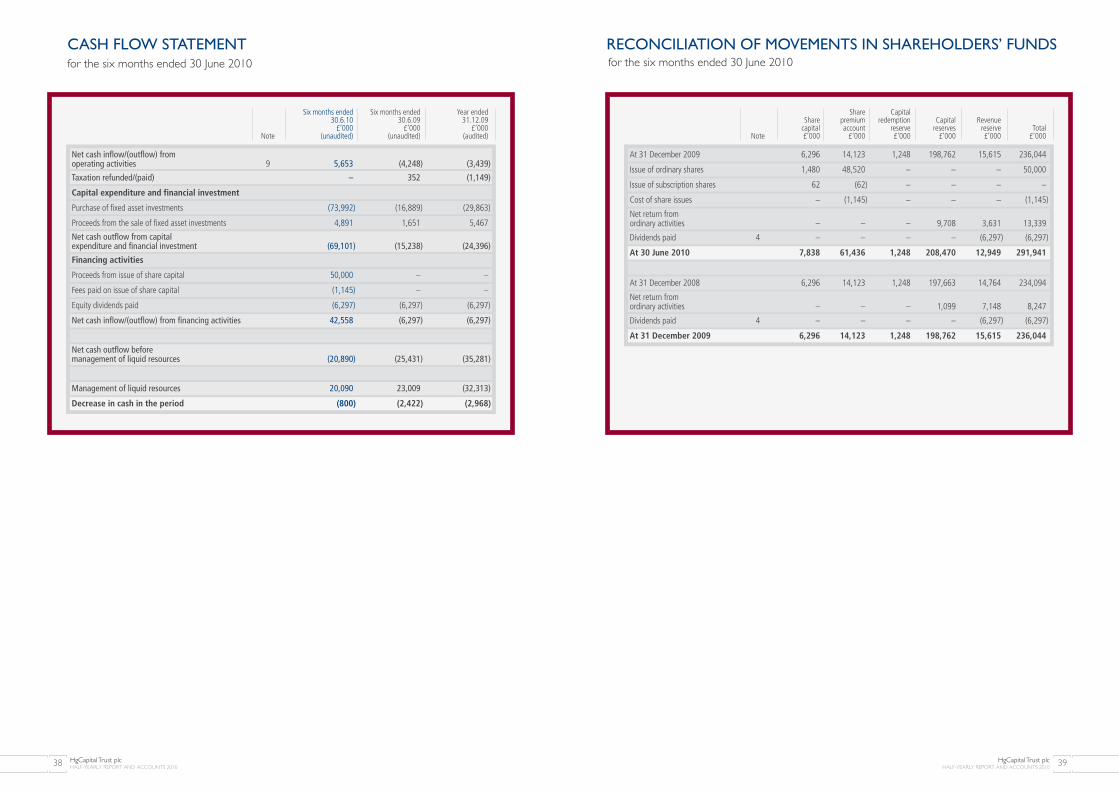
HgCapital Trust plcHALF-YEARLY REPORT AND ACCOUNTS 201038 HgCapital Trust plc
HALF-YEARLY REPORT AND ACCOUNTS 2010 39
RECONCILIATION OF MOVEMENTS IN SHAREHOLDERS’ FUNDSfor the six months ended 30 June 2010
CASH FLOW STATEMENTfor the six months ended 30 June 2010
Six months ended Six months ended Year ended30.6.10 30.6.09 31.12.09
£’000 £’000 £’000Note (unaudited) (unaudited) (audited)
Net cash inflow/(outflow) from operating activities 9 5,653 (4,248) (3,439)
Taxation refunded/(paid) – 352 (1,149)
Capital expenditure and financial investment
Purchase of fixed asset investments (73,992) (16,889) (29,863)
Proceeds from the sale of fixed asset investments 4,891 1,651 5,467
Net cash outflow from capital expenditure and financial investment (69,101) (15,238) (24,396)
Financing activities
Proceeds from issue of share capital 50,000 – –
Fees paid on issue of share capital (1,145) – –
Equity dividends paid (6,297) (6,297) (6,297)
Net cash inflow/(outflow) from financing activities 42,558 (6,297) (6,297)
Net cash outflow before management of liquid resources (20,890) (25,431) (35,281)
Management of liquid resources 20,090 23,009 (32,313)
Decrease in cash in the period (800) (2,422) (2,968)
Share CapitalShare premium redemption Capital Revenue
capital account reserve reserves reserve TotalNote £’000 £’000 £’000 £’000 £’000 £’000
At 31 December 2009 6,296 14,123 1,248 198,762 15,615 236,044
Issue of ordinary shares 1,480 48,520 – – – 50,000
Issue of subscription shares 62 (62) – – – –
Cost of share issues – (1,145) – – – (1,145)
Net return from ordinary activities – – – 9,708 3,631 13,339
Dividends paid 4 – – – – (6,297) (6,297)
At 30 June 2010 7,838 61,436 1,248 208,470 12,949 291,941
At 31 December 2008 6,296 14,123 1,248 197,663 14,764 234,094
Net return from ordinary activities – – – 1,099 7,148 8,247
Dividends paid 4 – – – – (6,297) (6,297)
At 31 December 2009 6,296 14,123 1,248 198,762 15,615 236,044

HgCapital Trust plcHALF-YEARLY REPORT AND ACCOUNTS 201040
NOTES TO THE FINANCIAL STATEMENTS
HgCapital Trust plcHALF-YEARLY REPORT AND ACCOUNTS 2010 41
1. Principal activityThe principal activity of the Company is that of an investment trust company. The Company is an investment company as defined by section833 of the Companies Act 2006 and an investment trust within the meaning of section 1158/9 of the Corporation Tax Act 2010 (“CTA”).
2. Basis of preparationThe accounts have been prepared in accordance with applicable UK law and Accounting Standards (‘GAAP’) and with the Statement ofRecommended Practice ‘Financial Statements of Investment Trust Companies’ (‘SORP’), dated January 2009. All of the Company’s operationsare of a continuing nature.
The Company has considerable financial resources and as a consequence, the Directors believe that the group is well placed to manage itsbusiness risks successfully despite the current uncertain economic outlook. After making enquiries, the Directors have a reasonableexpectation that the Company will have adequate resources to continue in operational existence for the foreseeable future. Accordingly, they continue to adopt the going concern basis in preparing the annual report and accounts.
The same accounting policies, presentation and methods of computation are followed in the condensed set of financial statements asapplied in the Company’s latest annual audited financial statements.
3. Organisational structure and Manager arrangementsPartnershipsIn May 2003 (subsequently revised in January 2009) and January 2009, the Company entered into two separate partnership agreementswith general and founder partners, at which point investment holding limited partnerships were established to carry on the business of aninvestor, with the Company being the sole limited partner in these entities.
The purpose of these partnerships, HGT LP and HGT 6 LP (together the ‘buyout funds’) is to hold all the Company’s investments in buyoutsand other investments, other than liquid funds and renewable energy projects (see below).
Under the partnership agreements, the Company made capital commitments into the buyout funds with the result that the Company nowholds direct investments in the buyout funds and an indirect investment in the fixed asset investments that are held by these funds, as it isthe sole limited partner. The fixed asset investments on the Balance Sheet and the Investment portfolio on page 33 comprise the underlyinginvestments held by these buyout funds.
The Company also entered into partnership agreements with the purpose of investing in renewable energy projects by making capitalcommitments alongside other limited partners in Hg Renewable Power Partners LP and HgCapital Renewable Power Partners 2 LP (together the ‘renewable funds’). These are direct investments in the renewable funds, as shown on the Balance Sheet and the Investmentportfolio on page 33.
Priority profit share and carried interest per the buyout limited partnership agreementsUnder the terms of the buyout fund limited partnership agreements (‘LPAs’), the general partner is entitled to appropriate, as a first chargeon the net income of the funds, an amount equivalent to its priority profit share (‘PPS’). The Company is entitled to net income from thefunds, after payment of the PPS.
In years in which these funds have not yet earned sufficient net income to satisfy the PPS, the entitlement is carried forward to the followingyears. The PPS is payable quarterly in advance, even if insufficient net income has been earned. Where the cash amount paid exceeds thenet income, an interest free loan is advanced to the general partner by these funds, which is funded via a loan from the Company. Such loan is only recoverable from the general partner by an appropriation of net income; until net income is earned, no value is attributedto this loan.
Furthermore, under the buyout LPAs, the founder partner is entitled to a carried interest distribution once certain preferred returns are met.The LPAs stipulate that the funds’ capital gains (or net income), after payment of the carried interest, are distributed to the Company.
Accordingly, the Company’s entitlement to net income and net capital gains are shown in the appropriate lines of the income statement.Notes 6, 7 and 9 to the financial statements and the cash flow statement disclose the gross income and gross capital gains of the funds(including the associated cash flows) and also reflect the proportion of net income and capital gains in the funds that have been paid tothe general partner and founder partner as its PPS and carried interest, where applicable.
The PPS paid from net income is charged to the revenue account in the income statement, whereas PPS paid as an interest-free loan, if any, is charged as an unrealised depreciation to the capital return on the income statement.
The carried interest payments made from net income and capital gains are charged to the revenue and capital account respectively on theincome statement.
4. DividendsIt is intended that dividends will be declared and paid annually in respect of each accounting period. A dividend of 25.00p per share,declared on 17 February 2010 as an interim dividend, was paid on 31 March 2010 in respect of the year ended 31 December 2009 (year ended 31 December 2008: final dividend of 25.00p per share, declared on 13 March 2009 and paid on 11 May 2009).
6. Income Six months Six months Yearended ended ended
30.6.10 30.6.09 31.12.09£’000 £’000 £’000
(unaudited) (unaudited) (audited)
Income from investments
UK and overseas unquoted investment income 5,869 3,239 6,994
UK dividends from unquoted investments 909 2 2,278
Gilt interest less amortisation (419) 374 322
6,359 3,615 9,594
Other income
Deposit interest 151 44 88
151 44 88
Total income 6,510 3,659 9,682
Priority profit share attribution (1,692) (774) (1,664)
Total net income 4,818 2,885 8,018
The Company’s issued share capital at the beginning of the year consisted of 25,186,755 ordinary shares. On 7 April 2010, 5,917,160 newordinary shares were issued as part of the placing and open offer at a price of £8.45, resulting in proceeds of £50 million being received.Subscription shares on a one for five basis were attached to these shares.
5. Issued share capital Six months ended Six months ended Year ended30.6.10 (unaudited) 30.6.09 (unaudited) 31.12.09 (audited)
No. ‘000 £’000 No. ‘000 £’000 No. ‘000 £’000
Ordinary shares of 25p each 40,000 10,000 40,000 10,000 40,000 10,000
Allotted, called up and fully paid:
Ordinary sharesAt 1 January 25,187 6,296 25,187 6,296 25,187 6,296
Issued as part of placing and open offer 5,917 1,480 – – – –
At 30 June / 31 December 31,104 7,776 25,187 6,296 25,187 6,296
On 7 April 2010, 5,037,351 subscription shares were issued as part of the qualifiying bonus issue, representing one subscription share forevery five existing ordinary shares held. A further 1,183,432 subscription shares were issued, attached to the placing and open offer,representing one subscription share for every five new ordinary shares issued.
Each subscription share entitles the holder to subscribe for one ordinary share upon exercise of their subscription right and payment of thesubscription price. The first opportunity to exercise such right will be on 31 May 2011, and thereafter on 31 October and 31 May in each yearto 2012, at a price of 950p per ordinary share. The final exercise date is on 31 May 2013 at a subscription price of 1,025p per ordinary share.
Six months ended Six months ended Year ended30.6.10 (unaudited) 30.6.09 (unaudited) 31.12.09 (audited)
No. ‘000 £’000 No. ‘000 £’000 No. ‘000 £’000
Allotted and fully paid:
Subscription shares of 1p eachIssued as part of placing and open offer 6,221 62 – – – –
At 30 June / 31 December 6,221 62 – – – –
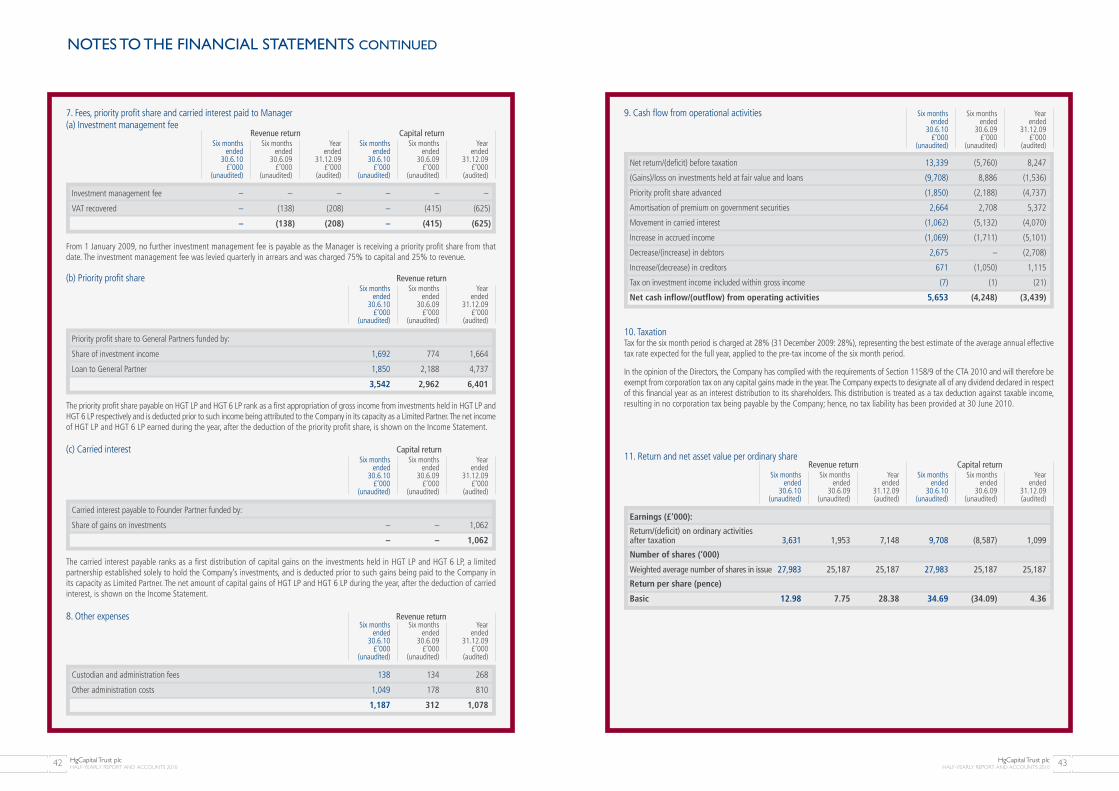
28
10. TaxationTax for the six month period is charged at 28% (31 December 2009: 28%), representing the best estimate of the average annual effectivetax rate expected for the full year, applied to the pre-tax income of the six month period.
In the opinion of the Directors, the Company has complied with the requirements of Section 1158/9 of the CTA 2010 and will therefore beexempt from corporation tax on any capital gains made in the year. The Company expects to designate all of any dividend declared in respectof this financial year as an interest distribution to its shareholders. This distribution is treated as a tax deduction against taxable income,resulting in no corporation tax being payable by the Company; hence, no tax liability has been provided at 30 June 2010.
NOTES TO THE FINANCIAL STATEMENTS CONTINUED
HgCapital Trust plcHALF-YEARLY REPORT AND ACCOUNTS 201042 HgCapital Trust plc
HALF-YEARLY REPORT AND ACCOUNTS 2010 43
The carried interest payable ranks as a first distribution of capital gains on the investments held in HGT LP and HGT 6 LP, a limitedpartnership established solely to hold the Company’s investments, and is deducted prior to such gains being paid to the Company inits capacity as Limited Partner. The net amount of capital gains of HGT LP and HGT 6 LP during the year, after the deduction of carriedinterest, is shown on the Income Statement.
11. Return and net asset value per ordinary shareRevenue return Capital return
Six months Six months Year Six months Six months Yearended ended ended ended ended ended
30.6.10 30.6.09 31.12.09 30.6.10 30.6.09 31.12.09(unaudited) (unaudited) (audited) (unaudited) (unaudited) (audited)
Earnings (£‘000):
Return/(deficit) on ordinary activities after taxation 3,631 1,953 7,148 9,708 (8,587) 1,099
Number of shares (‘000)
Weighted average number of shares in issue 27,983 25,187 25,187 27,983 25,187 25,187
Return per share (pence)
Basic 12.98 7.75 28.38 34.69 (34.09) 4.36
9. Cash flow from operational activities Six months Six months Yearended ended ended
30.6.10 30.6.09 31.12.09£’000 £’000 £’000
(unaudited) (unaudited) (audited)
Net return/(deficit) before taxation 13,339 (5,760) 8,247
(Gains)/loss on investments held at fair value and loans (9,708) 8,886 (1,536)
Priority profit share advanced (1,850) (2,188) (4,737)
Amortisation of premium on government securities 2,664 2,708 5,372
Movement in carried interest (1,062) (5,132) (4,070)
Increase in accrued income (1,069) (1,711) (5,101)
Decrease/(increase) in debtors 2,675 – (2,708)
Increase/(decrease) in creditors 671 (1,050) 1,115
Tax on investment income included within gross income (7) (1) (21)
Net cash inflow/(outflow) from operating activities 5,653 (4,248) (3,439)
(c) Carried interest Capital returnSix months Six months Year
ended ended ended30.6.10 30.6.09 31.12.09
£’000 £’000 £’000(unaudited) (unaudited) (audited)
Carried interest payable to Founder Partner funded by:
Share of gains on investments – – 1,062
– – 1,062
8. Other expenses Revenue returnSix months Six months Year
ended ended ended30.6.10 30.6.09 31.12.09
£’000 £’000 £’000(unaudited) (unaudited) (audited)
Custodian and administration fees 138 134 268
Other administration costs 1,049 178 810
1,187 312 1,078
From 1 January 2009, no further investment management fee is payable as the Manager is receiving a priority profit share from thatdate. The investment management fee was levied quarterly in arrears and was charged 75% to capital and 25% to revenue.
The priority profit share payable on HGT LP and HGT 6 LP rank as a first appropriation of gross income from investments held in HGT LP andHGT 6 LP respectively and is deducted prior to such income being attributed to the Company in its capacity as a Limited Partner. The net incomeof HGT LP and HGT 6 LP earned during the year, after the deduction of the priority profit share, is shown on the Income Statement.
(b) Priority profit share Revenue returnSix months Six months Year
ended ended ended30.6.10 30.6.09 31.12.09
£’000 £’000 £’000(unaudited) (unaudited) (audited)
Priority profit share to General Partners funded by:
Share of investment income 1,692 774 1,664
Loan to General Partner 1,850 2,188 4,737
3,542 2,962 6,401
7. Fees, priority profit share and carried interest paid to Manager(a) Investment management fee
Revenue return Capital returnSix months Six months Year Six months Six months Year
ended ended ended ended ended ended30.6.10 30.6.09 31.12.09 30.6.10 30.6.09 31.12.09
£’000 £’000 £’000 £’000 £’000 £’000(unaudited) (unaudited) (audited) (unaudited) (unaudited) (audited)
Investment management fee – – – – – –
VAT recovered – (138) (208) – (415) (625)
– (138) (208) – (415) (625)

MANAGEMENT AND ADMINISTRATION
Board of Directors
Roger Mountford (Chairman)Peter Gale (Deputy Chairman)Richard Brooman (Chairman of the Audit andValuation Committee)Piers BrookeAndrew MurisonMark Powell (appointed 27 July 2010)Tim Amies (retired 10 May 2010)
HgCapital Trust plc
2 More London Riverside London SE1 2APwww.hgcapitaltrust.com
Registered office
(Registered in England No. 1525583) 2 More London Riverside London SE1 2AP
Manager, secretary and administrator
HgCapital*†
2 More London Riverside London SE1 2APTelephone: 020 7089 7888 www.hgcapital.com
Stockbroker
RBS Hoare Govett Limited* 250 BishopsgateLondon EC2M 4AA
Independent auditor
Deloitte LLP2 New Street SquareLondon EC4A 3BZ
Legal adviser
Herbert Smith LLPExchange HousePrimrose StreetLondonEC2A 2HS
Registrar
Computershare Investor Services plc*The PavilionsBridgwater RoadBristol BS99 6ZYTelephone: 0870 702 0131www-uk.computershare.com/investor
AIC
Association of Investment Companieswww.theaic.co.uk
HgCapital Trust is a member of the Association ofInvestment Companies. The AIC is the trade bodyfor the closed-ended investment company industry.It represents a broad range of closed-endedinvestment companies, including investment trusts,offshore closed-ended investment companies andventure capital trusts (VCTs). Its mission is to helpmembers add value for shareholders over thelonger term.
LPEQ
Listed Private Equitywww.lpeq.com
HgCapital Trust is a founder member of ListedPrivate Equity (LPEQ). This is a group of privateequity investment trusts and similar vehicles listedon the London Stock Exchange and other majorEuropean stock markets, formed to raise awarenessand increase understanding of what listed privateequity is and how it enables all investors – not justlarge institutions – to invest in private equity.
LPEQ provides information on private equity ingeneral, and the listed sector in particular,undertaking and publishing research, and working toimprove levels of knowledge about the asset classamong investors and their advisers.
HgCapital Trust plcHALF-YEARLY REPORT AND ACCOUNTS 2010 45HgCapital Trust plc
HALF-YEARLY REPORT AND ACCOUNTS 201044
*Authorised and regulated by the Financial Services Authority.† HgCapital is the trading name of Hg Pooled Management Limited
12. Capital commitmentsThe Company has committed through HGT 6 LP to invest £285 million alongside the Manager’s latest buyout fund, HgCapital 6. The Company has agreed to pay fees on its commitment, whereas management fees were previously based on its NAV. The Company willbe entitled, without penalty, to opt out of any investment which could cause the Company to lose its status as an investment trust, resultin the Company not having the cash resources to meet any of its projected liabilities or expenses, or result in it not being able to paydividends or undertake any intended share buy-back. At 30 June 2010, £198,951,000 of this commitment was uncalled.
The Company has also committed through HGT LP to invest £120 million alongside the Manager’s previous buyout fund, HgCapital 5. At 30 June 2010, £20,464,000 of this commitment was uncalled.
On 28 May 2010, the Company committed to invest up to €40 million as a limited partner in HgCapital Renewable Power Partners 2 LP.The Company’s total commitment will become available when all commitments by limited partners reach €200 million. Until that level ofcommitment is reached, the Company’s contribution to capital called up from Limited Partners is limited to 25% of the total commitments.At 30 June 2010, the Company committed €13 million to the Fund of which €11,735,000 was uncalled. In addition the Company isallowed, without penalty, to be excused by the Manager of the Fund from any investment which could cause the Company to lose itsstatus as an investment trust.
As at 30 June 2010, investment purchases of £1,771,000 (31 December 2009: £5,557,000) had been authorised and contractuallycommitted, including the uncalled commitment to Hg Renewable Power Partners LP but excluding any uncalled commitment in any of theabove partnerships. In addition, the Company’s derivative financial instruments held through HGT LP expire on 29 August 2012. In orderto meet any potential liability arising on this date, an amount of £6,260,000 million has been reserved for this purpose. This amount istherefore callable from the Company at this or any earlier date.
13. Publication of non-statutory accountsThe financial information contained in this half-yearly financial report does not constitute statutory accounts as defined in Section 435 ofthe Companies Act 2006. The financial information for the six months ended 30 June 2010 and 2009 has not been audited. The financialinformation for the six months ended 30 June 2009 was reviewed by the Company’s auditor. The information for the year ended 31 December 2009 has been extracted from the latest published audited financial statements, which have been filed with the Registrar ofCompanies. The report of the auditors on those accounts contained no qualification or statement under section 498 (2) or (3) of theCompanies Act 2006.
14. Annual resultsThe Board expects to announce the results for the year ending 31 December 2010 in March 2011. The Annual report should be availableby the end of March 2011, with the Annual General Meeting being held in May 2011.
NOTES TO THE FINANCIAL STATEMENTS CONTINUED
Six months Six months Yearended ended ended
30.6.10 30.6.09 31.12.09(unaudited) (unaudited) (audited)
Net asset value (£'000)
Net assets 291,941 221,163 236,044
Assuming exercise of all subscription shares (at minimum price) 59,097 – –
Fully diluted net asset value 351,038 221,163 236,044
Number of shares (‘000)
Number of shares in issue 31,104 25,187 25,187
Dilutive potential subscription shares 6,221 – –
Diluted shares 37,325 25,187 25,187
Net asset value per share (pence)
Basic 938.6 878.1 937.2
Diluted 940.5 n/a n/a
The diluted net asset value per share is currently higher than the basic net asset value as the minimum excercise price of the subscriptionshares is 950 pence, whereas the current net asset value per share is 938.6 pence.