hgs investor - high growth stock...hgs investor software users guide revisions: this document is...
TRANSCRIPT

HGS Investor Software Users Guide
REVISIONS: This document is periodically updated to keep it in resalable alignment with the HGS Investor software. The procedures are correct but the images and data samples may be different.

HGS Investor Software User Guide
REVISIONS: This document is periodically updated to keep it in resalable alignment with the HGS Investor software. The procedures are correct but the images and data samples may be different.
Industry Monitors HGS Investor Software
PO Box 760 Sumner, WA 98390

Table of Content ABOUT THIS GUIDE ................................................................................................................................................ 4
KEEPING IN TOUCH ................................................................................................................................................ 4 TECHNICAL SUPPORT .................................................................................................................................................. 4 CHANGING YOUR E-MAIL ADDRESS............................................................................................................................ 4
INTRODUCTION ....................................................................................................................................................... 5 HGS INVESTOR SOFTWARE ......................................................................................................................................... 5 FEATURES ................................................................................................................................................................... 5
The Housekeeping Features .................................................................................................................................... 5 Managing Lists with the Designer ........................................................................................................................... 5 The Productivity Features ....................................................................................................................................... 5
HINTS AND HELP ..................................................................................................................................................... 7 RULES OF THUMB ........................................................................................................................................................ 7 COLOR CODING ........................................................................................................................................................... 7 GLOSSARY................................................................................................................................................................... 7 DATA ITEMS AND CHART INDICATORS ........................................................................................................................ 7 INFORMATION AND HELP SYSTEM ............................................................................................................................... 8
STEPS TO PRODUCTIVITY .................................................................................................................................... 9 DOING YOUR HOUSEKEEPING ..................................................................................................................................... 9 ANALYZING THE DATA ............................................................................................................................................... 9
SETTING PREFERENCES ..................................................................................................................................... 10 KEEPING THE HGS TOOLBAR VISIBLE ...................................................................................................................... 10 MANAGING YOUR ACCOUNT AND PASSWORD .......................................................................................................... 11 SETTING GLOBAL INDEX OPTIONS ............................................................................................................................ 12
MANAGING UPDATES........................................................................................................................................... 13 UPDATING THE HGS INVESTOR DATABASES............................................................................................................. 13
HGS INVESTOR RAPID TUTORIAL ................................................................................................................... 14 LEARNING TO USE HGS INVESTOR ............................................................................................................................ 14 TOUR #1: HOW’S THE MARKET? ............................................................................................................................... 14 TOUR #2: TOP DOWN INVESTING .............................................................................................................................. 18 TOUR #3: BOTTOM UP INVESTING ............................................................................................................................. 23 TOUR #4: MIX AND MATCH INDEX COMPARISONS .................................................................................................... 24
BUILDING GROUPS WITH THE DESIGNER .................................................................................................... 25 UNDERSTANDING THE DESIGNER DATA .................................................................................................................... 25 WORKING WITH USER GROUPS ................................................................................................................................. 25
Creating A User Group ......................................................................................................................................... 26 Editing A User Group............................................................................................................................................ 31 Building Groups on the Fly ................................................................................................................................... 33 Generating Indexes for User Groups .................................................................................................................... 33
WORKING WITH THE WAREHOUSE ................................................................................................................ 35 A QUICK LOOK AT THE WAREHOUSE ........................................................................................................................ 35 CUSTOMIZING WAREHOUSE VIEWS........................................................................................................................... 38 OTHER WAYS TO VIEW WAREHOUSE DATA ............................................................................................................. 42

Sorting the List ...................................................................................................................................................... 42 Viewing the Industry Group .................................................................................................................................. 42 Opening an Index in Another Module ................................................................................................................... 42
USING COMBINATION RANKINGS TO LOCATE CANDIDATES...................................................................................... 43 WORKING WITH FILTERS .................................................................................................................................. 46
UNDERSTANDING FILTERS ........................................................................................................................................ 46 CREATING FILTERS.................................................................................................................................................... 47 ATTACHING A FILTER TO A VIEW .............................................................................................................................. 49 SHARING FILTERS WITH OTHER USERS ..................................................................................................................... 51
Exporting Filters ................................................................................................................................................... 51 Importing Filters ................................................................................................................................................... 52
FILTER EXAMPLES..................................................................................................................................................... 52 Low Debt, High Yield Filter .................................................................................................................................. 52 The High EPS Breakout Filter .............................................................................................................................. 52 Increasing Volume Filter....................................................................................................................................... 53 Basic Earnings and Growth Filter ........................................................................................................................ 53
WORKING WITH RANKINGS .............................................................................................................................. 54 UNDERSTANDING THE RANKING PROCESS ................................................................................................................ 54
Interactivity Between Ranking and Warehouse ..................................................................................................... 54 Tiling the Warehouse/Ranking Screens ................................................................................................................. 55
VIEWS AVAILABLE IN RANKING................................................................................................................................ 56 USING OPTIONS TO CUSTOMIZE THE VIEW ................................................................................................................ 56
WORKING WITH CHARTS ................................................................................................................................... 59 THE PURPOSE OF CHARTING WINDOWS .................................................................................................................... 59 VIEWING CHARTS...................................................................................................................................................... 59 USING THE FIND FUNCTION ....................................................................................................................................... 59 EDITING THE CURRENT VIEW .................................................................................................................................... 60 CREATING A NEW CHARTING VIEW .......................................................................................................................... 66 VIEWING THE DATA WINDOW ................................................................................................................................... 67 VIEWING THE FUNDAMENTAL DATA WINDOW ......................................................................................................... 67 ZOOMING IN AND OUT .............................................................................................................................................. 69 USING ANNOTATION TOOLS ...................................................................................................................................... 69 CHANGING MODE FROM DAILY TO WEEKLY, ETC. ................................................................................................... 70
SHARING AND PRINTING DATA ........................................................................................................................ 71 IMPORTING DATA FROM OTHER PROGRAMS ............................................................................................................. 71 EXPORTING DATA TO OTHER PROGRAMS.................................................................................................................. 75 COPYING STOCK SYMBOLS DIRECTLY INTO OTHER PROGRAMS ............................................................................... 77 ADDING SECURITIES TO QUOTE TRACKER ................................................................................................................ 78 SAVING LISTS, VIEWS AND GROUP RANKINGS TO FILES ........................................................................................... 79 PRINTING AND SAVING SNAPSHOTS .......................................................................................................................... 80 DISPLAYING AND PRINTING REPORTS ....................................................................................................................... 80
APPENDIX A: GLOSSARY OF STOCK TERMINOLOGY ............................................................................... 81
APPENDIX B: HGS INVESTOR DATA ................................................................................................................ 83
APPENDIX C: HGS CHART INDICATORS ........................................................................................................ 88

H G S I n v e s t o r S o f t w a r e U s e r G u i d e
© Copyright 2003-2011 Industry Monitors Page 4 of 89
About this Guide This guide is intended to give you a thorough reference in the use of the HGS Investor software. Most new users are eager to become productive with the software, wishing to leave the reference material for later use. If you would like a quick getting started tour, please refer to the section of this guide titled HGS Investor Rapid Tutorial.
Keeping in Touch
Technical Support All technical support for the HGS Investor software is done via email. We monitor our email during evening hours, weekends and holidays. For software questions contact: [email protected]
Changing Your E-mail Address Your email address serves as your HGS Investor Member ID for access to the HGS Investor website. It also allows us to communicate with you regarding updates and the status of your membership. To change your e-mail address, use your old e-mail address to log on and update your member information at: www.highgrowthstock.com/MemberArea

H G S I n v e s t o r S o f t w a r e U s e r G u i d e
© Copyright 2003-2011 Industry Monitors Page 5 of 89
Introduction
HGS Investor Software The HGS Investor software from Industry Monitors offers a collection of seamlessly interactive tools designed to simplify the process of selecting candidate stocks to buy and sell. The HGS Investor software simplifies the process of finding the What, Which, When Why and So What that feed your decision-making efforts. Its goal is to create an intelligent user faster.
The HGS Investor software adapts to all investment styles and offers its own focused style integrating the best of many styles. It balances Value Investing, focusing on Fundamental Analysis with Momentum Investing focusing on Technical Analysis to offer a variety of styles that use the best of both.
Features
The Housekeeping Features
“Preferences” maintains your account information and enables you to set your Global Index options, including the Index Type, which filter to apply, if any, and the start date for indexing.
“Update” initiates an update of the HGS Investor database. You may elect to run these updates manually or schedule them to run automatically at a selected time.
Managing Lists with the Designer
The Designer contains all the groups that are part of the database (Group Database)
There are 3 categories of groups: HGS Reference Groups: The folder names identify the type of components contained in
each group. The components within the group are determined by HGS Investor personnel and cannot be modified. You can drag a copy into your own User Groups folder where they can be modified.
SmartGroups: The folder names identify the type of components contained in each SmartGroup. The components within the SmartGroups are determined automatically by a filter after every daily data Update. The filters were created by HGS Investor personnel. The filters generating the SmartGroup cannot be modified in the Designer. You can drag a copy of the components in the SmartGroups into your own User Groups folder where they can be modified.
User Groups: This grouping allows you to create, modify and experiment without altering the HGS Reference groups. The User Groups item is empty when you first install the software.
The Productivity Features
Warehouse, Ranking and Charting are the productivity features within which you perform most of your analysis work. They help you to decide what stocks, groups and industries are the current best performers, which are the strongest, and finally when you should invest.

H G S I n v e s t o r S o f t w a r e U s e r G u i d e
© Copyright 2003-2011 Industry Monitors Page 6 of 89
The “Warehouse” enables you to set your own criteria to determine what stocks, groups or indexes are the best performers. By creating filters based upon your own criteria, you use the Warehouse as a spreadsheet to display potential winners from any of the groups in the Group Database. “Ranking” indicates where the money is flowing by measuring the internal relative strength of an index or security and computing its rank among similar securities or indexes. Using color-coding, it visually identifies group and sector rotation.
Once you identify what to buy, “Charting” helps you decide when to buy. Charts indicate the “attitude” of traders toward the stock and group using MACD Indicator, Candle Charting, Group Strength, Revenue, Earnings Per Share and other important indicators.

H G S I n v e s t o r S o f t w a r e U s e r G u i d e
© Copyright 2003-2011 Industry Monitors Page 7 of 89
Hints and Help
Rules of Thumb When in doubt, try the right mouse click menu. When you start the HGS Investor software, the system can remember what you were doing
when it closed. It re-displays the individual components as they were when the system was closed.
Color Coding In keeping with the Simplicity Principle, HGS Investor software offers color-coding in Green, Yellow and Red to give immediate visual impact to the statistics listed. Green implies strength Yellow is neutral Red signifies weakness
The color-coding also reflects the 80:20 Rule Green represents the top 20% (80-99%) Yellow is the next 20% (60-79%) Red indicates the bottom 60% (0-59%)
Glossary
A glossary of terminology used by this guide and the HGS Investor software is located in Appendix A at the end of this guide.
Data Items and Chart Indicators Lists of Data Items and Chart Indicators appear in Appendix B and Appendix C of this guide.

H G S I n v e s t o r S o f t w a r e U s e r G u i d e
© Copyright 2003-2011 Industry Monitors Page 8 of 89
Information and Help System HGS Investor offers a detailed help system installed with your software. You can display the Help menu from the Help icon on the main HGS Investor toolbar.
Help displays the Help System “Getting Started” Menu (See below image) Learning Center links you to the website page for video and other help items. Fast Facts lists the date of your last update and the number of securities and groups updated. About gives you the software version number, licensing information and your membership’s
expiration date. Various convenience links such as: HGS Website, HGS Bulletin Board and HGS
Member Services open a browser window that displays the site requested.

H G S I n v e s t o r S o f t w a r e U s e r G u i d e
© Copyright 2003-2011 Industry Monitors Page 9 of 89
Steps to Productivity The following steps will start you using the software simply and quickly. After you complete these steps, you can further customize the software to your own needs or use it as is. Each of these steps is discussed in detail in the sections of this guide that follow the tutorial. Each item listed below tells you which sections to look at. This section assumes that you have successfully installed the software.
Doing Your Housekeeping Before you can begin using the software, you must know how to set up your system preferences and manage updates. These procedures involve:
1. Setting up Preferences (See Setting Preferences)
2. Managing Updates (See Managing Updates)
3. Printing and Sharing Files (See Sharing and Printing Data)
Analyzing the Data Once you have your system set up and the database updated, use the following steps to analyze your data:
1. Use the Designer to set up one or more User Groups. These groups can be empty shells if you cannot yet think of any securities or indexes you want to track. (See Building Groups with the Designer.)
2. In the Warehouse, create filters and views to narrow the choices. (See Working With Filters and Customizing the View under Working with the Warehouse)
3. Working with both Warehouse and Ranking, create a list of securities that best meet your performance criteria. (See Working with the Warehouse and Working with Rankings)
4. Using Charting, view the charts of each of your listed securities. When a promising chart appears, use the Quick Add to Group option in the right-click menu to add the security listing to the group you created. (See Working with Charts and Building Groups on the Fly under Building Groups with the Designer)

H G S I n v e s t o r S o f t w a r e U s e r G u i d e
© Copyright 2003-2011 Industry Monitors Page 10 of 89
Setting Preferences Information must be set up properly in Preferences before you can successfully use the system. The HGS Account Information and Global Index Options contain information that is required to get into the website for updating your data and which determines how the information is filtered and indexed when it is downloaded.
Keeping the HGS Toolbar Visible
The Always on Top option makes the HGS Investor software more convenient to use by keeping the main tool bar constantly visible on your computer screen until you close it, minimize it or un-check the Always on Top option. When you open another program, the HGS Investor software toolbar floats above the other program’s screen so that you may access it at any time. Note that you can move the toolbar by clicking on the title bar and dragging the toolbar to a different location.
The Always on Top option, when enabled, also keeps the Update, Preferences and Information screens on top of any other open programs. The Designer, Charting, Ranking and Warehouse are not affected.
To select the Always on Top option:
1. Click the Preferences icon on the main HGS Investor toolbar.
2. Click the Always On Top option. A check mark should appear by the option.
3. To disable this option, click Always on Top to remove the check.

H G S I n v e s t o r S o f t w a r e U s e r G u i d e
© Copyright 2003-2011 Industry Monitors Page 11 of 89
Managing Your Account and Password The HGS Investor software uses the Member ID (your e-mail address) and Password appearing on the High Growth Stock Member Information window to identify you when you access its website for information, account management or downloads. Unless this information is correct, you will be unable to use the software.
To verify your Member ID:
1. Click the Preferences icon on the main HGS Investor tool bar.
2. Click HGS Account Info…
3. Verify that your Member ID is your current e-mail address.
4. Click OK.
If your e-mail address has changed, click the HGS Website button to report your new Member ID and register for a new password.

H G S I n v e s t o r S o f t w a r e U s e r G u i d e
© Copyright 2003-2011 Industry Monitors Page 12 of 89
Setting Global Index Options The information in the Global Index Options window is used every time you perform an Update to download stock data. The Designer module also uses these settings whenever you elect to build an index. As you will see when you become more familiar HGS Investor, Indexing is a powerful feature of the software.
The settings in the Global Index Options window allow users to customize HGS Investor to their own needs and preferences. Note: Before setting these options, make sure that the system date on your computer is set to today’s date. To set Global Index Options:
1. Click the Preferences icon on the main HGS Investor tool bar.
2. Click Global Index Options…
3. Verify that the Index Type, Index Start Date and Indexing Filter are set according to your preferences. For further details regarding Index Types, see Generating Indexes for User Groups, later in this document. For further details regarding Filters, see Working with Filters, later in this document. The Index Start Date should allow for at least 26 weeks’ of data.
4. Click OK.
H G S I n v e s t o r S o f t w a r e U s e r G u i d e
© Copyright 2003-2011 Industry Monitors Page 13 of 89
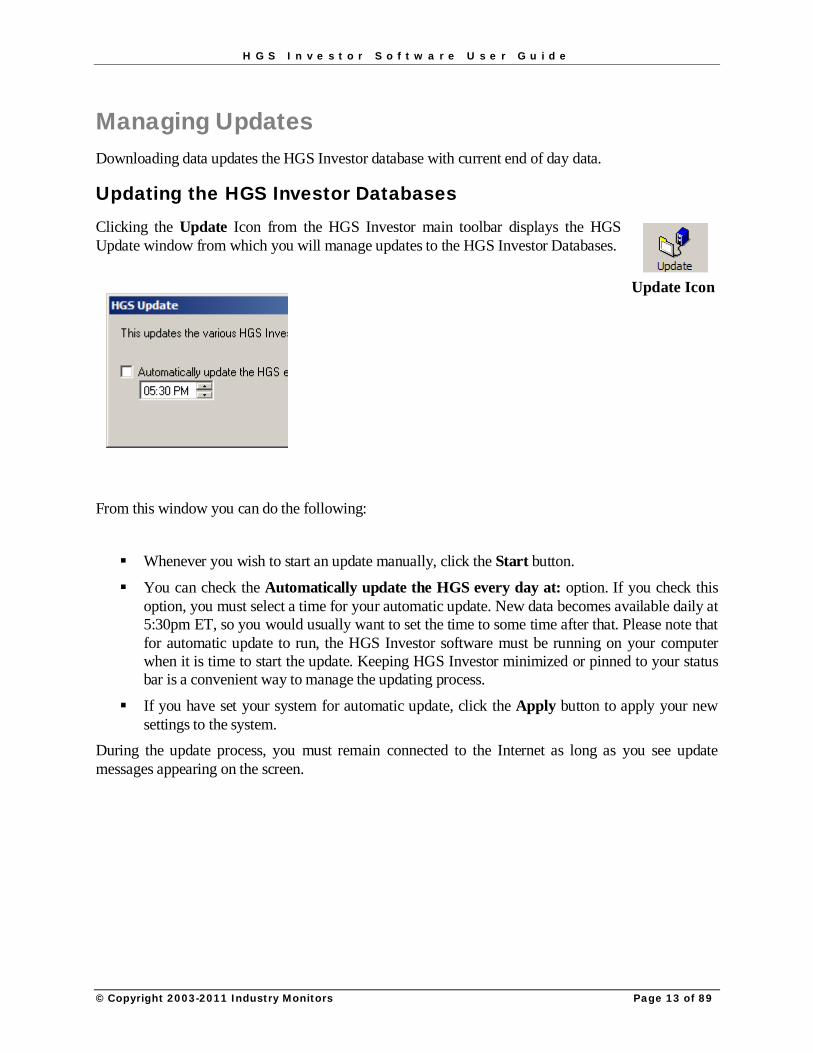
Managing Updates Downloading data updates the HGS Investor database with current end of day data.
Updating the HGS Investor Databases Clicking the Update Icon from the HGS Investor main toolbar displays the HGS Update window from which you will manage updates to the HGS Investor Databases.
From this window you can do the following:
Whenever you wish to start an update manually, click the Start button.
You can check the Automatically update the HGS every day at: option. If you check this option, you must select a time for your automatic update. New data becomes available daily at 5:30pm ET, so you would usually want to set the time to some time after that. Please note that for automatic update to run, the HGS Investor software must be running on your computer when it is time to start the update. Keeping HGS Investor minimized or pinned to your status bar is a convenient way to manage the updating process.
If you have set your system for automatic update, click the Apply button to apply your new settings to the system.
During the update process, you must remain connected to the Internet as long as you see update messages appearing on the screen.
Update Icon

H G S I n v e s t o r S o f t w a r e U s e r G u i d e
© Copyright 2003-2011 Industry Monitors Page 14 of 89
HGS Investor Rapid Tutorial
Learning to use HGS Investor If you read any part of this guide, read this. The next few pages will acquaint you with the features and interactivity native to the HGS Investor software and teach you enough to get started with your own analyses. After you complete this tour, you will be familiar enough with the software to begin creating your own methods for using HGS Investor to analyze the market.
This tour assumes that you have installed the HGS Investor software, set up your preferences and performed an update to download the stock data as described earlier in this guide. Tour #1 is a simple exercise using the Major Market Indexes and introducing you to the
Designer, Warehouse and Ranking.
Tour #2 is a more advanced exercise using industry groups and including a detailed tour of the Charting function. This tour introduces the Top-Down investing style.
Tour #3 is a quick exercise employing the All Securities group, demonstrating filters and introducing the Bottom-Up style of investing.
Tour #4 shows how to compare unlike indexes by placing them in a single group.
Tour #1: How’s the Market? 1. Open the HGS Investor software.
2. Click the Designer Icon.
3. Click HGS Reference Groups, under the Group Database folder.
4. Click Major Market Indexes. A listing of the most often used Major Market Indexes appears in the right window of the Designer screen. Examples of these components are the Dow, the NASDAQ and the S&P 500.
5. Highlight one of these indexes. Moving Between Program Components
6. On the Designer toolbar, click the Ranking icon. The Ranking screen appears. The index you highlighted in the Designer should also be highlighted in Ranking.

H G S I n v e s t o r S o f t w a r e U s e r G u i d e
© Copyright 2003-2011 Industry Monitors Page 15 of 89
Viewing Performance over Time 7. Which of the Major Market Indexes are relatively strong over long periods of time? The
Ranking screen displays weekly historical columns with the most recent week displayed first. The spreadsheet-style headers identify the week for which the data in that column is presented. In the drop down list labeled View, select Raw RS.
8. To see how you can control the number of weeks that appear, click Tools and select Options (or click the hand pointing to a card on the toolbar.) The HGS Ranking Options window appears.
9. The drop-down list under Number of Periods to Load allows you to select the number of months or years for which data is displayed in the Ranking column headers. Options range from one month to two years. If you select one or two months, all
columns will be visible on the Ranking screen. If you select two years, when viewing the Ranking screen you must scroll horizontally to see the earlier weeks.
The date boxes below the drop down list have meaning only if you select the Custom option, in which case you can designate the From and To dates for which you wish performance data displayed (good for historical studies.)
Ian Slow comes closest to the Investors Business Daily formula. For more information regarding the Options, see Using Options to Customize the View under Working with Rankings, later in this guide. For now, you may wish to select an option at random or click the Cancel button.
10. Click the Tools menu and select the last option: Tile Ranking and Warehouse Horizontally. (This option is also available from the Warehouse Tools menu.) Now both Warehouse and Ranking share the screen. This feature is useful because the Ranking and Warehouse evaluate data in different ways. The purpose of the Ranking is to view a variety of trends over time. Ranking uses one criterion over several weeks to evaluate stock, group or index performance, while the Warehouse uses several different criteria over a single week.
See Another View of Stock Performance 11. The Warehouse now displays the most often used Major Market Indexes in a spreadsheet style
format. The Scorecard view is likely displayed, as indicated in the drop-down list labeled View. If so strong indexes appear in green, weak in red, and neutral in yellow. This is true of many of the views available from this drop-down list.
Filter out Some Candidates 12. On the Warehouse toolbar, click the Filter icon. The HGS Filter window appears. The
Indexing Filter is probably selected.
13. Click one of the filters listed under Select Filter to Apply.
14. Click OK. Depending upon the filter you selected, the number of items in the list of indexes may decrease or disappear altogether. If so, few or none of the items in the list met the criteria set up in the filter. Filters are important tools for scanning through the database. You will use filters to weed out all but the stocks that are most important to you. Select the Indexing Filter and click OK. Items in the list should return to the screen.

H G S I n v e s t o r S o f t w a r e U s e r G u i d e
© Copyright 2003-2011 Industry Monitors Page 16 of 89
Determine the Market’s Recent Performance The next two sections of the tutorial will work only on Sunday, assuming that you have done weekend (Friday/ Saturday) updates. It probably will not work in the middle of the week, onWednesday, for example.
15. On the Warehouse screen, click the drop-down list next to the label View.
16. Select the % Price Change view. Note that the column headings change and the red, yellow and green colors disappear.
17. Click the % Pr Ch 1-Dy header. This shows how the market was doing the last business day. The listing of the best performer rises to the top.
18. Click the headers for the percent price change for 5 and 15 days. Note the variation in the best performers.
19. Highlight an entry.
20. Click each of the column headers and notice how the entry rises and falls. Check the Ranking and Warehouse Together
21. The Ranking screen should be visible on the screen. If not, select Tile Ranking and Warehouse Horizontally from the Warehouse Tools menu.
22. Select Options from the Ranking Tools menu. On the HGS Ranking Options window. Under Relative Strength Type, make sure that the last option, Percent Change, is selected. Enter the number of weeks as 1.
23. In the Warehouse, with the % Price Change view selected, click the %Pr Ch 5-Dy header. Since you have 1 week selected for the Percent Change in Ranking and 5 (business) days is the equivalent of one week, the Ranking and Warehouse screens should now display the list of indexes in the same order. Experiment with other time periods. The %Pr Ch 15-Day column header would synchronize with Ranking if 3 weeks was selected on the HGS Ranking Options screen. In the same manner, the %Pr Ch 21-Day column header would synchronize with 4 weeks.
24. Now set the Percent Change option on the HGS Ranking Options screen to 6 weeks. This is the number that is most commonly used.

H G S I n v e s t o r S o f t w a r e U s e r G u i d e
© Copyright 2003-2011 Industry Monitors Page 17 of 89
View Trends and Sector Rotation in Ranking 25. Click the headers from left to right on the Ranking screen. Notice how some entries rise and
fall as you click these headers. Ranking shows trends. The views therein can contain fundamental and technical data.
If an index was on the bottom one week in the Warehouse and one week in Ranking it appears on top, the rise may signal a trend or indicate a volatile market, dependent upon the consistency shown from one week to the next. This information is especially important to the investor who is interested in sector rotation. Sector rotation tracks where the relative strength of the market is located. Trends can also be seen by the colors shown, such as a trend of green, red and/or yellow across a line. Stocks with solid green across the top are especially important. Color can show movement. For example, stocks moving from yellow to red are moving down; those moving from red to yellow are moving up.

H G S I n v e s t o r S o f t w a r e U s e r G u i d e
© Copyright 2003-2011 Industry Monitors Page 18 of 89
Tour #2: Top Down Investing The Top-Down investing style moves from Markets to Sectors to Industry Groups to Stocks in the search for strongest stocks in the strongest industry groups.
1. Open the HGS Investor software.
2. Click the Designer Icon.
3. Click HGS Reference Groups, under the Group Database folder.
4. Click Industries & Sectors then click Industries. A listing of the industry groups appears in the right window of the Designer screen.
5. On the Designer toolbar, click the Ranking icon. Try another Ranking
6. Ranking is important because of the multiple ways that you can rank. To see how you can control the type of ranking used, click Tools and select Options (or click the hand pointing to a card on the toolbar.) The HGS Ranking Options window appears.
7. Under Relative Strength Type click to select Ian Slow. (For more details see, Using Options to Customize the View, later in this guide.)
8. Highlight an index that you feel is particularly strong.
9. Select Tile Ranking and Warehouse Horizontally from the Tools menu. In the Warehouse, scroll to locate the highlighted index. Does it still look strong in the short term? Keep highlighting indexes, viewing them in both Warehouse and Ranking until you find one that is strong in both. (You should now see the advantage of tiling these two screens.)
10. Right click a strong index and select Change to Index Group. Now the list displays the index’s component stocks that meet the criteria for the filter you have selected. (If too few items appear (or the list is blank) click the Filter Icon and select No Filter.)
11. Right click again and select the Back option. The Industries reappear. Check the Chart
12. Click the Charting icon from either the Warehouse or Ranking toolbar.
13. Click the box in the lower right corner of the chart. The box may be labeled Daily, Weekly, Monthly, Quarterly or Yearly. Change the selection to see what effect the change has on the chart.
14. Right-click your mouse and select Chart Mode. The same options appear. Select another mode.
15. Now hold down the Alt key and type a D. The chart should now display the Daily mode. You can switch to any other mode using the Alt key plus the first letter of the mode: W, M, Q, or Y.

H G S I n v e s t o r S o f t w a r e U s e r G u i d e
© Copyright 2003-2011 Industry Monitors Page 19 of 89
When you change the mode from Daily to Weekly the number of units along with the 9, 17, and 50 (Day, Week, Month, etc.), the Moving Average crossovers are measured in terms of weeks rather than days. If you change to Quarterly or Yearly, the unit of measure corresponds to that choice (quarters or years, respectively.)
16. Notice the three magnifying glasses that appear on the toolbar.
Clicking the icon with a plus sign makes the chart bigger, decreasing the number of time periods shown.
Clicking the one with a minus sign makes it smaller, increasing the number of time periods shown.
Clicking the icon with no plus or minus sign returns the chart to the default zoom—that is, the zoom selected when you opened HGS Investor for the first time.
17. Right click the mouse and select Auto Zoom. (If nothing happens, first change the Chart mode from Daily to Weekly or some such and re-try the Auto Zoom.) This option configures the chart on the data available. It is especially useful if you are changing units from stocks to indexes or vice-versa.
18. If you set up a zoom and remove the check from the Auto Zoom option, the software configures the chart (and all subsequent charts) according to the last zoom you selected.
Find Some Stocks in a Strong Index 19. Use the forward and backward facing triangles on the Charting toolbar to sequence through
the list of index charts until you find one that looks strong. 20. Click the Warehouse icon. The strong index from your Charting screen appears highlighted
in the Warehouse.
21. Right click the index entry and select Change to Index Group. The Warehouse displays the components of the group sorted with the strongest appearing first. The index itself is highlighted. The stocks that are listed above the index are the strong performers because they did better than the index.
22. Highlight the top stock or one that appears above the index.
23. Click the Ranking icon. Is it still above the index? Ranking clearly answers this. With both Warehouse and Ranking visible on your screen, you can view two time frames.
24. Click the Charting icon.
25. Click the drop down list labeled View and select one of the pre-built views.
26. Click the Charts drop-down list (in the center of the toolbar.) This list appears in the same order as the list in the Warehouse. This allows you to view charts for the strong items first. It is not alphabetical. The forward and backward facing triangles on the toolbar move you forward and backward through the list in rank order.

H G S I n v e s t o r S o f t w a r e U s e r G u i d e
© Copyright 2003-2011 Industry Monitors Page 20 of 89
The list of indexes on the left side of the Charting toolbar appears in the order that groups are presented in the Designer. The Find function, represented by binoculars on the toolbar and also as Find under the Tools menu, finds a stock from the list that is open. If you were looking at charts of all securities (about 8800) you would see the usefulness of this feature. The Find function is also available in Warehouse and Ranking.
View Chart Data 27. The Data Window, activated on the toolbar by an icon that looks like a two-column page,
gives a legend that tells what each of the chart lines represent. Above the line color legend it offers data as of the date indicated. Click the icon to open the window (you can also choose Data Window from the Tools or the Right-Click menu.)
28. With the Data Window still open, click somewhere on the chart. You may wish to select a crossover point where two colored lines intersect. Notice the crosshairs that appear where you clicked. (If not, click the Tools menu and click Crosshair until a check appears beside it.) Now look at the Data Window. The Data Window displays the data pertinent to the date represented by the location where you clicked. Note that when you click a certain location on a chart, calculated values pertinent to that point in time also appear on the status bar at the bottom of the chart window.
Annotate a Chart 29. You can add your own lines and notes to the chart as well. The Annotation Tools window is
activated from your Right-Click menu or Tools menu, or by clicking the icon on the toolbar that looks like a triangle, circle and square. Display the Annotation Tools window.
30. Select a line style and line color from the bottom two boxes.
31. Click somewhere on the chart and hold down your left mouse button.
32. Drag the mouse to the right and let go. You should now have a line on your chart where you dragged your mouse. Try another color line.
33. Note that you can remove annotations by selecting Clear All Annotations from the Right- Click menu or Tools menu, or by clicking the X in the Annotation Tools window. Note that the latter clears only one annotation at a time, whereas the other two options clear them all.

H G S I n v e s t o r S o f t w a r e U s e r G u i d e
© Copyright 2003-2011 Industry Monitors Page 21 of 89
Create a New Group in the Warehouse 34. From the Charting screen, click the Warehouse icon. The Warehouse screen appears. Make
sure the group that you selected in Step 19 is highlighted.
35. Click the File menu and select Make Group from List. The Create Group window appears.
36. If you wish to make this group a subgroup under an existing group such as “Watch List,” Click User Groups in the Parent Group drop down list, then select the “Watch List” folder (or the name of the group under which you wish to create the new group.) The advantage of putting a new group into a master group is that you can compare all the subgroups to the index of all securities in the master group. The Parent group will contain the index of each child group.
37. Give your new group a name. The Number of Securities already appears as the number of stocks in the Warehouse display. If you decreased this number to, say, 5, the creation process will use only the top five securities.
38. Click OK, and Yes when a message box asks if you wish to generate the index. The Warehouse now displays the newly-created group.
Rank the New Group 39. Click the Ranking icon to see what securities are strongest in Relative Strength.
40. Click the Warehouse icon to return to the Warehouse. Click the Tools menu and select Sort. Note that if you have a very long list, you can choose more than one criterion on which to sort.
41. Display the Choose Combo Ranking window by selecting Combination Ranking from the Tools menu or by clicking the toolbar icon that looks like a combination lock.
42. Combo Rankings allow you to select a combination of criteria on which to base your view. For example, if we want to find what is strongest on the basis of one day and five day performance and on velocity.
Give your ranking a name, then click Add.
Click the Column drop down list, scroll down to the All folder, click it, and select %A/D Vel. Select Descending and give it a Weighting of 4.
Do the same with %PrCh1-Dy.
Do the same with %PrCh5-Dy except give this one a Weighting of 3.

H G S I n v e s t o r S o f t w a r e U s e r G u i d e
© Copyright 2003-2011 Industry Monitors Page 22 of 89
Edit the current view by clicking the toolbar icon that looks like a pencil and an index card. If you do not see Combo Ranking listed in the right box, click Rankings in the left box and select Combo Ranking. Click the Add button.
You may wish to highlight the Combo Ranking entry in the right box and click the Up button until you have moved the Combo Ranking column to appear after Last Close. It will be easier to see there.
43. Click OK. The Combo Ranking column appears on the Warehouse spreadsheet with the red, green and yellow colors indicating weakness, strength and neutrality toward your ranking criteria. In the Combination Ranking, the software multiples the value by the weight for a candidate then totals those numbers and compares them with the totals for the other candidates. It then displays the rankings according to relative scores in the Combo Ranking column. Combination Ranking eliminates the confusion about which criterion is important by allowing you to combine multiple criteria and weight their importance for a single score. Unlike a filter, a Combo Ranking cannot be attached to a view. If you change your view, you can lose your Combo Ranking.
44. If you click the View drop down list so that it is active, you can scroll through the different views set up in the Warehouse using the up and down arrows on your keyboard (or the scrolling wheel on your mouse, if available.) You will notice that some views do not display all the stocks in your list, and some may display none at all. This depends upon the existence and type filter attached to the view. You can also use the Create View icon (index card with hand), duplicate and edit a view, if you do not wish to despoil your existing views. If you follow this method, however, any filter that was attached to the original view is disconnected from the newly-created view, and must be reconnected manually.

H G S I n v e s t o r S o f t w a r e U s e r G u i d e
© Copyright 2003-2011 Industry Monitors Page 23 of 89
Tour #3: Bottom Up Investing Bottom Up investing defines certain characteristics and then filters out any candidates that do not meet those criteria. It does not dwell on groups, sectors or industries, focusing instead on desired characteristics of each security.
Bottom Up Investing uses a filter to apply against All Securities and determine which stocks meet the filter criteria. A filter simply reduces the size of the list you are working with by identifying only those stocks that meet the criteria you feel are important as of that time.
1. Close Warehouse and Ranking and click the Designer icon on the HGS Investor toolbar.
2. Click the HGS Reference Groups folder and select the All Securities subfolder. The list of 8000-plus securities appears in the right window. The number of securities is indicated on the title bar at the top of the window.
3. Click the Filter icon and select the Volume Breakouts filter. The list is now much smaller.
4. Click the Filter icon again and select Volume Breakouts ROE. This yields an even smaller list because it includes more criteria.
5. Click the Charting icon on the Designer toolbar. A chart for the first security in the list (or the one highlighted) appears.
6. Click the Filter icon again and click the Duplicate button. A new filter appears called Volume Breakouts ROE1. Highlight that filter and click the Edit button.
7. Change the value in the ROE column from 17 to 18.
8. Click OK.
9. Click the drop down list that names the security (in the center bottom of the charting toolbar.) The list of securities that met the newly created filter appears in the drop-down list. The list may now be smaller.
10. Click the Warehouse icon on the Charting toolbar. Select Scorecard from the View drop down list.
11. Click the column labeled ERG to sort the list so that the green items in that column rise to the top.

H G S I n v e s t o r S o f t w a r e U s e r G u i d e
© Copyright 2003-2011 Industry Monitors Page 24 of 89
Tour #4 Mix and Match Index Comparisons Suppose we want to compare unlike indexes with each other. For example, if we wish to do a comparative ranking of the Major Market Indexes with the Computer Memory Devices, Office Supplies and Insurance indexes. Can we do this?
1. Start with the Designer, highlight User Groups, right click and select Add Group.
2. On the Add/Modify Group screen, give your new group a name.
3. Select Group Indexes from the Show drop down list at the bottom of the window.
4. Double-Click the Industries folder.
5. Highlight each of the three following indexes and click Add.
Airlines Index
Gold Index
Health Care Technology Index
6. Click OK.
7. Click No when the message box asks if you want to generate the index.
8. Highlight your new group and click the Warehouse icon from the Designer toolbar. (If nothing appears in the Warehouse, click the Filter icon and select <No Filter>.)
9. Now you can scroll through the views (using the mouse wheel, the up and down arrows on your keyboard or selecting the View drop-down list) to compare performances. (Once again, you may need to check to see if a filter is attached to a view to make sure it isn’t filtering out too many of your indexes.)

H G S I n v e s t o r S o f t w a r e U s e r G u i d e
© Copyright 2003-2011 Industry Monitors Page 25 of 89
Building Groups with the Designer
Understanding the Designer Data The Designer provides a place to build custom groups that you personally care about. The User Groups folder houses the groups of securities that you personally want to watch and/or compare against others. The HGS Reference Groups provide convenient lists from which you can distill the data for your own User Group lists.
Why build User Groups? The data on 8000 plus securities provides a formidable warehouse of data, more than most people are interested in studying. Creating a manageable number of securities by selecting stocks that hold the most interest for you and placing them in a separate folder makes tracking those securities easier and less time-consuming.
User Groups have several possible applications. Without performing any further data analysis in HGS Investor Software you could create several groups based on information you already have. The following are a few examples.
If you already have a portfolio, you might build a User Group called “Portfolio” to house the data on the securities that make up your portfolio.
If you have a list of candidate securities that you might want to add to your portfolio, you might create a User Group called “Watch List” to house the data on those securities.
You might wish to mirror the progress of a certain Mutual Fund by studying a good mutual fund and tracking its major component stocks in another User Group.
As you gain experience using the HGS Investor Software to analyze data, you can find many more reasons to create User Groups. Here are a few examples:
You might wish to work with a unique type of group that represents the 90th percentile in both Earnings Per Share and Relative Strength.
You might wish to create a group based on dividend greater than three percent and zero debt.
You might wish to track stocks that feature volume breakouts to determine whether the breakouts are repeating themselves at frequent intervals.
You will often wish to create a User Group that houses the stocks selected by a filter that you have designed.
You might want to create a User Group called “Good Charts” that will house the data on stocks whose performance is reflected in a promising chart pattern.
Working with User Groups Before you select the securities or items that will comprise a User Group, you may want to build one or more User Groups so that they will be ready to receive the security data that you find interesting. This is not a requirement, for you may create User Groups on the fly if you wish, but if you already have some groups in mind, creating the groups now will help you remember where you wanted to put data on certain stocks.

H G S I n v e s t o r S o f t w a r e U s e r G u i d e
© Copyright 2003-2011 Industry Monitors Page 26 of 89
Populating a just-created User Group with securities or indexes is also not a requirement. In other words, you can build “shells” for the User Groups you intend to fill later. For example, you may not know now what securities feature promising chart patterns, but when you find them, having an existing User Group called “Good Charts” will expedite the process of populating this group.
Creating A User Group
1. Click the Designer icon to open the Designer.
2. The Designer screen appears.

H G S I n v e s t o r S o f t w a r e U s e r G u i d e
© Copyright 2003-2011 Industry Monitors Page 27 of 89
3. Click the User Groups folder using your right mouse button. The Right Mouse Click menu appears.
4. Click Add Group. The Add/Modify Group window appears.
5. In the box in the upper-right corner of the window, replace the text “New Group” by typing
the name you wish to give to the group.

H G S I n v e s t o r S o f t w a r e U s e r G u i d e
© Copyright 2003-2011 Industry Monitors Page 28 of 89
6. Click the box labeled Show in the lower left corner to display a drop-down list and select Securities and Market Indexes, Group Indexes or Groups. The menu item you select depends on whether you wish to pick out individual securities and indexes, items from group indexes or all the items in a specific group, respectively. If you select Groups, you only get groups, not indexes. Note: If you select Securities and Market Indexes, two boxes appear above the listing of securities. This helps to locate securities without having to scroll through the list. If you use one of these boxes to enter the first character or few characters in the security Name or Symbol, the list automatically scrolls to display that stock. In the example above, if you typed SE in the right box or 7 in the left box, the list would scroll so that 7-Eleven (currently listed at the bottom of the box) moves to the top of the box. (The security name does not have to be visible on the screen for this to work.)
7. If you do not wish to add securities to your group right now skip to step 14.
8. If you chose to display “Securities and Market Indexes,” you can begin selecting and adding
items now. Skip to Step 11. 9. If you have chosen to display “Groups” or “Group Indexes,” you must open the folder that
contains them. The example above has selected HGS Reference Groups Index.

H G S I n v e s t o r S o f t w a r e U s e r G u i d e
© Copyright 2003-2011 Industry Monitors Page 29 of 89
10. If you double-click any folder that has a + symbol to the left of it, the individual components of the folder appear below the folder. In the example below, we clicked the + symbol to expand the Industries Index.
11. Pressing the <Enter> key (or clicking Add->) places the highlighted security or index into the box on the right.
12. If you wish to narrow the list of securities that appear in the left box, click the Filter button and select the filter that you wish to apply to the list. The left box then displays only the items that match the criteria set up in the filter you selected.
13. Use the down arrow key to move through the list in the left box, pressing <Enter> for each component security or index you wish to add to your new group. The name of the item should then appear in the right box. In the example below, we added many of the Industry indexes using this method. Your group may only contain a handful. Alternatively, you could drag and drop the entire folder to the right window and then remove the securities or indexes that you do not want to keep.

H G S I n v e s t o r S o f t w a r e U s e r G u i d e
© Copyright 2003-2011 Industry Monitors Page 30 of 89
14. When you finish adding items to your group (or if you do not plan to add at this time) click OK. The system displays a dialog box asking if you wish to generate the indexes now. The
index is a composite view of the stocks in the group. The index is created based on the Global Index Options that you set up in Properties. When the index is added as a member of the group, it can be viewed in Charting to see how the group is performing.
15. Click Yes. The message box displays the progress of the index generation.

H G S I n v e s t o r S o f t w a r e U s e r G u i d e
© Copyright 2003-2011 Industry Monitors Page 31 of 89
16. Click the User Groups folder. Your newly created group should appear as a folder on the left side and as a listing on the right side of the screen. In the example below a copy of the group index appears.
Editing A User Group
Editing a User Group is similar to building one. Follow these steps to edit your group.
1. Click the Designer icon to redisplay the Designer screen.
2. Under the User Groups folder, right-click the folder for the group that you wish to edit.
3. From the drop-down menu that appears, click Edit Group.
4. From this point, editing proceeds in the same manner as creating a user group (described above.) While editing, you may wish to use the following buttons:
Add—Adds the highlighted item to the new User Group.
Select All—when you place your cursor in the left or right box and click Select All, all the items are highlighted so that you can perform the same operation with all of them.
Remove—when you highlight an item in the right box (or select them all) and click Remove, the item is removed from your group and its name no longer appears in the right box.
Filter displays the HGS Filter screen, allowing you to select, edit or change the filter assigned to this group.
Load List is discussed under Importing Data from Other Programs discussed in the next section of the User Guide.
Save List—Clicking Save List brings up a dialog box that allows you to select a location for an external file.

H G S I n v e s t o r S o f t w a r e U s e r G u i d e
© Copyright 2003-2011 Industry Monitors Page 32 of 89
Once you have named the file, the HGS Investor software puts the name and symbol of each item in the right box into a text file that lists stock names and stock symbols in columns. The text file can be opened with Notepad or any other text editor. For additional methods of copying data to other programs, see Exporting Data to Other Programs, later in this User Guide.

H G S I n v e s t o r S o f t w a r e U s e r G u i d e
© Copyright 2003-2011 Industry Monitors Page 33 of 89
Building Groups on the Fly
Although the Designer is primarily used for creating and editing groups to track watch lists or personal portfolios, it is not the only place where you can add to or create groups. Both Warehouse and Ranking offer a Make Group from List option from the File menu.
Selecting the Parent Group, Group Name and Number of Securities and clicking OK displays the same Generate Index dialogue that the Designer presents when creating/editing a group.
The Warehouse, Ranking and Charting offer a Quick Add to Group option when you right-click a security or index name. From this option you can select the group you wish to add the item to.
Generating Indexes for User Groups
The index is a composite view of the stocks in the group. When the index is added as a member of the group, it can be viewed in Charting to see how the group is performing.
When you create a group using the Add/Modify Groups screen, you are offered an opportunity to generate the index when you finish adding items to the group. If you later add stocks or indexes to the group on the fly, or if you did not originally opt to generate the index, you may wish to generate the index now.
The index is created based on the Global Index Options that you set up in Preferences. If you wish to index a group but do not want to use Global Index Options for this group, you should use Group Properties to change this setting. You can change the Global Index Options by selecting Global Index Options from the Tools menu in Designer. If you wish to use global index options, skip to step 7.

H G S I n v e s t o r S o f t w a r e U s e r G u i d e
© Copyright 2003-2011 Industry Monitors Page 34 of 89
1. In the Designer, select Group Properties from the File menu.
2. Click the Index tab to display the Index properties.
3. Click the radio button labeled No index for this group, or Use these settings for this group’s index:
4. If you selected the latter, select an Index Type from the drop-down menu.
The four index types are: Average Price Index—The sum of the prices for all the companies in the index,
divided by the total number of companies. Price Weighted Index—An index where the component stocks that make up the
index are weighted by their price. Higher-priced stocks therefore have a greater percentage impact on the index than lower-priced stocks.
Market Value Weighted Index—An index whose components are weighted according to the total market value of their outstanding shares. It is also called “Capitalization-Weighted Index.” The impact of a component’s price change is proportional to the issue’s overall market value, which is the share price times the number of shares outstanding.
Equal Dollar Weighted Index—An equal-dollar weighted index calculates the performance of a group as if you invested the same amount of money in each security.
5. Set the Index Start Date.
6. Click OK.
7. From the Designer Tools menu, select Build Index. The index is built according to the properties you set.

H G S I n v e s t o r S o f t w a r e U s e r G u i d e
© Copyright 2003-2011 Industry Monitors Page 35 of 89
Working with the Warehouse The Warehouse supports decision making on the basis of Fundamental Indicators of Value and Earnings Per Share rankings. The EPS Rank represents the “E” in the HGS Investing “ERG Rank.” The Warehouse shows a stock’s performance according to selected indicators (set up in “views”) over the short run.
Most investment software packages attempt to locate candidate stocks using technical analysis breakouts while ignoring the fundamentals. The HGS Investor software balances technical and fundamental information to help you locate the best stocks.
A Quick Look at the Warehouse The Warehouse displays the Major Market Indexes in a spreadsheet-style format. Color is important. Strong stocks appear in green, weak in red, and neutral in yellow.
1. Start your HGS Investing software and click the Warehouse icon.
2. The Warehouse screen appears with securities sorted alphabetically. The Warehouse displays the selection in a spreadsheet format in which any column can be used to sort the list.

H G S I n v e s t o r S o f t w a r e U s e r G u i d e
© Copyright 2003-2011 Industry Monitors Page 36 of 89
3. From the drop-down lists above the column headings select All Securities and Scorecard.
4. Click the column heading that says ERG Rank. The list is resorted. The securities whose statistics are listed in green either rise to the top or sink to the bottom. Green indicates strength. Yellow is neutral. Red indicates weakness.

H G S I n v e s t o r S o f t w a r e U s e r G u i d e
© Copyright 2003-2011 Industry Monitors Page 37 of 89
5. Place your cursor on the line between two column headings. Notice that the pointer becomes a
line with arrows at either end. Click and drag your mouse to the right. Notice that you have changed the width of the column.
6. Scroll down to the bottom of the list.
7. Click the blank box above the numbers in the left column. This redisplays the list starting at the top.

H G S I n v e s t o r S o f t w a r e U s e r G u i d e
© Copyright 2003-2011 Industry Monitors Page 38 of 89
Customizing Warehouse Views The strength of the Warehouse is its ability to display stock performance as defined by a “view.” The Warehouse comes with several pre-set views that you can use to display stock performance. By creating your own view, you can set up the criteria by which you wish to sort the list of securities so that those that are strong in your selected criteria rise to the top. Although the View creation process is very powerful and flexible, it is best not to get carried away creating a single view. It is best to create ten views with five criteria rather than one view with fifty criteria. Use the following steps to create your own view.
1. Display the Warehouse by clicking the Warehouse icon on the HGS Investing tool bar.
2. In the drop-down list on the left below the tool bar, select the group you wish to display. In the example below we have selected “Fab 7” (later releases of the software may have different groups)
Note: You may also use the toolbar icons that look like sideways triangles facing left and right. Click the triangle facing right to scroll forward through the groups. Click the left-facing triangle to scroll back. You can also open a group in the Designer then click the Warehouse icon on the main HGS Investing toolbar. When the Warehouse opens, it displays the data for the group you selected in the Designer.
3. In the drop-down list labeled View select the view you wish to use. In the example above, we have selected Scorecard.
4. The Choose/Create View icon looks like a hand pointing to a note card. If you hold the cursor over it for a moment, the name appears in a small box. Click this icon (or select Options from the Tools menu.) The Choose/Create View dialog box appears.

H G S I n v e s t o r S o f t w a r e U s e r G u i d e
© Copyright 2003-2011 Industry Monitors Page 39 of 89
5. This dialog box allows you to perform the following operations.
You can create an entirely new view by clicking the New button.
You can edit an existing view by highlighting the view and clicking the Edit button.
You can make a copy of an existing view by highlighting the view, clicking the
Duplicate button then clicking the Edit button. The new view has the name of the old view with a number added. You can change the name on the Edit screen.
Note that the Duplicate option makes it easy to modify an existing view to create a new view without having to create the new view from scratch. This is handy if you do not wish to despoil your existing views. If you follow this method, however, any filter that was attached to the original view is disconnected from the newly-created view, and must be reconnected manually.
You can delete a view by highlighting the view and clicking the Delete button.
When you click the New or Edit button, the Edit View screen appears. The only difference between creating a new view and editing an existing one is that when creating a new view, the View Name appears as “New View” instead of the name of the view being edited, and only the Name and Symbol appear in the Columns to Display box.

H G S I n v e s t o r S o f t w a r e U s e r G u i d e
© Copyright 2003-2011 Industry Monitors Page 40 of 89
6. If you are creating a new view or editing a duplicate view, type a View Name in the box at the
top.
7. Unless you know what indicators appear in each of the folders in the left box (such as Chart Patterns, Company and so forth) it is best to click the folder at the bottom that says All. This folder contains indicators from all folders in sort order. The example below displays a partial list of indicators under the All folder.

H G S I n v e s t o r S o f t w a r e U s e r G u i d e
© Copyright 2003-2011 Industry Monitors Page 41 of 89
8. Scroll through the list of indicators and highlight any indicator you wish to use as a column on the Warehouse screen. Click Add-> to move it to the Columns to Display box.
9. If a column appears in the Columns to Display box that you do not want in your view, highlight it and click the <-Remove button.
10. Columns on the Warehouse screen appear left to right starting with Name and Symbol and continuing through the list as it appears in the Columns to Display box. If you would like to alter the order in which these columns appear, highlight a column name and click the Up or Down button, repeating if necessary until the name appears where you want it in the list.
11. The Reset button sets the Columns to Display to the original Scorecard list.
12. If you wish to attach a filter to the view, click the Filter button at the top of the dialog box. The HGS Filter screen appears. If a filter is attached to this view, whenever this view is selected, the Warehouse displays only those securities or indexes that meet the criteria listed in the filter. Note that if you duplicate a view that has a filter attached, when you edit the duplicated view, the filter will no longer be attached.
13. Highlight the filter that you wish to attach to the view. If necessary, you can edit, import or
create a filter before attaching it. Details for working with filters appear later in this guide under Working with Filters.
14. When you are satisfied with the design of your view, click OK.
15. The Warehouse screen now displays your selected group with the newly created view applied. To edit this view, you can click the Edit Current View button that appears next to the

H G S I n v e s t o r S o f t w a r e U s e r G u i d e
© Copyright 2003-2011 Industry Monitors Page 42 of 89
Choose/Create View button. The Edit Current View icon features a pencil writing on a note card.
16. Important: If you attached a filter to the view, you can turn off the filter by clicking the Turn Off View Filter button on the toolbar. This icon appears as a green, yellow and red column with a magnifying glass. If the filter is off, this button appears with a red X superimposed.
Other Ways to View Warehouse Data Although creating views is the most efficient and elegant way to view data in the Warehouse, you can enhance your experience with the HGS Investor software.
Sorting the List
You can sort the list of securities using any column heading as the sort criterion. To do this, click the column heading. The list is automatically sorted on that criterion. To reverse the sorts (descending to ascending or vice versa) click the column heading again.
You can perform a more sophisticated sort using the Sort icon. This icon appears as the letters A and Z with an arrow next to them. Clicking the Sort icon displays the Sort screen. The first sort criterion listed will be the criterion you last used to sort a column.
Using this screen, you can select as many as three criteria (from drop-down lists) on which to sort and indicate whether you wish the column to be sorted in Ascending or Descending order. The sort begins when you click OK.
Viewing the Industry Group
If viewing All Securities, when you right-click an index in the Warehouse, you can view the Industry Group by selecting the Change to Industry Group option from the right-click menu.
Opening an Index in Another Module
When working with indexes, each of the four analysis modules, Designer, Warehouse, Ranking and Charting, offer an option called Open Index In. This option is displayed from the right-click menu. It

H G S I n v e s t o r S o f t w a r e U s e r G u i d e
© Copyright 2003-2011 Industry Monitors Page 43 of 89
allows you to view the highlighted index in any of the other modules by selecting a module name from a presented list.
Using Combination Rankings to Locate Candidates Use filters to limit your universe of stocks and Combination Rankings to narrow the list to the “ripe” candidates. Combination rankings work independent of filters. To apply a Combination Ranking:
1. Select Combination Ranking from the Tools menu in the Warehouse. The Choose Combo Ranking screen appears.
2. Click New or Duplicate. (If you clicked Duplicate, click Edit.) The New/Edit Combo
Ranking screen appears. If you are editing, a list of rules appears on the screen and a comment appears in the box at the bottom of the screen.

H G S I n v e s t o r S o f t w a r e U s e r G u i d e
© Copyright 2003-2011 Industry Monitors Page 44 of 89
3. To add a rule to the list, click Add. To edit a rule, highlight the rule and click the Edit button.
The Combo Rule screen appears.
4. From the drop-down list labeled Column, select the indicator you wish to appear.
5. Next to the label Direction, click the order that you wish the column for this indicator to be sorted (Ascending or Descending.)

H G S I n v e s t o r S o f t w a r e U s e r G u i d e
© Copyright 2003-2011 Industry Monitors Page 45 of 89
6. Indicate the Weighting you wish this column to have in comparison with the other rules in this Combination Ranking. The default weight is 1.00. If you wish a column to have more influence than the others, increase this number. If you wish it to have less influence, decrease this number.
7. Click OK. The New/Edit Combo Ranking screen reappears. Repeat the Add or Edit process for each Rule you want to include in the Combination Ranking.
8. Highlight any rule you wish to delete and click the Delete button.
9. Add a comment or edit the one at the bottom of the screen.
10. Click OK.
11. Click OK. Combo Ranking and Raw Combo Ranking now appear as columns in the Warehouse View.
If you do not see the Combo Ranking and Raw Combo Ranking columns:
1. Click the Edit Current View icon (looks like a note card with a pencil).
2. Make sure that Combo Ranking and Raw Combo Ranking appear in the Columns to Display list on the right side of the window.
3. If these columns do not appear, click Rankings in the left box and highlight Combo Ranking. Click the Add button.
4. Do the same for Raw Combo Ranking.

H G S I n v e s t o r S o f t w a r e U s e r G u i d e
© Copyright 2003-2011 Industry Monitors Page 46 of 89
Working with Filters Filters are important tools for data mining. Use filters to weed out all but the stocks that are most important to you. Think of data mining as a means of getting to the gold. Once you create a filtered list inside one module, you can open that filtered list in any other module by clicking the Tools menu and clicking HGS Designer, HGS Ranking or HGS Charting.
Understanding Filters A primary function of filters is to cut the Warehouse down to size. In order to keep the data simple enough to analyze, we use filters to ultimately select 7 to 10 stocks from 8000-plus and 3 to 4 groups from 200.
The basic Indexing filter is used to eliminate inexpensive and low liquidity stocks from the indexes.
Secrets for using filters include the following:
1. Start simple and gradually add criteria.
2. Establish the criteria important to you.
3. Balance Fundamental and Technical criteria.
4. Check results along the way.
5. Have a “Theme” in mind. For sample themes, see Filter Examples, later in this section of the User Guide.

H G S I n v e s t o r S o f t w a r e U s e r G u i d e
© Copyright 2003-2011 Industry Monitors Page 47 of 89
Creating Filters
1. On the Warehouse (or Charting, Ranking or Designer) toolbar, click the Filter icon. The HGS Filter window appears. (Note that your window may have different filter names based on the filters in your list.)
2. Unless you have a reason to build a filter from scratch, it is easier to duplicate an existing filter and modify it than it is to pick out all new criteria to add to the filter. We will proceed in this manner.
3. Click one of the filters listed under Select Filter to Apply. The Indexing filter is a good place to start.
4. Click the Duplicate button. A new filter name appears below the one you selected. It is identified by the name of the original filter plus the number 1 (or a subsequent number if you have previously duplicated this filter and not changed the system-applied name.) The new filter is highlighted.
5. Click the Edit button. The Edit Filter window appears.

H G S I n v e s t o r S o f t w a r e U s e r G u i d e
© Copyright 2003-2011 Industry Monitors Page 48 of 89
(The Indexing filter being copied here ships with the software. The first option eliminates Preferred stocks by filtering out all securities that have a space and a “P” in their symbol name (first line) and stocks with a price under $5 (second line.) It accepts indexes and group indexes. (fourth and third lines, respectively.)
6. At the top of the window next to the label Filter Name, the system-applied filter name is highlighted. If you wish, enter a new name for the filter. Changing the name is not required, but more representative filter names are easier to identify from the list.
7. Edit the filter as necessary, using the following features:
Highlight any line you wish to remove and click the Delete Row button.
Clear the entire filter by clicking the Clear Filter button.
Insert a row by clicking the Insert Row button.
Add one or several lines by placing the cursor on the first new line and entering filter criteria.
8. Click the Cancel button if you change your mind about editing the filter. This is especially useful if you would rather not clean up a mess you made. If you cancel, skip the next step.
9. Click OK. Depending upon the filter you selected and the items you applied it to, the number of items in the list of indexes may decrease or disappear altogether.

H G S I n v e s t o r S o f t w a r e U s e r G u i d e
© Copyright 2003-2011 Industry Monitors Page 49 of 89
Attaching a Filter to a View If a filter is attached to a view, whenever this view is selected, the Warehouse displays only those securities or indexes that meet the criteria listed in the attached filter. Note that if you duplicate a view that has a filter attached, when you edit the duplicated view, the filter will no longer be attached.
1. Display the Warehouse by clicking the appropriate icon on the HGS Investor toolbar.
2. The Choose/Create View icon looks like a hand pointing to a note card . If you hold the cursor over it for a moment, the name appears in a small box. Click this icon (or select Options from the Warehouse Tools menu.) The Choose/Create View dialog box appears.
3. Highlight the view to which you wish to attach the filter and click the Edit button. The Edit
View window appears.

H G S I n v e s t o r S o f t w a r e U s e r G u i d e
© Copyright 2003-2011 Industry Monitors Page 50 of 89
4. Click the Filter button which appears below the View name: label. The HGS Filter screen appears.
5. Highlight the filter that you wish to attach to the view.
6. Click OK. The Warehouse screen now displays your selected group with the newly created view applied.

H G S I n v e s t o r S o f t w a r e U s e r G u i d e
© Copyright 2003-2011 Industry Monitors Page 51 of 89
7. If you attached a filter to the view, you can turn off the filter by clicking the Turn Off View Filter button on the toolbar. This icon appears as a green, yellow and red column with a magnifying glass. If the filter is off, this button appears with a red X superimposed.
Sharing Filters with Other Users On the Warehouse (or Charting, Ranking or Designer) toolbar, click the Filter icon. The HGS Filter window appears. (Note that your window may have different filter names. Some of the filters in the example below are user-built filters.)
Exporting Filters
1. Select one or more filters to be exported:
To select a group of filters whose names are all together, click the first filter name, press and hold the Shift key and click the last filter name in the group. All filters between the first and the last one clicked are selected.
To select a random group of filter names, press and hold the Ctrl key and click the name of each filter you want to select.
2. Click the Export button. The Save As window appears. Here you can select the location and the name the file to contain the filters. HGS Investor will default the Save In location to: .....\HGS Investor\Lists where …. is the name of the drive or directory where the software is installed.
3. Filters are saved in the location you specify with the name you provide.

H G S I n v e s t o r S o f t w a r e U s e r G u i d e
© Copyright 2003-2011 Industry Monitors Page 52 of 89
4. Exported filters have a file type of *.flt e.g. MyFilters.flt. The file of exported filters can be shared with others via disk, network or e-mail or can be saved as backups.
Importing Filters
If you are importing several filters you will find it easier to import them if you place the filters in the …HGS Investor\Lists location on your hard drive (where …. is the name of the drive or directory where the software is installed.) Each filter must be imported separately and since the import process will default to that directory, importing will be much quicker if you don’t have to navigate to a different location each time you import.
You must use the Import function to get the filters into your system. Simply copying from a floppy will not work.
1. On the HGS Filter screen (pictured above) click the Import button.
2. The Open dialog box appears. Here, you can select the location and the name of file that contains the filters.
3. Filters have a file type of *.flt—for example, MyFilter.flt
4. Select the file to be imported. If a filter by the same name already exists on your system, a warning message appears. To keep the old filter say No, rename the old filter, and try the import again.
5. Repeat these steps for each filter you wish to import.
Filter Examples Note: The first line of most filters appears as: If Symbol Does Not Contain P Please note that when entering the P it is preceded by a space. In the stock symbol, a P preceded by a space indicates a preferred stock.
Low Debt, High Yield Filter
Apply this filter against All Securities to locate quality stocks that have proved themselves.
If Symbol Does Not Contain P And Last Close >= 5.0000 And 50 DMA Vol >= 40000.0000 And ROE >= 5.000 And Long Term Debt to Equity <= 2.0000 And % Div Yld >=2.0000 % 1 Yr EPS Gr (TTM)>=25.0000
The High EPS Breakout Filter
Use the High EPS Breakout filter to look for stocks that are based with tight chart patterns. If Symbol Does Not Contain P

H G S I n v e s t o r S o f t w a r e U s e r G u i d e
© Copyright 2003-2011 Industry Monitors Page 53 of 89
And Last Close >= 5.0000 And %Vol/50 DMA Vol >= 0.0000 And EPS Rk >= 80.0000
Increasing Volume Filter
Use the Increasing Volume Filter to looks for stocks with a pattern of increasing volume. If Symbol Does Not Contain P And Last Close >= 5.0000 And 50 DMA Vol >= 40000.0000 And % Vol/50DMA Vol > 0.0000 And % Vol Chg > 10.0000
Basic Earnings and Growth Filter
Use the Basic Earnings and Growth filter to look for stocks that show respectable growth and earnings over the past year.
If Symbol Does Not Contain P And Last Close >= 5.0000 And 50 DMA Vol >= 40000.0000 And % EPS Chg > 0.0000 And % EPS Prev > 0.0000 And % 1YrEPSGr (TTM) > 0.0000

H G S I n v e s t o r S o f t w a r e U s e r G u i d e
© Copyright 2003-2011 Industry Monitors Page 54 of 89
Working with Rankings The purpose of Ranking is to view a variety of trends over time. Ranking uses one criterion over several time periods to evaluate stock performance, while the Warehouse uses several different criteria over a single time period. Ranking shows the relative strength of one security or index as compared to others in the same folder or group. It is most useful for measures of long-term relative strength. It helps you to make decisions on the basis of market or Group strength. It is the “G” in the HGS Investing “ERG Rank.”
Understanding the Ranking Process The HGS Investing software computes ranks using the values generated from relative strength. It sorts the values from high to low, then assigns a percentile rank from 99 to 1. A ranking value of 80 means that the security or index outperformed 80% of all securities or indexes during the period measured.
Rankings are updated each day. The last trading day of the prior week is retained as the weekly ranking. Any prior week’s ranking of an index or stock is determined by clicking the date at the top of the week’s column on the Ranking screen.
Interactivity between Ranking and Warehouse
In Ranking, the best performing groups will rise to the top. Highlight a group at the top of the Ranking display. (Later versions of the HGSI software may have different groups just select any group for this example)

H G S I n v e s t o r S o f t w a r e U s e r G u i d e
© Copyright 2003-2011 Industry Monitors Page 55 of 89
When you click the Warehouse icon, the display will give you a picture of how the industry is performing. You can reverse the process by selecting a group in Warehouse, then clicking Ranking.
Tiling the Warehouse/Ranking Screens
To compare performance over two different time periods and make the performance figures visible on the screen together, select Tile Warehouse and Ranking Horizontally from the Tools menu.
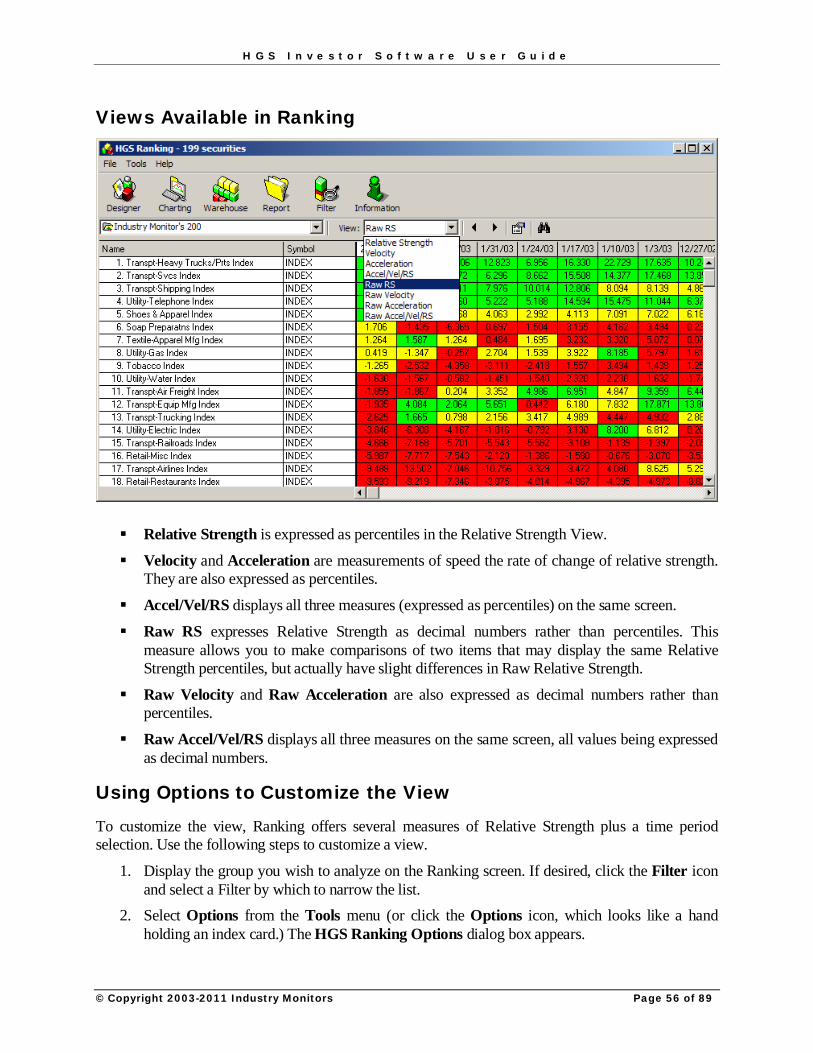
H G S I n v e s t o r S o f t w a r e U s e r G u i d e
© Copyright 2003-2011 Industry Monitors Page 56 of 89
Views Available in Ranking
Relative Strength is expressed as percentiles in the Relative Strength View.
Velocity and Acceleration are measurements of speed the rate of change of relative strength. They are also expressed as percentiles.
Accel/Vel/RS displays all three measures (expressed as percentiles) on the same screen.
Raw RS expresses Relative Strength as decimal numbers rather than percentiles. This measure allows you to make comparisons of two items that may display the same Relative Strength percentiles, but actually have slight differences in Raw Relative Strength.
Raw Velocity and Raw Acceleration are also expressed as decimal numbers rather than percentiles.
Raw Accel/Vel/RS displays all three measures on the same screen, all values being expressed as decimal numbers.
Using Options to Customize the View
To customize the view, Ranking offers several measures of Relative Strength plus a time period selection. Use the following steps to customize a view.
1. Display the group you wish to analyze on the Ranking screen. If desired, click the Filter icon and select a Filter by which to narrow the list.
2. Select Options from the Tools menu (or click the Options icon, which looks like a hand holding an index card.) The HGS Ranking Options dialog box appears.

H G S I n v e s t o r S o f t w a r e U s e r G u i d e
© Copyright 2003-2011 Industry Monitors Page 57 of 89
3. The drop-down list under Number of Periods to Load allows you to select the time period for which data is displayed in the Ranking column headers.
Options range from one month to two years. If you select one or two months, all columns will be visible on the Ranking screen. If you select two years, you will have to scroll horizontally to see the earlier periods.
The date boxes below the drop down list have meaning only if you select the Custom option, in which case you can designate the dates for which you wish performance data displayed. Custom is particularly useful for historical studies.

H G S I n v e s t o r S o f t w a r e U s e r G u i d e
© Copyright 2003-2011 Industry Monitors Page 58 of 89
4. Select the Relative Strength type. These formulas are discussed in detail in the Help system that displays from the Help button on the dialog box. The following is a brief summary of each.
Ian Slow Relative Strength requires a minimum of 25 weekly close values. The time period between the two close dates is divided into two segments and each is assigned a different weighting value. Seventy percent of the ranking is based on the most recent twelve weeks.
Ian Fast Relative Strength requires a minimum of 26 weekly close values. The time period between the first and last close date is divided into three segments and each is assigned a different weighting value. The most recent six weeks is weighted at forty percent; the periods from seven to thirteen weeks ago and fourteen to twenty six weeks ago are weighted at thirty percent. This measure is rarely used.
Wilder RSI is useful because you can select the number of weeks for which to rank, whereas both Ian rankings (slow and fast) are for fixed, usually longer, periods. Developed by Welles Wilde Relative Strength Index is a momentum oscillator that measures the velocity of a directional price movement by comparing a stock’s highest highs and lowest lows over a period of time. It has been successful in calling trend reversals at a very early point. This measure is used as an option in Ranking. Wilder RSI computation uses n weekly close values to compute the relative strength.
Percent Change is useful if you want to determine the change in a security’s strength over a certain time period. The default time period is 3 weeks, although this also can be changed. Because Percent Change shows values as gains or losses during this time period, it is a good way to see where the short-term action is in the market.

H G S I n v e s t o r S o f t w a r e U s e r G u i d e
© Copyright 2003-2011 Industry Monitors Page 59 of 89
Working with Charts Charting uses Technical Indicators to help you make decisions on the basis of Relative Strength and Momentum. Relative Strength comprises the “R” in the HGS Investing “ERG Rank.” With charts, you study Price and Volume. Price and Volume analysis is an art that can be learned. Price and Volume are more important than indicators and oscillators, which are better used for confirmation purposes rather than decision-making.
Never do anything without looking at Charts. When you study Rankings, the Group Ranks determine the relative strength between groups. You can determine group strength with the Index chart. The Industry Group Index chart determines the strength of the group within itself.
The Purpose of Charting Windows
The customizable chart windows (such as the default Price and Volume windows) can be enhanced and expanded with other details to give you the information needed to make an educated buying decision. You can add new windows to the chart and new indicators to the windows. The instructions below will guide you in these procedures.
Viewing Charts 1. On the Charting screen, click the drop down list labeled View and select one of the pre-built
views.
2. Click the Charts drop-down list (in the center of the toolbar.)
3. If you displayed a list of stocks or indexes in the Warehouse before you clicked the Charting icon, this drop-down list appears in the same order as the list in the Warehouse. This allows you to see the strong candidates first. It is not alphabetical. The forward and backward facing triangles on the toolbar move you forward and backward through the list in rank order.
The list of indexes on the left side of the Charting toolbar appears in the order that groups are presented in the Designer.
Using the Find Function
The Find function, represented by binoculars on the toolbar and also as Find under the Tools menu, finds a stock from the list that is open. If you were looking at charts of all securities (about 8800) you would see the usefulness of this feature. This feature is also available in Warehouse and Ranking.

H G S I n v e s t o r S o f t w a r e U s e r G u i d e
© Copyright 2003-2011 Industry Monitors Page 60 of 89
Editing the Current View 1. Click the View drop down list on the Charting toolbar and select the view that you wish to
edit. 2. From the Tools menu, select Edit Current View or click the icon on the toolbar that looks
like a pencil pointing to an index card. (You can also edit views, windows and indicators from the right mouse click menu.) The HGS Chart View window appears.
3. Click the Window tab at to top of the window. Here, you can:
Edit an indicator by clicking on its name. In the following example, if I clicked the Price indicator, then clicked the Edit button, I could customize the way this indicator appears on the chart.
Add a new window to the chart using the New Window button.
Add an indicator to a window that you have selected by clicking the Add Indicator button. The indicator will be added to the window that is highlighted when you click the Add Indicator button. In the example below, if I click the Add Indicator button, the new indicator will be added to the Price Window because that window is highlighted.
Delete the selected window or indicator by clicking the Delete button. There is no confirmation box before the deletion takes place. However, if you accidentally delete something you didn’t intend to delete, click the Cancel button to abandon the changes made to the view. The deletion, along with any other changes will then be reversed.
Edit a selected window by clicking the Edit button.
Move the location of the selected window by clicking the Up or Down button. On the example window below, clicking the Down button would move the Price window down in the Window list and on the chart, the Price Window would appear below the Volume Window in the chart view.
Editing indicators and windows and views is discussed in more detail in subsequent steps.

H G S I n v e s t o r S o f t w a r e U s e r G u i d e
© Copyright 2003-2011 Industry Monitors Page 61 of 89
4. To edit an indicator, double click its name on the Window tab. In the example above, I will
double click the Volume indicator. The Volume Indicator Options window appears.

H G S I n v e s t o r S o f t w a r e U s e r G u i d e
© Copyright 2003-2011 Industry Monitors Page 62 of 89
Each indicator options window displays different fields depending upon the type of information with which the indicator deals. For example, if I clicked Moving Average Crossover, I would see the following window:
Options on most of the windows are fairly self-explanatory, however, a few may require more clarification. An example is Clip Volume on spikes greater than the average volume times: 10 (or 3 or some other number.) This is a convenience used to work around screen space limitations for volume spikes that are so high they are hard to represent graphically.
HGS Investor computes a total average volume (using all days). Assume that the number I enter for this option is 3. When the chart appears on the screen, the volume indicator will display a maximum of three times the average, no matter how high the volume actually spiked. For example, if the computed average is 50,000 and the number entered is 3, if any day’s volume spikes to greater than 150,000 the indicator only shows 150,000. The data window will still show the actual volume.
Details and further resources regarding the available indicators can be viewed by clicking the Help button from any options window.

H G S I n v e s t o r S o f t w a r e U s e r G u i d e
© Copyright 2003-2011 Industry Monitors Page 63 of 89
5. The HGS Chart View window lists all windows and indicators that appear on the chart. We have already learned how to select and customize the indicators that appear in each window. We can also customize each window. To do this, double click the window name or highlight the name of the window you wish to edit and click the Edit button. The Window Options window appears.
You can improve the readability of your charts easily by clicking any of the color bars labeled Foreground Color, Background Color and Grid Color. When you click one of these bars, the Color window appears. This window allows you to select from a variety of colors and to create custom colors if you wish.
Note that this color window is also available from the Indicator Options windows described in the previous step.

H G S I n v e s t o r S o f t w a r e U s e r G u i d e
© Copyright 2003-2011 Industry Monitors Page 64 of 89
6. Once you have selected a color, click OK.
7. When you have set all your window options for the window you selected (in this example, the Price window) click OK. The color bar should appear with the color you selected.
8. In the same manner, edit any other colors or windows you wish to change.
9. Now that you have set your Indicator and Window options, you may wish to edit the view itself. Click the View tab on the HGS Chart View window. The View options tab appears.

H G S I n v e s t o r S o f t w a r e U s e r G u i d e
© Copyright 2003-2011 Industry Monitors Page 65 of 89
10. The View tab allows you to
Rename the view by entering a new name.
Under Periods to Show, select predefined or custom time periods to display.
Indicate a date range to display if you selected a custom time period.
Elect to add extra time periods to the chart and indicate the number of extra periods.
Indicate the chart display mode (daily, weekly, quarterly, and so forth.)
Add comments to the view.

H G S I n v e s t o r S o f t w a r e U s e r G u i d e
© Copyright 2003-2011 Industry Monitors Page 66 of 89
Creating a New Charting View You can create new views from scratch or duplicate views and edit them. Usually duplicating a view and editing saves time and allows you to keep the information already contained in another view rather than rebuilding it. To create a new view or to duplicate and edit a view, use the following instructions.
1. From the Tools menu in Charting, select the Choose/Create View option (or click the toolbar icon that looks like a hand pointing at an index card.) The Choose/Create View window appears.
From the Choose/Create View window, you can:
Create a new view by clicking the New button. From here, you can follow instructions under Editing the Current View, starting at Step 3, below.
Delete a view by clicking the Delete button. Edit a view by clicking the Edit button. (This displays the View and Window tabs
discussed previously under Editing the Current View.)
View a detailed discussion of indicators by clicking the Help button.
Duplicate the highlighted view by clicking the Duplicate button. When you click this button, a new entry appears. The entry name is identical to the one that you duplicated with the exception of the number at the end of the name. Once you have duplicated the view, click Edit to modify the view and name it to your own liking.
2. Click OK to select the highlighted view as your preference for displaying your chart.

H G S I n v e s t o r S o f t w a r e U s e r G u i d e
© Copyright 2003-2011 Industry Monitors Page 67 of 89
Viewing the Data Window
The Data Window, activated on the toolbar by an icon that looks like a two-column page, gives a legend that tells what each of the chart lines represent. It also offers fundamental data regarding the item displayed as of a certain date.
1. Click the Data Window icon to open the window (you can also choose Data Window from the Tools or the Right-Click menu.)
2. Note the color blocks at the bottom of the window. These color blocks serve as a legend representing the lines and line colors that appear on the chart.
3. Note also the name of the item at the top of the window. This is the name of the security or index for which the chart is displayed.
4. With the Data Window open, click somewhere on the chart. You may wish to select a crossover point where two colored lines intersect. Notice that if you have checked the Crosshair option from the Tools menu, the crosshairs appear where you clicked.
Now look at the Data Window. The Data Window displays the data pertinent to the date represented by the intersection point where you clicked. Note that when you click a certain location on a chart, calculated values pertinent to that point in time also appear on the status bar at the bottom of the chart window.
Viewing the Fundamental Data Window When viewing a chart, you can display the Fundamental Data Window by selecting Fundamental Panel from the Tools menu, or by clicking the icon that looks like a two column page with a graph at the bottom.
The Fundamental Panel appears as a table of data with two bars at the right side. The bars display triangles that point upwards and downwards. These up and down arrows allow you to scroll through several information panels.

H G S I n v e s t o r S o f t w a r e U s e r G u i d e
© Copyright 2003-2011 Industry Monitors Page 68 of 89
To view the previous or next window of information, click the appropriate arrow.

H G S I n v e s t o r S o f t w a r e U s e r G u i d e
© Copyright 2003-2011 Industry Monitors Page 69 of 89
Zooming In and Out 1. Notice the three magnifying glasses that appear on the Charting toolbar.
Clicking the icon with a plus sign makes the chart bigger, decreasing the time periods shown.
Clicking the icon with a minus sign makes it smaller, increasing the time periods shown.
Clicking the icon with no plus or minus sign returns the chart to the default zoom.
2. Right click the mouse and select Auto Zoom. This option configures the chart according to the data available. It is especially useful if you are changing units from stocks to indexes or vice-versa.
If you set up a zoom and remove the check from the Auto Zoom option, the software configures the chart (and all subsequent charts) according to the last zoom you selected.
Using Annotation Tools
Using the Annotation Tools window, you can add your own lines and notes to the chart. The following steps will demonstrate the use of these Annotation Tools.
1. The Annotation Tools window is activated from your Right-Click or Tools menu, or by clicking the icon on the toolbar that looks like a triangle, circle and square. The top row in the Annotation window allows you to select the action you wish to perform.
Clicking the first icon (a slanted line) indicates that you wish to draw a line. The instructions in the following paragraphs will tell you more about drawing lines.
Clicking the second icon (the letter “A”) indicates that you wish to add text to the chart. Once you click this icon, click the place on the chart where you wish to add the text and start typing.
Clicking the third icon (an arrow) indicates that you wish to select an annotation from the chart for deletion.
Clicking the fourth icon (an “X”) indicates that you wish to delete the selected annotation.

H G S I n v e s t o r S o f t w a r e U s e r G u i d e
© Copyright 2003-2011 Industry Monitors Page 70 of 89
If you have selected the Line icon in the first row, your next step is to select the type of line you wish to draw. The icons in the second row allow you to draw the following line types (in order of appearance):
Closed line
Extended Line - Line extends both ways with dotted line
1/8's Retracement Line - Splits the line into even eighths
Fibonacci Retracement - Standard retracement percentages
Fibonacci Fan Line - Three lines at various retracement percentages
The third and fourth rows in the Annotation window allow you to select the style (dotted or solid) degree of thickness and color of the line you wish to draw.
2. Once you have selected line type, style and color, follow these instructions to actually draw the line:
3. Click somewhere on the chart and hold down your left mouse button.
4. Drag the mouse to the right and let go. You should now have a line on your chart where you dragged your mouse.
Note that you can remove annotations by selecting Clear All Annotations from the Right- Click or Tools menu, or by clicking the X in the Annotation Tools window. Note that the latter clears only one annotation at a time, whereas the other two options clear them all.
Changing the Mode from Daily to Weekly, Etc. On charts, the content of the bar at the bottom changes as you move your cursor. When you change the mode from Daily to Weekly, the number of units along with the 9, 17 and 50 crossovers are measured in terms of weeks rather than days. If you change to Quarterly or Yearly, the unit of measure corresponds to that choice (quarters or years, respectively.)
1. Click the box in the lower right corner of the chart. The box may be labeled Daily, Weekly, Monthly, Quarterly or Yearly. Change the selection to see what effect the change has on the chart.
2. Right-click your mouse and select Chart Mode. The same options appear. Select another mode.
3. Now hold down the Alt key and type a D. The chart should now display the Daily mode. You can switch to any other mode using the Alt key plus the first letter of the mode: W, M, Q, or Y.

H G S I n v e s t o r S o f t w a r e U s e r G u i d e
© Copyright 2003-2011 Industry Monitors Page 71 of 89
Sharing and Printing Data
Importing Data from Other Programs In order to import information created in another program into the HGS Investor software, the file must meet the following criteria:
1. It must be in the ASCII format.
2. It must contain the stock symbols.
3. The file name must include a suffix of *.txt (for text files) or *.lst (for lists created by Quotes Plus.)
4. Since Excel (*.xls) files are not recognized by the HGS Investor software, they must be exported into ASCII/Text files before loading them.
To Import Data: 1. Click the Designer icon to open the Designer. The Designer screen appears.
2. Click the User Groups folder using your right mouse button. The Right Mouse Click menu appears.
3. Click Add Group or Edit Group. The Add/Modify Group window appears.
4. Click the Load List button.
5. In the Open dialog box, navigate to the location of your list.

H G S I n v e s t o r S o f t w a r e U s e r G u i d e
© Copyright 2003-2011 Industry Monitors Page 72 of 89
6. Highlight the file from which you wish to load data and click the Open button.
7. When the list is opened, the company name and the symbol for each item in the list appear in the right box on the Add Modify User Group screen.

H G S I n v e s t o r S o f t w a r e U s e r G u i d e
© Copyright 2003-2011 Industry Monitors Page 73 of 89
8. If any symbols in the list you loaded could not be located a message states the number of securities that could not be found and asks if you wish to see a listing.
9. Clicking Yes displays a Notepad screen where you can edit the list and save it.

H G S I n v e s t o r S o f t w a r e U s e r G u i d e
© Copyright 2003-2011 Industry Monitors Page 74 of 89
10. After saving the list, repeat the Load List procedure. Repeating the procedure with the entire list is safe, because the HGS Investor software will not add a security if the same symbol already exists in the User Group list.

H G S I n v e s t o r S o f t w a r e U s e r G u i d e
© Copyright 2003-2011 Industry Monitors Page 75 of 89
Exporting Data to Other Programs You can create an ASCII file that will export all historical price and volume information for each symbol in a group or collection of groups.
1. Click the Designer icon to open the Designer. The Designer screen appears.
2. In the HGS Designer, highlight the group containing the information you wish to export.
3. From the File menu select Export Groups As ASCII.

H G S I n v e s t o r S o f t w a r e U s e r G u i d e
© Copyright 2003-2011 Industry Monitors Page 76 of 89
4. In the Export groups to: box you may type the location where you wish to put the file or you may click the box labeled … to bring up a screen that will allow you to navigate to your desired location. The creation process automatically names the file.
Note that if you type the name of a location that does not yet exist, the file creation process will create that folder for you. For example, if you place your cursor at the end of the line in the example above and typed \export, the process would create a file and place it in the new folder C:\Program Files\HGS Investor\export.
5. If you clicked the box, in the Browse for Folder screen, you can then select the location where you wish to put the file.
6. On the Export Groups as ASCII window, if you check the box that says Include all subgroups all exported data will retain the original group and sub-group structure.
7. On the Export Groups as ASCII window, click the radio button under the label Format to select the kind of information format you wish to use for your file. All options yield a comma delimited text file (items separated by commas) that can be opened in Notepad or any other text editor.
8. Click OK.

H G S I n v e s t o r S o f t w a r e U s e r G u i d e
© Copyright 2003-2011 Industry Monitors Page 77 of 89
Copying Stock Symbols Directly into Other Programs Using Designer, Warehouse or Ranking, you can copy a list of stock symbols directly into the Windows Clipboard. This makes the list of symbols ready to paste into another program such as Word, Excel or Quote Tracker. Instructions for copying and pasting appear below.
1. If using HGS Designer, highlight the group containing the information you wish to export. If using Warehouse or Ranking, select the group from the drop-down list that appears below the tool bar.
2. From the File menu select Copy symbols to clipboard The example below shows this menu item displayed from the Designer. The same items appear in the same place in Ranking and Warehouse.
3. From the extended menu choose one of the following
Comma Separated List yields a list of symbols separated by columns. This format is best if you were creating a list that needs to go into comma-delimited format. The list, when pasted into a text editor such as Word, will look something like the following:
ACMR,ACF,INDEX,MTH,ODP,SBUX,URBN

H G S I n v e s t o r S o f t w a r e U s e r G u i d e
© Copyright 2003-2011 Industry Monitors Page 78 of 89
Text Column yields a list with one symbol per line. It is best for pasting data into programs for which the data should be separated by a paragraph mark or hard return (such as Excel™ .) The information, when pasted will look something like the following:
ACMR
ACF
INDEX
MTH
ODP
SBUX
URBN
4. Once you select the format, it may appear that nothing has happened. No dialog boxes appear (unless you already have something in the Clipboard). In order to see the results of your operation, you must paste the list from the clipboard into another program. To do this, open the program into which you wish to paste the information.
5. In the program you just opened, place your cursor where you want the list to start (such as the first cell of a spreadsheet.)
6. Select Paste from the Edit menu or use the key combination Ctrl-V to start pasting. The list appears in the new program.
Adding Securities to Quote Tracker These instructions do not cover the setup or features in QuoteTracker. Please refer to the QuoteTracker documentation for this information. The QT program must be open for the transfer to take place.
Four modules in the HGS Investing software offer an option in the File menu to add stocks directly to QT.
From Designer, Warehouse or Ranking , you may add groups of stocks to an existing QT portfolio or create a new portfolio.
From the Charting menu, you may add a single stock to QT.
When the process completes and you see a confirmation window, switch to QuoteTracker, and use the drop down menu to locate your new portfolio.

H G S I n v e s t o r S o f t w a r e U s e r G u i d e
© Copyright 2003-2011 Industry Monitors Page 79 of 89
Saving Lists, Views and Group Rankings to Files The Warehouse and Ranking offer a Save As option from the File menu. The Warehouse also has a Save List As option. Each of these options saves data to either a text file (Save As) or a Quotes Plus list file (Save List As).
Using each option, you navigate to a location where you wish to place the file, name the file and click Save.
In the Warehouse, the Save As option saves the stock or index data in the current view to a text file.
The Save List As option saves the list of stocks to a Quotes Plus list file. This file can be shared with another user or loaded using the Load List button when creating or editing a group in the Designer.
In Ranking, the Save As option saves the group ranking data to a text file.

H G S I n v e s t o r S o f t w a r e U s e r G u i d e
© Copyright 2003-2011 Industry Monitors Page 80 of 89
Printing and Saving Snapshots The Warehouse, Ranking and Charting offer a means of printing or saving a snapshot of the screen. The snapshot is saved as a file with a .png extension, which is viewable via the Fax Viewer as a Microsoft Picture-It document. The same picture can be sent to a printer.
Both options are available from the File menu in Warehouse, Ranking or Charting.
Displaying and Printing Reports In the Warehouse, Ranking or Charting you can highlight a security or index and click the Report icon on the toolbar. This displays a detailed report regarding the security or index. To print the report, select Print from the File menu.

H G S I n v e s t o r S o f t w a r e U s e r G u i d e
© Copyright 2003-2011 Industry Monitors Page 81 of 89
Appendix A: Glossary of Stock Terminology The following list covers only the terminology that is used in this guide. For complete listings and descriptions of the indicators and other terminology used by the HGS Investor software, see Data Fields in the Help System.
Indicator Definition
Acc/Dist Accumulation/Distribution “A” to “E”
Arms
Index Named after its creator Richard W. Arms, this indicator is also known as the "TRIN" index. The indicator uses advancing and declining stocks and their volume to measure intra-day market supply and demand and can be applied over short or longer time periods.
The Index formula can be applied to any market index for which data is available. The formula is calculated as (Advancing issues/Declining issues) / (Advancing volume/ Declining volume). If more volume goes into advancing issues than declining issues the Arms Index falls below 1.0. If more volume goes into declining stocks than advancing stocks the Arms Index rises above 1.0. A value of 1.0 is considered neutral.
This indicator can be selected from the Other folder when selecting indicators.
DMA Day Moving Average as in 50 Day Moving Average or 50 DMA
ERG A rank indicator that is the sum of three rankings, EPS rank, price rank and group rank. The sum of these three rankings is then ranked against all other companies.
EPS Earnings Per Share
Float Number of shares held by the public as opposed to those shares held by management.
Ian Slow Developed by Ian Woodward, founder of Woodward Investments, Ian Slow is a measure of Relative Strength requiring a minimum of 25 weekly close values. The time period between the two close dates is divided into two segments and each is assigned a different weighting value. This measure is used as an option in Ranking.
Ian Fast Developed by Ian Woodward, founder of Woodward Investments, Ian Fast is a measure of Relative Strength requiring a minimum of 26 weekly close values. The time period between the first and last close date is divided into three segments and each is assigned a different weighting value. This measure is used as an option in Ranking.

H G S I n v e s t o r S o f t w a r e U s e r G u i d e
© Copyright 2003-2011 Industry Monitors Page 82 of 89
Indicator Definition
MACD A technical indicator, Moving Average Convergence/Divergence, developed by Gerald Appel.
Wilder RSI
Developed by Welles Wilder, this indicator is a ratio of a security’s strength to its weakness. A technical indicator, Relative Strength Index is a momentum oscillator that measures the velocity of a directional price movement by comparing a stock’s highest highs and lowest lows over a period of time. It has been successful in calling trend reversals at a very early point. This measure is used as an option in Ranking. Wilder RSI computation uses n weekly close values to compute the relative strength. The number of weeks (n) defaults to 14 unless you elect to change this value in window provided.

H G S I n v e s t o r S o f t w a r e U s e r G u i d e
© Copyright 2003-2011 Industry Monitors Page 83 of 89
Appendix B: HGS Data HighGrowthStock (HGS) Data is an extensive database of a stock price, volume, fundamental and proprietary computed values. The database contains information for approximately 8000 securities and is updated daily. The table below is a partial list of data elements that can be used with HGS search filters or to build Warehouse spreadsheets for groups of securities. Descriptions of these elements appear in the Help System, accessed by the Information icon.
.
Category Comment Data for Filters Or Warehouse Spreadsheet Display
Chart Patterns Data fields useful for filter searches looking for chart patterns where up and/or down moving averages crossovers are occurring.
Crossover 17/50/200 DMA Crossover Close/17/50/200 Days Dn Since 17 DMA CO Days Dn Since 17 DMA Crossed 50 DMA Days Dn Since 200 DMA CO Days Dn Since 4 DMA CO Days Dn Since 4 DMA Crossed 17 DMA Days Dn Since 50 DMA CO Days Dn Since 9 DMA CO Days Dn Since 9 DMA Crossed 17 DMA Days Since 17DMA CO Days Since 17 DMA Crossed 50 DMA Days Since 200 DMA CO Days Since 4 DMA CO Days Since 4 DMA Crossed 17 DMA Days Since 50 DMA CO Days Since 9 DMA CO Days Since 9 DMA Crossed 17 DMA Last Close > 17 DMA
Company Various information about the company
Business CUSIP Exch IPO Date IPO Price Optionable Issue Type Name Symbol

H G S I n v e s t o r S o f t w a r e U s e r G u i d e
© Copyright 2003-2011 Industry Monitors Page 84 of 89
Category Comment Data for Filters Or Warehouse Spreadsheet Display
Fund-Earnings Earnings data fields useful in identifying earnings strength, change and growth for various periods of time
% 1Yr EPS Gr % 1Yr EPS Gr (TTM) % 5Yr EPS Gr % EPS Chg % EPS Prev % EPS Proj 3-5 Yrs % EPS Proj CFY % EPS Proj CQ % EPS Proj NFY % EPS Proj NQ % OScore (The score a security obtains for consistent,
continuous consecutive improvement in EPS and revenue over 8 qtrs)
CQIE (continuous qtr improvement in earning) CYIE (continuous yr improvement in earning) EPS Current FY Est EPS Current FY Yr Ago EPS Current Qtr Est EPS Current Qtr Yr Ago EPS Next FY Est EPS Next Qtr Est EPS Next Qtr Yr Ago EPS TTM HGS Boxes (Earnings classified into a 9 box matrix) P/E High TTM P/E Low TTM P/E on CY Est P/E on Ny Est P/E TTM PEG on CY Est PEG on Ny Est PEG TTM QEPS QEPS Date
Fund-Revenue Revenue data fields useful in identifying revenue strength, change and growth for various periods of time
% 1Yr Rev Gr % 1 Yr Rev Gr (TTM) % 5Yr Rev Gr % Rev Chg % Rev Prev CQIR (continuous qtr improvement in revenue) CYIR (continuous yr improvement in revenue) QREV QREV Date Rev TTM Rev/Share TTM

H G S I n v e s t o r S o f t w a r e U s e r G u i d e
© Copyright 2003-2011 Industry Monitors Page 85 of 89
Category Comment Data for Filters Or Warehouse Spreadsheet Display
Fund-General General Fundamental data fields helpful in identifying various information about fundamentals of stock
% Div Yld % Flt/Shrs Out % Instit % Shrt Int/Flt Analyst B/S Rec Analyst B/S Rec Chg Beta BkVal/Sh Cash Flow Per Share Float Long Term Debt to Equity Ratio Mkt Cap Pr/Book Val Pr/Sales ROE ROE/PE Shrs Out Shrt Int Yrly Div
Industry Data fields that identify the securities industry and market sector
Industry Sector SIC SIC Description
Rankings Data fields that give the rank of a security relative to all the other securities that were in the group being ranked
Combo Ranking – a ranking based on the combined weighted values of several data elements selected by the user
EPS Rank ERG (sum of EPS RK+RS RK+GRP RK) Group Rank RS Rank Raw Combo Ranking Raw EPS Raw Grp Raw RS. Note: Raw values are actual numbers used to compute
the 1-99 rankings. Viewing a sorted display of the raw values provide much more accuracy than looking at the 1-99 percentile rankings.

H G S I n v e s t o r S o f t w a r e U s e r G u i d e
© Copyright 2003-2011 Industry Monitors Page 86 of 89
Category Comment Data for Filters Or Warehouse Spreadsheet Display
Technicals Data fields primarily based on current and historical price and volume information
% A/D % A/D Vel % Cl/17 DMA % Cl/200 DMA % Cl/50 DMA % Cl/52 Hi % Cl/52 Lo % Dem/Sup % Gap % Pr Ch 1-Dy % Pr Ch 10-Dy % Pr Ch 12-Mo % Pr Ch 15 Dy % Ch 21-Dy % Ch 5-Dy % Pr Ch Bgn-Wk % Pr Ch Bgn-Yr % Pr Ch Qtr % Vol/50 DMA vol 17 DMA 200 DMA 30 DMA 50 DMA 50 DMA 1-Dy % Ch 50 DMA Slope 50 DMA Vol 52 Wk Hi Days Since 52 Wk Lo Days Since 52Hi Date 52 Lo Date 52Wk Hi 52Wk Low A/D Dir A/D Dir A/D Vel Dir ADX ADX 1-Dy % Ch ADX Slope Days Close Is High Days Since ADX crossed DI- Days Since ADX crossed DI+ Days Since DI+/DI- Crossover DI+/DI- Crossover Direction High Jump – Identifies extended stocks by looking at
the % Ch from the 17, 50, 200 DMA to the high of the day
Last Close Last Close Net Ch Last Date Last High Last Low Last Vol Up/Down Volume Ratio

H G S I n v e s t o r S o f t w a r e U s e r G u i d e
© Copyright 2003-2011 Industry Monitors Page 87 of 89
Category Comment Data for Filters Or Warehouse Spreadsheet Display
Technicals – S&P500 Ratios
Data fields that show the relative strength of a security to the S&P 500
1-Dy Ch vs S&P 500 5 -Dy Ch vs S&P 500 10-Dy Ch vs S&P 500 12 Mo Ch vs S&P 500 15-Dy Ch vs S&P 500 21-Dy Ch vs S&P 500 Bgn-Wk Ch vs S&P 500 Bgn-Yr Ch vs S&P 500 Qtr Ch vs S&P 500

H G S I n v e s t o r S o f t w a r e U s e r G u i d e
© Copyright 2003-2011 Industry Monitors Page 88 of 89
Appendix C: HGS Chart Indicators The table below shows a partial list of indicators that can be used with HGS Charting. Indicators can be added to any of the chart windows as an overlay using a private scale. .
Category Indicators
Price & Volume Price Volume
Moving Averages Average True Range (ATR) Average True Range Bands Bollinger Bands High Jump MACD Moving Average Moving Average Crossover Moving Average Slope
Momentum % A/D (JAD) Accumulation/Distribution Chaikin A/D Oscillator Chaikin Money Flow On Balance Volume (OBV) TRIX
Relative Strength Relative Strength, Comparative Relative Strength Index (RSI)
Other Additional Security ARMS Index Bear Power Bull Power Commodity Channel Index (CCI) Coppock Directional Movement % Down From High) Force Index Eureka Group Index Rate Of Change (ROC) Spread Stochastic Oscillator StockRSI U/D Volume Ratio Visual Filter Backtest