hidden treasure - pwc
TRANSCRIPT

www.pwc.com
A global study on master data management
Hidden Treasure


Hidden Treasure
A global study on master data management

Hidden Treasure
Published by PricewaterhouseCoopers AG Wirtschaftsprüfungsgesellschaft
By Marcus Messerschmidt and Jan Stüben
With Sven Gehrls, Frederick King, Karina Rode, Phil Schäfer, Paul Sengebusch and Markus Weber (DE); Linda Kates (US); Richard Jhang and Jasper Li (Can); Fernando Román Sandoval and Alfonso Velazquez Tavira (Mex); Romain Gichtenaere and Zouheir Guédri (FR); Xavier Lisoir and Antoine Puget (Lux); Hans Luijendijk (Net); Alexej Freund, Michael Gniffe, Dirk Larisch and Axel Timm (CH); Tolga Baloglu (TR); Patrick Beattie and Geraldine O’Connor (UK); Christoph Obermair and Andreas Plamberger (AT); Sunita Lahiri and Debdas Sen (IN);
November 2011, 104 pages, 93 figures
The results of this survey and the contributions from our experts are meant to serve as a general reference for our clients. For advice on individual cases, please refer to the sources cited in this study or consult one of the PwC contacts listed at the end of the publication. Publications express the opinions of the authors.
All rights reserved. Reproduction, microfilming, storing or processing in electronic media is not allowed without the permission of the publishers.
© November 2011 PricewaterhouseCoopers Aktiengesellschaft Wirtschaftsprüfungsgesellschaft. All rights reserved. In this document “PwC” refers to PricewaterhouseCoopers Aktiengesellschaft Wirtschaftsprüfungsgesellschaft, which is a member firm of PricewaterhouseCoopers International Limited,each member firm of which is a separate legal entity.
Hidden Treasure 5
Preface
Preface
Despite large investments in standardising processes; the development of comprehensive reporting solutions; and the implementation of ERP and other large-scale IT applications, there are still inconsistencies in business processes and IT solutions generating expected benefits. Our comprehensive project experience has shown that our clients regularly face the same challenges. Why? Master data quality has a decisive impact on the quality and efficiency of processes, systems and ultimately, business decisions.
It has also been our experience that companies take very different approaches to designing solutions to address this issue. Yet one thing stands out: although many companies have implemented various master data management initiatives, the majority have enjoyed only limited success.
This limited success, coupled with the growing importance of a high-quality set of master data are what prompted us to launch this study to take a closer look at master data management (MDM) and present our findings in the following publication. It allowed us to test a number of theories we formed during our project experience and to garner new insights on the current trends in master data management.
The study involved conducting interviews with high-ranking representatives of 49 companies spanning 12 countries1 and 8 different industries2 (listed below). Almost one quarter of the companies interviewed in this study had more than 100,000 employees (the largest had up to 400,000). The companies were taken from the following industries:
Automotive: car manufacturers and suppliers•Chemicals & Pharma: manufacturers of chemical and pharmaceutical products•Energy: power companies, raw materials suppliers, energy companies•Financial Services: banks and insurance companies •Industrial Products: manufacturers of industrial goods and facilities•Retail & Consumer: retail companies and manufacturers of consumer goods•Services: service providers, transport and logistics service providers, public •service providers, professional services providers Technology & Telecommunications: telecommunications companies, •manufacturers of high-tech goods, software developers
1 Canada, Germany, France, Great Britain, India, Luxembourg, Mexico, the Netherlands, Austria, Switzerland, Turkey, the USA.
2 The following related industries were combined for statistical reasons and to guarantee anonymity: Chemicals & Pharma, Retail & Consumer, Services, Technology & Telecommunications.

6 Hidden Treasure
We would like to thank the 49 participating companies for providing the information published in this study, and we would also like to thank our PwC colleagues in 12 countries for conducting the interviews and analysing the data which forms the basis of our study.
Düsseldorf and Hamburg, November 2011
Marcus MesserschmidtPartner
Jan StübenSenior Manager
Preface
Hidden Treasure 7
Table of contents
Table of contents
Preface .................................................................................................................... 5
Table of figures........................................................................................................ 8
List of abbreviations ...............................................................................................12
Introduction ...........................................................................................................14
A Key insights ....................................................................................................161 Hypotheses .....................................................................................................172 Success factors for successful MDM ................................................................173 Data quality ....................................................................................................194 Governance and organisation ........................................................................ 255 Processes ....................................................................................................... 286 Information technology ..................................................................................327 Current status and outlook .............................................................................37
B Industry-specific insights ................................................................................391 Automotive .................................................................................................... 402 Chemicals & Pharma ......................................................................................473 Energy ............................................................................................................534 Financial Services ..........................................................................................575 Industrial Products ........................................................................................ 626 Retail & Consumer .........................................................................................677 Services ..........................................................................................................768 Technology & Telecommunications ............................................................... 82
C MDM of the future: Where will the journey take us?.......................................87
D Additional information ...................................................................................911 Participating companies ................................................................................ 922 MDM responsibilities ..................................................................................... 943 Number of MDM systems ................................................................................954 Questions companies struggled to answer ......................................................975 Data quality ................................................................................................... 986 Types of companies ....................................................................................... 99
E Glossary .......................................................................................................100
Contacts ...............................................................................................................102
8 Hidden Treasure
Table of figures
Table of figures
Fig. 1 Success factors for MDM ......................................................................18
Fig. 2 Data quality ratings for all domains .....................................................21
Fig. 3 Average level of data quality with central governance and a central platform ..............................................................................................22
Fig. 4 Degree of governance per data domain ................................................23
Fig. 5 Main problems affecting data quality ..................................................23
Fig. 6 Effectiveness of DQM in relation to level of investment in related initiatives .............................................................................................24
Fig. 7 Effectiveness of own data governance .................................................25
Fig. 8 Different types of MDM responsibilities ...............................................26
Fig. 9 Different types of MDM responsibilities ...............................................27
Fig. 10 Average level of data quality with data governance effectiveness rated 1 compared to data governance effectiveness of 1 with a central data hub ...................................................................................27
Fig. 11 Data quality according to data governance effectiveness and taxonomy structure .............................................................................28
Fig. 12 Motivation for implementing MDM initiatives .....................................29
Fig. 13 Structure of decision-making processes for financial and material and product master data ......................................................................30
Fig. 14 Structure of maintenance processes in different master data domains ...............................................................................................31
Fig. 15 Effectiveness of data governance with CIP ...........................................31
Fig. 16 Average level of data quality with and without CIP ..............................32
Fig. 17 Applications used for MDM ..................................................................33
Fig. 18 Applications used for DQM ..................................................................34
Fig. 19 Applications used for data warehouse and data analysis ......................34
Fig. 20 Level of MDM maturity – Type of MDM architecture and governance ..........................................................................................35
Fig. 21 Reasons for implementing MDM and DQM software ...........................36
Hidden Treasure 9
Table of figures
Fig. 22 Extent to which goals were achieved after tool implementation ...........36
Fig. 23 Amount of time/effort invested in MDM in the last 10 years ................37
Fig. 24 Average level of data quality in the domains ........................................40
Fig. 25 Data volume according to domain ........................................................41
Fig. 26 Percentage of data with quality issues, eg, duplicates, incomplete data records .........................................................................................41
Fig. 27 Main MDM challenges for all domains .................................................42
Fig. 28 Level of MDM maturity ........................................................................42
Fig. 29 Distribution of data taxonomy .............................................................43
Fig. 30 Motivation for implementing MDM......................................................43
Fig. 31 Number of master data systems for material and product data .............44
Fig. 32 Success factors for MDM ......................................................................45
Fig. 33 Comparison of data quality in the chemicals and pharmaceutical industry (all domains) with industry average ......................................48
Fig. 34 Main challenges for MDM according to domain ...................................49
Fig. 35 Motivation for implementing MDM initiatives .....................................50
Fig. 36 Current challenges in maintaining data quality ...................................53
Fig. 37 Taxonomy structures ...........................................................................54
Fig. 38 Structure of decision-making processes ...............................................54
Fig. 39 Implementation of CIP .........................................................................55
Fig. 40 Effectiveness of data governance .........................................................55
Fig. 41 Amount of time/effort invested in MDM initiatives in the last 10 years ...............................................................................................55
Fig. 42 Data quality of customer data ..............................................................59
Fig. 43 Main master data challenges according to domain ..............................59
Fig. 44 Degree of MDM maturity .....................................................................61
Fig. 45 Percentage of product master data with quality issues, eg, duplicates, incomplete data records .......................................................................62
Fig. 46 Percentage of supplier master data with quality issues, eg, duplicates, incomplete data records .......................................................................63
Fig. 47 Criteria for high-quality MDM .............................................................63

10 Hidden Treasure
Table of figures
Fig. 48 Amount of time/effort invested in MDM initiatives in the last 10 years ...............................................................................................64
Fig. 49 Entities responsible for master data management ................................64
Fig. 50 Degree of centralisation of decision-making and maintenance processes for material and product data...............................................65
Fig. 51 Business drivers for MDM ....................................................................66
Fig. 52 Success factors .....................................................................................67
Fig. 53 Number of material and product master data records per company .....69
Fig. 54 Data quality ratings for material and product master data ...................69
Fig. 55 Master data quality across all domains ................................................71
Fig. 56 Degree of data ownership according to domain ...................................71
Fig. 57 Effectiveness of data governance structures ........................................72
Fig. 58 Success factors for MDM ......................................................................72
Fig. 59 Employees involved in maintaining material and product data ............73
Fig. 60 Employees involved in maintaining supplier data ................................73
Fig. 61 Use of data repositories ........................................................................74
Fig. 62 Main problems – according to domain .................................................75
Fig. 63 Number of master data records according to domain ...........................77
Fig. 64 Data quality according to domain ........................................................78
Fig. 65 Redundant data records .......................................................................78
Fig. 66 Main MDM problems ...........................................................................79
Fig. 67 Taxonomies in the services industry ....................................................79
Fig. 68 Motivation for implementing MDM......................................................80
Fig. 69 Amount of time/effort invested in MDM initiatives in the last 10 years ...............................................................................................81
Fig. 70 Average level of data quality according to domain ...............................83
Fig. 71 Challenges in maintaining data quality in all domains ........................83
Fig. 72 Average degree of definition of data ownership ...................................84
Fig. 73 Average degree of definition of data ownership in companies with a defined data governance role ...............................................................84
Hidden Treasure 11
Table of figures
Fig. 74 Degree of centralisation for decision-making and maintenance processes for financial master data ......................................................85
Fig. 75 Criteria for implementing software ......................................................86
Fig. 76 Future challenges for MDM .................................................................88
Fig. 77 Geographic distribution of participating companies ............................92
Fig. 78 Industry distribution of participating companies .................................93
Fig. 79 Size of participating companies ...........................................................93
Fig. 80 Entity responsible for MDM .................................................................94
Fig. 81 Breakdown of MDM responsibilities according to industry ..................94
Fig. 82 Number of systems containing master data according to domain .........95
Fig. 83 Average number of MDM systems per company ...................................96
Fig. 84 Number of systems containing master data according to size of company ..........................................................................................96
Fig. 85 Number of companies able to respond to certain questions on data quality .................................................................................................97
Fig. 86 Data quality of individual domains, according to size of company .......98
Fig. 87 Legal form of participating companies .................................................99
Fig. 88 Percentage of listed companies according to stock exchange ...............99

12 Hidden Treasure
List of abbreviations
List of abbreviations
BI business intelligence
BO BusinessObjects
BU business unit
BW business intelligence warehouse
CFO chief financial officer
CIO chief information officer
CRM customer relationship management
DIN Deutsche Industrie-Norm (German industrial standard)
DQM data quality management
EAN European Article Number
EDM energy data management
ERP enterprise resource planning
FTE full-time equivalent
GTIN Global Trade Item Number
HR human resources
n/a not applicable
KPI key performance indicator
CIP continuous improvement process
M&A mergers & acquisitions
MDM master data management
NYSE New York Stock Exchange
LSE London Stock Exchange
RFID radio frequency identification
SCoA standard chart of accounts
SDP system development process

Hidden Treasure 13
List of abbreviations
SBU strategic business unit
TSE Toronto Stock Exchange
UNSPSC United Nations Standard Products and Services Code
VDA Verband der Automobilindustrie (German Association of the Automotive Industry)
14 Hidden Treasure
Introduction
Introduction
The information presented in this study was gathered from 49 companies spanning 8 different industries in 12 countries. We chose to conduct our survey via an interview-based approach. The interviews with Managing Directors, CIOs (chief information officers) and other key decision-makers were generally several hours long which allowed us to gain both quantitative and qualitative insights into the participating companies. This approach gave the interviewees the opportunity to discuss their individual experiences at length, promising both participants and readers a greater level of understanding about the MDM practices in their company.
We understand MDM to encompass a broad framework comprising data governance, processes for creating and maintaining data, clear allocation of responsibilities, documented rules and standards, as well as appropriate IT support (that is IT that extends beyond the usual interpretation of purely technical or systems-oriented services).
The interviews focused on the following five main areas of master data management:
Data quality•Data governance•Processes•Information technology•Current status and outlook•
Of these five areas, particular attention has been given to data governance and the organisation it subsequently entails, as this aspect will create the organisational framework for each of the other MDM areas. Because the term governance often appears in a variety of contexts, it can also be understood to mean different things. For this reason we would like to preface this study with the definition of governance that we used in the interviews:
Our analysis of the interviews revealed a number of noteworthy issues that we believe are relevant for companies in all industries. These insights are presented in the first chapter to give you a clear overview of the most relevant conclusions.
Governance in the context of master data management describes all organisational structures, organisational units, processes, rules, management principles and management elements that have been established to implement a master data management system.

Hidden Treasure 15
Introduction
In Chapter B, we discuss all industry-specific results in detail. Although the data clearly indicates certain tendencies and trends, it is important to remember that the survey can only be viewed as representative to a limited extent, given that a total of 49 companies participated.
In Chapter C, we place the insights gleaned during the interviews in the context of new technologies, innovations and social media to offer a broader perspective on the future of master data management.
Chapter D concludes the study with further information and statistics on the participant structure of the surveyed companies to give you a deeper understanding of the insights presented here.

16 Hidden Treasure
Key insights
A Key insights

Hidden Treasure 17
Key insights
1 Hypotheses
In designing our study we developed ten hypotheses across our five focal MDM areas: information technology, organisation, the level of data management maturity, the causes of data quality problems and the business case for MDM. These ten hypotheses served as the basis for the questionnaire and interviews and will be examined during the course of the study.
Information technologyFor the majority of companies the use of IT applications has only partially solved •data management issues.
Governance and organisationCompanies that explicitly create a master data stewardship programme are •significantly more successful in terms of data governance.Data governance is embedded in existing governance structures.•Few companies have established independent, cross-process and cross-functional •data governance boards.
Level of data management maturityThe level of maturity varies across the five MDM areas when considering master •data governance and IT implementation to support MDM initiatives. The management of material and HR master data have the highest level of •maturity while financial and customer master data have the lowest.
Causes of data quality issuesData inconsistencies are caused by the distribution of data ownership across •different business and function areas and across different IT systems.Communication between the relevant areas is often inadequate and the •maintenance processes are often not clearly defined.
Business case for MDMBusiness case calculations for MDM initiatives are generally based solely on •increasing efficiency in MDM and tend to ignore benefits outside of MDM processes.The benefits that master data management creates for business processes remain •abstract and are not systematically tracked or measured.
2 Success factors for successful MDM
One of the main qualitative aspects that was addressed during the interviews was the question of which success factors play a part in establishing an effective MDM system. The results appear to confirm one of our hypotheses:
For the majority of companies, the use of IT applications has only partially solved data management issues, if at all.
Just 27% of the respondents considered the implementation of a state-of-the-art MDM solution to be a success factor.

18 Hidden Treasure
Key insights
This graph also shows that successful MDM should not be viewed as a purely technological issue. What is more critical in determining the success of MDM initiatives are the following four factors:
Management’s commitment to the project•Structured and goal-oriented governance•Process optimisation•Time and budget•
Management’s commitment to the projectTo ensure lasting success an MDM initiative must be established and be actively supported by a company’s top management. In our experience measurable benefits from MDM projects are generally noticeable over the long term. If management does not remain committed to the MDM project the initiative may fall by the wayside and be at risk for budget and staff cuts.
For this reason it is essential that management understand how the quality of the data impacts the quality and efficiency of processes and also how it may affect the observance of compliance guidelines. In turn, management must convey the importance of master data quality and efficient data retrieval to employees, explaining how data quality affects processes and how it can impact the overall success of the company.
Structured and goal-oriented governanceIn order to ensure consistent high quality in master data sets over the longer term each company needs to have a governance structure in place that reflects its individual MDM objectives, needs and business model.
State-of-the-art-IT
27.0%
69.0%
Time
49.0%
Budget
33.0%
Other
10.0%
60.0%
Optimised processes
71.0%
Revised governance
Fig. 1 Success factors for MDM
Multiple answers were possible
Good manage-
ment
Hidden Treasure 19
Key insights
This requires the establishment or expansion of organisational structures in the MDM system that:
explicitly define responsibilities along the chain of MDM operational processes;•develop dedicated governance elements, such as data stewards, data councils, etc;•develop and communicate appropriate guidelines and rules to embed the •governance changes across the entire company;define appropriate data quality KPIs and monitor the achievement of established •MDM objectives to reflect governance practices; anddefine packages of MDM responsibilities, including processes for collecting, •recording and managing data, processes of change for data structures or data quality management, and reporting processes.
Process optimisationAnother significant factor affecting the success of MDM is business process optimisation. Two reasons can be attributed to this, the first being that MDM can only be managed efficiently when a company’s core processes, manufacturing, distribution and accounting are conducted efficiently with a sufficient level of quality. If there is a duplication of effort or if there are gaps in the processes, these oversights are likely to result in redundant or inconsistent data. The second reason is the MDM processes themselves – that is, the entry, management and deletion of data – need to be optimised so the data can be efficiently processed with traceability and all changes accordingly documented. Gaps in MDM processes result not only in inefficiency but also in compliance issues such as missing data histories.
Time and budgetProject timelines and budgets also play a decisive role in successful outcomes. In general MDM initiatives rarely provide short-term benefits. It takes some time before the benefits are visible in business processes. Companies should not underestimate the time required to analyse and optimise data quality. After all, optimising master data will affect almost every business process in the company.
Essentially an MDM initiative should be seen as an investment towards a more efficient company infrastructure which underpins all operational and organi-sational processes across the business. When a business case is drawn up, which should be a requirement to any MDM implementation, it is important to ensure that all benefits are factored in, including those that are initially indirect and difficult to measure.
3 Data quality
The issue of quality among the individual data domain areas is the central indicator for data analysis, and it also serves as a reference in evaluating the other main aspects of MDM. Data quality and MDM are inextricably linked. The close connection between the two exists to the same extent across all industries although priorities in data quality management (DQM) do vary by industry (this will be discussed in further detail in the following chapter).

20 Hidden Treasure
Key insights
DQM and MDM: two sides of the same coinDQM comprises processes, tools and methods used to analyse and cleanse data. In contrast to MDM, DQM does entail any central storage, standar-disation and administration of data. Instead it focuses on analysing, testing, evaluating and, when necessary, cleansing data to ensure its quality.
DQM and MDM are complementary concepts: if data quality is low there is limited acceptance of MDM and without the uniform standards, structures and governance provided by MDM, data quality is not be guaranteed in long term.
DQM tools are often used to update and complete address data. Algorithms are used to identify redundant data entries, which can then be deleted as required. Data can be kept up-to-date by feeding data from external providers into DQM tools. Various companies such as Acxiom, Dun & Bradstreet, Europages and Uniserv, offer solutions that provide the latest company addresses, postcodes and credit ratings.
MDM solution providers offer integrated DQM solutions as well. A good example is SAP’s 2008 acquisition of BusinessObjects (BO) which paired SAP’s MDM solution with BO’s DQM tools. Another example is IBM’s InfoSphere product line which combines DQM processes such as data validations and duplicate checks, with a central MDM application.
Finally, DQM can also provide successful results when used for conventional data analysis. There are a number of conventional, cost-efficient solutions available such as Microsoft Access.
A good example of how data quality can impact MDM can be found in the creation and maintenance of customer data which represents a significant part of the sales process. Data quality is a significant factor in the overall efficiency of the sales process. This is the case for just about every company, regardless of industry. The influence of master data processes on other business processes is just as significant: inconsistencies in the master data set will directly affect the performance and quality of all processes that use it.
An interviewee from one of the companies participating in our survey noted that “MDM is an essential infrastructure requirement to ensure high process efficiency”.
During the interviews, participants were asked to give a subjective evaluation of the quality of their company’s data. They could rate the data domain areas for material and product data, customer master data, supplier master data, financial master data and HR master data on a scale of 1 (very good ) to 5 (poor). They were also asked to make quantitative statements about the number of duplicates or the completeness of the master data.
Mediocre data quality across all domains
Hidden Treasure 21
Key insights
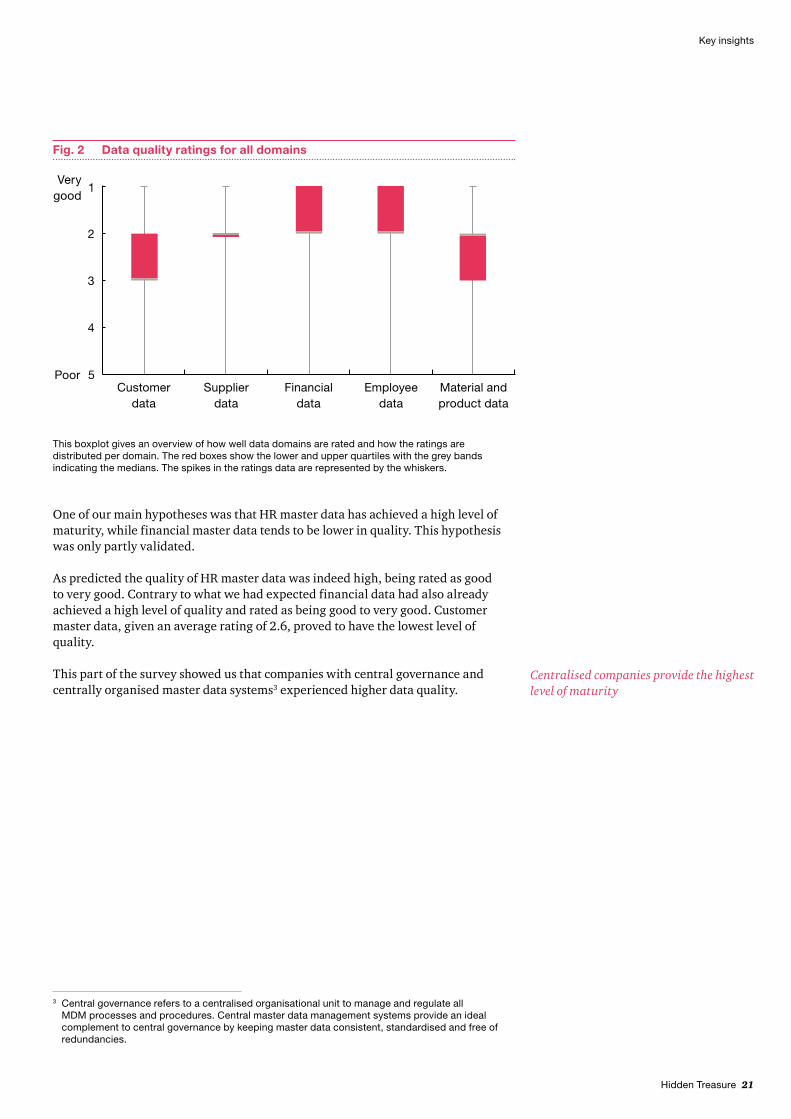
One of our main hypotheses was that HR master data has achieved a high level of maturity, while financial master data tends to be lower in quality. This hypothesis was only partly validated.
As predicted the quality of HR master data was indeed high, being rated as good to very good. Contrary to what we had expected financial data had also already achieved a high level of quality and rated as being good to very good. Customer master data, given an average rating of 2.6, proved to have the lowest level of quality.
This part of the survey showed us that companies with central governance and centrally organised master data systems3 experienced higher data quality.
Centralised companies provide the highest level of maturity
3 Central governance refers to a centralised organisational unit to manage and regulate all MDM processes and procedures. Central master data management systems provide an ideal complement to central governance by keeping master data consistent, standardised and free of redundancies.
Fig. 2 Data quality ratings for all domains
Material and product data
Supplier data
Employee data
Financial data
Customer data
4
3
2
5
1 Very
good
Poor
This boxplot gives an overview of how well data domains are rated and how the ratings are distributed per domain. The red boxes show the lower and upper quartiles with the grey bands indicating the medians. The spikes in the ratings data are represented by the whiskers.
22 Hidden Treasure
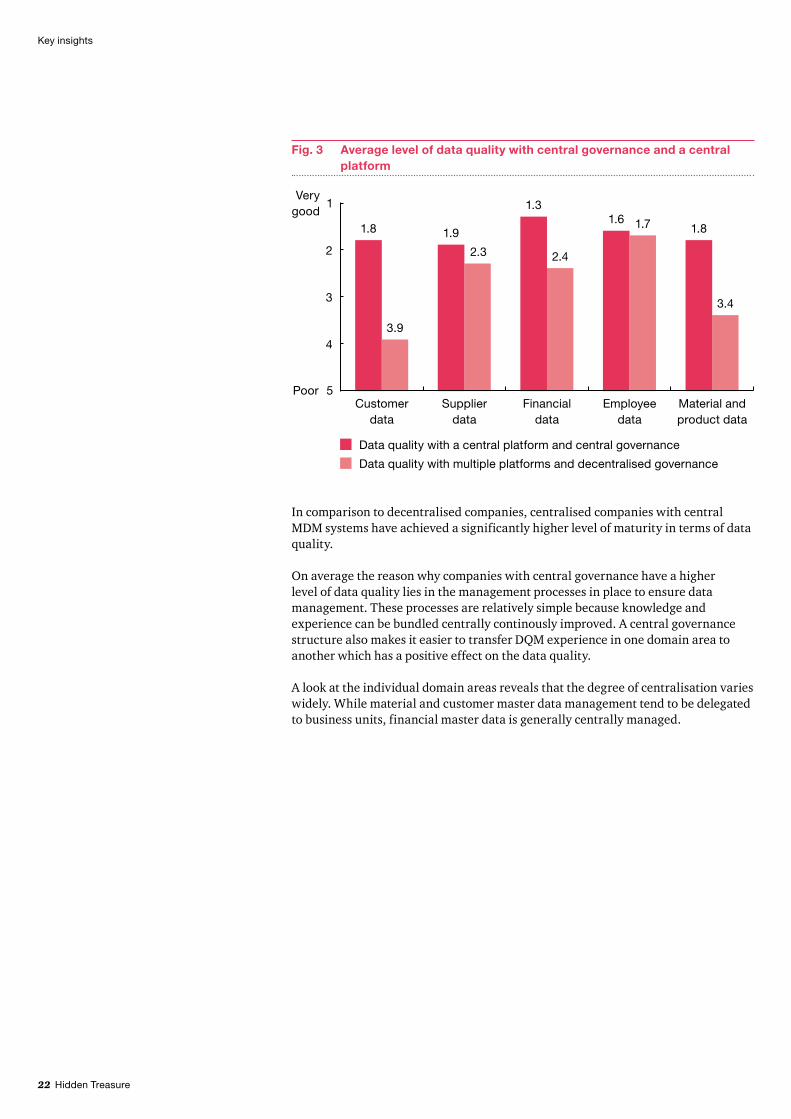
In comparison to decentralised companies, centralised companies with central MDM systems have achieved a significantly higher level of maturity in terms of data quality.
On average the reason why companies with central governance have a higher level of data quality lies in the management processes in place to ensure data management. These processes are relatively simple because knowledge and experience can be bundled centrally continously improved. A central governance structure also makes it easier to transfer DQM experience in one domain area to another which has a positive effect on the data quality.
A look at the individual domain areas reveals that the degree of centralisation varies widely. While material and customer master data management tend to be delegated to business units, financial master data is generally centrally managed.
Fig. 3 Average level of data quality with central governance and a central platform
Data quality with a central platform and central governance
Data quality with multiple platforms and decentralised governance
Customer data
1.8
3.9
Financial data
1.3
2.4
Employee data
1.6 1.7
Material and product data
3.4
1.8
Supplier data
2.3
1.9
4
3
2
5
1 Very
good
Poor
Key insights

Hidden Treasure 23
Key insights
The information supports another one of our hypotheses: the level of MDM maturity varies between different domain areas based on the criteria for master data governance and IT implementation.
This insight comes as no surprise but the different treatment of the data domain areas does indicate the cause of problems, or specific requirements in the business model, which makes it relevant for benchmarking purposes.
In addition to asking interviewees about the level of data quality in their companies, we also asked them to describe the main challenges they saw in maintaining master data quality. For each of the five domain areas, the companies identified the aspects of data quality they saw as the weakest.
The main problem: keeping data up-to-date and complete
58.0%
Correctness
56.0%
Consistency
36.0%
Validity
78.0%
Completeness
83.0%
Data currency
Fig. 5 Main problems affecting data quality
Multiple answers were possible
Fig. 4 Degree of governance per data domain
Customer data
2.6
Employee data
2.0
Material and product
data
2.9
2.1
Supplier data
1.7
Financial data
1
2
3
4
5Devolved
Central

24 Hidden Treasure
The results showed that investments in DQM made it more effective and that this effectiveness grew disproportionately with significant investments.
We expect that the number and the size of investments in MDM and data quality will continue to grow in the future since very high master data quality within a company is currently the exception. We see a clear need for optimisation, particularly in terms of making sure data is current and complete.
Companies often have master data that is old or has not been properly maintained. According to the interviewees the most important aspect to focus on is keeping data complete and up-to-date.
Why do companies find it so difficult to keep data current? They often have very large quantities of data to begin with and regularly generate large volumes of new data. As the amount of master data continues to grow so does the effort required to keep it updated. A similar problem arises when trying to make sure data is complete. A lack of initial quality control allows incomplete master data elements into the system. Given the growing volume of total data it becomes very time-consuming to make sure all data is complete.
Another important aspect of our survey was the level of investment in DQM. For our purposes an investment encompasses any kind of effort invested in improving MDM (eg. new projects, new IT systems or additional staff training). In seperate questions, we asked participants how much they had invested in projects in recent years and how effective they considered their data quality organisation to be. An analysis of their responses revealed an interesting correlation.
Large investments lead to large increases in efficiency
Fig. 6 Effectiveness of DQM in relation to level of investment in related initiatives
DQ
M e
ffec
tiven
ess
Very good
Low1
Very high5
Low4 3 2
Level of investment
4
3
2
5
1
Trend line
Key insights
Hidden Treasure 25
Key insights
“Quality at source” – quality standards for financial master dataCompared to other master data domain areas, financial master data occupies a special position in companies. Financial master data is usually managed by its own department, is rarely the focus of traditional MDM projects, and is interpreted differently by companies. Classic financial master data includes information from accounting, the group’s chart of accounts and the charts of accounts for the group’s individual operative companies, debtors, creditors and facilities. It also includes controlling elements like cost centres, profit centres, projects and internal orders.
Due to a large number of legal and often global reporting requirements, the charts of accounts are particularly important for a company’s finance function. However many companies have a number of different charts of accounts often developed over a number of years, that are used for their operative businesses. In such a varied data landscape indicators to measure quality such as complete ness, transparency, consistency and integrity, can rarely be implemented efficiently.
The solution to this problem lies in a group-wide standard chart of accounts (SCOA). Following the principle of “quality at source”, a SCOA allows companies to anchor all of the management and reporting information that is essential for the finance function in the operative ERP systems. On the one hand the standard chart of accounts lists the reporting attributes relevant for all of the group’s companies to the level of detail required by the regulator. On the other hand, the system still allows individual companies some freedom to add country- or company-specific requirements. Additionally, a standard chart of accounts makes it possible to establish a standardised, IT-supported maintenance and development process so that companies can integrate new reporting requirements in all operative charts of accounts quickly, efficiently and for the longer term.
4 Governance and organisation
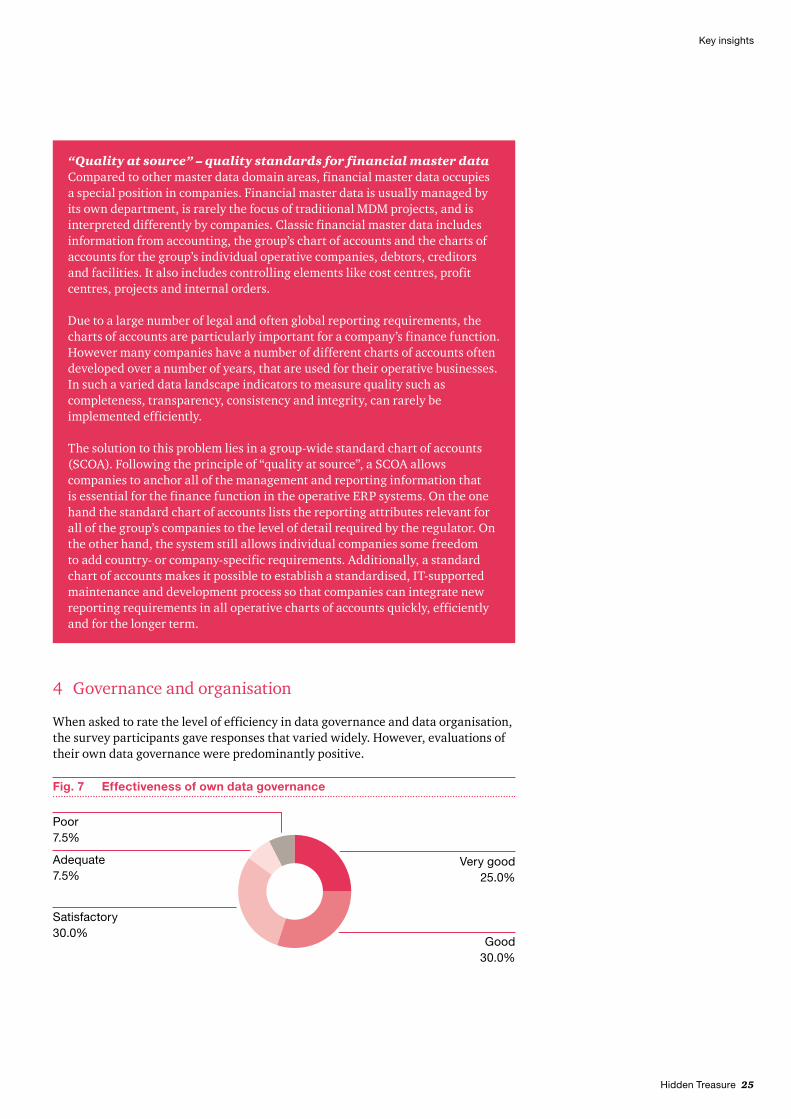
When asked to rate the level of efficiency in data governance and data organisation, the survey participants gave responses that varied widely. However, evaluations of their own data governance were predominantly positive.
Adequate 7.5%
Very good 25.0%
Good 30.0%
Satisfactory 30.0%
Poor 7.5%
Fig. 7 Effectiveness of own data governance
26 Hidden Treasure
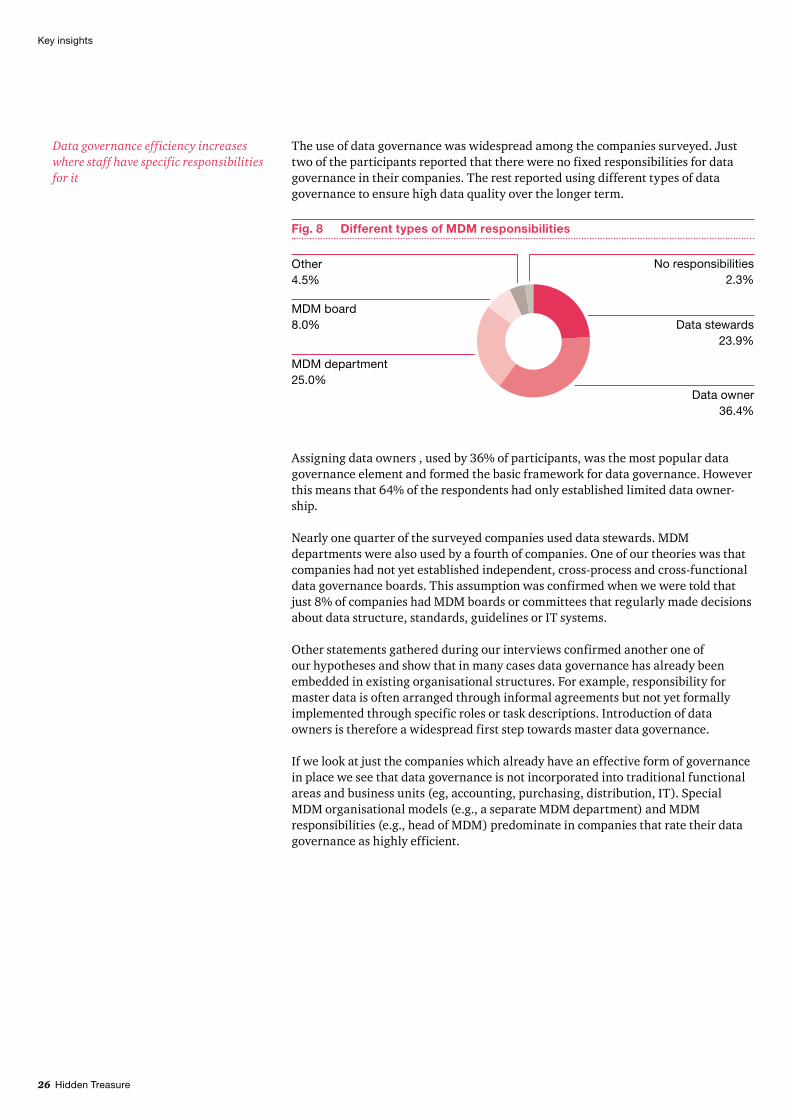
The use of data governance was widespread among the companies surveyed. Just two of the participants reported that there were no fixed responsibilities for data governance in their companies. The rest reported using different types of data governance to ensure high data quality over the longer term.
Data governance efficiency increases where staff have specific responsibilities for it
Fig. 8 Different types of MDM responsibilities
Other 4.5%
No responsibilities 2.3%
Data owner 36.4%
Data stewards 23.9%
MDM board 8.0%
MDM department 25.0%
Assigning data owners , used by 36% of participants, was the most popular data governance element and formed the basic framework for data governance. However this means that 64% of the respondents had only established limited data owner-ship.
Nearly one quarter of the surveyed companies used data stewards. MDM departments were also used by a fourth of companies. One of our theories was that companies had not yet established independent, cross-process and cross-functional data governance boards. This assumption was confirmed when we were told that just 8% of companies had MDM boards or committees that regularly made decisions about data structure, standards, guidelines or IT systems.
Other statements gathered during our interviews confirmed another one of our hypotheses and show that in many cases data governance has already been embedded in existing organisational structures. For example, responsibility for master data is often arranged through informal agreements but not yet formally implemented through specific roles or task descriptions. Introduction of data owners is therefore a widespread first step towards master data governance.
If we look at just the companies which already have an effective form of governance in place we see that data governance is not incorporated into traditional functional areas and business units (eg, accounting, purchasing, distribution, IT). Special MDM organisational models (e.g., a separate MDM department) and MDM responsibilities (e.g., head of MDM) predominate in companies that rate their data governance as highly efficient.
Key insights
Hidden Treasure 27
Key insights
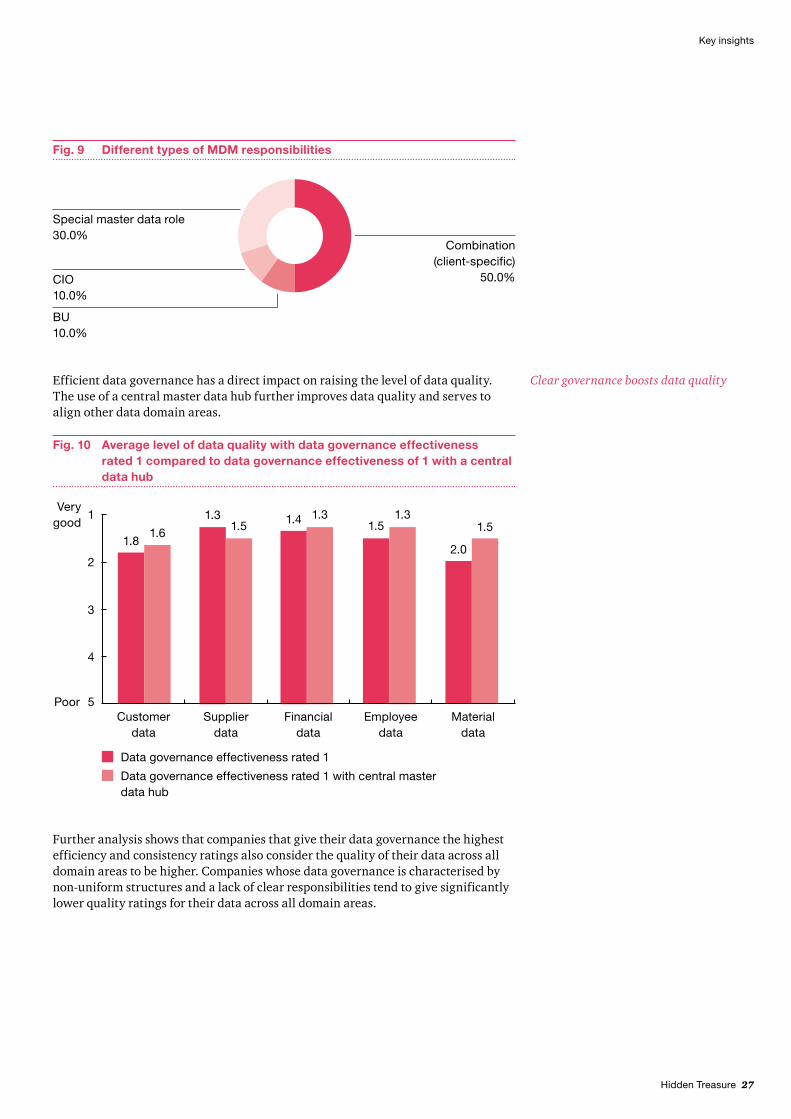
Further analysis shows that companies that give their data governance the highest efficiency and consistency ratings also consider the quality of their data across all domain areas to be higher. Companies whose data governance is characterised by non-uniform structures and a lack of clear responsibilities tend to give significantly lower quality ratings for their data across all domain areas.
Fig. 10 Average level of data quality with data governance effectiveness rated 1 compared to data governance effectiveness of 1 with a central data hub
4
3
2
Data governance effectiveness rated 1
Data governance effectiveness rated 1 with central masterdata hub
Customer data
1.81.6
Supplier data
1.31.5
Financial data
1.31.4
Employee data
1.51.3
Material data
2.0
1.5
5
1 Very
good
Poor
Efficient data governance has a direct impact on raising the level of data quality. The use of a central master data hub further improves data quality and serves to align other data domain areas.
Clear governance boosts data quality
Fig. 9 Different types of MDM responsibilities
CIO 10.0%
Special master data role 30.0%
Combination (client-specific)
50.0%
BU 10.0%
28 Hidden Treasure
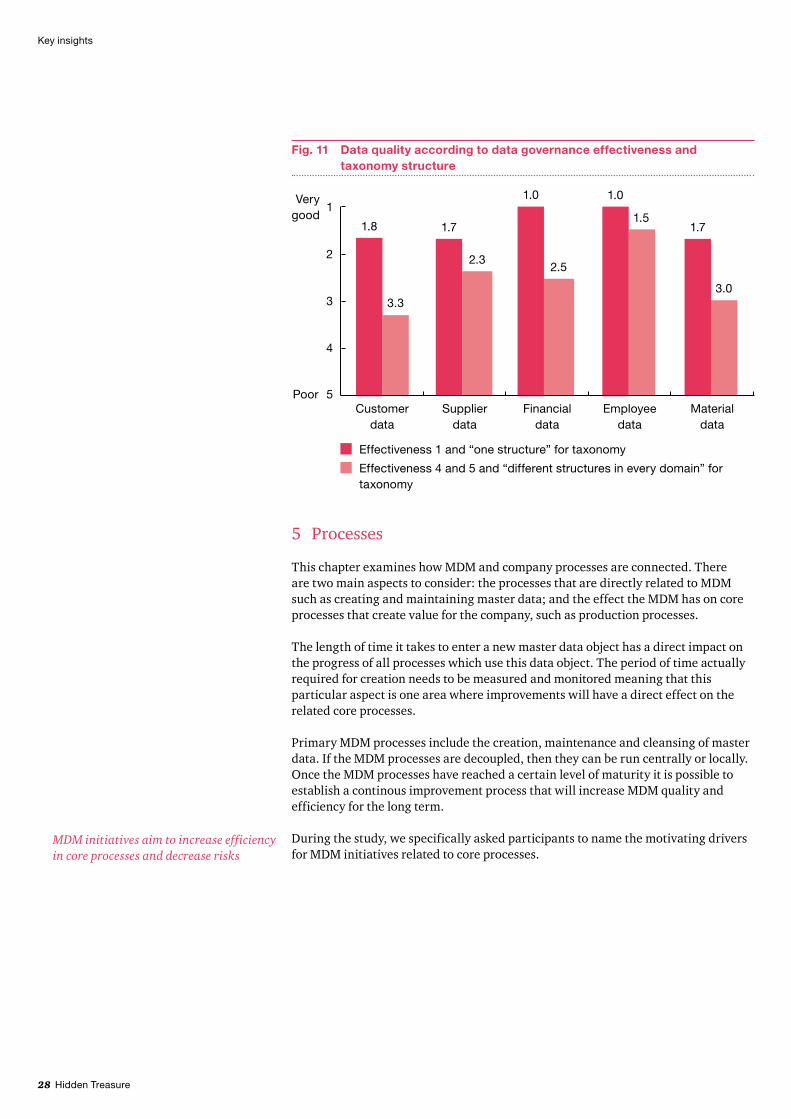
Fig. 11 Data quality according to data governance effectiveness and taxonomy structure
4
3
2
Effectiveness 1 and “one structure” for taxonomy
Effectiveness 4 and 5 and “different structures in every domain” for taxonomy
Material data
1.7
3.0
Employee data
1.0
1.5
Financial data
1.0
2.5
Supplier data
1.7
2.3
Customer data
1.8
3.3
5
1 Very
good
Poor
5 Processes
This chapter examines how MDM and company processes are connected. There are two main aspects to consider: the processes that are directly related to MDM such as creating and maintaining master data; and the effect the MDM has on core processes that create value for the company, such as production processes.
The length of time it takes to enter a new master data object has a direct impact on the progress of all processes which use this data object. The period of time actually required for creation needs to be measured and monitored meaning that this particular aspect is one area where improvements will have a direct effect on the related core processes.
Primary MDM processes include the creation, maintenance and cleansing of master data. If the MDM processes are decoupled, then they can be run centrally or locally. Once the MDM processes have reached a certain level of maturity it is possible to establish a continous improvement process that will increase MDM quality and efficiency for the long term.
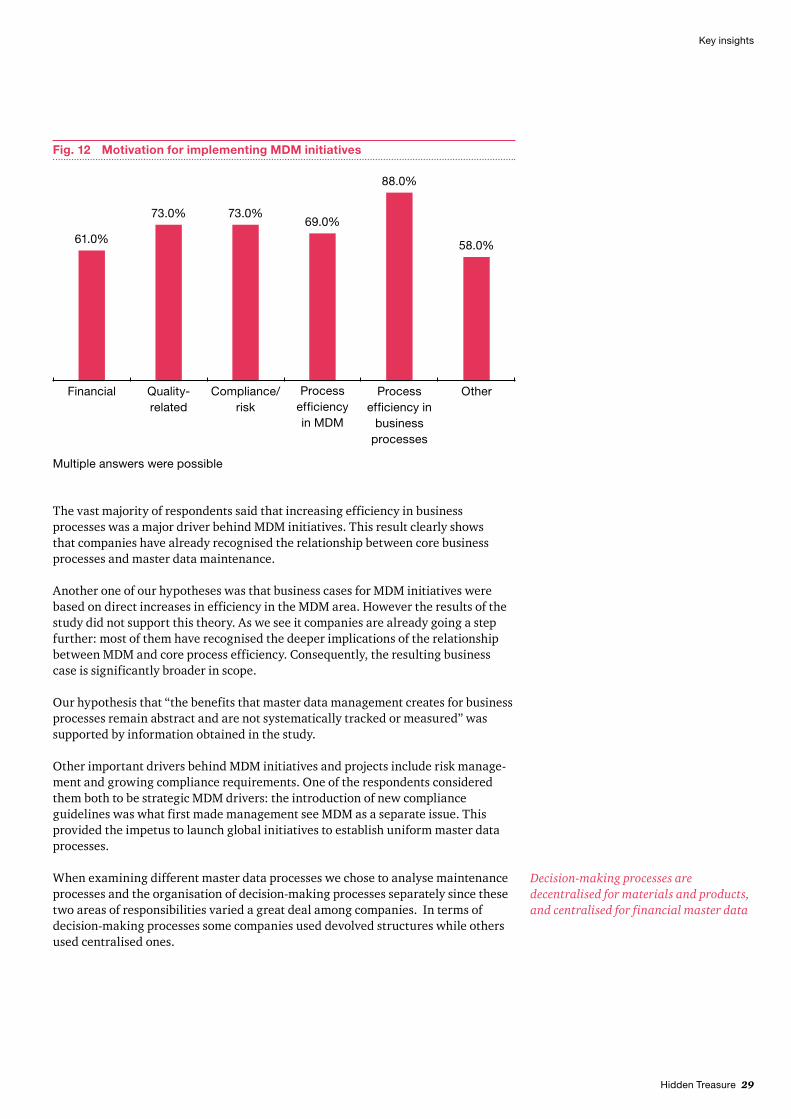
During the study, we specifically asked participants to name the motivating drivers for MDM initiatives related to core processes.
MDM initiatives aim to increase efficiency in core processes and decrease risks
Key insights
Hidden Treasure 29
Key insights
Fig. 12 Motivation for implementing MDM initiatives
Financial Process efficiency in MDM
Quality-related
Compliance/risk
Other
61.0%69.0%
73.0% 73.0%
58.0%
88.0%
Process efficiency in
business processes
Multiple answers were possible
The vast majority of respondents said that increasing efficiency in business processes was a major driver behind MDM initiatives. This result clearly shows that companies have already recognised the relationship between core business processes and master data maintenance.
Another one of our hypotheses was that business cases for MDM initiatives were based on direct increases in efficiency in the MDM area. However the results of the study did not support this theory. As we see it companies are already going a step further: most of them have recognised the deeper implications of the relationship between MDM and core process efficiency. Consequently, the resulting business case is significantly broader in scope.
Our hypothesis that “the benefits that master data management creates for business processes remain abstract and are not systematically tracked or measured” was supported by information obtained in the study.
Other important drivers behind MDM initiatives and projects include risk manage-ment and growing compliance requirements. One of the respondents considered them both to be strategic MDM drivers: the introduction of new compliance guidelines was what first made management see MDM as a separate issue. This provided the impetus to launch global initiatives to establish uniform master data processes.
When examining different master data processes we chose to analyse maintenance processes and the organisation of decision-making processes separately since these two areas of responsibilities varied a great deal among companies. In terms of decision-making processes some companies used devolved structures while others used centralised ones.
Decision-making processes are decentralised for materials and products, and centralised for financial master data
30 Hidden Treasure
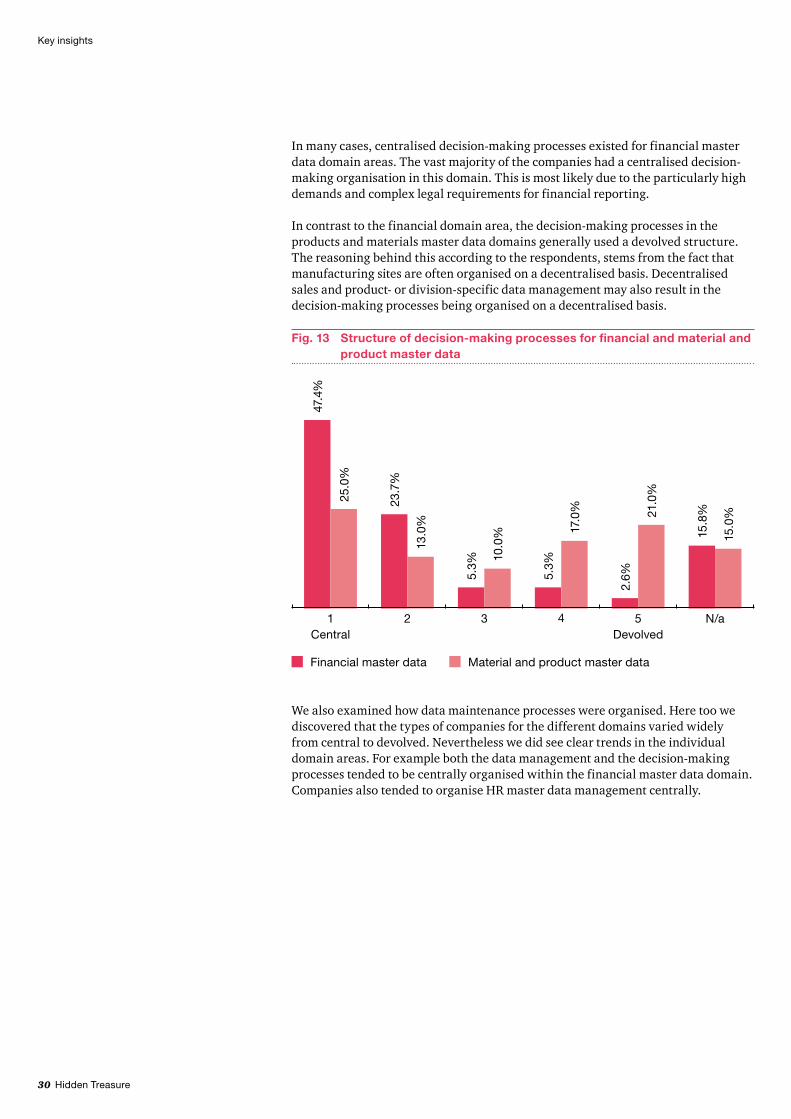
In many cases, centralised decision-making processes existed for financial master data domain areas. The vast majority of the companies had a centralised decision-making organisation in this domain. This is most likely due to the particularly high demands and complex legal requirements for financial reporting.
In contrast to the financial domain area, the decision-making processes in the products and materials master data domains generally used a devolved structure. The reasoning behind this according to the respondents, stems from the fact that manufacturing sites are often organised on a decentralised basis. Decentralised sales and product- or division-specific data management may also result in the decision-making processes being organised on a decentralised basis.
Fig. 13 Structure of decision-making processes for financial and material and product master data
47.4
%
25.0
%
23.7
%
13.0
%
5.3%
10.0
%
5.3%
17.0
%
2.6%
21.0
%
15.8
%
15.0
%
1 Central
2 3 4 5 Devolved
N/a
Financial master data Material and product master data
We also examined how data maintenance processes were organised. Here too we discovered that the types of companies for the different domains varied widely from central to devolved. Nevertheless we did see clear trends in the individual domain areas. For example both the data management and the decision-making processes tended to be centrally organised within the financial master data domain. Companies also tended to organise HR master data management centrally.
Key insights
Hidden Treasure 31
Key insights
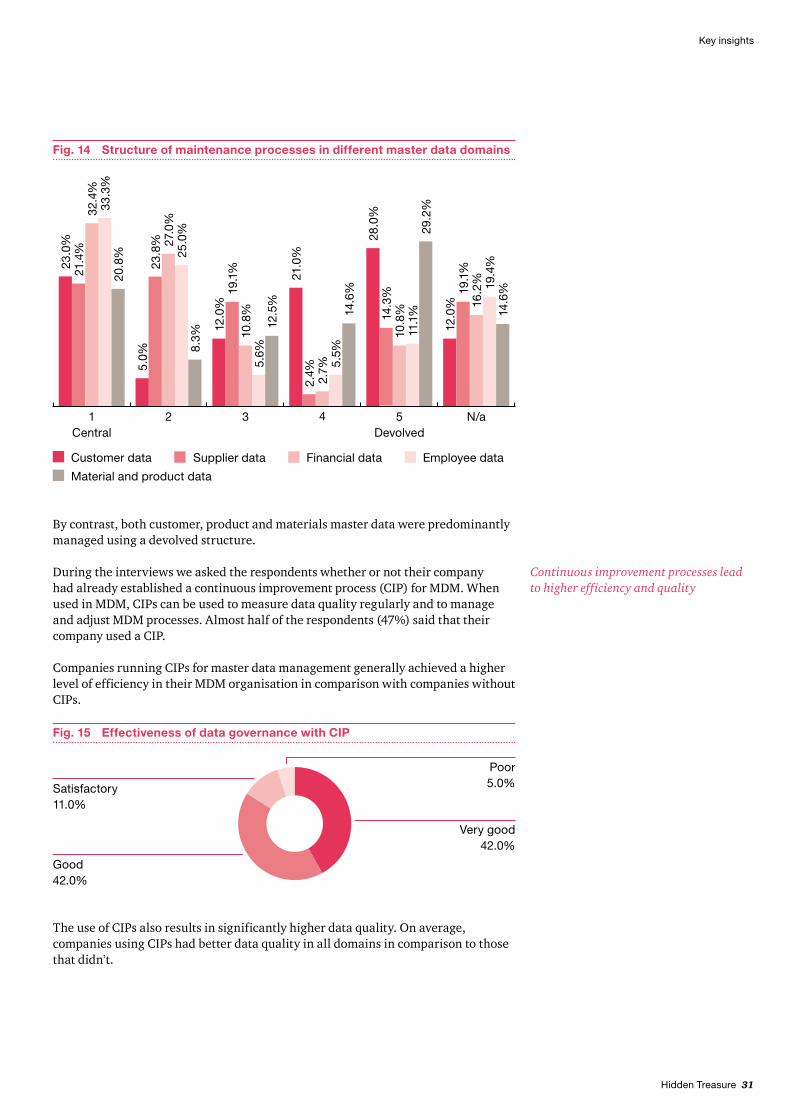
The use of CIPs also results in significantly higher data quality. On average, companies using CIPs had better data quality in all domains in comparison to those that didn’t.
Fig. 15 Effectiveness of data governance with CIP
Satisfactory 11.0%
Poor 5.0%
Very good42.0%
Good 42.0%
By contrast, both customer, product and materials master data were predominantly managed using a devolved structure.
During the interviews we asked the respondents whether or not their company had already established a continuous improvement process (CIP) for MDM. When used in MDM, CIPs can be used to measure data quality regularly and to manage and adjust MDM processes. Almost half of the respondents (47%) said that their company used a CIP.
Companies running CIPs for master data management generally achieved a higher level of efficiency in their MDM organisation in comparison with companies without CIPs.
Continuous improvement processes lead to higher efficiency and quality
Fig. 14 Structure of maintenance processes in different master data domains
33.3
%32
.4%
21.4
%23
.0%
20.8
%
1 Central
25.0
%27
.0%
23.8
%5.
0%
8.3%
2
5.6%
10.8
%19
.1%
12.0
%
12.5
%
3
5.5%
2.7%
2.4%
21.0
%
14.6
%
411
.1%
10.8
%14.3
%28
.0%
29.2
%5
Devolved
19.4
%16
.2%
19.1
%12
.0%
14.6
%
N/a
Financial data Employee dataSupplier data
Material and product data
Customer data

32 Hidden Treasure
The results of the survey show that the participating companies recognise the connection between core processes and master data management. They also listed increasing efficiency in core processes as the biggest motivation for launching MDM initiatives.
Overall, it can be seen that centralising decision-making processes in MDM increases both quality and efficiency. However there does not appear to be any one industry- or domain-wide approach to organising MDM. In order to maintain successful MDM companies need to employ a customised solution that is specifically designed to fit their structure and organisation.
Having clearly defined MDM processes and continuously improving the processes makes a significant contribution to quality and efficiency over the longer term. Companies that have realised this and implemented the necessary processes achieve a significantly higher level of data quality.
6 Information technology
Over the course of this study we investigated how companies used information technology to support MDM. We were particularly curious to understand whether companies were already using special MDM software and we wanted to know which tools they favoured, given the large number of software products available in this market segment.
Customised approaches increase efficiency
Fig. 16 Average level of data quality with and without CIP
4
3
2
Customer data
2.1
3.1
Supplier data
1.9
2.5
Financial data
2.2
1.5
Employee data
2.01.8
Material and product data
2.1
2.9
With CIP Without CIP
5
1 Very
good
Poor
Key insights
Hidden Treasure 33
Key insights
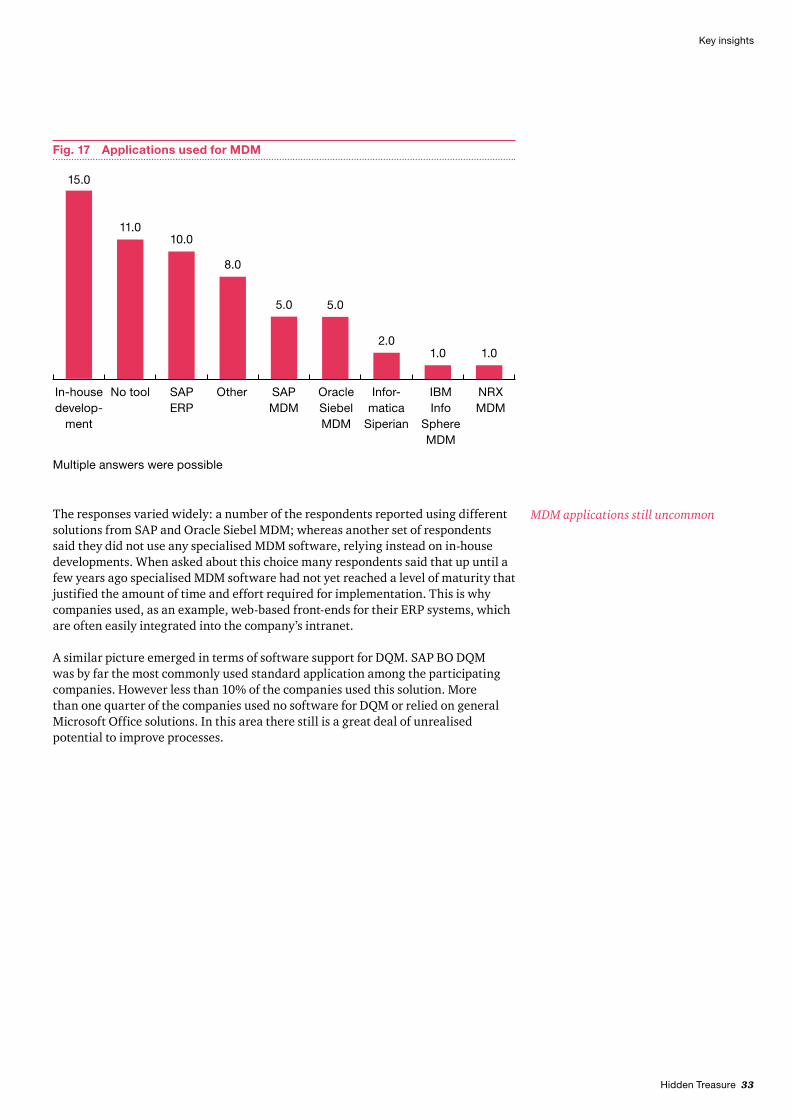
The responses varied widely: a number of the respondents reported using different solutions from SAP and Oracle Siebel MDM; whereas another set of respondents said they did not use any specialised MDM software, relying instead on in-house developments. When asked about this choice many respondents said that up until a few years ago specialised MDM software had not yet reached a level of maturity that justified the amount of time and effort required for implementation. This is why companies used, as an example, web-based front-ends for their ERP systems, which are often easily integrated into the company’s intranet.
A similar picture emerged in terms of software support for DQM. SAP BO DQM was by far the most commonly used standard application among the participating companies. However less than 10% of the companies used this solution. More than one quarter of the companies used no software for DQM or relied on general Microsoft Office solutions. In this area there still is a great deal of unrealised potential to improve processes.
MDM applications still uncommon
In-house develop -
ment
Fig. 17 Applications used for MDM
No tool SAP ERP
Other SAP MDM
Oracle Siebel MDM
Infor-matica
Siperian
IBM Info
Sphere MDM
NRX MDM
11.010.0
8.0
1.0 1.0
5.0
15.0
5.0
2.0
Multiple answers were possible
34 Hidden Treasure
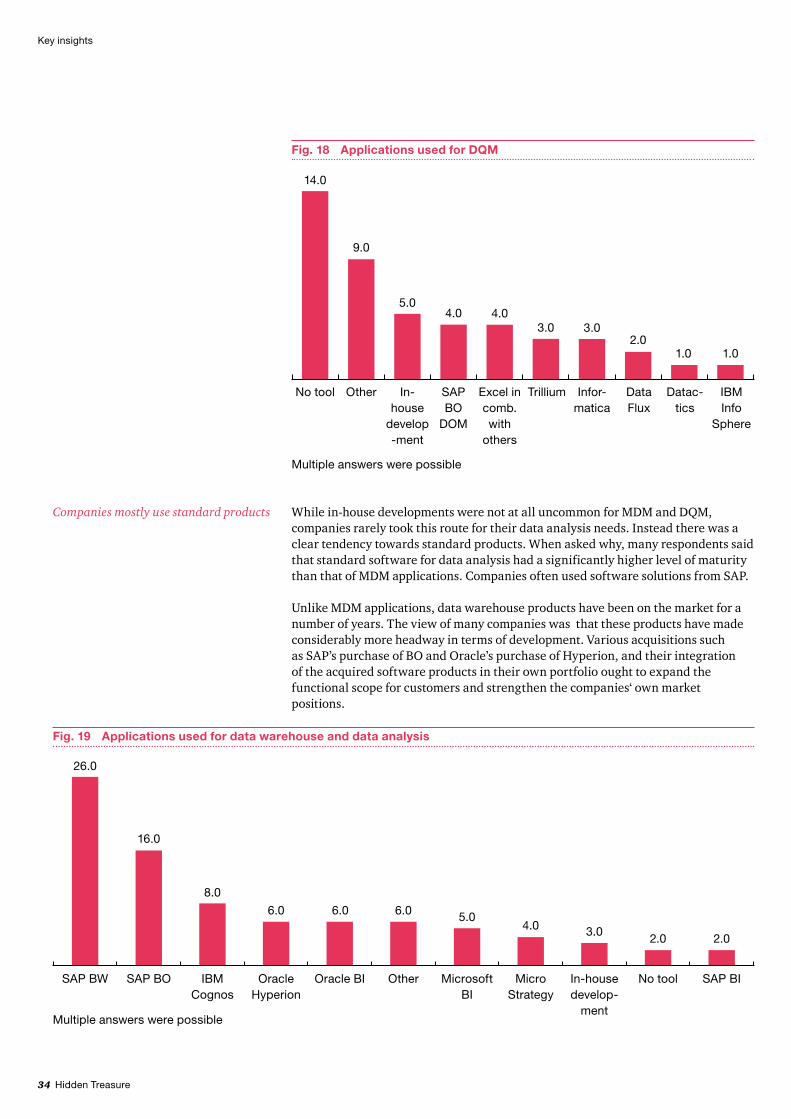
While in-house developments were not at all uncommon for MDM and DQM, companies rarely took this route for their data analysis needs. Instead there was a clear tendency towards standard products. When asked why, many respondents said that standard software for data analysis had a significantly higher level of maturity than that of MDM applications. Companies often used software solutions from SAP.
Unlike MDM applications, data warehouse products have been on the market for a number of years. The view of many companies was that these products have made considerably more headway in terms of development. Various acquisitions such as SAP’s purchase of BO and Oracle’s purchase of Hyperion, and their integration of the acquired software products in their own portfolio ought to expand the functional scope for customers and strengthen the companies‘ own market positions.
Companies mostly use standard products
No tool In- house
develop -ment
Other SAP BO
DOM
Excel in comb. with
others
Trillium Infor -matica
Data Flux
Datac-tics
IBM Info
Sphere
Fig. 18 Applications used for DQM
14.0
9.0
1.0 1.0
3.04.0
3.04.0
5.0
2.0
Multiple answers were possible
Fig. 19 Applications used for data warehouse and data analysis
SAP BW
26.0
SAP BO
16.0
In-house develop -
ment
3.0
No tool
2.0
SAP BI
2.0
Microsoft BI
5.0
Oracle BI OtherOracle Hyperion
6.0 6.0 6.0
IBM Cognos
8.0
Micro Strategy
4.0
Multiple answers were possible
Key insights
Hidden Treasure 35
Key insights
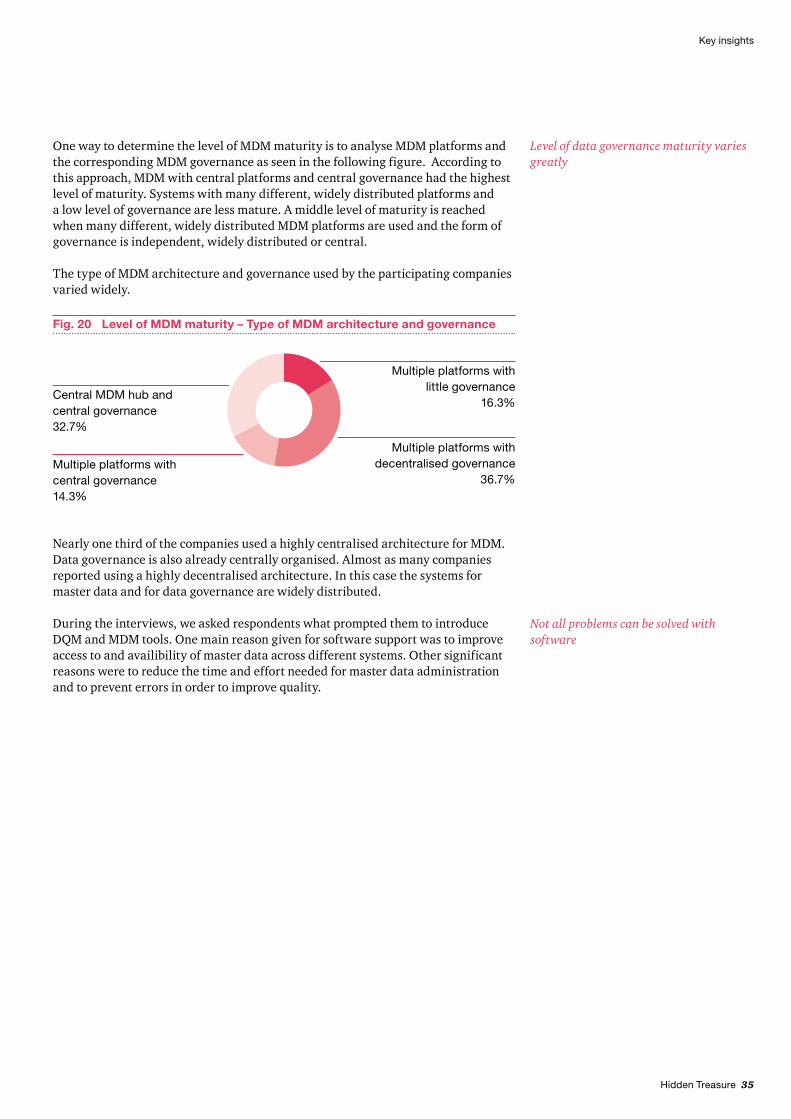
One way to determine the level of MDM maturity is to analyse MDM platforms and the corresponding MDM governance as seen in the following figure. According to this approach, MDM with central platforms and central governance had the highest level of maturity. Systems with many different, widely distributed platforms and a low level of governance are less mature. A middle level of maturity is reached when many different, widely distributed MDM platforms are used and the form of governance is independent, widely distributed or central.
The type of MDM architecture and governance used by the participating companies varied widely.
Level of data governance maturity varies greatly
Nearly one third of the companies used a highly centralised architecture for MDM. Data governance is also already centrally organised. Almost as many companies reported using a highly decentralised architecture. In this case the systems for master data and for data governance are widely distributed.
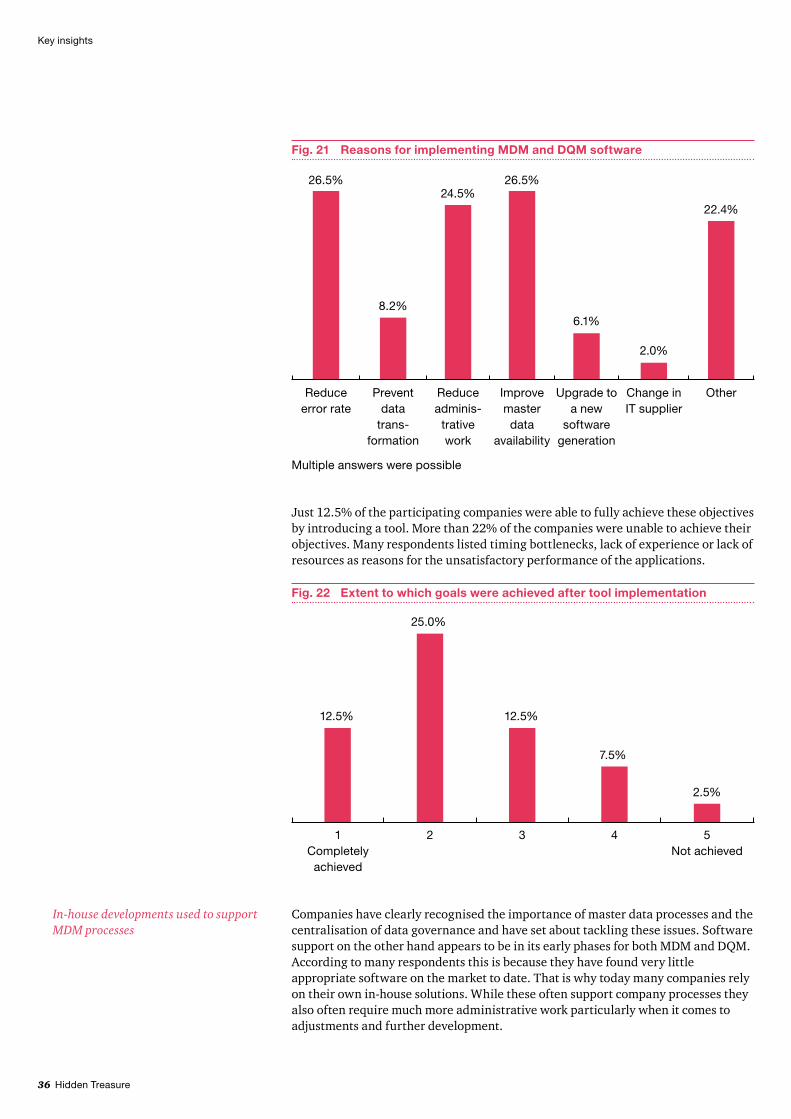
During the interviews, we asked respondents what prompted them to introduce DQM and MDM tools. One main reason given for software support was to improve access to and availibility of master data across different systems. Other significant reasons were to reduce the time and effort needed for master data administration and to prevent errors in order to improve quality.
Not all problems can be solved with software
Fig. 20 Level of MDM maturity – Type of MDM architecture and governance
Multiple platforms with little governance
16.3%
Multiple platforms with decentralised governance
36.7%
Central MDM hub and central governance 32.7%
Multiple platforms with central governance 14.3%
36 Hidden Treasure
Fig. 21 Reasons for implementing MDM and DQM software
Reduce error rate
26.5%
Prevent data
trans -formation
8.2%
Other
22.4%
Upgrade to a new
software generation
6.1%
Change in IT supplier
2.0%
Improve master data
availability
26.5%
Reduce adminis -
trative work
24.5%
Multiple answers were possible
Just 12.5% of the participating companies were able to fully achieve these objectives by introducing a tool. More than 22% of the companies were unable to achieve their objectives. Many respondents listed timing bottlenecks, lack of experience or lack of resources as reasons for the unsatisfactory performance of the applications.
Fig. 22 Extent to which goals were achieved after tool implementation
1 Completely achieved
12.5%
2
25.0%
7.5%
4 5 Not achieved
2.5%
3
12.5%
Companies have clearly recognised the importance of master data processes and the centralisation of data governance and have set about tackling these issues. Software support on the other hand appears to be in its early phases for both MDM and DQM. According to many respondents this is because they have found very little appropriate software on the market to date. That is why today many companies rely on their own in-house solutions. While these often support company processes they also often require much more administrative work particularly when it comes to adjustments and further development.
In-house developments used to support MDM processes
Key insights

Hidden Treasure 37
Key insights
Some companies have already turned to standard software to improve access to master data for systems that depend on it to prevent errors and to reduce the amount of time needed for administration. Many have achieved their objectives. Nonetheless one quarter of the projects initiated have had unsatisfactory results due to limited resources coupled with the complexity of the systems itself.
7 Current status and outlook
In the previous chapters we saw that companies are treating MDM as an important initiative and are actively addressing its issues. Half of the participating companies reported having made a significant investment in MDM.
Continuity creates lasting value
Fig. 23 Amount of time/effort invested in MDM in the last 10 years
1 Very high
12.0%
2
45.0%
3
27.0%
5.0%
5 Low
N/a
7.0%
4
4.0%
These investments point to a higher level of maturity for MDM structures. Only 16% of the participating companies described their own level of maturity as “little governance with diverse system support” (see Fig. 20).
The companies did not consider a state-of-the-art IT solution to be a critical factor for successful MDM. Instead they listed comprehensive governance and management commitment to the project as the most important factors for success.
The high value placed on “soft” factors such as modified governance, the support of an experienced management team and also timing, shows that MDM is no longer seen as a purely technical feature as it is often interpreted in discussions or trade press.
38 Hidden Treasure
Key insights
During the interviews the respondents clearly stated that although companies have made headway the journey is still far from over. All of the companies stated they planned to make additional investments in establishing or further developing MDM. The planned measures touch on a variety of areas:
Horizontal expansion of data governance to include additional master data •domain areasVertical expansion through standardisation of data governance structures, •processes and taxonomiesDefinition of data quality indicators and reporting structures to continuously •improve measurement of MDM performanceAutomation of MDM processes through the implementation of appropriate IT •solutions
Clearly, MDM is not a one-off project and must be understood as a crucial component of a company’s infrastructure. MDM continuity creates value through the lasting and sustainable improvement of master data quality and business processes.

Hidden Treasure 39
Industry-specific insights
B Industry-specific insights
40 Hidden Treasure
1 Automotive
This section highlights specific information we gathered by conducting various interviews with six international car manufacturers and diversified automotive suppliers. Four of these entities have fewer than 100,000 employees and the other two have more than 250,000 employees, placing them amongst the industry giants.
A few years ago car manufacturers and automotive suppliers were caught in the middle of a global crisis which led to insolvencies, government interventions, mass lay-offs, short shifts and plummeting revenues. However, with the Global economic improvement many in the industry are now seeing sales figures bouncing back and in some cases, factories are back to running at full capacity. Nevertheless the recent crisis was a wake-up call to the industry and showed the level of interdependency within this industry due in part to global supply chains and existing network structures. In addition to offering single parts suppliers also sell fully assembled components, such as complete dashboards or wiring harnesses.
In order to take advantage of just-in-time or just-in-sequence manufacturing strategies companies should have perfect synchronisation of processes and a standardised language to avoid miscommunications or logistics supply bottlenecks. Not only would these cause delays in the manufacturing plants but they would also cause considerable delays in the entire value creation chain and ultimately detract from profitability. Consequently supplier, material and product master data are of central importance for the industry.
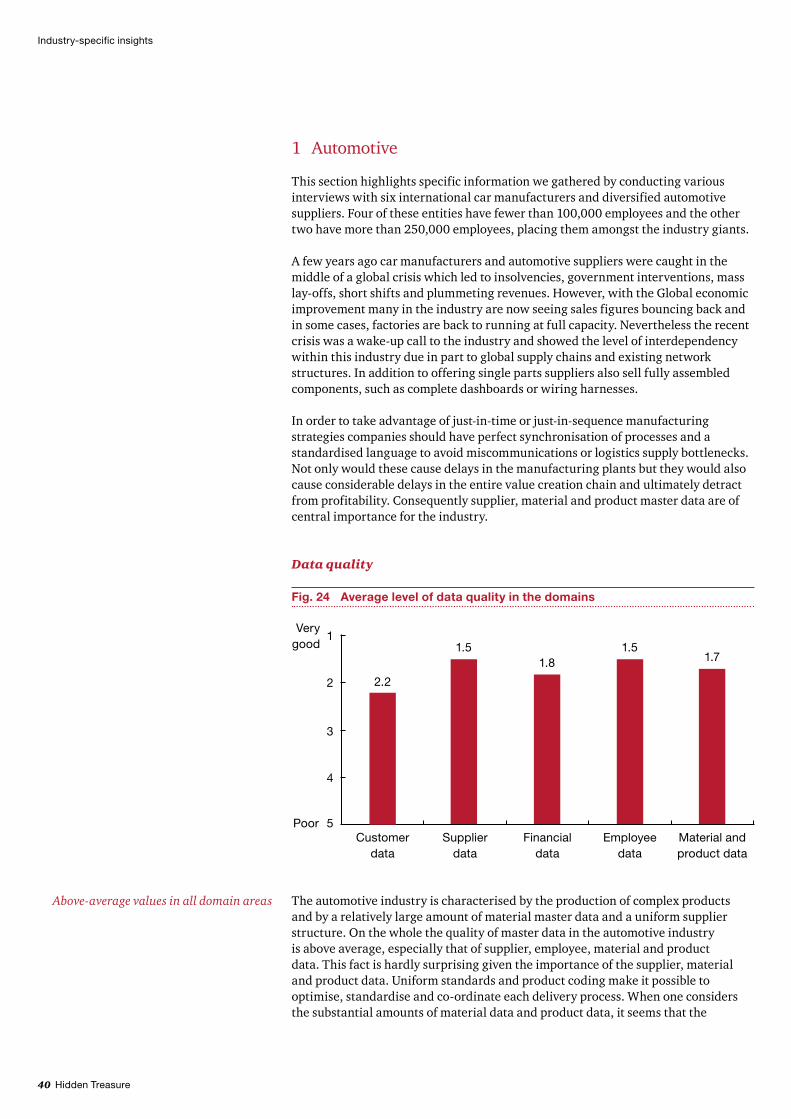
Data quality
Fig. 24 Average level of data quality in the domains
4
3
2
Supplier data
1.5
Employee data
1.5
Material and product data
1.7
Financial data
1.8
Customer data
2.2
5
1 Very
good
Poor
The automotive industry is characterised by the production of complex products and by a relatively large amount of material master data and a uniform supplier structure. On the whole the quality of master data in the automotive industry is above average, especially that of supplier, employee, material and product data. This fact is hardly surprising given the importance of the supplier, material and product data. Uniform standards and product coding make it possible to optimise, standardise and co-ordinate each delivery process. When one considers the substantial amounts of material data and product data, it seems that the
Above-average values in all domain areas
Industry-specific insights

Hidden Treasure 41
Industry-specific insights
The small amount of duplicates and other errors in the supplier, material and product master data is a further indication of the relevance of these data domains.
Fig. 26 Percentage of data with quality issues, eg, duplicates, incomplete data records
≤ 10%
50.0
%
33.3
%
10.1–30%
16.7
%
33.3
%
30.1–50% ≥ 70%50.1–70%
16.7
%
Customer data Material and product data
introduction of standards has made it easier to successfully manage these large volumes.
50.0 50.0 50.0
16.7 16.7
Supplier data domains Material and product data domains
≤ 5,000 5,001–10,000 10,001– 100,000
100,001– 1,000,000
≥ 1,000,000
Fig. 25 Data volume according to domain

42 Hidden Treasure
Governance and companyCentralisation is a key aspect to the running of any business. An indicator of above-average data quality of an organization is the level of centralisation within the industry. Our interviews revealed that two-thirds of the companies organised their data centrally with one-third preferring decentralised company.
Fig. 28 Level of MDM maturity
Multiple platforms with little governance
16.7%
Multiple platforms with independent governance
16.7%
Central MDM hub and central governance 66.7%
We also learned that half of the companies had implemented different taxonomies for the different data domains. Another half said that they had an efficient and effective data governance methodology. Two companies rated theirs as satisfactory and one company failed to respond.
Companies state that one of their biggest challenges is making sure data is complete, current and correct. This is a critical factor for an efficient and successful just-in-time manufacturing strategy.
Fig. 27 Main MDM challenges for all domains
Correctness
14.0%
Complete -ness
23.3%
Data currency
20.9%
16.3%
Validity Other
7.0%
Consistency
18.6%
Multiple answers were possible
Industry-specific insights
Hidden Treasure 43
Industry-specific insights
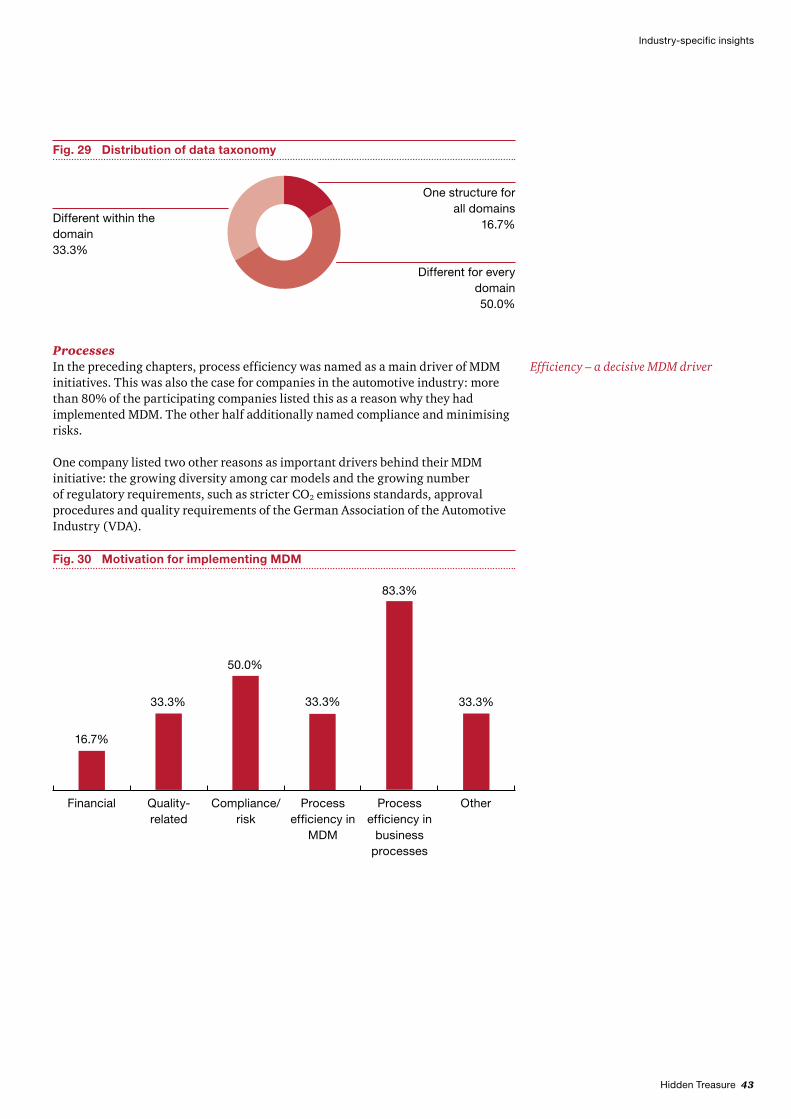
Fig. 29 Distribution of data taxonomy
One structure for all domains
16.7%
Different for every domain50.0%
Different within the domain 33.3%
Processes In the preceding chapters, process efficiency was named as a main driver of MDM initiatives. This was also the case for companies in the automotive industry: more than 80% of the participating companies listed this as a reason why they had implemented MDM. The other half additionally named compliance and minimising risks.
One company listed two other reasons as important drivers behind their MDM initiative: the growing diversity among car models and the growing number of regulatory requirements, such as stricter CO2 emissions standards, approval procedures and quality requirements of the German Association of the Automotive Industry (VDA).
Efficiency – a decisive MDM driver
Fig. 30 Motivation for implementing MDM
Financial
16.7%
Other
33.3%
Process efficiency in
MDM
33.3%
Process efficiency in
business processes
83.3%
Compliance/risk
50.0%
Quality-related
33.3%
44 Hidden Treasure
Current status and outlookDespite an above-average level of data quality and under-utilisation of standard software there is still great potential for improvement and efficiency, not only in the automotive industry but across all domains.
However many non-IT objectives have yet to be reached: five of the surveyed companies named comprehensive governance as a crucial success factor for MDM, directly followed by an increased commitment from management and an appropriate timeframe for the MDM initiative. As one company explained, top management needs to recognise the potential of MDM so that it can also be rooted at that level. Another interviewee from the automotive industry remarked that MDM also needs to be treated like the competitive factor it is.
Plenty of optimisation potential
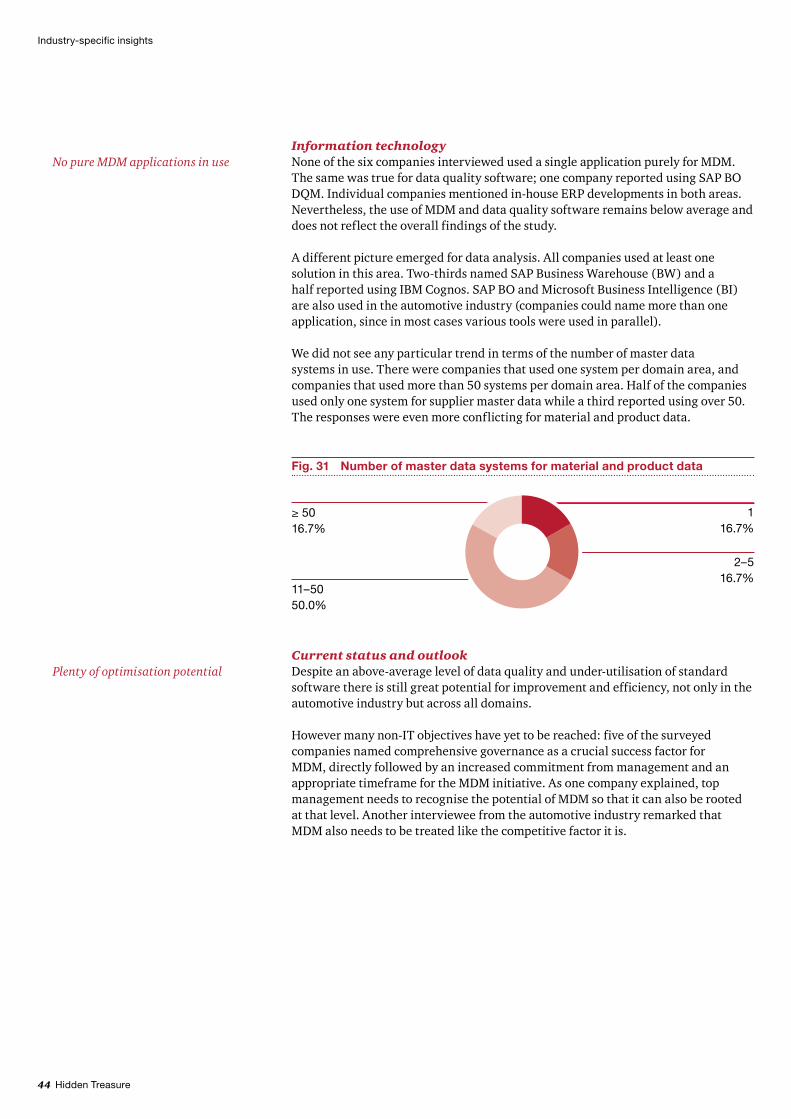
Information technologyNone of the six companies interviewed used a single application purely for MDM. The same was true for data quality software; one company reported using SAP BO DQM. Individual companies mentioned in-house ERP developments in both areas. Nevertheless, the use of MDM and data quality software remains below average and does not reflect the overall findings of the study.
A different picture emerged for data analysis. All companies used at least one solution in this area. Two-thirds named SAP Business Warehouse (BW) and a half reported using IBM Cognos. SAP BO and Microsoft Business Intelligence (BI) are also used in the automotive industry (companies could name more than one application, since in most cases various tools were used in parallel).
We did not see any particular trend in terms of the number of master data systems in use. There were companies that used one system per domain area, and companies that used more than 50 systems per domain area. Half of the companies used only one system for supplier master data while a third reported using over 50. The responses were even more conflicting for material and product data.
No pure MDM applications in use
Fig. 31 Number of master data systems for material and product data
116.7%
2–516.7%
11–50 50.0%
≥ 50 16.7%
Industry-specific insights
Hidden Treasure 45
Industry-specific insights
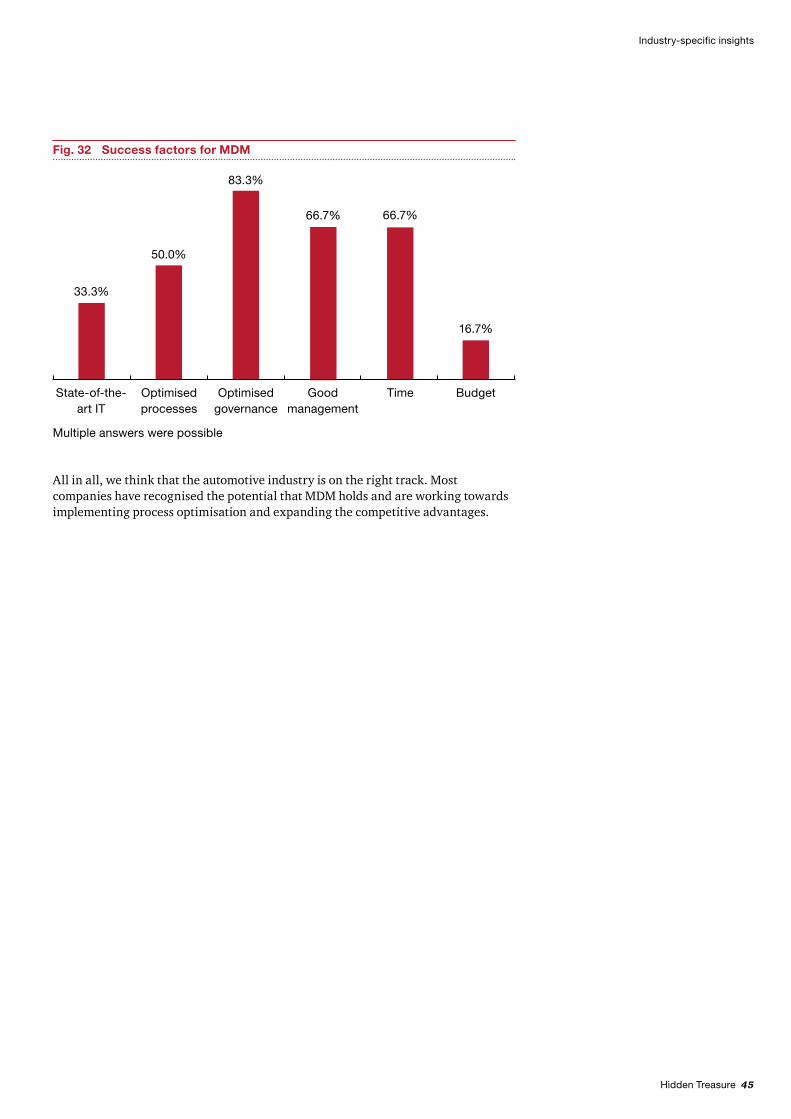
All in all, we think that the automotive industry is on the right track. Most companies have recognised the potential that MDM holds and are working towards implementing process optimisation and expanding the competitive advantages.
Fig. 32 Success factors for MDM
State-of-the-art IT
16.7%
Budget
66.7%
Good management
66.7%
Time
83.3%
Optimised governance
50.0%
Optimised processes
33.3%
Multiple answers were possible
46 Hidden Treasure
Three questions for Volker Donnermann, Head of Information Systems at Volkswagen AG
Mr. Donnermann, during our first interview you referred in passing to your company’s master data as its “pot of gold”. Could you elaborate on this vivid analogy? The way I see it, data and the processing of data into usable information form the basis for unique products and for successful business models. That makes reliable master data a necessary component of goal-oriented management and effective risk management.
In your opinion, what are the most important factors for the successful establishment and implementation of MDM? A sustainable MDM system has many different layers. On the one hand, there needs to be clear compliance with external and internal requirements. This includes complying with various laws, such as the German Federal Data Protection Act and the EU’s data protection guidelines. EU Directive (EC) No. 715/2007, for example, underscores the value and significance of data. It mandates new emissions standards and additional requirements for open access to vehicle repair information. Then there are internal standards, such as organisational guidelines or upholding our principles of treating master data as a “single point of truth” and a “trusted point of truth”. To make it easier to comply with the various requirements, we assign our master data one of four different levels of data classification: secret, confidential, internal or public.
At the same time, factors such as good communication skills and constant improvement awareness of the importance of data (quality) are also important for sustainable MDM. At VW, we have introduced data stewards, data designers and a comprehensive change management programme to help our employees understand how important data is.
When you look at your own company, what MDM challenges do you see on the horizon for the automotive industry in particular and how do you plan to meet them? The level of global networking is growing steadily and there is a rapid increase in data volume bringing with it the complexity of handling the data. The more data we produce, the more difficult it is to filter out the right information and to make data processing transparent.
VW is meeting these challenges by making a firm commitment to managing data quality. Our management board has laid down data protection guidelines, we have established a data protection commission and we specifically address the issue of data protection in our employment contracts.
Our information technology follows clear specifications, such as an obligatory systems development process (SDP) and a systems maintenance manual that includes guidelines on data modelling and data management. Group-wide directories, like our corporate directory, ensure transparency at all levels. Authorisation levels, access control and encryption ensure that information can be accessed only by the people who are authorised to use it.
The final components are the projects that we regularly launch to keep our MDM solution up-to-date. At the moment we are working on optimising our corporate product data management, which comprises product, process and resource management.
Industry-specific insights
Hidden Treasure 47
Industry-specific insights
2 Chemicals & Pharma
In this chapter we take a closer look at the chemicals and pharmaceutical industry; of the 49 companies that participated in this study, four belonged to the chemicals and pharmaceutical industry.
Two of the participating companies had more than 100,000 employees worldwide and an average annual revenue of €40.9 billion. The other two companies were significantly smaller (fewer than 25,000 employees) but nevertheless maintained a global presence.
In recent years, companies in the chemical and pharmaceutical industry have been confronted with a series of mergers and acquisitions, faced growing internationalisation and stiff competition from low-wage countries. Companies now see themselves facing the challenge of opening up new sales channels; although this is true to a lesser extent for German companies since they need to comply with certain statutory regulations. As a result of globalisation and increasing regulations the industry is now facing a growing number of data management challenges, particularly in the pharmaceutical sector.
An efficient MDM System is mandatory in order to effectively manage product recalls, batch tracking & Privacy Management. It will also be a necessary tool to curtail the side effects caused by drugs, toxic waste and hazardous substances.
Data qualityThe huge volume of master data involved in these companies is mind-boggling. Out of the companies that were part of the interview, two of them reported managing 720,000 master records and the others reported an approximation of 900,000 different customer master data records. Three of the other four companies managed between 100,001 and one million different product and material master data. The reason for the massive data volume is because all items used whether they be technical materials, chemical articles, operational substances, auxiliary materials are all listed as individual items.
Despite the strict regulatory environment a comparison between overall data quality and industry data quality revealed that the quality of the customer and material master data was at an average maintenance level whereas the the quality of supplier, financial and employee master data was below average.
48 Hidden Treasure
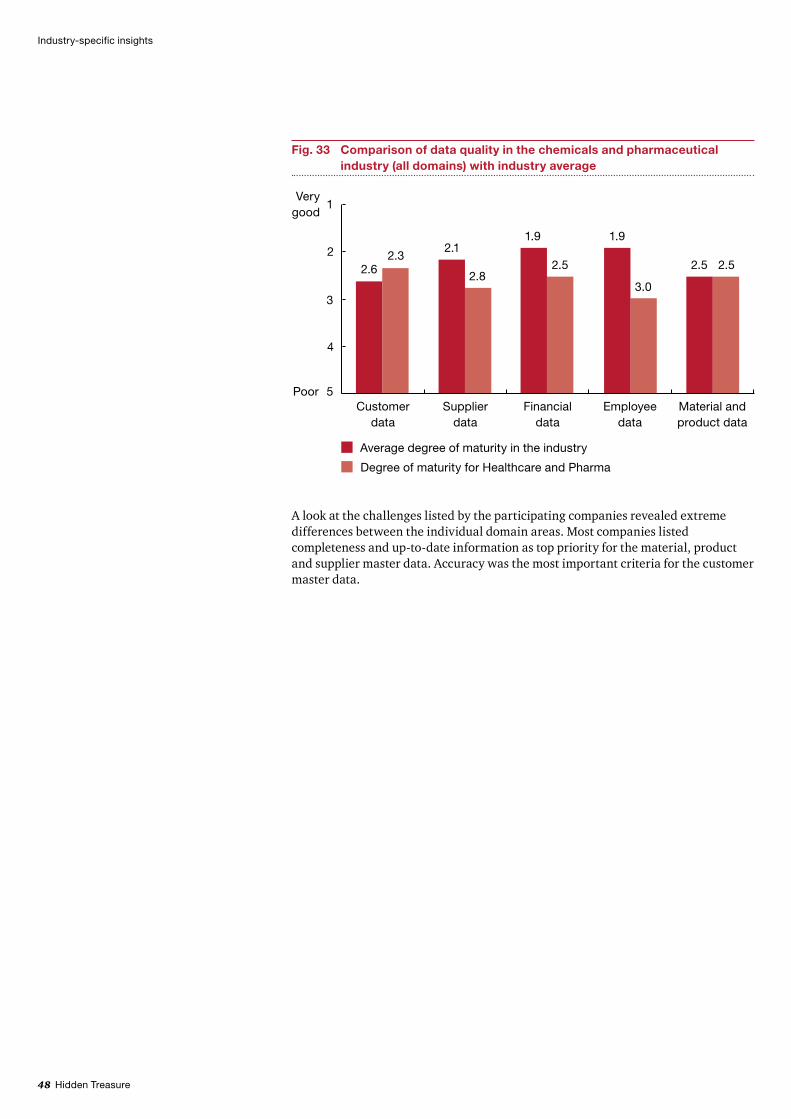
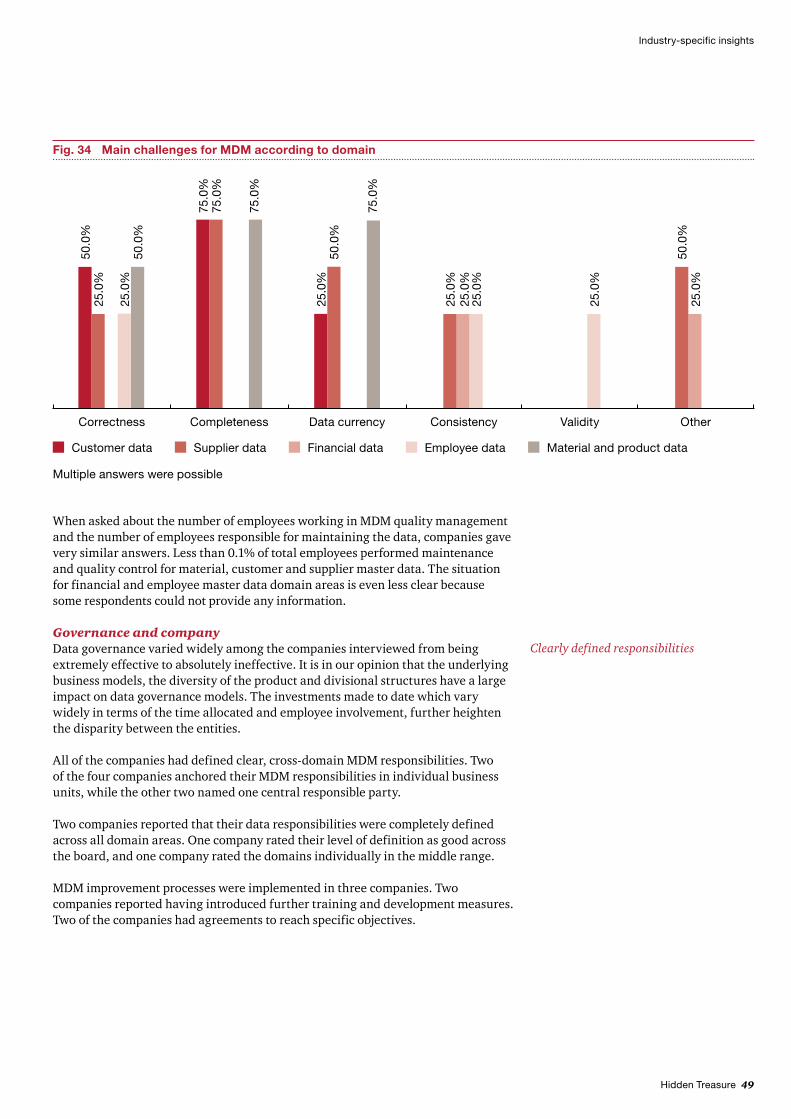
A look at the challenges listed by the participating companies revealed extreme differences between the individual domain areas. Most companies listed completeness and up-to-date information as top priority for the material, product and supplier master data. Accuracy was the most important criteria for the customer master data.
Fig. 33 Comparison of data quality in the chemicals and pharmaceutical industry (all domains) with industry average
Average degree of maturity in the industry
Degree of maturity for Healthcare and Pharma
4
2
Customer data
2.62.3
Supplier data
2.1
2.8
Employee data
3.0
1.9
Financial data
1.9
2.5
Material and product data
2.5 2.5
5
3
1 Very
good
Poor
Industry-specific insights
Hidden Treasure 49
Industry-specific insights
When asked about the number of employees working in MDM quality management and the number of employees responsible for maintaining the data, companies gave very similar answers. Less than 0.1% of total employees performed maintenance and quality control for material, customer and supplier master data. The situation for financial and employee master data domain areas is even less clear because some respondents could not provide any information.
Governance and companyData governance varied widely among the companies interviewed from being extremely effective to absolutely ineffective. It is in our opinion that the underlying business models, the diversity of the product and divisional structures have a large impact on data governance models. The investments made to date which vary widely in terms of the time allocated and employee involvement, further heighten the disparity between the entities.
All of the companies had defined clear, cross-domain MDM responsibilities. Two of the four companies anchored their MDM responsibilities in individual business units, while the other two named one central responsible party.
Two companies reported that their data responsibilities were completely defined across all domain areas. One company rated their level of definition as good across the board, and one company rated the domains individually in the middle range.
MDM improvement processes were implemented in three companies. Two companies reported having introduced further training and development measures. Two of the companies had agreements to reach specific objectives.
Clearly defined responsibilities
Multiple answers were possible
Fig. 34 Main challenges for MDM according to domain
50.0
%25
.0%
25.0
%50
.0%
75.0
%75
.0%
75.0
%
50.0
%25
.0%
75.0
%
25.0
%25
.0%
25.0
%
50.0
%25
.0%
25.0
%
Correctness Completeness Data currency Validity OtherConsistency
Customer data Supplier data Financial data Employee data Material and product data
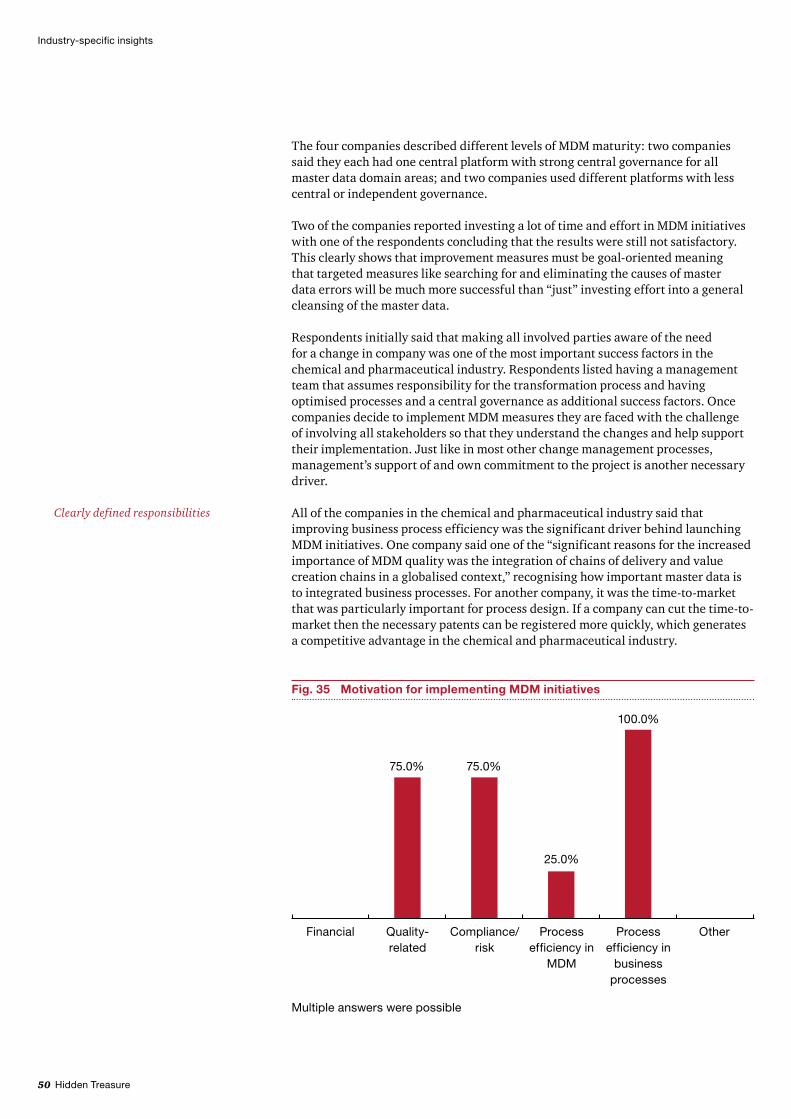
50 Hidden Treasure
The four companies described different levels of MDM maturity: two companies said they each had one central platform with strong central governance for all master data domain areas; and two companies used different platforms with less central or independent governance.
Two of the companies reported investing a lot of time and effort in MDM initiatives with one of the respondents concluding that the results were still not satisfactory. This clearly shows that improvement measures must be goal-oriented meaning that targeted measures like searching for and eliminating the causes of master data errors will be much more successful than “just” investing effort into a general cleansing of the master data.
Respondents initially said that making all involved parties aware of the need for a change in company was one of the most important success factors in the chemical and pharmaceutical industry. Respondents listed having a management team that assumes responsibility for the transformation process and having optimised processes and a central governance as additional success factors. Once companies decide to implement MDM measures they are faced with the challenge of involving all stakeholders so that they understand the changes and help support their implementation. Just like in most other change management processes, management’s support of and own commitment to the project is another necessary driver.
All of the companies in the chemical and pharmaceutical industry said that improving business process efficiency was the significant driver behind launching MDM initiatives. One company said one of the “significant reasons for the increased importance of MDM quality was the integration of chains of delivery and value creation chains in a globalised context,” recognising how important master data is to integrated business processes. For another company, it was the time-to-market that was particularly important for process design. If a company can cut the time-to-market then the necessary patents can be registered more quickly, which generates a competitive advantage in the chemical and pharmaceutical industry.
Clearly defined responsibilities
Industry-specific insights
Fig. 35 Motivation for implementing MDM initiatives
Financial OtherProcess efficiency in
MDM
25.0%
Process efficiency in
business processes
100.0%
Compliance/risk
75.0%
Quality-related
75.0%
Multiple answers were possible
Hidden Treasure 51
Industry-specific insights
Decision-making processes were organised centrally in two of the four companies while the remaining two had different ways of managing their decision-making and maintenance processes. The data maintenance processes tended to be more federally organised compared to the decision-making processes. Two of the respondents said that they had already positioned CIPs in their companies.
Information technologyThe main reasons named for using tools were to cut down on both errors and administrative work and to improve the availability of data. Establishing a consistent database to serve as a “global source of truth” was the main reason given by one company.
The companies did not use any special MDM tools. Just two of the four companies used solutions that were based on SAP ERP 6.0. The situation proved to be similar for data quality software: just two companies used standard software tools such as IBM InfoSphere, Informatica, DataFlux or Trillium. Microsoft Excel and Access and IBM Data Stage were also used.
A completely different picture emerged when we examined the use of data warehouse and data analysis tools. All four companies used SAP BW. In addition, two companies used IBM Cognos, and a third company used another six tool solutions along side SAP BW. This turned out to be the result of using different governance and taxonomy structures.
All of the respondents confirmed that it was possible to attain important objectives by using MDM tools. However the respondents reported varying degrees of success.
Master data across all domains was reported as being managed by a number of systems. On the positive side the majority used just one single master data repository to store the data centrally.
Current status and outlookThe participating companies recognised that there was a need for further action to improve data quality.
We found it difficult to establish any clear trends in this industry because the participating companies provided very different information particularly in terms of governance. The companies already have sufficient technology and process standards, so the next steps will be to increase monitoring and measuring of data quality and to implement various measures to improve quality within the individual domain areas. The use of appropriate technological support will also help to realise improvement potential.
Data warehouse and data analysis tools commonly used
No apparent industry trends
52 Hidden Treasure
Three questions for Andreas Abrath, Vice President Master Data Management at BASF Group
Mr Abrath, BASF has been implementing MDM since 1993, and in our opinion, it is one of the strongest companies in terms of MDM among the major corporations. How did the early interest in master data quality develop, and what factors do you think were critical for the successful implementation at BASF?At the beginning of the 1990s we needed to ensure that data availability was rapid, consistent and central, and that was what prompted us to set up a central master data system. That also guaranteed that information would be available for internal and external needs (eg, government agencies, customers) and at the same time laid the foundation for thorough, continuous reporting.
The top-down implementation in the organisation, coupled with intensive change management, was what made the project successful. In general, MDM has a huge impact on processes, organisation and responsibilities. It can only work when management guides and supports the changes in the long term.
How do you determine whether your MDM work is successful?Our benchmarks for success are clearly defined key performance indicators (KPIs), which are recorded at regular intervals, and continuous dialogue with the business and central units.
Today we are in the position to perform business integrations and carve-outs within shorter and shorter time frames with better data quality. That shows us that we are on the right track.
What MDM issues are you currently looking into in terms of future economic, political, technological or other challenges?Nothing in particular in those areas.
REACH, among other things, will certainly be a challenge for us in the future. We want to better support our master data systems and the related strategic decisions.
Our goal still remains to become even more consistent and even quicker in supplying data, for example by using in-memory technology.
Industry-specific insights

Hidden Treasure 53
Industry-specific insights
3 Energy
Five energy companies of different sizes discussed their MDM experiences, initiatives and successes with us. The smallest company had fewer than 1,000 employees and the largest were corporations with more than 50,000 employees.
The energy industry has been undergoing constant change worldwide for several years. The industry is charged not just with identifying trends concerning supply and demand but also complying with requirements arising from the liberalisation of the energy and gas markets in many countries. Companies all over the world need to master regulatory challenges, recognise changes in the market early on and make long-term decisions that remain sound in terms of the energy policy.
The complex strategic challenges in the energy industry translate into high standards for processes and systems. For this reason we were particularly keen to see to what extent the companies in this industry have recognised difficulties and the subsequent need for future MDM initiatives.
Data quality When asked to evaluate their own data quality none of the participating companies were able to provide specific answers. We were unable to glean significant trends on the basis of their answers. The lack of information around data quality suggests that companies have not yet begun to get to grips with this area. This assertion is directly related to the low level of data governance effectiveness described above. The weakest point across all domain areas in terms of data quality appears to be ensuring data completeness. Nevertheless, keeping data up-to-date and consistent also poses an ongoing challenge for companies in this industry.
Data quality difficult to evaluate
Fig. 36 Current challenges in maintaining data quality
Correctness
15.6%
Complete -ness
25.0%
Data currency
21.9%
12.5%
Validity Other
3.1%
Consistency
21.9%
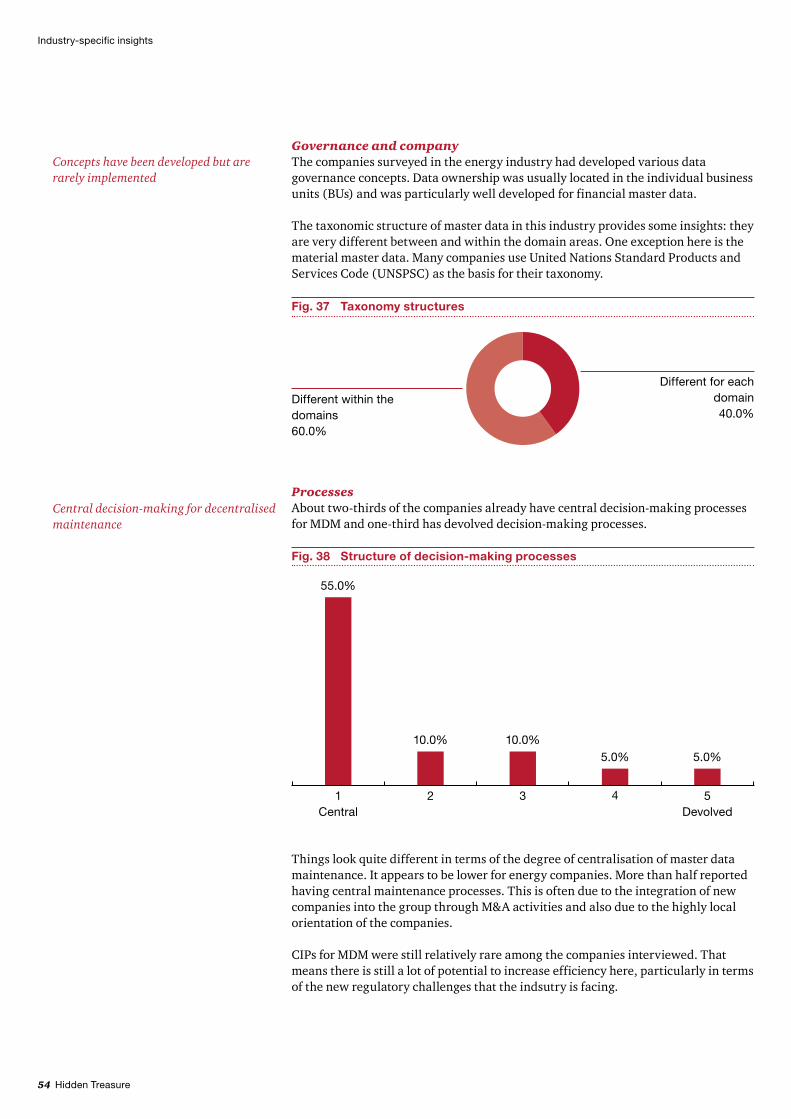
54 Hidden Treasure
Governance and companyThe companies surveyed in the energy industry had developed various data governance concepts. Data ownership was usually located in the individual business units (BUs) and was particularly well developed for financial master data.
The taxonomic structure of master data in this industry provides some insights: they are very different between and within the domain areas. One exception here is the material master data. Many companies use United Nations Standard Products and Services Code (UNSPSC) as the basis for their taxonomy.
Concepts have been developed but are rarely implemented
Fig. 37 Taxonomy structures
Different for each domain40.0%
Different within the domains 60.0%
Industry-specific insights
Fig. 38 Structure of decision-making processes
55.0%
1 Central
10.0%
2
10.0%
3
5.0%
4
5.0%
5 Devolved
ProcessesAbout two-thirds of the companies already have central decision-making processes for MDM and one-third has devolved decision-making processes.
Central decision-making for decentralised maintenance
Things look quite different in terms of the degree of centralisation of master data maintenance. It appears to be lower for energy companies. More than half reported having central maintenance processes. This is often due to the integration of new companies into the group through M&A activities and also due to the highly local orientation of the companies.
CIPs for MDM were still relatively rare among the companies interviewed. That means there is still a lot of potential to increase efficiency here, particularly in terms of the new regulatory challenges that the indsutry is facing.

Hidden Treasure 55
Industry-specific insights
Fig. 39 Implementation of CIP
No75.0%
Yes 25.0%
Fig. 41 Amount of time/effort invested in MDM initiatives in the last 10 years
5 Very low
4
20.0% 20.0% 20.0%
40.0%
321 Very high
The energy industry companies we interviewed rated the effectiveness of their data governance well below the average of the other industries. More than 60% of the participating companies said that the effectiveness of their MDM was either adequate or unsatisfactory.
The participating companies in the energy industry had made varying investments in MDM and its further development. This may be one reason for the difficulties companies had in evaluating their own quality and is definitely responsible for the low level of data governance effectiveness. Some 40% of the companies have made medium-sized to large investments in MDM in the past ten years. The remaining 60% of the respondents did significantly less to develop MDM.
Fig. 40 Effectiveness of data governance
N/a20.0%
Poor20.0%
Good20.0%
Adequate40.0%
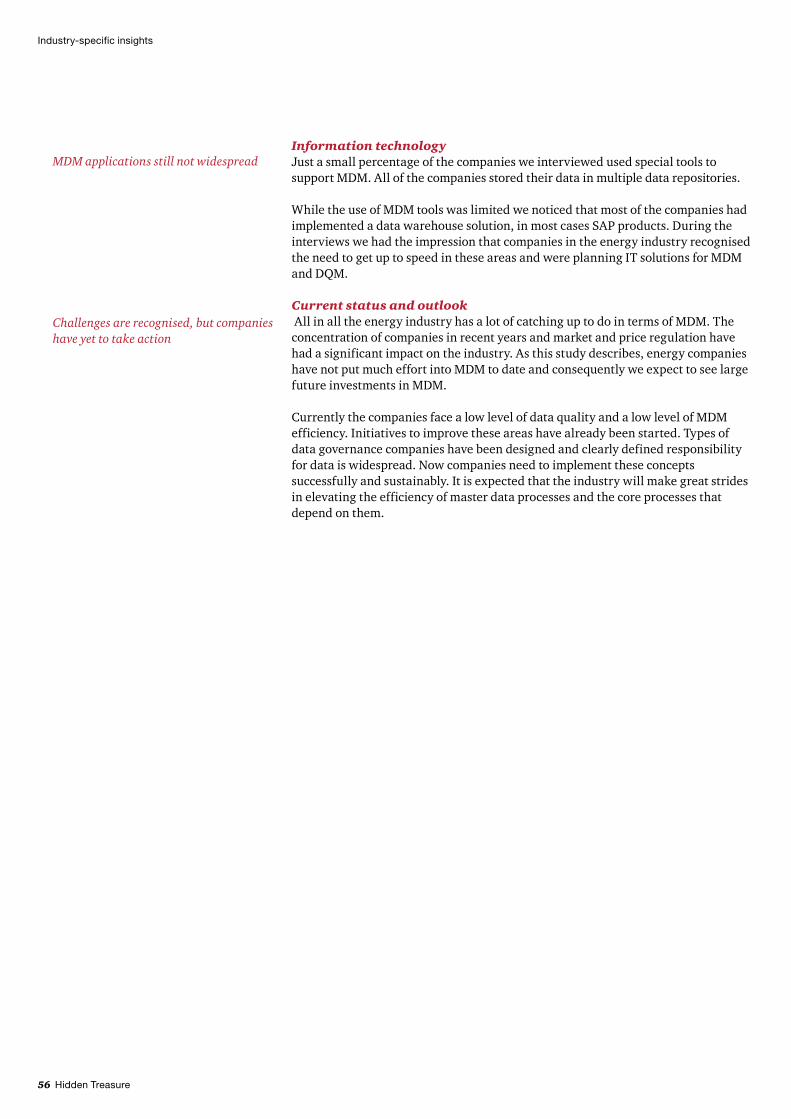
56 Hidden Treasure
Information technologyJust a small percentage of the companies we interviewed used special tools to support MDM. All of the companies stored their data in multiple data repositories.
While the use of MDM tools was limited we noticed that most of the companies had implemented a data warehouse solution, in most cases SAP products. During the interviews we had the impression that companies in the energy industry recognised the need to get up to speed in these areas and were planning IT solutions for MDM and DQM.
Current status and outlook All in all the energy industry has a lot of catching up to do in terms of MDM. The concentration of companies in recent years and market and price regulation have had a significant impact on the industry. As this study describes, energy companies have not put much effort into MDM to date and consequently we expect to see large future investments in MDM.
Currently the companies face a low level of data quality and a low level of MDM efficiency. Initiatives to improve these areas have already been started. Types of data governance companies have been designed and clearly defined responsibility for data is widespread. Now companies need to implement these concepts successfully and sustainably. It is expected that the industry will make great strides in elevating the efficiency of master data processes and the core processes that depend on them.
MDM applications still not widespread
Challenges are recognised, but companies have yet to take action
Industry-specific insights

Hidden Treasure 57
Industry-specific insights
Three questions for Olaf Altenberend, PwC Partner in Energy Consulting
Mr Altenberend, how important in your experience are MDM and data quality for the energy industry today and in the future and what are the key issues (for example mergers/demergers, regulation, data volumes)?MDM and data quality are of crucial importance, not just today but also in the future, and especially for energy companies. For example CRM, billing, EDM and portfolio management systems can only interact efficiently if high-quality and consistent data is available across all systems. But data consistency is also important for accounts and financial control functions as well as operational divisions. And this is where companies continue to face enormous challenges in providing high-quality deferred income calculations (forecasts) and implementing multidimensional reporting requirements efficiently. Managing mass (master) data along with high data volumes across different, partially non-integrated systems, will therefore continue to be a central component in many optimisation projects at energy companies.
What actions and activities have companies been undertaking in your experience to overcome the challenges posed by MDM and how successful do you think they are?In our opinion, the companies that have successfully implemented MDM in a structured manner are very few. Sensible measures, such as standardising master data maintenance processes, setting clear responsibilities for data quality and undertaking continuous measures to maintain or enhance data quality have been adopted to some extent, but without company-wide awareness of the underlying problem and central coordination of these activities, only a fraction of their potential impact can be achieved.
How would you rate the impact of MDM on the efficiency of operating processes and value creation quality in the energy industry in particular, as compared with other industries?For energy companies, the operating systems environment has a crucial impact on processes in all divisions. Data consistency, despite high data volumes in dispersed, non-integrated systems, is the main factor affecting process efficiency. Therefore, MDM is closely associated with making essential savings.
Taking into account the fluctuations in the market environment, the rise in global competition and increasing pressure on costs, it is apparent that there are few other industries that face a comparable challenge – particularly in terms of MDM.
4 Financial Services
This chapter takes a closer look at the financial services industry (banks and insurance companies). 49 companies participated in this study, five of which were banks/insurance companies.
In September 2010, a set of new capital and liquidity requirements (Basel III) were introduced for banks. These stricter regulatory requirements were established to make banks more resilient and improve their ability to absorb shocks in the event of a financial crisis. The new standards will come into effect in 2013 and be implemented in stages until 2018 and predictably will pose immense challenges for banks. Reinsurers and primary insurers will face similar drastic changes as well. In 2009, the European Parliament and the European Ministry of Finance passed Solvency II, which will be implemented in member states starting in 2013.
On top of that both banks and insurance companies must comply with the Minimum Requirements for Risk Management, popularly abbreviated as MaRisk, that were issued by the German Federal Financial Supervisory Authority (BaFin). MaRisk lays
58 Hidden Treasure
down mandatory administrative instructions for all insurance companies, banks, credit institutions and financial services providers.
Implementing these regulatory requirements necessitates large investment and commitment of resources to update processes and adapt existing IT systems. Some typical examples of important MDM applications include merging data from different systems, cleansing databases to eliminate duplicates and expanding the database with external data.
Data qualityFinancial services companies do not manufacture products so their data structures are somewhat different to those of the other companies that we interviewed for this study. Instead of listing tangible goods master data sets in the financial services industry list products such as current accounts and savings accounts, property financing agreements, equity funds and pension funds, securities, savings bonds, certificates, insurance policies and so on. Since these products are not provided by suppliers, the supplier networks for enterprises in the financial industry are relatively small generally limited to suppliers of traditional “C items”, like office supplies and services (eg, consulting). Consequently the number of supplier master data elements is relatively low compared to that of the companies in other industries.
What stands out is that the companies have more data elements in the customer domain area than in the product domain area. This is not surprising considering the fact that customer data is the most valuable type of data for these companies and that it often has a large strategic significance. Unlike other industries, where the end consumer is often unknown (e.g., in retail), the financial industry maintains a large amount of sensitive customer data (e.g., income, securities, real estate). In addition to names and addresses, the customer data includes information on policy terms, bank account balances, transactions, credit ratings, etc. Due to the sensitive nature of this data, companies have to comply with special data security requirements, such as having adequate backup and security systems (ie, mirrored data centres and appropriate access restrictions).
We did not see any significant differences compared to other industries in terms of employee and financial master data. However we did notice that the number of data elements in the financial domain areas were lower for the companies we surveyed in the financial industries than the corresponding figure for companies in other industries.
The number of employees involved in generating and maintaining the master data is also indicative of the importance of customer data. The largest numbers of employees responsible for data maintenance were concentrated in the customer data domain area; the other domain areas generally had fewer employees involved in data maintenance. The information provided on full-time equivalents (FTEs) highlights the same trend: the figures for customer data are significantly higher compared to those of other domain areas. In 80% of the participating companies, more than 2% of the total number of employees worked on the generation and maintenance of customer master data.
Key data have the best quality
Industry-specific insights
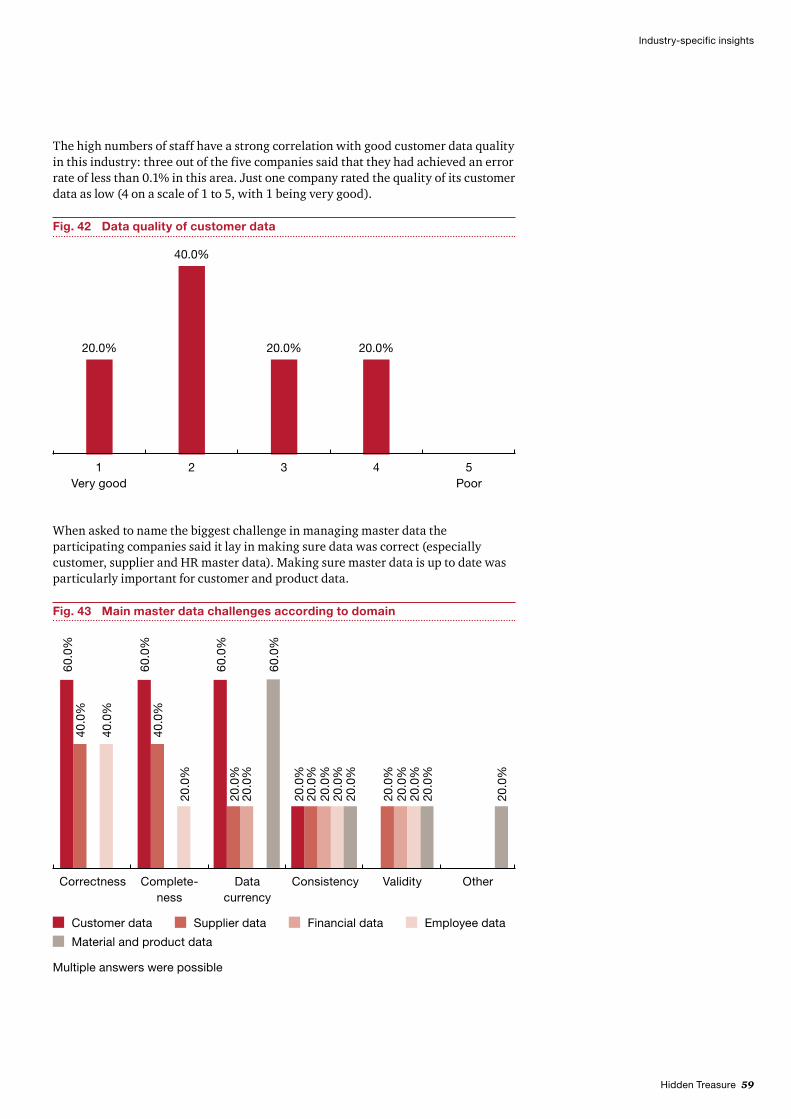
Hidden Treasure 59
Industry-specific insights
Fig. 42 Data quality of customer data
5 Poor
4321 Very good
20.0% 20.0% 20.0%
40.0%
The high numbers of staff have a strong correlation with good customer data quality in this industry: three out of the five companies said that they had achieved an error rate of less than 0.1% in this area. Just one company rated the quality of its customer data as low (4 on a scale of 1 to 5, with 1 being very good).
When asked to name the biggest challenge in managing master data the participating companies said it lay in making sure data was correct (especially customer, supplier and HR master data). Making sure master data is up to date was particularly important for customer and product data.
Fig. 43 Main master data challenges according to domain
20.0
%
60.0
%40
.0%
40.0
%
20.0
%20
.0%
20.0
%
20.0
%
20.0
%
20.0
%
20.0
%
20.0
%
20.0
%
Correctness Complete -ness
Data currency
Consistency Validity Other
60.0
%40
.0%
20.0
%
60.0
%
60.0
%
20.0
%20
.0%
Customer data Supplier data Employee data
Material and product data
Financial data
Multiple answers were possible
60 Hidden Treasure
Industry-specific insights
Governance and companyMost companies have recognised the importance of good data governance with three of the five participating companies having already launched improvement measures. Respondents specifically mentioned training units, regular meetings and establishing a governance team. Three of the companies have even defined and already established quality indicators. There still appears to be some room for improvement, since only two of the companies regularly measure their data quality by applying the defined indicators.
Some 40% of the companies have already defined responsibilities for the structuring and monitoring of master data processes and almost all companies document and monitor their methods and standards which explains why the participating companies in this industry report the effectiveness of their data governance as being wholly satisfactory. In terms of responsibilities for maintaining master data the companies have even gone one step further: all of them reported having defined clear responsibilities for the maintenance of their master data. Defining clear responsibilities, roles and tasks for employees has a positive impact on data quality. Each of the interviewed companies had a data owner and three companies even had their own dedicated MDM department, although in most cases each department still maintained responsibility for its master data.
Some 40% of the respondents from the financial services industry reported using a different taxonomy for each domain area. The remaining 60% said that they even used different taxonomies within a single domain area. These figures suggest that there is still no standard taxonomy in this industry.
ProcessesA significant success factor for good MDM is business process efficiency. Almost all of the interviewed companies in this industry listed this as a reason for introducing MDM with quality, compliance and risk management being the other reasons. One company said that “the regulation and savings on IT costs by avoiding opportunity costs” was the company’s main reason for launching MDM.
The information gathered during the interviews showed that on average the financial services industry organised its decision-making processes for MDM guidelines, structures and processes and master data maintenance processes much like companies in other industries. While the decision-making processes are more centrally organised in some domain areas than others it is still clear that the majority of companies prefer centrally organised processes. The only exception was in the case of customer data: two companies managed their data centrally and three companies used devolved structures.
Information technologyTwo companies reported using MDM tools as a way of significantly reducing their error rate. Tools were also considered to cut down on administrative work. One company saw that implementing a central MDM system with clear responsibilities can lead to an enormous increase in data quality.
Well defined roles for data maintenance
Visible trend towards centralisation
In-house developments preferred for MDM tools
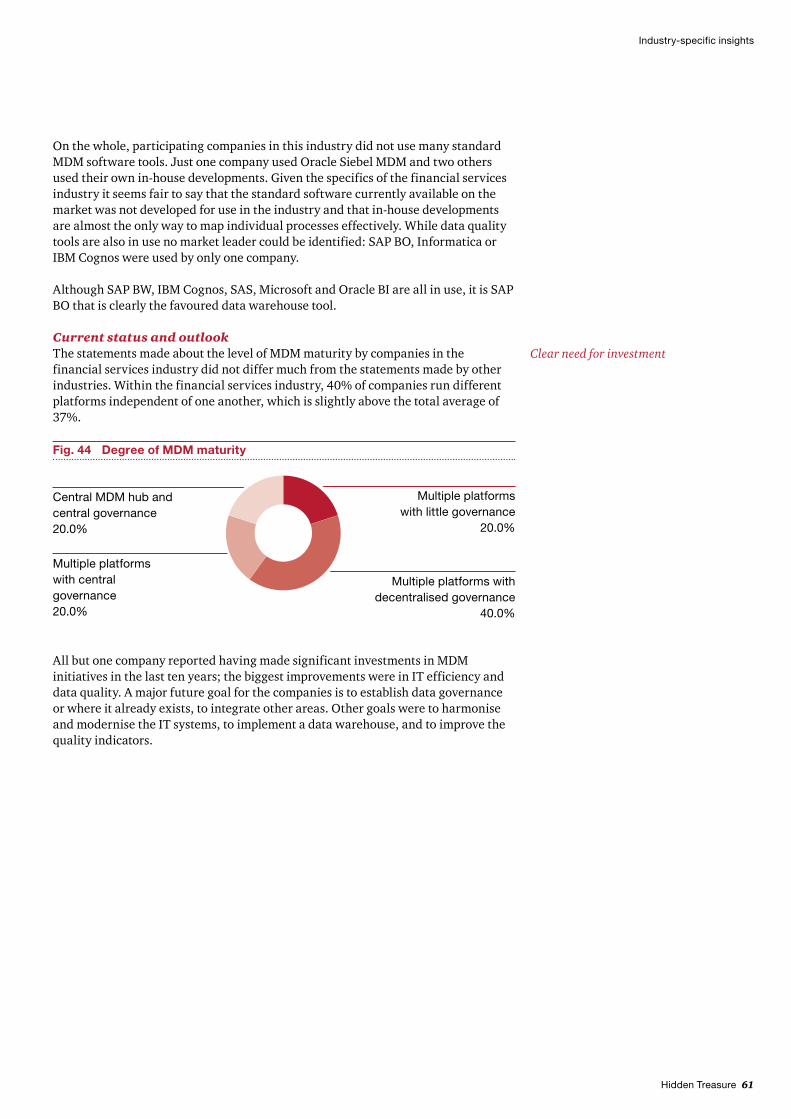
Hidden Treasure 61
Industry-specific insights
On the whole, participating companies in this industry did not use many standard MDM software tools. Just one company used Oracle Siebel MDM and two others used their own in-house developments. Given the specifics of the financial services industry it seems fair to say that the standard software currently available on the market was not developed for use in the industry and that in-house developments are almost the only way to map individual processes effectively. While data quality tools are also in use no market leader could be identified: SAP BO, Informatica or IBM Cognos were used by only one company. Although SAP BW, IBM Cognos, SAS, Microsoft and Oracle BI are all in use, it is SAP BO that is clearly the favoured data warehouse tool.
Current status and outlookThe statements made about the level of MDM maturity by companies in the financial services industry did not differ much from the statements made by other industries. Within the financial services industry, 40% of companies run different platforms independent of one another, which is slightly above the total average of 37%.
Clear need for investment
Fig. 44 Degree of MDM maturity
Multiple platforms with central governance20.0%
Multiple platforms with little governance
20.0%
Central MDM hub and central governance20.0%
Multiple platforms with decentralised governance
40.0%
All but one company reported having made significant investments in MDM initiatives in the last ten years; the biggest improvements were in IT efficiency and data quality. A major future goal for the companies is to establish data governance or where it already exists, to integrate other areas. Other goals were to harmonise and modernise the IT systems, to implement a data warehouse, and to improve the quality indicators.
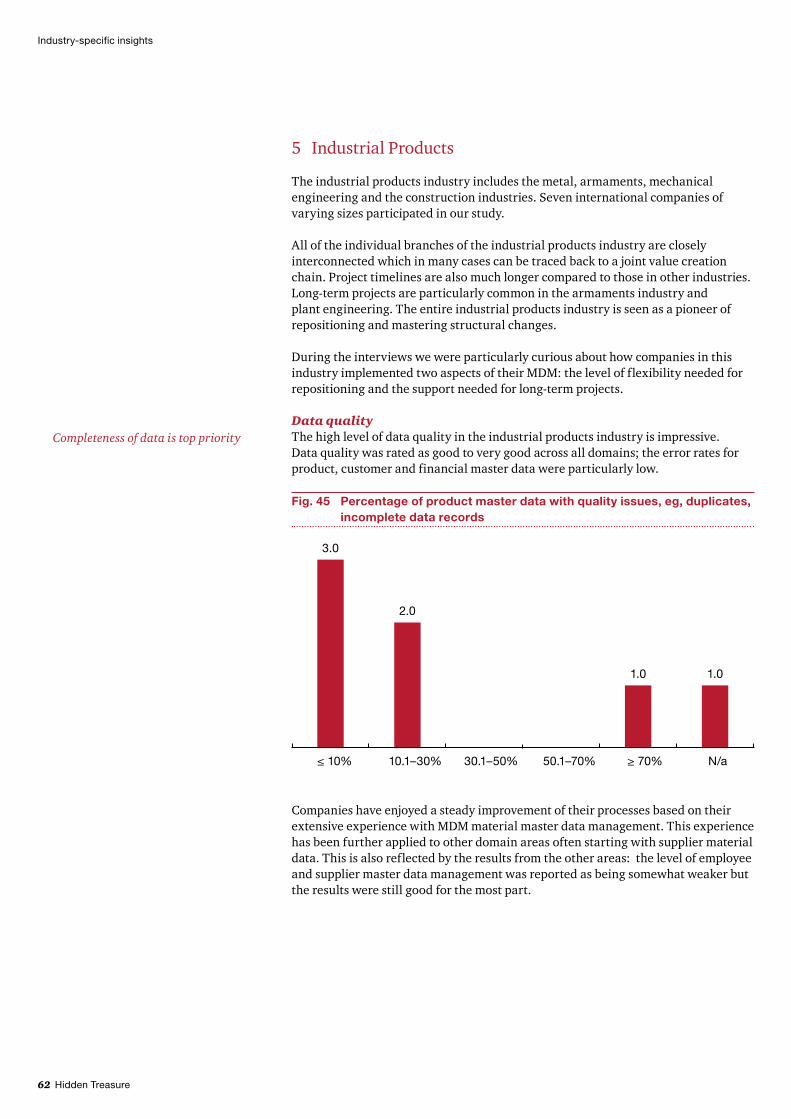
62 Hidden Treasure
5 Industrial Products
The industrial products industry includes the metal, armaments, mechanical engineering and the construction industries. Seven international companies of varying sizes participated in our study.
All of the individual branches of the industrial products industry are closely interconnected which in many cases can be traced back to a joint value creation chain. Project timelines are also much longer compared to those in other industries. Long-term projects are particularly common in the armaments industry and plant engineering. The entire industrial products industry is seen as a pioneer of repositioning and mastering structural changes.
During the interviews we were particularly curious about how companies in this industry implemented two aspects of their MDM: the level of flexibility needed for repositioning and the support needed for long-term projects.
Data qualityThe high level of data quality in the industrial products industry is impressive. Data quality was rated as good to very good across all domains; the error rates for product, customer and financial master data were particularly low.
Completeness of data is top priority
Companies have enjoyed a steady improvement of their processes based on their extensive experience with MDM material master data management. This experience has been further applied to other domain areas often starting with supplier material data. This is also reflected by the results from the other areas: the level of employee and supplier master data management was reported as being somewhat weaker but the results were still good for the most part.
Industry-specific insights
Fig. 45 Percentage of product master data with quality issues, eg, duplicates, incomplete data records
3.0
2.0
1.0 1.0
≥ 70% N/a30.1–50% 50.1–70%≤ 10% 10.1–30%

Hidden Treasure 63
Industry-specific insights
Fig. 46 Percentage of supplier master data with quality issues, eg, duplicates, incomplete data records
1.0
≥ 70% N/a30.1–50% 50.1–70%≤ 10% 10.1–30%
2.0 2.0 2.0
When asked to list the most important criteria for good data quality, respondents from the industrial products industry unanimously named completeness of data. Respondents also considered correctness and consistency to be very important factors for data quality.
Fig. 47 Criteria for high-quality MDM
18.9%
Correctness
28.3%
Complete -ness
13.2%
Data currency
18.9%
Consistency
7.5%
Validity
13.2%
Other
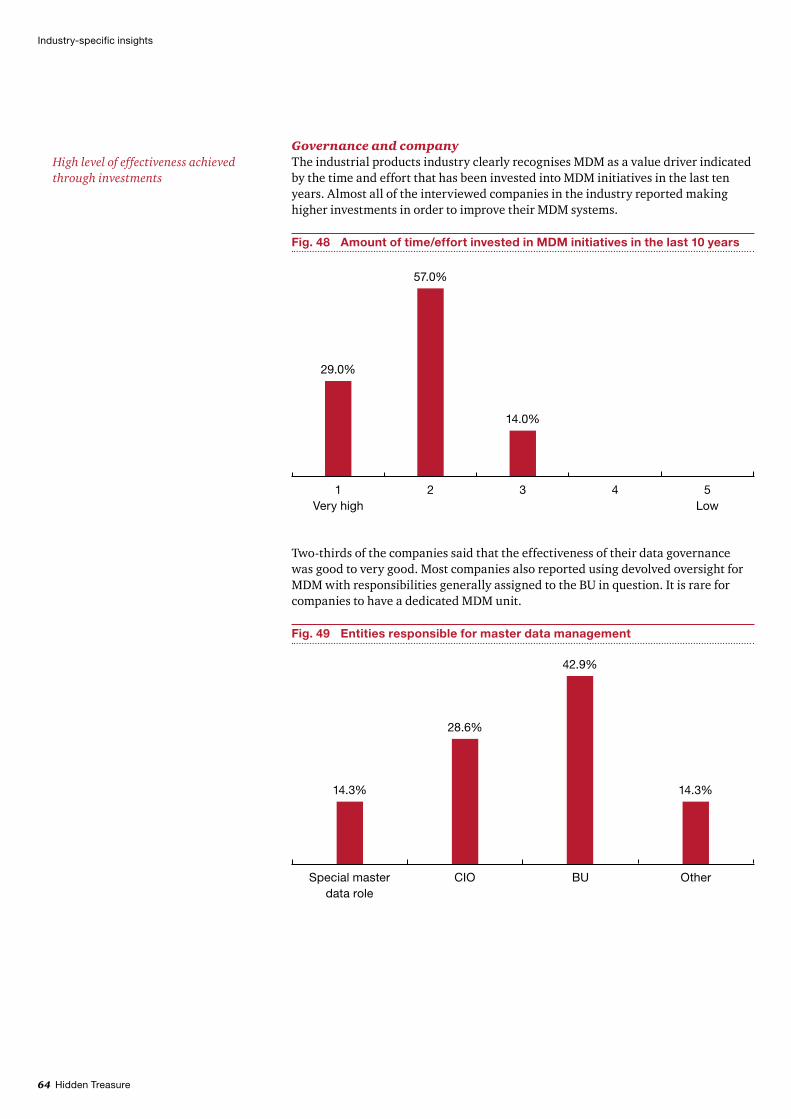
64 Hidden Treasure
Fig. 49 Entities responsible for master data management
28.6%
42.9%
BU
14.3%
OtherSpecial master data role
CIO
14.3%
Two-thirds of the companies said that the effectiveness of their data governance was good to very good. Most companies also reported using devolved oversight for MDM with responsibilities generally assigned to the BU in question. It is rare for companies to have a dedicated MDM unit.
Industry-specific insights
Governance and companyThe industrial products industry clearly recognises MDM as a value driver indicated by the time and effort that has been invested into MDM initiatives in the last ten years. Almost all of the interviewed companies in the industry reported making higher investments in order to improve their MDM systems.
High level of effectiveness achieved through investments
Fig. 48 Amount of time/effort invested in MDM initiatives in the last 10 years
14.0%
3 4
29.0%
1 Very high
57.0%
2 5 Low
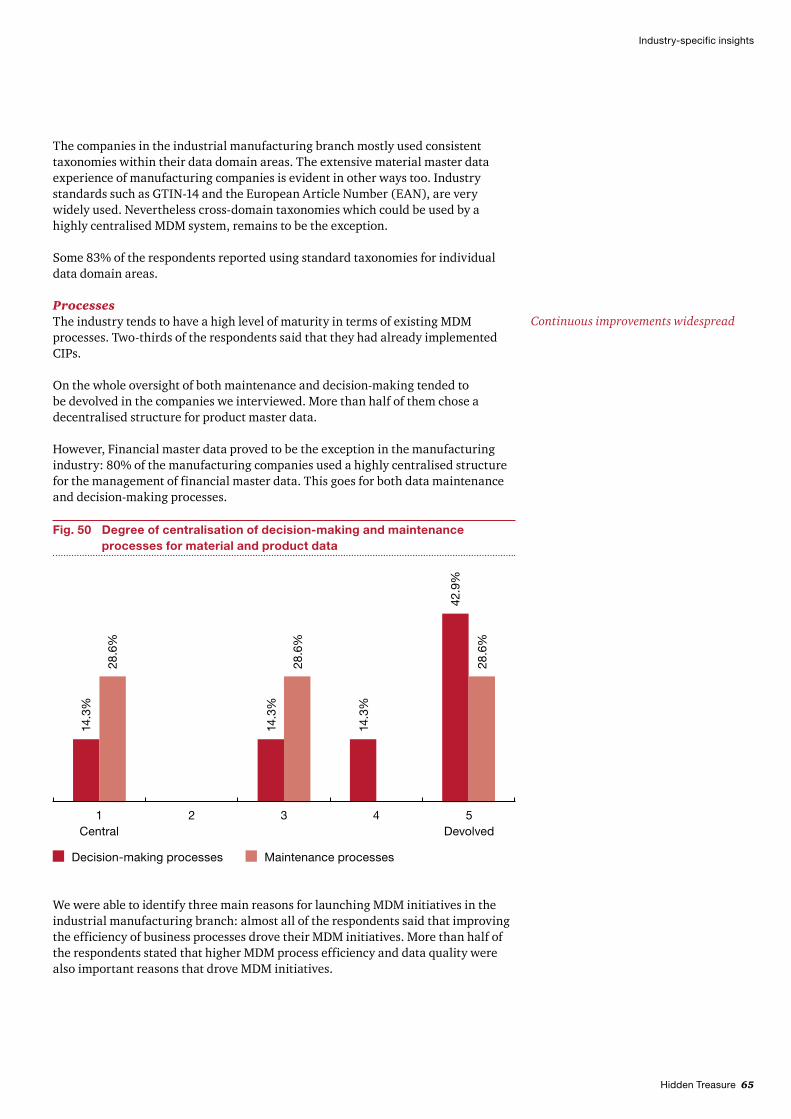
Hidden Treasure 65
Industry-specific insights
The companies in the industrial manufacturing branch mostly used consistent taxonomies within their data domain areas. The extensive material master data experience of manufacturing companies is evident in other ways too. Industry standards such as GTIN-14 and the European Article Number (EAN), are very widely used. Nevertheless cross-domain taxonomies which could be used by a highly centralised MDM system, remains to be the exception.
Some 83% of the respondents reported using standard taxonomies for individual data domain areas.
ProcessesThe industry tends to have a high level of maturity in terms of existing MDM processes. Two-thirds of the respondents said that they had already implemented CIPs.
On the whole oversight of both maintenance and decision-making tended to be devolved in the companies we interviewed. More than half of them chose a decentralised structure for product master data.
However, Financial master data proved to be the exception in the manufacturing industry: 80% of the manufacturing companies used a highly centralised structure for the management of financial master data. This goes for both data maintenance and decision-making processes.
Continuous improvements widespread
Fig. 50 Degree of centralisation of decision-making and maintenance processes for material and product data
14.3
%
28.6
%
14.3
%
28.6
%
28.6
%
42.9
%
Decision-making processes Maintenance processes
5 Devolved
31 Central
2 4
14.3
%
We were able to identify three main reasons for launching MDM initiatives in the industrial manufacturing branch: almost all of the respondents said that improving the efficiency of business processes drove their MDM initiatives. More than half of the respondents stated that higher MDM process efficiency and data quality were also important reasons that drove MDM initiatives.

66 Hidden Treasure
Fig. 51 Business drivers for MDM
Financial
14.3%
Quality-related
57.1%
Compliance/ risk
28.6%
57.1%
Process efficiency in
MDM
Process efficiency in
business processes
71.4%
Multiple answers were possible
Industry-specific insights
Information technologyThe companies in industrial manufacturing used individual, in-house IT developments that had been specially designed to meet the company’s MDM needs. The larger companies tended to run these tools as intelligent front-ends on ERP systems. The smaller companies often used independent in-house developments or in some cases no MDM tools at all.
Current status and outlook In the last ten years companies in the industrial manufacturing industry have made significant investments in MDM. These investments have kept up with those made by other industries. To date the industry has been able to achieve a level of data quality that is consistent with average figures and a level of MDM efficiency that is even higher than average. Nevertheless the companies still have some work to do in terms of data governance. The industry is on the right track and has recognised the most important success factors for MDM initiatives.
Technical support is highly individualised
Management’s support and devolved structures indispensable for success

Hidden Treasure 67
Industry-specific insights
Fig. 52 Success factors
42.9%
Time
14.3%
Budget
42.9%
Revised governance
100.0%
Good management
28.6%
State-of-the-art IT
57.1%
Optimised processes
Multiple answers were possible
The companies we interviewed in the industrial manufacturing industry said that management was one of the most critical factors for successful MDM initiatives. It is clear that very good management mechanisms need to be implemented given the extremely devolved structures and processes commonly found in the manufacturing industry. Companies that realise this and are able to transfer their experience with mature material master data management to other data domain areas will be able to achieve a higher level of efficiency in their business processes.
6 Retail & Consumer
This chapter focuses on specific insights that are relevant for the retail and consumer industry. The statements are based on information from retail/wholesale companies and companies in the consumer goods industry. Most of the respondents that contributed to this chapter represent international companies.
In terms of the level of sales and number of employees, the retail and consumer industry, along with the automotive and technology industries, is one of the heavyweights of our study. Four of the seven participating companies employ over 250,000 people and generate an average of €60 billion in annual sales. The other three companies are also considerably sized with 130,000 employees and sales in the billions.
68 Hidden Treasure
Current trends in the retail and consumer industry have increased management’s need for information and consequently added a new level of complexity to the management model:
Individualisation of customer needs – greater diversification of product range and •targeted customer approach to meet customer segmentation requirements Growth of multi-channel retail – management of processes across business areas •that have generally been decentrally managed in the past Globalisation – different consumer markets with local requirements for product •design and distribution channels – competition is increasingGlobalisation – new procurement markets in regions with currency risks and •different regulatory requirements – increasing demand is leading to resource insecurity Information technology – all of these developments translate 1:1 into information •technology: networking all data requires solid master data management; volumes of data will continue to grow dramatically Information technology – the consolidation of distribution channels has resulted •in a new level of IT complexity for data structures and interfaces that need to be maintained and governed transparently – enterprise architecture and IT architecture will become increasingly importantInformation technology – traditional ERP approaches limit change mapping •for complex processes and structures – a disintegration of systems seems to be advisable
The increased requirements for information and transparency are creating new challenges for data harmonisation and the design of business data models.
Data qualityThe amount and complexity of master data reflect the large number of products and product variants, frequent product innovations and the detailed pricing models that are common to the consumer environment. Uniform product structures and calculation models are fundamental for a proper analysis of the profitability of product groups, distribution channels and regions. Increasing customer group differentiation and the demands it places on customer segmentation must also be taken into account.
The decentralised business model used in retail gives rise to additional challenges. The recent IFRS Exposure Draft, for example, stipulates new requirements for the structuring and accounting treatment of master data related to property, plant and equipment; given the large volume of selling space that is rented out these new requirements are sure to pose problems for companies.
During the interviews respondents stated that they found handling these two domain areas particularly difficult: product or article stocklists (as opposed to the classic “material” in other industries) and customer master data.
Product-related data pose a special challenge
Industry-specific insights

Hidden Treasure 69
Industry-specific insights
Fig. 53 Number of material and product master data records per company
≥ 1,000,00050.0%
≤ 5,000 16.7%
10,001–100,00016.7%
100,001–1,000,00016.7%
Half of the surveyed companies had over one million product and article master data items, and 17% reported having between 100,000 and one million.
Despite handling large volumes of data, half of the respondents reported having good or very good product and article master data. One reason for this lies in the relatively widespread use of technology to support material master data: two-thirds of the respondents said they had a central data repository for their product and article master data, and major BI solutions were in use across the board.
The high degree of technology usage also explains why relatively few employees are involved in the maintenance and optimisation of the material data. In two-thirds of the participating companies, less than 0.1% of their staff was involved in MDM optimisation. Just one company said that more than 2% of its staff were involved in the optimisation of its product and article master data.
Just a few years ago, the industry knew relatively little about end consumers. Products were distributed through dealer networks and no information was collected about the ultimate consumer. Today customer addresses and other information is available through electronic payment systems and bonus programmes. During the interviews, we learned that online sales channels (such as webshops) and new indicators (e.g., click-to-basket) are throwing up new data
Fig. 54 Data quality ratings for material and product master data
5 Poor
14.3%
42.9%
28.6%
14.3%
1 Very good
2 3 4
70 Hidden Treasure
volumes and measuring units for the departments to contend with. Since customers can use different sales channels to make purchases, it is difficult to merge data into consistent master data records. As a consequence, the participating companies did not rate the quality of their customer data as highly: 56% reported it as satisfactory and just 28% said it was good or very good.
The quality of supplier data was rated as good across the board: some 86% of the respondents reported a redundancy rate of less than 10% in their supplier master data records. Just one company reported it being in the 10% to 30% range. These are the best results of all the industries examined in this study. Data quality in this domain was also rated as good by all of the respondents.
One potential reason for these results is that retail uses purchasing as the main way to maximise profit. The industry has been standardising and integrating supplier data for years. The respondents confirmed that there was indeed a strong trend towards centralisation which is reflected in the way the supplier data is maintained. Some 86% of the respondents said that the decision-making processes for the supplier data domain were centrally organised.
The quality of financial master data was rated as good or very good across the board. One company did not provide any response about this.
However, our experience with numerous auditing and optimisation projects across a range of industries paints a different picture: a large number of reporting units results in a large number of legal and local requirements. While it was possible to implement central guidelines, for example, a standard chart of accounts for the group or a company-wide cost centre structure, the guidelines were often inflated and led to high administrative costs. A typical example is that transaction types, customer groups, products or affiliated enterprises are listed using the chart of accounts instead of additional postings. Using additional postings would be advantageous because it keeps the chart of accounts streamlined and makes it possible to interpret different information separately.
In conclusion, the quality of master data in this industry is considered above average. Aside from financial master data (1.5), employee and supplier master data received top ratings. In spite of the large volume of data, material and customer master data were given relatively high ratings of 2.4 and 2.5 respectively. .
Industry-specific insights

Hidden Treasure 71
Industry-specific insights
Fig. 55 Master data quality across all domains
Customer data
2.5
Supplier data
2.0
Employee data
1.8
Material and product data
2.4
Financial data
1.5
4
3
2
5
1 Very
good
Poor
Governance and companyComprehensive responsibility for data quality appears to be widely implemented in companies in the retail and consumer industry: data ownership has been defined in all domain areas, and data governance is considered highly effective across all domain areas.
Management support more important than technology
Very good
Poor
Fig. 56 Degree of data ownership according to domain
4
3
2
5
1
2.4
Customer data
1.4
Supplier data
3.0
Financial data
3.0
Employee data
2.1
Material and product data

72 Hidden Treasure
The respondents also said that having standards and guidelines for the consistent creation and processing of data is another decisive criterion for good data quality. Two-thirds of the respondents used binding standards to optimise their data quality. The extent of the guidelines varied from company to company, ranging from minimum requirements such as the article number length and required fields to separate data quality instructions consistent with a group-wide quality handbook.
All of the respondents emphasised that the need for high-quality data cannot be anchored solely in the specific departments (data stewards, data owner), “clear and continuous support from the top management” is essential.
All of the respondents thought that good management is a critical success factor for maintaining high master data quality in the long term. The second most important factor mentioned was comprehensive governance and having the time to implement the necessary changes.
Industry-specific insights
Fig. 58 Success factors for MDM
22.0%
Time
17.0%
Budget
17.0%
Revised governance
code
30.0%
Good management
4.0%
State-of-the-art IT
9.0%
Optimised processes
Multiple answers were possible
Fig. 57 Effectiveness of data governance structures
5 Poor
14.3%
42.9%
28.6%
1 Very good
2 3 4
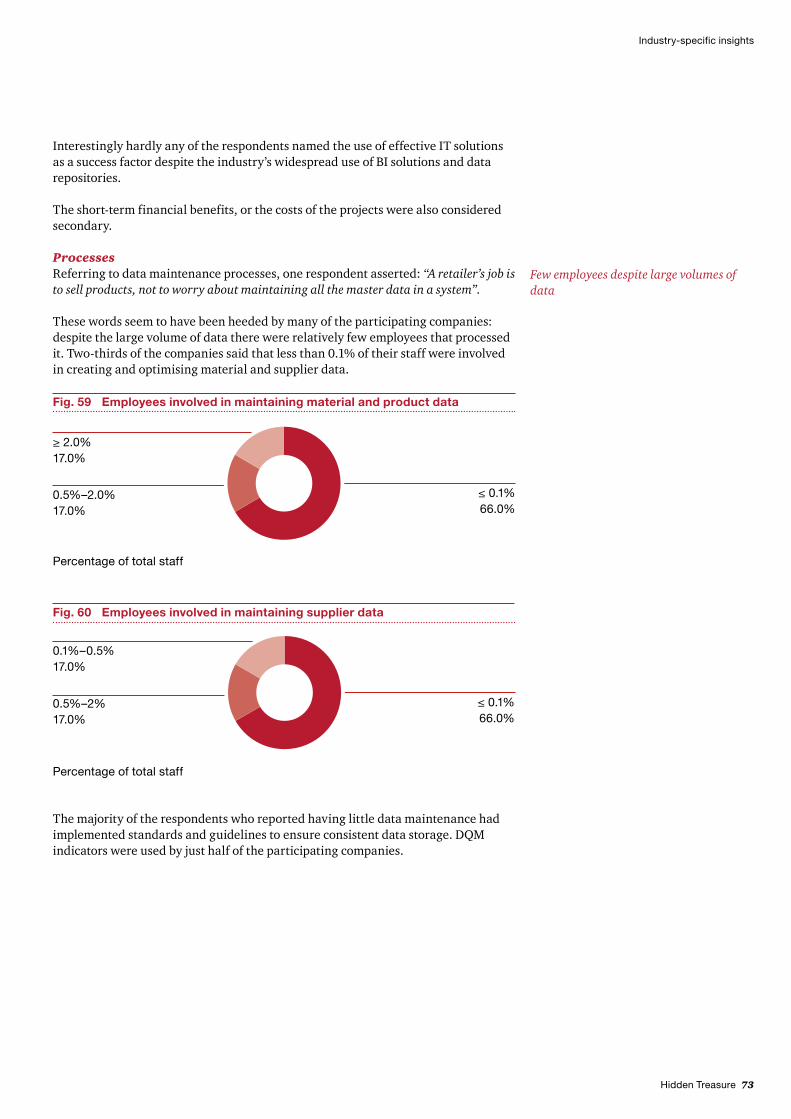
Hidden Treasure 73
Industry-specific insights
Percentage of total staff
Fig. 59 Employees involved in maintaining material and product data
0.5%–2.0%17.0%
≥ 2.0%17.0%
≤ 0.1%66.0%
Interestingly hardly any of the respondents named the use of effective IT solutions as a success factor despite the industry’s widespread use of BI solutions and data repositories.
The short-term financial benefits, or the costs of the projects were also considered secondary.
ProcessesReferring to data maintenance processes, one respondent asserted: “A retailer’s job is to sell products, not to worry about maintaining all the master data in a system”.
These words seem to have been heeded by many of the participating companies: despite the large volume of data there were relatively few employees that processed it. Two-thirds of the companies said that less than 0.1% of their staff were involved in creating and optimising material and supplier data.
Few employees despite large volumes of data
Percentage of total staff
Fig. 60 Employees involved in maintaining supplier data
0.5%–2%17.0%
0.1%–0.5%17.0%
≤ 0.1%66.0%
The majority of the respondents who reported having little data maintenance had implemented standards and guidelines to ensure consistent data storage. DQM indicators were used by just half of the participating companies.
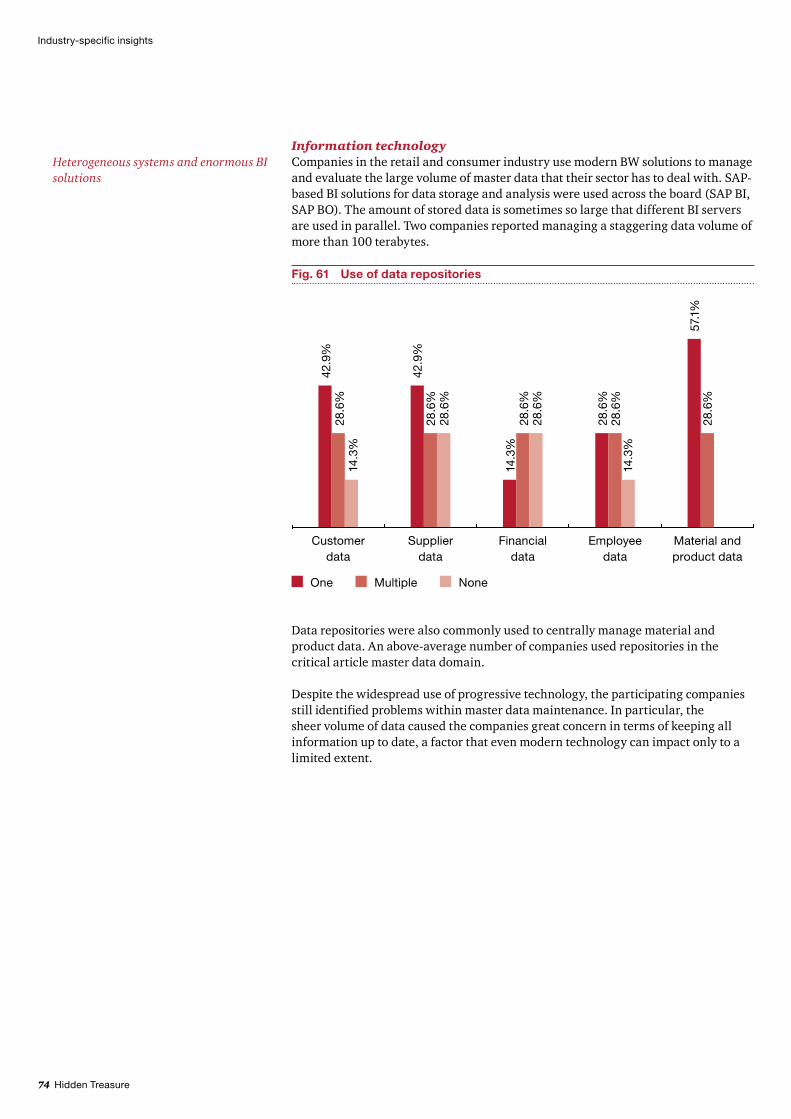
74 Hidden Treasure
Information technologyCompanies in the retail and consumer industry use modern BW solutions to manage and evaluate the large volume of master data that their sector has to deal with. SAP-based BI solutions for data storage and analysis were used across the board (SAP BI, SAP BO). The amount of stored data is sometimes so large that different BI servers are used in parallel. Two companies reported managing a staggering data volume of more than 100 terabytes.
Heterogeneous systems and enormous BI solutions
Industry-specific insights
Data repositories were also commonly used to centrally manage material and product data. An above-average number of companies used repositories in the critical article master data domain.
Despite the widespread use of progressive technology, the participating companies still identified problems within master data maintenance. In particular, the sheer volume of data caused the companies great concern in terms of keeping all information up to date, a factor that even modern technology can impact only to a limited extent.
Fig. 61 Use of data repositories
One Multiple None
Customer data
42.9
%28
.6%
14.3
%
Supplier data
42.9
%28
.6%
28.6
%
Financial data
28.6
%28
.6%
14.3
%
Employee data
28.6
%28
.6%
14.3
%
Material and product data
57.1
%28
.6%
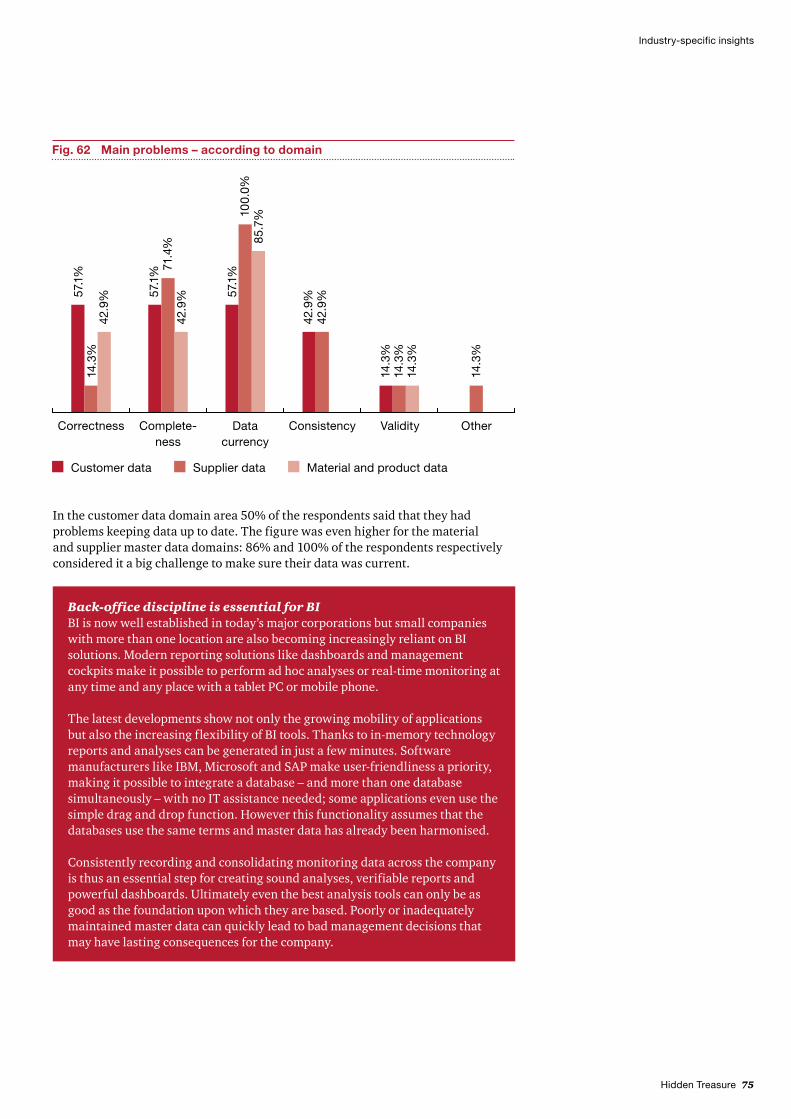
Hidden Treasure 75
Industry-specific insights
Fig. 62 Main problems – according to domain
Correctness Complete -ness
Data currency
Validity OtherConsistency
Customer data Supplier data Material and product data
57.1
%14
.3%
42.9
% 57.1
%
57.1
%10
0.0%
85.7
%
42.9
%42
.9%
14.3
%14
.3%
14.3
%
71.4
%42
.9%
14.3
%
Back-office discipline is essential for BIBI is now well established in today’s major corporations but small companies with more than one location are also becoming increasingly reliant on BI solutions. Modern reporting solutions like dashboards and management cockpits make it possible to perform ad hoc analyses or real-time monitoring at any time and any place with a tablet PC or mobile phone.
The latest developments show not only the growing mobility of applications but also the increasing flexibility of BI tools. Thanks to in-memory technology reports and analyses can be generated in just a few minutes. Software manufacturers like IBM, Microsoft and SAP make user-friendliness a priority, making it possible to integrate a database – and more than one database simultaneously – with no IT assistance needed; some applications even use the simple drag and drop function. However this functionality assumes that the databases use the same terms and master data has already been harmonised.
Consistently recording and consolidating monitoring data across the company is thus an essential step for creating sound analyses, verifiable reports and powerful dashboards. Ultimately even the best analysis tools can only be as good as the foundation upon which they are based. Poorly or inadequately maintained master data can quickly lead to bad management decisions that may have lasting consequences for the company.
In the customer data domain area 50% of the respondents said that they had problems keeping data up to date. The figure was even higher for the material and supplier master data domains: 86% and 100% of the respondents respectively considered it a big challenge to make sure their data was current.

76 Hidden Treasure
Industry-specific insights
Current status and outlook The retail and consumer industry has been undergoing massive changes for years: it is continuously adapting to company size, international presence and the changing behaviour of consumers. New sales markets, products and distribution channels have resulted in large volumes of data which require both consistently implemented data governance and the effective use of technology.
The necessary governance, process standards and technology have been largely implemented across the retail and consumer industry and aligned with one another as part of a comprehensive approach. The value of high-quality data seems to be recognised in the industry. One of the participants in our study summed it up as follows: “Master data projects require an initial investment; we only see the results in terms of sales in the medium term”.
In recent years the industry has concentrated on optimising data quality. Some 80% of the respondents said that they had had the greatest success in this area. All of the respondents said that they planned to make future investments in master data projects and keep developing their MDM. According to the respondents in the future “clear and continuous support from top management” will be just as important as recruiting and developing qualified employees with knowledge of data management.
7 Services
This chapter describes the state of MDM in the services industry. The information presented here was gathered from six companies that provide services in logistics, the public sector, consulting and staff recruitment. Financial services providers are not included in this chapter (see chapter 4). Five of the companies interviewed have fewer than 10,000 employees; the remaining company is the group heavyweight with more than 160,000 employees.
Although industrial manufacturing companies once dominated the workforce they have now been overtaken by the services sector. Around 70% of the population of industrialised countries now work in the services sector. In Germany 69.6% of the population are employed by some kind of service company while in the USA a staggering 78.6% of the labour force works in the tertiary sector.
According to current statistics international corporations are no longer the only enterprises to outsource parts of their business activities. Small to medium businesses are increasingly turning to third-party service providers. For every core competency that was once considered sacred today there are a number of companies that can provide the same service more efficiently, with higher quality for lower cost. Now marketing, logistics, financial accounting and even payroll accounting is outsourced. Companies are also increasingly contracting various experts for short-term projects, generating a mini-boom for staff recruitment agencies and consulting companies.
Data qualityIn terms of master data service companies are faced with the challenge of portraying their intangible, highly customised products as concrete data. While options such as EAN codes, DIN standards and Global Trade Item Numbers (GTINs) exist in the manufacturing and retail industries, equivalent items tend to be rare in the services industry and mostly limited to process standards such as DIN 9001.
High level of maturity but further development still crucial
Key data have the lowest level of quality
4 Cf. Federal Statistical Office of Germany (ed.): The Statistical Yearbook, 2010.
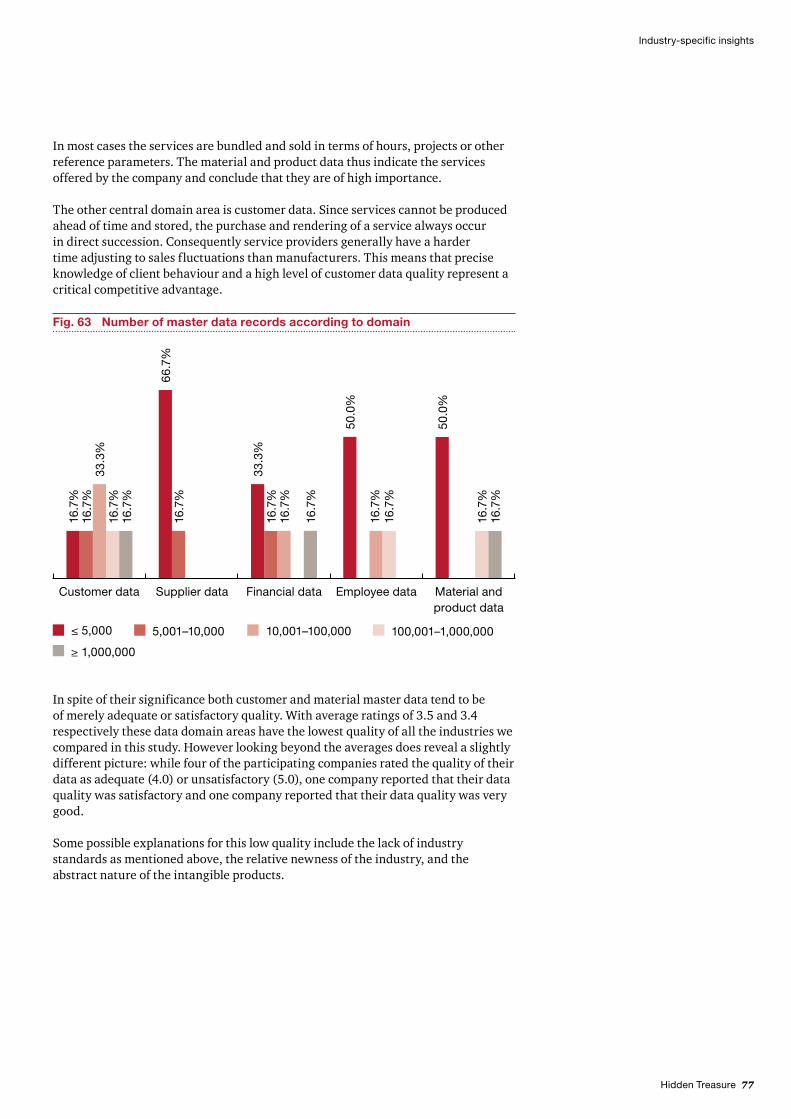
Hidden Treasure 77
Industry-specific insights
Fig. 63 Number of master data records according to domain
Material and product data
Employee dataFinancial dataSupplier data
16.7
%16
.7%
33.3
%16
.7%
16.7
%
66.7
%16
.7%
33.3
%16
.7%
16.7
%
16.7
%
50.0
%
16.7
%16
.7%
50.0
%
16.7
%16
.7%
Customer data
≤ 5,000 5,001–10,000 100,001–1,000,000
≥ 1,000,000
10,001–100,000
In most cases the services are bundled and sold in terms of hours, projects or other reference parameters. The material and product data thus indicate the services offered by the company and conclude that they are of high importance.
The other central domain area is customer data. Since services cannot be produced ahead of time and stored, the purchase and rendering of a service always occur in direct succession. Consequently service providers generally have a harder time adjusting to sales fluctuations than manufacturers. This means that precise knowledge of client behaviour and a high level of customer data quality represent a critical competitive advantage.
In spite of their significance both customer and material master data tend to be of merely adequate or satisfactory quality. With average ratings of 3.5 and 3.4 respectively these data domain areas have the lowest quality of all the industries we compared in this study. However looking beyond the averages does reveal a slightly different picture: while four of the participating companies rated the quality of their data as adequate (4.0) or unsatisfactory (5.0), one company reported that their data quality was satisfactory and one company reported that their data quality was very good.
Some possible explanations for this low quality include the lack of industry standards as mentioned above, the relative newness of the industry, and the abstract nature of the intangible products.

78 Hidden Treasure
When looking at the number of redundant data records, it is also interesting to look beyond the average figure. Two of the companies reported very good figures in the 0% to 10% range for their customer and material data. Three companies reported that their master data redundancy was as high as 50% in these domains. One company did not provide a response to this question.
Industry-specific insights
Unlike customer and material data, employee data was of high quality. The average rating of 2.0 can be traced back to the small number of employees and to the consistent data maintenance. This is not surprising, since information about employee skills and abilities is of great strategic importance to a consulting company.
Supplier master data tend to play a secondary role in the services industry. The service providers reported having a relatively small number of suppliers (generally
Fig. 64 Data quality according to domain
Very good
Poor
4
3
2
5
1
Supplier data
2.4
Financial data
2.2
Employee data
2.0
Material and product data
3.4
Customer data
3.5
Fig. 65 Redundant data records
50.1–70.0% ≥ 70.0%30.1–50.0%10.1–30.0%
33.3
%
33.3
%
16.7
%
33.3
%
33.3
%
16.7
%
≤ 10.0%
Customer data Material and product data
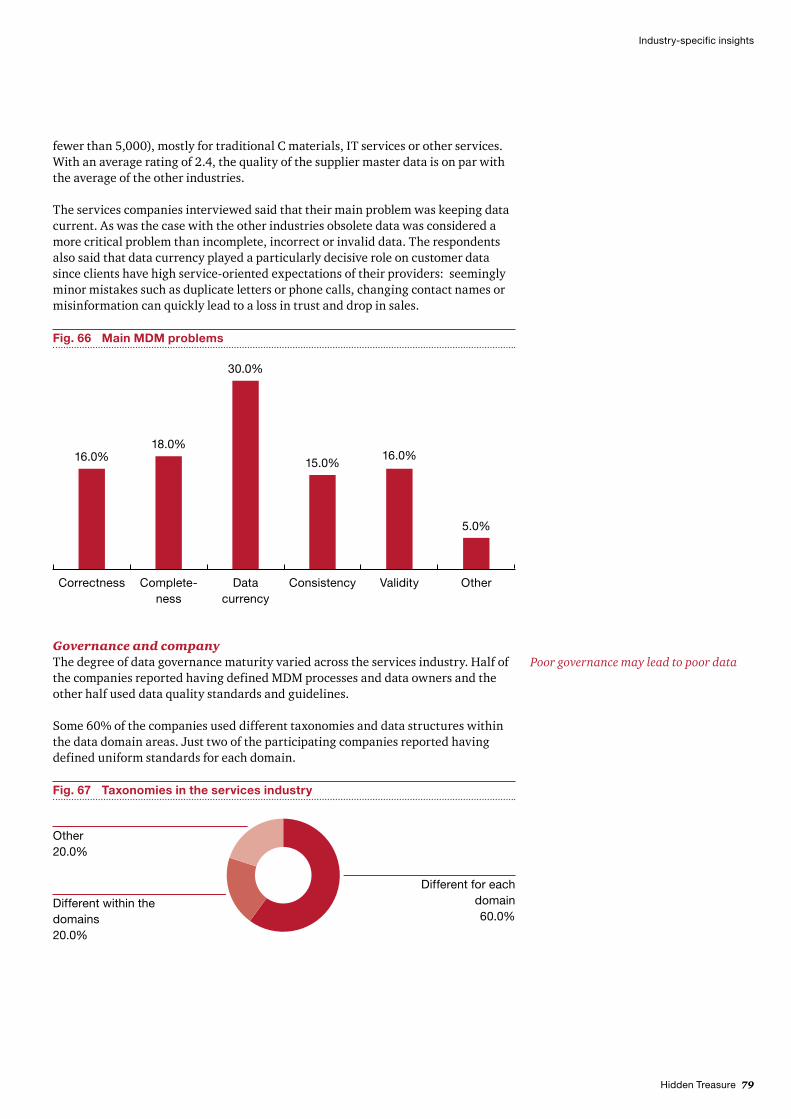
Hidden Treasure 79
Industry-specific insights
fewer than 5,000), mostly for traditional C materials, IT services or other services. With an average rating of 2.4, the quality of the supplier master data is on par with the average of the other industries.
The services companies interviewed said that their main problem was keeping data current. As was the case with the other industries obsolete data was considered a more critical problem than incomplete, incorrect or invalid data. The respondents also said that data currency played a particularly decisive role on customer data since clients have high service-oriented expectations of their providers: seemingly minor mistakes such as duplicate letters or phone calls, changing contact names or misinformation can quickly lead to a loss in trust and drop in sales.
Fig. 67 Taxonomies in the services industry
Different for each domain60.0%
Different within the domains20.0%
Other 20.0%
Fig. 66 Main MDM problems
5.0%
Other
16.0%
Validity
15.0%
Consistency
30.0%
Data currency
18.0%
Complete -ness
Correctness
16.0%
Governance and companyThe degree of data governance maturity varied across the services industry. Half of the companies reported having defined MDM processes and data owners and the other half used data quality standards and guidelines.
Some 60% of the companies used different taxonomies and data structures within the data domain areas. Just two of the participating companies reported having defined uniform standards for each domain.
Poor governance may lead to poor data

80 Hidden Treasure
Fig. 68 Motivation for implementing MDM
Process efficiency in
business processes
Process efficiency in
MDM
Compliance/ risk
Quality-related
33.3%33.3%
66.7%
50.0%
100.0%
Financial
Multiple answers were possible
Industry-specific insights
The extent to which maintenance of the individual domains is centralised is just as varied. There are significant differences between both the companies and the individual domain areas. The following trends were identified: financial, supplier and employee data are primarily maintained centrally while maintenance structures for customer master data tend to be devolved – a familiar scenario among other industries.
Information technologyAside from the need for optimisation in data governance there is room for improvement in technology too. Just one company used a central data repository to manage their customer data. Two companies (33% of respondents) reported using a central system for their product master data.
The domain areas with the highest data quality in the services industry (employee and financial data) were maintained in central systems: two-thirds of the respondents used cetnral data repositories to maintain their HR and financial data. The use of central data systems seems to have a positive effect on how companies rate the quality of their master data.
Central data repositories ensure high quality
Respondent ratings for the effectiveness of their data governance varied with three companies unable to make any statements and the remaining three giving ratings of very good, good and satisfactory.
When compared to other industries, the services industry has some catching up to do in terms of defining responsibilities and implementing uniform standards and structures for their master data.
ProcessesAll of the participating companies said that increasing the efficiency of their business processes was a central driver for MDM initiatives. Although legal requirements and regulatory compliance were also considered important, efficient MDM processes (cited by just two companies) and financial/quality-related factors (cited by three companies) were considered less so.
Efficiency a central driver
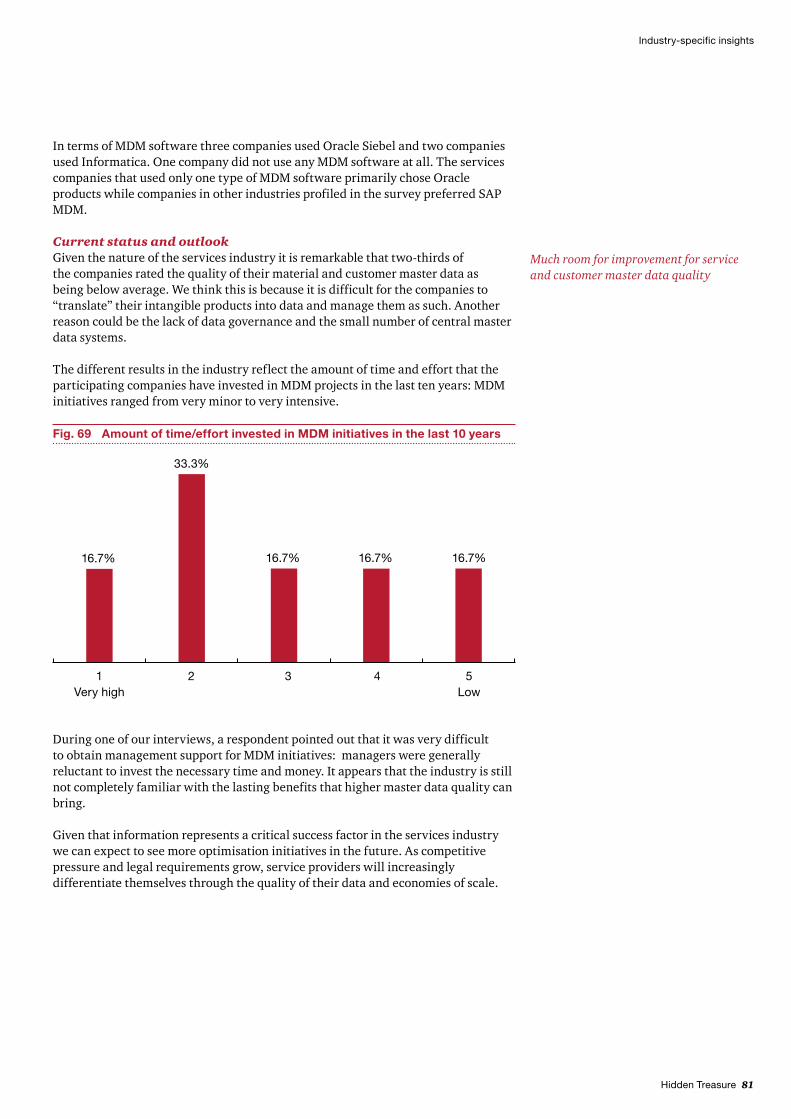
Hidden Treasure 81
Industry-specific insights
Fig. 69 Amount of time/effort invested in MDM initiatives in the last 10 years
5 Low
432
16.7%
33.3%
16.7% 16.7% 16.7%
1 Very high
In terms of MDM software three companies used Oracle Siebel and two companies used Informatica. One company did not use any MDM software at all. The services companies that used only one type of MDM software primarily chose Oracle products while companies in other industries profiled in the survey preferred SAP MDM.
Current status and outlookGiven the nature of the services industry it is remarkable that two-thirds of the companies rated the quality of their material and customer master data as being below average. We think this is because it is difficult for the companies to “translate” their intangible products into data and manage them as such. Another reason could be the lack of data governance and the small number of central master data systems.
The different results in the industry reflect the amount of time and effort that the participating companies have invested in MDM projects in the last ten years: MDM initiatives ranged from very minor to very intensive.
Much room for improvement for service and customer master data quality
During one of our interviews, a respondent pointed out that it was very difficult to obtain management support for MDM initiatives: managers were generally reluctant to invest the necessary time and money. It appears that the industry is still not completely familiar with the lasting benefits that higher master data quality can bring.
Given that information represents a critical success factor in the services industry we can expect to see more optimisation initiatives in the future. As competitive pressure and legal requirements grow, service providers will increasingly differentiate themselves through the quality of their data and economies of scale.

82 Hidden Treasure
Industry-specific insights
8 Technology & Telecommunications
At first glance the technology and telecommunications sectors might seem too disparate to be grouped into one category but a closer look reveals that there is indeed a high degree of convergence. The integration of computer, internet, telephone and television technologies in a digital environment has become commonplace everywhere. Content is increasingly being liberated from any particular medium and the liberation from any specific location is currently gaining a foothold through the use of mobile terminal devices. By virtue of its unique positioning the technology and telecommunications industry is already used to coping with great pressure to be innovative. As a result, companies have very high expectations when it comes to a flexible and dynamic response to the market.
For this study we interviewed nine companies within this sector including three telecommunications companies and six technology companies. We wanted to find out how the technology and telecommunications industry had implemented its characteristic innovations and dynamic nature in MDM processes and systems. Our expectations were high; after all, the industry includes software manufacturers who themselves play a significant role in MDM.
Data qualityCustomer master data is of particular importance for telecommunications providers. The cut-throat competition in the telecom industry and the marketing measures make it essential for companies to have reliable information about their customers. Thus, it is hardly surprising that the companies in this industry reported having the highest-quality customer master data. The companies also deal with large volumes of data compared to the industries used for this study. It is not at all unusual for a telecommunications company to have 50 million customer master data records or more. As a result companies have had to find solutions to extraordinary companyal and technological challenges. The time and effort they have invested has paid off: despite the enormous amounts of data the companies still have high quality customer master data. Nevertheless the industry is still faced with an enormous challenge. Since customer master data has always been maintained separately in different product divisions the integration of mobile telephones, landlines, internet and various entertainment services means that millions upon millions of customer master data records now need to be aligned and connected while at the same time adhering to data protection requirements.
Data quality is also very high in technology companies. Although they often have less data (an international corporation, for example, might have fewer than 500,000 data records) the amount of maintenance work required is still substantial.
The technology and telecommunications industry on the whole has achieved a good average data quality through intensive processing of customer master data.
Quality of financial and customer master data is good
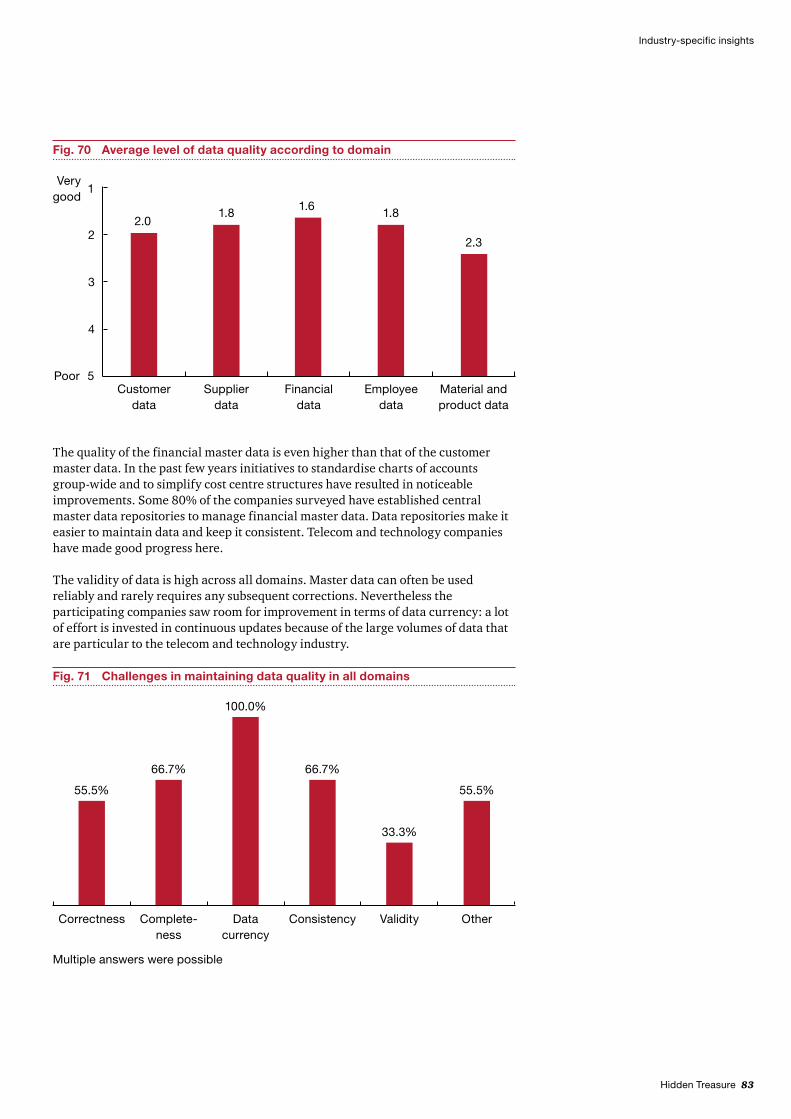
Hidden Treasure 83
Industry-specific insights
Fig. 71 Challenges in maintaining data quality in all domains
55.5%
Other
33.3%
Validity
66.7%
Consistency
100.0%
Data currency
66.7%
Complete -ness
Correctness
55.5%
Multiple answers were possible
Fig. 70 Average level of data quality according to domain
Very good
Poor
4
3
2
Employee data
1.8
Material and product data
2.3
Financial data
1.6
5
1
Customer data
2.0
Supplier data
1.8
The quality of the financial master data is even higher than that of the customer master data. In the past few years initiatives to standardise charts of accounts group-wide and to simplify cost centre structures have resulted in noticeable improvements. Some 80% of the companies surveyed have established central master data repositories to manage financial master data. Data repositories make it easier to maintain data and keep it consistent. Telecom and technology companies have made good progress here.
The validity of data is high across all domains. Master data can often be used reliably and rarely requires any subsequent corrections. Nevertheless the participating companies saw room for improvement in terms of data currency: a lot of effort is invested in continuous updates because of the large volumes of data that are particular to the telecom and technology industry.
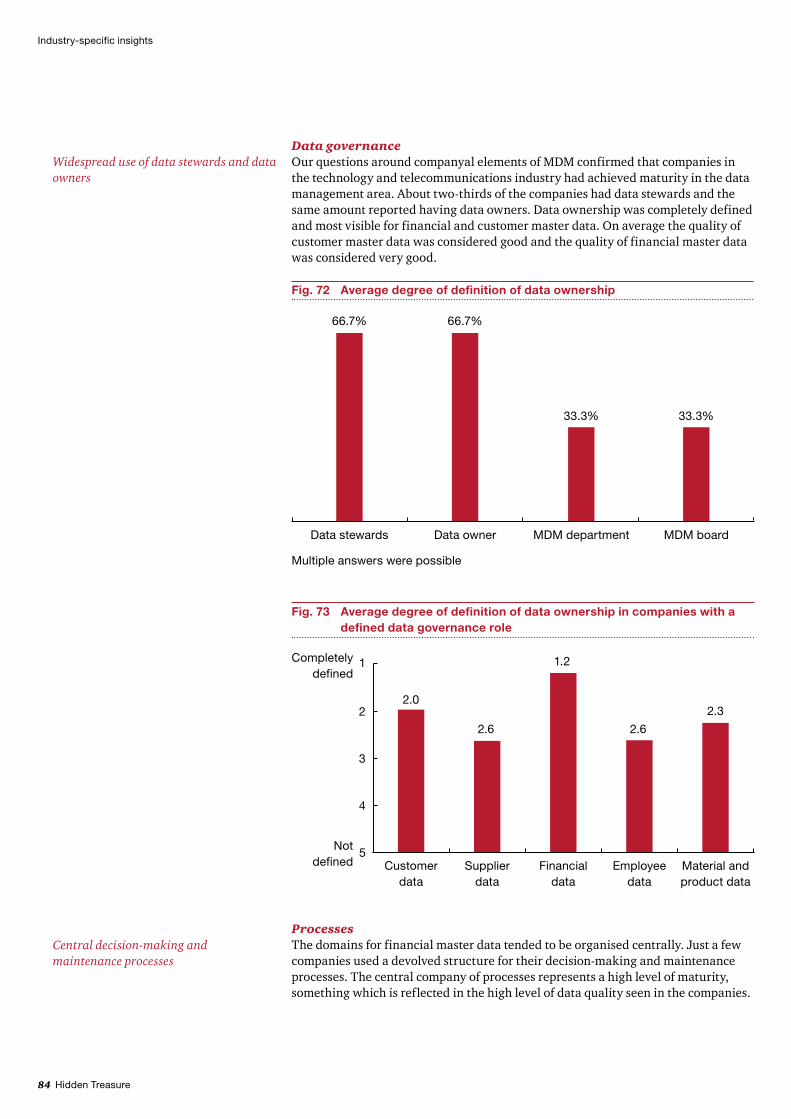
84 Hidden Treasure
Fig. 73 Average degree of definition of data ownership in companies with a defined data governance role
5
4
3
2
1
Customer data
2.0
Supplier data
2.6
Employee data
2.6
Material and product data
2.3
Financial data
1.2Completely defined
Not defined
Fig. 72 Average degree of definition of data ownership
66.7% 66.7%
MDM boardMDM departmentData stewards Data owner
33.3% 33.3%
Multiple answers were possible
Industry-specific insights
Data governanceOur questions around companyal elements of MDM confirmed that companies in the technology and telecommunications industry had achieved maturity in the data management area. About two-thirds of the companies had data stewards and the same amount reported having data owners. Data ownership was completely defined and most visible for financial and customer master data. On average the quality of customer master data was considered good and the quality of financial master data was considered very good.
Widespread use of data stewards and data owners
ProcessesThe domains for financial master data tended to be organised centrally. Just a few companies used a devolved structure for their decision-making and maintenance processes. The central company of processes represents a high level of maturity, something which is reflected in the high level of data quality seen in the companies.
Central decision-making and maintenance processes
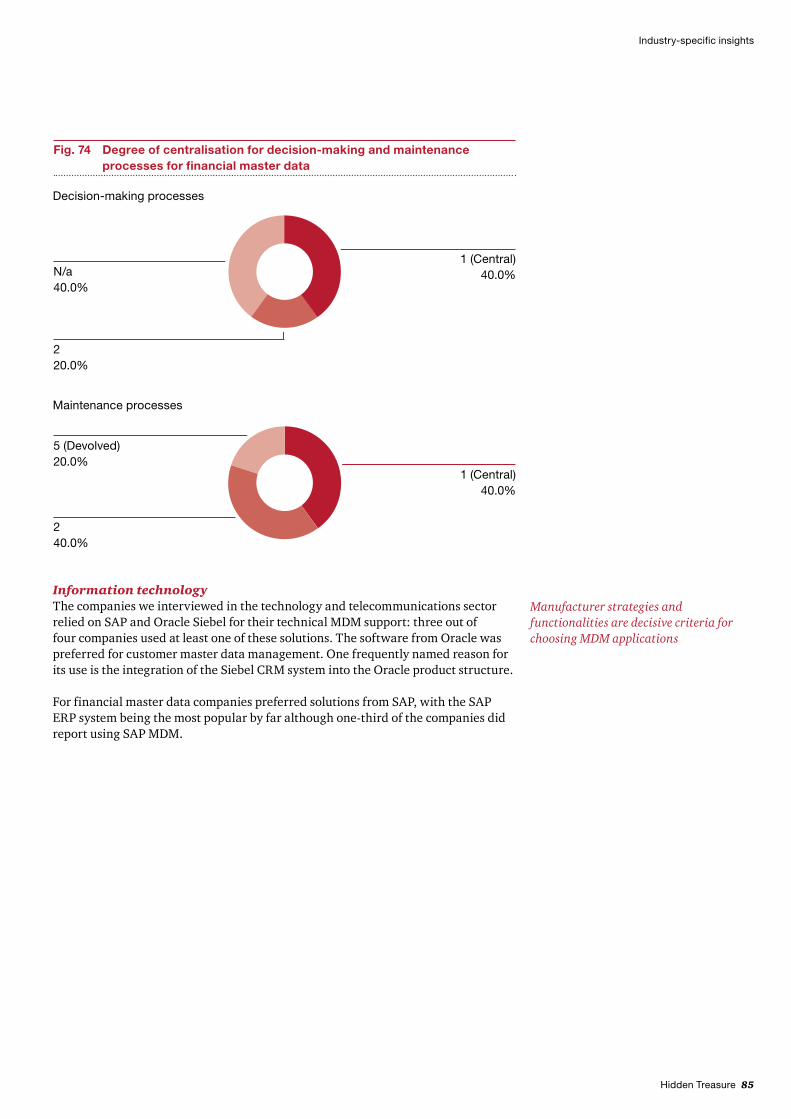
Hidden Treasure 85
Industry-specific insights
Fig. 74 Degree of centralisation for decision-making and maintenance processes for financial master data
Decision-making processes
Maintenance processes
1 (Central) 40.0%N/a
40.0%
2 20.0%
1 (Central) 40.0%
2 40.0%
5 (Devolved) 20.0%
Information technologyThe companies we interviewed in the technology and telecommunications sector relied on SAP and Oracle Siebel for their technical MDM support: three out of four companies used at least one of these solutions. The software from Oracle was preferred for customer master data management. One frequently named reason for its use is the integration of the Siebel CRM system into the Oracle product structure.
For financial master data companies preferred solutions from SAP, with the SAP ERP system being the most popular by far although one-third of the companies did report using SAP MDM.
Manufacturer strategies and functionalities are decisive criteria for choosing MDM applications

86 Hidden Treasure
Industry-specific insights
Fig. 75 Criteria for implementing software
Functionality
3.8
Supplier
3.2
Costs
4.7
Architecture strategy
5.3
Distribution
5.35
4
3
2
1
6
Highly significant
Not significant
In most cases, the choice of software solutions was informed by the company’s manufacturing strategy. In terms of the IT strategy, a medium- to long-term road map was defined that covers data management and specifies software solutions.
Another decisive factor for choosing one MDM software solution over another is the type of functionalities it offers. During the selection process different applications are reviewed and their support of certain functions examined with the company then selecting the software product that provides the most benefits.
Current status and outlookThe results of the interviews with technology and telecommunications companies confirm that customer and financial master data are highly important in the industry. These data domain areas have also achieved high levels of quality and have well-developed governance structures.
Nevertheless to date very few companies have managed to transfer their knowledge to other domain areas. Consequently there is a lot of untapped potential to exploit synergies and knowledge transfer within this area.
The biggest task facing this industry is to expand the use of support tools. More than two-thirds of the companies said they did not use a dedicated MDM solution in at least one of the five data domains. The lack of technical support for DQM is even larger. There is a lot of potential for companies in the telecom and technology industry to increase their MDM efficiency.
Customer and financial master data is highly relevant, but use of synergies is rare

Hidden Treasure 87
MDM of the future: Where will the journey take us?
C MDM of the future: Where will the journey take us?
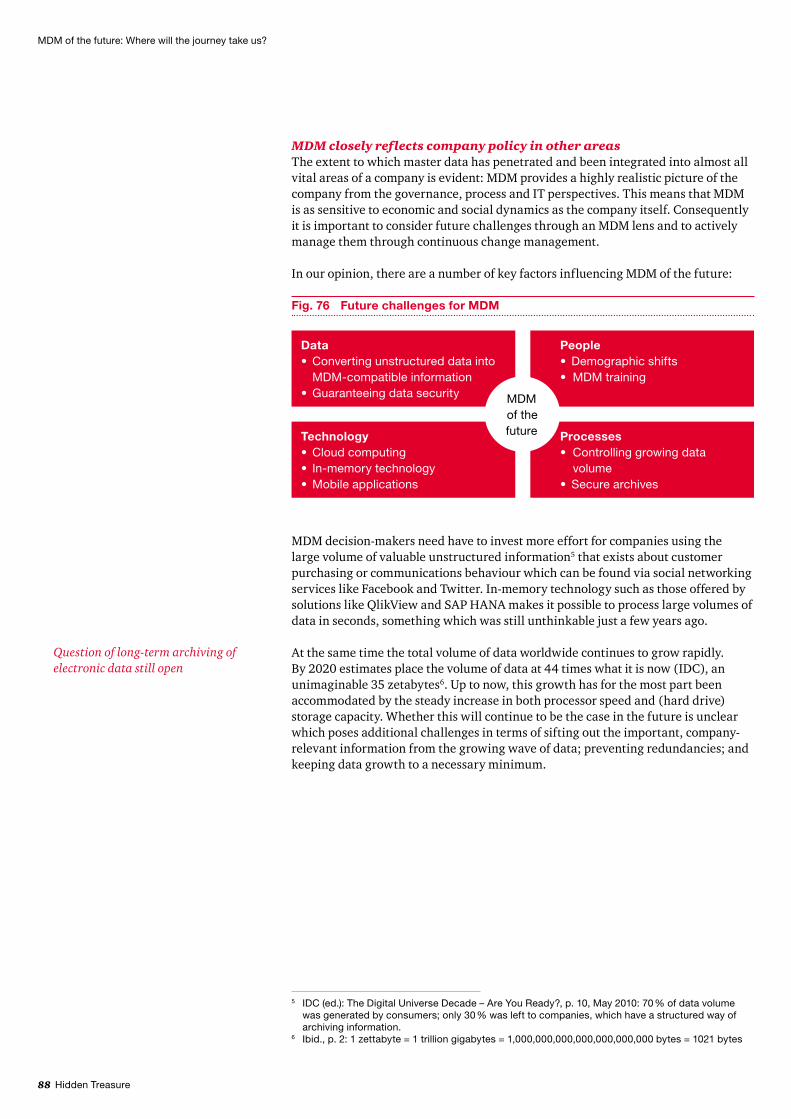
88 Hidden Treasure
MDM closely reflects company policy in other areasThe extent to which master data has penetrated and been integrated into almost all vital areas of a company is evident: MDM provides a highly realistic picture of the company from the governance, process and IT perspectives. This means that MDM is as sensitive to economic and social dynamics as the company itself. Consequently it is important to consider future challenges through an MDM lens and to actively manage them through continuous change management.
In our opinion, there are a number of key factors influencing MDM of the future:
Fig. 76 Future challenges for MDM
DataConverting unstructured data into •MDM-compatible informationGuaranteeing data security•
TechnologyCloud computing•In-memory technology•Mobile applications•
PeopleDemographic shifts•
•MDMtraining
Processes•Controllinggrowingdata
volumeSecure archives•
MDMof the future
MDM decision-makers need have to invest more effort for companies using the large volume of valuable unstructured information5 that exists about customer purchasing or communications behaviour which can be found via social networking services like Facebook and Twitter. In-memory technology such as those offered by solutions like QlikView and SAP HANA makes it possible to process large volumes of data in seconds, something which was still unthinkable just a few years ago.
At the same time the total volume of data worldwide continues to grow rapidly. By 2020 estimates place the volume of data at 44 times what it is now (IDC), an unimaginable 35 zetabytes6. Up to now, this growth has for the most part been accommodated by the steady increase in both processor speed and (hard drive) storage capacity. Whether this will continue to be the case in the future is unclear which poses additional challenges in terms of sifting out the important, company-relevant information from the growing wave of data; preventing redundancies; and keeping data growth to a necessary minimum.
Question of long-term archiving of electronic data still open
5 IDC (ed.): The Digital Universe Decade – Are You Ready?, p. 10, May 2010: 70 % of data volume was generated by consumers; only 30 % was left to companies, which have a structured way of archiving information.
6 Ibid., p. 2: 1 zettabyte = 1 trillion gigabytes = 1,000,000,000,000,000,000,000 bytes = 1021 bytes
MDM of the future: Where will the journey take us?

Hidden Treasure 89
MDM of the future: Where will the journey take us?
There is also the consideration of how to archive data so that we can still process it far into the coming decades. At the moment there is no reliable technology available that allows data to be permanently stored without any loss aside from the familiar analogue solution (printed material) that prevailed until around 1960.
Data security will also become an increasingly important part of master data in light of the growing rate of cybercrime, industrial espionage and the publishing of leaked documents through channels such as WikiLeaks. Thanks to new technology, the number of ways to gain illegal access to data and information is growing along with a willing army of people ready to take advantage of vulnerabilities; recent examples include an informant’s offering of a stolen CD of information on tax evaders to the German government for a hefty sum and the regular publishing of classified documents by WikiLeaks. According to IDC estimates the volume of data that should be protected is growing faster than the volume of data that does not require protection.7
This backdrop also begs the question of how cloud technology will impact the optimised storage of master data. Even today companies are already striving to replace non-sensitive data, for example in supplier records, or to classify product data in order to avoid redundant data storage and management and to benefit from common standards of quality. There is still a great deal of potential to collectively improve MDM across all companies while still maintaining data security and with it each company’s potential competitive advantage.
In our opinion the consumers and clients themselves will be the regulating force for fundamental change: more and more information is required in real time to provide complete transparency for consumers. As an example, recent food-related scandals have served to strengthen demand. The increasing processing power of mobile terminal devices, such as Smartphones and tablet PCs, coupled with expanding networks will also advance this process further, posing new challenges for companies and MDM decision-makers.
Companies will need competent, well-qualified staff to master the challenges described here. Many companies are already having a hard time finding employees who have the skills and competences needed to make an MDM department successful. In general, a very unusual combination of competences is required:
Extensive knowledge of value-creating business processes and the significance of •process-related master data Good knowledge of governance and companyal structures•Good IT knowledge•
Data security increasingly important
Growing need for qualified employees in MDM departments
7 Ibid., p. 7.

90 Hidden Treasure
MDM of the future: Where will the journey take us?
As a rule, this type of employee tends to develop over time through a combination of experience, long-term employment, and integration across business units. Unsurprisingly, they are a rare breed so we can expect to see an increased need for training programmes that will allow a company to both broaden and deepen the scope of its existing MDM expertise. Training programmes offer an interesting opportunity to open up options off the beaten career path, potentially for older and more experienced employees, while at the same time effectively meeting staffing bottlenecks that have arisen out of demographic developments.
Given the current-state of MDM presented here and the upcoming challenges we are predicting, MDM will remain a focal point for businesses, becoming even more integral and relevant. Successful decision-makers will, if they have not already done so, recognise this and drive its implementation through the respective business context.
Hidden Treasure 91
Additional information
D Additional information
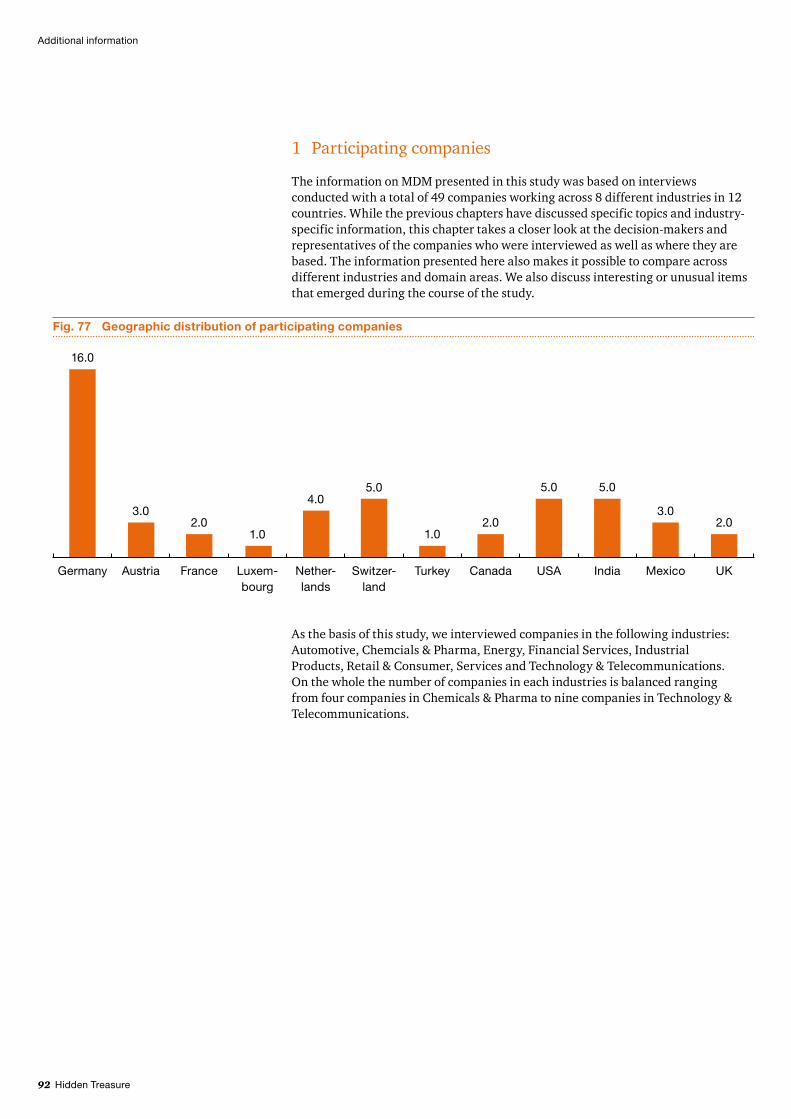
92 Hidden Treasure
1 Participating companies
The information on MDM presented in this study was based on interviews conducted with a total of 49 companies working across 8 different industries in 12 countries. While the previous chapters have discussed specific topics and industry-specific information, this chapter takes a closer look at the decision-makers and representatives of the companies who were interviewed as well as where they are based. The information presented here also makes it possible to compare across different industries and domain areas. We also discuss interesting or unusual items that emerged during the course of the study.
Fig. 77 Geographic distribution of participating companies
Germany
16.0
Austria
3.0
France
2.0
Luxem- bourg
1.0
Nether- lands
4.0
Switzer -land
5.0
Turkey
1.02.0
Canada
5.0
USA
5.0
India
3.0
Mexico
2.0
UK
As the basis of this study, we interviewed companies in the following industries: Automotive, Chemcials & Pharma, Energy, Financial Services, Industrial Products, Retail & Consumer, Services and Technology & Telecommunications. On the whole the number of companies in each industries is balanced ranging from four companies in Chemicals & Pharma to nine companies in Technology & Telecommunications.
Additional information

Hidden Treasure 93
Fig. 78 Industry distribution of participating companies
5.0
7.0 7.0
6.0
9.0
6.0
Automotive
4.0
Chemicals & Pharma
5.0
Energy Financial Services
Industrial Products
Retail & Consumer
Services Technology & Tele -
communications
Additional information
In terms of number of employees, the smallest company had just under 100 and the largest several hundred thousand.
We chose to interview a broad spectrum of companies of different sizes to obtain as complete a picture as possible of the current status of MDM. The majority of companies with fewer than 5,000 employees were regional enterprises, while companies with more than 100,000 employers were mostly global corporations.
Fig. 79 Size of participating companies
≥ 200,000100,001– 200,000
50,001– 100,000
25,001– 50,001
≤ 5,000
Number of employees per company
5,001– 25,000
16.0
10.0
5.06.0
4.0
8.0
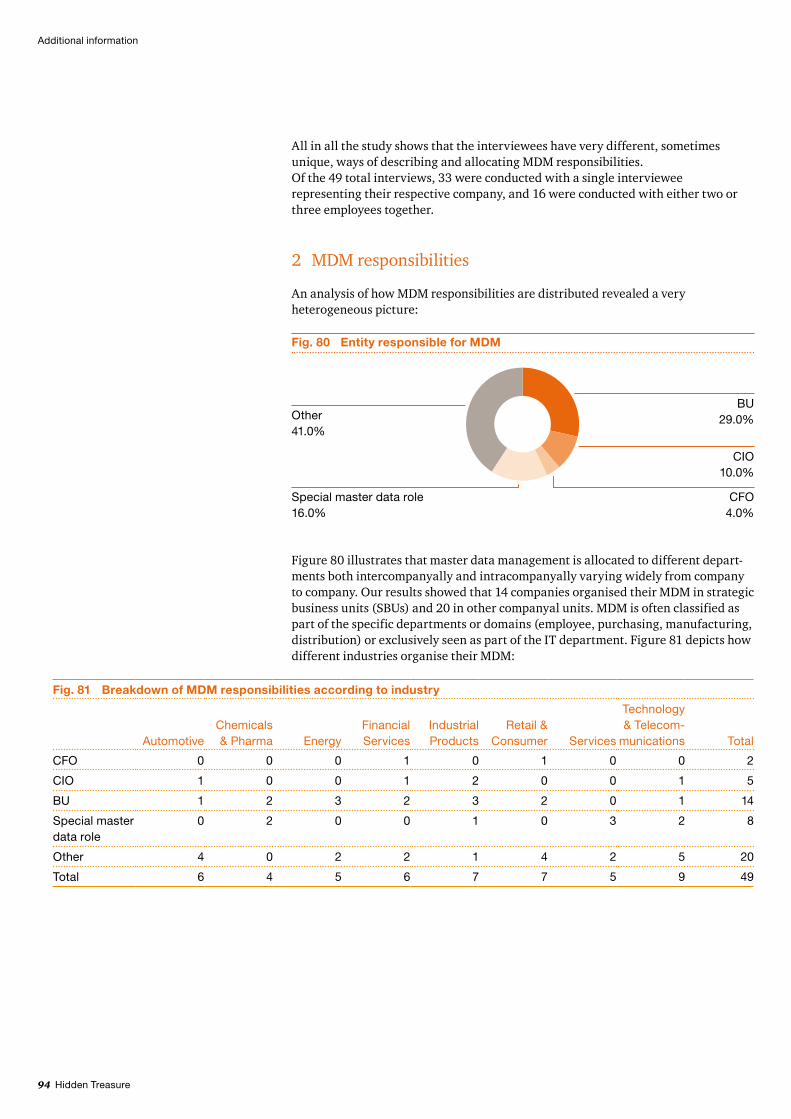
94 Hidden Treasure
Fig. 81 Breakdown of MDM responsibilities according to industry
AutomotiveChemicals & Pharma Energy
Financial Services
Industrial Products
Retail & Consumer Services
Technology & Tele com-
munications Total
CFO 0 0 0 1 0 1 0 0 2
CIO 1 0 0 1 2 0 0 1 5
BU 1 2 3 2 3 2 0 1 14
Special master data role
0 2 0 0 1 0 3 2 8
Other 4 0 2 2 1 4 2 5 20
Total 6 4 5 6 7 7 5 9 49
Additional information
Figure 80 illustrates that master data management is allocated to different depart-ments both intercompanyally and intracompanyally varying widely from company to company. Our results showed that 14 companies organised their MDM in strategic business units (SBUs) and 20 in other companyal units. MDM is often classified as part of the specific departments or domains (employee, purchasing, manufacturing, distribution) or exclusively seen as part of the IT department. Figure 81 depicts how different industries organise their MDM:
Fig. 80 Entity responsible for MDM
CIO10.0%
BU 29.0%
CFO4.0%
Special master data role16.0%
Other41.0%
All in all the study shows that the interviewees have very different, sometimes unique, ways of describing and allocating MDM responsibilities.Of the 49 total interviews, 33 were conducted with a single interviewee representing their respective company, and 16 were conducted with either two or three employees together.
2 MDM responsibilities
An analysis of how MDM responsibilities are distributed revealed a very heterogeneous picture:

Hidden Treasure 95
Additional information
3 Number of MDM systems
The survey also enquired about the number of MDM systems companies had in place for the domain areas material and product data, customer data, supplier data, financial data and employee data. The data from all five areas was cumulatively combined to determine the average of MDM systems by (based on the number of employees) and industry.
If we look at the number of systems per domain the following picture emerges:
Fig. 82 Number of systems containing master data according to domain
9.0
7.0
10.0
14.0
14.0
9.0
12.0
Financial data Employee data
Material and product data
Customer data Supplier data
N/a≥ 5011–506–102–51
8.0
12.0
12.0
9.
03.
0 4.0
10.0
5.0
7.0
6.0
5.0
5.0
9.010
.08.
0 8.
0 7.
0
2.0
2.03.
04.0
13.0
18.0
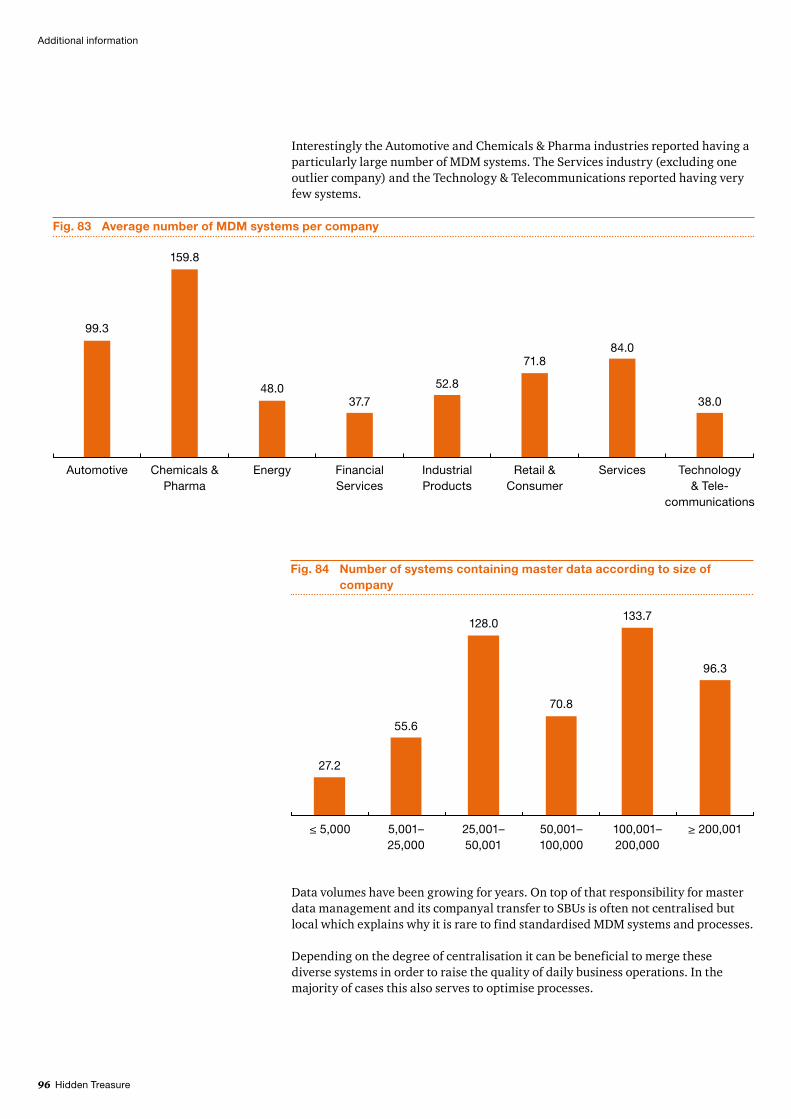
96 Hidden Treasure
Additional information
Fig. 84 Number of systems containing master data according to size of company
≤ 5,000 5,001– 25,000
25,001– 50,001
50,001– 100,000
100,001– 200,000
≥ 200,001
27.2
55.6
128.0
70.8
96.3
133.7
Data volumes have been growing for years. On top of that responsibility for master data management and its companyal transfer to SBUs is often not centralised but local which explains why it is rare to find standardised MDM systems and processes.
Depending on the degree of centralisation it can be beneficial to merge these diverse systems in order to raise the quality of daily business operations. In the majority of cases this also serves to optimise processes.
Fig. 83 Average number of MDM systems per company
99.3
159.8
48.037.7
52.8
71.884.0
38.0
Automotive Chemicals & Pharma
Energy Financial Services
Industrial Products
Retail & Consumer
Services Technology & Tele -
communications
Interestingly the Automotive and Chemicals & Pharma industries reported having a particularly large number of MDM systems. The Services industry (excluding one outlier company) and the Technology & Telecommunications reported having very few systems.

Hidden Treasure 97
Additional information
Fig. 85 Number of companies able to respond to certain questions on data quality
Yes No
20.0
29.0
17.0
32.0
12.0
37.0
9.0
40.0
5.0
44.0
Customer data
Supplier data
Financial data
Employee data
Material and product data
4 Questions companies struggled to answer
Not all companies could make statements on the quality of their master data across all domains. While many respondents rated the quality of employee data as good to very good, many could not make any state ment about the quality of their employee data. Here it is likely that many of the respondents were part of other areas in the company.
A large number of respon dents could provide information, for example, on the quality of product and material data.

98 Hidden Treasure
Additional information
Fig. 86 Data quality of individual domains, according to size of company
Employee
Customer data Supplier data Financial data Employee data
Material and product data
≤ 5,000
2.8
2.1
2.3
1.8
2.7
5,001–25,000
2.8
2.0
2.0
2.0
2.4
25,001–50,001
2.7
2.8
1.3
1.7
2.6
50,001–100,000
2.2
1.7 1.
51.
52.
5≥ 200,001
2.3 2.
0 1.8
2.0
2.4
100,001–200,000
2.3
3.0
2.0
2.0
2.0
2
4
5
3
1 Very
good
Poor
5 Data quality
Breaking down the data quality by company size provides an extremely heterogeneous picture. Spikes in both directions (above and below average) can be seen in all domains in companies of all sizes.
Employee and financial data are for the most part of very good quality and the supplier data is almost completely in the good range. The quality of the material and product data and customer data are not rated as highly.

Hidden Treasure 99
Fig. 87 Legal form of participating companies
OtherPublic sectorFamily businessListed corporation
35.0
5.03.0
6.0
6 Types of companies
The majority of the surveyed companies are listed on a stock exchange but there were also some family businesses, companies in the public sector and commercial enterprises in the private sector.
Fig. 88 Percentage of listed companies according to stock exchange
DAX (D)
NYSE (USA) LSE (GB)
TSE (CDN)
SMI (CH)
AEX (NL)
Other
12.0
4.0
2.0 2.0
10.0
2.0
3.0
Additional information
Because a large number of the companies are based in Germany the study included a disproportionately high number of DAX companies. The study also included companies listed on other exchanges, such as the New York Stock Exchange (NYSE), the London Stock Exchange (LSE) and the Toronto Stock Exchange (TSE).
100 Hidden Treasure
Glossary
E Glossary
Central master data hubA central system comprising one or more servers which are solely used for master data. All systems that process master data save it in this central system and/or access it from there. The process of saving and loading master data varies. It can occur as part of a real-time process (ie., a process that continuously synchronises the data) or as part of a regularly occurring update process.
Data governance and data organisationIn MDM terms, data governance refers to all organisational structures, organisational units, rules and guidelines, managing principles, managing elements and decision-making authorities that are established for the technical and organisational implementation of master data management (MDM). On the operational level, roles and responsibilities for the information processes and data need to be defined in the company. Data governance determines who (under which circumstances, when and using what methods) is allowed to implement measures impacting data and information in companies.
Data ownerThe data owner in a company (or a division, BU or other organisational unit) is responsible for a particular group of data entities or an entire data domain area and for the data maintenance processes. The data owner is responsible for fulfilling important data quality criteria, such as completeness or timeliness. He or she maintains authority over and responsibility for the data. On the operative level the data owner is supported by data stewards who implement data-related rules, continuously monitor compliance to ensure data quality, and give reports to the data owner.
Data repositoryA data repository is a centrally managed databank used to store and process all data. An integrated resource management or administration tool is constantly run in the background to make sure that the repository functions like a single data source despite the use of diverse hardware resources.
All kinds of financial data (sales, expenses) from different financial applications (accounts receivable, accounts payable) can be stored together in a financial data repository. The repository supports standard operations such as data entry, description and enhancement and securing digital objects. It operates autonomously.
Data stewardA data steward is responsible for implementing data governance standards and guidelines in companies and organisational subdivisions (e.g., divisions or BUs). Depending on the size of the company and the volume of data a data steward’s responsibility is limited to the specific data domain in which he or she specialises (e.g., customer data, supplier data, financial data). A data steward’s chief responsibility is the operative implementation and design of the guidelines and maintenance processes defined by the data owner to achieve the desired level of quality. Data stewards also continuously measure data quality and report this to the data owners and other stakeholder groups.

Hidden Treasure 101
In terms of organisational structure, data stewards belong to the MDM department, if one exists. The MDM department reports to data owners and advises them on decisions.
Hierarchy and taxonomyA taxonomy is the system of classification used. In MDM, hierarchies and taxonomies make it possible to classify and arrange data according to certain criteria.
Master data managementCommonly abbreviated as MDM master data management refers to a broad framework comprising data governance, processes for creating and maintaining data; clearly documented rules and responsibilities; and appropriate IT support, that is IT that extends beyond the usual interpretation of purely technical or systems-oriented services.
MDM councilAn MDM council is the body that has full authority to make decisions regarding a company’s master data. The MDM council is generally very high in the company’s hierarchy and is made up of representatives of all areas that are responsible for master data (customers, suppliers, finance) and their management. This includes the data owners and the company’s management. In the case that the head of the department (distribution for customer data, chief financial officer [CFO] for financial data) is not the data owner, then he or she should also sit on the MDM council.
MDM departmentThe MDM department is the organisational unit that is responsible for managing the master data. Its responsibilities can range from conceptual roles that serve to obtain strategic objectives to operative roles, for example data maintenance.
Special master data rolesOrganisational roles that exist for master data management purposes, examples include data stewards and data owners.
Master data domain areasMaster data is used in all functional areas or departments of a company. The data sets from these separate areas are allocated to separate areas called domains. Some typical examples of master data domains include material and product master data, customer and supplier master data, contract master data, financial master data and employee master data.
Glossary

102 Hidden Treasure
Contacts
Marcus MesserschmidtPartnerMoskauer Strasse 1940227 DüsseldorfTel.: +49 211 [email protected]
Jan StübenSenior ManagerNew-York-Ring 1322297 HamburgTel.: +49 40 [email protected]
About usOur clients face diverse challenges, strive to put new ideas into practice and seek expert advice. They turn to us for comprehensive support and practical solutions that deliver maximum value. Whether for a global player, a family business or a public institution, we leverage all of our assets: experience, industry knowledge, high standards of quality, commitment to innovation and the resources of our expert network in over 158 countries. Building a trusting and cooperative relationship with our clients is particularly important to us – the better we know and understand our clients’ needs, the more effectively we can support them.
PwC. 8,900 dedicated people at 28 locations. €1.45 billion in turnover. The leading auditing and consulting firm in Germany.
Contacts


www.pwc.de