hier c6, (oetddey shs meta
TRANSCRIPT

THE CONSTRUCTION OF INFLUENCE LINES
WITH A MECHANICAL INTERFEROMETER
by
James Howard Sword
Thesis submitted to the Graduate Faculty of the
Virginia Polytechnic Institute
in candidacy for the degree of
MASTER OF SCIENCE
in
APPLIED MECHANICS
APPROVED: APPROVED:
hier C6, (oetddey SHS Meta Director of Graduate Studies Head of Department
ARBAB E Det thes ~~ Dean of Engineering Major Professor
May 17, 1954
Blacksburg, Virginia

cL ; on
V JSS 1G 54 S “ f i
oJ f
4.) .¥ a =
* ~
~

YW. TABLE OF CONTENTS
Section Page Number
I, TITLE SHEET <- - - 2+ 2+ © <= 2 = = 2 ee oe = - =]
fl. TABLE OF CONTENTS= « +--+ + * © - = + « ~- «# = Z
Tl. LIST OF ILLUSTRATIONS + - - = + + 2 = + e ee = 3
IV. LIST OF INFLUENCE DIAGRAMS - - +--+ - 2+ - 4
V. LIST OF INFLUENCE TABLES - - ++ ----- 7 = 5
VI. INTRODUCTION - - - = + - ee ee ee eee ee -
VIN. INFLUENCE LINES - +--+ * 7s eee - ee 2 = 7
VII. MODEL ANALYSIS -- + +--+ -* 2-2 - + e+ & 8
A. Types of Models «~ - *- = - = = = - * = + == ~ =~ 8
B. Model Similarity - -- +--+ - +--+ -¢+- “a ww a oe B
C. Methods of Model Analysis - -~ - - + - - ee 2 o J
IX. MECHANICAL INTERFEROMETRY - - *+-*-7 + * = 11
X. THE INVESTIGATION - - =e - - - ee ee ee eo 14
A. Statement of the Problem - - - - * - - © * - + = 14
B. The Modela --*°- + +--+ 7222 ~-« = - 14
C. The Deflection Apparatus - - -- - - - +--+ - 14
D. Procedure * - = - © © = = =e we ee ee we ee 17
E. Interpretation of Results - - - - -* -*-* 7 => 18
XI. DISCUSSION OF RESULTS + - - -*- 7 = = 2 eo ee 27
Xl. CONCLUSIONS AND RECOMMENDATIONS - - - - = =~ 39
XII. SUMMARY - - - - <2 2 ee ee ee eee ee ee 40
XIV. ACKNOWLEDGEMENTS - - +--+ - - - ese ee 4
XV. BIBLIOGRAPHY - - - - - - - wee ee ee ee we = 42
XVI. VITA+ - - - ee ee eee te ee eee -- = + = 44

WW. LIST OF ILLUSTRATIONS
Figure Number Page Number
1,
bent fea
- 2
Pe PN
SF Tm ew
N
Mechanical Interferometry Applied to Model Analysis ~- ~- - +12
Diagram of Deflection Apparatus - - - ---+-+-+-+-+++-+ + 16
Photograph of Two-Span Beam~-Moment Fringe Pattern - - 19
Photograph of Arch-- Thrust Fringe Pattern - - ------ - 20
Photocopy of Shear Fringe Pattern--Fixed-Ended Beam ~- ~ 21
Photocopy of Moment Fringe Pattern-~Fixed-Ended Beam - - 21
Photocopy of Shear Fringe Pattern--Two-Span Beam - «+ - + 22
Photacopy of Moment Fringe Pattern--Two-Span Beam- ~- - 22
Photocopy of Thrust Fringe Pattern--Arch ----+---++-+ 23
Photocopy of Shear Fringe Pattern--Arch - ----+-+---- 24
Photocopy of Moment Fringe Pattern--Arch - ~- - « - - - - - 25
IV. LIST OF INFLUENCE DIAGRAMS
Figure Number Page Number
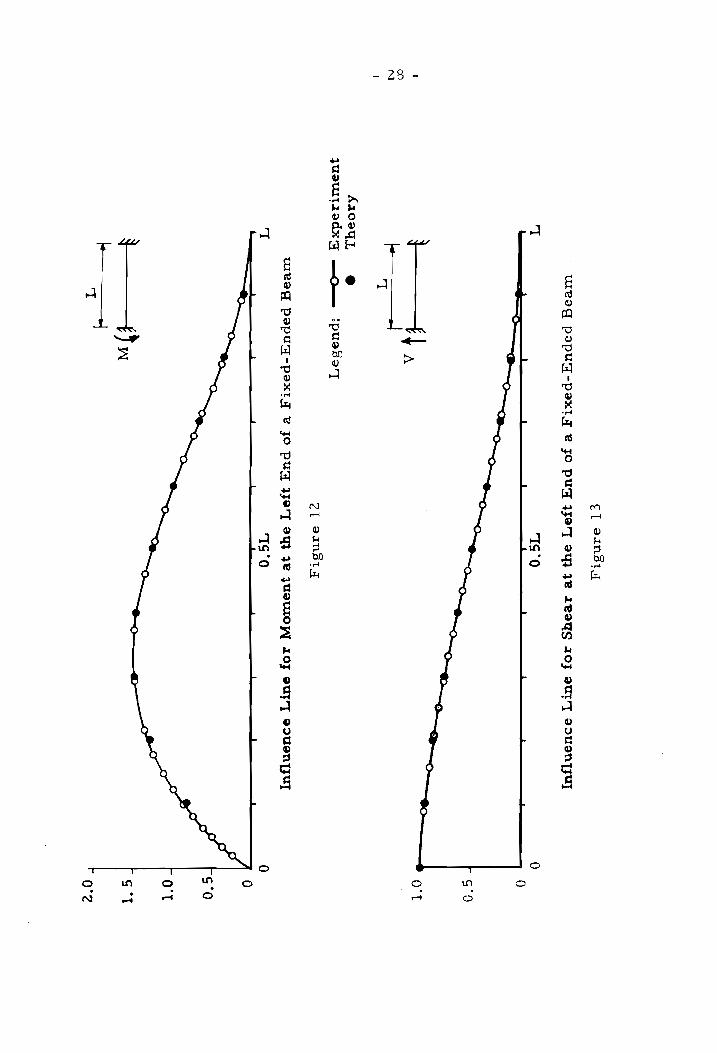
12. Moment at the Left End of a Fixed-Ended Beam - - - » 28
13. Shear at the Left End of a Fixed-Ended Beam - +--+ 28
14. Moment at the Left End of a Two-~-Span Beam - + - - - + 31
15. Shear at the Left End of a Two-Span Beam ~ + - - - + + 31
16. Horizontal Thrust for a Symmetrically Haunched Arch - 34
17. Shear at the Left End of a Symmetrically Haunched
Arch - +++ - wee ee wee wee new ew ewww 34
18. Moment at the Left End of a Symmetrically Haunched
Arch « « «© © www wwe mr www mre moe eee 57

V. LIST OF INFLUENCE TABLES
Table Number Page Nurnber
I. Ordinates for Moment--Left End of a Fixed-Ended Beam ~- - 29
i. Ordinates for Shear~-+Left End of a Fixed-Ended Beam - - - 30
Il. Ordinates for Moment--Left End of a Two-Span Beam ~ ~- + 32
IV. Ordinates for Shear--Left End of a Two-Span Beam---+- 33
Vv. Ordinates for Horizontal Thrust on a Symmetrically
Haunched Arch «+ « = « = 2 =m @ ww me ee meee www 35
VI. Ordinates for Shear at the Left End of a Symmetrically
Haunched Arch - -- + << @ =e ee eee eee ew en ee = 36
VII. Ordinates for Moment at the Left End of a Symmetrically
Haunched Arch « - +--+ +2. ee eee ewer enw nen wee 38

~6-
VI. INTRODUCTION
In the design of both statically determinate and indeterminate
structures it is necessary for the designer to predict the effects on
the structure of static and moving loads. He must place the movable
loads on the structure in such a manner that their effects--shears,
moments, thrusts, reactions--have maximum values. There are
several methods of placing the loads for the desired effects. The de-
signer is forced by economic considerations to choose a method
which is both rapid and accurate. In addition, he is encouraged by
his own human nature to devise an easy approach to his problem.
The influence line has been recognized as a useful tool for the
analysis of structures acted upon by moving loads. This thesia is
the report of an attempt to develop a method whereby the influence
line may be obtained more easily than was heretofore possible. The
newness of the method is in the means employed for measuring the
deflection of a structural model. The method and the results obtain-
ed are described in greater detail in the following pages.

VI. INFLUENCE LINES
An influence line for a structure is a curve for which the ordinate
at a point is some linear function--such as shear, moment, thrust or
reaction--of a unit load on the structure at that point (1), The in-
fluence diagram for moment, for example, differs from the regular
moment diagram in that it gives a moment at one point for any po-
sition of the load. The moment diagram, on the other hand, gives
the moment at any point due to a fixed position of the load. Given an
influence line for some position on a structural member, the effect
of a concentrated load of any magnitude at any point may be determined
by multiplying the ordinate of the influence line at that point by the
applied load. The effect of a uniformly distributed load may be ob-
tained by multiplying the intensity of the load by the area under the
influence diagram for those parts subjected to the load.
Influence ordinates may be calculated by using several theoreti-
cal methods. However, as structures become more complex, mathe-
matical solutions become exceedingly laborious. In many cases, so-
lutions depend upon certain simplifying assumptions. Structural
models offer the designer an opportunity to check the results of his
calculations. At times, mode] analysis is the only practical method
of justifying the assumptions necessary to the theoretical analysis.

- § -
Vill. MODEL ANALYSIS
A. Types of Models
Structural models are of two general types~-loaded and unloaded.
The loaded models may be either full-sized or scaled-down repro-
ductions of some prototype. The load may be either the full intended
load or some scaled-down load. The effects of loads in terms of
stress are generally determined by measuring values of strain or
deflection which may be converted to stress.
The unloaded model is subjected to a known deformation at some
point and is allowed to deflect. According to the Miiller-Breslau
Principle (1) the ordinates to the influence line for a atructure are
proportional to the ordinates of the deflected centerline of the
structure. The designer may obtain the influence line for the
structure by causing a structural model to deflect under the action of
some known deformation. He must, however, be careful to satisfy
the principles of similitude.
The unloaded model is used in many different methods of
structural model analysis and was used in this investigation.
B. Model Similarity
The principles of similitude require that the model be geome-
trically similar to the prototype if the effecta of shear and thrust
deformation are to be considered. However, if the major part of the
strain energy is provided by bending~-whether due to reaction, shear,

-~9-
moment or thrust--the model will be sufficient if the width of the
member is proportional to the cube root of the moment of inertia for
the prototype. The length of the model must be proportional to the
length of the corresponding member of the prototype. The material
from which the model is made must be homogeneous, clastic and of
constant thickness (2).
Ordinarily the direct and shear strains will not be large enough to
consider, They may not be neglected in deep beams of short span.
C. Methods of Model Analysis
Beggs (3) developed the most widely known application of the
method of analysis using unloaded models. He devised gages which he
called deformeters. The gages are fitted with plugs for applying
deformations to models. The deflections produced by the plugs are
so small that they must be measured with micrometer microscopes.
The procedure is tedious, the equipment is very expensive, there is
no permanent record of the deflections which can be used to check
the work and the models are affected by termperature and creep.
Other people (4) have employed apparatus based on the same
principles for model analysis. In general, their methods meet with
many of the same objections.
Eney (5) devised a deformeter apparatus which gives large de-
flections which may be measured with an engineers scale. The
method does not provide a permanent record and there is the posai-
bility that the material will be overstressed.

Rocha (6) recently published an account of a method for the de-
termination of displacements by taking double-exposure photographs
of a target attached to a celluloid model. The deflections are large
and must be scaled from a photograph. The photographic equipment
is expensive and the lights necessary for good photographic detail
produce heat which tends to distort the model.
The technique of photoelasticity offers a possible approach to
the analysis of structures. The method is time-consuming and it
requires rather expensive equipment.
IX. MECHANICAL INTERFEROMETRY
Weller and Shepard (7) showed that two transparent plates, each
ruled with equally spaced dark lines, will exhibit a fringe pattern simi-
lar in appearance to the photoelastic stress pattern if one of the plates
is moved relative to the other. The fringes which appear are the
result of a mechanical interference by the dark lines to the passage of
light through the transparent material. If the spacing of the lines is
known, itis an easy matter to measure deflections by observing the
pattern. The ruled lines act as a vernier. Each fringe produced
represents a motion perpendicular to the ruled lines of a magnitude
equal to the line spacing. The method may be used to measure the
expansion or contraction of a member subjected to an axial load, the
rotation of a member under a bending load and, by the use of two sets
of ruled lines, it may measure displacements in two directions.
Figure 1 demonstrates the mechanics of the method as applied to a
beam.
Okie (8) tried to use mechanical interferometry to measure
strains attempting thereby to obtain values of stress in a beam. He
deemed the method impractical, however, when he discovered that
it was necessary to correct for the rotation of the member. The
fringe in the interference pattern represents the total motion of a
point in a particular direction. Therefore, since each displacement
is a function of both the rotation and translation of a member, it is
neither necessary nor desirable to introduce a rotation correction for

-~12- T eandty
stskTeuy
[apoyw, 03
petiddy
Arajyaurorazazajyuy Teoturqooypy
‘a8utay Burpsceid
ayy wr01y
saqout p
jo UOT}.aTJap
& syuseseidar
aButaj yAep
yoeq °
uP f~
zazoddns jo
yuyod aqj
42 prety
yAep B WTA
uses se
wWieSg aUIeS
34} 10;
U193}ed JIUVI9zI9}UT
‘aButzy Surpacead
ay} wl0Iy
seqouUy p
pa}oeTZep seq
qorym yurod
vB JO
UOWeD0]
9g} s3uss0I1d91
VBBuUTIzz 20
Paty 1GZI]
Suppoaons
yoeq ‘320ddne
30 yuyod
oy} 38
plots 3qST]T
© IIA
punocssy eq
poms > ra
e 4SUIeSe
Tapoul ures|q
AVASTIVULD pola
& IOZ
u1933ed 99U219j;2930T
tb

measuring deflections.
~ ]3 -

- 14 -
x. THE INVESTIGATION
A. Statement of the Problem
It has long been established that there are relatively accurate ex-
perimental methods of obtaining influence ordinates for structures
through the use of models. As stated previously, there are certain
disadvantages attached to their use by the ordinary design office. The
present investigation is an attempt to provide an easier and more eco-
nomical method for measuring the deformation of a structural model.
The method employs a mechanical interferometer to determine the
desired deflections.
B. The Medels
The three models used in this investigation were a fixed-ended
beam, a two-span continuous beam and a symmetrically haunched
arch. They were cut from sheets of cast Lucite to which a ruling of
one hundred lines per inch had been applied by a commercial litho-
grapher. The width of each model was proportional to the cube root
of the cross-sectional moment of inertia of the prototype. The aver-
age thickness of the material was 0.083 +0.005 inches. The vari-
ation did not seem to affect the resulta of the experiments adversely.
C. The Deflection Apparatus
In planning the experiment, it was intended that a Beggs-type
3) deformeter ( would be used to produce the model deflections.

-15-
Tests showed that the deflections thus produced were not large enough
to give a good interferometer fringe pattern. A deflection apparatus,
similar in some respects to the Eney Deformeter (5) was devised
by the author. The device consists of a plate to which the model may
be fixed and which may be attached to a base plate by inserting pins in
appropriately placed holes. To induce a deformation in the model,
either a translation or a rotation, it is only necessary to move the
pins to new positions.
The deflection apparatus and the method of using it to produce
distortions are shown in Figure Z.
The rest of the apparatus consisted of cover plates of the ruled
plastic, supports for the models, a light source, photographic copy
paper and a drawing board to which the supports and the base plate of
the deflection apparatus were attached. The cover sheets were cut
to size so that they would fit between model supperts. The model
supports were gages from the deformeter. The models were clamped
to the gages for a fixed end effect or were pinned to them for a pin
joint.
The photographic paper was 'Contura Contact Orthochromatic
Reflex Paper". This is a high contrast paper which may be safely
handled in subdued light and may be developed as ordinary photo~-
graphic film. The light source used to expose the paper was a
“Strobelume" electronic flash. <A photoflash bulb or an ordinary
incandescent bulb would serve the same purpose.

7 eins
@TVIS 03
JON snyereddy
uo 0 Tjeq
jo wies8eIq
UOTZIBOg U[g
saj0oueq e
suotpoeTseq Burf{ddy
jo poyjoyy
aeoyus |
TewUoSZIAOP
yUSWUO
WP ‘
| B eG oO
e
I oO 1
MIS
POOM
|
1BaUS
Ted29A
TeaqneaN .
: 93eId
1993S .%/T
g 8
e TOPOW
e
MIIOG
suTyqoepy
utq
1293¢ t

~17-«
D. Procedure
Each of the three models was tested for moment and for vertical
shear at the left support due to a vertical load on the member. In
addition, the arch was checked for horizontal thrust due to a vertical
load.
For each test the copy paper was placed, emulsion side up, on
the model supports. The model was clamped in place, free from
initial deformation, over the paper. The cover plate was then put
into position over the model so that it gave either a uniform light or
dark field and was fixed to the drawing board so that it would not move
during the test. To minimize the effect of parallax, the ruled side of
the cover sheet was placed next to the ruled side of the model. With
the model and cover plate in position, the model was deformed by an
appropriate movement of the deflection apparatus. The motion of the
model with respect to the cover sheet produced an interference pattern
which was contact-printed on the photographic copy paper by a single
flash of the "Strobelume". In an effort to further reduce the effect
of parallax, the light was held directly over the model at a distance
of approximately five feet. After the paper was exposed, the model
was unloaded and the light field checked to see that there were no
residual deformations and that the cover plate had not moved during
the test. The paper was then removed and developed in a photo-
graphic darkroom. The pattern appeared on the print as a photo-
graphic negative. A positive pattern was obtained by contact-print-
ing the original on another sheet of copy paper.

- 18 +
The photographic reproduction of the fringe pattern is not an es-
sential part of the method. The deflections could be easily measured
on the deformed model. The photographs provide a permanent record;
they allow simultaneous readings, thus eliminating creep and temper-
ature effects by removing time as a factor; they can be interpreted at
leisure; and each can be compared with the deflected model ag a
check on the accuracy of the data.
Figure 3 is a photograph of the two-span beam in its deflected
position. It shows the fringe pattern due to a moment applied at the
left end. Figure 4 shows the fringes on the arch due to a horizontal
thrust. Both figures show the method of supporting the models.
Figures 5 through 11 show the fringe patterns obtained from the
tests reported herein.
E. Intrepretation of Data
The interference patterns were used to provide data for the
construction of influence lines due to a unit vertical load. There was
some definite point of zero deflection from which to count the fringes
in each test. For moments and thrusts, there was zero vertical
deflection at each point of support. For shear, there was no move-
ment at a minimum of one support.
Maxwell's Law (3) was used to calculate the influence ordinates
from the measured deflections. In determining the ordinate to the
influence line for thrust or shear, it was only necessary to measure
the model deflection and to know the applied deformation. For

~19~
al
aph of Two-Span Beam--Moment Fringe Patte Photograph wo-5)
Figure 3

« 20 <
Photograph of Arch«- Thrust Fringe Pattern
Figure 4

g a1n81 4
Weed popuy-pexi j--u1syeg
esutsa 7
juauio-=w jo
Adooojoyg
my
pili
G eanstz
Uleeg popun-pext
JF--u19}3eg sdula gq
resys
yo Adoo0j0Y4g

g eins g
wiereg uedg-oMm],--ul9}eg
edulaq
juewoypl
jo Adosojoyd
L aan3sig
uevag uedsg-omy,--u19}eg odula gq
zeays
jo Adoosojoug
THT
Pil j 4 i |
means a enmeerai oeemett ee mentee
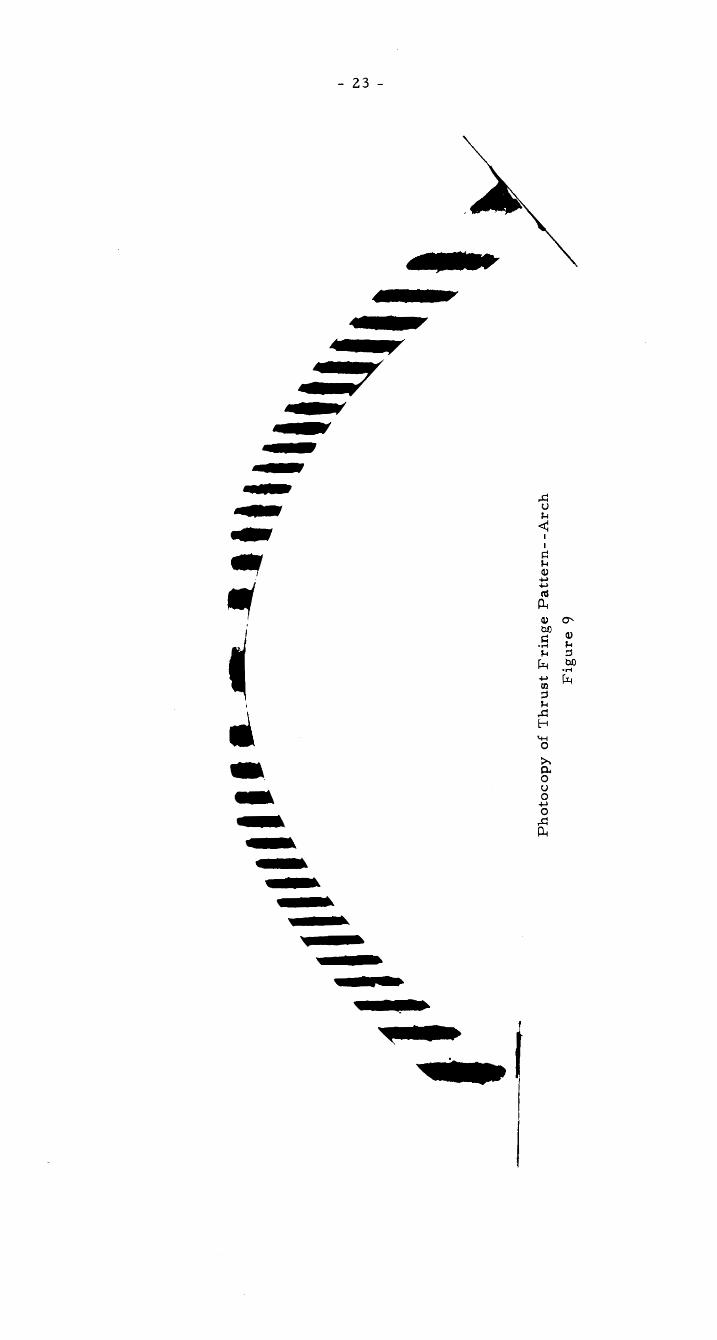
-~23-
6
eansIt 7
yoiy--u19}}eg
ssutay ysnayy
jo Adosojoyg
\ +
| |
"Wines wl
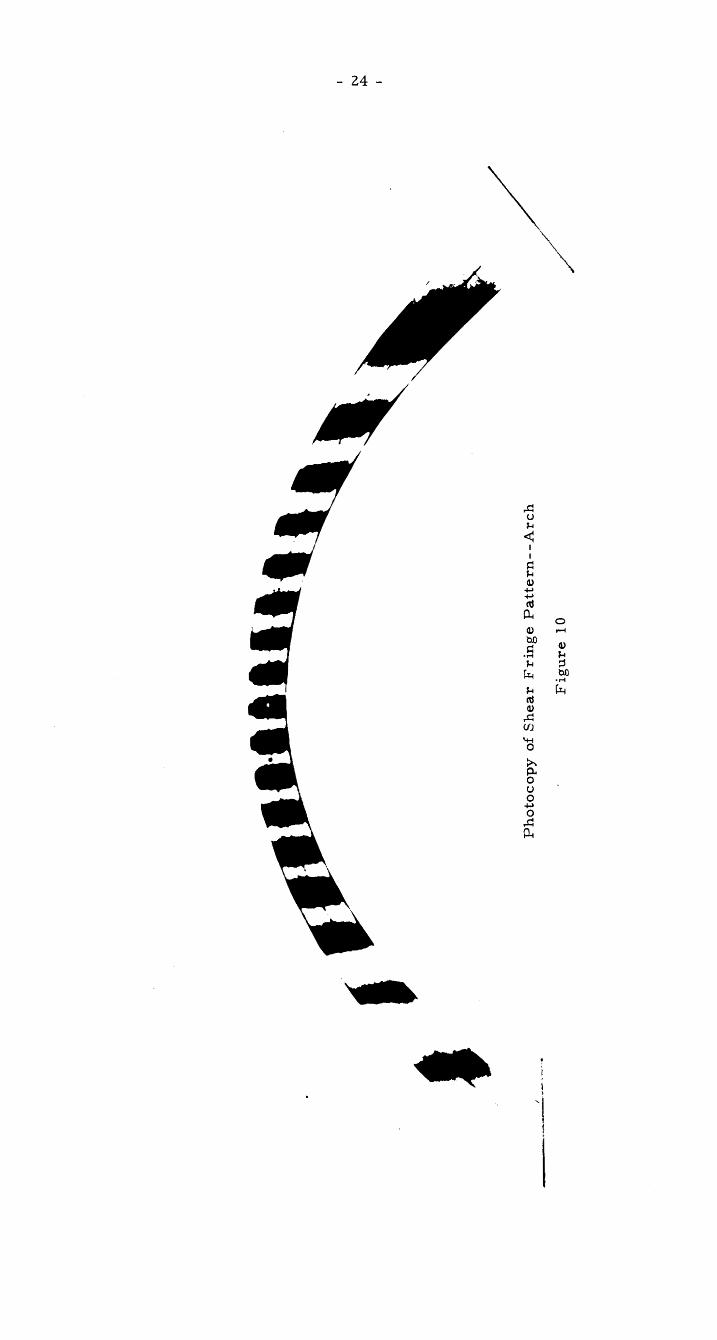
~ 24 -
OL eans1 7
yoivy--ui9}edg
odutay
zaesys jo
Adosojoyg
Nv ussrcccanst#
i
7

I]
eand1 7
Yoly--ul9yjeg ssulz FF
yuauoy,
jo Adosojyoudg

- 26 ~-
example, the equation for shear ordinate is
v=p
when Vis the shear force, Pia an applied load (in this case a unit
load), dis the measured vertical deflection of the model and y is the
applied distortion in the direction of the shear force. The similar
equation for the thrust ordinate is
H=PS
when His the horizontal thrust due to a vertical load.
The equation for the moment ordinate
M=P$
contains an angular distortion term, 0, which is the angle through
which the support was turned to produce the influence line for moment.
In order to determine 6, it was necessary to calibrate the apparatus
by mounting a strip of the ruled plastic and rotating it through a unit
angle. The measured deflection divided by the length of the strip gave
the magnitude of the angle, in radians. The Min the moment
equation is the moment in a structure of the same scale as the model.
Therefore, it was necessary to multiply the value of Mfrom the
equation by the length scale factor of the model to obtain the influence
ordinate.
The values of shear and thrust do not require a correction for
the scale of the model.

~27-
XI. DISCUSSION OF RESULTS
The experimentally determined influence lines for the two beams
were compared with theoretical curves from Hool and Johnson's
Concrete Engineer's Handbook (9) Except for the right span of the
continuous beam, the experimental influence lines agreed very closely
with those obtained by theoretical means. The deflection of the right
span was very small and the experiment did not give enough points
for a good curve. The disagreernent between the curves is not serious,
however, because a load anywhere on the right span would have sucha
comparatively small effect on the left support that the error could
safely be neglected.
The comparison curves for the symmetrically haunched arch were
obtained by solving for influence ordinates using the Column Analogy
(10) Again the experimental curves agreed very closely with those
obtained theoretically.
Figures 12 through 18 are the influence lines for the models.
Tables I through VII are the tabulated influence ordinates.
eT ean3rg
WUeVIg Ppepuy-pexiy
e jo
pug eT
oy} 4e
ABBYS 10;
GUT] DOUENTFUI
TS 0
S*0
- 28 -
OT -+#—_—+|
AioauyL
= @
qUSUITIOAUXY Oem
spuaday
271 oansty
UlVegG Pepuy-psexiy
eB jo
puy
ie'yT oy}
#e JUSUIOPY
IOJ OUT]
sdUONTUT
ad A
al
1.
150
0 1
\ i
$—_$—_ +}

~ 29 -
Table I
Influence Ordinates for Moment at the Left End of a Fixed-~Ended Beam
(L.! = Span = 10 feet; L = Model Span = 9. 7 units)
Position | Fringe | Moment on Beam | Experimental /Theoretical Value Moment Moment
x d_,d age be! L d M)=P <q =lay M = M! | = 10.3M!
0 0 0 0 0 0.001 2 0. 200 0.206 -
0.003 3 0. 300 0.309 “ 0. 034 4 0.400 0.412 - 0.057 5 0. 500 0.516 - 0.074 6 0. 600 0.618 - 0.095 7 0. 700 0. 722 - 0. 100 - - - 0.810 0.115 8 0. 800 0.825 - 0.141 9 0. 900 0.928 ~ 0.173 | 10 1.000 1.032 - 0. 200 - - - 1.280 6.210] 11 1.100 1.133 ~ 0.286 | 12 1.200 1.238 - 0. 300 - - ~ 1.470 0.328 12.5 1.250 1.290 - 0.366 | 12 1.200 1.238 - 0.400 - - - 1.440 0.457 | 11 1.100 1.133 - 0. 500 “ - - 1.250 0.512 10 1.000 1,032 - 0.555 9 0. 900 0.928 - 0.597 8 06. 860 0.825 - 0. 600 “ - - 0.960 0. 635 7 0. 700 0. 722 ~ 0. 672 6 0. 600 0.618 - 0. 700 - - - 0. 630 0. 712 5 0. 500 0.516 “ 0. 748 4 0.400 0.412 - 0. 790 3 0. 300 0. 309 - 0. 800 ~ - “ 0. 320 0. 835 2 0.200 0.206 - 0. 900 - - - 0.090 0.950 l 0. 100 0.103 - 1.000 0 9 0 0

~ 30 «
Table I
Influence Ordinates for Shear at the Left End of a Fixed-Ended Beam
(L = Span = 10 feet)
Position Fringe Value | Experimental Shear | Theoretical Shear
x d v=pisif tL y 20.5
0 20.5 1.000 1.000 0,086 20 0.977 - 0.100 - - 0.972 0.155 19 0.926 - 0.200 - - 0.896 0.207 18 0.879 - 0.252 17 0.830 - 0.294 16 0. 780 - 0. 300 - - 0. 784 0.331 15 0. 732 - 0. 367 14 0. 683 - 0. 400 13 0.635 0. 648 0.435 12 0. 586 - 0.469 11 0. 537 - 0.5006 10 0.488 0. 500 0.535 9 0.439 - 0. 569 8 0.390 - 0. 600 - 0. 352 0.603 7 0. 342 - 0. 638 6 0.293 - 0.675 5 0.244 ~ 0. 700 - - 0. 216 0.714 4 0.196 - 0. 755 3 0.146 - 0. 800 - - 0. 104 0. 804 2 0.098 - 0.863 i 0.049 - 0.900 - - 0.028 1.000 0 0 0

GI eanst ay
ulveg
SNONUTJUOD pepuy-poexty
& Jo
puy ia]
oy} 3B Avs
AOFZ BUTT
aoUeNTsU] rs O-
~ 3] -
Asoauy,
e queultiedxy ——O——
spusedoey PL
oanaly
weeg snonuyu0y pepuq-
pext 7
e@ jo
puy
jjyo7y oy}
3e JURUIOPF
AOF AUT]
BdUeNTFUT
SO
-
‘I )
j _j
j "E 0
] |
j /
—
“Tt T
T t
t T
T T
0 ‘Iz
IST
a)
FO *T
}—#
_4 W
S"T
i r
HO °Z

-~ 32 -
Table 111
Influence Ordinate: fr Moment at the Left End of a Two-Span
Continuous Beam (L' = Span = 10 feet each; L = Model Span = 6 units
Position | Fringe | Moment on Bearn | Experimental Theoretical Value Moment Moment
* d MY =P$=19, M=M i 5 103M!
0 0 7) 0 0 0.013 2 0.270 0.450 - 0.039 3 0.405 0. 675 - 0.070 4 0. 541 0. 902 - 0.100 - - - 0. 832 0. 107 5 0.675 7 127 ~ 0.157 6 0.812 4 358 - 0. 200 : - - 1 360 0.217 7 0. 946 1.5 - 0, 300 7 - - 1.627 0. 348 8 1. 082 1. 862 - 0.400 - - “ 1. 680 0. 500 - - - 1. 562 0. 508 7 0.946 1.578 - 0. 592 6 0.812 1.355 - 0. 600 - - - 1. 320 0, 663 5 0.675 1.127 - 0. 700 - - - 0.997 0. 728 4 0. 541 0. 902 - 0. 793 3 0.405 0.675 - 0. 800 - - - 0. 640 0. 857 2 0.270 0.450 - 0.900 - - - 0.292 0.928 l 0.135 0.225 ~ 1.000 0 0 0 C 1.100 ~ - - - 0.202 1,135 ~1 ~ 0.135 - 0.225 - 1.200 ~ - - - 0, 320 1, 300 - - - ~ 0. 367 1. 400 - - - - 0. 360 1. 500 ~ - - - 0.312 1.570 -1 ~0.135 -0. 225 - 1. 600 “ ~ - 0.240 1. 700 - - - ~ 0.157 1. 800 - - - ~ 0. 080 1.900 - - - - 0,023 2.000 0 0 0 0

« 33 -
Table IV
Influence Ordinates for Shear at the Left End of a Two-Span
Continuous Beam (L = Span = 10 feet, each span)
Position | Fringe Value | Experimental Shear | Theoretical Shear x d d L d Ve PS = ] 50
0 20 1,000 1.000 0.100 - - 0.979 0.161 19 0. 950 -
0. 200 - - 0.920 0.230 18 0.900 ~-
0.285 17 0.850 - 9. 300 - - 0.831 0.336 16 0. 800 - 0. 382 15 0. 750 - 6.400 - - 0. 720 0.423 14 0. 700 - 0.465 13 0. 650 “ 0. 500 - - 0. 594 0. 504 lz 0. 600 - 0. 541 11 0. 550 - 0.578 10 6.500 ” 0. 600 - - 0. 460 0.617 9 0.450 1
0. 652 8 0.400 “ 0. 690 7 0. 350 - 0. 700 - - 0. 326 0. 728 6 0. 300 - 0. 765 5 0. 250 ™ 0. 800 - - 0.. 200
0.808 4 0.200 -
0. 850 3 0.150 - 0. 900 2 0.100 0.089 0.943 1 0.050 -
1.600 0 0 0
1.075 ~ 1 - 6.050 -
1.100 - - - 0.061
1.175 - 2 - 0.100 “
1. 200 - - - 0.094
1.300 - - ~ 0.110
1.375 ~2.5 ~ 0.125 -
1.400 “ - 0.108 1. 600 - - 0. 072
1. 613 ~ 2 ~ 0,100 -
1. 800 “ - ~ 0. 024
1.805 - I - 0.050 -
z.000 0 0 0

» -
LI eansty
yoay peyqouney
ATpTectajyourwiAg ®
jo pug yo]
94} Je
AVEYS AO,
suty souentsuy
"I TS
0
' '
\ 0
Arosyy,
©@ juswtisdxyT —O—
:puesaq
g{ eanstgq
yoay peyounezy
AjTesizyoururAg &
1OF JSNHAGY
[eJUOZTAOPY AOJ
Butry souonypuy
T TS
°0 0
1 i
i i
i 1
i A
i i.
pa
{2
rot

Table V
Influence Ordinates for Horizontal Thrust on a Symmetrically
Haunched Arch (L. = Span = 100 feet)
Position | Fringe Value | Experimental Thrust | Theoretical Thrust x d_,d Er d H=P 71 30
0 i) 0 0 0. 064 1 0.050 - 0.160 - - 0. 086 0.108 2 0. 100 - 0.138 3 0. 150 - 0. 167 4 0.200 - 0.196 5 0.250 - 0.200 - - 0.298 0.211 6 0. 300 ~ 0.231 7 0. 350 - 0.254 8 0.400 - 0.274 9 0.450 - 0.295 10 0. 500 - 0. 300 - - 0. 547 0.318 V1 0. 550 %. 341 12 0. 660 - 0. 367 13 0. 650 0.395 14 0. 706 - 0.4006 - - 0. 748 0.433 15 0. 750 - 0. 500 - - 0. 825 0. 505 16 0. 800 - 0. 580 15 0. 750 - 0. 600 - - 0. 748 0. 618 14 0. 700 - 0. 649 13 0. 650 0. 675 12 0. 600 0.697 11 0. 550 - 0. 700 - ~ 0. 547 0. 720 10 0. 500 « 0. 742 9 0.450 0. 761 8 0. 400 - 0. 780 7 0. 350 - 0. 800 - - 0.298 0.803 6 0. 300 - 0.825 5 0.250 - 0. 849 4 0. 200 - 0.872 3 0.150 - 0. 900 2 6.100 0. 086 0.935 1 0. 050 - 1.000 0 Q 0

~ 36 -
Table VI
Influence Ordinates for Shear at the Left End of a Symmetrically
Haunched Arch (L = Span = 100 feet)
Position | Fringe Value | Experimental Shear | Theoretical Shear x d d L d Vv =P 5* 1Ts
0 18 1.000 1.000 0.100 - - 0.978 0.118 17 0. 944 - 0.200 - - 0.912 0.202 16 0.888 oo 0.260 15 0.833 - 0. 300 - ~ 0. 803 0.311 14 0.777 - 0.355 13 0. 722 ° - 0.398 12 0. 666 - 0.400 - - 0. 662 0.435 11 0.610 - 0.473 10 0.555 - 0. 500 - - 0. 500 0.507 9 0. 500 - 0. 542 8 0.444 - 0. 580 7 0. 389 - 0. 600 - - 0. 338 0.615 6 0.333 + 0.655 5 0.278 - 0.697 4 0, 222 - 0. 700 - - 0.197 0. 742 3 0.165 - 0.800 - - 0.088 0.803 2 O.111 - 0.885 1 0.056 - 6.900 - - 0.022 1.000 0 0 0

- 37-
QI aansta
yoay peyouney
ATTeotsazeumuds
® jo
puy 3a]
oyR 3e
JUAWIOPFk OJ
aut]
aOUeNTsU]
KD
wn Azooyy
= ®
yuswtiedxy
——O-—— ‘:puasey
-
OI[-
OT

- 38 -
Table VII
Influence Ordinates for Moment at the Left End of a Symmetrically
Haunched Arch (L' = Span = 100 feet ; L. = Model Span = 10 units)
Position | Fringe! Moment on Beam Experimental |Theoretical Value Moment Moment
* d M=PS=19, | M=M!E= 103M!
0 0 0 0 0 0.013 -~1 ~ 0.160 - 1.900 “ 0.025 ~Z - 0,200 ~ 2.000 ~ 0.036 ~ 3 - 0. 300 ~ 3.000 - 0. 050 ~4 - 0.400 ~ 4,000 - 0. 066 «5 - 0.500 - 5.000 - 0. 087 ~ 6 - 0. 600 - 6,000 “ 0.100 - - - ~ 6.65 0.120 ~ 7 ~ 0, 700 ~ 7.000 ~ 0. 167 ~ 7.5 ~ 0, 750 - 7.500 ~ 0.200 ~ - - - 7.50 0.202 -7 -0. 700 , - 7,000 - 0.247 «6 - 0. 600 - 6,000 - 0. 280 ~ 5 ~ 0. 560 ~§. 000 - 0. 300 - - ~ ~ 4,50 0. 305 -4 ~ 0.400 - 4.000 ~ 0. 336 «3 ~ 0. 300 - 3.000 - 0. 352 ~2 - 9.200 ~ 2.000 - 0.375 -~1] ~ 0.100 ~ 1.000 ~ 0. 395 0 0 0 - 0.400 - - - 0.13 0.422 i 0.100 1.000 - 0.445 2 0.200 2.000 ~ 0.470 3 0. 300 3. 000 - 0. 560 - - - 4.27 0.502 4 0.400 4.0006 - 0. 542 5 0. 500 5,000 - 0. 600 - - - 6.33 0. 626 6 0. 600 6.000 - 0. 700 - - - 5. 84 0. 730 5 0. 500 5.000 ~ 0. 780 4 6.400 4.000 - 0. 860 - - ~ 3, 66 0. 824 3 0. 300 3.000 - 0.867 2 0.200 2.000 - 0. 900 - - - 1.16 0.915 1 9. 100 1.000 -
1. 000 4) e 0 0

- 39 ~
XII. CONCLUSIONS AND RECOMMENDATIONS
The close agreement of the results of the experimental investi-
gation with theory supports the original premise that mechanical
interferometry could be successfully used for the determination of
influence lines. The method offers the advantages of inexpensive
apparatus and materials, accuracy and permanence of record over
some of the methods in present use. For speed and the ease with which
deflections may be read, the method is unexcelled.
The method should, of course, be subjected to further tests in
order to extend its usefulness. It should be used with models of
other types of structures to obtain influence lines for positions other
than points of support.
It should prove interesting to use the ruled plastic models with
other types of deformeter apparatus, particularly the Eney Deformeter,.
With a finer ruled pattern--more lines per inch-~-it might be possible
to use the Beggs Deformeter.
The method would be much more useful if models could be built
up using splines cemented together. Several such models should be
tested to see how they compare with one-piece models.
An attempt should be made to reproduce the fringe pattern by
some method such as Ozalid or blueprint, to further increase the
utility of the methed. Every effort should be made to enable the
prospective user to work with the equipment which he has. The
commercial possibilities of the method should be investigated.

~ 40 -
AY. SUMMARY
The experimental investigation of the application of mechanical
interferometry to the construction of influence lines has proven
successful. The method is similar in principle to other methods of
model analysis. Mechanical interferometry offers the advantages of
apeed and permanence of record over the other methods in present use.
The idea seems to offer commercial possibilities.

- 41 -
XIV. ACKNOWLEDGEMENTS
The author wishes to express his appreciation to all those who
aided him in his work. Specifically, he wishes to acknowledge the
assistance of the following:
Professor Dan H. Pletta, who conceived the idea of
using the method of mechanical interferometry for
the construction of influence lines and who supervised
the investigation;
Mr. G. Kenneth McCauley, who did the necessary
shop and photographic work;
Mrs. Jeanette Sword, his wife, who typed the manu-
script;
The Engineering Experiment Station, Dean John W.
Whittemore, Director, which provided the necessary
funds;
and
Members of the staff of the Applied Mechanics De-
partment who read and criticized the work.

~ 42 -
XV. BIBLIOGRAPHY
Wilbur, J. B., and Norris, C. H., Elementary Structural
Analysis , pages 154--160 and 450--452. McGraw-Hill Book
Company, Inc., New York, 1948.
Pell, P. S., Thompson, N. E., and Coates, R. C., "Structural
Analysis by Models". Civil Engineering and Public Works
Review, London, Volume 47, Number 553, pages 559--56l,
July 1952.
Beggs, George E., "The Use of Models in the Solution of
Indeterminate Structures". Journal of the Franklin Institute,
Volume 203, pages 375--386, March 1927.
Norris, C. H., "Model Analysis of Structures". Experimental
Stress Analysis, Proceedings of The Society for Experimental
Stress Analysis, Volume I, Number 2, pages 18--33, 1944.
Eney, W. J., "A Large Displacement Deformeter Apparatus
for Stress Analysis with Elastic Models". Experimental Stress
Analysis, Proceedings of The Society for Experimental Stress
Analysis, Volume VI, Number 2, pages 84--93, 1948.
Rocha, M. and Borges, F., "Photographic Method for Model
Analysis of Structures", Experimental Stress Analysis, Pro-
ceedings of The Society for Experimental Stress Analysis,
Volume VII, Number Z, pages 129--142, 1951.
Weller, R., and Shepard, B. M., "Displacement Measurement
By Mechanical] Interferometry". Experimental Stress Analysis,

10.
Proceedings of The Society for Experimental Stress Analysis,
Volume VI, Number 1, pages 35--38, 1948.
Okie, W. R., Determination of Stress By Mechanical Interfer-
ometry. Master's Thesis Submitted to Virginia Polytechnic
Institute, Blacksburg, Virginia, 1950.
Hool, G. A., and Johnson, N. C., Concrete Engineer's
Handbook, pages 324--25. McGraw-Hill Book Company, Inc.,
New York, 1918.
Pletta, D. H., "Rigid Frame and Arch Bridges". Unpublished,
a chapter for the forthcoming edition of Concrete Engineer's
Handbook, McGraw-Hill Book Company, Inc., New York.

~ 44 «
a erica AD AEE
James Howard Sword was born in Derby, “ise Tounty, Virginia,
on January 1, 1924. He attended grammar school in Derby, high
school through the junior year in Appalachia, Virginia, and was
graduated from Woodrow “ilson High School in Portsmouth, Virginia,
in June, 1942,
He worked as a store manager fer Colcnial Stores, Ine., in Porta-
mouth until his induction inte the Army in March 1943, After aporoxi-
mately nineteen months training he waa sent tc the Pacific Theater
where he served with the 51!th Parachute Infantry of the Lith Airborne
Division. He wae discharged in February 1946 with the rank of
Sergeant.
He entered Virginia Polytechnic Institute in September 1946 and
wae graduated, with Honors, in June 1950 with the Bachelor of
Science Degree in Civil Engineering. He held a teaching fellowship
in the Civil Engineering Department at V. P. 1. for six months and
waa aninstructor for six months. In September 1951 he was made
Instructcr in the Department of Applied Mechanica at V. P. I. where
he is now an Assistant Profesaor.
The author is a member of Chi Epsilon, Tau Geta Pi, Phi Kappa
Phi, the American Society of Civil Engineers and the National Society
of Professional Engineers. He is a registered Professional Engineer
(Virginia--Civil 1275). 3 | avers