high-achieving students
TRANSCRIPT
1016 16th Street, NW • 8th Floor • Washington D.C., 20036
Copies of this report are available electronically at our website, www.edexcellence.net
The institute is neither connected with nor sponsored by Fordham University
Hig
H-A
CH
iev
iNg
ST
UD
eN
TS
iN T
He
er
A o
F N
CL
B
Th
om
as B
. Fo
rdh
am
institu
te
AN ANALySiS oF NAeP DATAby Tom Loveless
reSULTS From A NATioNAL TeACHer SUrveyby Steve Farkas and Ann Duffett
Foreword by Chester E. Finn, Jr. and Michael J. Petrilli
PART 1
PART 2
in the Era of NCLBHigh-Achieving Students
Table of ContentsExecutive Summary
Foreword
PART 1: Analysis of NAEP Data
Data Treatment
Question 1: What has happened to the national NAEP scores of high and low achievers since the advent of NCLB?
Question 2: What were the trends in NAEP scores of high and low achievers before NCLB?
Question 3: Is it NCLB accountability or accountability in general that is associated with contraction of the achievement gap?
Question 4: Who are America’s high-achieving students?
A Closer Look: High-achieving students from three NCLB Subgroups
Summary and Conclusion
Appendix A
PART 2: Findings from a National Teacher Survey
Chapter 1: How much of a priority are academically advanced students?
Chapter 2: Teachers talk about values and tradeoffs
Chapter 3: Teachers talk about the school environment
Chapter 4: Teachers talk about solutions
Appendix A: Methodology
Appendix B: National survey of public school teachers grades 3-12
2
8
13
17
18
20
24
27
32
35
40
49
51
56
61
68
72
74
page 2
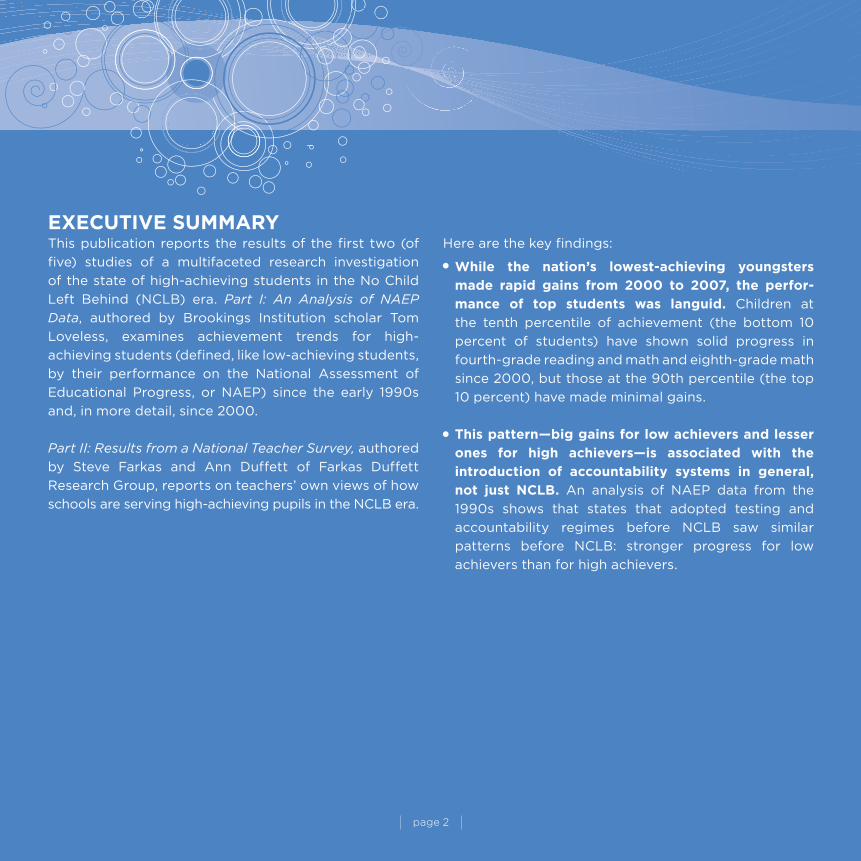
ExEcuTivE SummARyThis publication reports the results of the first two (of
five) studies of a multifaceted research investigation
of the state of high-achieving students in the No Child
Left Behind (NCLB) era. Part I: An Analysis of NAEP
Data, authored by Brookings Institution scholar Tom
Loveless, examines achievement trends for high-
achieving students (defined, like low-achieving students,
by their performance on the National Assessment of
Educational Progress, or NAEP) since the early 1990s
and, in more detail, since 2000.
Part II: Results from a National Teacher Survey, authored
by Steve Farkas and Ann Duffett of Farkas Duffett
Research Group, reports on teachers’ own views of how
schools are serving high-achieving pupils in the NCLB era.
Here are the key findings:
While the nation’s lowest-achieving youngsters
made rapid gains from 2000 to 2007, the perfor-
mance of top students was languid. Children at
the tenth percentile of achievement (the bottom 10
percent of students) have shown solid progress in
fourth-grade reading and math and eighth-grade math
since 2000, but those at the 90th percentile (the top
10 percent) have made minimal gains.
This pattern—big gains for low achievers and lesser
ones for high achievers—is associated with the
introduction of accountability systems in general,
not just NcLB. An analysis of NAEP data from the
1990s shows that states that adopted testing and
accountability regimes before NCLB saw similar
patterns before NCLB: stronger progress for low
achievers than for high achievers.
page 3
HigH-ACHieving STudenTS in THe erA of nCLB
executive Summary
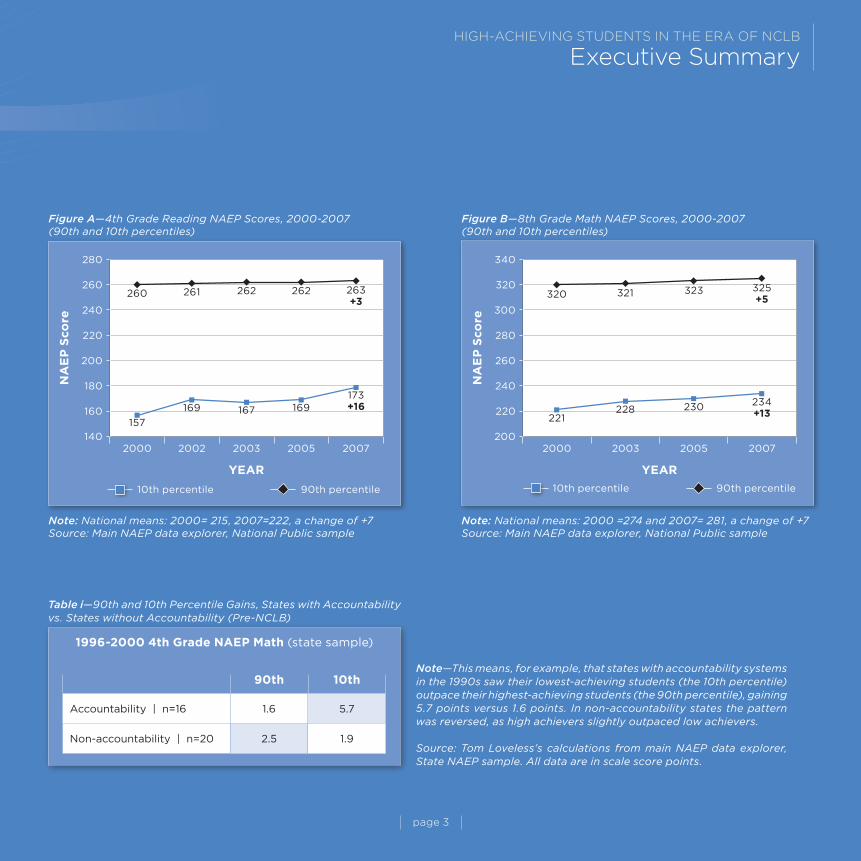
Figure A—4th Grade Reading NAEP Scores, 2000-2007(90th and 10th percentiles)
Note: National means: 2000= 215, 2007=222, a change of +7Source: Main NAEP data explorer, National Public sample
280
260
240
220
200
180
160
140
NA
EP
Sco
re
2000
yEAR
260 262 263+3
157
169 169173+16
2002 2003 2005 2007
262261
167
10th percentile 90th percentile
340
320
300
280
260
240
220
200
NA
EP
Sco
re
2000 2003 2005 2007
yEAR
320 321 323 325+5
221228 230 234
+13
10th percentile 90th percentile
Figure B—8th Grade Math NAEP Scores, 2000-2007(90th and 10th percentiles)
Note: National means: 2000 =274 and 2007= 281, a change of +7Source: Main NAEP data explorer, National Public sample
Table i—90th and 10th Percentile Gains, States with Accountability vs. States without Accountability (Pre-NCLB)
Note—This means, for example, that states with accountability systems in the 1990s saw their lowest-achieving students (the 10th percentile) outpace their highest-achieving students (the 90th percentile), gaining 5.7 points versus 1.6 points. In non-accountability states the pattern was reversed, as high achievers slightly outpaced low achievers.
Source: Tom Loveless’s calculations from main NAEP data explorer, State NAEP sample. All data are in scale score points.
1996-2000 4th Grade NAEP math (state sample)
90th 10th
Accountability | n=16 1.6 5.7
Non-accountability | n=20 2.5 1.9

page 4
Teachers are much more likely to indicate that
struggling students, not advanced students, are their
top priority. Asked about the needs of struggling
students, 60 percent of teachers say they are a “top
priority” at their school. Asked a similar question about
“academically advanced” students, only 23 percent of
teachers say they are a top priority. (They could give
multiple answers to this question.)
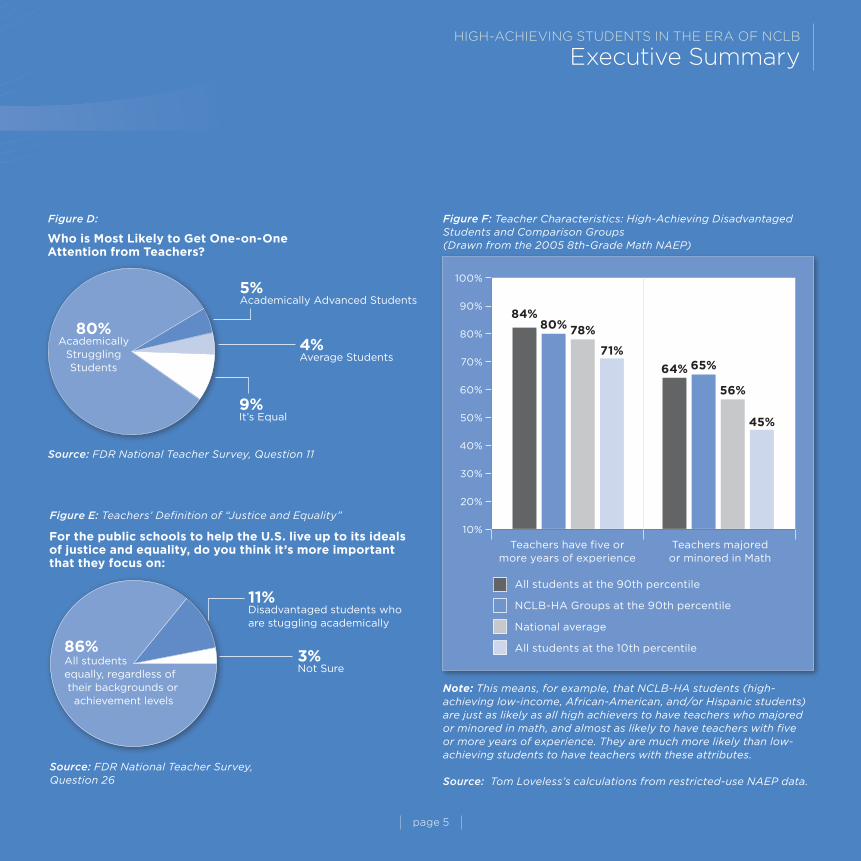
Low-achieving students receive dramatically more
attention from teachers. Asked “Who is most likely to
get one-on-one attention from teachers?” 81 percent
of teacher named “struggling students” while only 5
percent named “advanced students.”
Still, teachers believe that all students deserve an
equal share of attention. Teachers were given the
following choice: “For the public schools to help the
U.S. live up to its ideals of justice and equality, do
you think it’s more important that they (A) focus on
raising the achievement of disadvantaged students
who are struggling academically OR (B) focus equally
on all students, regardless of their backgrounds or
achievement levels?” Only 11 percent chose the former,
while 86 percent chose the latter.
Low-income, black, and Hispanic high achievers (on
the 2005 eighth-grade math NAEP) were more likely
than low achievers to be taught by experienced
teachers. These disadvantaged high achievers—
termed “NCLB-HA” in the study—were also as likely as
other high-achieving students to have teachers who
had majored or minored in math.
Figure C:
Source: FDR National Teacher Survey, Questions 3 and 4
Who is a “Top Priority” at your School?
AcademicallyStruggling Students
AcademicallyAdvanced Students
70%
60%
50%
40%
30%
20%
10%
0%
60%
23%
page 5
HigH-ACHieving STudenTS in THe erA of nCLB
executive Summary
Figure D:
Source: FDR National Teacher Survey, Question 11
Who is most Likely to Get One-on-One Attention from Teachers?
9% It’s Equal
5% Academically Advanced Students
4% Average Students
80%Academically
StrugglingStudents
Figure E: Teachers’ Definition of “Justice and Equality”
Source: FDR National Teacher Survey, Question 26
For the public schools to help the u.S. live up to its ideals of justice and equality, do you think it’s more important that they focus on:
3% Not Sure
86% All students equally, regardless of their backgrounds or achievement levels
11% Disadvantaged students who are stuggling academically
Figure F: Teacher Characteristics: High-Achieving Disadvantaged Students and Comparison Groups(Drawn from the 2005 8th-Grade Math NAEP)
Note: This means, for example, that NCLB-HA students (high-achieving low-income, African-American, and/or Hispanic students) are just as likely as all high achievers to have teachers who majored or minored in math, and almost as likely to have teachers with five or more years of experience. They are much more likely than low-achieving students to have teachers with these attributes.
Source: Tom Loveless’s calculations from restricted-use NAEP data.
Teachers have five or more years of experience
Teachers majored or minored in Math
All students at the 90th percentile
NCLB-HA Groups at the 90th percentile
National average
All students at the 10th percentile
100%
90%
80%
70%
60%
50%
40%
30%
20%
10%
84%
64%
80%
65%
78%
56%
71%
45%
page 6
HigH-ACHieving STudenTS in THe erA of nCLB
executive Summary
imPLicATiONS
Neither of these studies sought a causal link between
the No Child Left Behind Act and the performance of
high-achieving students. We cannot say that NCLB
“caused” the performance of the nation’s top students
to stagnate any more than it “caused” the achievement
of our lowest-performing pupils to rise dramatically.
All we know is that the acceleration in achievement
gains by low-performing students is associated with
the introduction of NCLB (and, earlier, with state
accountability systems). Neither can we be sure from
these data that teacher quality explains why some low-
income, African-American, and Hispanic students were
able to score in the top 10 percent on the 2005 eighth-
grade math NAEP, though there does appear to be a
relationship between the experience and education of
math teachers and their students’ performance.
The national survey findings show that most teachers, at
this point in our nation’s history, feel pressure to focus on
their lowest-achieving students. Whether that’s because
of NCLB we do not know (though teachers are certainly
willing to blame the federal law). What’s perhaps most
interesting about the teachers’ responses, however,
is how committed they are to the principle that all
students (regardless of performance level) deserve their
fair share of attention and challenges. Were Congress
to accept teachers’ views about what it means to create
a “just” education system—i.e., one that challenges all
students to fulfill their potential, rather than just focus
on raising the performance of students who have been
“left behind”—then the next version of NCLB would be
dramatically different than today’s.

page 7page 7
page 8
FOREWORDcHESTER E. FiNN, JR. AND micHAEL J. PETRiLLi
The major finding of this dual study is that, in one respect
at least, No Child Left Behind (NCLB) is working precisely
as designed. A good thing, surely, but not entirely
so. What we see in this study is one of its unintended
consequences—and one that’s worrisome for America’s
future competitiveness.
Congress was quite clear about NCLB’s objectives. Right
on its cover, it’s termed “An Act to close the achievement
gap.” Congress followed through with accountability
mechanisms that have one clear and explicit purpose:
drive up the achievement of low-performing pupils. As
for students on the other end of the spectrum, indeed
all youngsters who could already be termed proficient,
NCLB’s core provisions treat them with benign neglect.
Let them fend for themselves. Let someone else worry
about them. Let them eat—well, whatever is left over at
the bakery when the bread runs out.
And lo and behold, six years after the law’s enactment,
what do we find? Low-achieving students made solid
progress on the National Assessment of Educational
Progress (NAEP) from 2000 to 2007 (an accomplishment
surely worth celebrating, even though these students are
still far, far behind). Meanwhile, however, the progress of
our top students has been modest at best. And teachers
report feeling pressure to focus on the classroom’s
underachievers versus the overachievers—and, with
guilty conscience, have by and large done exactly that.
On this score, No Child Left Behind appears to be meeting
its objectives: narrowing achievement gaps from the
bottom up. Some may declare this to be a wonderful
accomplishment: the performance of low-achieving
students is rising, while those at the top aren’t losing
ground. But is that outcome good enough for a great
nation? If we want to compete in a global economy, don’t
we need all our young people—including our highest
achievers—to make steady progress too? And if so, isn’t
our current approach to standards-based reform in need
of a make-over?
Followers of Fordham’s work know that we’ve been
tracking NCLB since before its enactment. They also
know that the education of high achievers is a subject
about which we’ve long been concerned. (Myriad
employers, economists, tycoons, and elected officials
are similarly fretful about America’s competitiveness in
a flatter, brainier world.) So we decided to look into the
connection between the two.
Two years ago, we approached the John Templeton
Foundation about supporting a major research initiative
on this subject. They had already waded into these waters
with their landmark 2005 report, A Nation Deceived: How
Schools Hold Back America’s Brightest Students. After
some fruitful back-and-forth, the foundation agreed to
page 9
HigH-ACHieving STudenTS in THe erA of nCLB
foreword
underwrite our project. We are immensely grateful for
their partnership, support, and good counsel.
We signed up Tom Loveless, director of the Brown
Center on Education Policy at the Brookings Institution,
as well as Steve Farkas and Ann Duffett of the Farkas
Duffett Research Group. We’ve been privileged to work
with all three on earlier Fordham projects (with Loveless
on a paper on tracking and with Farkas and Duffett on
innumerable survey-research ventures). Each is careful,
creative, and rigorously objective. .
They agreed to collaborate with us on a multiyear, five-
part investigation of the state of high-achieving students
in U.S. schools. Within these covers are the findings from
the first two parts of that initiative. (Future studies will
look at the impact of de-tracking on achievement and at
the expansion of the Advanced Placement program.)
Templeton insisted, and we happily agreed, to appoint
an independent review committee to help steer these
studies. Committee members provided immeasurably
useful input on the study design and on early drafts of
these reports. Our thanks to Cynthia Brown, Director of
Education Policy, Center for American Progress; Paul
Gross, Professor Emeritus, College of Arts and Sciences,
University of Virginia; Frederick M. Hess, Director of
Education Policy Studies, American Enterprise Institute;
Richard Light, William H. Gale Professor of Education,
Harvard Graduate School of Education; Stephanie Pace
Marshall, Founding President and President Emerita,
Illinois Mathematics and Science Academy; Delia
Pompa, Vice President of Education, National Council of
La Raza; and Joyce Van Tassel-Baska, Executive Director,
Center for Gifted and Talented and Smith Professor of
Education, College of William and Mary. Let’s be clear,
though, that not every suggestion of every committee
member could be incorporated into the final product,
so any complaints and critiques should be addressed to
Fordham and the authors, not to the reviewers.
We also appreciate the myriad efforts of Fordham’s
team who helped this massive effort across the finish
line. They include program associate Christina Hentges,
new research director Amber Winkler, copy editor Anne
Himmelfarb, and designer Bill Buttaggi. It surely takes at
least a small village to produce a research report of this
sophistication, and we are grateful for everyone’s help.
cAN WE BE EquAL AND ExcELLENT, TOO?
That’s the question the late John W. Gardner asked
about Americans in his seminal 1961 book, Excellence. It
remains a profoundly important query in 2008. Hence
our original questions for these first two studies were
straightforward: How are high-achieving students
performing in the NCLB era? Has the introduction of
NCLB been associated with any change in their long-
term trends? How do trends in their performance
compare to those for low-achieving students? What can
we learn from teachers about how high achievers are
treated in their schools? What do teachers think about
page 10
NCLB’s focus on low-achieving pupils?
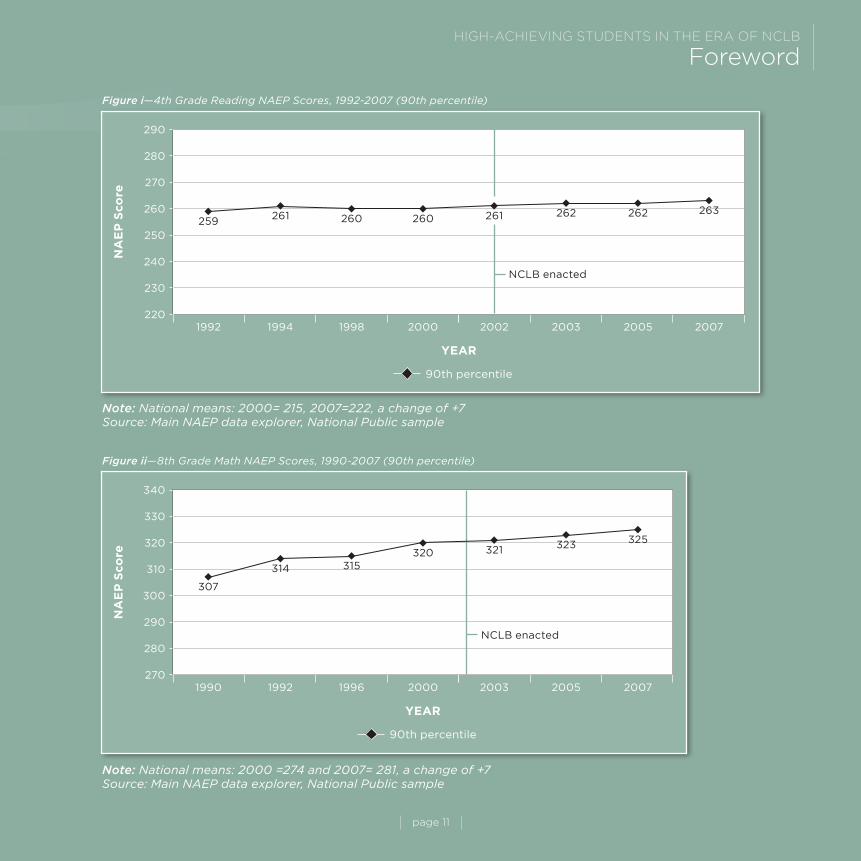
Many of the answers aren’t surprising, though they
are illuminating. Low-achieving students (defined by
Loveless as the 10 percent with the lowest scores on
the National Assessment of Educational Progress) made
big strides from 2000 to 2007, gaining sixteen points
(on NAEP’s 500-point scale) in fourth-grade reading,
eighteen in fourth-grade math, and thirteen in eighth-
grade math. (Eighth-grade reading was a bit of an
anomaly throughout this time, as Loveless explains in
detail.) Meanwhile, however, the performance of high-
achieving students is, in Loveless’s word, “languid.”
Their test scores haven’t fallen, mind you. This isn’t a
“Robin Hood” effect, where the bottom went up and the
top went down. But the bottom went up rather more
than the top did. Looking at long-term NAEP trends for
the top 10 percent, one spots a steady line inching ever-
so-slowly upward from the early 1990s to today. Enter
NCLB, and nothing changes. It’s “benign neglect” in
pictures. (See figures i and ii.)
It’s no great surprise, then, to learn that classroom
practitioners feel much pressure to focus on the needs
of the worst-performing youngsters. In their national
survey of third- to twelfth-grade public school teachers,
Steve Farkas and Ann Duffett found 60 percent saying
that low achievers are a “top priority” in their schools,
versus 23 percent who say that high achievers are.
And what about existing special programs intended to
serve high-achieving students? Can they be counted on
to challenge these students and boost their achievement
even more? Teachers don’t see them as terribly valuable.
In fact, a full 40 percent of teachers say that the content
and curriculum of honors and accelerated classes is “too
often watered down and lacking rigor.”
You may have expected this. But other findings of this
study are notably less predictable. Loveless performs
a unique analysis of NAEP data that shows big gains
for low performers and stagnation for top performers
associated not just with NCLB but with standards-based
reform in general. States that adopted their own testing-
and-accountability reforms in the 1990s witnessed similar
trends. And for good reason: most state accountability
systems, like NCLB’s, put pressure on schools to get
students over a fairly low bar. That meant helping low
achievers. And voila.
Loveless also introduces us to a very interesting subset
of high achievers who had been largely invisible before:
poor, African-American, and Hispanic students who
scored in the top 10 percent on the 2005 eighth-grade
math NAEP. How do they manage to do so well? Partly,
it’s luck; 41 percent of them were born to mothers who
graduated from college—compared to only 19 percent of
low-achieving students (and 37 percent of all students).
But teacher quality probably plays a role, too. By and
large, these disadvantaged high achievers are taught
by instructors who majored or minored in math and
page 11
HigH-ACHieving STudenTS in THe erA of nCLB
foreword
2005 2007
NA
EP
Sco
re290
280
270
260
250
240
230
2201992 20021994 2003 2005 20071998 2000
yEAR
90th percentile
Figure i—4th Grade Reading NAEP Scores, 1992-2007 (90th percentile)
Note: National means: 2000= 215, 2007=222, a change of +7Source: Main NAEP data explorer, National Public sample
259 261 261 262 263262260 260
NCLB enacted
Note: National means: 2000 =274 and 2007= 281, a change of +7Source: Main NAEP data explorer, National Public sample
2005 2007
NA
EP
Sco
re
340
330
320
310
300
290
280
270 1990 20031992 2005 20071996 2000
yEAR
90th percentile
Figure ii—8th Grade Math NAEP Scores, 1990-2007 (90th percentile)
307
314
321 323 325
315320
NCLB enacted

page 12
HigH-ACHieving STudenTS in THe erA of nCLB
foreword
page 12
have greater classroom experience under their belts.
On paper at least, the teachers of these kids resemble
the teachers of all high achievers—and are much more
qualified than the teachers of low performers.
Farkas and Duffett also encountered some telling
surprises. Most notably, they explore the psyches of
U.S. teachers to understand their views on “equality and
justice” vis-à-vis low- and high-achieving youngsters.
Teachers were given the following forced-choice
question: “For the public schools to help the U.S. live up
to its ideals of justice and equality, do you think it’s more
important that they (A) focus on raising the achieve-
ment of disadvantaged students who are struggling
academically OR (B) focus equally on all students,
regardless of their backgrounds or achievement levels?”
Only 11 percent chose the former, while 86 percent chose
the latter.
Think about that. It’s an overwhelming repudiation of one
of NCLB’s core tenets. And perhaps it explains why the
achievement of our top students hasn’t fallen in recent
years—teachers’ personal views have “mediated” the
federal law’s intentions and incentives. In other words,
teachers haven’t totally yielded to NCLB’s pressures
because doing so would force them to abandon their
own values.
We can hear NCLB boosters cringing. “That’s a false
choice” they may say. “We never said to ignore the other
students. We just want disadvantaged kids to have their
fair share.”
This evokes Gardner’s question. “Can we be excellent
and equal too?” Of course we want that answer to be yes.
We’d like to believe that lawmakers will find a techno-
cratic solution to NCLB’s flaws. (Loveless suggests a
creative one.) Perhaps through the right “growth model,”
the perfectly chosen “multiple indicators” or “multiple
measures,” we can provide incentives to schools to
focus on low performers, and high performers, too, and
also everybody in between.
Perhaps. But listen again to the teachers, who have
limited time and finite resources and must make painful
choices about how to spend them. And so we learn that
81 percent of teachers say that “academically struggling”
students are likely to get their one-on-one attention,
versus 5 percent who say “advanced students” are.
So let’s bring some honesty to this debate. How should
we define “justice” in America’s public education
system? Does it mean doing everything to bring up the
performance of low-achieving students, or does it mean
helping all students—rich and poor, black and white, low
and high achieving—equally? Count us with the teachers
on this one. If the United States is to compete with the
rest of the globe, and, more crassly, if No Child Left
Behind is to survive politically, then no students, even
those at the top, can have their needs “left behind.”
Our low-performing students are starting to make
respectable gains. By all means, let’s keep that trend
going. But if gains by low achievers are our only measure
of success, America faces big challenges in the years
ahead.
page 13
PART 1
Analysis of nAeP dataTOM LOVELESS
page 14
HiGH-AcHiEviNG STuDENTS iN THE ERA OF NcLBIn 1972, Commissioner of Education Sidney P. Marland Jr.
presented a report to Congress on the education of gifted
and high-achieving children in the United States. The Marland
Report argued that America had too few challenging
programs to meet the needs of its high-achieving students.
Just fifteen years earlier, the Russian launch of Sputnik had led
to a flurry of programs promoting mathematics and science.
Within a few years, however, these programs were eclipsed by
a focus on societal inequities—especially those related to race
and poverty—and efforts were launched to eradicate similar
inequalities in U.S. schools. Gifted programs came under fire
for being elitist. Some dwindled away from lack of funding.
In addition to urging that gifted programs address a broad
array of talents and abilities, the Marland Report warned
Congress that bright minority students are particularly
vulnerable:
Intellectual and creative talent cannot survive educational
neglect and apathy. This loss is particularly evident in the
minority groups who have in both social and educational
environments every configuration calculated to stifle
potential talent.1
Attitudes toward bright children have waxed and waned
over the decades. The No Child Left Behind (NCLB) Act of
2001 sought to fuse equity and excellence into a single
initiative, promoting academic achievement in the pursuit
of equity.2 Historically, the federal government provided
additional revenue to schools serving disadvantaged children,
ostensibly so that schools could offer services that would
help poor children learn. The architects of NCLB sought
to transform the federal education dollar from a school
entitlement into an incentive to prod schools towards better
performance.3 Universal proficiency became the nation’s
foremost education goal.
Incentives shape behavior. Some analysts today express
the concern that, by focusing attention on the education
of students at the bottom of the achievement distribution,
NCLB is surely encouraging schools to neglect high achievers.
After all, schools face consequences for failing to move low-
achieving students to proficiency. Students in schools that fail
to make adequate progress for two consecutive years must be
offered the option of transferring to another public school. A
school that continues to fall short faces possible replacement
of its teaching staff, conversion to a charter school, or state
takeover. Nothing, however, happens when schools fail to
boost the learning of already-proficient students to higher
levels. As Susan Goodkin argued in the Washington Post, “By
forcing schools to focus their time and funding almost entirely
on bringing low achieving students up to proficiency, NCLB
sacrifices the education of the gifted students who will become
our future biomedical researchers, computer engineers, and
other scientific leaders.”4
Are these concerns well founded? Do the incentives of NCLB
create a Robin Hood effect, yielding gains for low-achieving
students but at the expense of high achievers? That’s what we
set out to investigate.
LiTERATuRE REviEWFaced with a powerful incentive to boost the test scores of
students on the borderline of proficiency—“bubble kids,” as
they are sometimes termed—schools might be expected to
focus resources on that point in the achievement distribution
and neglect the extreme upper and/or lower ends. If such
educational “triage” is actually practiced, high-achieving
students would lose out by making less academic progress
than that of which they are capable. Very little research has
been conducted on this topic, but three studies stand out for
their sound research methods.
page 15
PArT 1 Analysis of nAeP data
Derek Neal and Diane Schanzenbach examined test scores in
the city of Chicago in 2001 and 20025, a period when, due
to NCLB’s impending implementation, the city’s assessment
regimen shifted from low- to high- stakes testing. They found
that students in the middle of the achievement distribution—in
particular, those clustered around the threshold of proficiency—
made the greatest gains in reading and math. The evidence
was mixed as to whether high achievers made the gains that
would have been expected based on previous test scores, but
the bottom two achievement deciles definitely lagged behind.
The same pattern was found in a second batch of test scores
from 1996, right after the Chicago school system instituted
its own local accountability system. Evidence of educational
triage is indicated, but not necessarily at the expense of high
achievers. The students losing out seem to be those who are
so far below the cutoff for proficiency that they stand little
chance of getting over the proficiency bar.
Matthew Springer conducted a similar analysis using data from
an entire state.6 He analyzed test scores from the Northwest
Evaluation Association, a national organization that offers
assessment services, and focused on the accountability
system of a single western state (left unnamed). Springer
found no evidence of triage there. Examining test score
changes over a three-year period, Springer detected gains
across the distribution of achievement. Unlike Neal and
Schanzenbach, Springer detected the largest gains among the
lowest achievers. But high achievers gained, too. Interestingly,
they made gains in schools facing NCLB sanctions—and did
not show gains in schools immune from sanctions because
the schools had previously made adequate yearly progress
(AYP)—the opposite of what one would expect if schools were
redirecting resources away from high achievers in response to
NCLB’s incentives.
Randall Reback examined Texas data from the 1990s in search
of signs of triage.7 He compared the gains made by students
in schools facing sanctions under the Texas accountability
system with gains made by typical students at similar points
in the distribution of achievement. The Texas accountability
system at the time based school sanctions on pass rates, much
like NCLB. Reback found significant gains by students whose
improvement most influenced state ratings, but the scores of
very low-achieving students also improved. High achievers
did not fare well, and Reback concluded that “relatively high
achieving students perform worse than usual if their own
performance is irrelevant to the short-run accountability
incentives.”8 A cautionary note: the undemanding content
of the Texas Assessment of Academic Skills (TAAS), which
produced the data analyzed in the study, has been well
documented. Some experts describe the TAAS as covering
skills and knowledge several years below grade level, which
raises questions as to whether it is an adequate instrument for
measuring the gains of high achievers.9
These three studies yield no clear conclusion as to whether
NCLB-style accountability encourages educational triage.
In particular, it is unclear how high achievers fare under
such systems. They gained (Springer), lost (Reback), and
experienced mixed results (Neal and Schanzenbach). In
addition to these mixed and inconclusive findings, one of the
difficulties in generalizing from studies that focus on a single
locale (city or state) is that outcomes may be influenced by
other atypical factors. In Chicago, for example, the city’s
accountability system overlapped with that of Illinois and
included a heavy dose of student accountability in the form
of mandatory summer school for failing students. Few local
accountability systems include strong student accountability,
and NCLB is silent on the matter. Because NCLB is a national
policy with national implications, an examination of trends in
national achievement is informative for understanding how
the law may affect high-achieving students.
page 16
THE PROBLEm ADDRESSED iN THiS STuDyThe incentives of NCLB are geared towards improving the
education of low-achieving students to close achievement
gaps. Have low achievers gained the most in the NCLB
era? What about high achievers? Data from the National
Assessment of Educational Progress (NAEP) are analyzed
to compare national achievement trends of low and high
achievers. This analysis cannot test causal theories relating to
NCLB (or anything else) since NAEP data are cross-sectional,
offering a snapshot of how students are performing at
a single point in time. However, because NAEP is the only
test given to a nationally representative sample each time it
is administered, its data give the best estimate of trends in
national achievement.
NAEP regularly assesses students in reading and mathematics
at fourth and eighth grades. The 10th and 90th percentiles
on the NAEP scale are used in this analysis to identify “low
achievers” and “high achievers.” National averages on NAEP
have been going up since 2000. In an environment of rising
average scores, what is happening at both ends of the
distribution? If the distribution of achievement is shifting
upward across all performance levels—all ships rising—everyone
would be getting better at about the same rate with no
one group having an apparent advantage over another. A
compressed distribution or narrowing of the gap between the
10th and 90th percentiles would occur if low achievers gained
more than high achievers, or if high achievers’ scores declined
while low achievers’ scores rose. In either case, the bottom
would be catching up with the top. A widening distribution,
on the other hand, would result if scores of high achievers rose
more than those of low achievers, or if low achievers’ scores
declined while high achievers’ scores went up. Regardless,
the gap between the two groups would grow larger. High
achievers would be outdistancing their peers by even more.
Based on the thrust of NCLB, a plausible hypothesis to begin
with is that the distribution of NAEP scores is compressing, with
low achievers making gains, high achievers staying flat or even
declining, and the achievement gap between the two groups
narrowing. After all, NCLB gives schools and policymakers no
incentive to boost the scores of high-achieving students. The
studies reviewed above offer three reasonable hypotheses
about the test scores of high-achieving students: that they
went up (Springer), went down (Reback), or were mixed or
neutral (Neal and Schanzenbach). One benefit of NAEP is that
scale scores run from 0-500, and even the top 10% of scores
are immune from a ceiling effect.
RESEARcH quESTiONSThe study addresses four questions:
1. What has happened to the national NAEP scores of high
and low achievers since the advent of NCLB? Reading and
math scores at the 10th and 90th percentiles are analyzed
for fourth and eighth grades.
2. Was a trend in place before NCLB? National NAEP data
prior to NCLB are examined.
3. Is it NCLB accountability or accountability in general that
is associated with changes in the achievement gap? State
NAEP data from the 1990s are analyzed to compare the
gains of low and high achievers in states with and without
accountability mechanisms in place before NCLB was
enacted.
4. Who are America’s high achievers? Student level data
from the 2005 NAEP restricted-use files are summarized
to paint a portrait of America’s high-achieving students. A
subgroup of students is singled out for special attention:
high achievers who are black, Hispanic, or poor—special
subgroups under NCLB.
page 17
PArT 1 Analysis of nAeP data
DATA TREATmENTThree different NAEP sets of data are used in the analysis—
national, state, and student-level restricted-use files. The data
addressing research questions #1 and #2 are national means
at the 10th and 90th percentiles for students attending public
schools. The data in question 3 are 10th and 90th percentile
means of state NAEP scores. Question 4 uses student-level
data from the restricted-use 2005 NAEP files.
Why use the 10th and 90th percentiles of NAEP to define
low and high achievers? An argument could be made to use
NAEP’s own achievement levels. After all, NCLB sanctions
are tied to “proficiency,” not to percentiles. Yet the validity
of NAEP achievement levels has been questioned since their
inception.10 Moreover, too few students score at NAEP’s
advanced level—less than 5% in fourth-grade math in 2000,
for instance—to make that analysis meaningful, and the
categories are unbalanced: in contrast to that 5% of students
at the advanced level, about 77% of fourth-graders scored
below “proficient” in math in 2000.11 The benefit of using 10th
and 90th percentiles instead is that if NAEP scores are rising
equally across all achievement levels, we would expect scores
at these two points to behave about the same. Not so with the
NAEP achievement-level categories.
The data consist of NAEP reading and math scores for
fourth and eighth grades, producing four grade-subject
combinations. The NCLB time periods are defined by the last
administration of NAEP prior to the law’s passage and signing.
That is 2000 for fourth-grade math and reading and eighth-
grade math. For these three subject-grade combinations,
then, the 2000 NAEP serves as the dividing line between pre-
and post-NCLB periods in the analysis—that is, as the starting
point in the 2000–2007 NCLB-era data, and as the endpoint
in the 1990 –2000 pre-NCLB data. Eighth-grade reading was
not given in 2000, but was given in 1998 and 2002. For that
subject-grade combination, 1990–2002 constitutes the pre-
NCLB period and 2002–2007 the NCLB-era data.
P-values and standard errors for all of the data reported in the
paper appear in tables in appendices A and B, respectively.
Please note that the NAEP sample is so large (more than
160,000 students) that even changes of one or two points in a
NAEP score—or mean differences of three or four percentage
points in a descriptive statistic—can be statistically significant,
although perhaps not significant in the real world. In the
description below, any value that is described as “large” or
“significant” meets significance tests of p<.05.
page 18
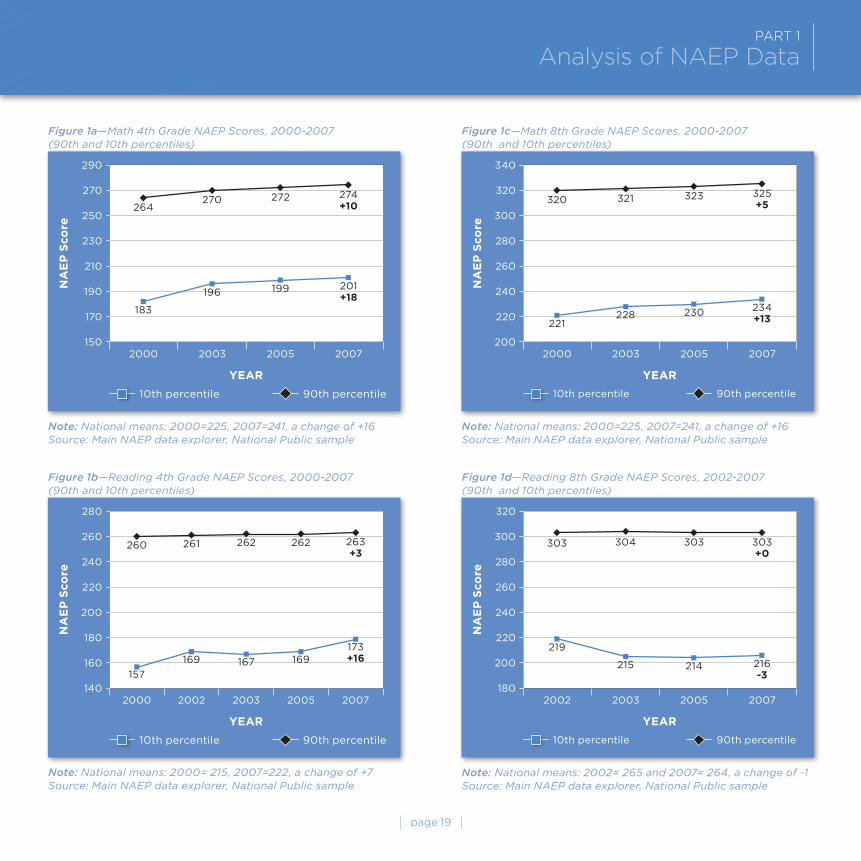
quESTiON 1: What has happened to the national NAEP scores of high and low achievers since the advent of NcLB?
The four graphs in figure 1 show the NAEP scores of high- and
low-achieving students from 2000 to 2007. The graphs on the
left, figures 1a and 1b, display scores for fourth grade; those on
the right, figures 1c and 1d, display scores for eighth grade. In
fourth grade, both high and low achievers made large gains
in math (figure 1a). Scores at the 90th percentile rose from
264 to 274, a gain of ten points. Scores at the 10th percentile
rose a whopping eighteen points, from 183 to 201. Both gains
are statistically significant at p<.001. For a more meaningful
measure of the magnitude of such gains, a ballpark estimate
is that one year of learning is equal to about eleven NAEP
points. A gain of eighteen points at the 10th percentile is equal
to more than one and a half years of learning, an increase
that any teacher or parent of a low-achieving student would
surely notice and applaud.
The 2000 tests were the last NAEPs administered before
NCLB was proposed, debated in Congress, and signed into
law, and 2003 brought the first NAEP test given in math
after NCLB went into effect. As figure 1a reveals, the biggest
leap in math scores took place from 2000 to 2003. For both
low and high achievers, the bulk of the gains of the NCLB era
were attained in the very first interval of NAEP testing—from
2000 to 2003. The achievement gap between high and low
achievers narrowed immediately after NCLB was passed, but
then stabilized.
In fourth-grade reading, the sixteen-point gain by low
achievers stands out as impressive (see figure 1b). High
achievers’ scores have remained flat, however. As with math,
most of the action in reading scores took place in the initial
years. A pop upward of twelve points occurred in low achievers’
scores from 2000 to 2002, compared to a one-point gain by
high achievers. Over the entire era of NCLB, the gap between
the two groups contracted by thirteen scale score points,
more than a year’s worth of learning.
The eighth-grade scores do not tell a straightforward story.
They differ by subject. Math scores follow the same pattern
as fourth-grade scores—a pop in low achievers’ scores during
NCLB’s infancy (though not as large as that for fourth-graders),
leading to narrowing of the achievement gap, and then similar
growth by both low and high achievers in subsequent years
(see figure 1c). But eighth-grade reading diverges from this
pattern (see figure 1d). From 2002 to 2003, scores at the
90th percentile increased by a point, while the scores at
the 10th percentile declined four points, from 219 to 215. The
achievement gap widened. From 2003 to 2007, scores for
both groups barely budged, with low achievers gaining
a point and high achievers losing a point. Over all, unlike
the other three grade-subject combinations, eighth-grade
reading evidences no progress at the 10th percentile during
the NCLB era.
Why is eighth-grade reading an outlier? Note that it has a
different baseline year (2002) than the other grade-subject
combinations in the analysis because no eighth-grade reading
test was given in 2000. Any gains between 2000 and 2002,
which are quite large for the other three grade-subject
combinations, therefore go undetected. The prior NAEP test
in eighth-grade reading was in 1998. From 1998 to 2002,
eighth-grade reading did experience a jump in scores, and,
interestingly, the 10th percentile gained more than the 90th
percentile. The unique nature of eighth-grade NAEP scores
in reading should be kept in mind for the remainder of the
discussion.
Another important consideration concerning time intervals
should also now be apparent from examining the NAEP
data. Three grade-subject combinations exhibit a consistent
page 19
PArT 1 Analysis of nAeP data
290
270
250
230
210
190
170
150
NA
EP
Sco
re
2000 2003 2005 2007
yEAR
264270 272 274
+10
183
196 199 201+18
10th percentile 90th percentile
Figure 1a—Math 4th Grade NAEP Scores, 2000-2007(90th and 10th percentiles)
Note: National means: 2000=225, 2007=241, a change of +16Source: Main NAEP data explorer, National Public sample
340
320
300
280
260
240
220
200
NA
EP
Sco
re
2000 2003 2005 2007
yEAR
320 321 323 325+5
221228 230 234
+13
10th percentile 90th percentile
Figure 1c—Math 8th Grade NAEP Scores, 2000-2007(90th and 10th percentiles)
Note: National means: 2000=225, 2007=241, a change of +16Source: Main NAEP data explorer, National Public sample
Figure 1b—Reading 4th Grade NAEP Scores, 2000-2007(90th and 10th percentiles)
Note: National means: 2000= 215, 2007=222, a change of +7Source: Main NAEP data explorer, National Public sample
280
260
240
220
200
180
160
140
NA
EP
Sco
re
2000
yEAR
260 262 263+3
157
169 169173+16
10th percentile 90th percentile
2002 2003 2005 2007
262261
167
320
300
280
260
240
220
200
180
NA
EP
Sco
re
2002 2003 2005 2007
yEAR
303 304 303 303+0
219
215 214 216-3
10th percentile 90th percentile
Figure 1d—Reading 8th Grade NAEP Scores, 2002-2007(90th and 10th percentiles)
Note: National means: 2002= 265 and 2007= 264, a change of -1Source: Main NAEP data explorer, National Public sample
page 20
pattern, a straightforward story of narrowing gaps during the
NCLB era—mostly the result of sharp gains by low-achieving
students from 2000 to 2002 or from 2000 to 2003. But
whether these years belong in the NCLB era is debatable. The
starting point matters. Using the NAEP test immediately before
NCLB’s passage as a baseline, as this study does, includes
growth that may have nothing to do with NCLB. Selecting
a later date—2003, for example—and arguing that the act’s
accountability provisions could not have been implemented
before then would lead to the conclusion that growth was
much less during the NCLB era (although still statistically
significant, as shown in appendix A), and that the gaps
between low and high achievers were essentially unchanged.
But it would also omit influence that NCLB may have had on
NAEP scores during the debate and early implementation of
the legislation.
Neal and Schanzenbach provide an example. In the fall of
2001, “with the passage of NCLB looming on the horizon,”
the state of Illinois placed hundreds of schools on a watch list
and declared that future state testing would be high stakes.12
If such actions influenced educators’ behavior and students’
test scores, an “NCLB effect” may have been registered in
2002. The bottom line is that there is no clear boundary
between pre- and post-NCLB periods and no perfect way to
delineate the NCLB era using the NAEP test years. Critics and
defenders of NCLB alike can (and do) exploit this ambiguity
to their advantage. The fairest approach is to point out the
large gains in NAEP scores in the period around 1998–2003
and acknowledge that NCLB’s association with these gains
is unknown.
Let’s turn now to examining NAEP scores from the 1990s
to see if the trends for 2000–2007 were evident in the
previous decade.
quESTiON 2: What were the trends in NAEP scores of high and low achievers before NcLB?
The four graphs of figure 2 display NAEP scores for the 1990s.
NAEP testing in the two subjects began in different years:
math testing in 1990 and reading in 1992. As figure 2a shows,
both high and low achievers in fourth grade made strong
gains during the decade. High achievers’ scores increased from
252 to 264, a gain of twelve points. Low achievers gained
thirteen points, going from 170 to 183. Both gains represent
more than a year’s worth of learning. The gap between the
10th and 90th percentiles remained essentially unchanged in
fourth-grade math.
Fourth-graders as a whole lost ground in reading (see figure
2b). Scores at the 10th percentile fell sharply from 168 to 157,
with a large loss from 1992 to 1994. High achievers’ reading
scores remained flat, ticking up a single point over the entire
decade. The gap between high and low achievers expanded
in the 1990s due to the declining scores of students at the
bottom of the achievement distribution.
The achievement gap also widened in eighth-grade math
but for a different reason (see figure 2c). Scores of high
achievers moved from 307 to 320, a gain of thirteen points.
Low achievers made gains, but not as large—seven points. All
boats were rising in eighth-grade math, but the boats at the
90th percentile rose more than those at the 10th percentile.
The gap did narrow in eighth-grade reading (see figure 2d).
Scores at the 10th percentile rose eight points, in contrast to
a one-point gain at the 90th percentile. Thus, math and
reading present opposite patterns in eighth grade but, as
noted above, the unique time interval for eighth-grade
reading scores makes those data difficult to interpret.
In sum, the 1990s present a mixed picture. The NAEP score
gap between high and low achievers widened in fourth-grade

page 21
PArT 1 Analysis of nAeP data
290
270
250
230
210
190
170
150
NA
EP
Sco
re
1990 1992 1996 2000
yEAR
252259 261 264
+12
170176
181 183+13
10th percentile 90th percentile
Figure 2a—Math 4th Grade NAEP Scores, 1990-2000(90th and 10th percentiles)
Note: National means: 1990= 213, 2000 = 225, a change of +12Source: Main NAEP data explorer, National Public sample
290
270
250
230
210
190
170
150
NA
EP
Sco
re
1992 1994 1998 2000
yEAR
259 261 260 260+1
168 156161
+11157
10th percentile 90th percentile
Figure 2b—Reading 4th Grade NAEP Scores, 1992-2000(90th and 10th percentiles)
Note: National means: 1992 = 217, 2000= 215, a change of -2Source: Main NAEP data explorer, National Public sample
340
320
300
280
260
240
220
200
NA
EP
Sco
re
1990 1992 1996 2000
yEAR
307314 315
320+13
214219 219 221
+7
10th percentile 90th percentile
Figure 2c—Math 8th Grade NAEP Scores, 1990-2000(90th and 10th percentiles)
Note: National means: 1990= 263 and 2000= 274, a change of +11Source: Main NAEP data explorer, National Public sample
320
300
280
260
240
220
200
180
NA
EP
Sco
re
1992 1994 1998 2002
yEAR
302 303 303 303+1
211 208214
219+8
10th percentile 90th percentile
Figure 2d—Reading 8th Grade NAEP Scores, 1992-2002(90th and 10th percentiles)
Note: 1992=260 and 2002= 265, a change of +5Source: Main NAEP data explorer, National Public sample

page 22
Grade/Subject Pre-NcLB Post-NcLB
Grade/Subject Pre-NcLB Post-NcLB
Table 1—Annual Gains by 10th percentile pre- and post-NCLB
Table 2—Annual Gains by 90th percentile pre- and post-NCLB
Average annual gains found by dividing gain over entire interval by number of years in interval. All gains are measured in NAEP scale score points.
Average annual gains found by dividing gain over entire interval by number of years in interval. All gains are measured in NAEP scale score points.
Grade 4–Math 1.3 2.6
Grade 4–Reading -1.4 2.3
Grade 8–Math 0.7 1.9
Grade 4–Reading 0.8 -0.6
Average of grade/subject combinations
0.35 1.55
Grade 4–Math 1.2 1.4
Grade 4–Reading 0.1 0.4
Grade 8–Math 1.3 0.7
Grade 4–Reading 0.1 0.0
Average of grade/subject combinations
0.675 0.625
page 23
PArT 1 Analysis of nAeP data
reading and eighth-grade math, but for different reasons.
The gap contracted in fourth-grade math and eighth-grade
reading, again for different reasons. High achievers generally
fared better than low achievers during the 1990s; however, the
weak performance of 10th percentile fourth-graders in reading
unduly influences this conclusion. Without that steep decline,
the conclusion would be that the two groups performed about
the same, with both making solid gains.
How do the pre- and post-NCLB periods compare? Tables 1
and 2 report the average annual change in test scores. The
changes are expressed in annual increments because the test
intervals of the grade-subject combinations span different
numbers of years. Table 1 shows changes in test scores for 10th
percentile students in the pre- and post-NCLB periods. Table
2 offers the same comparison for 90th percentile students.
The major contrast before and after NCLB occurred in scores
at the 10th percentile (see table 1). Low achievers made
significant strides on NAEP after 2000. The gains of low
achievers in fourth-grade math doubled from the pre-NCLB
period (when there was an average annual gain of 1.3 points)
to the post-NCLB period (2.6 points). In fourth-grade reading,
low achievers lost ground before NCLB (average annual loss
of 1.4 points) but accomplished healthy gains after NCLB (2.3
points). The gain in eighth-grade math rose from .7 points per
year to 1.9 points per year. And eighth-grade reading exhibits a
pattern different from the other grade-subject combinations,
showing gains in the pre-NCLB period (average increase of
0.8 points per year) offset by losses during the post-NCLB
period (average decline of 0.6 points per year).
For the 90th percentile students, the differences between the
two eras’ NAEP scores are less pronounced (see table 2). Big
gains in fourth-grade math before NCLB (1.2 points per year)
continued into the post-NCLB period (1.4 points per year).
Trivial gains in fourth-grade reading in the pre-NCLB years
were matched by small gains after NCLB. A robust gain of
1.3 points per year in eighth-grade math before NCLB slowed
to an average annual gain of 0.7 points during the NCLB era.
Scores in eighth-grade reading were flat both before and after
NCLB. Overall, growth at the 90th percentile changed very
little in the pre- and post-NCLB eras, averaging 0.675 points
per year across the four grade-subject combinations in the
1990s and 0.625 after 2000. Growth at the 10th percentile,
on the other hand, has averaged 1.55 points per year during
the NCLB era, a marked acceleration from the 0.35 points per
year in the 1990s. The accelerating growth at the bottom of
the achievement distribution is driving the narrowing of the
achievement gap.
Let’s sum up the data on questions 1 and 2. The national
NAEP data support three findings: first, the achievement gap
between high and low achievers narrowed during the NCLB
era (2000–2007); second, the narrowing of the gap was not
taking place immediately prior to NCLB (1990–2000); and
third, the narrowing of the gap during the NCLB era is largely
due to a significant improvement in the performance of low
achievers and smaller gains by high achievers. It is important
to stress again that these patterns in NAEP data only indicate
correlation and cannot be tied causally to NCLB. But they
do confirm the Springer study’s finding that NCLB-style
accountability is associated with increases in achievement at
the bottom of the distribution without declines in achievement
at the top.
Holding schools accountable for changes in test scores was
not an invention of NCLB. Similar accountability systems were
in place in many states in the 1990s. They, too, emphasized
boosting the achievement of students at the bottom of the
distribution. Maybe, then, accountability in general rather than
NCLB accountability in particular is associated with rising
scores among low-achieving students. The states present
a natural experiment on the question. Some states had
accountability systems in the 1990s and some states did not.
Examining state NAEP data will allow us to compare them.
page 24
quESTiON 3: is it NcLB accountability or accountability in general that is associated with contraction of the achievement gap?
NAEP draws on different samples of students to produce
national and state scores. This practice provides a way to
confirm or reject the trends reported above for national NAEP
data. We weighted the gains by population so that a large state
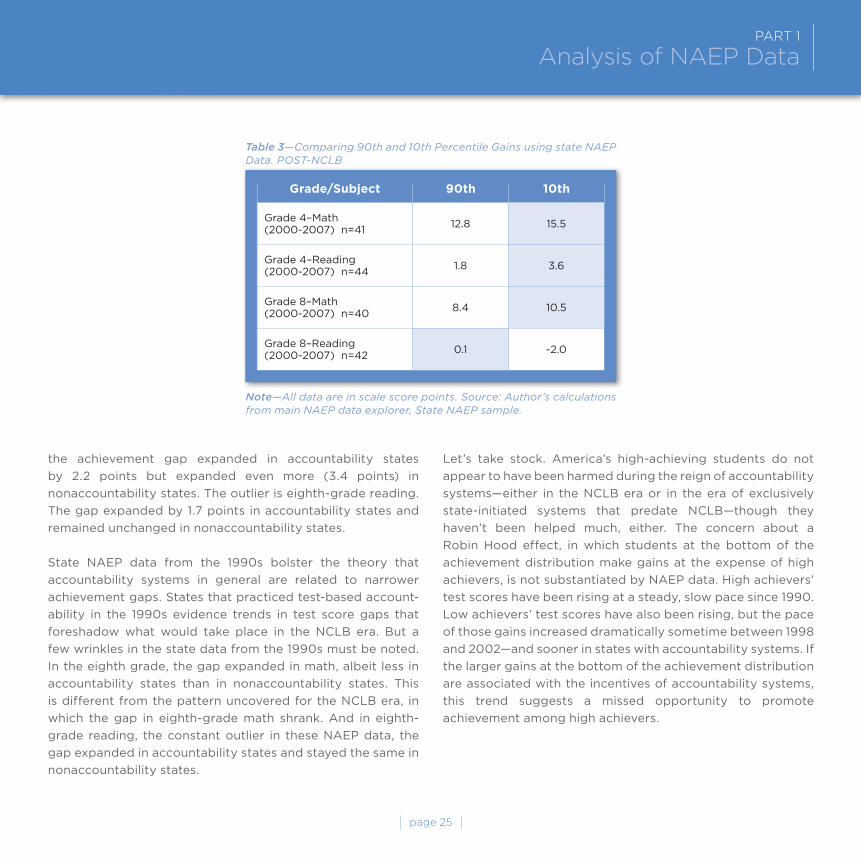
counts for more than a small state. Table 3 shows the mean
scale score gains at the 10th and 90th percentiles for states that
participated in NAEP from 2000 to 2007 (participation was
voluntary until 2003). At the beginning of the decade, state
math and reading tests were given in different years—2000
for math and 2002 for reading. The statistic for the group of
students making the most progress—either the 10th or 90th
percentile—is shaded in each row.
In a trend consistent with national NAEP data, low-achieving
students made greater academic strides than 90th percentile
students on state NAEP tests and narrowed the gap separating
the two groups. In fourth-grade math, low achievers notched
a 15.5-point gain compared to a 12.8-point gain among high
achievers. In fourth-grade reading, low achievers gained 3.6
points versus 1.8 for high achievers. In eighth-grade math,
the 10.5-point gain by low achievers outpaced the gain
of 8.4 points by high achievers. The general pattern is one
of all boats rising; but the boats at the 10th percentile rose
more than those at the 90th percentile. Again, eighth-grade
reading diverges from the general pattern, with the 90th
percentile showing a tiny gain (0.1 point) and low achievers a
2.0-point loss.
For the analysis of pre-NCLB data, we categorized states as
having accountability or nonaccountability policies in the
1990s using the coding scheme of Martin Carnoy and Susanna
Loeb.13 They classified as “accountability states” those states
with systems that rewarded or sanctioned schools based
on test scores. The sanctions of NCLB apply to schools with
grades 3–8, which are also the grades of interest in the current
study, so if a state’s accountability system did not apply to
grades 3–8, we re-classified the state as a “nonaccountability”
state. In table 4, data are presented for the NAEP testing
interval immediately prior to NCLB—1996 to 2000 in math
and 1998 to 2002 in reading. Going back earlier in the 1990s
would severely diminish the number of states in the analysis
since not all states participated in NAEP.14
Two questions of interest: Did low achievers gain more than
high achievers? And did they gain more in accountability
states than in nonaccountability states? The statistic for the
group of students making the most progress—either the 10th
or 90th percentile—is shaded in each row of table 4. First look
at the figures for “overall.” The picture is mixed. Low achievers
did gain more than high achievers in both subjects at fourth
grade—4.5 versus 1.8 points in math and 8.2 versus 2.3 points
in reading. But high achievers did better than low achievers
in both subjects at eighth grade—a gain of 2.3 points versus
a 0.2 loss in math, and a gain of 1.6 points versus a 0.3 gain in
reading. So in the NAEP testing period immediately preceding
NCLB, the achievement gaps contracted in fourth grade but
widened in eighth grade.
The comparison of accountability systems is more decisive.
Examine the change in gap statistics for both regimes.
Negative values indicate a narrowing gap and positive values
a widening gap. For three of the grade-subject combinations,
the achievement gap in states with accountability systems
improved compared to nonaccountability states. In
fourth-grade math, the gap narrowed by 4.1 points in
accountability states compared to a widening of 0.6 points in
nonaccountability states. In fourth-grade reading, the gap
narrowed by 6.6 points in accountability states versus 4.3
points in nonaccountability states. In eighth-grade math,
page 25
PArT 1 Analysis of nAeP data
Grade/Subject 90th 10th
Table 3—Comparing 90th and 10th Percentile Gains using state NAEP Data. POST-NCLB
Note—All data are in scale score points. Source: Author’s calculations from main NAEP data explorer, State NAEP sample.
Grade 4–Math(2000-2007) n=41
12.8 15.5
Grade 4–Reading(2000-2007) n=44
1.8 3.6
Grade 8–Math(2000-2007) n=40
8.4 10.5
Grade 8–Reading(2000-2007) n=42
0.1 -2.0
the achievement gap expanded in accountability states
by 2.2 points but expanded even more (3.4 points) in
nonaccountability states. The outlier is eighth-grade reading.
The gap expanded by 1.7 points in accountability states and
remained unchanged in nonaccountability states.
State NAEP data from the 1990s bolster the theory that
accountability systems in general are related to narrower
achievement gaps. States that practiced test-based account-
ability in the 1990s evidence trends in test score gaps that
foreshadow what would take place in the NCLB era. But a
few wrinkles in the state data from the 1990s must be noted.
In the eighth grade, the gap expanded in math, albeit less in
accountability states than in nonaccountability states. This
is different from the pattern uncovered for the NCLB era, in
which the gap in eighth-grade math shrank. And in eighth-
grade reading, the constant outlier in these NAEP data, the
gap expanded in accountability states and stayed the same in
nonaccountability states.
Let’s take stock. America’s high-achieving students do not
appear to have been harmed during the reign of accountability
systems—either in the NCLB era or in the era of exclusively
state-initiated systems that predate NCLB—though they
haven’t been helped much, either. The concern about a
Robin Hood effect, in which students at the bottom of the
achievement distribution make gains at the expense of high
achievers, is not substantiated by NAEP data. High achievers’
test scores have been rising at a steady, slow pace since 1990.
Low achievers’ test scores have also been rising, but the pace
of those gains increased dramatically sometime between 1998
and 2002—and sooner in states with accountability systems. If
the larger gains at the bottom of the achievement distribution
are associated with the incentives of accountability systems,
this trend suggests a missed opportunity to promote
achievement among high achievers.

page 26
Table 4—Comparing 90th and 10th Percentile Gains using state NAEP Data. PRE-NCLB
90th
1996-2000 GRADE 4 – mATH
10th change in Gap
90th
1996-2000 GRADE 8 – mATH
10th change in Gap
Accountability | n=15 2.5 0.3 2.2
Non-accountability | n=19 2.1 -1.3 3.4
Overall | n=34 2.3 -0.2 2.5
90th
1998-2002 GRADE 4 – READiNG
10th change in Gap
Accountability | n=16 2.2 8.8 -6.6
Non-accountability | n=21 2.6 6.9 -4.3
Overall | n=37 2.3 8.2 -5.9
90th
1998-2002 GRADE 8 – READiNG
10th change in Gap
Accountability | n=16 1.5 -0.2 1.7
Non-accountability | n=18 1.9 1.9 0.0
Overall | n=34 1.6 0.3 1.9
Note—All data are in scale score points. Source: Author’s calculations from main NAEP data explorer, State NAEP sample.
Accountability | n=16 1.6 5.7 -4.1
Non-accountability | n=20 2.5 1.9 +0.6
Overall | n=36 1.8 4.5 -2.7
page 27
PArT 1 Analysis of nAeP data
quESTiON 4: Who are America’s high achieving students?
The emphasis on closing achievement gaps between high
and low achievers places a spotlight on struggling students.
Popular media, academic researchers, and public policy
devotes considerable resources to students having trouble at
school. Often left out of discussions of achievement gaps are
high achievers. They are America’s best students. What do we
know about them?
This section presents a profile of high-achieving students
in the United States. The sample of eighth-graders scoring
at the 90th percentile or above on NAEP represents about
380,000 pupils. What do we know about them in terms of
their demographic characteristics, their schools, and their
teachers? We sifted through the restricted-use files of the
2005 NAEP, specifically those pertaining to the eighth-grade
math test. Data from the NAEP reading test or another grade
might produce different results.15 Appendix C provides the
sources for the independent variables in this question.
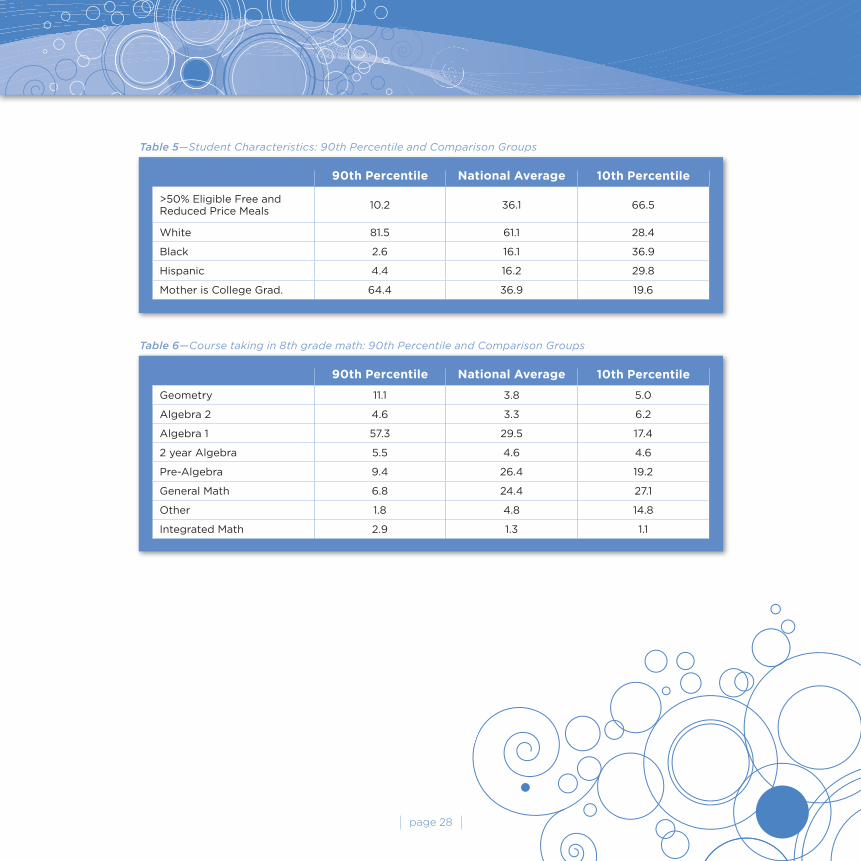
THE TyPicAL HiGH AcHiEvER The typical student scoring at the 90th percentile on the
eighth-grade math NAEP comes from a more privileged
socioeconomic background than the typical American
student (see table 5). Only 10.2% qualify for free or reduced
price meals, compared to 36.1% of eighth-graders nationwide
and 66.5% of students scoring at the 10th percentile. This
means that high achievers are only one-sixth as likely to be
eligible for the free or reduced price meals program—a proxy
for family income—as low achievers. High achievers also differ
from other students in their racial and ethnic backgrounds.
More than four out of five (81.5%) of them are white, 2.6%
are black, and 4.4% are Hispanic.16 Among eighth-graders
nationwide, 61.1% are white, 16.1% black, and 16.2% Hispanic.
The three racial/ethnic groups are fairly evenly represented
among low achievers—28.4% white, 36.9% black, and 29.8%
Hispanic. As a rule of thumb, blacks and Hispanics are about
twice the proportion of low achieving students that one would
expect based on the composition of 8th grade students as a
whole—and one-fifth to one-fourth of the expected proportion
of high achievers.
For several decades, research has identified mothers’ education
as one of the strongest correlates of family background to
student achievement.17 Nearly two-thirds (64.4%) of high-
achieving students have mothers who graduated from college.
This is significantly higher than the national average (36.9%)
and more than three times the rate for low-achieving students
(19.6%). In sum, compared to the typical American eighth-
grader, high achievers are more likely to come from higher-
income homes, more likely to be white, and less likely to be
black or Hispanic, and their mothers are more likely to have
earned a college degree.
What math do high achievers study in eighth grade? Table
6 shows enrollment in eighth-grade courses. Most high
achievers are enrolled in algebra (57.3%), with a significant
number taking geometry (11.1%) or algebra II (4.6%). Thus,
nearly three-quarters of high achievers, 73.0%, are taking an
advanced math course—algebra or beyond. Among eighth-
graders nationwide, almost exactly half as many, 36.6%, are
enrolled in such courses. For students at the 10th percentile,
the figure is a surprisingly high 28.6%.18 The recent push to
enroll eighth-graders in tougher math courses is apparently
paying off, extending even to students for whom mathematics
is a struggle. High achievers take advanced math classes, to
be sure, but a significant number of low achievers are sitting
in the same classrooms.
About 18.0% of high achievers are enrolled in lower-level
math classes—pre-algebra, general math, or other (e.g.,
business math, remedial math)—compared to 61.1% of low-
page 28
90th Percentile National Average 10th Percentile
>50% Eligible Free and Reduced Price Meals
10.2 36.1 66.5
White 81.5 61.1 28.4
Black 2.6 16.1 36.9
Hispanic 4.4 16.2 29.8
Mother is College Grad. 64.4 36.9 19.6
Table 5—Student Characteristics: 90th Percentile and Comparison Groups
90th Percentile National Average 10th Percentile
Geometry 11.1 3.8 5.0
Algebra 2 4.6 3.3 6.2
Algebra 1 57.3 29.5 17.4
2 year Algebra 5.5 4.6 4.6
Pre-Algebra 9.4 26.4 19.2
General Math 6.8 24.4 27.1
Other 1.8 4.8 14.8
Integrated Math 2.9 1.3 1.1
Table 6—Course taking in 8th grade math: 90th Percentile and Comparison Groups

page 29
PArT 1 Analysis of nAeP data
achieving students and 55.6% of eighth-graders overall. Note,
though, that these are course titles only and may not reflect
the actual quality or rigor of the mathematics taught in the
courses. A fruitful line of inquiry for future research would be
to investigate eighth-grade math courses and describe how
math content varies among courses with the same title.19
ScHOOLS ATTENDED By HiGH AcHiEvERSThe characteristics of schools attended by high achievers are
shown in tables 7 and 8. High achievers are more likely to attend
suburban schools than other eighth-graders. Low-achieving
eighth-graders are more likely to attend urban schools and
schools with larger enrollments; these larger schools serve
about 885 students compared to a national average of 820 for
schools that house an eighth grade (see table 8). The schools
of high achievers are average in size, serving 815 students.
The negative relationship of school size with achievement—
driven here by the presence of low achievers in large
schools—has led some school reformers to call for reducing
the size of schools.20
Let’s look at the rest of the characteristics of schools displayed
in table 8. Like high-achieving students themselves, the schools
of high achievers appear socioeconomically advantaged.
About one in seven high achievers (14.7%) attends private
schools, much larger than the statistic for eighth-graders
nationally (8.8%) and for low achievers (3.3%). Only 10.6% of
high-achieving students attend high-poverty schools—those
in which at least half of the student body qualifies for free or
reduced price meals. That compares to 31.6% of all students
nationally and 59.1% of students at the 10th percentile. Only
3.8% of high achievers attend schools with half or more of
students receiving targeted Title I services. This is about
one-eighth of the figure for low-achieving students (29.7%).
Overall, high and low-achievers attend schools with drama-
tically different demographic profiles.
NAEP asks school principals to report how many students are
enrolled in an algebra course in their schools and how many
students participate in gifted and talented programs. Both
questions are important for determining whether schools are
offering high-achieving youngsters educational opportunities
that meet their unique educational needs. In 2001, Michigan
State researchers examined data from the 1995 Trends in
International Mathematics and Science Study (TIMSS) and
estimated that one-third of schools did not offer eighth-
graders an algebra class.21 This dismal situation has improved.
Evidence supplied by principals in response to the NAEP
questionnaire shows that 13.1% of eighth-graders nationwide
attended schools without an algebra class in 2005, including
9.2% of high achievers, the students who are presumably
best prepared for and most in need of such a course.22
That still represents about 34,000 students, so despite the
improvement, the figure suggests a significant neglect of
talent. About 16.5% of low achievers attend schools without
algebra, but as indicated above, one-third of low achievers
say they are enrolled in advanced math courses. Access to
such courses does not appear to be too daunting. Ironically,
low-achieving students are more likely to attend schools with
gifted programs than high achievers. This may be because
access to a variety of programs is intertwined with school size,
and attending schools with gifted programs is one benefit
that low achievers enjoy in attending larger schools. A less
benign possibility is that these gifted programs are used as a
substitute for algebra courses and other curricular offerings
with truly advanced content.
High-achieving students are more likely to attend schools
that assign students to math classes on the basis of ability
(i.e., tracking). Among students at the 90th percentile, 78.3%
attend a school that tracks eighth-grade math, versus 70.9%
for the average student and 65.7% among 10th percentile
students. This finding is consistent with research on tracking
reform conducted in the 1990s. At that time, an anti-tracking
page 30
movement swept the country; its proponents argued that
such sorting of pupils discriminated against poor and minority
children by locking them out of advanced classes.23 Many low-
performing schools, especially in urban areas, responded by
abandoning tracking and creating classes of students who
were presumably heterogeneous in ability. At the middle-
school level, de-tracking was especially popular in English
and history departments. Math departments vehemently
opposed this reform in the 1990s, but as shown here, even
they have been subject to it in many schools. About 22% of
high-achieving eighth-graders attend schools that do not
group students by ability in mathematics.
TEAcHERS OF HiGH AcHiEvERSWhat can NAEP tell us about the math teachers of high-
achieving students? Three findings stand out (see table 9).
They tend to be more experienced than teachers of the typical
eighth-grader, with an average of 15.2 classroom years under
their belts, compared with 13.5 years for the math teacher
of the average eighth-grader and 11.8 for teachers of low-
achieving students. A similar pattern is found in the odds of
being taught by a novice instructor. Low-achieving students
are about twice as likely (29.1%) to have a math teacher in the
first four years of his or her career as students at the 90th
percentile (16.1%).
Teachers of high achievers are slightly more likely to hold
a regular teaching certificate (86.6% versus 82.5% for the
average student) and to have majored or minored in math in
college. Almost two-thirds of the teachers of high-achieving
students majored or minored in math (64.2%) compared
to less than half of the teachers of low achievers (44.9%).24
These data are almost certainly driven by the demographic
characteristics of schools. A solid body of research documents
dramatic differences in the characteristics of teachers in
high- and low-poverty schools, ranging from preparation to
experience to turnover.25 As noted above, high achievers tend
to be clustered in low-poverty schools.
The third finding about teachers of high achievers is that
they are not walled off from the rest of the students in the
schools in which they teach. About one in six of the teachers
of 90th percentile students (17.1%) also teach a remedial math
class, and four in ten teach general math classes (39.5%). This
should allay the concern that teachers of high achievers are
cloistered from the general school population and unaware of
the needs of average students.
This concern relates to tracking. Critics of tracking argue
that grouping kids into classes by ability means that the best
students get the best teachers, while kids at risk of failing
get the worst teachers. The matching of good teachers and
students probably happens innocently. It makes sense that
schools assign teachers who know the most math to teach
advanced math classes, just as it makes sense that good math
students take the toughest math courses. Such commonsense
practices create a pairing of staff and students that looks
inequitable—high achievers taught by teachers with the
strongest math backgrounds and low achievers taught by
everybody else, including, of course, those who are weak in
math. One way to address the imbalance is to ask more strong
math teachers to teach at least one general or remedial math
class each day. Another is to increase the supply of teachers
with rigorous mathematics training—a longer-term and more
satisfying solution but also one that is more ambitious.
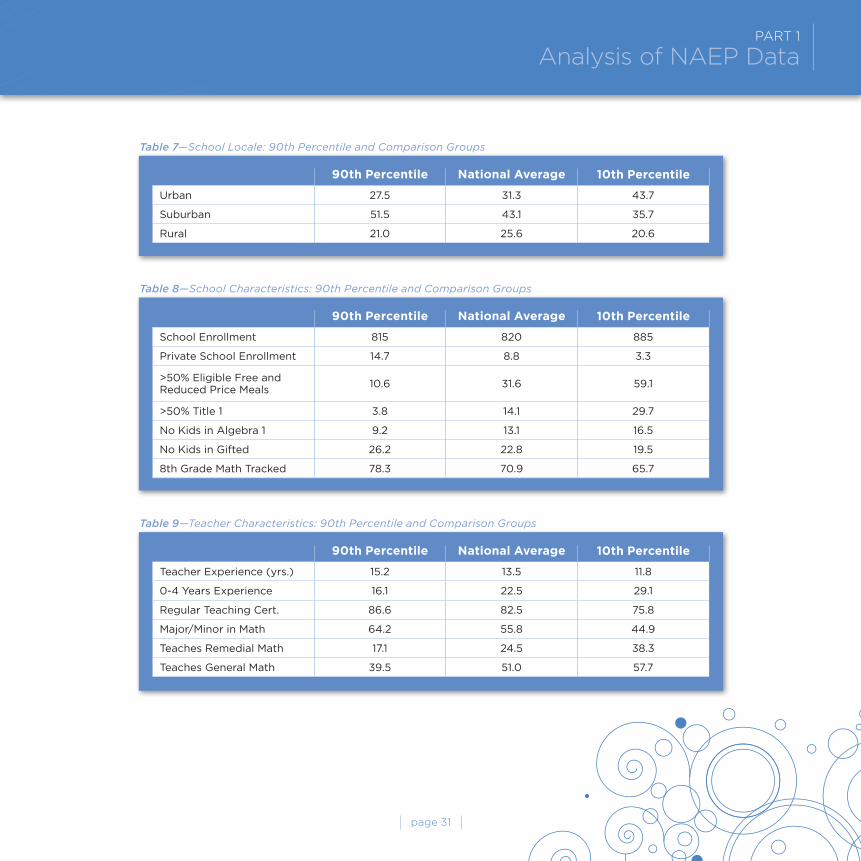
page 31
PArT 1 Analysis of nAeP data
90th Percentile National Average 10th Percentile
Urban 27.5 31.3 43.7
Suburban 51.5 43.1 35.7
Rural 21.0 25.6 20.6
Table 7—School Locale: 90th Percentile and Comparison Groups
90th Percentile National Average 10th Percentile
School Enrollment 815 820 885
Private School Enrollment 14.7 8.8 3.3
>50% Eligible Free and Reduced Price Meals
10.6 31.6 59.1
>50% Title 1 3.8 14.1 29.7
No Kids in Algebra 1 9.2 13.1 16.5
No Kids in Gifted 26.2 22.8 19.5
8th Grade Math Tracked 78.3 70.9 65.7
Table 8—School Characteristics: 90th Percentile and Comparison Groups
90th Percentile National Average 10th Percentile
Teacher Experience (yrs.) 15.2 13.5 11.8
0-4 Years Experience 16.1 22.5 29.1
Regular Teaching Cert. 86.6 82.5 75.8
Major/Minor in Math 64.2 55.8 44.9
Teaches Remedial Math 17.1 24.5 38.3
Teaches General Math 39.5 51.0 57.7
Table 9—Teacher Characteristics: 90th Percentile and Comparison Groups
page 32
A cLOSER LOOk: HiGH-AcHiEviNG STuDENTS FROm THREE NcLB SuBGROuPSWithin the population of high achievers are students targeted
by NCLB for special attention. Recall that, in the effort to
leave no child behind, NCLB requires schools to break out
the test scores of subgroups of children who historically
perform below average on tests of academic achievement.
What about kids within these subgroups who nonetheless
score well above average? From the pool of students scoring
at the 90th percentile and above on NAEP, we selected three
of these subgroups for special scrutiny—students who are
black, Hispanic, and eligible for free or reduced price meals.
About 14.0% of high achievers are members of one of these
three subgroups, representing approximately 53,000 eighth-
graders. They are not being left behind; rather, they are
outdistancing their peers in learning. What do the NAEP data
tell us about them?
Table 10 displays the socioeconomic characteristics of this
group of NCLB high achievers (hereafter called NCLB-HA).
Most students in this group come from a lower-income family.
Seven out of ten (70.5%) qualify for free or reduced price
meals, almost twice the national average. In terms of racial and
ethnic backgrounds, the NCLB-HA students are white (39.6%),
black (17.8%), and Hispanic (30.5%). The mothers of NCLB-HA
students are much more likely to have graduated from college
(41.1%) than the mothers of low achievers (19.6%). Indeed, the
mothers of NCLB-HA students are more likely to be college
grads than are the mothers of average students (36.9%).
The math coursework of NCLB-HA students is somewhat
less challenging than that of other 90th percentile students
(see table 11). About 64.2% are taking algebra or beyond in
eighth grade, nine percentage points less than for the 90th
percentile group as a whole. Enrollment by NCLB-HA students
in general math and pre-algebra (23.9%) exceeds that of all
high achievers (16.2%). These less rigorous courses seem
to be drawing students who are capable of handling more
advanced mathematics in eighth grade. Do not forget that
NCLB-HA students score at the 90th percentile on NAEP—
they differ from other high achievers only in race, ethnicity, or
family income.26
School characteristics for NCLB-HA students are displayed
in tables 12 and 13. Table 12 confirms that these students are
more likely to attend schools in urban areas (39.0%) compared
to other 90th percentile students (27.5%). Indeed, the schools
serving NCLB-HA students look more like schools serving 10th
percentile students than schools for those at the upper end of
the achievement distribution. NCLB-HA students attend larger
schools (863 students versus 815 students) and are much less
likely to attend private schools than the typical high achiever
(see table 13). Features of the large, urban public school
carry over into the remaining data in table 13. The schools of
NCLB-HA students enroll more youngsters eligible for free
or reduced price meals and targeted Title I services than the
average school of high achievers.
About one in seven NCLB-HA students (13.3%) attends a
school without an algebra class. Interestingly, the percentage
of NCLB-HA students attending schools with tracking (71.3%)
resembles the national average (70.9%), not the figure for other
high achievers (78.3%). These statistics underscore the impact
of tracking reform on urban schools. High achievers who are
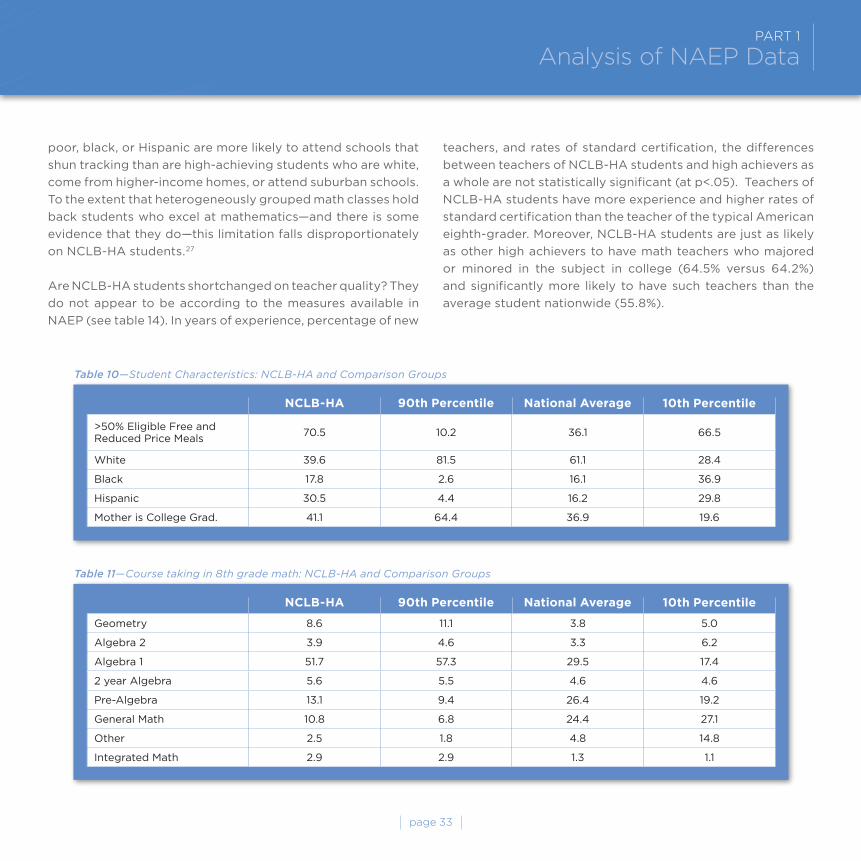
page 33
PArT 1 Analysis of nAeP data
90th PercentileNcLB-HA National Average 10th Percentile
>50% Eligible Free and Reduced Price Meals
70.5 10.2 36.1 66.5
White 39.6 81.5 61.1 28.4
Black 17.8 2.6 16.1 36.9
Hispanic 30.5 4.4 16.2 29.8
Mother is College Grad. 41.1 64.4 36.9 19.6
Table 10—Student Characteristics: NCLB-HA and Comparison Groups
90th PercentileNcLB-HA National Average 10th Percentile
Geometry 8.6 11.1 3.8 5.0
Algebra 2 3.9 4.6 3.3 6.2
Algebra 1 51.7 57.3 29.5 17.4
2 year Algebra 5.6 5.5 4.6 4.6
Pre-Algebra 13.1 9.4 26.4 19.2
General Math 10.8 6.8 24.4 27.1
Other 2.5 1.8 4.8 14.8
Integrated Math 2.9 2.9 1.3 1.1
Table 11—Course taking in 8th grade math: NCLB-HA and Comparison Groups
poor, black, or Hispanic are more likely to attend schools that
shun tracking than are high-achieving students who are white,
come from higher-income homes, or attend suburban schools.
To the extent that heterogeneously grouped math classes hold
back students who excel at mathematics—and there is some
evidence that they do—this limitation falls disproportionately
on NCLB-HA students.27
Are NCLB-HA students shortchanged on teacher quality? They
do not appear to be according to the measures available in
NAEP (see table 14). In years of experience, percentage of new
teachers, and rates of standard certification, the differences
between teachers of NCLB-HA students and high achievers as
a whole are not statistically significant (at p<.05). Teachers of
NCLB-HA students have more experience and higher rates of
standard certification than the teacher of the typical American
eighth-grader. Moreover, NCLB-HA students are just as likely
as other high achievers to have math teachers who majored
or minored in the subject in college (64.5% versus 64.2%)
and significantly more likely to have such teachers than the
average student nationwide (55.8%).
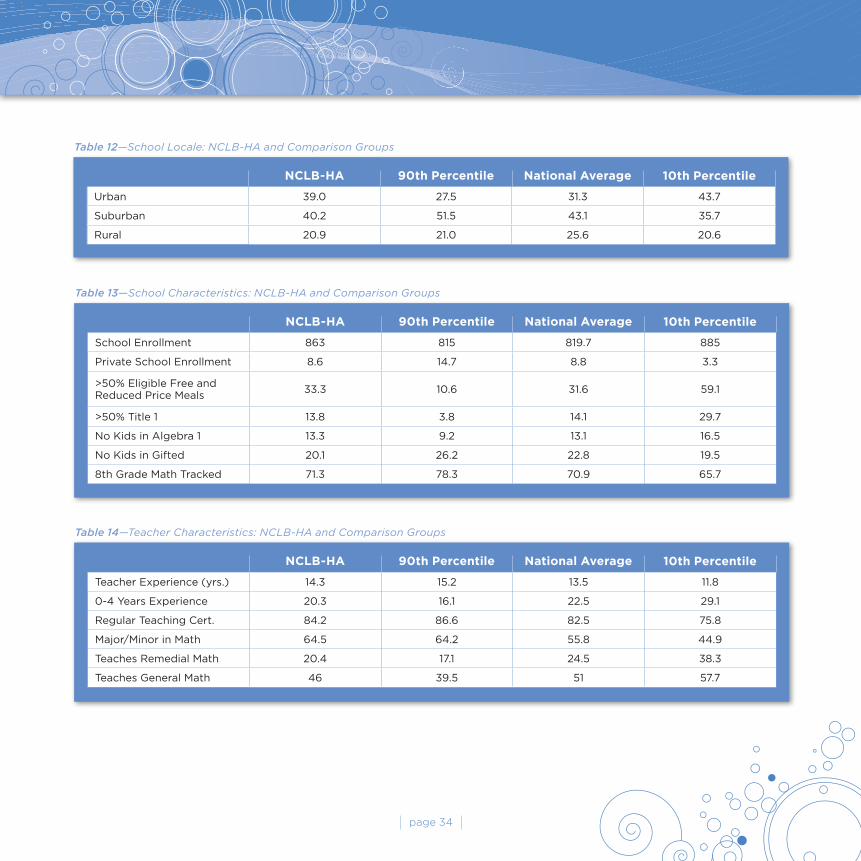
page 34
90th PercentileNcLB-HA National Average 10th Percentile
School Enrollment 863 815 819.7 885
Private School Enrollment 8.6 14.7 8.8 3.3
>50% Eligible Free and Reduced Price Meals
33.3 10.6 31.6 59.1
>50% Title 1 13.8 3.8 14.1 29.7
No Kids in Algebra 1 13.3 9.2 13.1 16.5
No Kids in Gifted 20.1 26.2 22.8 19.5
8th Grade Math Tracked 71.3 78.3 70.9 65.7
Table 13—School Characteristics: NCLB-HA and Comparison Groups
90th PercentileNcLB-HA National Average 10th Percentile
Teacher Experience (yrs.) 14.3 15.2 13.5 11.8
0-4 Years Experience 20.3 16.1 22.5 29.1
Regular Teaching Cert. 84.2 86.6 82.5 75.8
Major/Minor in Math 64.5 64.2 55.8 44.9
Teaches Remedial Math 20.4 17.1 24.5 38.3
Teaches General Math 46 39.5 51 57.7
Table 14—Teacher Characteristics: NCLB-HA and Comparison Groups
90th PercentileNcLB-HA National Average 10th Percentile
Urban 39.0 27.5 31.3 43.7
Suburban 40.2 51.5 43.1 35.7
Rural 20.9 21.0 25.6 20.6
Table 12—School Locale: NCLB-HA and Comparison Groups
page 35
PArT 1 Analysis of nAeP data
SummARy AND cONcLuSiONConcerns have been raised about how high-achieving
students may be affected by accountability systems, including
NCLB. Has the emphasis on getting struggling students over
a low academic bar diminished the quality of education for
students who excel academically? The NAEP data lead to
several conclusions. During the NCLB era, achievement gaps
between high- and low-achieving students have narrowed.
Both high and low achievers have made test score gains since
the federal government debated and implemented NCLB—
though not necessarily because of NCLB—but low achievers
have gained more. The trend is evident on both national and
state NAEP scores.
National NAEP data from the 1990s offer a mixed picture.
State NAEP data from the late 1990s also offer a mixed picture,
with one important exception: test score changes in states
that had accountability systems in place before NCLB look
more like the post-NCLB pattern—with all boats rising and low
achievers’ boats rising more—than those in states that did not
have accountability systems. So it appears that accountability
systems in general are associated with a similar pattern. The
NAEP data trends reported here mirror the state data analyzed
by Springer, whose research we looked at briefly above.
A few caveats. To reiterate a point already made, the choice
of what year to use as the beginning of the NCLB era affects
conclusions about the behavior of test scores during that
era. Since the largest gains were accomplished before 2003,
starting the era in 2003 will significantly reduce gains made
within the era. The second caveat pertains to eighth-grade
reading scores. Among the four grade-subject combinations
analyzed in the study, it is a constant outlier. The divergence
may be due to the different years that the test was administered,
but that is only a conjecture, and any conclusions about
eighth-grade reading must be made cautiously. Third, the
study does not allow for firm conclusions about the effects of
NCLB. It is true that the trends reported here are inconsistent
with the hypothesis that NCLB’s emphasis on low-achieving
students somehow cheats high achievers. But the data cannot
support or reject claims of causality. Perhaps high achievers
would have performed even better if NCLB never existed, or
perhaps the trends reported here were caused by other policy
interventions or changes in the family or society. NAEP data
cannot confirm or rebut such possibilities.
It would be a mistake to allow the narrowing of test score gaps,
although an important accomplishment, to overshadow the
languid performance trends of high-achieving students. Their
test scores are not being harmed during the NCLB era, but
they are not flourishing either. Gaps are narrowing because
the gains of low-achieving students are outstripping those of
high achievers by a factor of two or three to one. The nation
has a strong interest in developing the talents of its best
students to their fullest to foster the kind of growth at the top
end of the achievement distribution that has been occurring
at the bottom end. International comparisons of top students
around the world invariably show American high-achievers
falling short. The data reviewed here offer no indication of
that problem being solved anytime soon.28
There are several implications to consider from the data on
characteristics of high achievers. High achievers possess
socioeconomic advantages and more advantaged schools
and teachers. Compared to the average pupil—and especially
to the typical low-achieving student—they come from higher-
income families and their mothers are more educated. They
are more likely to attend schools in suburban areas, and their
schools are less likely to serve low-income children. They
take higher-level math courses and have more experienced
teachers, and their math teachers are more likely to have
majored or minored in math in college.
page 36
Although scoring at equally lofty levels on NAEP, high achievers
who come from NCLB-designated groups—black, Hispanic, or
low income—evidence a different set of characteristics than
their high-achieving peers. These students come from less
privileged socioeconomic backgrounds and attend schools
with more constraints—larger numbers of poor, urban children
and fewer advanced math courses offered. In fact, an eighth-
grader who scores at the national average in math is slightly
more likely to attend a school with an algebra course than
an NCLB-HA student scoring at the 90th percentile. Despite
rising scores for high achievers in the NCLB era, these are the
students at risk of suffering any lost opportunities stemming
from NCLB’s incentives.29
The math courses offered to NCLB-HA students deserve
close scrutiny. As noted above, great progress has been
made in providing algebra in most schools. Yet there is room
for improvement. About one-quarter of NCLB-HA students
(26.4%) are in math classes that precede algebra (pre-
algebra, general math, or other) compared to 18.0% of all
high-achieving eighth graders. Thousands of excellent math
students are not being adequately challenged in the subject—
at a time when these students are about to enter high school.
The NCLB-HA students have math teachers who appear as
qualified to teach advanced courses as the teachers of high
achievers as a whole. Granted, the data offer only crude proxies
for teacher quality, but they are commonly cited as national
and state indicators. Years of teaching experience are similar,
and similar percentages hold standard teaching certificates.
Similar percentages majored or minored in mathematics. On
this last measure—important in preparation to teach algebra,
geometry, and advanced algebra—the teachers of NCLB-
HA students are more highly qualified than teachers of the
average eighth-grader nationwide.
Thus, the lack of advanced math classes appears to be
school-based, in the sense that it is a product of school
policy or circumstances at schools, not of student or teacher
preparation. Some schools may have too few students with
the prerequisite skills to handle algebra and therefore cannot
fill a single algebra class. The fact that the schools of NCLB-
HA students are less likely to group students by ability in
math classes could also lead to fewer advanced curricular
offerings.
These findings have two sets of policy implications: one
directed at schools and districts, the other at policymakers
who create accountability systems. If course offerings in math
are limited for NCLB-HA students—or anyone else—because
of school-based factors, opportunities for taking advanced
math need to be opened up that are independent of schools.
No eighth-grader who is ready for algebra should be denied
access to that subject simply because of the school that he or
she attends. The same imperative holds for other advanced
math classes. If districts or schools find it impossible to provide
these math courses, for whatever reason, then web-based
courses should be offered to students who can demonstrate
that they are prepared to take them.
The current study joins a growing body of research that
suggests that incentives incorporated into accountability
systems work about as intended. The key is to get the
incentives right. To promote the continued progress of high-
achieving students, policymakers should consider creating
incentives for schools to boost more students into the upper
echelons of achievement.
Here is a modest proposal. Congress should fund an
experiment, perhaps as part of the reauthorization of
NCLB, that would both add to our understanding of how
accountability systems work and create new educational
opportunities for gifted disadvantaged youngsters. Schools
with large numbers of NCLB-HA students would be invited
to participate and randomly assigned to treatment or control
page 37
PArT 1 Analysis of nAeP data
groups. Control schools would be subject to standard NCLB
provisions. Treatment schools would be eligible for rewards.
Rewards would be offered for improving the test scores of
high-achieving students, with the reward increasing, perhaps
doubling, for gains by students in the NCLB-HA groups.
Evaluation could be built into the program so that, after a
reasonable period of time, the effects would be assessed
and findings released to the public. If the impact turned
out to be beneficial, the program could be expanded. Such
an experiment might motivate schools to better serve high
achievers, improve the image of NCLB by adding carrots to a
program with an incentive structure that currently is all sticks,
and produce valuable data for policy researchers.
Accountability systems try to improve the education of
students who struggle in school, and the preponderance of
evidence suggests that they have succeeded in boosting the
performance of low achievers. NCLB continues in that tradition.
The next generation of accountability in education must build
on that accomplishment to maximize the attainments of all
students, including America’s highest achievers.
NOTES1 Sydney Marland Jr., Education of the Gifted and Talented—Volume 1: Report to the Congress of the United States by the U. S.
Commissioner of Education (Washington, DC: Office of Education, 1971), 6.
2 Equity and excellence are two major themes of school reform. See Tom Loveless, “Uneasy Allies: The Evolving Relationship of
School and State,” Educational Evaluation and Policy Analysis 20, no.1 (1998): 1–8.
3 Tom Loveless, “The Peculiar Politics of No Child Left Behind,” in Standards-Based Reform and the Poverty Gap: Lessons for No
Child Left Behind, ed. A. Gamoran (Washington, DC: The Brookings Institution, 2007), 253–85.
4 Susan Goodkin, “Leave No Gifted Child Behind, Washington Post, December 27, 2005, A25.
5 Derek Neal and Diane Schanzenbach, “Left Behind by Design: Proficiency Counts and Test-Based Accountability,” NBER
Working Paper No. W13293, 2007.
6 Matthew Springer, “Accountability Incentives,” Education Next 8, no. 1 (2008): 74-79.
7 Randall Reback, “Teaching to the Rating” Journal of Public Economics (2007), doi:10.1016/j.jpubeco.2007.05.003
8 Ibid, page 3.
page 38
9 P. Clopton, W. Bishop, and D. Klein, “Statewide Mathematics Assessment in Texas,” http://www.mathematicallycorrect.com/
lonestar.htm (accessed March 14, 2008).
10 See Lori Shepard et al., Setting Performance Standards for Student Achievement (Washington, DC: National Academy of
Education, 1993).
11 Author’s calculations from the main NAEP data explorer, http://nces.ed.gov/nationsreportcard/nde/.
12 Neal and Schanzenbach, “Left Behind,” p. 13.
13 Martin Carnoy and Susanna Loeb, “Does External Accountability Affect Student Outcomes? A Cross-State Analysis,” Educational
Evaluation and Policy Analysis 24, no. 4 (2002): 305–31.
14 Carnoy and Loeb also took this approach in order to maximize the number of states available for analysis, as did Eric A.
Hanushek and Margaret E. Raymond, “High-Stakes Research,” Education Next, no. 3 (2003): 48-55.
15 Test scores for Hispanic students, because of potential language barriers affecting reading performance, may especially differ
between the math and reading tests.
16 Black, white, and Hispanic students constitute about 90% of the sample. The 10% of pupils unaccounted for in the discussion
are Asian or other racial/ethnic classifications.
17 This correlation was noted over forty years ago by James S. Coleman et al., Equality of Educational Opportunity (Washington,
DC: U.S. Government Printing Office, 1966) and has been confirmed by subsequent research.
18 This does not include 4.6% of students who are enrolled in two-year algebra courses, which are offered to increase the number
of students taking algebra by slowing down the pace and stretching the curriculum over two years.
19 Reba Page, Lower-Track Classrooms: A Curricular and Cultural Perspective (New York: Teachers College Press, 1991).
20 Tom Loveless and Frederick Hess, “Introduction: What Do We Know about School Size and Class Size?” in Brookings Papers
on Education Policy: 2006–2007, ed. T. Loveless & F. Hess, (Washington, DC: The Brookings Institution Press, 2007), 1-14.
21 L. S. Cogan, W. H. Schmidt, and D. E. Wiley, “Who Takes What Math and in Which Track? Using TIMSS to Characterize U.S.
Students’ Eighth-Grade Mathematics Learning Opportunities,” Educational Evaluation and Policy Analysis 23, no. 4 (Winter
2001): 323–41.
page 39
PArT 1 Analysis of nAeP data
22 A technical issue: principals were asked not if their schools offered an algebra class, but how many students were taking an
algebra class (and geometry and other math classes). The ensuing discussion assumes that schools do not offer an algebra class
if the principal reported zero students taking algebra.
23 Jeannie Oakes [Keeping Track:How Schools Structure Inequality (New Haven: Yale University Press, 1985)] was influential in
spurring the anti-tracking movement, which continues today. For research on schools responding to tracking reform, see Tom
Loveless, The Tracking Wars: State Reform Meets School Policy (Washington, DC: The Brookings Institution, 1999).
24 Tom Loveless, The 2004 Brown Center Report on American Education: How Well Are Students Learning? (Washington, DC:
The Brookings Institution, 2004).
25 L. Darling-Hammond, “Teachers and Teaching: Testing Policy Hypotheses from a National Commission Report,” Educational
Researcher 27, no. 1 (1998): 5–15.
26 Test scores aren’t everything in determining whether students are ready for particular classes. Study skills, attendance, and
other characteristics may come into play. Moreover, the eighth-grade NAEP may not be the appropriate test for differentiating
students who are equipped to take algebra from those who are not.
27 See Daniel I. Rees, Laura M. Argys, and Dominic J. Brewer, “Tracking in the United States: Descriptive Statistics from NELS,”
Economics of Education Review 15, no. 1 (1996): 83–89. See also Chen-Lin C. Kulik, and James A. Kulik, “Effects of Ability
Grouping on Secondary School Students: A Meta-Analysis of Evaluation Findings,” American Educational Research Journal 19
(1982): 415–28.
28 Patrick Gonzales, “America’s Top-Performing Students in Mathematics and Science: How Do They Compare to Their International
Peers?” Paper presented at the American Association for the Advancement of Science (AAAS) 2007 annual conference, San
Francisco, CA, February 17, 2007.
29 We examined the performance of NCLB-HA students on NAEP in 2000 and 2005 and found that they gained about 4.6 scale
score points in math, statistically indistinguishable from the gains of the 90th percentile as a whole. The percentage of high
achievers falling into one of the NCLB-HA subgroups groups rose from 9.4% to 14.5% during this period, but the share of the
subgroups also rose nationally, so this is not unexpected.
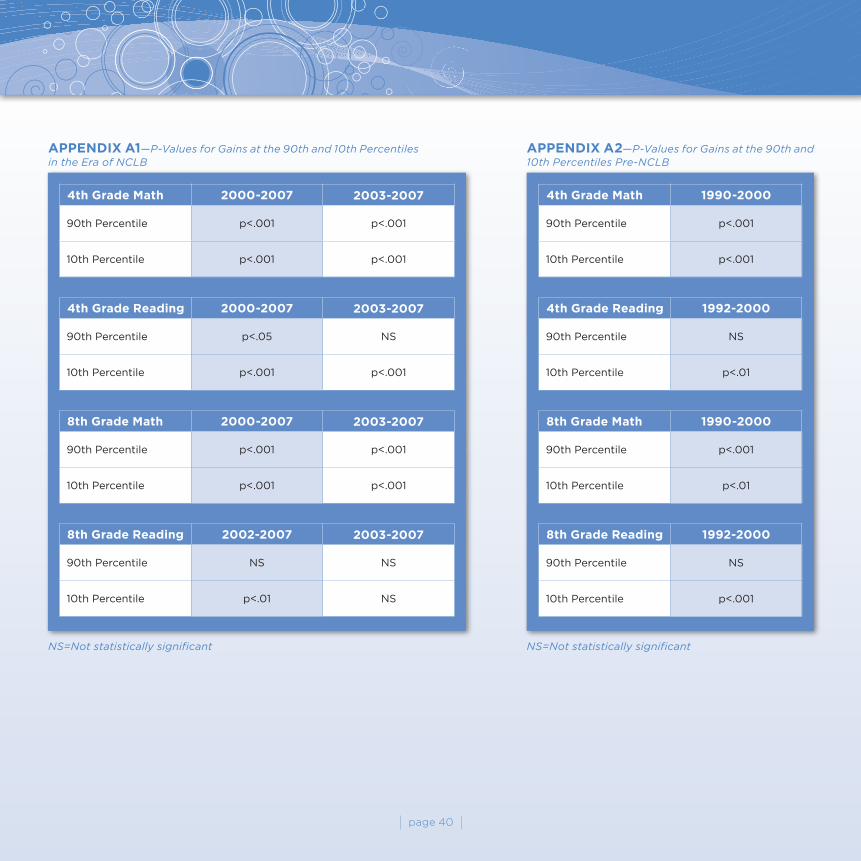
page 40
APPENDix A1—P-Values for Gains at the 90th and 10th Percentiles in the Era of NCLB
APPENDix A2—P-Values for Gains at the 90th and 10th Percentiles Pre-NCLB
NS=Not statistically significant NS=Not statistically significant
4th Grade math 2000-2007 2003-2007
90th Percentile p<.001 p<.001
10th Percentile p<.001 p<.001
4th Grade math 1990-2000
90th Percentile p<.001
10th Percentile p<.001
4th Grade Reading 1992-2000
90th Percentile NS
10th Percentile p<.01
8th Grade math 1990-2000
90th Percentile p<.001
10th Percentile p<.01
8th Grade Reading 1992-2000
90th Percentile NS
10th Percentile p<.001
4th Grade Reading 2000-2007 2003-2007
90th Percentile p<.05 NS
10th Percentile p<.001 p<.001
8th Grade math 2000-2007 2003-2007
90th Percentile p<.001 p<.001
10th Percentile p<.001 p<.001
8th Grade Reading 2002-2007 2003-2007
90th Percentile NS NS
10th Percentile p<.01 NS
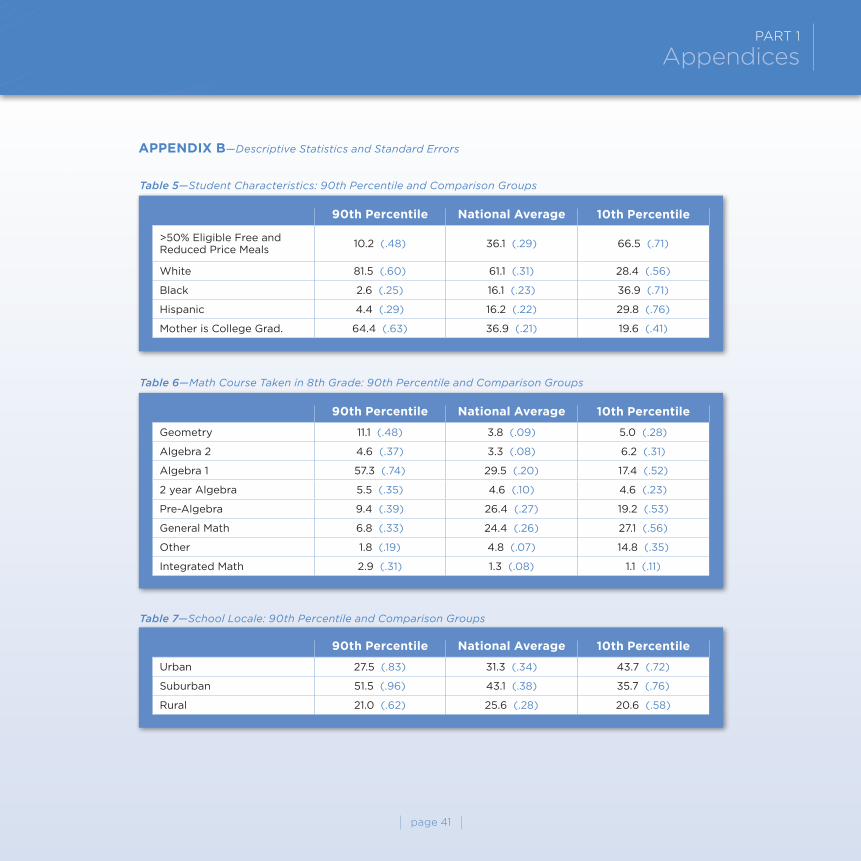
page 41
APPENDix B—Descriptive Statistics and Standard Errors
90th Percentile National Average 10th Percentile
>50% Eligible Free and Reduced Price Meals
10.2 (.48) 36.1 (.29) 66.5 (.71)
White 81.5 (.60) 61.1 (.31) 28.4 (.56)
Black 2.6 (.25) 16.1 (.23) 36.9 (.71)
Hispanic 4.4 (.29) 16.2 (.22) 29.8 (.76)
Mother is College Grad. 64.4 (.63) 36.9 (.21) 19.6 (.41)
Table 5—Student Characteristics: 90th Percentile and Comparison Groups
90th Percentile National Average 10th Percentile
Geometry 11.1 (.48) 3.8 (.09) 5.0 (.28)
Algebra 2 4.6 (.37) 3.3 (.08) 6.2 (.31)
Algebra 1 57.3 (.74) 29.5 (.20) 17.4 (.52)
2 year Algebra 5.5 (.35) 4.6 (.10) 4.6 (.23)
Pre-Algebra 9.4 (.39) 26.4 (.27) 19.2 (.53)
General Math 6.8 (.33) 24.4 (.26) 27.1 (.56)
Other 1.8 (.19) 4.8 (.07) 14.8 (.35)
Integrated Math 2.9 (.31) 1.3 (.08) 1.1 (.11)
Table 6—Math Course Taken in 8th Grade: 90th Percentile and Comparison Groups
90th Percentile National Average 10th Percentile
Urban 27.5 (.83) 31.3 (.34) 43.7 (.72)
Suburban 51.5 (.96) 43.1 (.38) 35.7 (.76)
Rural 21.0 (.62) 25.6 (.28) 20.6 (.58)
Table 7—School Locale: 90th Percentile and Comparison Groups
PArT 1 Appendices
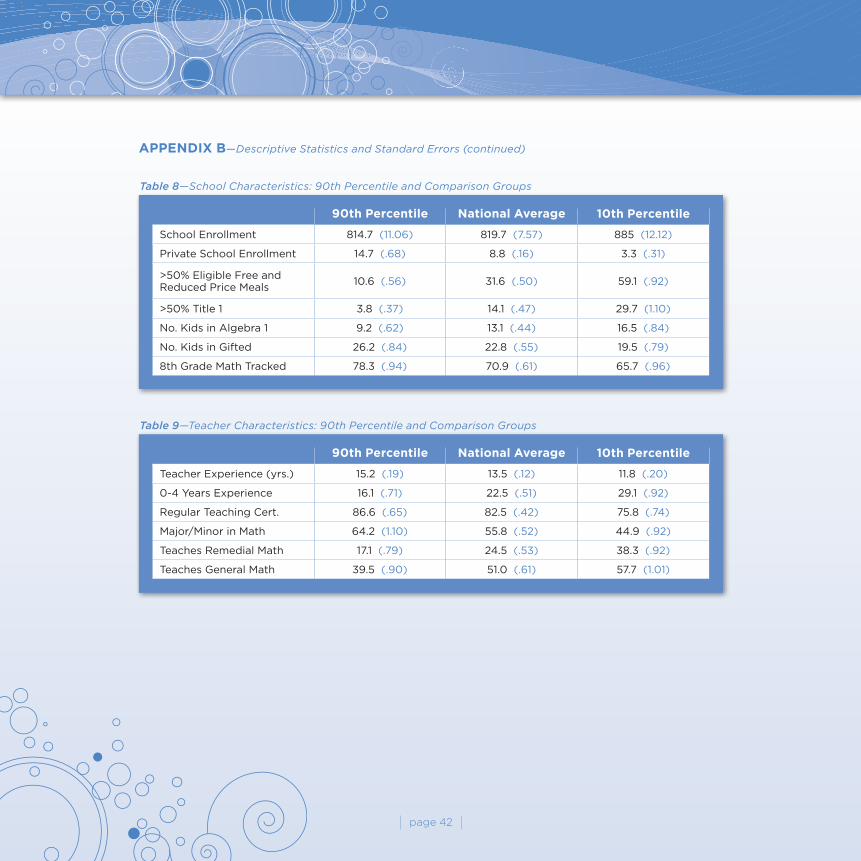
page 42
APPENDix B—Descriptive Statistics and Standard Errors (continued)
90th Percentile National Average 10th Percentile
School Enrollment 814.7 (11.06) 819.7 (7.57) 885 (12.12)
Private School Enrollment 14.7 (.68) 8.8 (.16) 3.3 (.31)
>50% Eligible Free and Reduced Price Meals
10.6 (.56) 31.6 (.50) 59.1 (.92)
>50% Title 1 3.8 (.37) 14.1 (.47) 29.7 (1.10)
No. Kids in Algebra 1 9.2 (.62) 13.1 (.44) 16.5 (.84)
No. Kids in Gifted 26.2 (.84) 22.8 (.55) 19.5 (.79)
8th Grade Math Tracked 78.3 (.94) 70.9 (.61) 65.7 (.96)
Table 8—School Characteristics: 90th Percentile and Comparison Groups
90th Percentile National Average 10th Percentile
Teacher Experience (yrs.) 15.2 (.19) 13.5 (.12) 11.8 (.20)
0-4 Years Experience 16.1 (.71) 22.5 (.51) 29.1 (.92)
Regular Teaching Cert. 86.6 (.65) 82.5 (.42) 75.8 (.74)
Major/Minor in Math 64.2 (1.10) 55.8 (.52) 44.9 (.92)
Teaches Remedial Math 17.1 (.79) 24.5 (.53) 38.3 (.92)
Teaches General Math 39.5 (.90) 51.0 (.61) 57.7 (1.01)
Table 9—Teacher Characteristics: 90th Percentile and Comparison Groups

page 43
APPENDix B—Descriptive Statistics and Standard Errors (continued)
90th PercentileNcLB-HA National Average 10th Percentile
>50% Eligible Free and Reduced Price Meals
70.5 (1.52) 10.2 (.48) 36.1 (.29) 66.5 (.71)
White 39.6 (1.76) 81.5 (.60) 61.1 (.31) 28.4 (.56)
Black 17.8 (1.36) 2.6 (.25) 16.1 (.23) 36.9 (.71)
Hispanic 30.5 (1.51) 4.4 (.29) 16.2 (.22) 29.8 (.76)
Mother is College Grad. 41.1 (2.04) 64.4 (.63) 36.9 (.21) 19.6 (.41)
Table 10—Student Characteristics: NCLB-HA and Comparison Groups
90th PercentileNcLB-HA National Average 10th Percentile
Geometry 8.6 (.83) 11.1 (.48) 3.8 (.09) 5.0 (.28)
Algebra 2 3.9 (.70) 4.6 (.37) 3.3 (.08) 6.2 (.31)
Algebra 1 51.7 (1.67) 57.3 (.74) 29.5 (.20) 17.4 (.52)
2-year Algebra 5.6 (.90) 5.5 (.35) 4.6 (.10) 4.6 (.23)
Pre-Algebra 13.1 (1.41) 9.4 (.39) 26.4 (.27) 19.2 (.53)
General Math 10.8 (1.19) 6.8 (.33) 24.4 (.26) 27.1 (.56)
Other 2.5 (.57) 1.8 (.19) 4.8 (.07) 14.8 (.35)
Integrated Math 2.9 (.58) 2.9 (.31) 1.3 (.08) 1.1 (.11)
Table 11—Math Course Taken in 8th Grade: NCLB-HA and Comparison Groups
90th PercentileNcLB-HA National Average 10th Percentile
Urban 39.0 (1.91) 27.5 (.83) 31.3 (.34) 43.7 (.72)
Suburban 40.2 (1.85) 51.5 (.96) 43.1 (.38) 35.7 (.76)
Rural 20.9 (1.30) 21.0 (.62) 25.6 (.28) 20.6 (.58)
Table 12—School Locale: NCLB-HA and Comparison Groups
PArT 1 Appendices
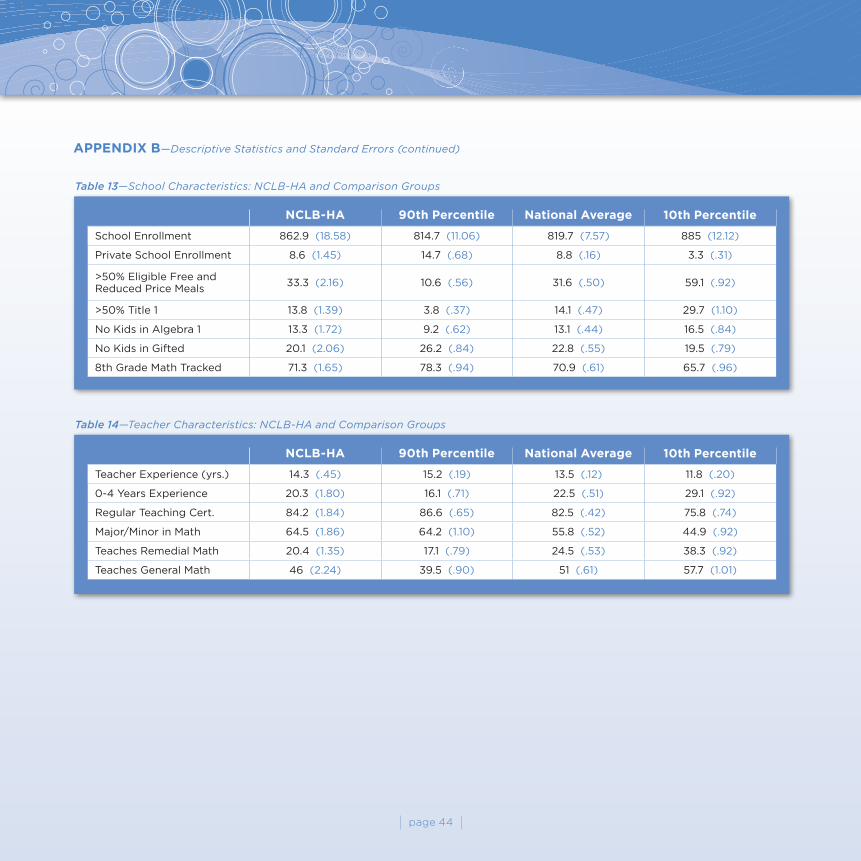
page 44
APPENDix B—Descriptive Statistics and Standard Errors (continued)
90th PercentileNcLB-HA National Average 10th Percentile
School Enrollment 862.9 (18.58) 814.7 (11.06) 819.7 (7.57) 885 (12.12)
Private School Enrollment 8.6 (1.45) 14.7 (.68) 8.8 (.16) 3.3 (.31)
>50% Eligible Free and Reduced Price Meals
33.3 (2.16) 10.6 (.56) 31.6 (.50) 59.1 (.92)
>50% Title 1 13.8 (1.39) 3.8 (.37) 14.1 (.47) 29.7 (1.10)
No Kids in Algebra 1 13.3 (1.72) 9.2 (.62) 13.1 (.44) 16.5 (.84)
No Kids in Gifted 20.1 (2.06) 26.2 (.84) 22.8 (.55) 19.5 (.79)
8th Grade Math Tracked 71.3 (1.65) 78.3 (.94) 70.9 (.61) 65.7 (.96)
Table 13—School Characteristics: NCLB-HA and Comparison Groups
90th PercentileNcLB-HA National Average 10th Percentile
Teacher Experience (yrs.) 14.3 (.45) 15.2 (.19) 13.5 (.12) 11.8 (.20)
0-4 Years Experience 20.3 (1.80) 16.1 (.71) 22.5 (.51) 29.1 (.92)
Regular Teaching Cert. 84.2 (1.84) 86.6 (.65) 82.5 (.42) 75.8 (.74)
Major/Minor in Math 64.5 (1.86) 64.2 (1.10) 55.8 (.52) 44.9 (.92)
Teaches Remedial Math 20.4 (1.35) 17.1 (.79) 24.5 (.53) 38.3 (.92)
Teaches General Math 46 (2.24) 39.5 (.90) 51 (.61) 57.7 (1.01)
Table 14—Teacher Characteristics: NCLB-HA and Comparison Groups
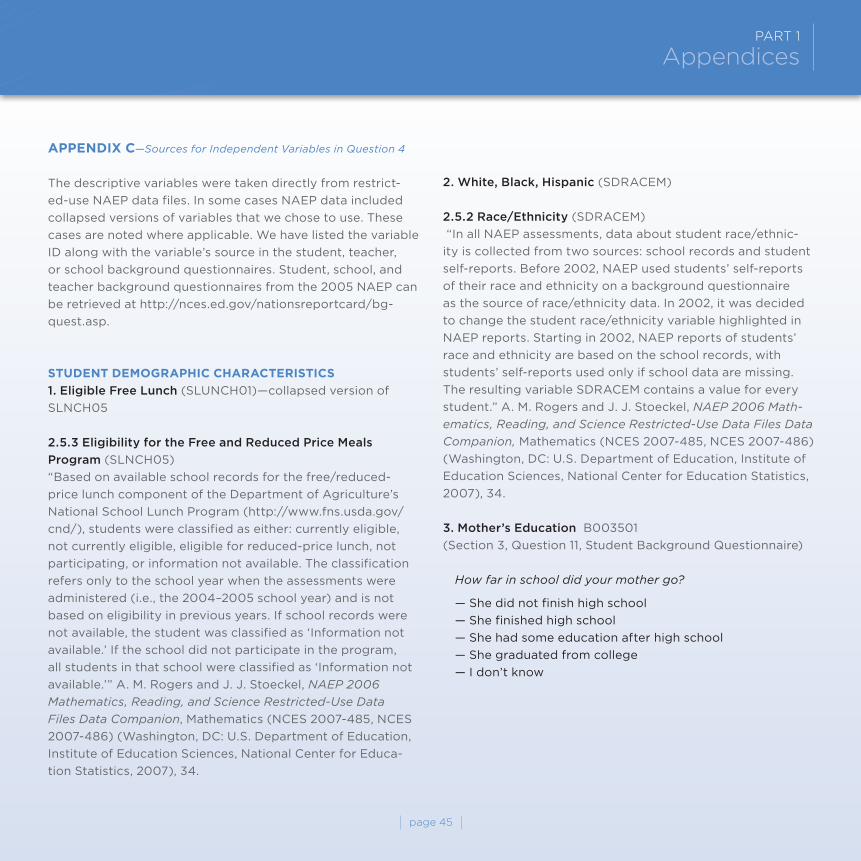
page 45
APPENDix c—Sources for Independent Variables in Question 4
The descriptive variables were taken directly from restrict-
ed-use NAEP data files. In some cases NAEP data included
collapsed versions of variables that we chose to use. These
cases are noted where applicable. We have listed the variable
ID along with the variable’s source in the student, teacher,
or school background questionnaires. Student, school, and
teacher background questionnaires from the 2005 NAEP can
be retrieved at http://nces.ed.gov/nationsreportcard/bg-
quest.asp.
STuDENT DEmOGRAPHic cHARAcTERiSTicS
1. Eligible Free Lunch (SLUNCH01)—collapsed version of
SLNCH05
2.5.3 Eligibility for the Free and Reduced Price Meals
Program (SLNCH05)
“Based on available school records for the free/reduced-
price lunch component of the Department of Agriculture’s
National School Lunch Program (http://www.fns.usda.gov/
cnd/), students were classified as either: currently eligible,
not currently eligible, eligible for reduced-price lunch, not
participating, or information not available. The classification
refers only to the school year when the assessments were
administered (i.e., the 2004–2005 school year) and is not
based on eligibility in previous years. If school records were
not available, the student was classified as ‘Information not
available.’ If the school did not participate in the program,
all students in that school were classified as ‘Information not
available.’” A. M. Rogers and J. J. Stoeckel, NAEP 2006
Mathematics, Reading, and Science Restricted-Use Data
Files Data Companion, Mathematics (NCES 2007-485, NCES
2007-486) (Washington, DC: U.S. Department of Education,
Institute of Education Sciences, National Center for Educa-
tion Statistics, 2007), 34.
2. White, Black, Hispanic (SDRACEM)
2.5.2 Race/Ethnicity (SDRACEM)
“In all NAEP assessments, data about student race/ethnic-
ity is collected from two sources: school records and student
self-reports. Before 2002, NAEP used students’ self-reports
of their race and ethnicity on a background questionnaire
as the source of race/ethnicity data. In 2002, it was decided
to change the student race/ethnicity variable highlighted in
NAEP reports. Starting in 2002, NAEP reports of students’
race and ethnicity are based on the school records, with
students’ self-reports used only if school data are missing.
The resulting variable SDRACEM contains a value for every
student.” A. M. Rogers and J. J. Stoeckel, NAEP 2006 Math-
ematics, Reading, and Science Restricted-Use Data Files Data
Companion, Mathematics (NCES 2007-485, NCES 2007-486)
(Washington, DC: U.S. Department of Education, Institute of
Education Sciences, National Center for Education Statistics,
2007), 34.
3. Mother’s Education B003501
(Section 3, Question 11, Student Background Questionnaire)
How far in school did your mother go?
— She did not finish high school
— She finished high school
— She had some education after high school
— She graduated from college
— I don’t know
PArT 1 Appendices

page 46
4. Courses Taken by the 90th Percentile at 8th Grade
M815701 (Section 4, Question 1, Student Background
Questionnaire)
What math class are you taking this year?
— Geometry
— Algebra II
— Algebra I (one-year course)
— First year of a two-year Algebra I course
— Second year of a two-year Algebra I course
— Introduction to algebra or pre-algebra
— Basic or general eighth-grade math
— Integrated or sequential math
— Other math class
5. School Locale TOL3
The National Center for Education Statistics (NCES) merged
several locale variables from the Common Core of Data with
the school-level NAEP variables. We used the three-level
variable, TOL3, that collapses locale into urban, suburban,
and rural.
ScHOOL cHARAcTERiSTicS
6. School Enrollment C038101
(Part 1, Question 5, School Background Questionnaire)
What is the current enrollment of your school?
7. Private School Enrollment SCHTYP2
(collapsed version of Question 7 in Part 1, School Background
Questionnaire)
What type of school is this? Fill in ovals for all that apply.
— Regular middle or secondary school
— A regular school with a magnet program
— A magnet school or a school with a special program
emphasis, e.g., science/math school, performing arts
school, talented/gifted school, foreign language
immersion school, etc.
— Special education: a school that primarily serves students
with disabilities
— Alternative: a school that offers a curriculum designed
to provide alternative or nontraditional education, not
clearly categorized as regular, special education, or
vocational
— Private (independent)
— Private (religiously affiliated)
— Charter school
— Privately run public school
— Other
8. >50% Eligible Free and Reduced Price Meals C051601
(Part 1, Question 11, School Background Questionnaire)
During this school year, about what percentage of
students in your school was eligible to receive a free
or reduced-price lunch through the National School
Lunch Program?
0% 11–25% 51–75%
1–5% 26–34% 76-99%
6–10% 35–50% 100%
9. >50% Eligible Title 1 C051801
(Part 1, Question 13, School Background Questionnaire)
Approximately what percentage of students in your school
receives the following services? Fill in one oval on each line.
Students who receive more than one service should be
counted for each service they receive. Please report the
percentage of students who receive each of the following
services as of the day you respond to this questionnaire.
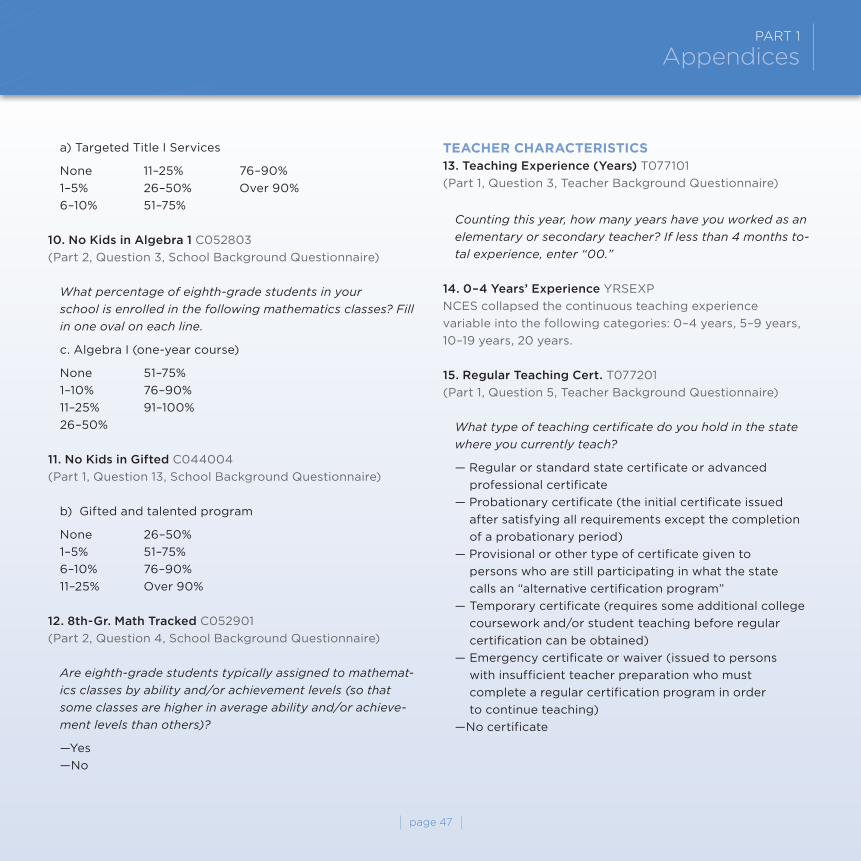
page 47
a) Targeted Title I Services
None 11–25% 76–90%
1–5% 26–50% Over 90%
6–10% 51–75%
10. No Kids in Algebra 1 C052803
(Part 2, Question 3, School Background Questionnaire)
What percentage of eighth-grade students in your
school is enrolled in the following mathematics classes? Fill
in one oval on each line.
c. Algebra I (one-year course)
None 51–75%
1–10% 76–90%
11–25% 91–100%
26–50%
11. No Kids in Gifted C044004
(Part 1, Question 13, School Background Questionnaire)
b) Gifted and talented program
None 26–50%
1–5% 51–75%
6–10% 76–90%
11–25% Over 90%
12. 8th-Gr. Math Tracked C052901
(Part 2, Question 4, School Background Questionnaire)
Are eighth-grade students typically assigned to mathemat-
ics classes by ability and/or achievement levels (so that
some classes are higher in average ability and/or achieve-
ment levels than others)?
—Yes
—No
TEAcHER cHARAcTERiSTicS 13. Teaching Experience (Years) T077101
(Part 1, Question 3, Teacher Background Questionnaire)
Counting this year, how many years have you worked as an
elementary or secondary teacher? If less than 4 months to-
tal experience, enter “00.”
14. 0–4 Years’ Experience YRSEXP
NCES collapsed the continuous teaching experience
variable into the following categories: 0–4 years, 5–9 years,
10–19 years, 20 years.
15. Regular Teaching Cert. T077201
(Part 1, Question 5, Teacher Background Questionnaire)
What type of teaching certificate do you hold in the state
where you currently teach?
— Regular or standard state certificate or advanced
professional certificate
— Probationary certificate (the initial certificate issued
after satisfying all requirements except the completion
of a probationary period)
— Provisional or other type of certificate given to
persons who are still participating in what the state
calls an “alternative certification program”
— Temporary certificate (requires some additional college
coursework and/or student teaching before regular
certification can be obtained)
— Emergency certificate or waiver (issued to persons
with insufficient teacher preparation who must
complete a regular certification program in order
to continue teaching)
—No certificate
PArT 1 Appendices
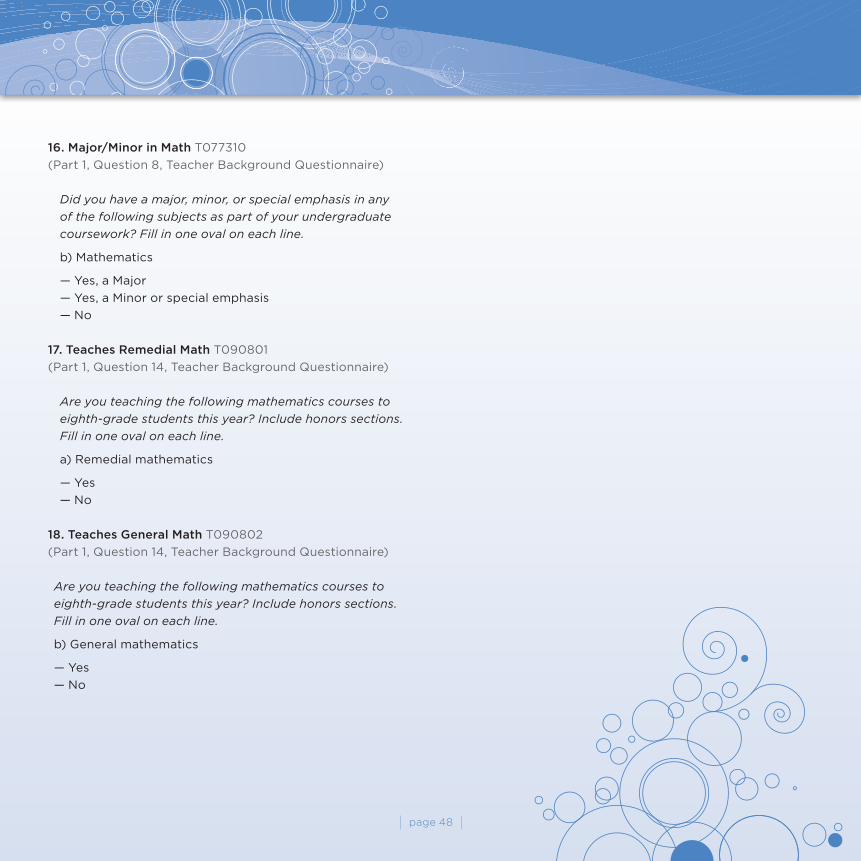
page 48
16. Major/Minor in Math T077310
(Part 1, Question 8, Teacher Background Questionnaire)
Did you have a major, minor, or special emphasis in any
of the following subjects as part of your undergraduate
coursework? Fill in one oval on each line.
b) Mathematics
— Yes, a Major
— Yes, a Minor or special emphasis
— No
17. Teaches Remedial Math T090801
(Part 1, Question 14, Teacher Background Questionnaire)
Are you teaching the following mathematics courses to
eighth-grade students this year? Include honors sections.
Fill in one oval on each line.
a) Remedial mathematics
— Yes
— No
18. Teaches General Math T090802
(Part 1, Question 14, Teacher Background Questionnaire)
Are you teaching the following mathematics courses to
eighth-grade students this year? Include honors sections.
Fill in one oval on each line.
b) General mathematics
— Yes
— No

page 49page 49
reSuLTS from A nATionAL TeACHer Survey STEVE FARKAS AND ANN DUFFETT
PART 2

page 50
Standards-based education reform in general and the No Child
Left Behind Act in particular make it no longer possible—either
in America’s inner cities or in its affluent suburbs—for public
schools to overlook entire groups of students whose education
is not succeeding. Similarly, because of the Individuals with
Disabilities Education Act, schools are required to address
the needs of youngsters with physical disabilities or special
learning needs; it is no longer possible to neglect these
children, either. Nowadays, public school systems must also
grapple with how best to educate immigrant children who do
not speak English—avoidance is a hard strategy to justify. The
resulting educational approaches and policies that schools
have adopted may be tangled and confused; they may not be
working as they should. But the public schools are constantly
challenged by circumstances to live up to their own proclaimed
ideals. And they challenge themselves, too.
In the findings from a national teacher survey on how well
schools serve high-achieving students, public school teachers
do some challenging of their own; they challenge both
themselves and America’s current education policy priorities.
They point to a segment of the pupil population they believe
is being overlooked: students with unusual intellectual talent
and higher levels of academic achievement. Teachers believe
that these youngsters deserve more classroom attention and
conscious effort than they now get, and they have their own
explanations for why academically advanced students are
being neglected. Teachers also have recommendations to
make, some of which fly in the face of conventional education
wisdom and contradict prevailing practices.
Teachers want these advanced (some say “gifted” or “gifted
and talented”) students to move up the list of education
priorities because educating them properly is the right
thing to do and because it’s good for the nation, but mostly
because they see in their own classrooms youngsters whose
considerable talents are not adequately challenged or fully
utilized.
TERmiNOLOGy Throughout this report, we interchangeably use such terms
as “academically advanced,” “talented,” and “high-achieving”;
they do not refer to specific programs, nor are they based on
achievement data. We have deliberately avoided the use of the
terms “gifted” and “gifted and talented,” which refer to actual
programs, except where we are referring to those programs.
The survey questionnaire relied on the term “academically
advanced” because prior focus groups indicated this was
consistently most comfortable for teachers to use.
iNTRODucTiON
The great historian Arthur M. Schlesinger, Jr., once wrote that “a basic theme of American history
has been the movement, uneven but steady, from exclusion to inclusion”—a movement “fueled by
egalitarian political principles . . . that constantly goad Americans to live up to their own proclaimed
ideals.”1 He might well have been talking about America’s public education system. The nation
keeps discovering segments of its pupil population that have been overlooked or neglected—and
then tries to do something about it.
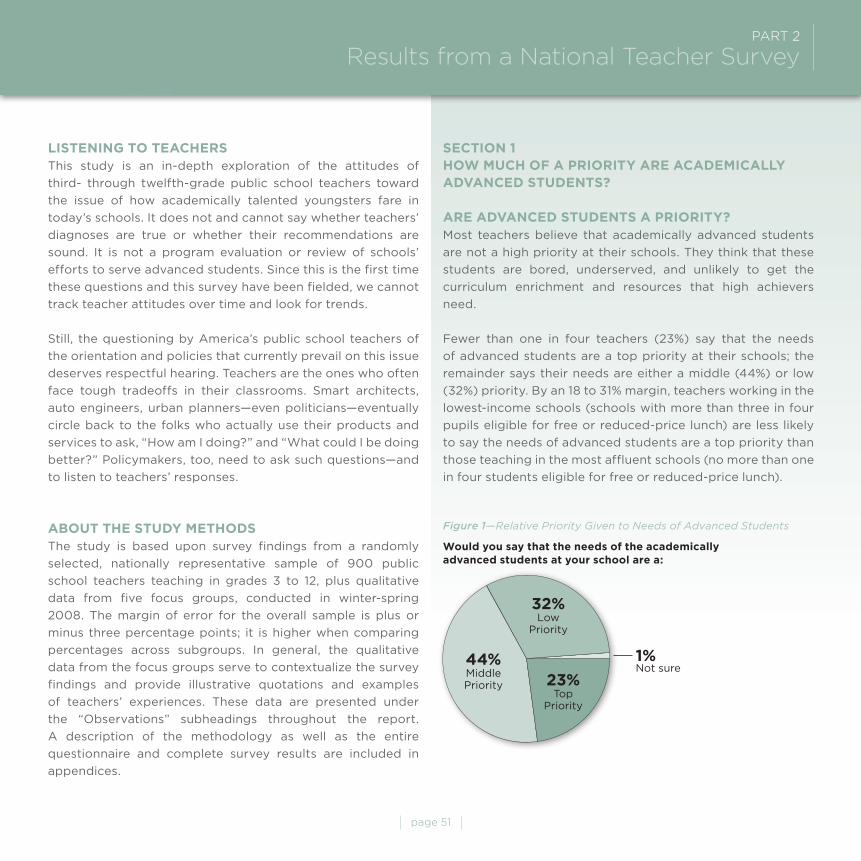
page 51
PArT 2 results from a national Teacher Survey
LiSTENiNG TO TEAcHERS
This study is an in-depth exploration of the attitudes of
third- through twelfth-grade public school teachers toward
the issue of how academically talented youngsters fare in
today’s schools. It does not and cannot say whether teachers’
diagnoses are true or whether their recommendations are
sound. It is not a program evaluation or review of schools’
efforts to serve advanced students. Since this is the first time
these questions and this survey have been fielded, we cannot
track teacher attitudes over time and look for trends.
Still, the questioning by America’s public school teachers of
the orientation and policies that currently prevail on this issue
deserves respectful hearing. Teachers are the ones who often
face tough tradeoffs in their classrooms. Smart architects,
auto engineers, urban planners—even politicians—eventually
circle back to the folks who actually use their products and
services to ask, “How am I doing?” and “What could I be doing
better?” Policymakers, too, need to ask such questions—and
to listen to teachers’ responses.
ABOuT THE STuDy mETHODSThe study is based upon survey findings from a randomly
selected, nationally representative sample of 900 public
school teachers teaching in grades 3 to 12, plus qualitative
data from five focus groups, conducted in winter-spring
2008. The margin of error for the overall sample is plus or
minus three percentage points; it is higher when comparing
percentages across subgroups. In general, the qualitative
data from the focus groups serve to contextualize the survey
findings and provide illustrative quotations and examples
of teachers’ experiences. These data are presented under
the “Observations” subheadings throughout the report.
A description of the methodology as well as the entire
questionnaire and complete survey results are included in
appendices.
SEcTiON 1HOW mucH OF A PRiORiTy ARE AcADEmicALLy ADvANcED STuDENTS?
ARE ADvANcED STuDENTS A PRiORiTy?Most teachers believe that academically advanced students
are not a high priority at their schools. They think that these
students are bored, underserved, and unlikely to get the
curriculum enrichment and resources that high achievers
need.
Fewer than one in four teachers (23%) say that the needs
of advanced students are a top priority at their schools; the
remainder says their needs are either a middle (44%) or low
(32%) priority. By an 18 to 31% margin, teachers working in the
lowest-income schools (schools with more than three in four
pupils eligible for free or reduced-price lunch) are less likely
to say the needs of advanced students are a top priority than
those teaching in the most affluent schools (no more than one
in four students eligible for free or reduced-price lunch).
Figure 1—Relative Priority Given to Needs of Advanced Students
Would you say that the needs of the academically advanced students at your school are a:
44%Middle Priority 23%
TopPriority
32%Low
Priority
1% Not sure

page 52
More than seven in ten teachers (73%) agree that “too often,
the brightest students are bored and under-challenged in
school—we’re not giving them a sufficient chance to thrive.”
The same majority of teachers (73%) agrees that electives,
humanities, and the arts “are getting short shrift because
schools are putting so much focus on the basics.”
OBSERvATiONSIn the focus groups, it was not unusual to detect a sense of
guilt among teachers about the fate of students with extra
talent. To hear teachers tell it, their schools are sometimes at
a loss about what to do with advanced students; they lack a
strategic plan or creative ideas. And teachers feel bad when
they see talent going to waste.
“I feel like sometimes we’re cheating them. Cheating
them out of their own personal glory . . . They could be
so much more magnificent in their own right and happier,
because I think they feel a level of frustration when they
have to sit by while we’re babysitting.”
“I don’t think enough is done for them. They do get lost in
the classroom, especially if you have very low-performing
students or if you have behavior issues. You’re over here.
Meanwhile, they’re done, and they’re patiently waiting.”
“It does seem that the resources, when we do get them
for the higher achieving, are always geared toward things
like day trips to places…. The problem is that when we do
get funds for the gifted students, it’s always, ‘Take them
to the science museum.’”
Figure 2—Top Priority for Advanced Students, by School Poverty Status
Note: Lowest-income schools > 75% students eligible for free/reduced-price lunch; most affluent schools ≤25% students eligible for free/reduced-price lunch.
Percentage of teachers who say academically advanced students at their
school are a top priority:
50%
40%
30%
20%
10%
0%
18%
31%Lowest-Income Schools
(n=188)
Most Affluent Schools (n=250)
Figure 3—Shortchanging of Students and Subjects
Percentage of teachers who agree:
0% 20% 40% 60% 80% 100%
Too often, the brightest students are bored and under-challenged in school—we’re not giving them a sufficient chance to thrive
Electives, humanities and the arts are getting short shrift because schools are putting so much focus on the basics
26%73% Total
73% Total38%
48%
35%
Strongly Agree Somewhat Agree
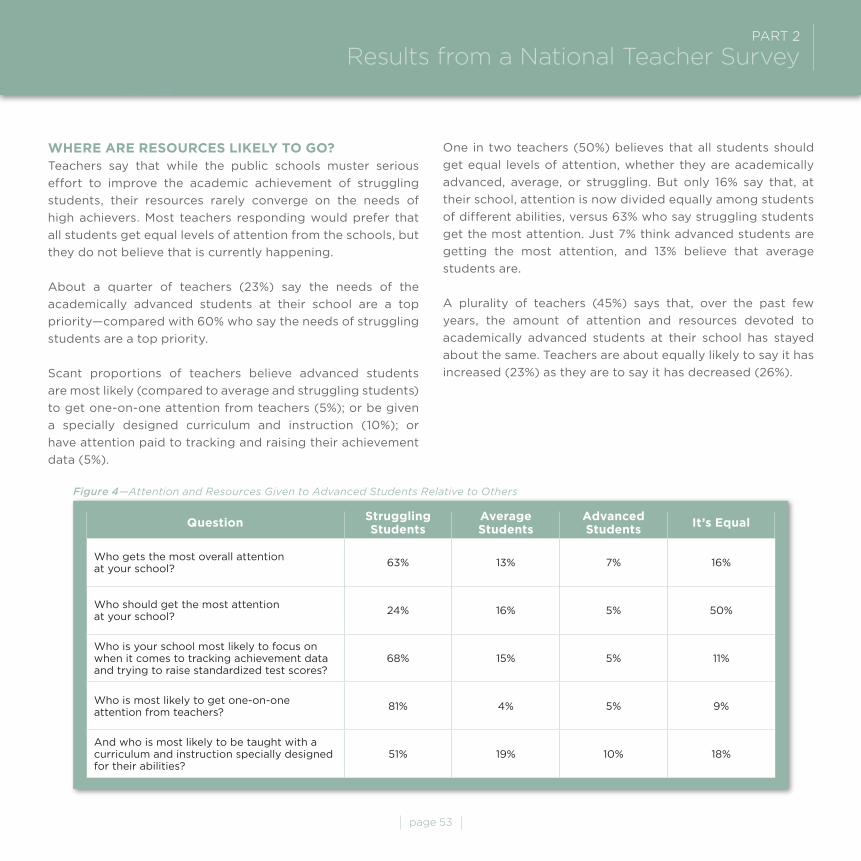
page 53
PArT 2 results from a national Teacher Survey
WHERE ARE RESOuRcES LikELy TO GO?Teachers say that while the public schools muster serious
effort to improve the academic achievement of struggling
students, their resources rarely converge on the needs of
high achievers. Most teachers responding would prefer that
all students get equal levels of attention from the schools, but
they do not believe that is currently happening.
About a quarter of teachers (23%) say the needs of the
academically advanced students at their school are a top
priority—compared with 60% who say the needs of struggling
students are a top priority.
Scant proportions of teachers believe advanced students
are most likely (compared to average and struggling students)
to get one-on-one attention from teachers (5%); or be given
a specially designed curriculum and instruction (10%); or
have attention paid to tracking and raising their achievement
data (5%).
One in two teachers (50%) believes that all students should
get equal levels of attention, whether they are academically
advanced, average, or struggling. But only 16% say that, at
their school, attention is now divided equally among students
of different abilities, versus 63% who say struggling students
get the most attention. Just 7% think advanced students are
getting the most attention, and 13% believe that average
students are.
A plurality of teachers (45%) says that, over the past few
years, the amount of attention and resources devoted to
academically advanced students at their school has stayed
about the same. Teachers are about equally likely to say it has
increased (23%) as they are to say it has decreased (26%).
Figure 4—Attention and Resources Given to Advanced Students Relative to Others
StrugglingStudents
AverageStudents
AdvancedStudents
it’s Equalquestion
Who gets the most overall attention at your school?
63% 13% 7% 16%
Who should get the most attention at your school?
24% 16% 5% 50%
Who is your school most likely to focus on when it comes to tracking achievement data and trying to raise standardized test scores?
68% 15% 5% 11%
Who is most likely to get one-on-one attention from teachers?
81% 4% 5% 9%
And who is most likely to be taught with a curriculum and instruction specially designed for their abilities?
51% 19% 10% 18%
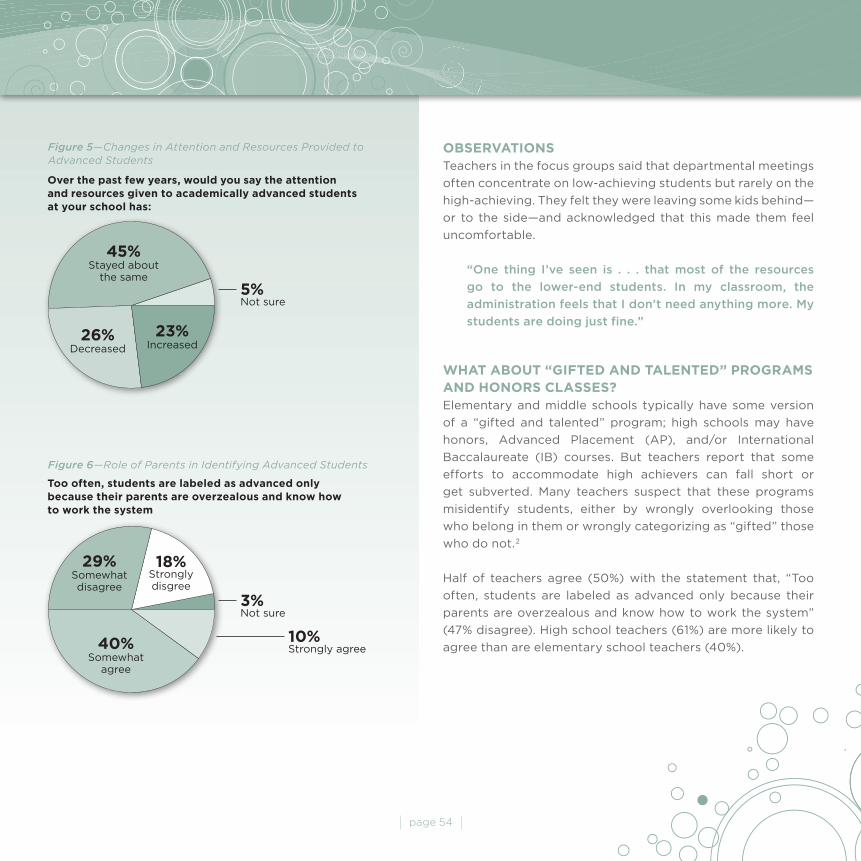
page 54
OBSERvATiONSTeachers in the focus groups said that departmental meetings
often concentrate on low-achieving students but rarely on the
high-achieving. They felt they were leaving some kids behind—
or to the side—and acknowledged that this made them feel
uncomfortable.
“One thing I’ve seen is . . . that most of the resources
go to the lower-end students. In my classroom, the
administration feels that I don’t need anything more. My
students are doing just fine.”
WHAT ABOuT “GiFTED AND TALENTED” PROGRAmS AND HONORS cLASSES?Elementary and middle schools typically have some version
of a “gifted and talented” program; high schools may have
honors, Advanced Placement (AP), and/or International
Baccalaureate (IB) courses. But teachers report that some
efforts to accommodate high achievers can fall short or
get subverted. Many teachers suspect that these programs
misidentify students, either by wrongly overlooking those
who belong in them or wrongly categorizing as “gifted” those
who do not.2
Half of teachers agree (50%) with the statement that, “Too
often, students are labeled as advanced only because their
parents are overzealous and know how to work the system”
(47% disagree). High school teachers (61%) are more likely to
agree than are elementary school teachers (40%).
Figure 5—Changes in Attention and Resources Provided to Advanced Students
Figure 6—Role of Parents in Identifying Advanced Students
Over the past few years, would you say the attention and resources given to academically advanced students at your school has:
Too often, students are labeled as advanced only because their parents are overzealous and know how to work the system
5% Not sure
45%Stayed about
the same
23%Increased
26%Decreased
3% Not sure
10% Strongly agree
18% Strongly disgree
40%Somewhat
agree
29%Somewhat disagree
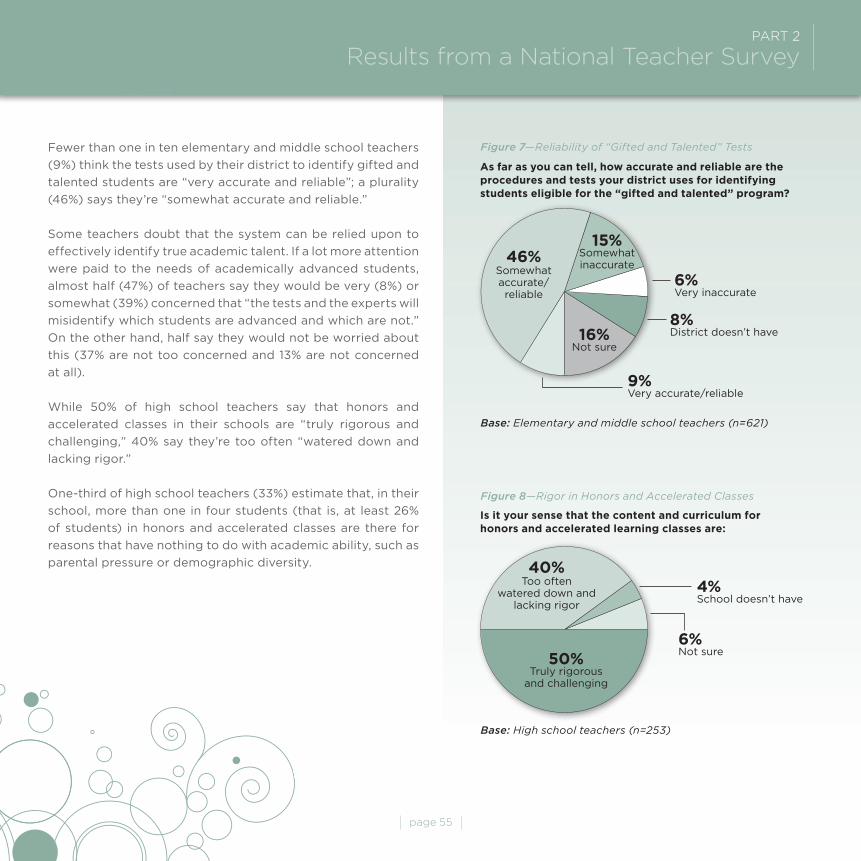
page 55
PArT 2 results from a national Teacher Survey
Fewer than one in ten elementary and middle school teachers
(9%) think the tests used by their district to identify gifted and
talented students are “very accurate and reliable”; a plurality
(46%) says they’re “somewhat accurate and reliable.”
Some teachers doubt that the system can be relied upon to
effectively identify true academic talent. If a lot more attention
were paid to the needs of academically advanced students,
almost half (47%) of teachers say they would be very (8%) or
somewhat (39%) concerned that “the tests and the experts will
misidentify which students are advanced and which are not.”
On the other hand, half say they would not be worried about
this (37% are not too concerned and 13% are not concerned
at all).
While 50% of high school teachers say that honors and
accelerated classes in their schools are “truly rigorous and
challenging,” 40% say they’re too often “watered down and
lacking rigor.”
One-third of high school teachers (33%) estimate that, in their
school, more than one in four students (that is, at least 26%
of students) in honors and accelerated classes are there for
reasons that have nothing to do with academic ability, such as
parental pressure or demographic diversity.
Figure 8—Rigor in Honors and Accelerated Classes
Base: High school teachers (n=253)
is it your sense that the content and curriculum for honors and accelerated learning classes are:
6% Not sure
4% School doesn’t have
50% Truly rigorous
and challenging
40%Too often
watered down and lacking rigor
Figure 7—Reliability of “Gifted and Talented” Tests
Base: Elementary and middle school teachers (n=621)
As far as you can tell, how accurate and reliable are the procedures and tests your district uses for identifying students eligible for the “gifted and talented” program?
6% Very inaccurate
8% District doesn’t have16%
Not sure
9% Very accurate/reliable
15% Somewhat inaccurate
46%Somewhataccurate/reliable

page 56
OBSERvATiONSIn the focus groups, high school teachers said parents
sometimes push unprepared kids into advanced classes to
beef up their college applications or to make sure they go
to class with better-behaved students. Several talked about
administrators anxious to enhance the school’s reputation in
the community by creating advanced classes—even if they
would have to populate those classes with academically
average students. Teachers in the lower grades complained
that many students funneled into the gifted and talented
program didn’t belong there. Meanwhile, some teachers talked
about overlooked students who deserve to be in advanced
classes but lack advocates.
“They call them honors classes or they call them AP
classes, but it’s sad. They’re not.”
“You have plenty of talented children, and you’ve got
language issues—because they don’t fill in that circle
correctly or they miss a word and they can’t get it
translated. It doesn’t translate correctly into what their
true abilities are.”
“We have what we call the true GATE [Gifted and Talented
Education] and then we have the GATE ‘wannabes.’ The
ones that may have gotten in just by test scores, but
had none of the skills or the classroom abilities to do
the studying, and just keep up with it, didn’t have the
motivation. We were forcing these kids to do things that
they didn’t really want to do.”
The portrait painted by teachers is not pretty: schools without
a real plan or thought-through strategy on how optimally to
serve advanced students; teachers who suspect—and often feel
guilty—that some of their students are getting shortchanged;
parents who sometimes get their way when they shouldn’t;
and advanced programs and classes that have lost their focus.
“There is no real gifted curriculum,” said one teacher. “It’s up
to the teacher to come up with it.”
If teachers depict a situation where academically talented
students are languishing in a system that has somehow settled
on a strategy of inattention, what’s their explanation for how
the system has gotten to this point?
SEcTiON 2TEAcHERS TALk ABOuT vALuES AND TRADEOFFSOne hypothesis going into this study was that public school
teachers might be carrying into their classrooms attitudes that
constrained the amount of attention they gave to advanced
students, such as the view that these youngsters already
have ample educational advantages. But in fact, teachers
believe that balance and equal investment in all students is
the right approach for schools. Few fear that pushing the best
and brightest students harder would hurt their emotional
development. Nor do they worry that giving them more
attention would damage the self-esteem of other students.
WHERE SHOuLD THE ScHOOLS DiREcT THEiR ATTENTiON?A commitment to fairness and equity is one reason teachers
think academically advanced students ought to get as much
attention as other students. Another is the belief that the nation
will need the talents of these students with strong academic
skills. Few accept the notion that these youngsters need less
attention because they are already academically ahead.
The answers to one survey question were particularly
telling: “For the public schools to help the U.S. live up to its
ideals of justice and equality,” the question asked, is it more
important that the schools “focus on raising the achievement
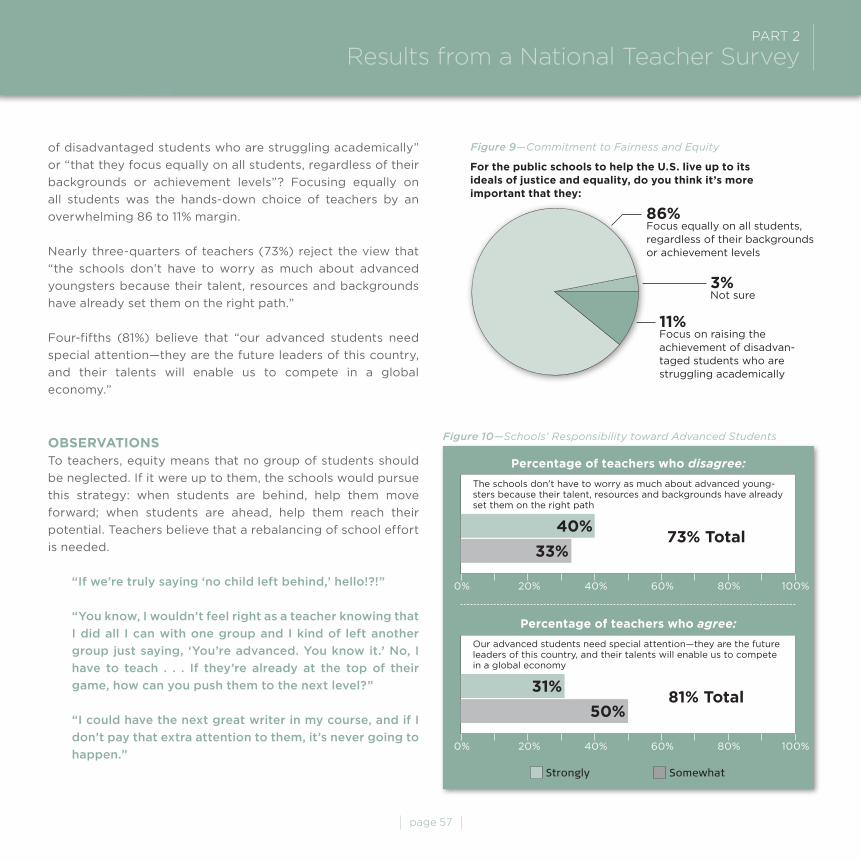
page 57
PArT 2 results from a national Teacher Survey
of disadvantaged students who are struggling academically”
or “that they focus equally on all students, regardless of their
backgrounds or achievement levels”? Focusing equally on
all students was the hands-down choice of teachers by an
overwhelming 86 to 11% margin.
Nearly three-quarters of teachers (73%) reject the view that
“the schools don’t have to worry as much about advanced
youngsters because their talent, resources and backgrounds
have already set them on the right path.”
Four-fifths (81%) believe that “our advanced students need
special attention—they are the future leaders of this country,
and their talents will enable us to compete in a global
economy.”
OBSERvATiONSTo teachers, equity means that no group of students should
be neglected. If it were up to them, the schools would pursue
this strategy: when students are behind, help them move
forward; when students are ahead, help them reach their
potential. Teachers believe that a rebalancing of school effort
is needed.
“If we’re truly saying ‘no child left behind,’ hello!?!”
“You know, I wouldn’t feel right as a teacher knowing that
I did all I can with one group and I kind of left another
group just saying, ‘You’re advanced. You know it.’ No, I
have to teach . . . If they’re already at the top of their
game, how can you push them to the next level?”
“I could have the next great writer in my course, and if I
don’t pay that extra attention to them, it’s never going to
happen.”
Figure 10—Schools’ Responsibility toward Advanced Students
0% 20% 40% 60% 80% 100%
Our advanced students need special attention—they are the future leaders of this country, and their talents will enable us to compete in a global economy
31%81% Total
Strongly Somewhat
50%
Figure 9—Commitment to Fairness and Equity
For the public schools to help the u.S. live up to its ideals of justice and equality, do you think it’s more important that they:
3% Not sure
11% Focus on raising the achievement of disadvan-taged students who are struggling academically
86% Focus equally on all students, regardless of their backgrounds or achievement levels
0% 20% 40% 60% 80% 100%
The schools don’t have to worry as much about advanced young-sters because their talent, resources and backgrounds have already set them on the right path
40%73% Total
33%
Percentage of teachers who disagree:
Percentage of teachers who agree:
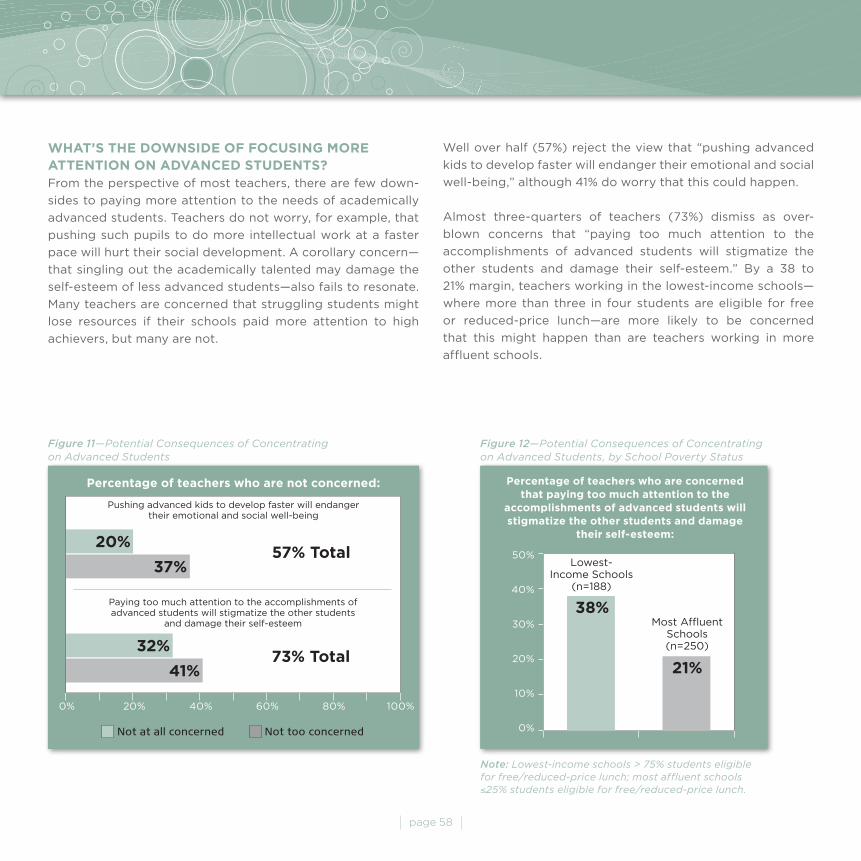
page 58
WHAT’S THE DOWNSiDE OF FOcuSiNG mORE ATTENTiON ON ADvANcED STuDENTS?From the perspective of most teachers, there are few down-
sides to paying more attention to the needs of academically
advanced students. Teachers do not worry, for example, that
pushing such pupils to do more intellectual work at a faster
pace will hurt their social development. A corollary concern—
that singling out the academically talented may damage the
self-esteem of less advanced students—also fails to resonate.
Many teachers are concerned that struggling students might
lose resources if their schools paid more attention to high
achievers, but many are not.
Well over half (57%) reject the view that “pushing advanced
kids to develop faster will endanger their emotional and social
well-being,” although 41% do worry that this could happen.
Almost three-quarters of teachers (73%) dismiss as over-
blown concerns that “paying too much attention to the
accomplishments of advanced students will stigmatize the
other students and damage their self-esteem.” By a 38 to
21% margin, teachers working in the lowest-income schools—
where more than three in four students are eligible for free
or reduced-price lunch—are more likely to be concerned
that this might happen than are teachers working in more
affluent schools.
Figure 12—Potential Consequences of Concentrating on Advanced Students, by School Poverty Status
Note: Lowest-income schools > 75% students eligible for free/reduced-price lunch; most affluent schools ≤25% students eligible for free/reduced-price lunch.
Percentage of teachers who are concerned that paying too much attention to the
accomplishments of advanced students will stigmatize the other students and damage
their self-esteem:
50%
40%
30%
20%
10%
0%
38%
21%
Lowest-Income Schools
(n=188)
Most Affluent Schools (n=250)
Figure 11—Potential Consequences of Concentrating on Advanced Students
0% 20% 40% 60% 80% 100%
Pushing advanced kids to develop faster will endanger their emotional and social well-being
20%57% Total
37%
Not at all concerned Not too concerned
Percentage of teachers who are not concerned:
Paying too much attention to the accomplishments of advanced students will stigmatize the other students
and damage their self-esteem
32%73% Total
41%
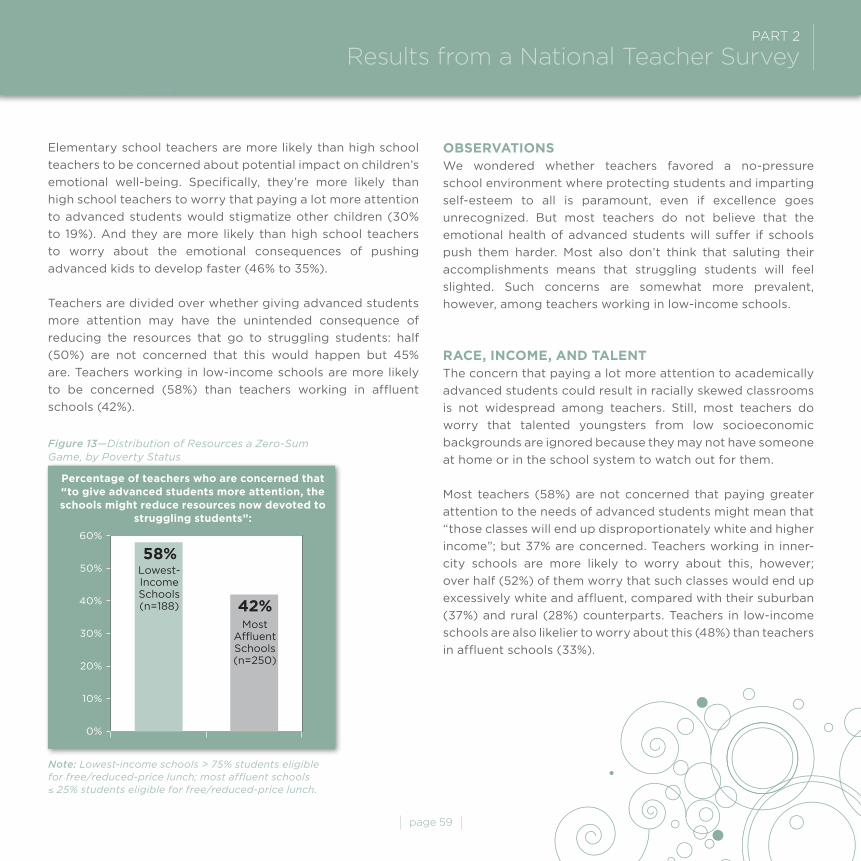
page 59
PArT 2 results from a national Teacher Survey
Elementary school teachers are more likely than high school
teachers to be concerned about potential impact on children’s
emotional well-being. Specifically, they’re more likely than
high school teachers to worry that paying a lot more attention
to advanced students would stigmatize other children (30%
to 19%). And they are more likely than high school teachers
to worry about the emotional consequences of pushing
advanced kids to develop faster (46% to 35%).
Teachers are divided over whether giving advanced students
more attention may have the unintended consequence of
reducing the resources that go to struggling students: half
(50%) are not concerned that this would happen but 45%
are. Teachers working in low-income schools are more likely
to be concerned (58%) than teachers working in affluent
schools (42%).
OBSERvATiONSWe wondered whether teachers favored a no-pressure
school environment where protecting students and imparting
self-esteem to all is paramount, even if excellence goes
unrecognized. But most teachers do not believe that the
emotional health of advanced students will suffer if schools
push them harder. Most also don’t think that saluting their
accomplishments means that struggling students will feel
slighted. Such concerns are somewhat more prevalent,
however, among teachers working in low-income schools.
RAcE, iNcOmE, AND TALENTThe concern that paying a lot more attention to academically
advanced students could result in racially skewed classrooms
is not widespread among teachers. Still, most teachers do
worry that talented youngsters from low socioeconomic
backgrounds are ignored because they may not have someone
at home or in the school system to watch out for them.
Most teachers (58%) are not concerned that paying greater
attention to the needs of advanced students might mean that
“those classes will end up disproportionately white and higher
income”; but 37% are concerned. Teachers working in inner-
city schools are more likely to worry about this, however;
over half (52%) of them worry that such classes would end up
excessively white and affluent, compared with their suburban
(37%) and rural (28%) counterparts. Teachers in low-income
schools are also likelier to worry about this (48%) than teachers
in affluent schools (33%).
Figure 13—Distribution of Resources a Zero-Sum Game, by Poverty Status
Note: Lowest-income schools > 75% students eligible for free/reduced-price lunch; most affluent schools ≤ 25% students eligible for free/reduced-price lunch.
Percentage of teachers who are concerned that “to give advanced students more attention, the schools might reduce resources now devoted to
struggling students”:
60%
50%
40%
30%
20%
10%
0%
58%
42%
Lowest-Income Schools (n=188)
Most Affluent Schools (n=250)

80%
70%
60%
50%
40%
30%
20%
10%
0%
page 60
There is a widely shared sense among teachers that
“academically talented youngsters from low socioeconomic
backgrounds are often overlooked—they fall through the
cracks because no one advocates for them,” with almost six in
ten teachers agreeing (59%), compared with 37% disagreeing.
Teachers working in low-income schools are even more likely
to agree (76%), compared with their counterparts in affluent
schools (52%).
OBSERvATiONSTeachers seem less worried about the political appearance
of academically advanced classes that are skewed by race
or ethnicity than about the possibility of low-income and
minority students falling through the cracks because their
parents might lack the know-how to promote their interests.
Teachers think the context of students’ lives matters most—if
youngsters come from families with low socioeconomic
backgrounds and are pigeonholed by the schools, it may be
more difficult for their talent to carry the day.
“They [school board members] feel that there’s not
enough minorities and poverty-level [students]. They pull
from other groups to put them in the honors classes, but
they’re watering it down. They have to water down the
curriculum. Again, it’s a political thing.”
Figure 14—Concern about Demographic Skew in Advanced Classes, by School Type and Poverty Status
Percentage of teachers who are concerned that the way the schools define “advanced students” means that those classes
will end up disproportionately white and higher income:
48%
Lowest-Income Schools (n=188)
52%
InnerCity
(n=103)37%
Sub-urban
(n=302)
28%
Rural (n=315)
33%
Most Affluent Schools (n=250)
Figure 15—Relative Concern about Neglect of Academically Talented Poor, by School Poverty Status
Note: Lowest-income schools > 75% students eligible for free/reduced-price lunch; most affluent schools ≤ 25% students eligible for free/reduced-price lunch.
Percentage of teachers who agree that academically talented youngsters from low socioeconomic
backgrounds are often overlooked—they fall through the cracks because no one advocates for them:
80%
70%
60%
50%
40%
30%
20%
10%
0%
76%
Lowest-Income Schools (n=188) 52%
Most Affluent Schools (n=250)
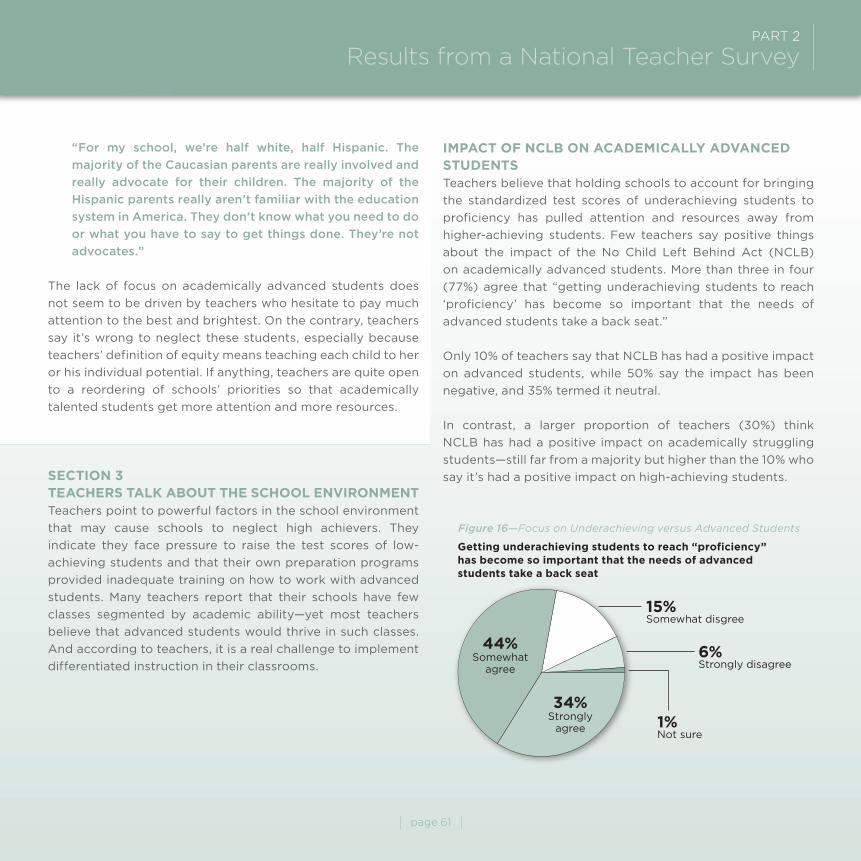
page 61
PArT 2 results from a national Teacher Survey
“For my school, we’re half white, half Hispanic. The
majority of the Caucasian parents are really involved and
really advocate for their children. The majority of the
Hispanic parents really aren’t familiar with the education
system in America. They don’t know what you need to do
or what you have to say to get things done. They’re not
advocates.”
The lack of focus on academically advanced students does
not seem to be driven by teachers who hesitate to pay much
attention to the best and brightest. On the contrary, teachers
say it’s wrong to neglect these students, especially because
teachers’ definition of equity means teaching each child to her
or his individual potential. If anything, teachers are quite open
to a reordering of schools’ priorities so that academically
talented students get more attention and more resources.
SEcTiON 3TEAcHERS TALk ABOuT THE ScHOOL ENviRONmENT
Teachers point to powerful factors in the school environment
that may cause schools to neglect high achievers. They
indicate they face pressure to raise the test scores of low-
achieving students and that their own preparation programs
provided inadequate training on how to work with advanced
students. Many teachers report that their schools have few
classes segmented by academic ability—yet most teachers
believe that advanced students would thrive in such classes.
And according to teachers, it is a real challenge to implement
differentiated instruction in their classrooms.
imPAcT OF NcLB ON AcADEmicALLy ADvANcED STuDENTSTeachers believe that holding schools to account for bringing
the standardized test scores of underachieving students to
proficiency has pulled attention and resources away from
higher-achieving students. Few teachers say positive things
about the impact of the No Child Left Behind Act (NCLB)
on academically advanced students. More than three in four
(77%) agree that “getting underachieving students to reach
‘proficiency’ has become so important that the needs of
advanced students take a back seat.”
Only 10% of teachers say that NCLB has had a positive impact
on advanced students, while 50% say the impact has been
negative, and 35% termed it neutral.
In contrast, a larger proportion of teachers (30%) think
NCLB has had a positive impact on academically struggling
students—still far from a majority but higher than the 10% who
say it’s had a positive impact on high-achieving students.
Figure 16—Focus on Underachieving versus Advanced Students
Getting underachieving students to reach “proficiency” has become so important that the needs of advanced students take a back seat
1% Not sure
6% Strongly disagree
15% Somewhat disgree
34%Strongly
agree
44%Somewhat
agree

page 62
OBSERvATiONSTeachers in the focus groups talked repeatedly about the
drive in their buildings to bring up the scores of so-called
“bubble kids”—students with standardized test scores just
below proficiency levels. In these conversations, teachers
often blamed the No Child Left Behind Act and the need to
make adequate yearly progress—for them, it was the clearest
embodiment of the negative impact of the trend toward high-
stakes testing.
“I went around asking teachers if they recommended
any of the students for the gifted programs. Nobody
has, because they’re so concerned with those low kids
and getting them to pass. That’s our concern. We’re not
even worrying about the high kids. They’re not being
identified.”
“I’m aware of their numbers. I know where they are. I
know who’s on the bubble and who I have to push up. We
have meetings. I’m on the leadership committee at the
school. We have meetings about, ‘Okay, who is only two
points away from meeting the [state] goal?’”
“At our school, we really broke it all down and we looked
at all the gainers and sliders, the kids who have gone up
over the last year, or have gone down. All the kids that
are what we called ‘on the bubble’—that’s where the last
two years, all of our focus has gone to those kids.”
TEAcHER TRAiNiNGTeachers report receiving little grounding on how to work with
academically advanced students. They say the preparation
programs they attended as well as the professional
development they got once they had their own classroom
were unlikely to emphasize this kind of training.
Nearly two-thirds (65%) report that their education courses or
teacher preparation programs focused either very little or not
at all on how to best teach academically advanced students.
Relatively few (34%) say there was a lot or some focus on this
subject in their programs.
Nearly six in ten (58%) say they have had no professional
development over the past few years that specifically focused
on teaching academically advanced students. Four in ten
(41%) report that they have.
Figure 17—Impact of NCLB on Advanced Students Relative to Others
Positive Negative NeutralGroup
What kind of effect would you say NcLB has had on the students at your school?
Academically struggling students 30% 46% 20%
Average students 15% 44% 38%
Academically advanced students 10% 50% 35%
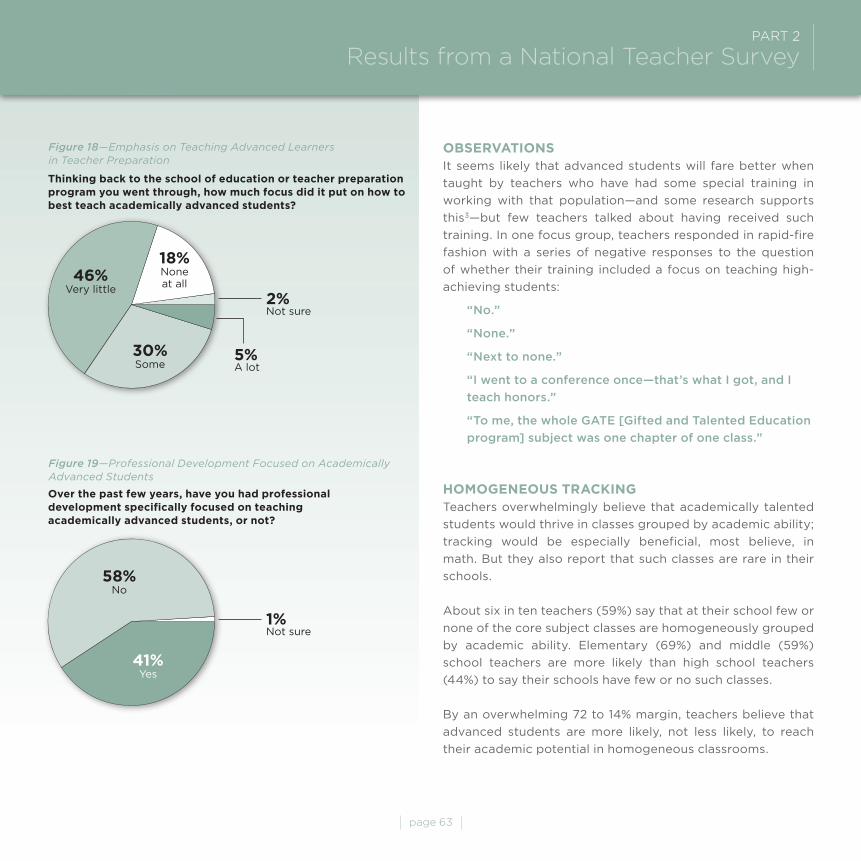
page 63
PArT 2 results from a national Teacher Survey
OBSERvATiONSIt seems likely that advanced students will fare better when
taught by teachers who have had some special training in
working with that population—and some research supports
this3—but few teachers talked about having received such
training. In one focus group, teachers responded in rapid-fire
fashion with a series of negative responses to the question
of whether their training included a focus on teaching high-
achieving students:
“No.”
“None.”
“Next to none.”
“I went to a conference once—that’s what I got, and I
teach honors.”
“To me, the whole GATE [Gifted and Talented Education
program] subject was one chapter of one class.”
HOmOGENEOuS TRAckiNGTeachers overwhelmingly believe that academically talented
students would thrive in classes grouped by academic ability;
tracking would be especially beneficial, most believe, in
math. But they also report that such classes are rare in their
schools.
About six in ten teachers (59%) say that at their school few or
none of the core subject classes are homogeneously grouped
by academic ability. Elementary (69%) and middle (59%)
school teachers are more likely than high school teachers
(44%) to say their schools have few or no such classes.
By an overwhelming 72 to 14% margin, teachers believe that
advanced students are more likely, not less likely, to reach
their academic potential in homogeneous classrooms.
Figure 18—Emphasis on Teaching Advanced Learners in Teacher Preparation
Thinking back to the school of education or teacher preparation program you went through, how much focus did it put on how to best teach academically advanced students?
5% A lot
2% Not sure
30%Some
46%Very little
18%Noneat all
1% Not sure
Figure 19—Professional Development Focused on Academically Advanced Students
Over the past few years, have you had professional development specifically focused on teaching academically advanced students, or not?
58% No
41% Yes

page 64
Figure 21—Likelihood of Reaching Academic Potential within Homogeneous Grouping
more Likely Less Likely Little DifferenceGroup
When classes are homogeneously grouped by academic ability, how likely do you think students are to reach their academic potential?
Academically struggling students 46% 36% 13%
Average students 50% 20% 28%
Academically advanced students 71% 14% 12%
Figure 20—Core Subject Classes—Extent of Homogeneous Grouping
About how many of the core subject classes at your school are homogeneously grouped by academic ability?
2% Not sure
6% All
35% A few
19% Some
15% Most
24% None
By a margin of 50 to 20%, teachers believe that even average
students are more likely, not less likely, to reach their academic
potential in such classrooms. The margin is far narrower when
teachers are talking about struggling students (46% to 36%).
Almost three in four teachers (74%) believe that “mathematics
is the one subject where students could really benefit from
homogeneous grouping.” Just 20% disagree. And when asked
to think about the consequences of having schools pay a
lot more attention to the needs of academically advanced
students, more than half of teachers (57%) expressed concern
that “there will be a big shortage of top-notch math and science
teachers who could teach advanced students at a very high
level,” versus 40% who said that they were not concerned.
OBSERvATiONSJudging by what teachers report, ability-grouped classes are
not widespread. On the one hand, the very word “tracking”
has taken on a negative connotation in education circles,
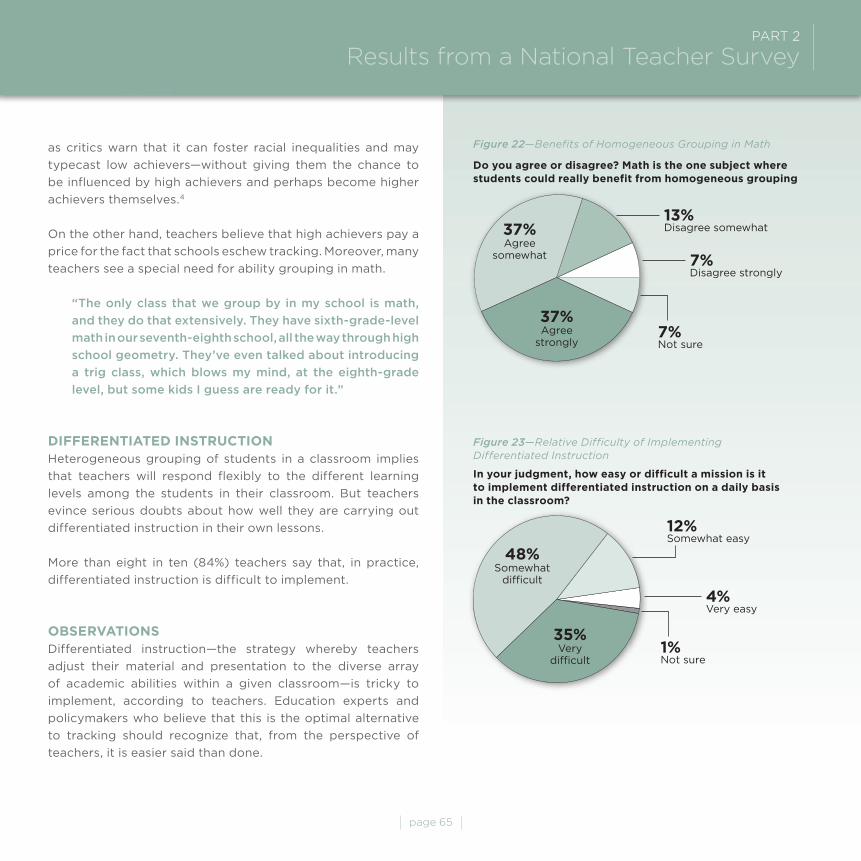
as critics warn that it can foster racial inequalities and may
typecast low achievers—without giving them the chance to
be influenced by high achievers and perhaps become higher
achievers themselves.4
On the other hand, teachers believe that high achievers pay a
price for the fact that schools eschew tracking. Moreover, many
teachers see a special need for ability grouping in math.
“The only class that we group by in my school is math,
and they do that extensively. They have sixth-grade-level
math in our seventh-eighth school, all the way through high
school geometry. They’ve even talked about introducing
a trig class, which blows my mind, at the eighth-grade
level, but some kids I guess are ready for it.”
DiFFERENTiATED iNSTRucTiONHeterogeneous grouping of students in a classroom implies
that teachers will respond flexibly to the different learning
levels among the students in their classroom. But teachers
evince serious doubts about how well they are carrying out
differentiated instruction in their own lessons.
More than eight in ten (84%) teachers say that, in practice,
differentiated instruction is difficult to implement.
OBSERvATiONSDifferentiated instruction—the strategy whereby teachers
adjust their material and presentation to the diverse array
of academic abilities within a given classroom—is tricky to
implement, according to teachers. Education experts and
policymakers who believe that this is the optimal alternative
to tracking should recognize that, from the perspective of
teachers, it is easier said than done.
page 65
PArT 2 results from a national Teacher Survey
Figure 22—Benefits of Homogeneous Grouping in Math
Do you agree or disagree? math is the one subject where students could really benefit from homogeneous grouping
7% Not sure
7% Disagree strongly
13% Disagree somewhat37%
Agreesomewhat
37%Agree
strongly
Figure 23—Relative Difficulty of Implementing Differentiated Instruction
in your judgment, how easy or difficult a mission is it to implement differentiated instruction on a daily basis in the classroom?
1% Not sure
4% Very easy
12% Somewhat easy
48%Somewhat
difficult
35%Very
difficult
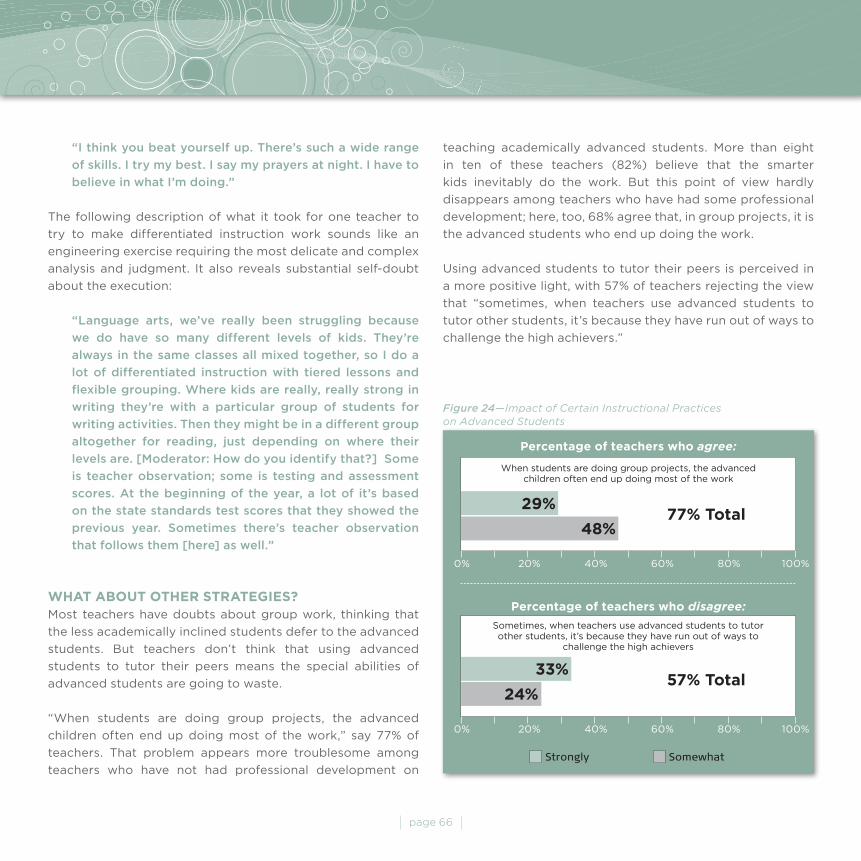
teaching academically advanced students. More than eight
in ten of these teachers (82%) believe that the smarter
kids inevitably do the work. But this point of view hardly
disappears among teachers who have had some professional
development; here, too, 68% agree that, in group projects, it is
the advanced students who end up doing the work.
Using advanced students to tutor their peers is perceived in
a more positive light, with 57% of teachers rejecting the view
that “sometimes, when teachers use advanced students to
tutor other students, it’s because they have run out of ways to
challenge the high achievers.”
“I think you beat yourself up. There’s such a wide range
of skills. I try my best. I say my prayers at night. I have to
believe in what I’m doing.”
The following description of what it took for one teacher to
try to make differentiated instruction work sounds like an
engineering exercise requiring the most delicate and complex
analysis and judgment. It also reveals substantial self-doubt
about the execution:
“Language arts, we’ve really been struggling because
we do have so many different levels of kids. They’re
always in the same classes all mixed together, so I do a
lot of differentiated instruction with tiered lessons and
flexible grouping. Where kids are really, really strong in
writing they’re with a particular group of students for
writing activities. Then they might be in a different group
altogether for reading, just depending on where their
levels are. [Moderator: How do you identify that?] Some
is teacher observation; some is testing and assessment
scores. At the beginning of the year, a lot of it’s based
on the state standards test scores that they showed the
previous year. Sometimes there’s teacher observation
that follows them [here] as well.”
WHAT ABOuT OTHER STRATEGiES?Most teachers have doubts about group work, thinking that
the less academically inclined students defer to the advanced
students. But teachers don’t think that using advanced
students to tutor their peers means the special abilities of
advanced students are going to waste.
“When students are doing group projects, the advanced
children often end up doing most of the work,” say 77% of
teachers. That problem appears more troublesome among
teachers who have not had professional development on
page 66
Figure 24—Impact of Certain Instructional Practices on Advanced Students
0% 20% 40% 60% 80% 100%
0% 20% 40% 60% 80% 100%
When students are doing group projects, the advanced children often end up doing most of the work
Sometimes, when teachers use advanced students to tutor other students, it’s because they have run out of ways to
challenge the high achievers
29%
33%
77% Total
57% Total
48%
Strongly Somewhat
24%
Percentage of teachers who agree:
Percentage of teachers who disagree:
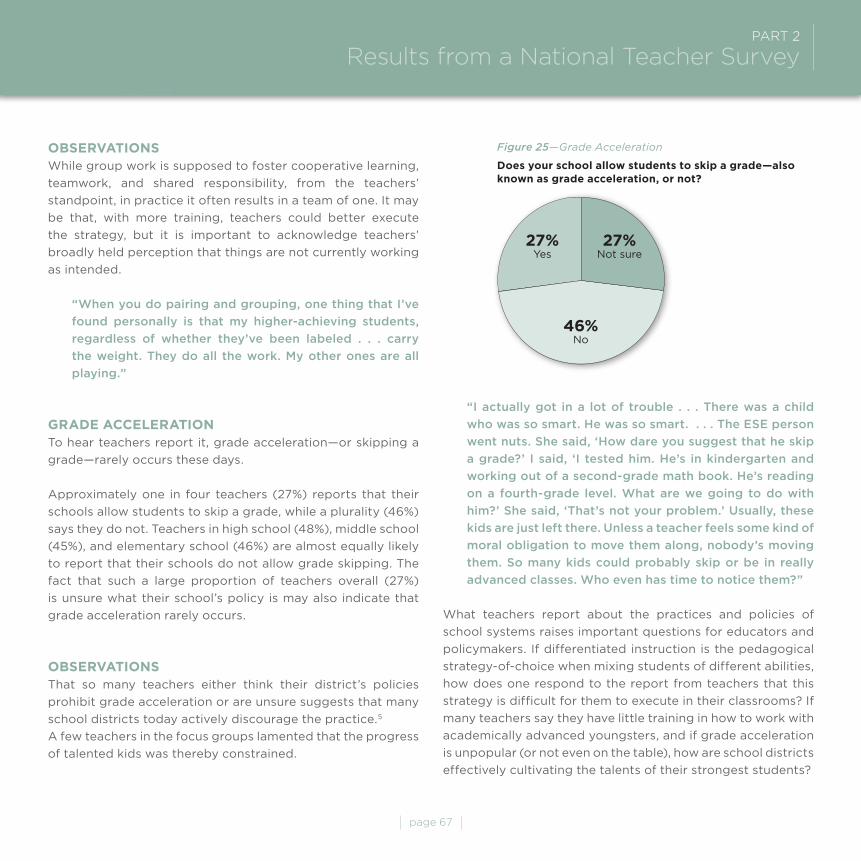
OBSERvATiONSWhile group work is supposed to foster cooperative learning,
teamwork, and shared responsibility, from the teachers’
standpoint, in practice it often results in a team of one. It may
be that, with more training, teachers could better execute
the strategy, but it is important to acknowledge teachers’
broadly held perception that things are not currently working
as intended.
“When you do pairing and grouping, one thing that I’ve
found personally is that my higher-achieving students,
regardless of whether they’ve been labeled . . . carry
the weight. They do all the work. My other ones are all
playing.”
GRADE AccELERATiONTo hear teachers report it, grade acceleration—or skipping a
grade—rarely occurs these days.
Approximately one in four teachers (27%) reports that their
schools allow students to skip a grade, while a plurality (46%)
says they do not. Teachers in high school (48%), middle school
(45%), and elementary school (46%) are almost equally likely
to report that their schools do not allow grade skipping. The
fact that such a large proportion of teachers overall (27%)
is unsure what their school’s policy is may also indicate that
grade acceleration rarely occurs.
OBSERvATiONSThat so many teachers either think their district’s policies
prohibit grade acceleration or are unsure suggests that many
school districts today actively discourage the practice.5
A few teachers in the focus groups lamented that the progress
of talented kids was thereby constrained.
“I actually got in a lot of trouble . . . There was a child
who was so smart. He was so smart. . . . The ESE person
went nuts. She said, ‘How dare you suggest that he skip
a grade?’ I said, ‘I tested him. He’s in kindergarten and
working out of a second-grade math book. He’s reading
on a fourth-grade level. What are we going to do with
him?’ She said, ‘That’s not your problem.’ Usually, these
kids are just left there. Unless a teacher feels some kind of
moral obligation to move them along, nobody’s moving
them. So many kids could probably skip or be in really
advanced classes. Who even has time to notice them?”
What teachers report about the practices and policies of
school systems raises important questions for educators and
policymakers. If differentiated instruction is the pedagogical
strategy-of-choice when mixing students of different abilities,
how does one respond to the report from teachers that this
strategy is difficult for them to execute in their classrooms? If
many teachers say they have little training in how to work with
academically advanced youngsters, and if grade acceleration
is unpopular (or not even on the table), how are school districts
effectively cultivating the talents of their strongest students?
page 67
PArT 2 results from a national Teacher Survey
Figure 25—Grade Acceleration
Does your school allow students to skip a grade—also known as grade acceleration, or not?
27%Yes
27%Not sure
46%No
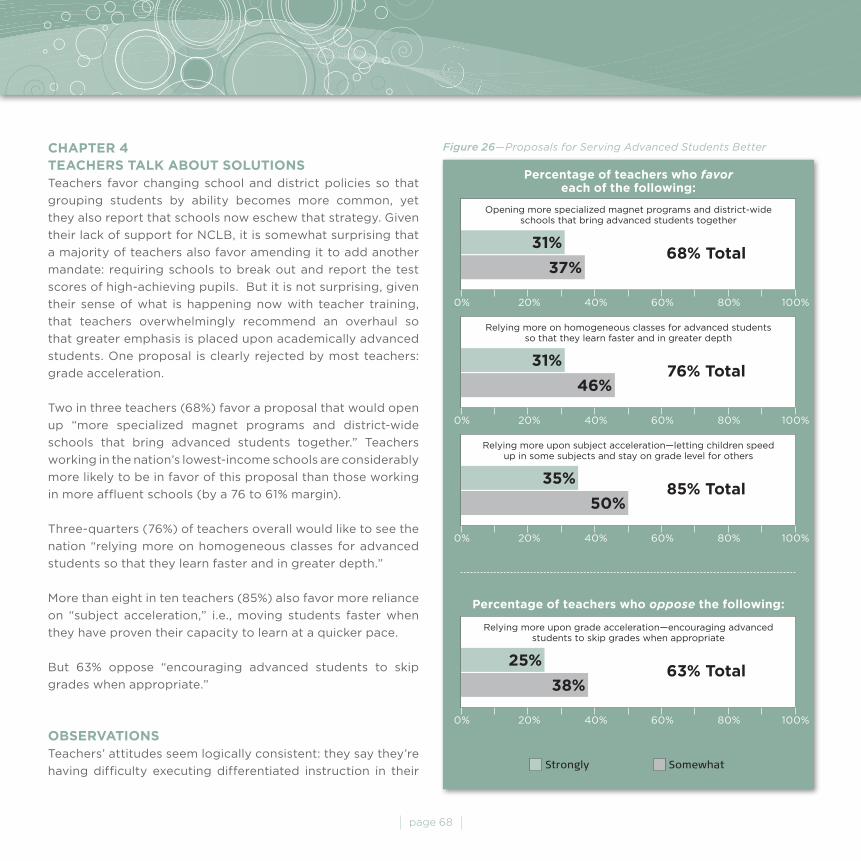
page 68
cHAPTER 4TEAcHERS TALk ABOuT SOLuTiONSTeachers favor changing school and district policies so that
grouping students by ability becomes more common, yet
they also report that schools now eschew that strategy. Given
their lack of support for NCLB, it is somewhat surprising that
a majority of teachers also favor amending it to add another
mandate: requiring schools to break out and report the test
scores of high-achieving pupils. But it is not surprising, given
their sense of what is happening now with teacher training,
that teachers overwhelmingly recommend an overhaul so
that greater emphasis is placed upon academically advanced
students. One proposal is clearly rejected by most teachers:
grade acceleration.
Two in three teachers (68%) favor a proposal that would open
up “more specialized magnet programs and district-wide
schools that bring advanced students together.” Teachers
working in the nation’s lowest-income schools are considerably
more likely to be in favor of this proposal than those working
in more affluent schools (by a 76 to 61% margin).
Three-quarters (76%) of teachers overall would like to see the
nation “relying more on homogeneous classes for advanced
students so that they learn faster and in greater depth.”
More than eight in ten teachers (85%) also favor more reliance
on “subject acceleration,” i.e., moving students faster when
they have proven their capacity to learn at a quicker pace.
But 63% oppose “encouraging advanced students to skip
grades when appropriate.”
OBSERvATiONSTeachers’ attitudes seem logically consistent: they say they’re
having difficulty executing differentiated instruction in their
Figure 26—Proposals for Serving Advanced Students Better
0% 20% 40% 60% 80% 100%
Opening more specialized magnet programs and district-wide schools that bring advanced students together
31%68% Total
37%
0% 20% 40% 60% 80% 100%
Relying more upon grade acceleration—encouraging advanced students to skip grades when appropriate
25%63% Total
38%
0% 20% 40% 60% 80% 100%
Relying more on homogeneous classes for advanced students so that they learn faster and in greater depth
31%76% Total
46%
0% 20% 40% 60% 80% 100%
Relying more upon subject acceleration—letting children speed up in some subjects and stay on grade level for others
35%85% Total
50%
Strongly Somewhat
Percentage of teachers who favor each of the following:
Percentage of teachers who oppose the following:
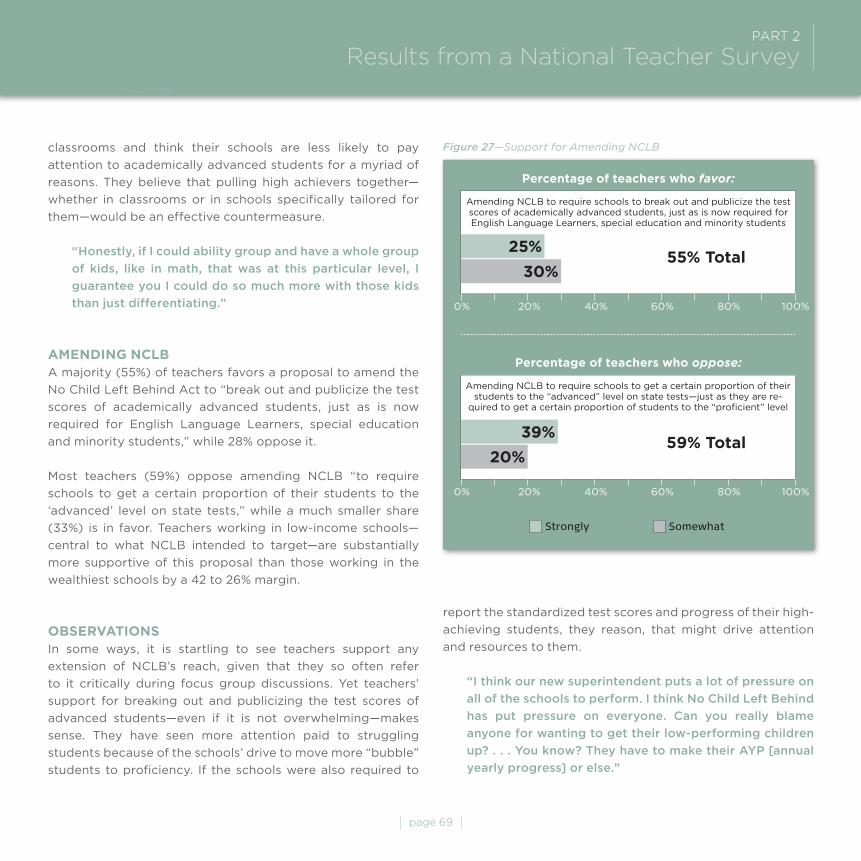
page 69
PArT 2 results from a national Teacher Survey
classrooms and think their schools are less likely to pay
attention to academically advanced students for a myriad of
reasons. They believe that pulling high achievers together—
whether in classrooms or in schools specifically tailored for
them—would be an effective countermeasure.
“Honestly, if I could ability group and have a whole group
of kids, like in math, that was at this particular level, I
guarantee you I could do so much more with those kids
than just differentiating.”
AmENDiNG NcLBA majority (55%) of teachers favors a proposal to amend the
No Child Left Behind Act to “break out and publicize the test
scores of academically advanced students, just as is now
required for English Language Learners, special education
and minority students,” while 28% oppose it.
Most teachers (59%) oppose amending NCLB “to require
schools to get a certain proportion of their students to the
‘advanced’ level on state tests,” while a much smaller share
(33%) is in favor. Teachers working in low-income schools—
central to what NCLB intended to target—are substantially
more supportive of this proposal than those working in the
wealthiest schools by a 42 to 26% margin.
OBSERvATiONSIn some ways, it is startling to see teachers support any
extension of NCLB’s reach, given that they so often refer
to it critically during focus group discussions. Yet teachers’
support for breaking out and publicizing the test scores of
advanced students—even if it is not overwhelming—makes
sense. They have seen more attention paid to struggling
students because of the schools’ drive to move more “bubble”
students to proficiency. If the schools were also required to
Figure 27—Support for Amending NCLB
0% 20% 40% 60% 80% 100%
0% 20% 40% 60% 80% 100%
Amending NCLB to require schools to break out and publicize the test scores of academically advanced students, just as is now required for English Language Learners, special education and minority students
Amending NCLB to require schools to get a certain proportion of their students to the “advanced” level on state tests—just as they are re-
quired to get a certain proportion of students to the “proficient” level
25%
39%
55% Total
59% Total
30%
Strongly Somewhat
20%
Percentage of teachers who favor:
Percentage of teachers who oppose:
report the standardized test scores and progress of their high-
achieving students, they reason, that might drive attention
and resources to them.
“I think our new superintendent puts a lot of pressure on
all of the schools to perform. I think No Child Left Behind
has put pressure on everyone. Can you really blame
anyone for wanting to get their low-performing children
up? . . . You know? They have to make their AYP [annual
yearly progress] or else.”
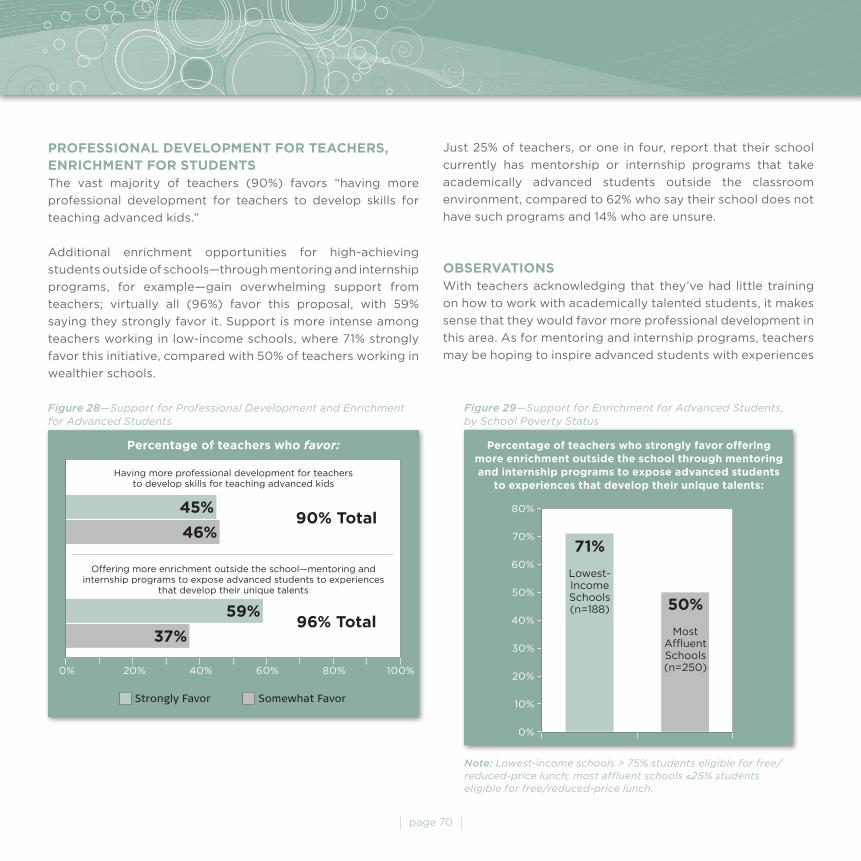
PROFESSiONAL DEvELOPmENT FOR TEAcHERS, ENRicHmENT FOR STuDENTSThe vast majority of teachers (90%) favors “having more
professional development for teachers to develop skills for
teaching advanced kids.”
Additional enrichment opportunities for high-achieving
students outside of schools—through mentoring and internship
programs, for example—gain overwhelming support from
teachers; virtually all (96%) favor this proposal, with 59%
saying they strongly favor it. Support is more intense among
teachers working in low-income schools, where 71% strongly
favor this initiative, compared with 50% of teachers working in
wealthier schools.
page 70
Figure 29—Support for Enrichment for Advanced Students, by School Poverty Status
Note: Lowest-income schools > 75% students eligible for free/reduced-price lunch; most affluent schools ≤25% students eligible for free/reduced-price lunch.
Percentage of teachers who strongly favor offering more enrichment outside the school through mentoring and internship programs to expose advanced students
to experiences that develop their unique talents:
80%
70%
60%
50%
40%
30%
20%
10%
0%
71%
Lowest-Income Schools (n=188) 50%
Most Affluent Schools (n=250)
Just 25% of teachers, or one in four, report that their school
currently has mentorship or internship programs that take
academically advanced students outside the classroom
environment, compared to 62% who say their school does not
have such programs and 14% who are unsure.
OBSERvATiONSWith teachers acknowledging that they’ve had little training
on how to work with academically talented students, it makes
sense that they would favor more professional development in
this area. As for mentoring and internship programs, teachers
may be hoping to inspire advanced students with experiences
Figure 28—Support for Professional Development and Enrichment for Advanced Students
0% 20% 40% 60% 80% 100%
Having more professional development for teachers to develop skills for teaching advanced kids
45%90% Total
46%
Offering more enrichment outside the school—mentoring and internship programs to expose advanced students to experiences
that develop their unique talents
59%96% Total
37%
Strongly Favor Somewhat Favor
Percentage of teachers who favor:
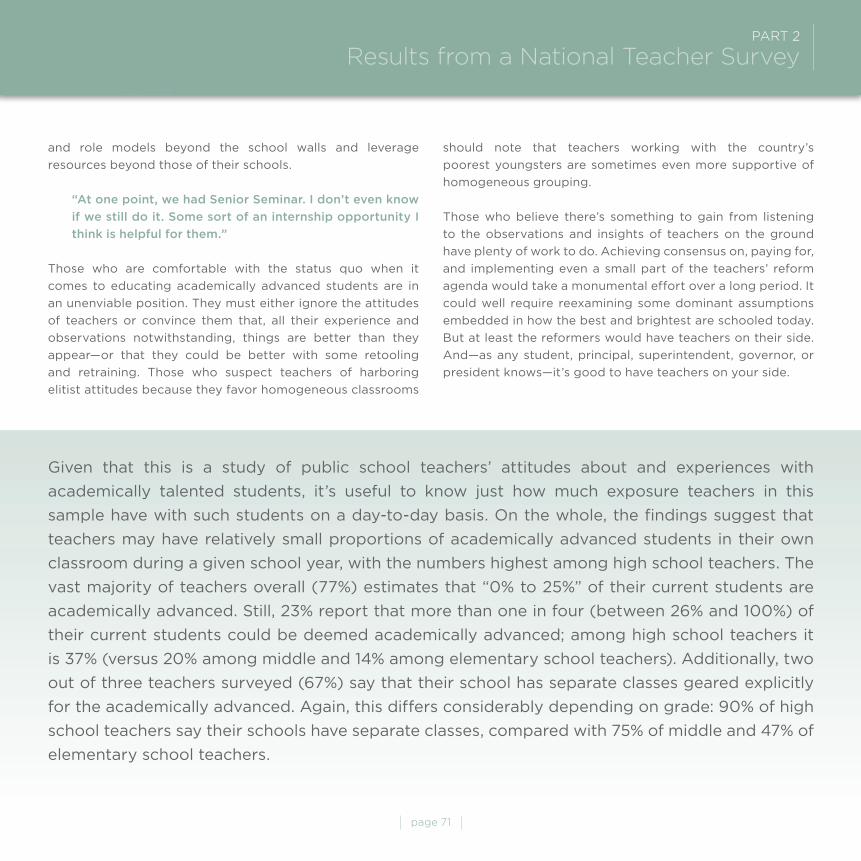
page 71
PArT 2 results from a national Teacher Survey
and role models beyond the school walls and leverage
resources beyond those of their schools.
“At one point, we had Senior Seminar. I don’t even know
if we still do it. Some sort of an internship opportunity I
think is helpful for them.”
Those who are comfortable with the status quo when it
comes to educating academically advanced students are in
an unenviable position. They must either ignore the attitudes
of teachers or convince them that, all their experience and
observations notwithstanding, things are better than they
appear—or that they could be better with some retooling
and retraining. Those who suspect teachers of harboring
elitist attitudes because they favor homogeneous classrooms
should note that teachers working with the country’s
poorest youngsters are sometimes even more supportive of
homogeneous grouping.
Those who believe there’s something to gain from listening
to the observations and insights of teachers on the ground
have plenty of work to do. Achieving consensus on, paying for,
and implementing even a small part of the teachers’ reform
agenda would take a monumental effort over a long period. It
could well require reexamining some dominant assumptions
embedded in how the best and brightest are schooled today.
But at least the reformers would have teachers on their side.
And—as any student, principal, superintendent, governor, or
president knows—it’s good to have teachers on your side.
Given that this is a study of public school teachers’ attitudes about and experiences with
academically talented students, it’s useful to know just how much exposure teachers in this
sample have with such students on a day-to-day basis. On the whole, the findings suggest that
teachers may have relatively small proportions of academically advanced students in their own
classroom during a given school year, with the numbers highest among high school teachers. The
vast majority of teachers overall (77%) estimates that “0% to 25%” of their current students are
academically advanced. Still, 23% report that more than one in four (between 26% and 100%) of
their current students could be deemed academically advanced; among high school teachers it
is 37% (versus 20% among middle and 14% among elementary school teachers). Additionally, two
out of three teachers surveyed (67%) say that their school has separate classes geared explicitly
for the academically advanced. Again, this differs considerably depending on grade: 90% of high
school teachers say their schools have separate classes, compared with 75% of middle and 47% of
elementary school teachers.

page 72
NOTES1 Arthur Schlesinger, Jr., “What Is an American?” in One America Indivisible: A National Conversation on American Pluralism and
Identity by Sheldon Hackney (Washington, DC: National Endowment for the Humanities, 1999), 173.
2 A study looking specifically at Advanced Placement programs through the eyes of AP teachers is in progress and will be
released in 2009.
3 See Free Library, “Certification and Specialized Competencies for Teachers in Gifted Education Programs,” http://www.
thefreelibrary.com/Certification+and+Specialized+Competencies+for+Teachers+in+Gifted...-a062684723.
4 A recent National Research Council report on fostering student motivation in urban high schools, for example, recommends
that “both formal and informal tracking by ability be eliminated. Alternative strategies should be used to ensure appropriately
challenging instruction for students who vary widely in their skill level” (6). Committee on Increasing High School Students’
Engagement and Motivation to Learn, National Research Council, Engaging Schools: Fostering High School Students’ Motivation
to Learn (Washington, DC: National Academies Press, 2003), www.nap.edu/catalog/10421.html.
5 The authors of a Templeton Foundation report on academic acceleration—including single-subject acceleration, grade skipping,
early entrance to school, and Advanced Placement courses—were outraged by how widely the schools dismiss it as a strategy,
as the title of their report makes clear. See Nicholas Colangelo, Susan G. Assouline, and Maraca U. M. Gross, A Nation Deceived:
How Schools Hold Back America’s Brightest Students (Iowa City, IA: University of Iowa, 2004).
APPENDix A—mETHODOLOGyThese findings are based on data from a nationally
representative random sample of 900 third- through twelfth-
grade public school teachers who were surveyed by mail and
online in winter-spring 2008. The survey was conducted by
the Farkas Duffett Research (FDR) Group for the Thomas B.
Fordham Institute. The margin of error for the overall sample
of 900 is plus or minus three percentage points; the margin of
error increases for subgroups within the sample.
The sample was randomly drawn from a comprehensive
database of names and school addresses of current third- to
twelfth-grade public school teachers. Because school districts
typically begin identifying “gifted and talented” children in
grade 3 or higher, teachers in grades K–2 were intentionally
excluded from the sample. The sample was provided by
Market Data Retrieval, a subsidiary of Dun & Bradstreet; data
collection and tabulation were provided by Robinson and
Muenster Associates.
The survey instrument was designed for two modes: paper
(for the mail survey) and online (for use via the Internet). The
survey instrument was extensively pretested with third- to
twelfth-grade public school teachers prior to fielding.
A total of 6,000 questionnaires (along with cover letter
and postage-paid return envelope) was sent to a randomly
selected sample of third- to twelfth-grade public school
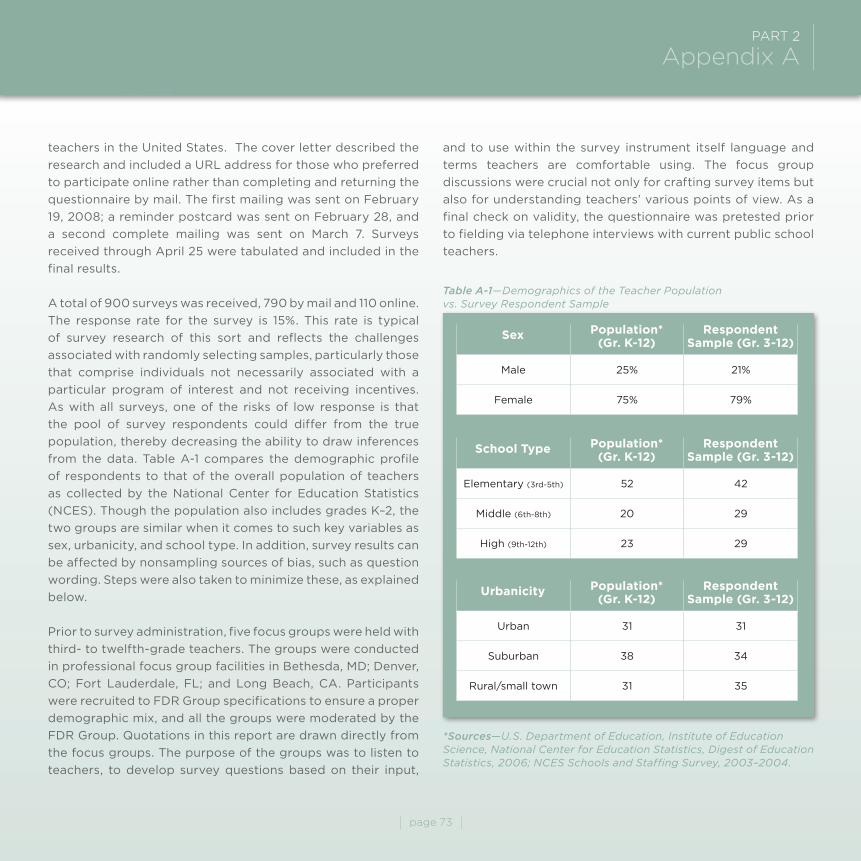
page 73
PArT 2 Appendix A
teachers in the United States. The cover letter described the
research and included a URL address for those who preferred
to participate online rather than completing and returning the
questionnaire by mail. The first mailing was sent on February
19, 2008; a reminder postcard was sent on February 28, and
a second complete mailing was sent on March 7. Surveys
received through April 25 were tabulated and included in the
final results.
A total of 900 surveys was received, 790 by mail and 110 online.
The response rate for the survey is 15%. This rate is typical
of survey research of this sort and reflects the challenges
associated with randomly selecting samples, particularly those
that comprise individuals not necessarily associated with a
particular program of interest and not receiving incentives.
As with all surveys, one of the risks of low response is that
the pool of survey respondents could differ from the true
population, thereby decreasing the ability to draw inferences
from the data. Table A-1 compares the demographic profile
of respondents to that of the overall population of teachers
as collected by the National Center for Education Statistics
(NCES). Though the population also includes grades K–2, the
two groups are similar when it comes to such key variables as
sex, urbanicity, and school type. In addition, survey results can
be affected by nonsampling sources of bias, such as question
wording. Steps were also taken to minimize these, as explained
below.
Prior to survey administration, five focus groups were held with
third- to twelfth-grade teachers. The groups were conducted
in professional focus group facilities in Bethesda, MD; Denver,
CO; Fort Lauderdale, FL; and Long Beach, CA. Participants
were recruited to FDR Group specifications to ensure a proper
demographic mix, and all the groups were moderated by the
FDR Group. Quotations in this report are drawn directly from
the focus groups. The purpose of the groups was to listen to
teachers, to develop survey questions based on their input,
and to use within the survey instrument itself language and
terms teachers are comfortable using. The focus group
discussions were crucial not only for crafting survey items but
also for understanding teachers’ various points of view. As a
final check on validity, the questionnaire was pretested prior
to fielding via telephone interviews with current public school
teachers.
Table A-1—Demographics of the Teacher Population vs. Survey Respondent Sample
*Sources—U.S. Department of Education, Institute of Education Science, National Center for Education Statistics, Digest of Education Statistics, 2006; NCES Schools and Staffing Survey, 2003–2004.
Sex Population*(Gr. k-12)
Respondent Sample (Gr. 3-12)
Male 25% 21%
Female 75% 79%
School Type Population*(Gr. k-12)
Respondent Sample (Gr. 3-12)
Elementary (3rd-5th) 52 42
Middle (6th-8th) 20 29
High (9th-12th) 23 29
urbanicity Population*(Gr. k-12)
Respondent Sample (Gr. 3-12)
Urban 31 31
Suburban 38 34
Rural/small town 31 35
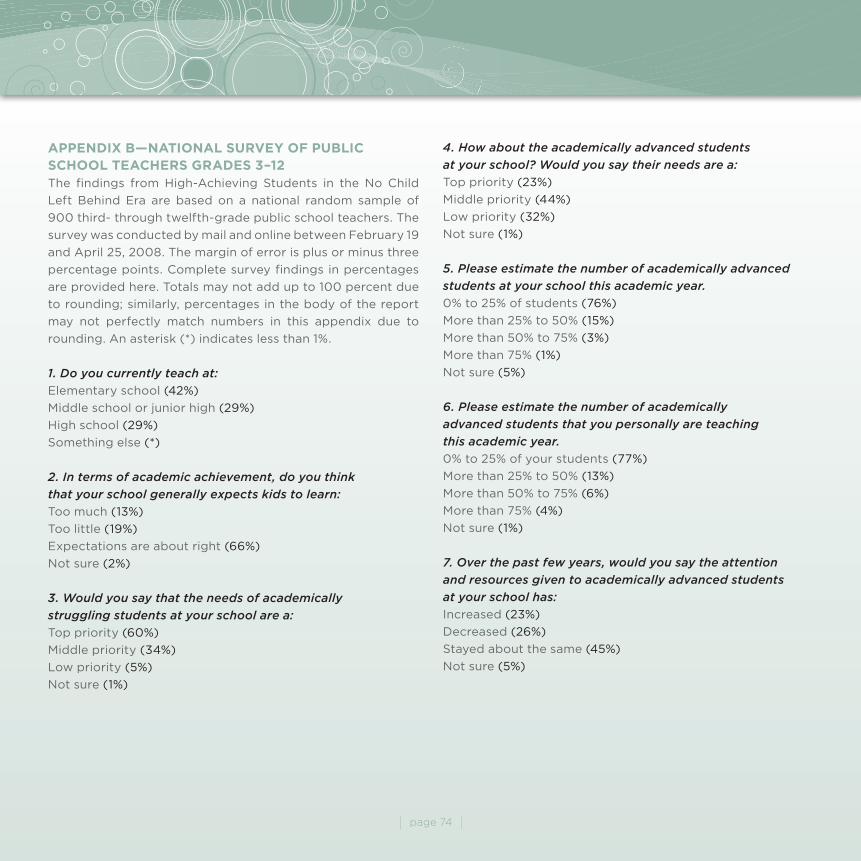
page 74
APPENDix B—NATiONAL SuRvEy OF PuBLic ScHOOL TEAcHERS GRADES 3–12The findings from High-Achieving Students in the No Child
Left Behind Era are based on a national random sample of
900 third- through twelfth-grade public school teachers. The
survey was conducted by mail and online between February 19
and April 25, 2008. The margin of error is plus or minus three
percentage points. Complete survey findings in percentages
are provided here. Totals may not add up to 100 percent due
to rounding; similarly, percentages in the body of the report
may not perfectly match numbers in this appendix due to
rounding. An asterisk (*) indicates less than 1%.
1. Do you currently teach at:
Elementary school (42%)
Middle school or junior high (29%)
High school (29%)
Something else (*)
2. In terms of academic achievement, do you think
that your school generally expects kids to learn:
Too much (13%)
Too little (19%)
Expectations are about right (66%)
Not sure (2%)
3. Would you say that the needs of academically
struggling students at your school are a:
Top priority (60%)
Middle priority (34%)
Low priority (5%)
Not sure (1%)
4. How about the academically advanced students
at your school? Would you say their needs are a:
Top priority (23%)
Middle priority (44%)
Low priority (32%)
Not sure (1%)
5. Please estimate the number of academically advanced
students at your school this academic year.
0% to 25% of students (76%)
More than 25% to 50% (15%)
More than 50% to 75% (3%)
More than 75% (1%)
Not sure (5%)
6. Please estimate the number of academically
advanced students that you personally are teaching
this academic year.
0% to 25% of your students (77%)
More than 25% to 50% (13%)
More than 50% to 75% (6%)
More than 75% (4%)
Not sure (1%)
7. Over the past few years, would you say the attention
and resources given to academically advanced students
at your school has:
Increased (23%)
Decreased (26%)
Stayed about the same (45%)
Not sure (5%)

page 75
PArT 2 Appendix B
For the next series of questions, think about the students at your school in terms of their academic ability.
When classes are homogenously grouped by academic ability, do you think that each group below is more
likely to reach their academic potential, less likely or does it make little difference?
StrugglingStudents
AverageStudents
AdvancedStudents
it’s Equal Not Surequestion
8. Who gets the most overall attention at your school?
63% 13% 7% 16% 2%
9. Who should get the most attention at your school?
24% 16% 5% 50% 6%
10. Who is your school most likely to focus on when it comes to tracking achievement data and trying to raise standardized test scores?
68% 15% 5% 11% 2%
11. Who is most likely to get one-on-one attention from teachers?
81% 4% 5% 9% 2%
12. And who is most likely to be taught with a curriculum and instruction specially designed for their abilities?
51% 19% 10% 18% 2%
more Likely Less Likely Little Difference
it’s EqualGroup
13. Academically struggling students 46% 36% 13% 5%
14. Average students 50% 20% 28% 3%
15. Academically advanced students 72% 14% 12% 3%
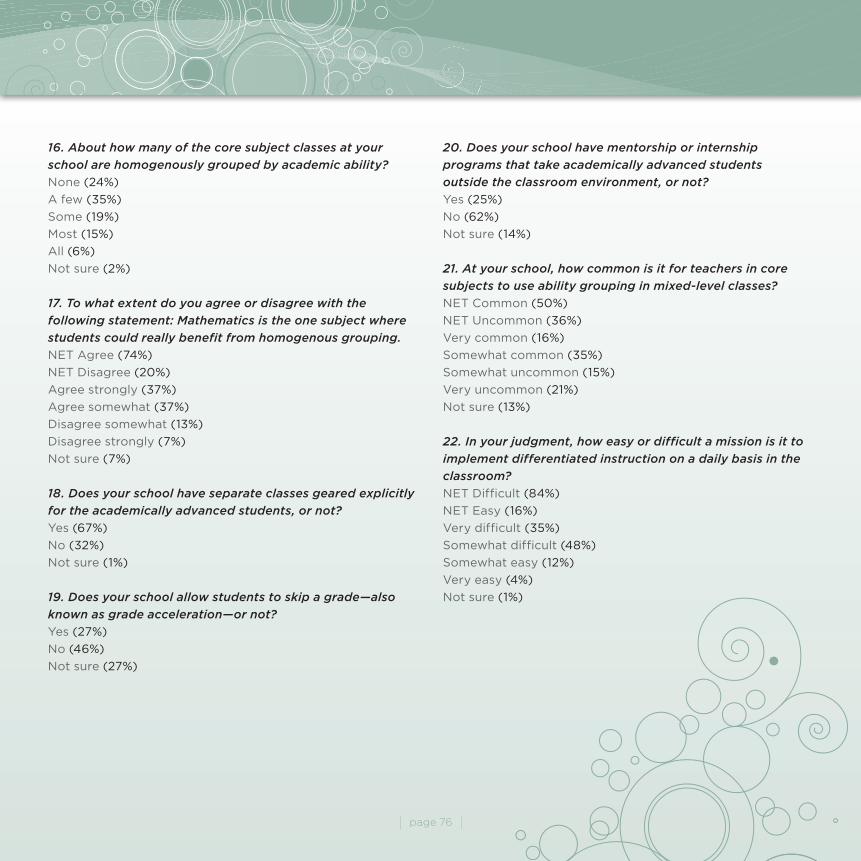
page 76
16. About how many of the core subject classes at your
school are homogenously grouped by academic ability?
None (24%)
A few (35%)
Some (19%)
Most (15%)
All (6%)
Not sure (2%)
17. To what extent do you agree or disagree with the
following statement: Mathematics is the one subject where
students could really benefit from homogenous grouping.
NET Agree (74%)
NET Disagree (20%)
Agree strongly (37%)
Agree somewhat (37%)
Disagree somewhat (13%)
Disagree strongly (7%)
Not sure (7%)
18. Does your school have separate classes geared explicitly
for the academically advanced students, or not?
Yes (67%)
No (32%)
Not sure (1%)
19. Does your school allow students to skip a grade—also
known as grade acceleration—or not?
Yes (27%)
No (46%)
Not sure (27%)
20. Does your school have mentorship or internship
programs that take academically advanced students
outside the classroom environment, or not?
Yes (25%)
No (62%)
Not sure (14%)
21. At your school, how common is it for teachers in core
subjects to use ability grouping in mixed-level classes?
NET Common (50%)
NET Uncommon (36%)
Very common (16%)
Somewhat common (35%)
Somewhat uncommon (15%)
Very uncommon (21%)
Not sure (13%)
22. In your judgment, how easy or difficult a mission is it to
implement differentiated instruction on a daily basis in the
classroom?
NET Difficult (84%)
NET Easy (16%)
Very difficult (35%)
Somewhat difficult (48%)
Somewhat easy (12%)
Very easy (4%)
Not sure (1%)
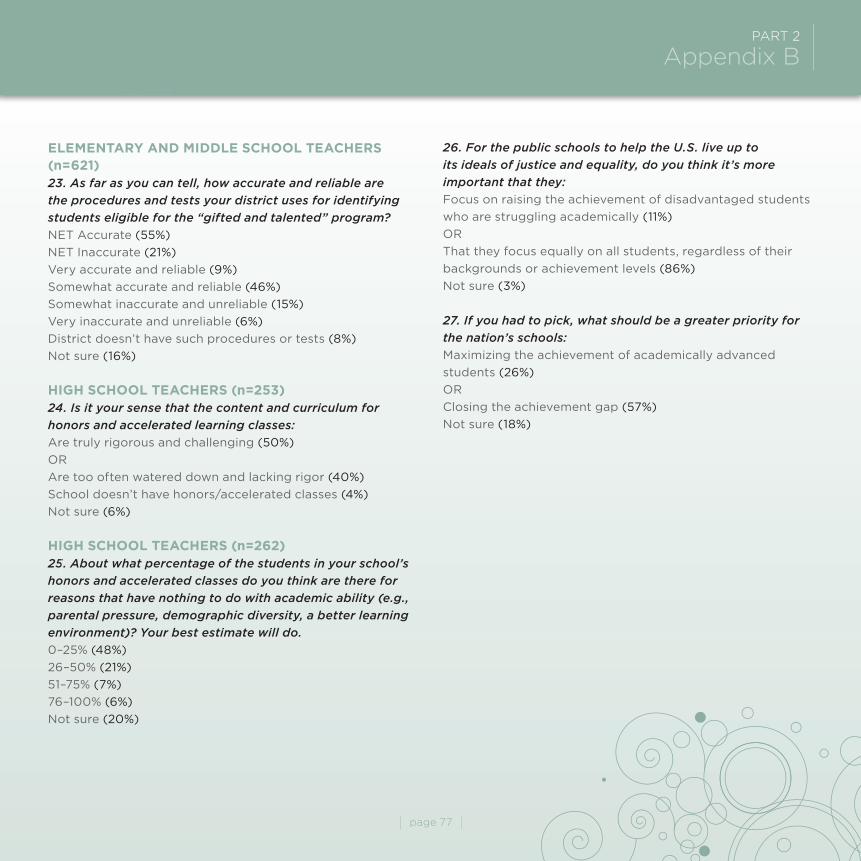
page 77
PArT 2 Appendix B
ELEmENTARy AND miDDLE ScHOOL TEAcHERS (n=621)23. As far as you can tell, how accurate and reliable are
the procedures and tests your district uses for identifying
students eligible for the “gifted and talented” program?
NET Accurate (55%)
NET Inaccurate (21%)
Very accurate and reliable (9%)
Somewhat accurate and reliable (46%)
Somewhat inaccurate and unreliable (15%)
Very inaccurate and unreliable (6%)
District doesn’t have such procedures or tests (8%)
Not sure (16%)
HiGH ScHOOL TEAcHERS (n=253)24. Is it your sense that the content and curriculum for
honors and accelerated learning classes:
Are truly rigorous and challenging (50%)
OR
Are too often watered down and lacking rigor (40%)
School doesn’t have honors/accelerated classes (4%)
Not sure (6%)
HiGH ScHOOL TEAcHERS (n=262)25. About what percentage of the students in your school’s
honors and accelerated classes do you think are there for
reasons that have nothing to do with academic ability (e.g.,
parental pressure, demographic diversity, a better learning
environment)? Your best estimate will do.
0–25% (48%)
26–50% (21%)
51–75% (7%)
76–100% (6%)
Not sure (20%)
26. For the public schools to help the U.S. live up to
its ideals of justice and equality, do you think it’s more
important that they:
Focus on raising the achievement of disadvantaged students
who are struggling academically (11%)
OR
That they focus equally on all students, regardless of their
backgrounds or achievement levels (86%)
Not sure (3%)
27. If you had to pick, what should be a greater priority for
the nation’s schools:
Maximizing the achievement of academically advanced
students (26%)
OR
Closing the achievement gap (57%)
Not sure (18%)
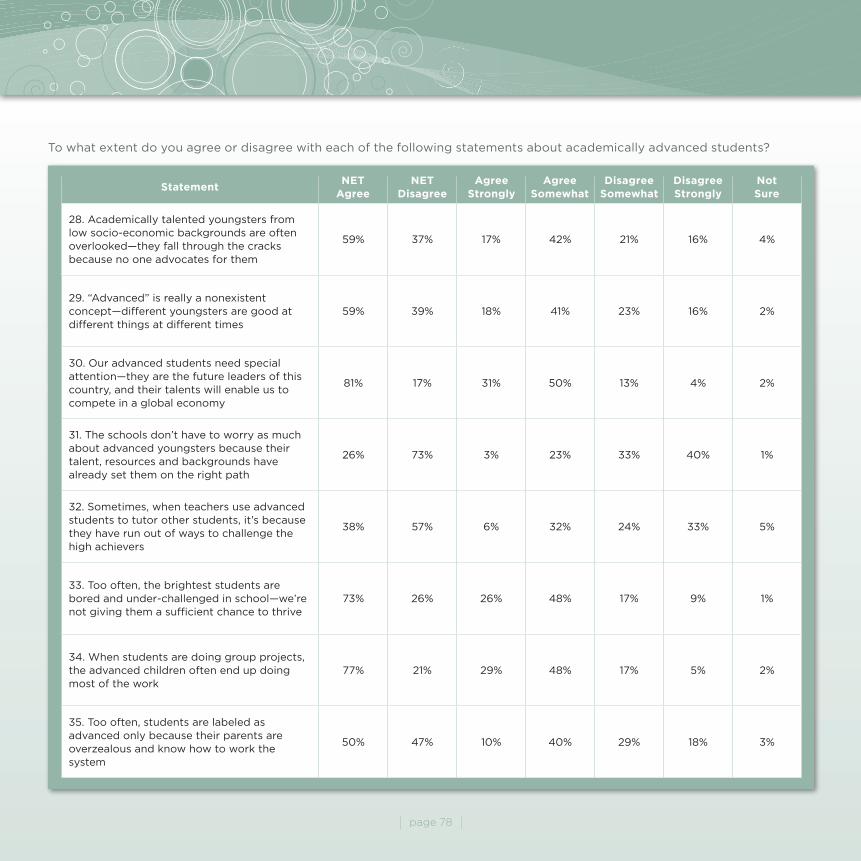
page 78
To what extent do you agree or disagree with each of the following statements about academically advanced students?
NET Agree
NET Disagree
AgreeStrongly
AgreeSomewhat
DisagreeSomewhat
DisagreeStrongly
Not Sure
Statement
28. Academically talented youngsters from low socio-economic backgrounds are often overlooked—they fall through the cracks because no one advocates for them
59% 37% 17% 42% 21% 16% 4%
29. “Advanced” is really a nonexistent concept—different youngsters are good at different things at different times
59% 39% 18% 41% 23% 16% 2%
30. Our advanced students need special attention—they are the future leaders of this country, and their talents will enable us to compete in a global economy
81% 17% 31% 50% 13% 4% 2%
31. The schools don’t have to worry as much about advanced youngsters because their talent, resources and backgrounds have already set them on the right path
26% 73% 3% 23% 33% 40% 1%
32. Sometimes, when teachers use advanced students to tutor other students, it’s because they have run out of ways to challenge the high achievers
38% 57% 6% 32% 24% 33% 5%
33. Too often, the brightest students are bored and under-challenged in school—we’re not giving them a sufficient chance to thrive
73% 26% 26% 48% 17% 9% 1%
34. When students are doing group projects, the advanced children often end up doing most of the work
77% 21% 29% 48% 17% 5% 2%
35. Too often, students are labeled as advanced only because their parents are overzealous and know how to work the system
50% 47% 10% 40% 29% 18% 3%
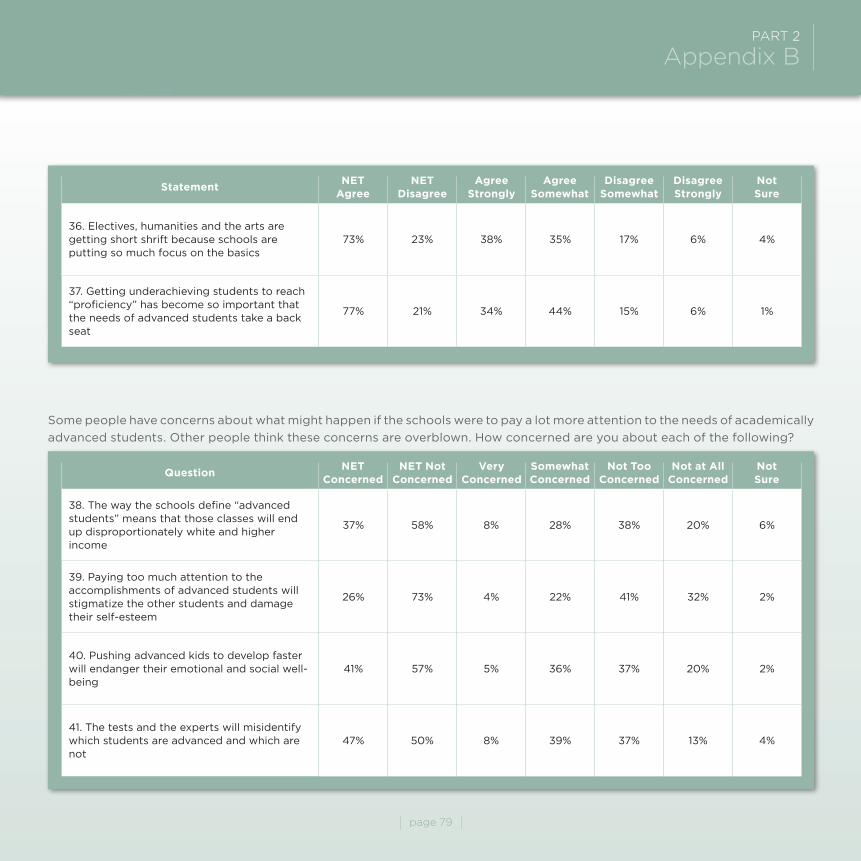
page 79
PArT 2 Appendix B
Some people have concerns about what might happen if the schools were to pay a lot more attention to the needs of academically
advanced students. Other people think these concerns are overblown. How concerned are you about each of the following?
NET Agree
NET Disagree
AgreeStrongly
AgreeSomewhat
DisagreeSomewhat
DisagreeStrongly
Not Sure
Statement
36. Electives, humanities and the arts are getting short shrift because schools are putting so much focus on the basics
73% 23% 38% 35% 17% 6% 4%
37. Getting underachieving students to reach “proficiency” has become so important that the needs of advanced students take a back seat
77% 21% 34% 44% 15% 6% 1%
NET concerned
NET Notconcerned
veryconcerned
Somewhatconcerned
Not Tooconcerned
Not at Allconcerned
Not Sure
question
38. The way the schools define “advanced students” means that those classes will end up disproportionately white and higher income
37% 58% 8% 28% 38% 20% 6%
39. Paying too much attention to the accomplishments of advanced students will stigmatize the other students and damage their self-esteem
26% 73% 4% 22% 41% 32% 2%
40. Pushing advanced kids to develop faster will endanger their emotional and social well-being
41% 57% 5% 36% 37% 20% 2%
41. The tests and the experts will misidentify which students are advanced and which are not
47% 50% 8% 39% 37% 13% 4%
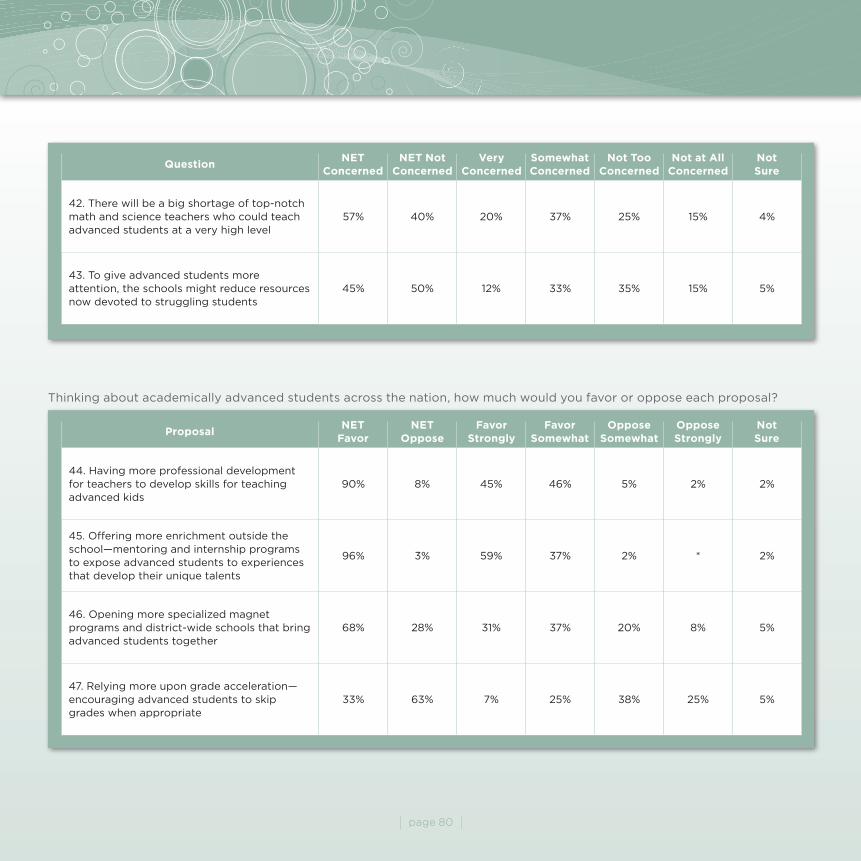
page 80
NET concerned
NET Notconcerned
veryconcerned
Somewhatconcerned
Not Tooconcerned
Not at Allconcerned
Not Sure
question
42. There will be a big shortage of top-notch math and science teachers who could teach advanced students at a very high level
57% 40% 20% 37% 25% 15% 4%
43. To give advanced students more attention, the schools might reduce resources now devoted to struggling students
45% 50% 12% 33% 35% 15% 5%
Thinking about academically advanced students across the nation, how much would you favor or oppose each proposal?
NET Favor
NETOppose
Favor Strongly
FavorSomewhat
OpposeSomewhat
OpposeStrongly
Not Sure
Proposal
44. Having more professional development for teachers to develop skills for teaching advanced kids
90% 8% 45% 46% 5% 2% 2%
45. Offering more enrichment outside the school—mentoring and internship programs to expose advanced students to experiences that develop their unique talents
96% 3% 59% 37% 2% * 2%
46. Opening more specialized magnet programs and district-wide schools that bring advanced students together
68% 28% 31% 37% 20% 8% 5%
47. Relying more upon grade acceleration—encouraging advanced students to skip grades when appropriate
33% 63% 7% 25% 38% 25% 5%
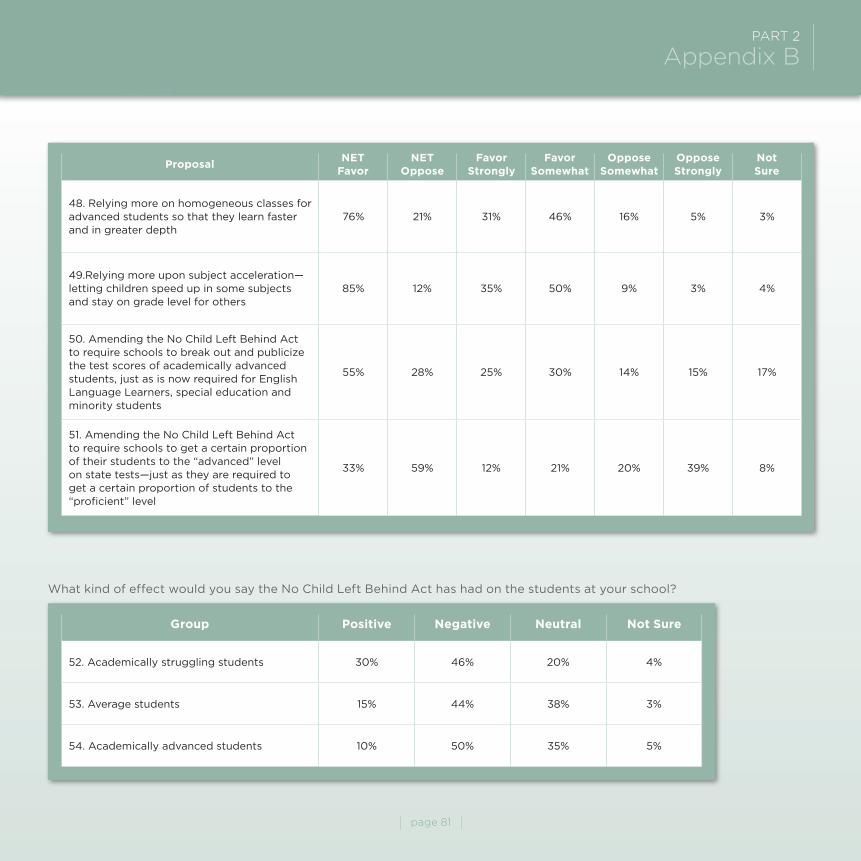
page 81
PArT 2 Appendix B
NET Favor
NETOppose
Favor Strongly
FavorSomewhat
OpposeSomewhat
OpposeStrongly
Not Sure
Proposal
48. Relying more on homogeneous classes for advanced students so that they learn faster and in greater depth
76% 21% 31% 46% 16% 5% 3%
49.Relying more upon subject acceleration—letting children speed up in some subjects and stay on grade level for others
85% 12% 35% 50% 9% 3% 4%
50. Amending the No Child Left Behind Act to require schools to break out and publicize the test scores of academically advanced students, just as is now required for English Language Learners, special education and minority students
55% 28% 25% 30% 14% 15% 17%
51. Amending the No Child Left Behind Act to require schools to get a certain proportion of their students to the “advanced” level on state tests—just as they are required to get a certain proportion of students to the “proficient” level
33% 59% 12% 21% 20% 39% 8%
What kind of effect would you say the No Child Left Behind Act has had on the students at your school?
Positive Negative Neutral Not SureGroup
52. Academically struggling students 30% 46% 20% 4%
53. Average students 15% 44% 38% 3%
54. Academically advanced students 10% 50% 35% 5%

page 82
55. To the best of your knowledge, is your school currently
identified as “in need of improvement” as defined by the No
Child Left Behind Act, or not?
Yes (26%)
No (67%)
Not sure (8%)
56. Thinking back to the school of education or teacher
preparation program you went through, how much focus
did it put on how to best teach academically advanced
students?
A lot (5%)
Some (30%)
Very little (46%)
None at all (18%)
Not sure (2%)
57. Over the past few years, have you had professional
development specifically focused on teaching academically
advanced students, or not?
Yes (41%)
No (58%)
Not sure (1%)
58. Are you:
Female (79%)
Male (21%)
59. For how many years have you been a public
school teacher?
1–4 (13%)
5–9 (20%)
10–20 (34%)
>20 (33%)
60. Approximately what percentage of students at your
school are African American or Hispanic?
0% to 25% of students (54%)
More than 25% to 50% (19%)
More than 50% to 75% (13%)
More than 75% (15%)
61. Approximately what percentage of students at your
school are eligible for the free or reduced lunch program?
0% to 25% of students (28%)
More than 25% to 50% (28%)
More than 50% to 75% (22%)
More than 75% (21%)
62. Which best describes your school:
Inner city (12%)
Urban (not inner city) (19%)
Suburban (34%)
Rural (35%)

1016 16th Street, NW • 8th Floor • Washington D.C., 20036
Copies of this report are available electronically at our website, www.edexcellence.net
The institute is neither connected with nor sponsored by Fordham University
Hig
H-A
CH
iev
iNg
ST
UD
eN
TS
iN T
He
er
A o
F N
CL
B
Th
om
as B
. Fo
rdh
am
institu
te
AN ANALySiS oF NAeP DATAby Tom Loveless
reSULTS From A NATioNAL TeACHer SUrveyby Steve Farkas and Ann Duffett
Foreword by Chester E. Finn, Jr. and Michael J. Petrilli
PART 1
PART 2
in the Era of NCLBHigh-Achieving Students