high fidelity performance behavior models development for ... · • rhino 5 | orca3d: 3d modeler...
TRANSCRIPT

High Fidelity Performance Behavior Models Development
for Combat Ship in Model Based Environment
Jared Adams, I. Mizine, Chase Rogers, CSRA
April 18th, 2018
Overview
04/18/2018 2
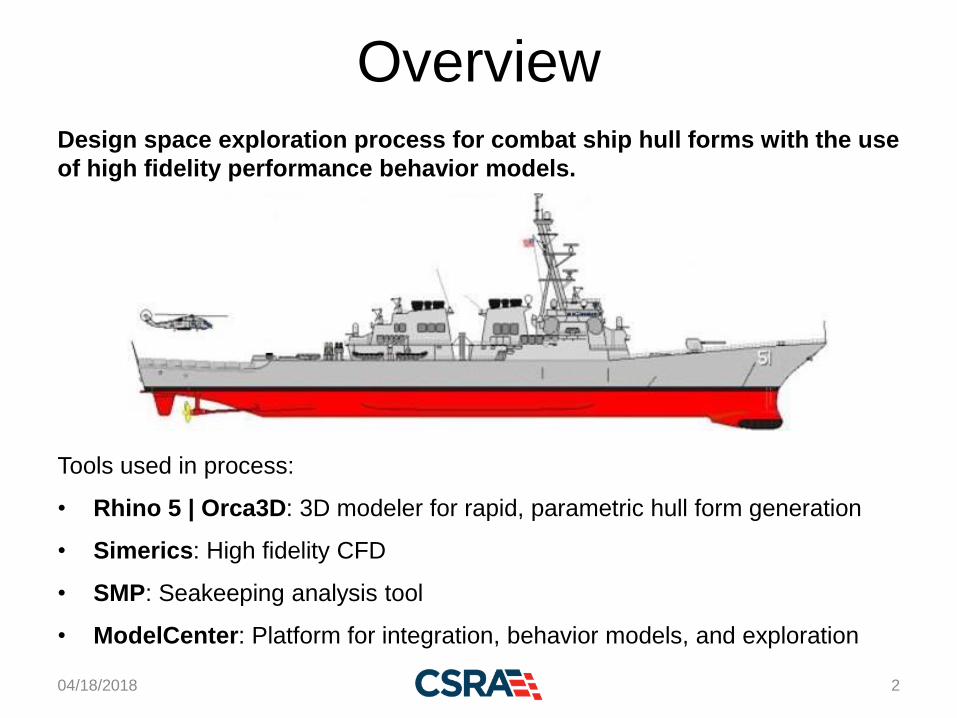
Design space exploration process for combat ship hull forms with the use
of high fidelity performance behavior models.
Tools used in process:
• Rhino 5 | Orca3D: 3D modeler for rapid, parametric hull form generation
• Simerics: High fidelity CFD
• SMP: Seakeeping analysis tool
• ModelCenter: Platform for integration, behavior models, and exploration

Agenda
1. Hull Form Development and Hydrostatics
2. Propulsion Power CFD and Seakeeping Calculations
Integrated in ModelCenter
3. Relationships of Performance Characteristics and Hull
Form Parameters
4. Response Surface Models
5. Sensitivity Analysis and Hull Form Performance
Derivatives
6. Hull Form Performance Optimization Results
7. Summary
04/18/2018 3

Agenda
1. Hull Form Development and Hydrostatics
2. Propulsion Power CFD and Seakeeping Calculations
Integrated in ModelCenter
3. Relationships of Performance Characteristics and Hull
Form Parameters
4. Response Surface Models
5. Sensitivity Analysis and Hull Form Performance
Derivatives
6. Hull Form Performance Optimization Results
7. Summary
04/18/2018 4

04/18/2018 5
Baseline Hull Form
• 3D modeling tool utilizes input parameters for hull forms generation called
“Control Parameters” which allow geometrical transformation
• Iterate until satisfied with input parameter ranges

Hull Form Series• Integrated with ModelCenter for DOE Latin Hypercube
Sampling of 1000 runs
• Hydrostatics calculated for each hull
• 143 hulls are feasible as a result of the following
hydrostatic constraints:
04/18/2018 6
Variable Minimum Maximum
BeamWL to Draft 2.7 3.2
GM to BeamWL 0.04 0.16
Slenderness 7 8.5
Prismatic Coefficient 0.56 1
Midship Coefficient 0.8 0.98
Block Coefficient 0.5 1

Feasible Hull Forms in the Design Space Domain
04/18/2018 7

Agenda
1. Hull Form Development and Hydrostatics
2. Propulsion Power CFD and Seakeeping
Calculations Integrated in ModelCenter
3. Relationships of Performance Characteristics and Hull
Form Parameters
4. Response Surface Models
5. Sensitivity Analysis and Hull Form Performance
Derivatives
6. Hull Form Performance Optimization Results
7. Summary
04/18/2018 8

Propulsion Power CFD• FINE/Marine CFD verification with comparative Navy test data
• CFD Comparison of FINE/Marine and Orca3D Simerics
04/18/2018 9
Re
sis
tan
ce
Speed
FINE/Marine
Orca3D Simerics
Re
sid
ua
l C
oe
ffic
ien
t
Speed
FINE/Marine
Test Data

Comparative Stern Waves
Orca3D Simerics
Stern Waves
FINE/Marine
Stern Waves
04/18/2018 10

Seakeeping Calculations• Percent Time of Operability (PTO) using NATO flight deck operability
criteria in winter of the North Pacific Ocean at 16 knots
• The operability criteria are set to the following Significant Amplitude
(SA) limits:
• Integration and automation process from the 3D modeler and
analysis code was accomplished through a combination of Python
and ModelCenter
04/18/2018 11
Motion Limit
Roll 5◦
Pitch 3◦
Vertical Velocity 2 m/s

ModelCenter Integration
04/18/2018 12

Agenda
1. Hull Form Development and Hydrostatics
2. Propulsion Power CFD and Seakeeping Calculations
Integrated in ModelCenter
3. Relationships of Performance Characteristics and
Hull Form Parameters
4. Response Surface Models
5. Sensitivity Analysis and Hull Form Performance
Derivatives
6. Hull Form Performance Optimization Results
7. Summary
04/18/2018 13
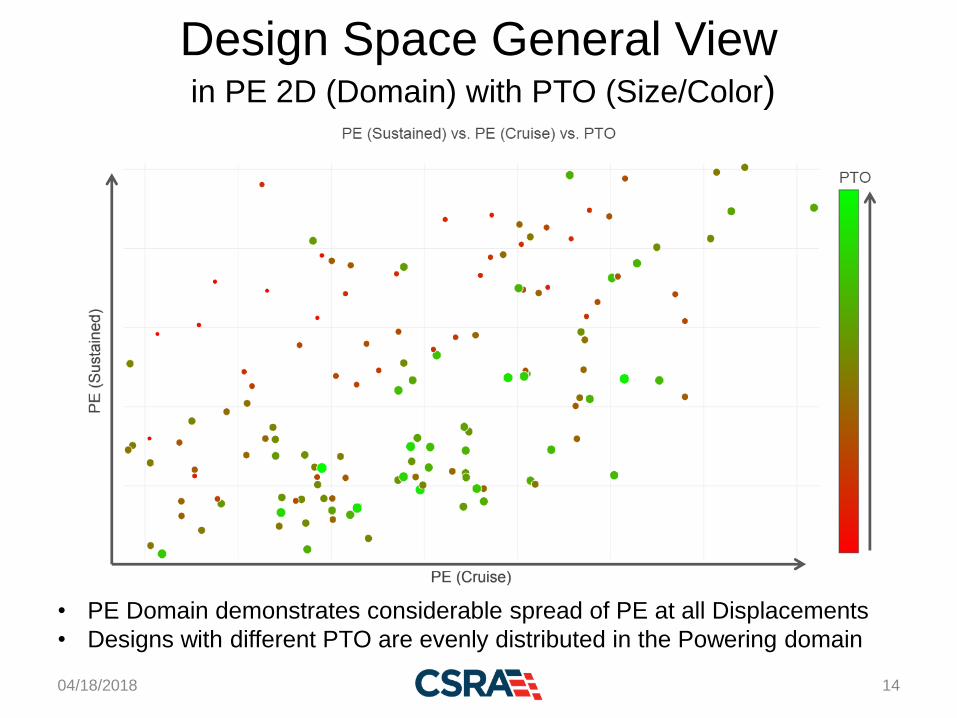
Design Space General Viewin PE 2D (Domain) with PTO (Size/Color)
04/18/2018 14
• PE Domain demonstrates considerable spread of PE at all Displacements
• Designs with different PTO are evenly distributed in the Powering domain

04/18/2018 15
• Sustained Speed - highest
Lift to Drag values are
mostly achieved at highest
Slenderness at all
Displacements
• Cruise Speed - high
Slenderness points are
distributed evenly in the
Lift to Drag domain
• High Slenderness does
not necessarily correlate
to optimal designs (high
Lift to Drag ratio) at all
displacements

04/18/2018 16
• Cruise Speed - designs
with different Cp are
distributed almost evenly
in the Lift to Drag domain
at all displacements
• Sustained Speed - The
highest Lift to Drag is
achieved at low values of
Cp

04/18/201804/18/2018 17
General Trends:
• Higher LCB/Lwl (aft), Lift
to Drag Higher
• Higher LCB/Lwl (aft), Cp
Lower
General Trends:
• No correlations between Lift
to Drag (Cruise) and
Metacenter Height
• Higher Lift to Drag (Cruise),
Cp Lower

Agenda
1. Hull Form Development and Hydrostatics
2. Propulsion Power CFD and Seakeeping Calculations
Integrated in ModelCenter
3. Relationships of Performance Characteristics and Hull
Form Parameters
4. Response Surface Models
5. Sensitivity Analysis and Hull Form Performance
Derivatives
6. Hull Form Performance Optimization Results
7. Summary
04/18/2018 18

Response Surface Models in ModelCenter
04/18/2018 19
Sample RSM using
Kriging and Polynomial fitting:
All variables resulted in R2 of 95% or higher

Agenda
1. Hull Form Development and Hydrostatics
2. Propulsion Power CFD and Seakeeping Calculations
Integrated in ModelCenter
3. Relationships of Performance Characteristics and Hull
Form Parameters
4. Response Surface Models
5. Sensitivity Analysis and Hull Form Performance
Derivatives
6. Hull Form Performance Optimization Results
7. Summary
04/18/2018 20

Design Parameters Influence on Propulsion
Criteria: PE Powering (L/D) and PTO
04/18/2018 21
SlendernessFullness FWD
PTO
L/B
L/D at Sustained Speed L/D at Cruise Speed

Design Costs of Hull Form parameters on Performance
Criteria at Full Range of Displacements
Design Costs λj=∂(∆F)/∂Xj are mostly consistent at various groups of displacements,
however their numeric values are different. For example, for Slenderness parameter
Design Costs are the following:
Displacement
Group
Small Medium Large
λSl∆PTO 0.1 0.12 0.12
λSl∆PE
Cruise0.03 0.01 0.02
λSl∆PE
Sustained0.23 0.27 0.27
The trend is fully consistent with all other sensitivity representative plots; Prediction
Profiler allows us to estimate the design costs, which can be further used to
coordinate hull forms selection in the course of design process among design
subsystems and disciplines.
2210/13/2017

Agenda
1. Hull Form Development and Hydrostatics
2. Propulsion Power CFD and Seakeeping Calculations
Integrated in ModelCenter
3. Relationships of Performance Characteristics and Hull
Form Parameters
4. Response Surface Models
5. Sensitivity Analysis and Hull Form Performance
Derivatives
6. Hull Form Performance Optimization Results
7. Summary
04/18/2018 23

Optimization Tasks• For each displacement range of Small, Medium, and Large ship, two
scenarios are optimized with Darwin Algorithm:
1. Powering: ∆L
D cruise vs. ∆L
D sustained
2. Performance: ∆L
D cruise vs. ∆L
D sustained vs PTO
• Constraints are applied for the following hydrostatic variables:
04/18/2018 24
Variable Minimum Maximum
BeamWL to Draft 2.7 3.2
GM to BeamWL 0.04 0.16
Prismatic
Coefficient0.56 1
Midship Coefficient 0.8 0.98
Block Coefficient 0.5 1

Pareto Front
04/18/2018 25

04/18/2018 26
1. Powering Optimization:Pareto Point Example Snapshot
Performance OptimizationCharacteristics
∆ Lift to Drag (Cruise) 5.2%
∆ Lift to Drag (Sustained) 35.6%
∆ PTO 5.7%
Optimized hull form (orange) versus baseline hull form (black)
Not Optimized

2. Performance Optimization:Pareto Point Example Snapshot
04/18/2018 27
Performance OptimizationCharacteristics
∆ Lift to Drag (Cruise) 0.9%
∆ Lift to Drag (Sustained) 25.4%
∆ PTO 12.2%
Optimized hull form (orange) versus baseline hull form (black)

Optimization Tasks SummaryThe results of sample optimization tasks can be summarized in
comparison with the baseline hull form with the following table:
It is necessary to note that in the Powering results are presented with
designs, which are already the best compromise between Powering at
two speeds. The table shows the effect of adding the Operability
criterion.
04/18/2018 28
Small Displacement
Group
Large Displacement
Group
Criteria Powering Performance Powering Performance
∆ Lift to Drag (Cruise) -5.0% -8.0% 5.2% 0.9%
∆ Lift to Drag (Sustained) 12.5% 7.1% 35.6% 25.4%
∆ PTO 1.7% 6.4% 5.7% 12.2%

Agenda
1. Hull Form Development and Hydrostatics
2. Propulsion Power CFD and Seakeeping Calculations
Integrated in ModelCenter
3. Relationships of Performance Characteristics and Hull
Form Parameters
4. Response Surface Models
5. Sensitivity Analysis and Hull Form Performance
Derivatives
6. Hull Form Performance Optimization Results
7. Summary
04/18/2018 29

Summary and Recommendations
1. The Study resulted with:
– Series of the Monohull forms of combatant-type between small and large displacements
– Effective Power Database with all coefficients, running trim data and detailed flow characteristics, including Wave pattern, Pressure, Streamlines and Velocity Distributions
– Seakeeping database with Percent Time Operability at long and short crested waves
– Response Surface Models, which provide quick, easy solution to calculate all hull forms geometrical and performance characteristics.
– Results of ModelCenter sensitivity analysis and sample optimization tasks
2. It is recommended that
– Surrogate Model development would include more types of regression relationships, including Neural Nets
– DOE would include Sobol algorithms or o called LPt sequence of points
04/18/2018 30