high-field-side mhd activity during local helicity injection · high-field-side mhd activity during...
TRANSCRIPT

PEGASUS Toroidal Experiment
University of Wisconsin-Madison
59th Annual Meeting of the APS Division of Plasma Physics
Milwaukee, WI
26 October 2017
High-Field-Side MHD Activity During Local Helicity Injection
Jessica L. Pachicano M.W. Bongard, R.J. Fonck, J.M. Perry, J.A. Reusch, N.J. Richner

2
Layout Slide (Include for Posters)
US Legal 8.5 x 14”
US Letter 8.5 x 11”
Panel size: 8’ x 4’ 12:1 scale
MHD transition
PEGASUS Magnetic
Diagnostic Locations
NIMROD Simulated n=1 Activity Present
in Experiment on Low-Field-Side
(LFS)
NIMROD Provides
Simulation of Injected Current
Streams
Overview/LHI Introduction
Troubleshooting Noise Source
Noise Suppression
Solution
Results of implemented
solution
Motivation for Noise
Reduction
Transition Behavior Differs Greatly between the LFS and HFS
Large Changes in MHD Auto-Power
at Transition: LFS
vs. HFS
Little Correlation
between HFS and LFS
HFS LHI MHD Transition Behavior
Toroidal Mode Number: LFS
vs. HFS
High Frequency
Spectra of HFS
Summary of high MHD on
HFS
Coherence vs. poloidal angle
Toroidal Mode Number on
HFS
High Frequency
Spectra of HFS
Summary of low MHD on
HFS
Coherence vs. poloidal angle
Title Slide
Elimination of EMI-driven switching
noise
High amplitude MHD behavior
on HFS
Low amplitude MHD behavior
on HFS

Local Helicity Injection Current Drive

4
Local Helicity Injection (LHI)
J.L. Pachicano, APS-DPP 2017
• Non-solenoidal startup on PEGASUS • High-Field-Side (HFS) current injection • Reduced-MHD regime discovered
Local Helicity Injectors
Injected Current Stream
0.25
0.20
0.15
0.10
0.05
0.00
I p [M
A]
28242016Time [ms]
Plasma CurrentInjector Current
Ip ≤ 0.2 MA (Iinj ≤ 8 kA)

5
PEGASUS Magnetic Diagnostic Locations Poloidal Inboard High Resolution Mirnov Coils: “HighRes1-12”
Poloidal Outboard Mirnov Coils: “PDX 1-13”
Toroidal Outboard Mirnov Coils: “Otor 1-6”
J.L. Pachicano, APS-DPP 2017

6
NIMROD Simulated n=1 Activity Present in Experiment on Low-Field-Side (LFS)
• NIMROD simulates mechanism for current growth during LHI
– Build toroidal current and poloidal flux – Induce large magnetic bursting phenomena
1. Streams follow field lines
2. Adjacent passes attract
3.Reconnection pinches off current rings
10-16
10-14
10-12
10-10
LFS
B z A
uto-
Pow
er [
T2 /H
z]
140120100806040200Frequency [kHz]
n=0 n=11st n=1Harmonic
• LHI exhibits large Alfvénic, n=1 MHD activity
– Both continuous and bursting behavior
– Structure consistent with island coalescence and/or kinking of injected current streams
J.L. Pachicano, APS-DPP 2017

7
NIMROD Provides Simulation of Injected Current Streams
• Simulations indicate coherent streams and reconnection activity on both LFS and HFS
• Experiment has shown evidence of coherent injected streams in plasma edge at LFS
– Outboard magnetic signature
• Do the current streams exist, and how do they behave on the Inboard side during experiment?
– Upgrade Inboard magnetic diagnostics to view magnetic activity down the center column
J.L. Pachicano, APS-DPP 2017

Elimination of EMI-driven Switching Noise

9
Motivation for Noise Reduction on Core Magnetics • Switching power supply systems
introduce EMI-driven switching noise – Many Mirnov coils along the center column
were unusable
• Core magnetics needed to study HFS magnetic activity
• Mitigate noise on the HFS Mirnov coils
– Characterize where noise is originating – Determine if coil, connections, or signal
processing are problem areas
-20
-10
0
10
20
CTor
2 [V
]
806040200
Time [ms]
-20
-10
0
10
20
CTor
2 [V
]
SN 91413
Plasma shot
SN 91412
Vacuum shot
Example of noisy Mirnov coil:
J.L. Pachicano, APS-DPP 2017

10
Troubleshooting Noise Source
• Looked at noise level on Mirnov coils – Noise-free triax cable run used with properly executed signal
processing
• Results: – Decreased noise level from 800mV to 150mV on CTor’s – Coils with bad signals are recoverable, not damaged
50Ω Digitizer Anti
Aliasing
Digitizer Anti
Aliasing
• Tested stand alone triax cable through clean, properly shielded signal processing
– Terminated cable with 50Ω resistor – Typical noise level ≈ 400 mV
-10
-5
0
5
10
Tria
x Ca
ble
[mV]
806040200
Time [ms]
-1.0
-0.5
0.0
0.5
1.0
CTor
1 [V
]
50Ω terminated cableVacuum Shot
BEFORE (SN 93488) AFTER (SN 91565)
SN 91308
CTor1 Vacuum shot
J.L. Pachicano, APS-DPP 2017

11
Noise Suppression Solution • New shielded cable runs from the
machine to the screen room – Cat7A Ethernet cable is Shielded Shielded
Twisted Pair (SSTP) – Low cost, industry standard to 1GHz
• Modify anti aliasing module – Input SSTP – Output shielded LEMO cables – Output differentially driven
J.L. Pachicano, APS-DPP 2017

12
Results of Implemented Solution • EMI-driven switching noise reduced by an
order of magnitude – From 400mV to 40mV
• Plasma signal no longer polluted with noise – Accurate enough to use for detailed spectral analysis
0.4
0.3
0.2
0.1
0.0
-0.1
-0.2
-0.3
High
Res7
[V]
806040200
Time [ms]
BEFORE SN 91565 AFTER SN 94198 Ethernet cable noise floor SN 93490
Vacuum shots
-1.5
-1.0
-0.5
0.0
0.5
1.0
1.5
High
Res
12 [
V]
806040200
Time [ms]
-1.5
-1.0
-0.5
0.0
0.5
1.0
1.5
High
Res
12 [
V]
BEFORE
AFTER
Plasma SN 91309
Vacuum SN 91308
Plasma SN 94193
Vacuum SN 94198
J.L. Pachicano, APS-DPP 2017

MHD Transition
14
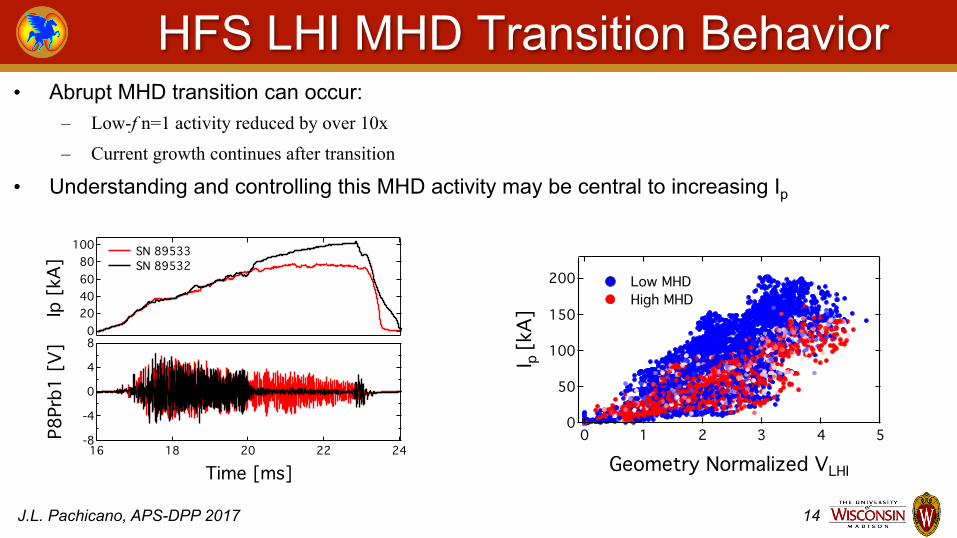
HFS LHI MHD Transition Behavior
10080604020
0
Ip [k
A]
2422201816
Time [ms]-8-4048
P8Pr
b1 [V
]
SN 89533 SN 89532
• Abrupt MHD transition can occur: – Low-f n=1 activity reduced by over 10x
– Current growth continues after transition
• Understanding and controlling this MHD activity may be central to increasing Ip
200
150
100
50
0
I p [k
A]
543210
Geometry Normalized VLHI
Low MHD High MHD
J.L. Pachicano, APS-DPP 2017

15
Transition Behavior Differs Greatly between the LFS and HFS
• Inboard magnetics show minimal reduction
• Outboard magnetics consistently experience abrupt MHD transition
600400200
0-200-400
High
Res1
1 [T
/s]
323028262422201816
Time [ms]
600400200
0-200-400
OTor
2 [T
/s]
SN 95161 Inboard
Outboard
J.L. Pachicano, APS-DPP 2017

16
Large Changes in MHD Auto-Power at Transition: LFS vs. HFS
• Inboard Auto-Power: – Little changes in power after transition – Displays comparable magnetic activity at higher frequencies
• Outboard Auto-Power: – Dramatic drop after transition
120
80
40
0
Ip [k
A]
3028262422201816
Time [ms]-400
-200
0
200
400
PDX
7 [T
/s]
SN 95161
10-6
10-4
10-2
100
Auto
-Pow
er [
(T/s
)^2/
Hz]
4003002001000
Frequency [kHz]
10-6
10-4
10-2
100
Auto
-Pow
er [(
T/s)
^2/H
z]
SN 95161
High MHD Low MHD
Inboard
Outboard
J.L. Pachicano, APS-DPP 2017

17
Little Correlation between HFS and LFS
• Large n=1 mode on LFS strongly reduced after transition • In general, decrease in activity at all frequencies • For f > 15 kHz, no correlation between LFS and HFS activity • High correlation toroidally on LFS
1.0
0.8
0.6
0.4
0.2
0.0
Cohe
renc
e
250200150100500
Frequency [kHz]
High MHD10-6
10-4
10-2
100
Cros
s-Po
wer
[(T/
s)^2
/Hz] High MHD
OTor 2 PDX 7 HighRes 11
Referencedto OTor2:
1.0
0.8
0.6
0.4
0.2
0.0
Cohe
renc
e
250200150100500Frequency [kHz]
Low MHD10-6
10-4
10-2
100
Cros
s-Po
wer
[(T/
s)^2
/Hz] OTor2
PDX 7 HighRes 11
Low MHDReferencedto OTor2:
J.L. Pachicano, APS-DPP 2017

High Amplitude MHD Behavior on HFS

19
Coherence of n=1 MHD activity traced from the outboard side, around the machine, and down the center column
• n=1 activity at 30 kHz – Coherent on LFS – Dramatic drop in coherence
on HFS
1.2
1.0
0.8
0.6
0.4
0.2
0.0Co
here
nce
150100500-50-100-150Poloidal Angle [degrees]
High
Res1
High
Res2
High
Res3
High
Res5
High
Res6
High
Res7
High
Res8
High
Res9
High
Res1
0Hi
ghRe
s11
High
Res1
2
PDX_
01
PDX_
03
PDX_
05
PDX_
06
PDX_
07
PDX_
09
PDX_
11
Coherence at 30 kHz PDX 7 reference Profile Bias Error
SN 95161
J.L. Pachicano, APS-DPP 2017

20
Toroidal Mode Number: LFS vs. HFS
• LFS toroidal mode number is consistently n=1 before the transition
• HFS instead sees n=0 mode before and after the transition
-200
-100
0
100
200Ph
ase
Angl
e [d
egre
es]
3002001000
Toroidal Physical Angle Ø[degrees]
fpeak = 31.532 kHz n = 1 reference ( X2 ) n = 1 reference ( |Diff| )
Outboard SN 97651
-200
-100
0
100
200
Phas
e An
gle
[deg
rees
]
3002001000
Toroidal Physical Angle Ø[degrees]
fpeak = 31.5 kHz n = 0 reference ( X2
)
Inboard SN 97651
0.001
0.01
0.1
1
Cros
s-Po
wer
[(
T/s)
^2/H
z]
3002001000
Frequency [kHz]
InboardHigh MHD
J.L. Pachicano, APS-DPP 2017
21
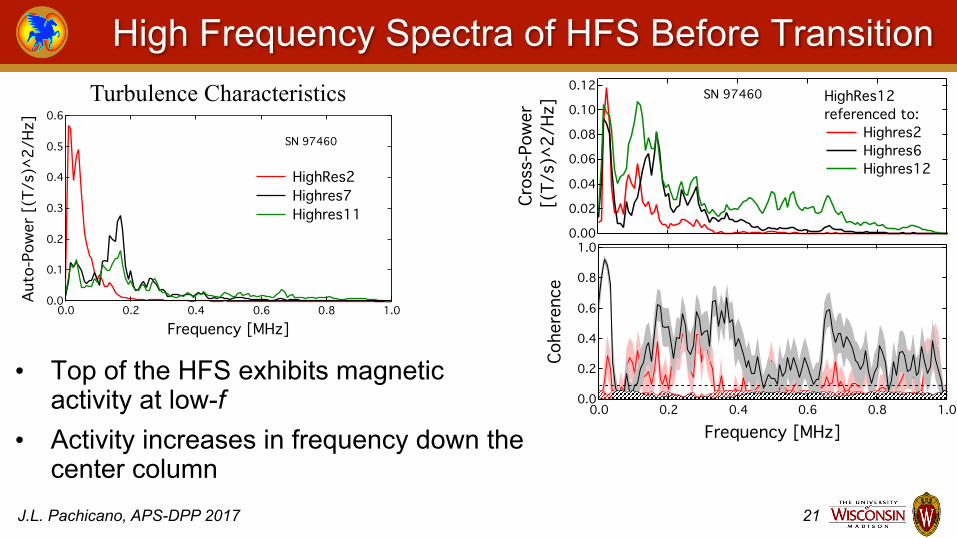
High Frequency Spectra of HFS Before Transition
• Top of the HFS exhibits magnetic activity at low-f
• Activity increases in frequency down the center column
0.6
0.5
0.4
0.3
0.2
0.1
0.0Auto
-Pow
er [
(T/s
)^2/
Hz]
1.00.80.60.40.20.0
Frequency [MHz]
SN 97460
HighRes2 Highres7 Highres11
Turbulence Characteristics 0.12
0.10
0.08
0.06
0.04
0.02
0.00
Cros
s-Po
wer
[(T
/s)^
2/Hz
] SN 97460 HighRes12referenced to:
Highres2 Highres6 Highres12
1.0
0.8
0.6
0.4
0.2
0.0
Cohe
renc
e
1.00.80.60.40.20.0
Frequency [MHz]
J.L. Pachicano, APS-DPP 2017

22
High Amplitude MHD Summary • Strong n=1 mode on the LFS does not appear on the HFS
– Little to no coherence – Toroidal mode number is n=0 on the HFS
• No obvious n=1 activity at higher frequency on HFS
• Indicates large-scale fluctuations of current streams may not be present on center column
J.L. Pachicano, APS-DPP 2017

Low Amplitude MHD Behavior on HFS
24
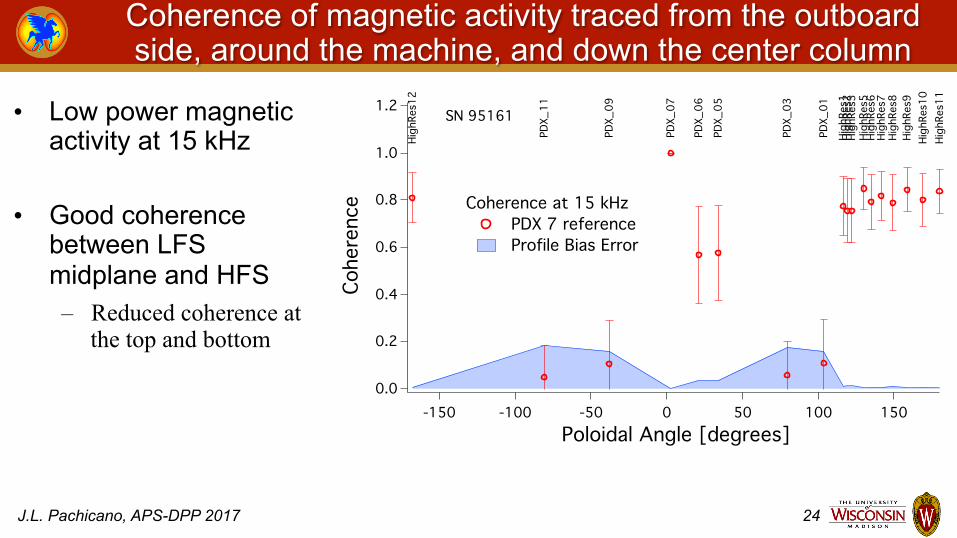
Coherence of magnetic activity traced from the outboard side, around the machine, and down the center column
• Low power magnetic activity at 15 kHz
• Good coherence between LFS midplane and HFS – Reduced coherence at
the top and bottom
1.2
1.0
0.8
0.6
0.4
0.2
0.0
Cohe
renc
e
150100500-50-100-150Poloidal Angle [degrees]
High
Res1
High
Res2
High
Res3
High
Res5
High
Res6
High
Res7
High
Res8
High
Res9
High
Res1
0Hi
ghRe
s11
High
Res1
2
PDX_
01
PDX_
03
PDX_
05PD
X_06
PDX_
07
PDX_
09
PDX_
11SN 95161
Coherence at 15 kHz PDX 7 reference Profile Bias Error
J.L. Pachicano, APS-DPP 2017

25
Toroidal Mode Number on HFS After Transition
• HFS toroidal mode number is also n=0 after the transition
-200
-150-100
-500
50
100150
200
Phas
e An
gle
[deg
rees
]
350300250200150100500
Toroidal Physical Angle Ø[degrees]
fpeak = 15 kHz n = 0 reference
InboardSN 96949
2
4
0.0012
4
0.012
4
0.1
Cros
s-Po
wer
[(T/
s)^2
/Hz]
350300250200150100500
Frequency [kHz]
InboardSN 96949
J.L. Pachicano, APS-DPP 2017

26
High Frequency Spectra on HFS After Transition • Apparent vertical correlation
length is about a quarter of the center column length
• Dominant magnetic activity occurs at higher frequencies
– 150-350 kHz
• Related to slinking motion of streams around the core?
40
30
20
10
0
Cros
s-Po
wer
[m(T
/s)^
2/Hz
] HighRes 12 referenced to:
Highres2 Highres6 Highres12
SN 97491
1.0
0.8
0.6
0.4
0.2
0.0
Cohe
renc
e
1.00.80.60.40.20.0
Frequency [MHz]
J.L. Pachicano, APS-DPP 2017

27
Low Amplitude MHD Summary • Low power magnetic activity coherent on the LFS and HFS
– Ip continues to increase after transition with lack on strong n=1 feature on LFS
• Toroidal mode number on HFS is consistently n=0 during the transition
• Higher Frequency magnetic activity seen after the transition – Coherent along the center column
J.L. Pachicano, APS-DPP 2017